Tramp Ship Routing and Scheduling with Integrated Carbon Intensity Indicator (CII) Optimization
Abstract
1. Introduction
2. Literature Review
3. Mathematical Model
3.1. Problem Description
3.2. Model Assumptions
- The tramp ships in the fleet are heterogeneous in terms of size, loading capacity, cruising speed, draft, fuel efficiency, and some other indicators;
- Each ship can only transport one cargo on one voyage, and each cargo can only be transported by one ship on one voyage; there are no split loads or trans-shipments;
- The shipping company can choose its own ships or charter ships on the spot market if necessary;
- There are no unforeseen delays due to weather conditions or port congestion. Details of each cargo demand, including its specific weight, loading port, discharging port, and time window, are fixed and known in advance;
- Ships sail at a specific constant speed on each leg;
- Ships have enough fuel to reach their destinations, and fuel prices do not change over time;
- Carriers and shippers are rational.
3.3. Model Formulation
3.3.1. Cost Calculation
3.3.2. CII Calculation Method
- Calculation of CII (G1 CII calculation methods)
- 2.
- Reference Lines for CII (G2 reference lines guideline)
- 3.
- Operational Carbon Intensity Reduction Factors Relative to Reference Lines (G3 reduction factors)
- 4.
- Operational Carbon Intensity Rating of Ships (G4 rating guidelines)
3.3.3. Optimization Model
4. Algorithm Design
4.1. Gale–Shapley Algorithm
- Initialize vessel data and cargo data.
- For each vessel, call the vessel-to-cargo matching algorithm to obtain the result set of matches sorted by voyages; this could be the preference list ranking the potential matches.
- Extract the optimal solution for each vessel to form an initial array of solutions.
- Extract the part of the initial solution that does not have conflicting cargoes and save it to the final result set.
- Extract the cargo involved to eliminate unlikely candidates before the next round of the cycle.
- Remove from backward to forward the initial solution that has entered the final set of matching results.
- Rank the corresponding solutions according to their profits for the optimal set of outcomes where multiple ships are present simultaneously for one cargo.
- Add the conflicting scenario with the best net benefit to the final matching result and list the other conflicting scenarios as deletions.
- Loop steps 5, 6, 7, and 8 until the initial solution is empty.
- For the set of vessels that have not yet been matched, a new initial result set is formed by selecting the suboptimal solution with no cargo conflicts based on the gains from the initial matching results.
- Output the final stable matching scheme.
4.2. Genetic Algorithm
- Initialization:
- 2.
- Evaluation:
- 3.
- Selection:
- 4.
- Crossover:
- 5.
- Mutation:
- 6.
- Replacement:
- 7.
- Termination:
5. Computational Study
5.1. Data Source and Description
5.2. Computational Results and Analysis
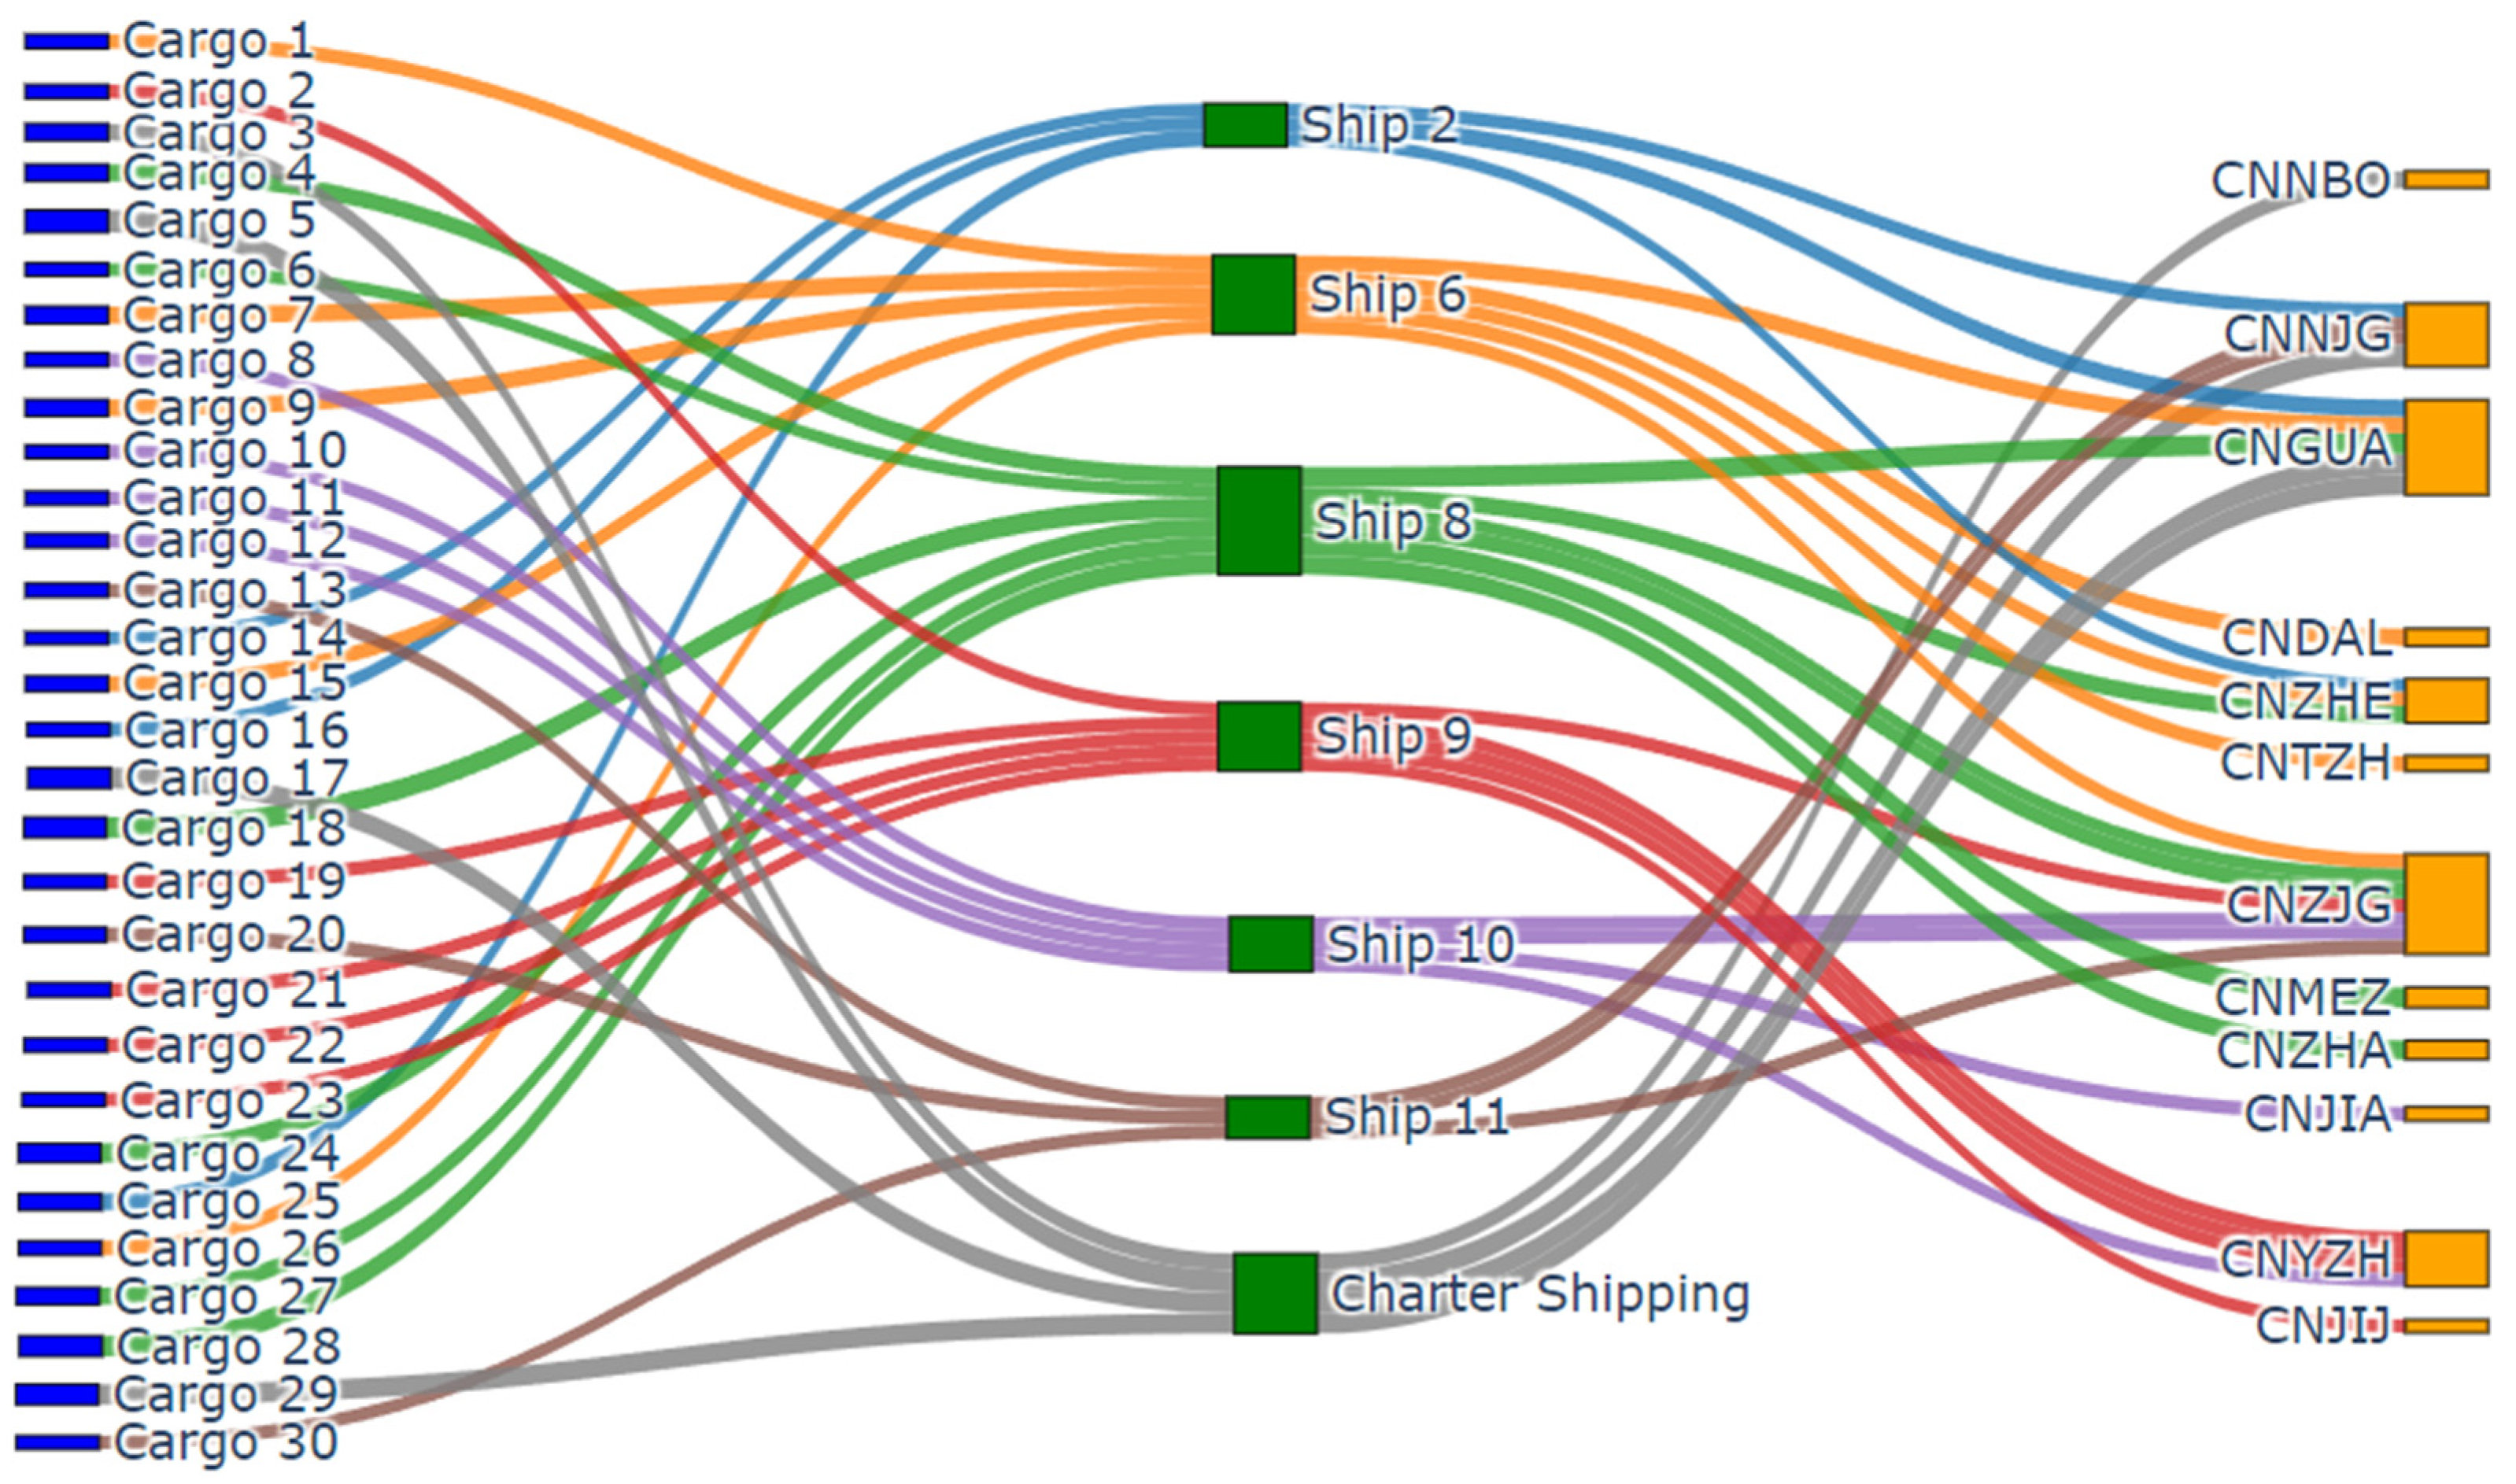
- A mismatch between ship capabilities and cargo requirements: The type, capacity, or other characteristics of some ships may not align with cargo needs.
- Distance to departure ports: Certain ships were too far from the departure ports to meet the time windows, making chartering ships necessary to avoid time constraint violations.
- Impact on CII ratings: Some voyages may increase unit carbon emissions, thereby lowering the CII rating below acceptable levels.
- Flexibility of chartering on the spot market: Charter shipping possesses considerable flexibility and enables rapid adjustment of shipping capacity and routes. In some cases, charter shipping can be more economical and efficient.
- Economic efficiency: The profit achieved by GA is $205,001.19, exhibiting 10.6% and 6.1% improvements over SA ($183,200.45) and PSO ($192,450.70), respectively. By dynamically optimizing sailing speeds, GA balances fuel costs and transportation efficiency. In contrast, SA and PSO fail to identify superior speed combinations because of insufficient local search capabilities.
- CII rating: GA achieves an A-level CII rating with the Attained CII to Required CII ratio of 0.69, significantly better than the A rating (0.82) of SA and the C rating (0.95) of PSO. The speed strategies of SA and PSO result in higher carbon emissions per transport work, failing to meet the IMO’s stringent standards.
- Convergence Efficiency and Global Search Capability: GA converges after 430 iterations, which is faster than PSO (590 iterations), while also delivering superior solution quality. SA requires 680 iterations because of its conservative cooling strategy and is prone to local optima. GA’s crossover and mutation mechanisms effectively maintain population diversity, preventing premature convergence.
- Practical Constraint Satisfaction: The transportation schedules optimized by GA achieve full compliance with time window constraints (100%), whereas SA and PSO exhibit lower compliance rates of 92% and 88%, respectively, which significantly escalates operational risks.
6. Conclusions
Author Contributions
Funding
Data Availability Statement
Acknowledgments
Conflicts of Interest
References
- UNCTAD. Review of Maritime Transport; UNCTAD: Geneva, Switzerland, 2021. [Google Scholar]
- UNCTAD. Review of Maritime Transport; UNCTAD: Geneva, Switzerland, 2023. [Google Scholar]
- Christiansen, M.; Fagerholt, K.; Nygreen, B.; Ronen, D. Ship routing and scheduling in the new millennium. Eur. J. Oper. Res. 2013, 228, 467–483. [Google Scholar] [CrossRef]
- IMO. Fourth IMO GHG Study; IMO: London, UK, 2020. [Google Scholar]
- IMO. 2023 IMO Strategy on Reduction of GHG Emissions from Ships; IMO: London, UK, 2023. [Google Scholar]
- Ammar, N.R.; Seddiek, I.S. Eco-environmental analysis of ship emission control methods: Case study RO-RO cargo vessel. Ocean Eng. 2017, 137, 166–173. [Google Scholar] [CrossRef]
- Hua, W.S.; Sha, Y.S.; Zhang, X.L.; Cao, H.F. Research progress of carbon capture and storage (CCS) technology based on the shipping industry. Ocean Eng. 2023, 281, 114929. [Google Scholar] [CrossRef]
- Bayraktar, M.; Yuksel, O. A scenario-based assessment of the energy efficiency existing ship index (EEXI) and carbon intensity indicator (CII) regulations. Ocean Eng. 2023, 278, 114925. [Google Scholar] [CrossRef]
- IMO. Resolution MEPC.308(73)—2018 Guidelines on the Method of Calculation of the Attained Energy Efficiency Design Index (EEDI) for New Ships; IMO: London, UK, 2018. [Google Scholar]
- Gianni, M.; Pietra, A.; Coraddu, A.; Taccani, R. Impact of SOFC Power Generation Plant on Carbon Intensity Index (CII) Calculation for Cruise Ships. J. Mar. Sci. Eng. 2022, 10, 1478. [Google Scholar] [CrossRef]
- Chen, X.Q.; Zheng, J.B.; Li, C.F.; Wu, B.; Wu, H.F.; Montewka, J. Maritime traffic situation awareness analysis via high-fidelity ship imaging trajectory. Multimed. Tools Appl. 2023, 83, 48907–48923. [Google Scholar] [CrossRef]
- Adland, R.; Cariou, P.; Jia, H.Y.; Wolff, F.C. The energy efficiency effects of periodic ship hull cleaning. J. Clean. Prod. 2018, 178, 1–13. [Google Scholar] [CrossRef]
- Zhou, R.; Luo, M.; Jiang, C.; Yang, D.; Wang, K. How does emission allowance allocation affect shipowners’ selection of emission reduction technologies? Transp. Res. Part D Transp. Environ. 2025, 139, 104573. [Google Scholar] [CrossRef]
- Chen, X.Q.; Chen, W.P.; Wu, B.; Wu, H.F.; Xian, J.F. Ship visual trajectory exploitation via an ensemble instance segmentation framework. Ocean Eng. 2024, 313, 119368. [Google Scholar] [CrossRef]
- Hua, R.; Yin, J.B.; Wang, S.H.; Han, Y.; Wang, X.B. Speed optimization for maximizing the ship’s economic benefits considering the Carbon Intensity Indicator (CII). Ocean Eng. 2024, 293, 116712. [Google Scholar] [CrossRef]
- Aydin, N.; Lee, H.; Mansouri, S.A. Speed optimization and bunkering in liner shipping in the presence of uncertain service times and time windows at ports. Eur. J. Oper. Res. 2017, 259, 143–154. [Google Scholar] [CrossRef]
- Wang, H.Q.; Liu, Y.; Wang, S.A.; Zhen, L. Optimal Ship Deployment and Sailing Speed under Alternative Fuels. J. Mar. Sci. Eng. 2023, 11, 1809. [Google Scholar] [CrossRef]
- Gale, D.; Shapley, L.S. College Admissions and the Stability of Marriage. Am. Math. Mon. 1962, 69, 9–15. [Google Scholar] [CrossRef]
- Al-Hamad, K.; Al-Ibrahim, M.; Al-Enezy, E. A genetic algorithm for ship routing and scheduling problem with time window. Am. J. Oper. Res. 2012, 2, 22440. [Google Scholar] [CrossRef][Green Version]
- Kim, S.H.; Lee, K.K. An optimization-based decision support system for ship scheduling. Comput. Ind. Eng. 1997, 33, 689–692. [Google Scholar] [CrossRef]
- Fagerholt, K. A computer-based decision support system for vessel fleet scheduling—Experience and future research. Decis. Support Syst. 2004, 37, 35–47. [Google Scholar] [CrossRef]
- Fagerholt, K.; Christiansen, M. A combined ship scheduling and allocation problem. J. Oper. Res. Soc. 2000, 51, 834–842. [Google Scholar] [CrossRef]
- Zeng, Q.C.; Yang, Z.Z.; VanAlbada, G.D. Model integrating fleet design and ship routing problems for coal shipping. In Proceedings of the Computational Science—ICCS 2007, Beijing, China, 27–30 May 2007; pp. 1000–1003. [Google Scholar]
- Bronmo, G.; Christiansen, M.; Nygreen, B. Ship routing and scheduling with flexible cargo sizes. J. Oper. Res. Soc. 2007, 58, 1167–1177. [Google Scholar] [CrossRef]
- Lin, D.Y.; Liu, H.Y. Combined ship allocation, routing and freight assignment in tramp shipping. Transp. Res. Part E-Logist. Transp. Rev. 2011, 47, 414–431. [Google Scholar] [CrossRef]
- Vilhelmsen, C.; Lusby, R.M.; Larsen, J. Tramp ship routing and scheduling with voyage separation requirements. OR Spectr. 2017, 39, 913–943. [Google Scholar] [CrossRef]
- Yu, B.; Wang, K.M.; Wang, C.; Yao, B.Z. Ship scheduling problems in tramp shipping considering static and spot cargoes. Int. J. Shipp. Transp. Logist. 2017, 9, 391–416. [Google Scholar] [CrossRef]
- Zhao, K.; Zhang, D.; Jin, J.G.; Dong, G.X.; Lee, D.H. Vessel voyage schedule planning for maritime ore transportation. Ocean Eng. 2024, 291, 116503. [Google Scholar] [CrossRef]
- Ma, W.H.; Lu, T.F.; Ma, D.F.; Wang, D.H.; Qu, F.Z. Ship route and speed multi-objective optimization considering weather conditions and emission control area regulations. Marit. Policy Manag. 2021, 48, 1053–1068. [Google Scholar] [CrossRef]
- Wang, C.X.; Xu, C.Y. Sailing speed optimization in voyage chartering ship considering different carbon emissions taxation. Comput. Ind. Eng. 2015, 89, 108–115. [Google Scholar] [CrossRef]
- Wen, M.; Pacino, D.; Kontovas, C.A.; Psaraftis, H.N. A multiple ship routing and speed optimization problem under time, cost and environmental objectives. Transp. Res. Part D-Transp. Environ. 2017, 52, 303–321. [Google Scholar] [CrossRef]
- Weng, J.X.; Shi, K.; Gan, X.F.; Li, G.R.; Huang, Z. Ship emission estimation with high spatial-temporal resolution in the Yangtze River estuary using AIS data. J. Clean. Prod. 2020, 248, 119297. [Google Scholar] [CrossRef]
- Yan, R.; Wang, S.A.; Du, Y.Q. Development of a two-stage ship fuel consumption prediction and reduction model for a dry bulk ship. Transp. Res. Part E-Logist. Transp. Rev. 2020, 138, 101930. [Google Scholar] [CrossRef]
- Sun, W.Y.; Tang, S.Y.; Liu, X.Y.; Zhou, S.A.; Wei, J.F. An Improved Ship Weather Routing Framework for CII Reduction Accounting for Wind-Assisted Rotors. J. Mar. Sci. Eng. 2022, 10, 1979. [Google Scholar] [CrossRef]
- Li, L.Z.; Ji, B.; Yu, S.S.; Zhou, S.Q.; Fang, X.P. Branch-And-Price Algorithm for the Tramp Ship Routing and Scheduling Problem Considering Ship Speed and Payload. J. Mar. Sci. Eng. 2022, 10, 1811. [Google Scholar] [CrossRef]
- Yuan, Q.; Wang, S.; Peng, J. Operational efficiency optimization method for ship fleet to comply with the carbon intensity indicator (CII) regulation. Ocean Eng. 2023, 286, 115487. [Google Scholar] [CrossRef]
- Tsai, Y.M.; Lin, C.Y. Effects of the Carbon Intensity Index Rating System on the Development of the Northeast Passage. J. Mar. Sci. Eng. 2023, 11, 1341. [Google Scholar] [CrossRef]
- Psaraftis, H.N.; Kontovas, C.A. Ship speed optimization: Concepts, models and combined speed-routing scenarios. Transp. Res. Part C-Emerg. Technol. 2014, 44, 52–69. [Google Scholar] [CrossRef]
- IMO. Resolution MEPC.328(76)—2021 Amendments to the Annex of the Protocol of 1997 to Amend the International Convention for the Prevention of Pollution from Ships, 1973, as Modified by the Protocol of 1978 Relating Thereto 2021 Revised MARPOL Annex VI; IMO: London, UK, 2021. [Google Scholar]
- IMO. Resolution MEPC.352(78)—2022 Guidelines on Operational Carbon Intensity Indicators and the Calculation Methods (CII Guidelines, G1); IMO: London, UK, 2022. [Google Scholar]
- IMO. Resolution MEPC.352(78)—2022 Guidelines on the Reference Lines for Use with Operational Carbon Intensity Indicators (CII Reference Lines Guidelines, G2); IMO: London, UK, 2022. [Google Scholar]
- IMO. Resolution MEPC.338(76)—2021 Guidelines on the Operational Carbon Intensity Reduction Factors Relative to Reference Lines (CII Reduction Factors Guidelines, G3); IMO: London, UK, 2021. [Google Scholar]
- IMO. MEPC.354(78)—2022 Guidelines on the Operational Carbon Intensity Rating of Ships (CII Rating Guidelines, G4); IMO: London, UK, 2022. [Google Scholar]
- IMO. MEPC.355(78)—2022 Interim Guidelines on Correction Factors and Voyage Adjustments for CII Calculations (CII Guidelines, G5); IMO: London, UK, 2022. [Google Scholar]


| Sets | Description |
|---|---|
| The set of loading ports, discharge ports, and the initial position of each ship in the fleet. | |
| The set of ships, each element is denoted as . | |
| The set of cargoes, each element is denoted as . | |
| The set of loading ports associated with cargo is a loading port . | |
| The set of discharge ports associated with cargo is a discharge port . | |
| The set of nodes that can be visited by ship . | |
| The set of loading ports that ship may visit. | |
| The set of discharge ports that ship may visit. | |
| The set of arcs that are traversable by ship . |
| Parameters | Description |
|---|---|
| The origin node of the ship . | |
| The artificial destination node of ship . | |
| The load capacity of ship (tons). | |
| The total quantity of cargo (tons). | |
| The quantity of cargo that has been actually transported (tons). | |
| The total berth time at node for ship , including loading and discharging time, waiting for service time, etc (days). | |
| The time for arrival node for ship (days). | |
| The earliest arrival time for the ship at node expected by the shipper. | |
| The latest time for the start of service at node . | |
| The expected time window associated with node . | |
| The sailing distance from node to node (n miles). | |
| γ | The amount of fuel consumption when the ship is at port (tons/hour) |
| Decision Variables | Description |
|---|---|
| The exact load on board at node . | |
| If ship sails from node to node , ; otherwise, . | |
| If cargo is transported by a charter ship in the spot market, ; otherwise, . | |
| The sailing speed of ship from node to node . |
| Ship ID | MMSI | Deadweight Tonnage (ton) | Lightship Weight (ton) | Min Speed (kn) | Max Speed (kn) | Initial Location | Fuel Consumption (ton/day) | ||
|---|---|---|---|---|---|---|---|---|---|
| Longitude (°) | Latitude (°) | Anchoring | Berthing | ||||||
| 1 | 354643000 | 76,546 | 40,896 | 10.239 | 15.359 | 4.049 | 51.937 | 6.114 | 2.867 |
| 2 | 354879000 | 55,676 | 30,953 | 9.888 | 14.900 | 113.486 | 23.082 | 5.080 | 3.099 |
| 3 | 356760000 | 56,907 | 33,044 | 10.765 | 16.084 | 73.907 | 7.153 | 7.030 | 4.120 |
| 4 | 412343000 | 55,566 | 30,963 | 9.888 | 14.900 | 127.735 | 34.907 | 4.408 | 2.995 |
| 5 | 412523920 | 32,034 | 19,995 | 11.510 | 17.201 | 140.670 | 35.922 | 4.553 | 2.998 |
| 6 | 412775000 | 57,617 | 33,511 | 11.063 | 16.594 | 123.337 | 34.771 | 5.121 | 1.987 |
| 7 | 413219590 | 52,818 | 29,995 | 10.481 | 15.660 | 102.003 | 2.170 | 6.396 | 3.271 |
| 8 | 414139000 | 64,542 | 38,384 | 12.529 | 18.793 | 118.012 | 38.386 | 6.719 | 2.892 |
| 9 | 414166000 | 49,998 | 31,893 | 11.312 | 16.968 | 118.455 | 38.987 | 5.625 | 2.582 |
| 10 | 414775000 | 49,256 | 28,714 | 10.981 | 16.407 | 122.471 | 31.273 | 5.514 | 2.510 |
| 11 | 414783000 | 49,281 | 28,714 | 10.981 | 16.407 | 118.188 | 38.950 | 5.232 | 2.454 |
| 12 | 477043400 | 63,261 | 36,378 | 10.732 | 16.189 | 121.374 | 31.501 | 6.610 | 3.423 |
| 13 | 477595900 | 76,364 | 40,896 | 10.239 | 15.359 | −43.930 | −23.128 | 5.185 | 2.698 |
| 14 | 477961500 | 56,687 | 32,899 | 10.765 | 16.084 | 29.458 | 40.763 | 5.976 | 2.785 |
| 15 | 563023600 | 52,395 | 30,053 | 8.117 | 13.529 | 171.427 | 41.853 | 7.411 | 3.836 |
| Cargo ID | Quantity (ton) | Loading Port | Discharging Port | LAN/CAN |
|---|---|---|---|---|
| 1 | 49,000 | CNQHD | CNZHE | 1–3 July 2022 |
| 2 | 47,500 | CNQHD | CNZJG | 4–6 July 2022 |
| 3 | 57,000 | CNQHD | CNNBO | 4–6 July 2022 |
| 4 | 58,500 | CNTJN | CNZHE | 5–7 July 2022 |
| 5 | 76,550 | CNHUA | CNNJG | 5–7 July 2022 |
| 6 | 44,500 | CNJIT | CNZJG | 6–8 July 2022 |
| 7 | 59,000 | CNHUA | CNDAL | 6–8 July 2022 |
| 8 | 47,000 | CNQHD | CNYZH | 6–8 July 2022 |
| 9 | 57,200 | CNQHD | CNGUA | 6–8 July 2022 |
| 10 | 46,600 | CNJIT | CNZJG | 6–8 July 2022 |
| 11 | 46,600 | CNJIT | CNZJG | 6–8 July 2022 |
| 12 | 47,500 | CNZHA | CNJIA | 7–9 July 2022 |
| 13 | 47,000 | CNCFD | CNNJG | 7–9 July 2022 |
| 14 | 43,500 | CNJIT | CNZHE | 8–10 July 2022 |
| 15 | 53,000 | CNJIT | CNTZH | 8–10 July 2022 |
| 16 | 47,000 | CNHUA | CNNJG | 8–10 July 2022 |
| 17 | 70,500 | CNQHD | CNGUA | 9–11 July 2022 |
| 18 | 70,500 | CNQHD | CNGUA | 9–11 July 2022 |
| 19 | 47,000 | CNCFD | CNYZH | 10–12 July 2022 |
| 20 | 50,000 | CNJIT | CNZJG | 10–12 July 2022 |
| 21 | 47,800 | CNCFD | CNYZH | 10–12 July 2022 |
| 22 | 47,000 | CNHUA | CNYZH | 10–12 July 2022 |
| 23 | 45,000 | CNZHA | CNJIJ | 10–12 July 2022 |
| 24 | 65,000 | CNHUA | CNZHA | 11–13 July 2022 |
| 25 | 57,500 | CNCFD | CNGUA | 12–14 July 2022 |
| 26 | 49,300 | CNJIT | CNZJG | 12–14 July 2022 |
| 27 | 58,300 | CNJIT | CNZJG | 12–14 July 2022 |
| 28 | 70,000 | CNHUA | CNMEZ | 12–14 July 2022 |
| 29 | 69,000 | CNCFD | CNGUA | 12–14 July 2022 |
| 30 | 46,000 | CNJIT | CNNJG | 15–17 July 2022 |
| Port Code | Port Name |
|---|---|
| CNCFD | Caofeidian Port |
| CNDAL | Dalian Port |
| CNGUA | Guangzhou Port |
| CNHUA | Huangpu Port |
| CNJIA | Jiangyin Port |
| CNJIJ | Jingjiang Port |
| CNJIT | Jingtang Port |
| CNMEZ | Meizhou Port |
| CNNBO | Ningbo Port |
| CNNJG | Nanjing Port |
| CNQHD | Qinhuangdao Port |
| CNTJN | Tianjin Port |
| CNTZH | Taizhou Port |
| CNYZH | Yangzhou Port |
| CNZHA | Zhanjiang Port |
| CNZHE | Zhenjiang Port |
| CNZJG | Zhangjiagang Port |
| Metric | Genetic Algorithm (GA) | Simulated Annealing (SA) | Particle Swarm Optimization (PSO) |
|---|---|---|---|
| Profit (USD) | 205,001.19 | 183,200.45 (−10.6%) | 192,450.70 (−6.1%) |
| CII Rating | A (0.69) | A (0.82) | C (0.95) |
| Convergence Iterations | 430 | 680 | 590 |
| Speed Optimization Strategy | Dynamic speed adjustment | Single-speed optimization | Locally Optimal Speed Combinations |
| Time Window Satisfaction Rate | 100% | 92% | 88% |
| Ship | MMSI | Route | Attained CII/ Required CII | CII Rating | Profit ($) | Speed (Knot) |
|---|---|---|---|---|---|---|
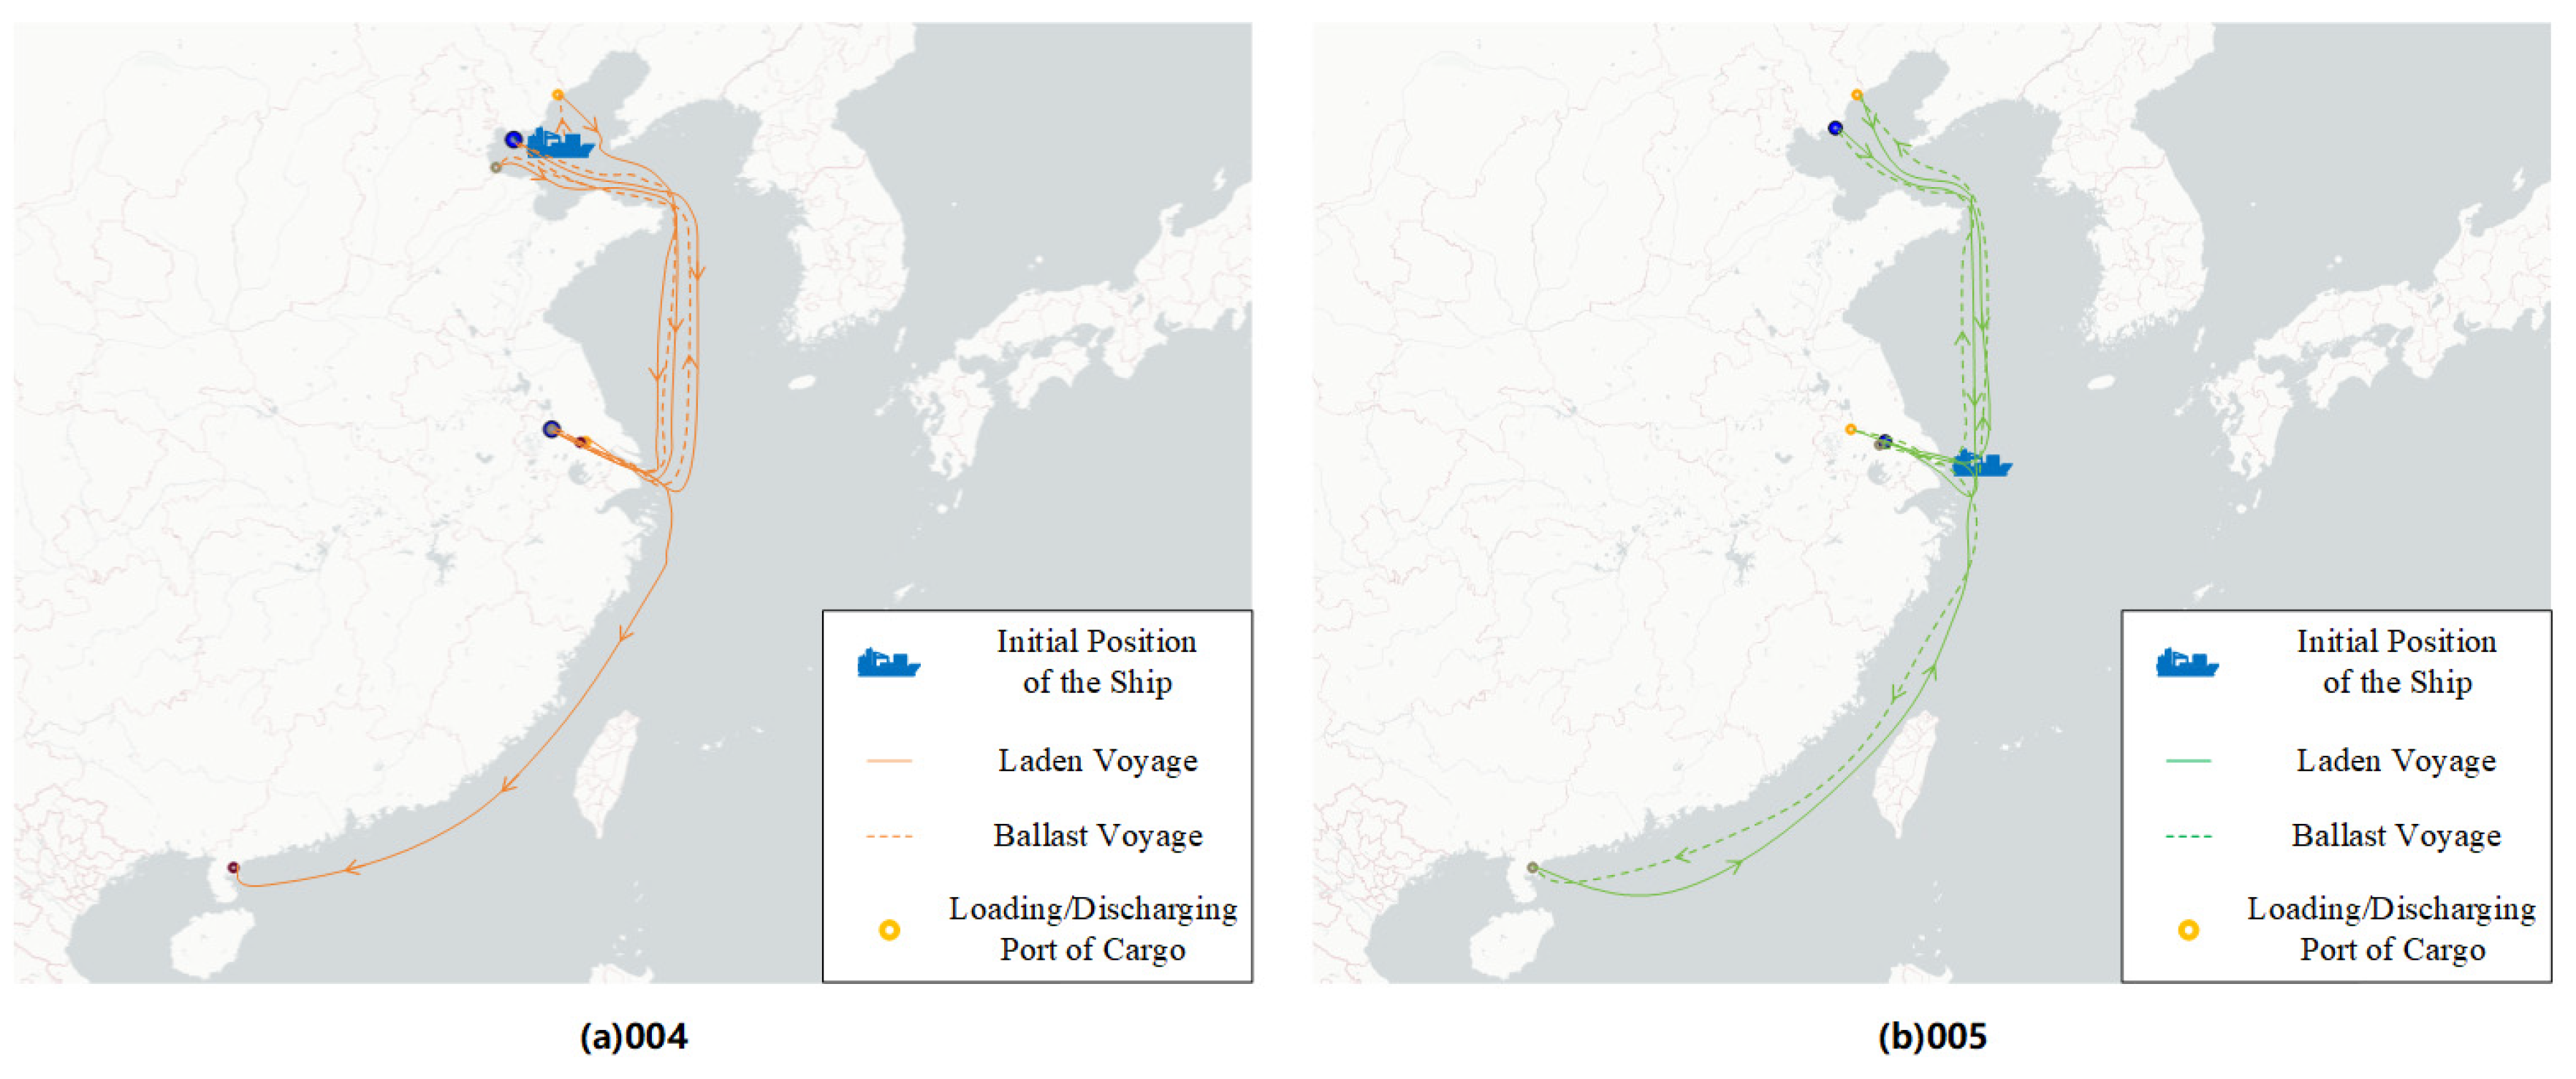
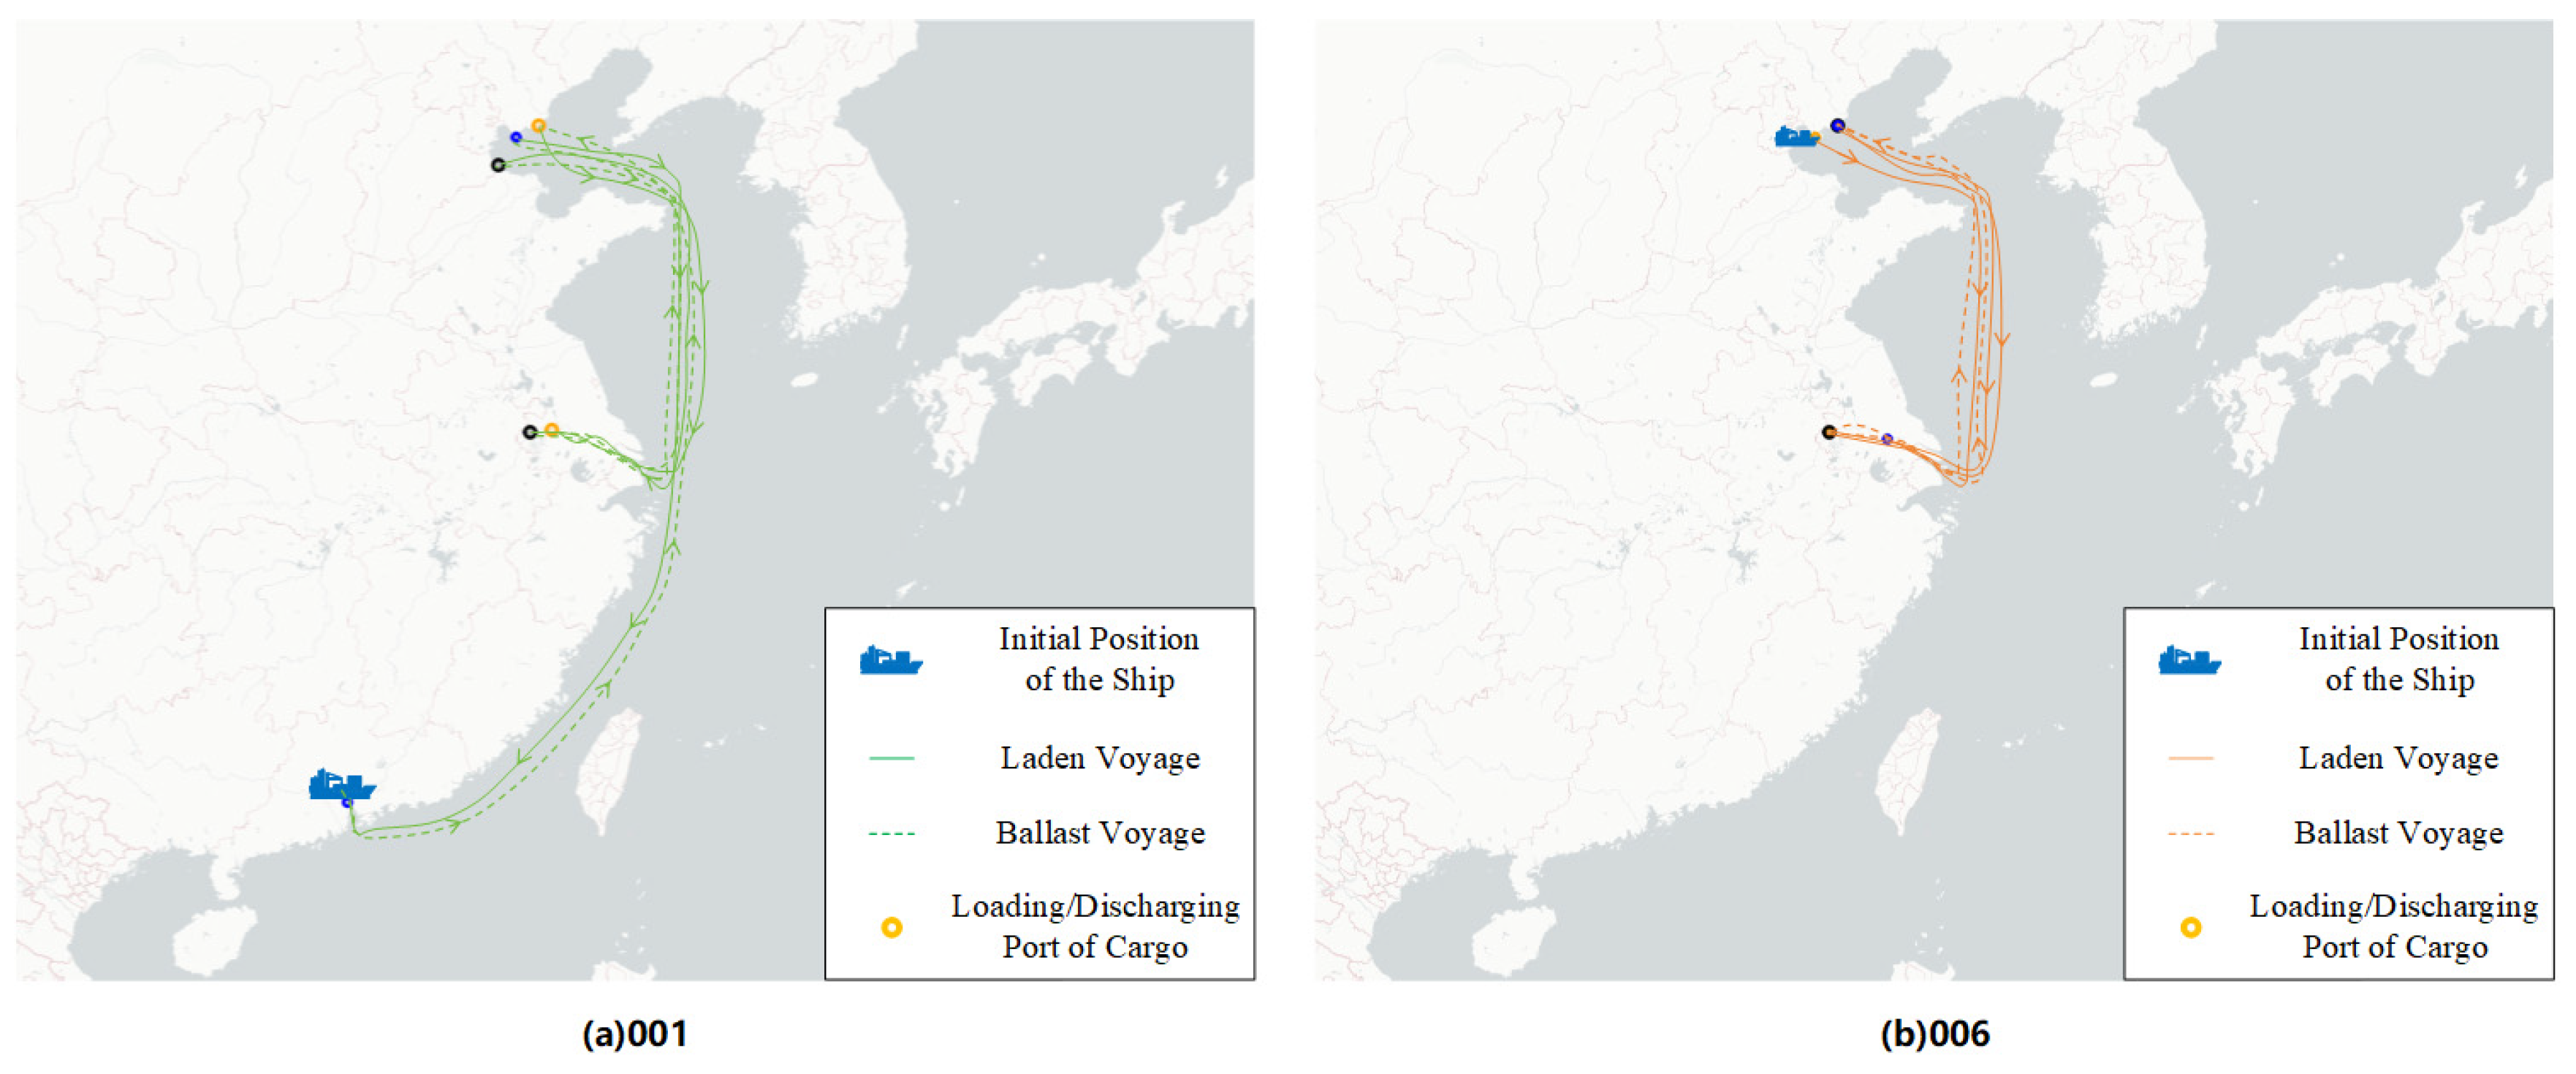
| 001 | 354879000 | 14-16-25 | 0.69 | A | 205,001.19 | [11.86, 14.32]-[14.21, 10.10]-[12.28, 10.72] |
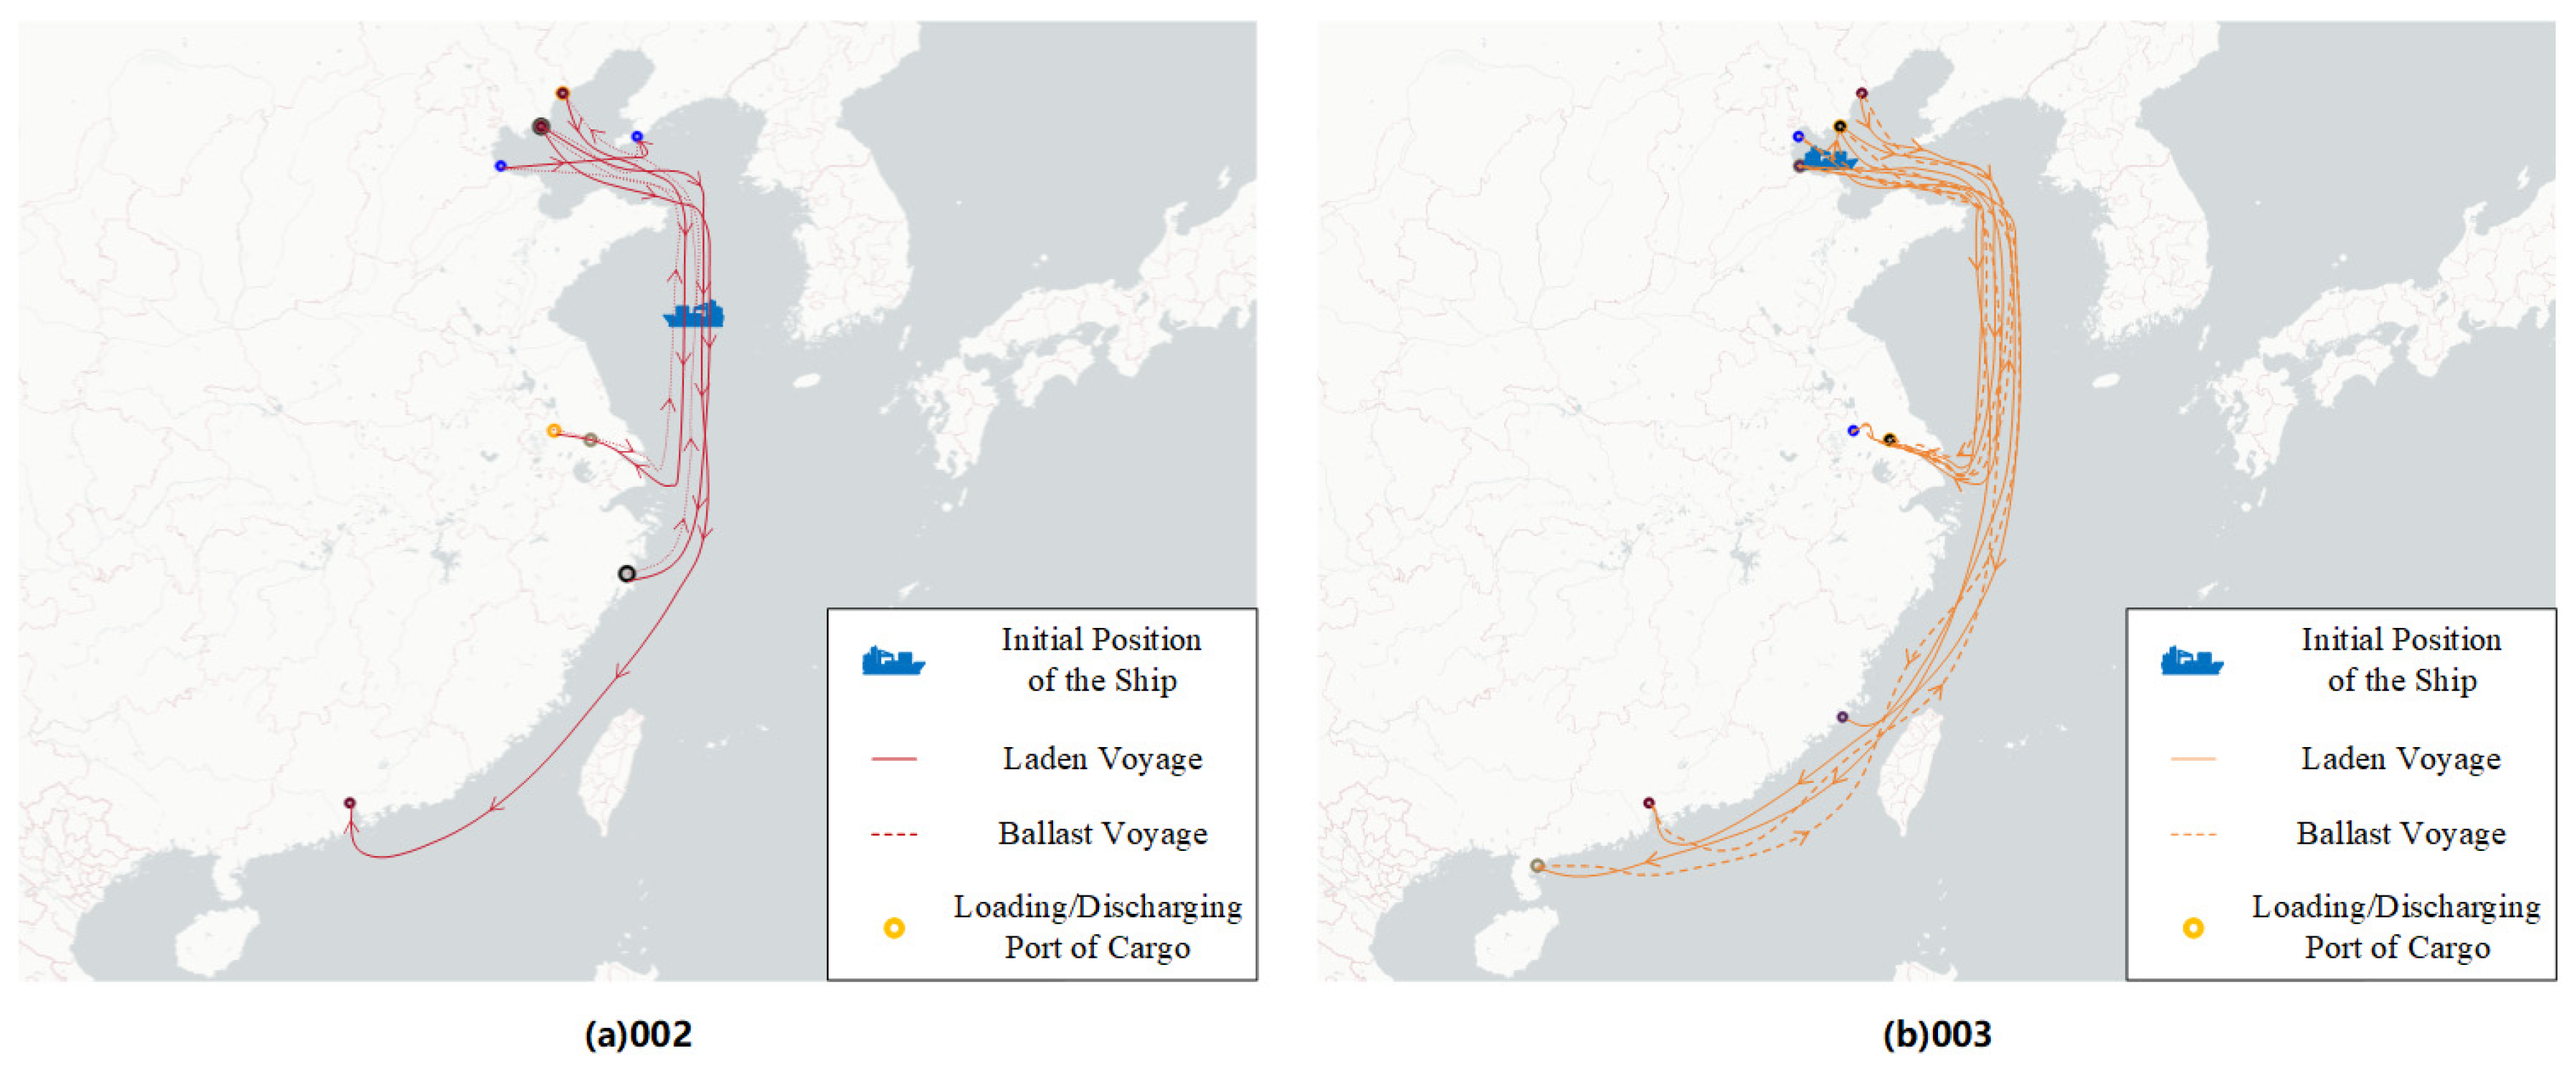
| 002 | 412775000 | 1-15-7-26-9 | 1.05 | C | 429,955.47 | [14.36, 16.49]-[14.71, 16.55]-[13.88, 13.75]-[11.94, 15.04]-[15.61, 14.69] |
| 003 | 414139000 | 6-27-4-24-18-28 | 0.90 | B | 259,211.12 | [16.94, 13.64]-[14.90, 13.97]-[17.36, 17.85]-[18.50, 18.17]-[12.82, 15.39]-[14.18, 15.58] |
| 004 | 414166000 | 2-21-19-22-23 | 0.87 | B | 290,509.53 | [14.30, 12.34]-[11.88, 13.18]-[13.09, 13.14]-[15.46, 16.44]-[14.03, 14.62] |
| 005 | 414775000 | 8-10-11-12 | 0.79 | A | 294,967.22 | [16.17, 11.91]-[14.92, 11.42]-[11.57, 12.15]-[13.06, 13.25] |
| 006 | 414783000 | 13-30-20 | 0.90 | B | 220,333.49 | [15.57, 11.21]-[13.26, 13.74]-[14.84, 13.68] |
| C | - | 3-5-17-29 | - | - | - | - |
| Ship | Actual CII Rating | Optimized CII Rating | Actual Profit ($) | Optimized Profit ($) | Optimized Profit Change |
|---|---|---|---|---|---|
| 001 | D | A | 244,058.00 | 205,001.19 | −16.00% |
| 002 | B | C | 320,563.99 | 429,955.47 | +34.12% |
| 003 | E | B | 290,911.29 | 259,211.12 | −10.90% |
| 004 | C | B | 257,488.50 | 290,509.53 | +12.82% |
| 005 | C | A | 317,483.07 | 294,967.22 | −7.09% |
| 006 | C | B | 198,159.95 | 220,333.49 | +11.19% |
| Total | - | - | 1,628,664.80 | 1,699,978.02 | +4.38% |
Disclaimer/Publisher’s Note: The statements, opinions and data contained in all publications are solely those of the individual author(s) and contributor(s) and not of MDPI and/or the editor(s). MDPI and/or the editor(s) disclaim responsibility for any injury to people or property resulting from any ideas, methods, instructions or products referred to in the content. |
© 2025 by the authors. Licensee MDPI, Basel, Switzerland. This article is an open access article distributed under the terms and conditions of the Creative Commons Attribution (CC BY) license (https://creativecommons.org/licenses/by/4.0/).
Share and Cite
Yang, H.; Ren, F.; Yin, J.; Wang, S.; Khan, R.U. Tramp Ship Routing and Scheduling with Integrated Carbon Intensity Indicator (CII) Optimization. J. Mar. Sci. Eng. 2025, 13, 752. https://doi.org/10.3390/jmse13040752
Yang H, Ren F, Yin J, Wang S, Khan RU. Tramp Ship Routing and Scheduling with Integrated Carbon Intensity Indicator (CII) Optimization. Journal of Marine Science and Engineering. 2025; 13(4):752. https://doi.org/10.3390/jmse13040752
Chicago/Turabian StyleYang, Haiying, Feiyang Ren, Jingbo Yin, Siqi Wang, and Rafi Ullah Khan. 2025. "Tramp Ship Routing and Scheduling with Integrated Carbon Intensity Indicator (CII) Optimization" Journal of Marine Science and Engineering 13, no. 4: 752. https://doi.org/10.3390/jmse13040752
APA StyleYang, H., Ren, F., Yin, J., Wang, S., & Khan, R. U. (2025). Tramp Ship Routing and Scheduling with Integrated Carbon Intensity Indicator (CII) Optimization. Journal of Marine Science and Engineering, 13(4), 752. https://doi.org/10.3390/jmse13040752


