Article

Decarbonization and Improvement of Energy Efficiency of FSRU by Cryogenic CO2 Capture

by
Audrius Malūkas
* and
Sergejus Lebedevas
Faculty of Marine Technologies and Natural Sciences, Klaipeda University, Bijunu 17, 91225 Klaipeda, Lithuania
*
Author to whom correspondence should be addressed.
J. Mar. Sci. Eng. 2025, 13(4), 770; https://doi.org/10.3390/jmse13040770
Submission received: 25 February 2025 / Revised: 2 April 2025 / Accepted: 5 April 2025 / Published: 12 April 2025
(This article belongs to the Section Ocean Engineering)

Abstract

:
Cryogenic Carbon Capture (CCC) has emerged as a promising technology to enhance the sustainability of Liquefied Natural Gas (LNG) operations in line with the International Maritime Organization’s (IMO) decarbonization targets. This study investigates the integration of CCC within Floating Storage and Regasification Units (FSRUs), leveraging LNG’s cryogenic potential to improve CO2 capture efficiency and optimize energy use. A detailed structural analysis of the FSRU’s energy balance was conducted considering variable regasification performance in open- and closed-loop regimes, followed by a Thermoflow-based simulation to assess the impact of CCC integration under real operational conditions. The results demonstrate that incorporating CCC into the FSRU’s closed-loop regasification process enables effective CO2 capture and separation from the flue gas emitted by the Wärtsilä 8L50DF and 6L50DF dual-fuel electric diesel generators, as well as the boiler system. The study identifies a potential fuel consumption optimisation of 22% and a CO2 capture rate of 100%, where the energy balance process requires 17.4 MW of combined energy unitisation. In addition, the study highlights the role of LNG cold energy potential in optimising heat exchange and mitigating thermal losses. These findings support the feasibility of CCC as a viable decarbonisation strategy for LNG FSRU operations. Future research should focus on improving system scalability and evaluating long-term performance under varying environmental and operational conditions.

1. Introduction

The International Maritime Organization’s (IMO) revised Greenhouse Gas (GHG) Strategy, adopted in 2023, has set ambitious targets for achieving net-zero emissions by 2050. The strategy specifies goals to achieve decarbonization in transition period where the GHG strategy envisages a plan to reduce CO2 emissions by at least 40% by 2030, with efforts towards 70% by 2040 and achieving net-zero GHG emissions by 2050 compared to 2008. To decarbonize the shipping industry towards settled levels in the strategy, the IMO has proposed several technological and regulation-based measures, including the implementation of ship-based carbon capture technologies.
To improve and control the decarbonization effect, measures to enhance vessels’ operational carbon intensity and emission control have been established through the Energy Efficiency Existing Ship Index (EEXI), Energy Efficiency Design Index (EEDI), Carbon Intensity Indicator (CII), and the updated Ship Energy Efficiency Management Plan (SEEMP) [1]. In the pathway to decarbonization, a key development includes advancements in renewable and low-carbon fuels with residual CO2 emissions, categorized as follows: (a) current and transition period fuels: liquefied natural gas (LNG) and biodiesel; (b) mid-term period (2030–2035): ammonia and methanol; (c) long-term period: hydrogen [2]. These advancements go hand in hand with operational efficiency improvements which are also outlined by the International Energy Agency (IAE) which reports that the development of CO2 capture and storage technologies is essential. According to the IEA, the maritime industry may struggle to achieve the targeted decarbonization goal in time due to challenges related to the long lifetime of vessels (up to 35 years), fuel availability, and infrastructure, which has sparked debate over the feasibility of the proposed timelines and the suitability of specific technologies [3]. Diverging perspectives exist regarding the scalability of these alternatives, with some advocating for Market-Based Measures (MBMs) like carbon pricing to accelerate adoption, while others emphasize the need for significant subsidies and investment.
The technological development of emission reduction goal is also highly related to the imposed tax regulations. The shipping industry from 1 January 2024 is part of the EU Emission Trading System (EU ETS). This means that shipping companies must now monitor, report, and pay for their CO2 emissions when operating within the EU and European Economic Area (EEA) waters [4]. The strong role in the EU ETS adoption plays the unit price which in market fluctuates around 80 EUR in 2024, with peaks up to 96.08 EUR in previous years [5]. Besides the EU ETS, the European Commission has adopted the COM (2021) 562 framework for the use of renewable and low-carbon fuels in maritime transport, and the final proposal outlines the FuelEU Maritime initiative, designed to cut emissions in maritime transport by encouraging the shift to renewable and low-carbon fuels. It sets specific targets for reducing the greenhouse gas intensity of marine fuels, aligning with the EU’s broader climate strategy. The regulation adopts a “well-to-wake” approach, considering emissions across the entire fuel lifecycle, and promotes a technology-neutral, goal-oriented framework [6].
Liquefied Natural Gas (LNG) has emerged as a transitional fuel in the maritime sector, bridging the gap between conventional fossil fuels and future zero-emission alternatives. LNG offers significant reductions in sulphur oxides (SOx), nitrogen oxides (NOx), and particulate matter compared to traditional marine fuels, aligning with both of the IMO’s short-term decarbonization measures. Additionally, LNG-fuelled vessels achieve lower CO2 emissions per unit of energy, making it a viable option for meeting regulatory requirements under initiatives like the CII [7].
However, LNG as a transitional solution is not without controversy. Critics point to methane slip—unburned methane released during LNG combustion or handling—as a significant drawback, given methane’s higher global warming potential compared to CO2 [8]. While advances in engine technologies aim to mitigate the issue of methane slip, the debate on LNG’s long-term role in maritime decarbonisation continues. Classified as a transitional fuel, LNG is in line with current regulatory measures such as the IMO’s CII. However, CII projections indicate that by around 2030, LNG-fuelled ships will need to adopt additional technologies—such as carbon capture systems or blending with bio-LNG or synthetic LNG—to meet increasingly stringent carbon intensity standards set by IMO guidelines. According to data from the GIIGNL Annual Report, the total LNG tanker fleet at the end of 2023 will consist of 772 vessels, including 51 Floating Storage Regasification Units (FSRUs). At the end of 2023, the order book included 341 additional units. Globally, the fleet of dual-fuel vessels operating on LNG comprised more than 2400 vessels [9]. LNG-fuelled ships now account for more than 2% of the world’s shipping fleet, and with current orders, this figure is expected to rise to 4% in terms of number of ships and 6% in terms of Deadweight Tonnage (DWT) [10]. In anticipation of the alarming compliance requirements and the growing fleet of LNG-fuelled vessels, a proposal was submitted in 2022 to the Marine Environment Protection Committee (MEPC) to incorporate CO2 reductions achieved through carbon capture technologies into the EEDI/EEXI and CII frameworks. The proposal recommends that CO2 reductions from on-board CCS systems should be included in the calculation of: (1) the achieved EEDI/EEXI; (2) the achieved CII by taking into account the total mass of CO2 emissions prevented from being released into the atmosphere.
The rapid marked expansion of LNG reflects the linear growth of LNG trade and LNG regasification operations related to consumption of LNG as fuel for the purpose of vessel navigation and LNG regasification as energy for delivery to consumers. During the regasification process, LNG undergoes a significant expansion, with a volumetric ratio of 1:578 (m3 LNG to Nm3 of natural gas under reference conditions: 25 °C, 0 °C, and a pressure of 1.01325 bar). At the conversion stage, the cryogenic environment could be recovered by using LNG cold potential in cogeneration cycles through temperature exchange [11]. It is estimated that approximately 830 kJ of the cryogenic potential contained in 1 kg LNG could be utilised in the cogeneration cycle due to its extremely low temperature of approximately −162 °C. When LNG is regasified, it absorbs heat from its surroundings, making it an excellent medium for cryogenic heat exchange applications, which can be used in various heat exchange processes [12]. The integration of LNG’s cold potential into technological systems holds substantial promise; however, technological adaptation remains at the pioneering stage. The conducted studies suggest that ships fuelled by LNG are the most compatible units for integration of the carbon capture system; it is estimated that a 3000 kW engine at nominal 75% load produces exhaust gas which contains up to 931 kW heat available for LNG regasification [13]. In today’s market, guidelines are being developed to prepare the industry for wider adoption and conversion, paving the way for innovative energy use solutions. According to the latest Det Norske Veritas (DNV) Maritime Forecast to 2050, the situation analysis of decarbonisation in shipping confirms that carbon-neutral fuels will remain expensive and in limited supply for the near future. Therefore, on-board carbon capture technologies could delay the need for carbon-neutral fuels as the infrastructure is developed [14].
With the focus on carbon emissions and technological measures to comply with environmental regulations, DNV, a leading classification society, has published Guidelines for the Implementation of Carbon Capture and Storage (CCS) Technologies in 2023, with a focus on their application in maritime operations. These guidelines aim to ensure the safe, efficient, and effective deployment of CCS systems in accordance with international standards and regulations [15]. The rules outline requirements that include, but are not limited to, CO2 capture technologies, storage of captured CO2, and its transportation for subsequent injection. DNV emphasises that the fuel system components of existing LNG-fuelled ships can be retrofitted for CO2 capture and liquefaction processes. Therefore, it could be a potential leading technology to retrofit the LNG fleet in view of the regulations coming in the near future, especially in 2030. The use of LNG as a potential cold source is attracting increasing attention as a means of promoting energy conservation and reducing carbon dioxide emissions [16]. Cryogenic Carbon Capture (CCC) is an innovative approach to capturing carbon dioxide emissions by using extreme temperature changes to isolate CO2 from flue gases. The process involves cooling the exhaust gases to very low temperatures in conjunction with pressure, which causes the CO2 to condense or freeze, allowing it to be separated from other components in the gas stream. Unlike chemical absorption or adsorption techniques, CCC relies primarily on physical temperature-driven transformations of the aggregate state, which can increase efficiency and reduce the need for chemical reagents. The captured CO2 is then collected in a concentrated form suitable for storage or use in various industrial applications. This process is characterised by its scalability and adaptability to different emission sources. CO2 properties: liquid at −56.6 °C, 5.11 bar (1156 kg/m3); solid at −78.5 °C, 1 bar (1562 kg/m3) [17]. It is essential to highlight that pressure and temperature characterise CO2 physical conditions where pressure is the key point to liquefy captured CO2. These characteristics enhance storage and disposal flexibility. The cryogenic carbon capture method integrates efficiently with LNG regasification, forming a cogeneration cycle that optimizes thermal energy exchange and boosts overall efficiency [18].
According to the Global CCS Institute’s annual report, the data to 2024 indicate that 628 carbon capture and storage facilities are currently in various stages of development, of which 212 are CO2 transport and/or storage projects. These projects aim to provide the infrastructure necessary to support industry’s transition to carbon-neutral operations [19].
There are several of studies that assess CO2 capture technologies in the LNG-fuelled vessel case. The feasibility of implementing CCC technology on an LNG-fuelled tanker has been evaluated. The analysed system results showed that the high-temperature exhaust gases are cooled by a seawater heat exchanger, which condenses water vapour and removes moisture, reducing the exhaust temperature to 30 °C. The article by J. Park, Y. Kim et al. describes the cooling potential of LNG as high-quality cold energy that is wasted and could instead be converted into a cryogenic CO2 capture module [20]. According to the study, the challenging part of the CO2 capture process is the conversion of CO2 to the liquid phase when liquefaction occurs at pressures above 5.1 bar. After dehydration, the gases are further cooled by using the cryogenic temperature released from the LNG within the CCC system. This process allows CO2 to be captured in solid form, while the remaining gases are emitted as cleaner flue gas. Some CO2 is lost during storage, with an estimated daily loss rate of 7.4% due to natural evaporation. The CCC system has a carbon capture efficiency of 92.1%. Of the total refrigeration potential used, approximately 78.7% comes from seawater, 0.3% from LNG, and 20.7% from recirculated clean gas. The dried flue gas is pressurised to 2.7 bar and the cryogenic CCS system requires approximately 270 kW of power to operate. Although the technology indicates a high capture rate, additional energy capacity is required, and the introduction of additional refrigeration potential could potentially limit this consumption and optimise the CO2 loss ratio.
Researchers Sultan H., Muhammad H. et al. in a study demonstrate the integration of LNG fuel’s cryogenic temperature potential into a Natural Gas Combined Cycle (NGCC) power plant including carbon capture integration which enables the CO2 gas to condense and separate at low temperatures [21]. The study analyses the carbon dioxide capture process, in which the flue gas is cleaned by a solvent-based CO2 absorption processes and, at the end, the separated CO2 is sent to compression to enable its conversion from gas phase to liquid at the triple point of 5.1 bar and −56.6 °C. The CO2 flows through two compression stages and is conveyed to the LNG CO2 cooler. The CO2 passes through two compression stages and is then transferred to the LNG CO2 cooler for the liquefaction stage. The liquid phase CO2 is then pressurised to 150 bar for storage. The NGCC power plant case study shows that the CCS process reduces the thermal energy production requirement due to heat absorption from the flue gas. The study’s simulation and case analysis show that the CO2 capture process with activated LNG cooling potential can reduce its energy consumption by 12.8%.
External Cooling Loop (ECL) technology using LNG cooling potential has been analysed with a view to its implementation in natural gas power plant. The study shows that several types of refrigerants can be used in the cryogenic carbon capture process; however, natural gas was selected due to its high availability of compression. The created model analyses flue gas treatment from the precooling stage where the CO2 composition is 13.5%. The stream is cooled down to 16 °C to condense H2O which allows the removal of 90% of the water vapor which indicates that the post-[precooling stream should pass through a flue gas dryer to ensure ice formation. The steam then is cooled in multiple heat exchangers down to 98 °C. At full load, the system performance showed a 272 ton/h capture ratio, which is 90% of the total CO2 emissions [22].
The integration of cryogenic carbon capture technologies on seagoing vessels faces limitations in carbon capture rates due to the availability of LNG fuel which is primarily required for the vessel’s navigation and as a cryogenic source to achieve high capture rates. While this limits the capture rate, the evaluation study was performed on an LNG-fuelled vessel equipped with a WinGD X72DF-2.1 as the main engine where an integration of cryogenic carbon capture technology was assessed aligned with the Organic Rankine Cycle (ORC). Ballout J., Al-Rawashdeh M. et al. in their research evaluated CCC integration on an LNG-fuelled vessel where in the proposed system the separated CO2 from the flue gas at the first step is compressed to the storage pressure of 15 bar and sequentially in the second stage is cooled down to storage pressure at −30 °C [23]. The integration assessment showed a 29.8% capture rate. Given the selected pressure condition of 15 bar, it is evident that researchers are aiming to optimise the performance of CCC systems on seagoing vessels. However, the cryogenic potential of these systems is inherently limited by the LNG fuel consumption of the engines. Any additional use of LNG to enhance the cryogenic process would increase boil-off, which poses challenges in maintaining sustainable fuel pressure in the storage tank and potentially leads to higher overall fuel consumption. This underscores the necessity of balancing carbon capture efficiency with the operational constraints of LNG-fuelled vessels, emphasising innovative system integration and optimisation strategies to achieve sustainable performance.
LNG can also be used not only on LNG-fuelled seagoing vessels, but also as fuel on LNG regasification vessels such as FSRUs. The FSRU fleet has grown rapidly in recent years due to their contractual flexibility making it possible to relocate to different markets based on gas consumption demand. From an environmental standpoint, FSRUs have a lower impact as they cause less land disturbance than onshore terminals. Additionally, they facilitate the swift adoption of LNG as a lower-carbon alternative to coal and oil, contributing to the acceleration of power generation decarbonization and LNG as a fuel infrastructure development [24]. On an FSRU, the LNG is regasified by converting LNG from a typical temperature of −162 °C into a gaseous state at a temperature of 15 °C. The utilisation of cryogenic temperature is significantly higher with it being estimated that approximately 1.5% of the regasified LNG volume is required for the regasification process, while the remaining 98.5% could potentially be utilised as a source of environmental cooling to capture CO2. Due to numerous heat exchange-related regasification operations, and the potential of LNG cryogenic temperatures to enable conversion into CCC, in 2019 a study was released assessing the possibility of using LNG as potential source of cold to capture CO2 from exhaust gas in an LNG regasification plant. Rifka T., Morosuk T. et al. in their study showed a simulation of cooling down exhaust gases in the first stage to −40 °C where H2O vapour composition is separated from the flue gas stream using a flash separator [25]. Thereafter, the following stages take place: the flue gas stream is directed to a compressor with an interstate cooler, then enters a heat exchanger where the LNG cryogenic temperature cools it down to −140 °C with a CO2 concentration of 4.2%. The LNG is then regasified to 14 °C, after which CO2 is separated in a flash separator and pumped to a pressure of 150 bar. Finally, the liquefied CO2 is heated to −44 °C by exhaust gases. The completed research presents an option to utilize the captured CO2 as cold potential, regenerated during LNG regasification, for cooling exhaust gases in their primary state after combustion. Additionally, it is proposed to transport the pressurized CO2 via pipelines which explains the high-pressure treatment. However, the article does not provide detailed information on the flow rates, temperatures of fluids, gases, or other components involved in the simulation before and after the heat exchange or pressurisation. Consequently, the limited data hinder a comprehensive evaluation of the technology’s applicability to an FSRU vessel.
Another case study evaluates a unique FSRU structure’s compatibility by integrating CCC technology into a closed-loop regasification system adapting an ORC power generation system. The study shows a capture efficiency result of over 90% from the boiler flue gases and in addition minimizes the fuel consumption by 18% when regasification is carried out in a closed-loop regime [26]. Typically, the CO2 concentration of a natural gas combustion composition is in the range of 3–4%. The aim of technology integration is not even to capture CO2 emissions but to optimise energy consumption utilizing the flue gas temperature in exchange for the LNG cold temperature potential in cogeneration cycles.
A detailed analysis of the available information sources pertaining to the decarbonisation of sea transport through the utilisation of greenhouse gas extraction techniques reveals that the practical implementation of CCS technologies is constrained by the technological limitations inherent in ship systems. Conversely, the implementation of such a system on a ship should not result in any detrimental impact on the performance indicators of the operational systems, including FSRU regasification systems. The primary importance is given to the realisation of characteristic components of the energy balance of the multilevel regasification system and its temperature regime, taking into account the loading factors and the influence of the external environment. In the context of the expected contribution to the solution of these problems, a comprehensive project of comparative research into decarbonisation and regional application technologies for different types of ships is being implemented at Klaipeda University. A particular research direction involves the evaluation of CCS implementation on a floating terminal (FSRU) located in North Europe with a focus on its effectiveness. The initial stage of the research involved the preliminary estimation of energy components and indicators of the effect of CO2 capture from the ship’s gas engines and its subsequent transfer to the liquid phase. The analytical relations of the oxidation of the components of the chemical composition of diesel and natural gas were established and solved, based on which the energy balance of physical transformations of the components of CCS exhaust gases was determined. On the basis of comparative variation analysis for practical integration, the priorities of the so-called “wet” exhaust gas emission treatment are established, when the carbon capture ratio on a sea-going LNG-fuelled vessel can be boosted to 57% [27]. This publication presents the primary outcomes of further developed research endeavours directed towards the development of CCS applications for a standard LNG regasification system. The research tasks involved a structural analysis of the FSRU energy balance, serving as the basis for an analytical representation of the energy balance components within key technological blocks of the regasification system. This approach provided a quantitative framework for evaluating energy efficiency and optimizing system performance. The proposed FSRU applications were identified and characterised, with consideration for the impact of variable climatic factors and the compatibility of CCS with different regasification loops. The aim of the research is the identification of the most effective operational modes for optimizing the technological configuration of an FSRU to enhance decarbonization, along with its simulation-based Thermoflow modelling under actual operational parameters.

2. Methodology

2.1. Structure of the Research Object

The object of this research is an FSRU LNG regasification power system, which operates during the cold season when seawater temperatures drop close to freezing temperatures 1–2 °C. Therefore, the selected system is equipped with regasification machinery that allows the vessel to operate and regasify LNG year-round despite temperature challenges (Table 1). Figure 1 provides a schematic representation of the main structural blocks of LNG regasification into gas phase.
The LNG regasification process can be divided into four distinct loops. Figure 1 illustrates a schematic representation of the circulation of three different fluids within the LNG regasification cycle. This diagram was generated by the authors as part of experimental research conducted on an FSRU vessel capable of operating in both open- and closed-loop regasification modes. The schematic highlights four specific loops: the LNG regasification loop, the R290 loop, the seawater loop, and the steam loop. These loops are interconnected and operate in synergy through heat exchangers. LNG is stored in the cargo tanks, where the average temperature of LNG in the liquid phase is −162 °C and the LNG vapor temperature fluctuates around −130 °C. Each cargo tank is equipped with LNG regasification feed pumps that supply LNG to a buffer tank known as the suction drum. In addition, the FSRU vessel can operate in LNG carrier mode; therefore, each cargo tank also has two cargo pumps which can supply LNG to the regasification skid. From there, the LNG is transferred to a high-pressure pump, called the Booster Pump (BP). From the BP, the LNG is conveyed to the LNG vaporizer, passing through the LNG recondenser on the way. The recondenser in the LNG regasification cycle controls the Boil-Off Ratio (BOR) in the cargo tank: the boil-off gas (−130 °C) is directed to the recondenser, where the LNG, at −162 °C, condenses the Boil of Gas (BOG) and absorbs heat from it. Consequently, the LNG is heated up to −150 °C at the recondenser and subsequently transferred to the main LNG vaporizer. The LNG enters the vaporizer, where LNG is heated up to −6 °C. During this process, the LNG undergoes heat exchange with the refrigerant R-290, converting it from a liquid to a gas phase. R-290, selected for its thermodynamic properties to withstand temperature fluctuations and low freezing point, enters the vaporizer at −1.4 °C and exits at −14.6 °C.
The main difference between open-and closed-loop regasification systems on FSRU vessels lies in the source of heat used to warm up the propane R-290 fluid which vaporizes the LNG during the regasification. When the sea water remains at a stable temperature above 13 °C, the sea water after the cycle of passing through the heat exchangers (pre-heater and evaporator) is returned to the sea. Meanwhile, in a closed loop the boilers contribute as a steam production source to heat seawater. The regas boilers produce steam at 120 °C and 10 bar pressure, which is sent to the seawater steam heaters. Steam heater operating conditions on the steam side are inlet temperature 120 °C, operational pressure 1 bar, outlet 80 °C; on the seawater side, inlet temperature 6 °C, operational pressure 7 bar, and outlet temperature 25 °C.

2.2. Structure of the Energy Balance

Figure 2 represents the distribution of the energy balance in a closed-loop regime when the vessel is running regasification at full capacity. The regasification chain consist of three energy exchange blocks: sea water and steam energy exchange; sea water and propane energy exchange; propane and LNG energy exchange. The regas boilers have a 10 MW redundancy compared to the 81.3 MW capacity of the seawater steam heaters. Most heated water (77%) goes to the propane evaporator, while 23% is sent to the propane pre-heater. In open-loop mode, the steam heaters are bypassed, and seawater is fed directly to the evaporator and pre-heater. Previous studies estimate 1018 kJ is needed to regasify 1 kg of LNG. The selected FSRU’s 92 MW boiler capacity aligns with these estimates, confirming their accuracy [27]. A systematic energy balance review enables system retrofit options with CCS integration. The systematic layout in Figure 2 can serve as a foundation for the Thermoflow modelling and validation of CCS integration.

2.3. Composition of Combustion Flue Gas

The compositional assessment of the combustion product is a vital process for determining the energy exchange process. It is particularly important to take into account the water vapour component, which is removed in the first stage. The assessment is performed in expression of a system of Equations (1)–(4) which estimates the proportional composition of flue gas. The necessary volume of air to perform fuel combustion under stoichiometric conditions is taken as 0.59 Kmol/1 kg fuel. The air/fuel ratio λ for the engines and regas boilers is considered equal to characteristic value conditions optimal for nominal engine and boiler performance under all running conditions and regasification at full load.
r C O 2 = C 12 C 12 + H 2 + 0.21 L a i r λ 1 + 0.79 L a i r λ = 0.755 12 0.755 12 + 0.245 2 + 0.21 × 0.59 × 2 1 + 0.79 × 0.59 × 2 = 0.05 ,
where: r—composition in percentage of element of combusted 1 kg LNG fuel; C—atomic mass fraction of carbon in the fuel; H—atomic mass fraction of hydrogen in the fuel; 0.21 Lair (λ − 1)—amount of oxygen of 1 kg fuel; 0.79 Lair λ—amount of nitrogen of 1 kg fuel.
r H 2 O = H 2 O 2 C 12 + H 2 O 2 + + 0.21 L a i r λ 1 + 0.79 L a i r λ = 0.245 2 0.755 12 + 0.245 2 + 0.21 × 0.59 × 2 1 + 0.79 × 0.59 × 2 = 0.10 ,
r O 2 = 0.21 L a i r λ 1 C 12 + H 2 O 2 + + 0.21 L a i r λ 1 + 0.79 L a i r λ = 0.21 × 0.49 × 2 1 0.755 12 + 0.245 2 + 0.21 × 0.59 × 2 1 + 0.79 × 0.59 × 2 = 0.10 ,
r N 2 = 0.79 L a i r λ C 12 + H 2 O 2 + + 0.21 L a i r λ 1 + 0.79 L a i r λ = 0.79 × 0.59 × 2 0.755 12 + 0.245 2 + 0.21 × 0.59 × 2 1 + 0.79 × 0.59 × 2 = 0.75 ,
The results of the equations are summarised in Table 2. On the FSRU, which operates in both open- and closed-loop regimes, the emission sources are divided into two groups: those from the regas boilers and those from the engines. Consequently, the table also provides an indication of the exhaust gas flow at peak regasification rate.
With regard to daily consumption, calculations are performed using Equation (5) to estimate the volume of energy necessary for CO2 capture when the FSRU is running regasification in a closed-loop regime. In the equation, consumption is considered at the peak of maximum regasification, where the density of LNG is 448 kg/m3. In the equation: m—fuel consumption, m3 of LNG per day; ρ—density of LNG.
Q C l o s e d   l o o p = m × ρ × 18,254 k J k g = 160,384   k g × 18,254   k J / k g = 813,235   k W / d a y ,
Q O p e n   l o o p = m × ρ × 18,254 k J k g = 25,984   k g × 18,254   k J / k g = 131,754   k W / d a y ,

2.4. The Mathematical Expression of the Regasification Energy Balance

The structure of the mathematical model includes three main blocks of energy exchange in the form of heat (Equation (6)). In the equations, dU is an expression of energy change per elementary time. Uboiler—steam energy flowing to sea water heat exchanger; UW—sea water energy flowing to sea water heat exchanger; Upropane—propane energy flow to propane heat exchangers; ULNG—LNG energy flow to vaporizer.
d U b o i l e r = d U w ,
d U w = d U p r o p a n e ,
d U p r o p a n e = d U L N G ,
Equation (7) is an expression of energy exchange at different heat exchangers throughout the regasification process which is structured into three blocks: (1) boiler-steam circulation and sea water heat exchanger; (2) sea water and propane loop heat exchanger; (3) propane and LNG heat exchanger.
d U b o i l e r · η b o i l e r + d U w · η W + d U p r o p a n e · η p r o p a n e = d U W + d U p r o p a n e + d U L N G ,
The results are interrelated and are obtained by iteratively solving the system of equations in Equation (8). In the equations: Gf—fuel consumption in boiler; Hu—energy production per 1 kg combusted fuel; ηboiler—efficiency index; GW—sea water flow; hW1—sea water enthalpy after heating; hW2—sea water enthalpy before heating; Gpropane—propane flow; hpropane1—propane enthalpy after heating; hpropane2—propane enthalpy before heating; GW—steam flow; hw1—steam enthalpy before cooling; hW2—steam enthalpy after cooling; Gpropane—propane flow; hpropane1—propane enthalpy before heating; hW2—propane enthalpy after heating; GLNG—LNG flow; hLNG(propane)—LNG enthalpy before; hW2—LNG enthalpy after heating; Gf—engine fuel consumption; Hu—energy production; ηengine—efficiency index; Pe—engine power production, kJ.
G f · H u · η b o i l e r + G w h W 1 h W 2 η t W + G p r o p a n e h p r o p a n e 1 h p r o p a n e   L N G η t   p r o p a n e = G W h w 1 h w 2 + G p r o p a n e h p r o p a n e 1 h p r o p a n e W + G L N G h L N G 1 h L N G 2 G f · H u · η e n g i n e = P e n g i n e · 3600 G f · 2.75 C O 2
In the system performance assessment process, it is essential to define the key variables that influence the simulation outcomes, ensuring their proper integration into the model. Equation (8) expresses the regasification closed-loop energy balance with the indicated relation to the engines’ performance. Energy balance flow has a direct impact on engine fuel consumption; therefore, in the simulation further both the CO2 generated by boilers and the engines’ performance is taken into account. To assess the CCC technology integration, Thermoflow Thermoflex 32 software is introduced to replicate the existing regasification system with the aim of evaluating whether the software is capable of simulating actual performance results and whether its parameters and thereafter the CCC integration solution are verified. In the simulation, the Equation (8) variational parameters are key elements to define system performance results, such as G L N G which represents LNG regasification demand and G w h W 1 h W 2 which describes the regasification performance loop in summer and winter seasons when sea water is below or above 13 °C. The FSRU power production directly corresponds to regasification activity; therefore, in the equation the fuel consumption corelation is expressed as G f · 2.75   C O 2 : 1 kg of natural gas releases 2.75 kg of CO2.
In this research, the simulation is performed considering FSRU performance at nominal 100% regasification load when it is operating in the closed-loop regime when steam supply from the regas boiler is heating sea water which is circulating in a closed system.

3. Results

3.1. Structural Analysis of the Regasification Energy System

The structural analysis of the system provides the basis for identifying more rational principles for the applicability of CCC technology to FSRUs, achieving a dual effect of CO2 separation from the combustion processes and increasing the energy efficiency of the system by reducing fuel consumption.
The principal idea of CCC integration with the existing regasification process is illustrated in Figure 3, where the authors propose to divide the thermal balances into main two stages: (i) water condensate removal in optimization of the sea water heating process; (ii) cooling down of exhaust gas in optimization of LNG vaporizer performance. At the first carbon capture step, the flue gas flows to the heat exchanger with two-phase output: liquid water condensate and a gas phase mixture of CO2; O2; N2. In this process, the exhaust gas transfers up to 11.4 MW of heat to sea water which is heated to an outlet condition of 25 °C, equal to the sea water steam heater performance parameters. Then, at the next step, the gas mixture is cooled down to the temperature equal to the CO2 liquefication condition of −57 °C; however, considering that in order to obtain liquid- phase CO2, after cooling down CO2 pressure should be introduced at a further step, the remaining exhaust gas mixture is pressurized from the atmospheric pressure to 5.1 bar. Together with pressurization, the exhaust gas temperature will increase; therefore, an additional sink-type cooler shall be considered in the simulation case. In overall CO2 liquefication, the exhaust gas mixture has a theoretical estimate of 5.9 MW of heat transfer to LNG. Due to the direct reduction in steam production, the gas consumption of the regas boiler should accordingly decrease by 22%. The energy consumption estimates presented in the subsection are derived from the analytical evaluation of combustion products in the first publication of this research work [27].
To evaluate full system compatibility and potential retrofit of the system, Thermoflow Thermoflex 32 software is used for evaluation which enables the parameters to be verified. This software is a tool widely used in industrial and maritime applications, particularly for thermal process simulation, energy efficiency analysis, and verification of system optimization. The application is widely used in LNG terminals, power plants, and ship propulsion systems allowing estimation of the performance of heat exchangers, compressors and fuel systems [28]. The result of the mathematical modelling, based on the principle of CCC technology as outlined in Figure 3, was realised on the basis of the Thermoflow infrastructure.
The FSRU regasification system was simulated with Thermoflow Thermoflex 32 software, and Figure 4 represents the result. The system has shown simulation results accurate to actual performance which enables us to develop further system modifications enhancing CCC technology implementation as proposed in the above methodology and literature review. In general, four different energy exchange blocks defined in the simulation and the results were simulated:
Steam inlet 8: steam flow from regasification boiler at 1 bar pressure, 120.9 °C, and 34.2 kg/s.
Sea water inlet 9: sea water circulation in closed-loop regasification at 7 bar pressure, 6 °C, and 1018 kg/s mass flow.
LNG from cargo tank 19: the LNG condition is considered after bypassing the BOG recondenser; therefore, the LNG temperature is −150 °C and pressure is 56 bar, with mass flow equal to 102 kg/s (peak regasification capacity). Note: instead of simulating three individual LNG/propane heat exchange loops, one regasification train was simulated based on sum of three units’ capacity.
Propane inlet 23: closed-loop R-290 refrigerant circulation at 2.3 bar pressure in the buffer tank and mass flow of 230 kg/s. Note: propane pressure is being controlled by pump 24 which increases fluid pressure up to 10 bar and then at the propane evaporator 5 pressure control valve it decreases down to 4.05 bar.

3.2. FSRU Regasification System Energy Balance Structural Review

The FSRU regasification system simulation which is presented in Figure 4 illustrates the flow process of energy exchange between steam, water, and propane. The regasification boilers which are two individual units produce steam which flows to the steam skid located on the FSRU’s upper deck. The steam skid is separated into three individual heat exchangers which have the same 27,100 kW heat exchange capacity. At the peak load of regasification, all three units are in operation; therefore, the control valve marked in simulation as splitter 10 is opened equally dividing the steam stream into 33.33% or 11.4 kg/s steam mass flow per stream: 1; 2; 3. On the other side, the sea water is circulating; following simulation the minimum sea water temperature is considered to evaluate the heat exchanger’s performance. Sea water at 6 °C temperature and 7 bar pressure is also divided into three streams at splitter 11 each containing 339 kg/s mass flow of sea water: 10; 11; 12. Both fluids perform heat exchange at the sea water steam heater: 1; 2; 3. The simulation has indicated that after heat exchange, the steam temperature decreases down to 70 °C converting steam into condensate. Then, the sea water is heated up to 25 °C. The simulation result showed that the achieved heat transfer capacity of the SW steam heater is equal to 27,353 kW per unit.
After the water is heated, all three streams connect into one at streamer 13 which splits into two streams at splitter 14: 23% of the total mass flow is directed to steam 17 and the remaining 77% is sent to steam 19. At this point, the sea water is flowing to two different propane heat exchangers: the evaporator and pre-heater (Figure A1). In steam 16, marked in purple, propane R-290 is circulating.
In the buffer tank, propane is stored and supplied to the system. In the simulation, a refrigerant flash tank connects the storage tank with the refrigerant pump, ensuring that only the liquid phase of propane reaches the pump, replicating the actual system layout and preventing operational issues. The propane pump increases the pressure, delivering a steady mass flow. The first propane stream flows to the pre-heater, where it is warmed by seawater before continuing through the system. A second propane stream is directed to the trim heater, where it transfers heat to vaporized LNG, bringing it to the required temperature before entering the grid. During this process, the propane absorbs cold energy and is subsequently cooled. After the LNG vaporizer, the propane stream passes through a pressure control valve, reducing pressure before reaching the propane evaporator. Here, the propane is slightly heated, transitioning from liquid to gas. The gaseous propane then flows to the LNG vaporizer, where it facilitates the phase change of LNG from liquid to gas. After heat exchange, the cooled propane returns to the buffer tank to complete the cycle.
Figure A2 illustrates in simulation the heat exchangers’ achieved performance and specifies the capacity and operational conditions of the propane evaporator, propane pre-heater, and trim heater. The total sum of the propane pre-heater, trim heater, and LNG vaporizer heat exchangers on the FSRU vessel is 160 MW. Taking into consideration the achieved results, the comparison allows us to evaluate the accuracy of the results compared to actual performance.
The simulation generated the following parameters of heat exchange:
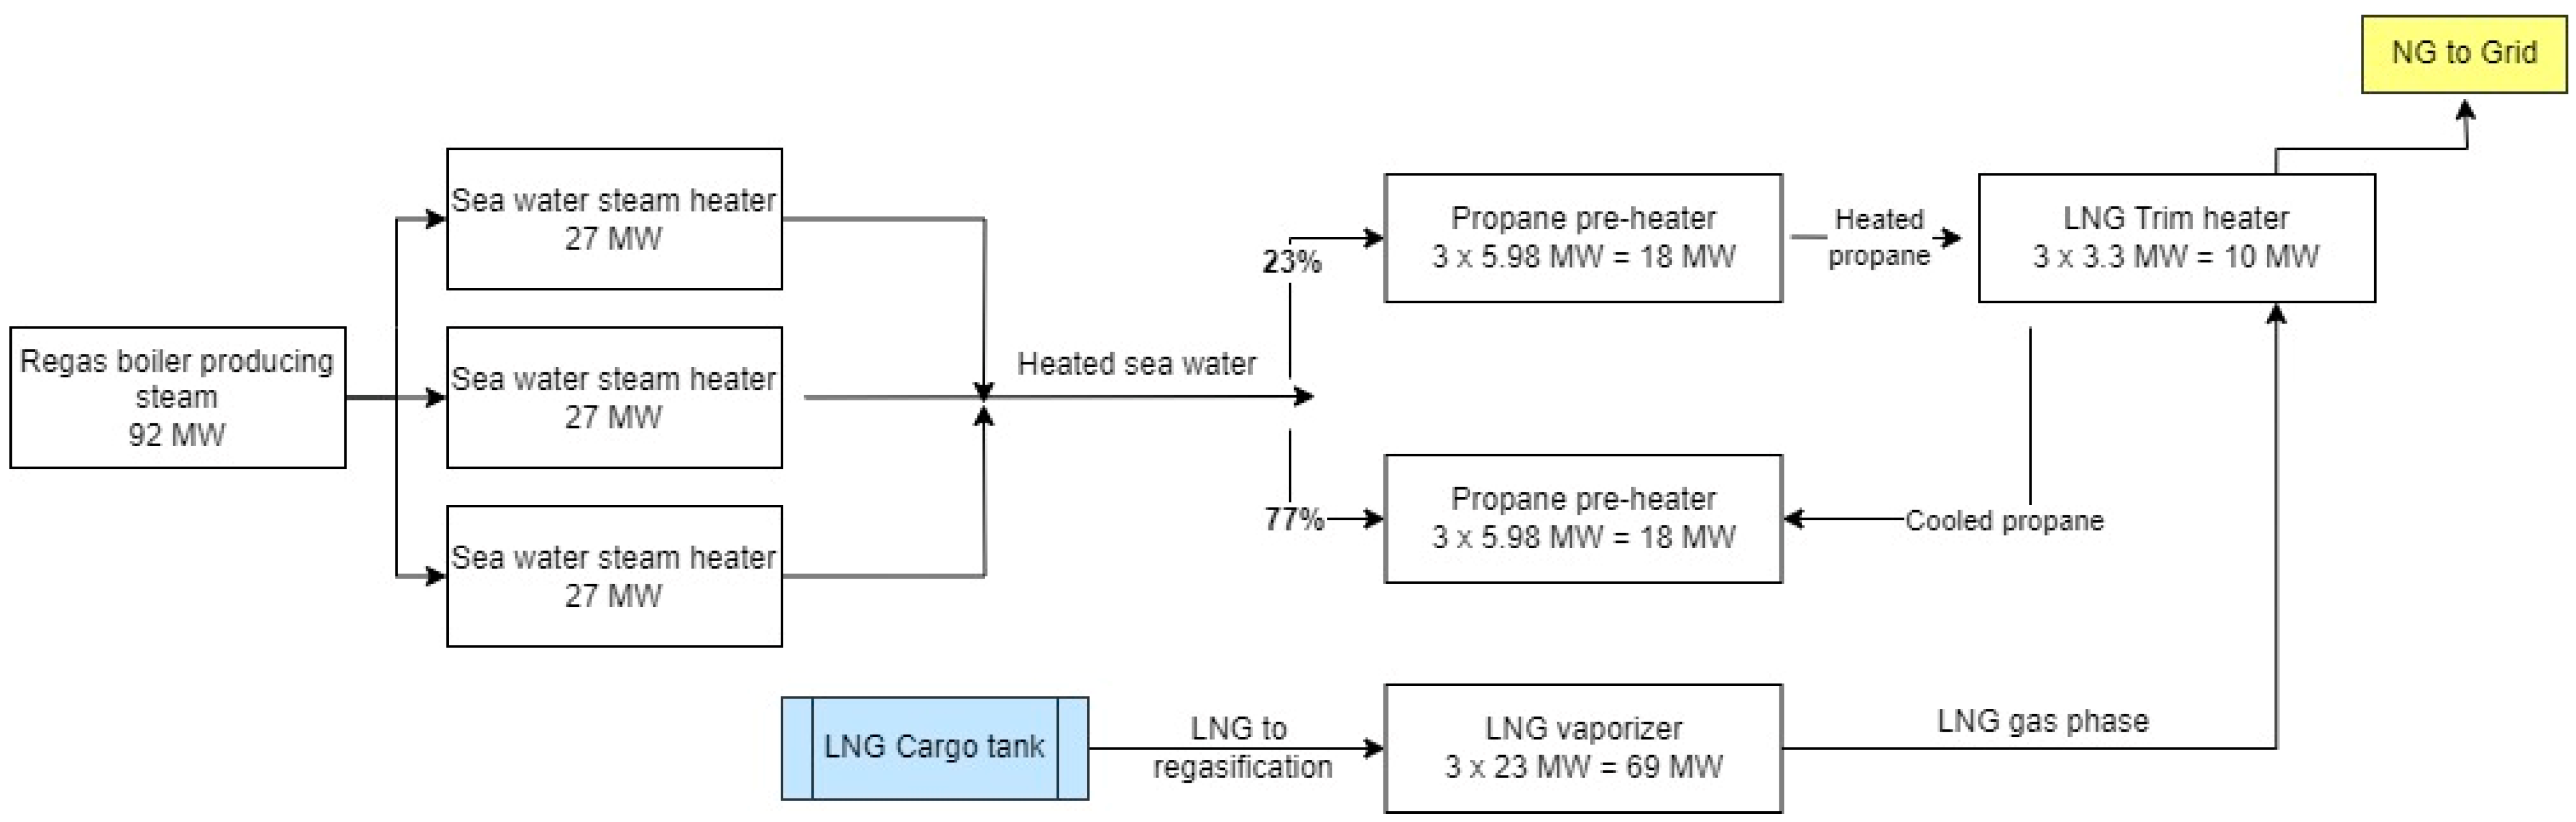
  • LNG vaporizer: heat transfer of 65,763 kW;
  • Trim heater: heat transfer of 12,131 kW;
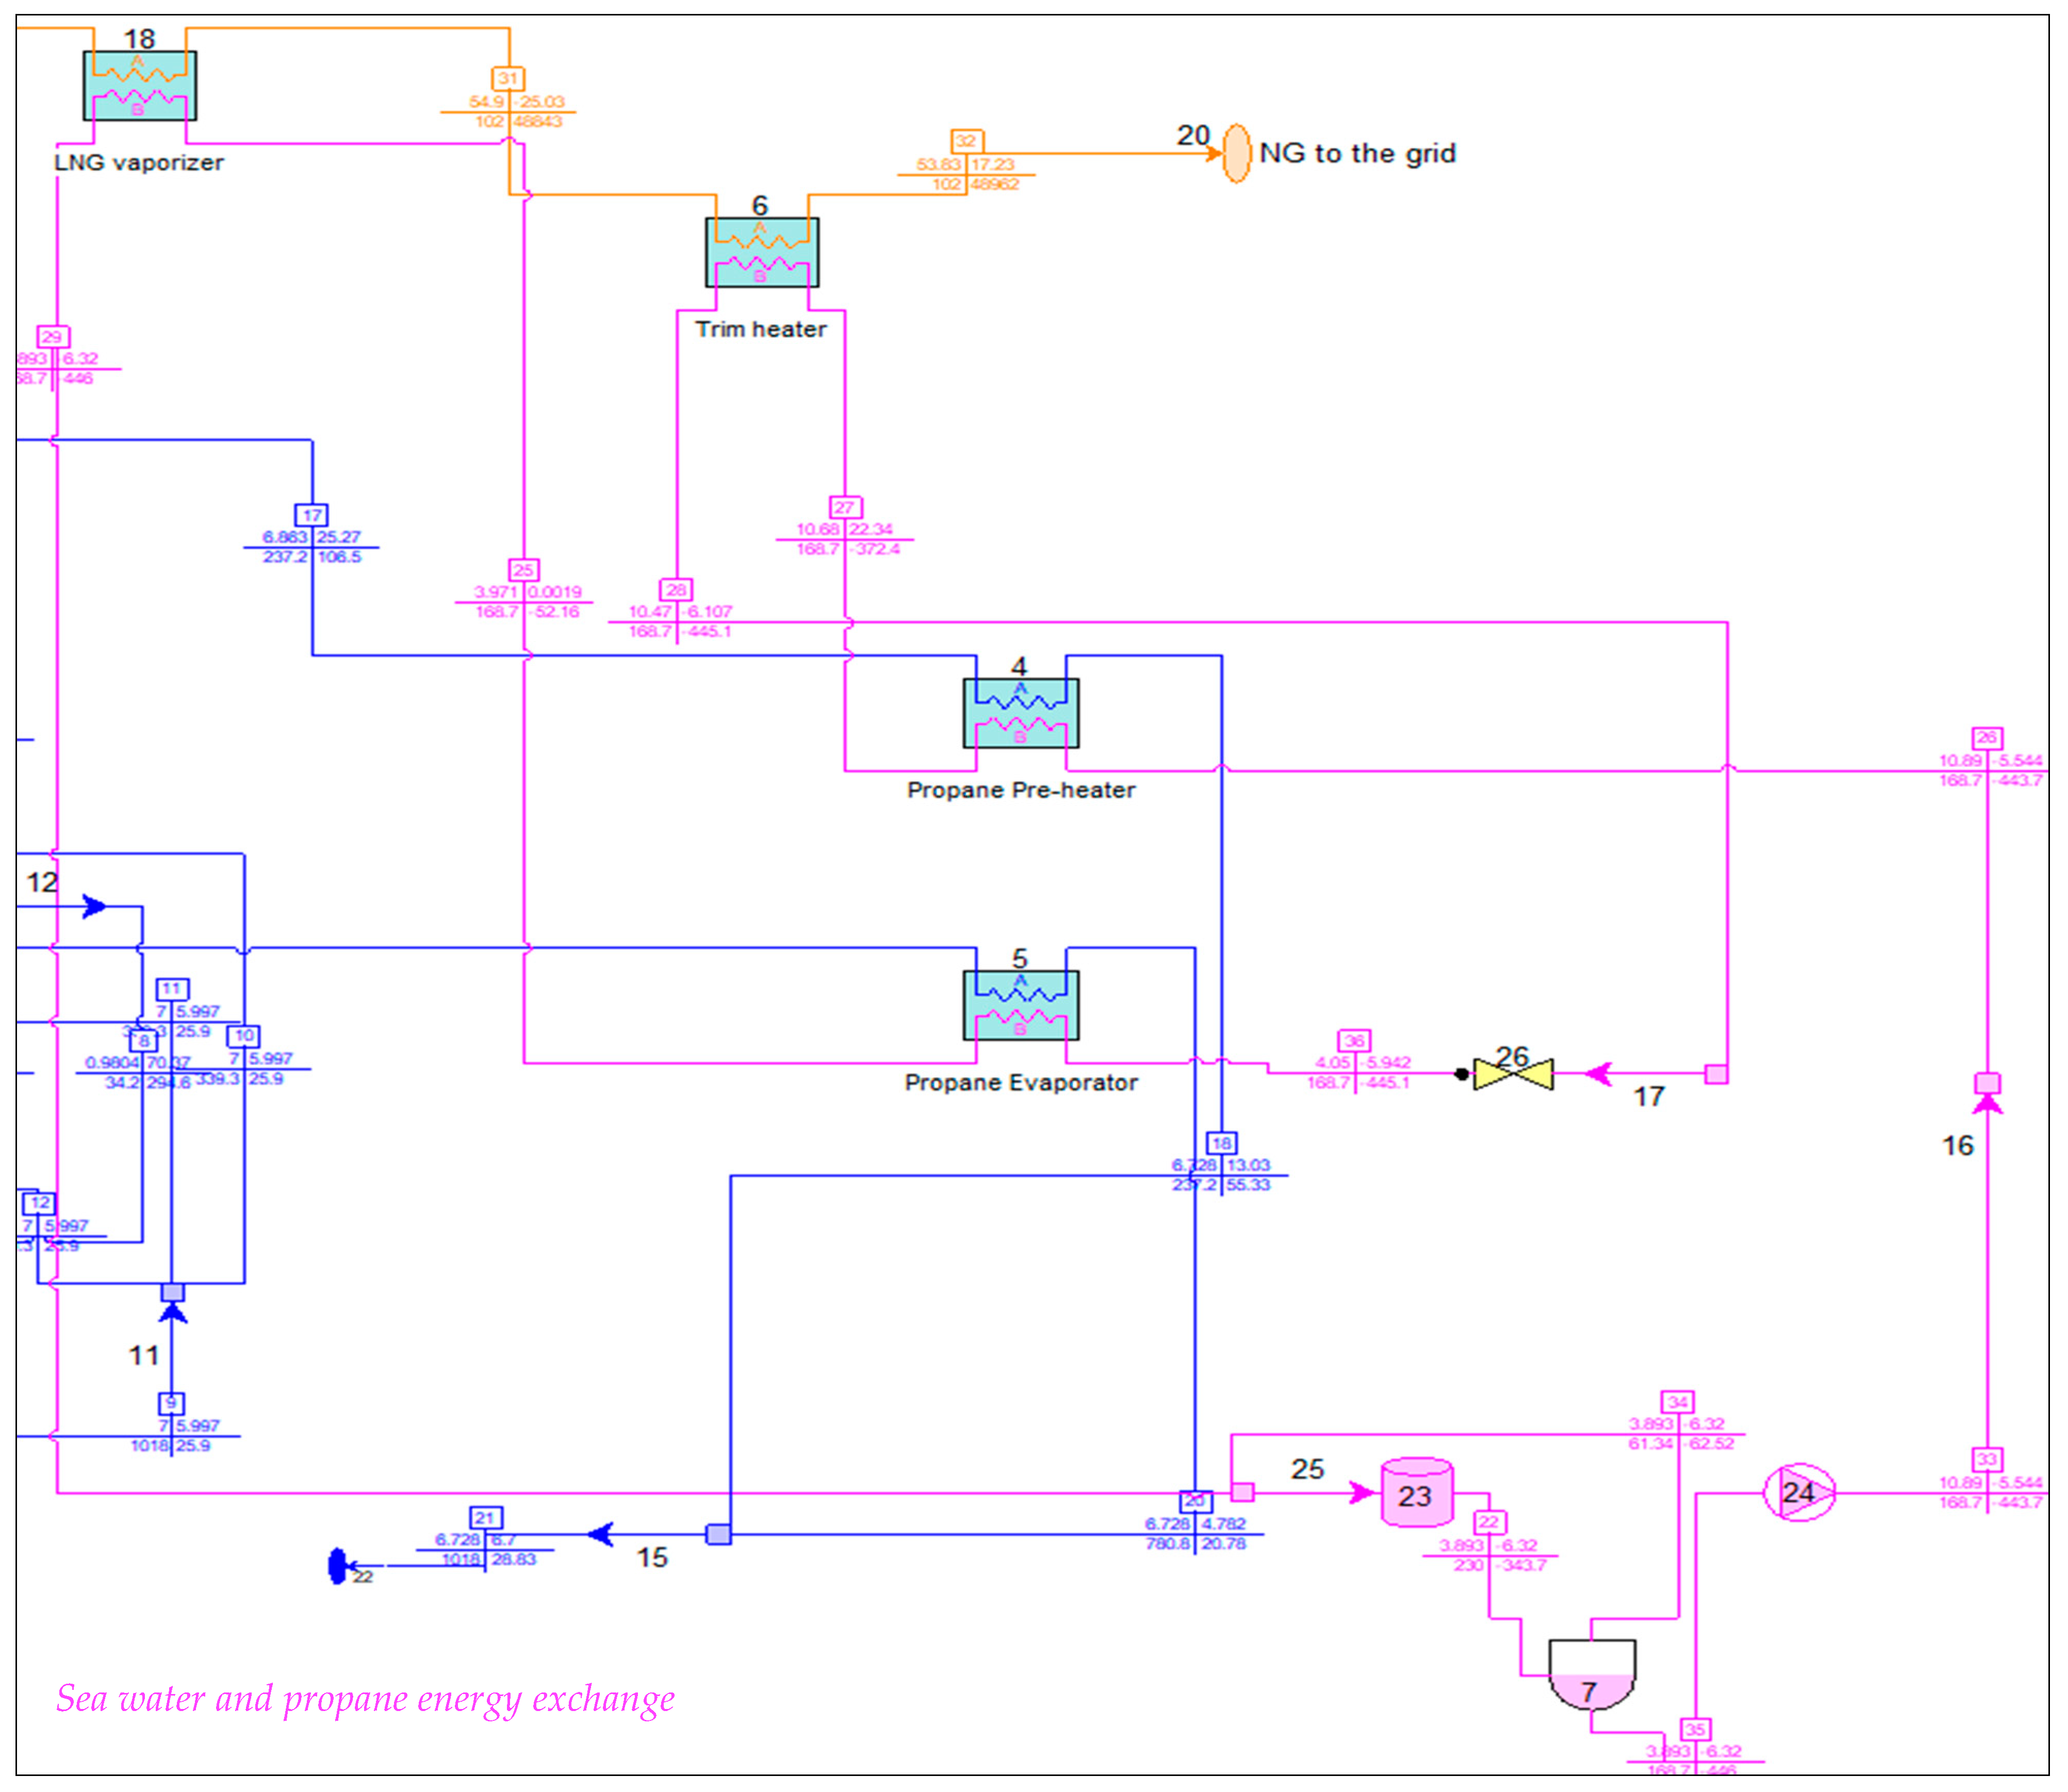
  • Propane pre-heater: heat transfer of 12,018 kW;
  • Propane evaporator: heat transfer of 66,272 kW;
  • Total: 156,184 kW.
Overall, the achieved result showed 2.4% deviation which is within the acceptable tolerance range applied for maritime and offshore simulations [29]. The system operational conditions are presented in Table 3.
After simulation of the FSRU closed-loop regasification system, we continue with simulation of the integration of the CCC system. Considering the estimation completed in our previous study, 1 kg of combusted LNG fuel generates 26.1 kg of exhaust gas emission [27]. The CCC integration should minimize fuel consumption of the regas boiler by 26%. Accordingly, to perform the simulation the following FSRU performance conditions were considered and used for simulation purposes:
-
Regasification is running at peak load capacity;
-
Fuel consumption is 90 m3 LNG for the engines and 218.3 m3 LNG for regasification boilers;
-
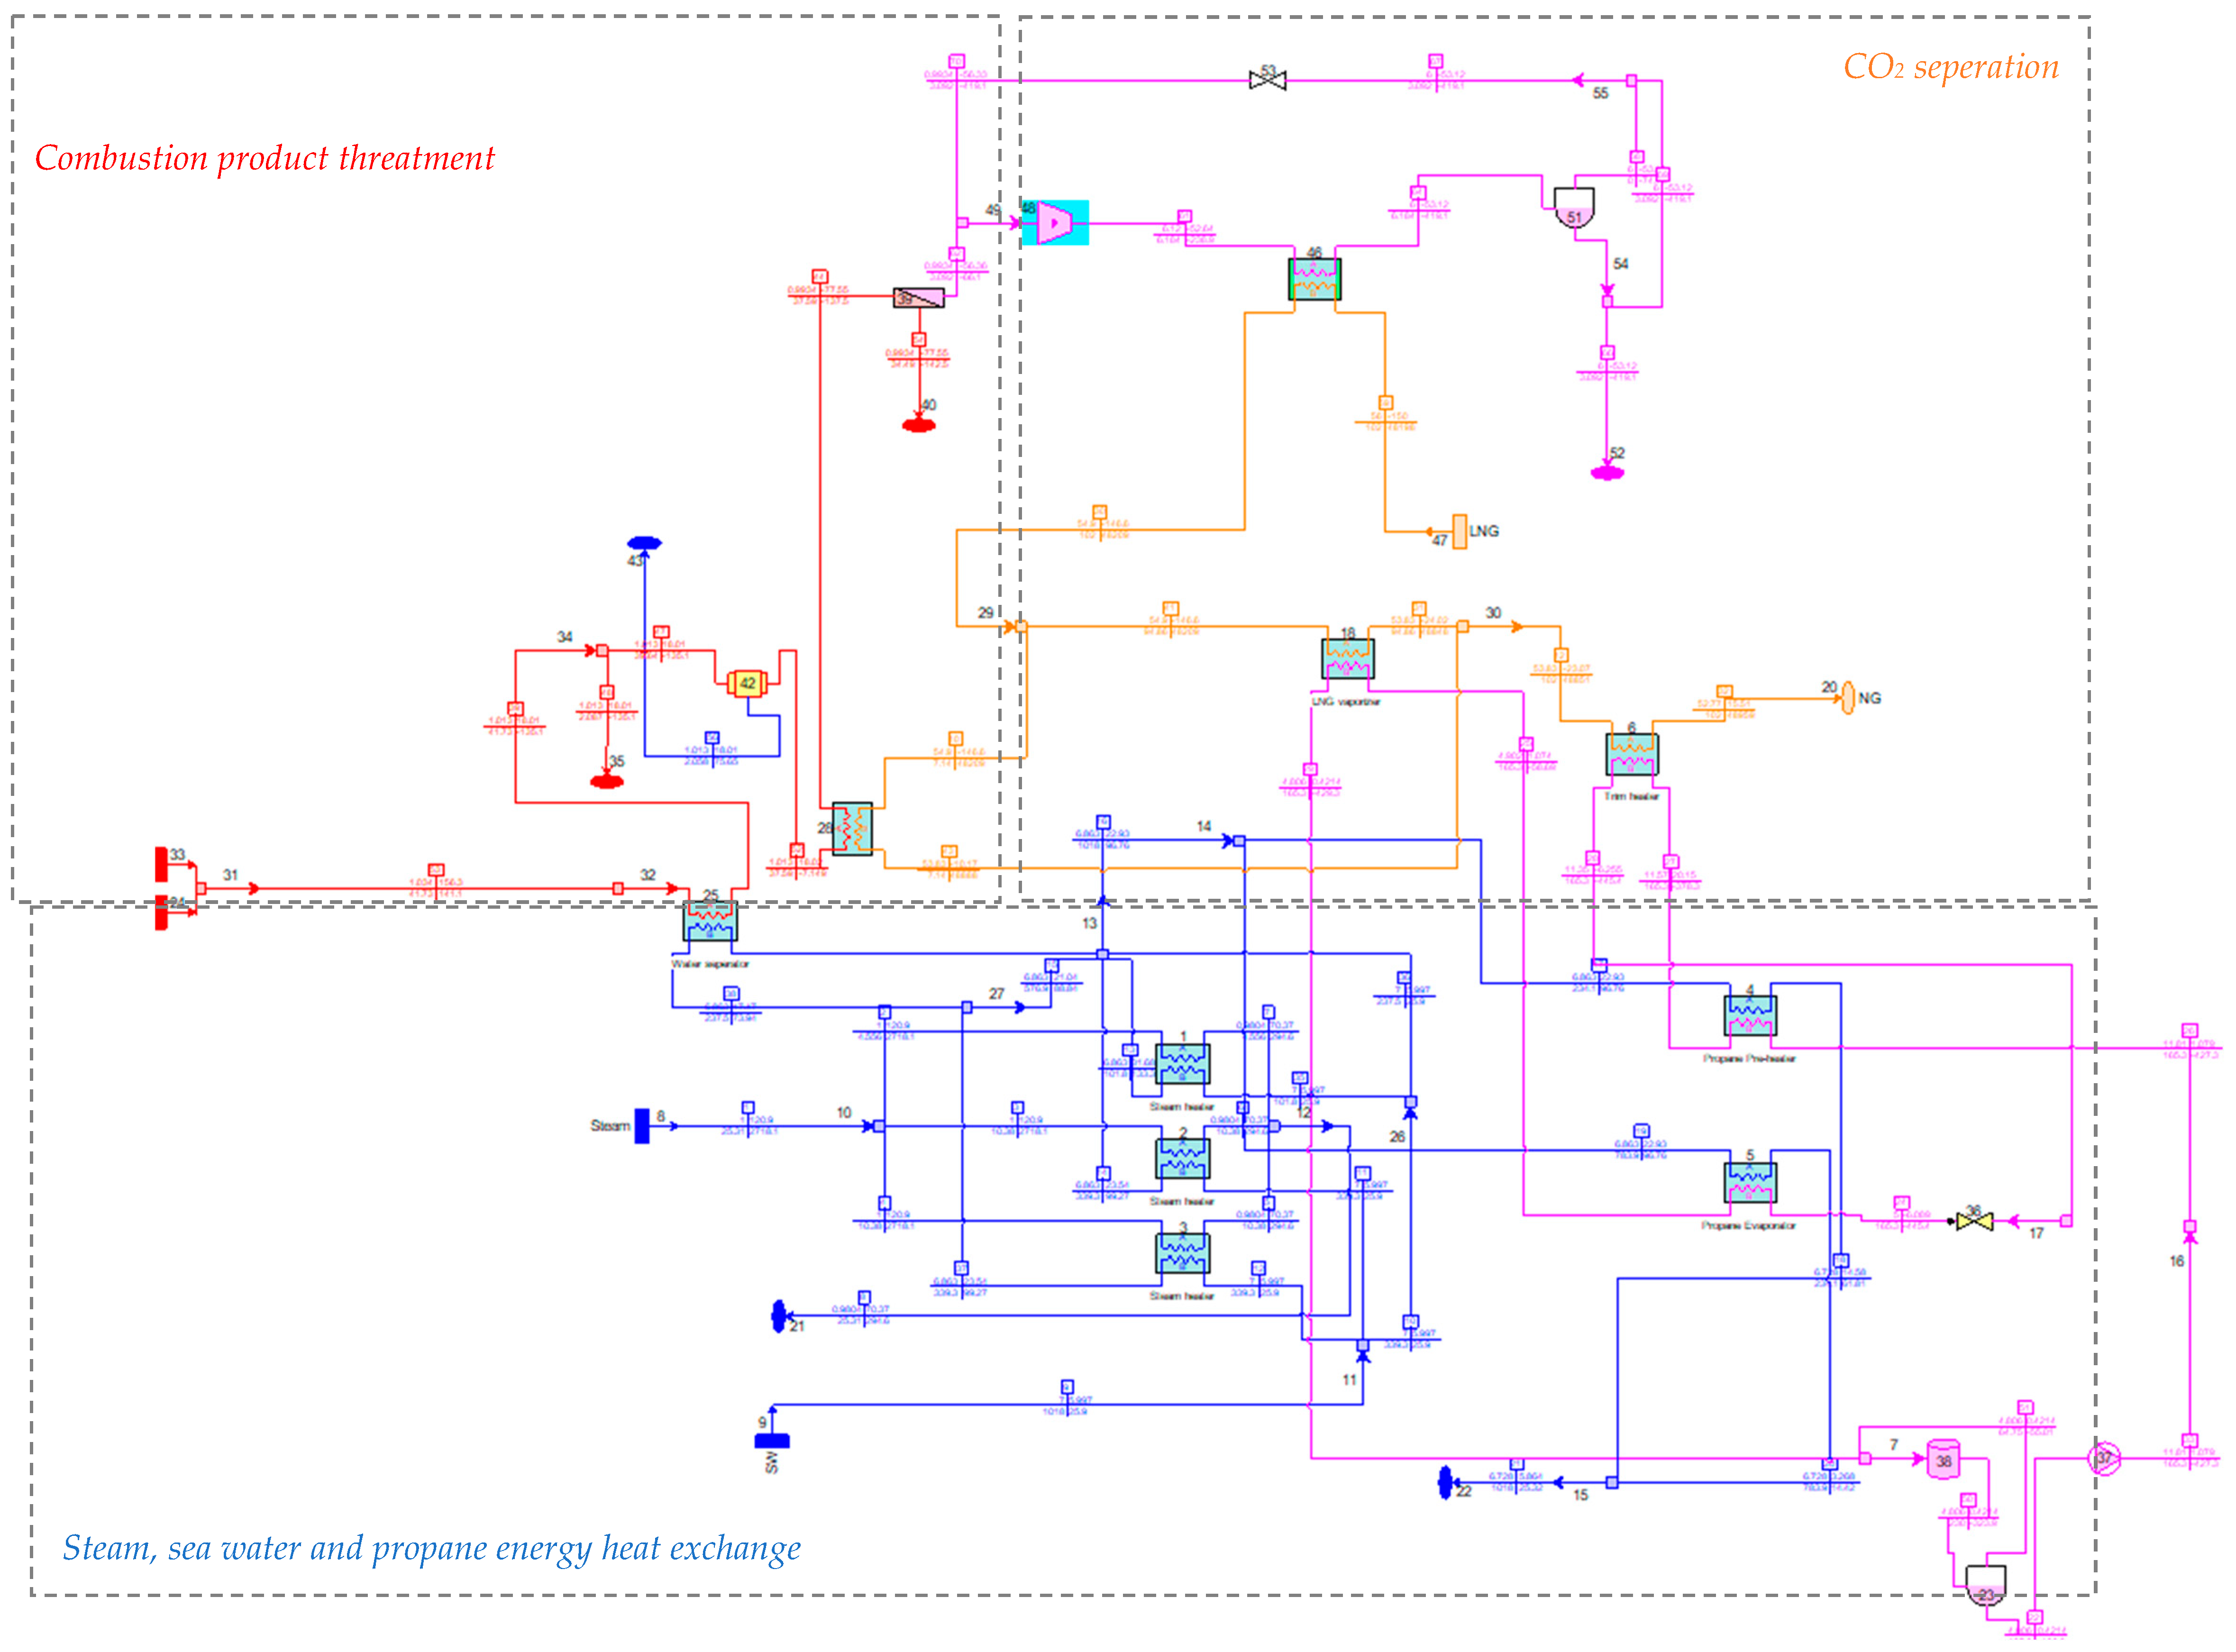
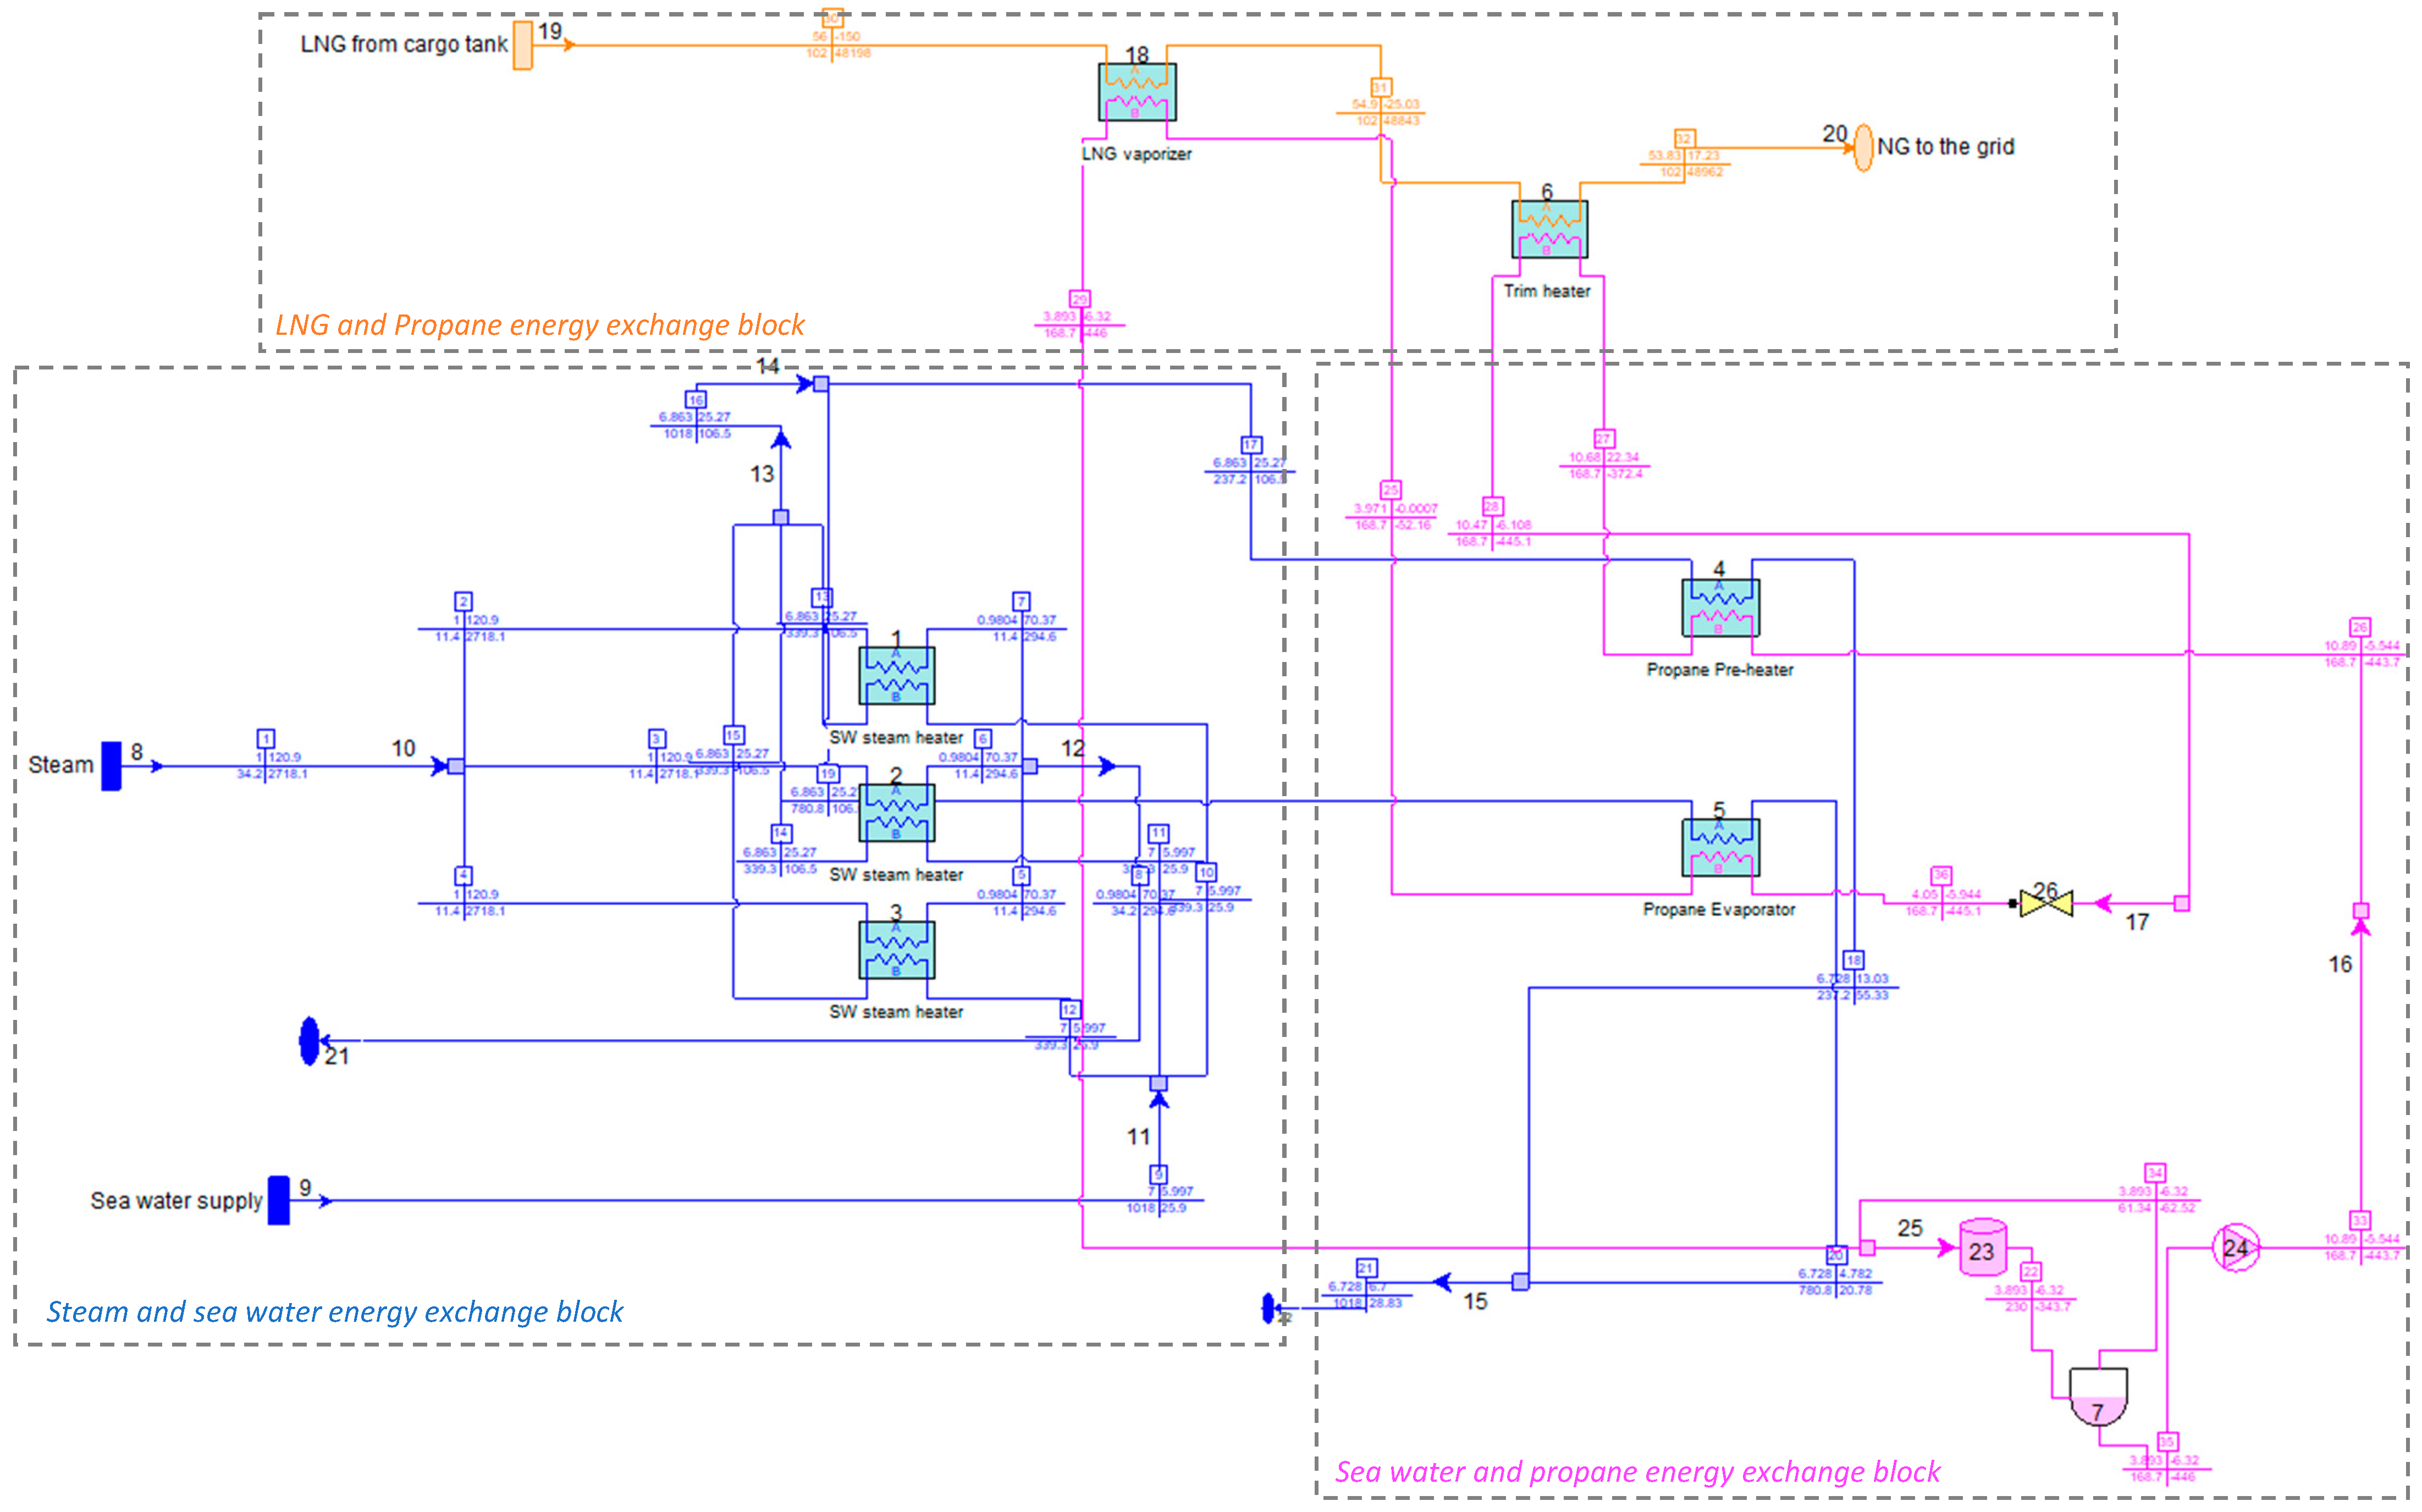
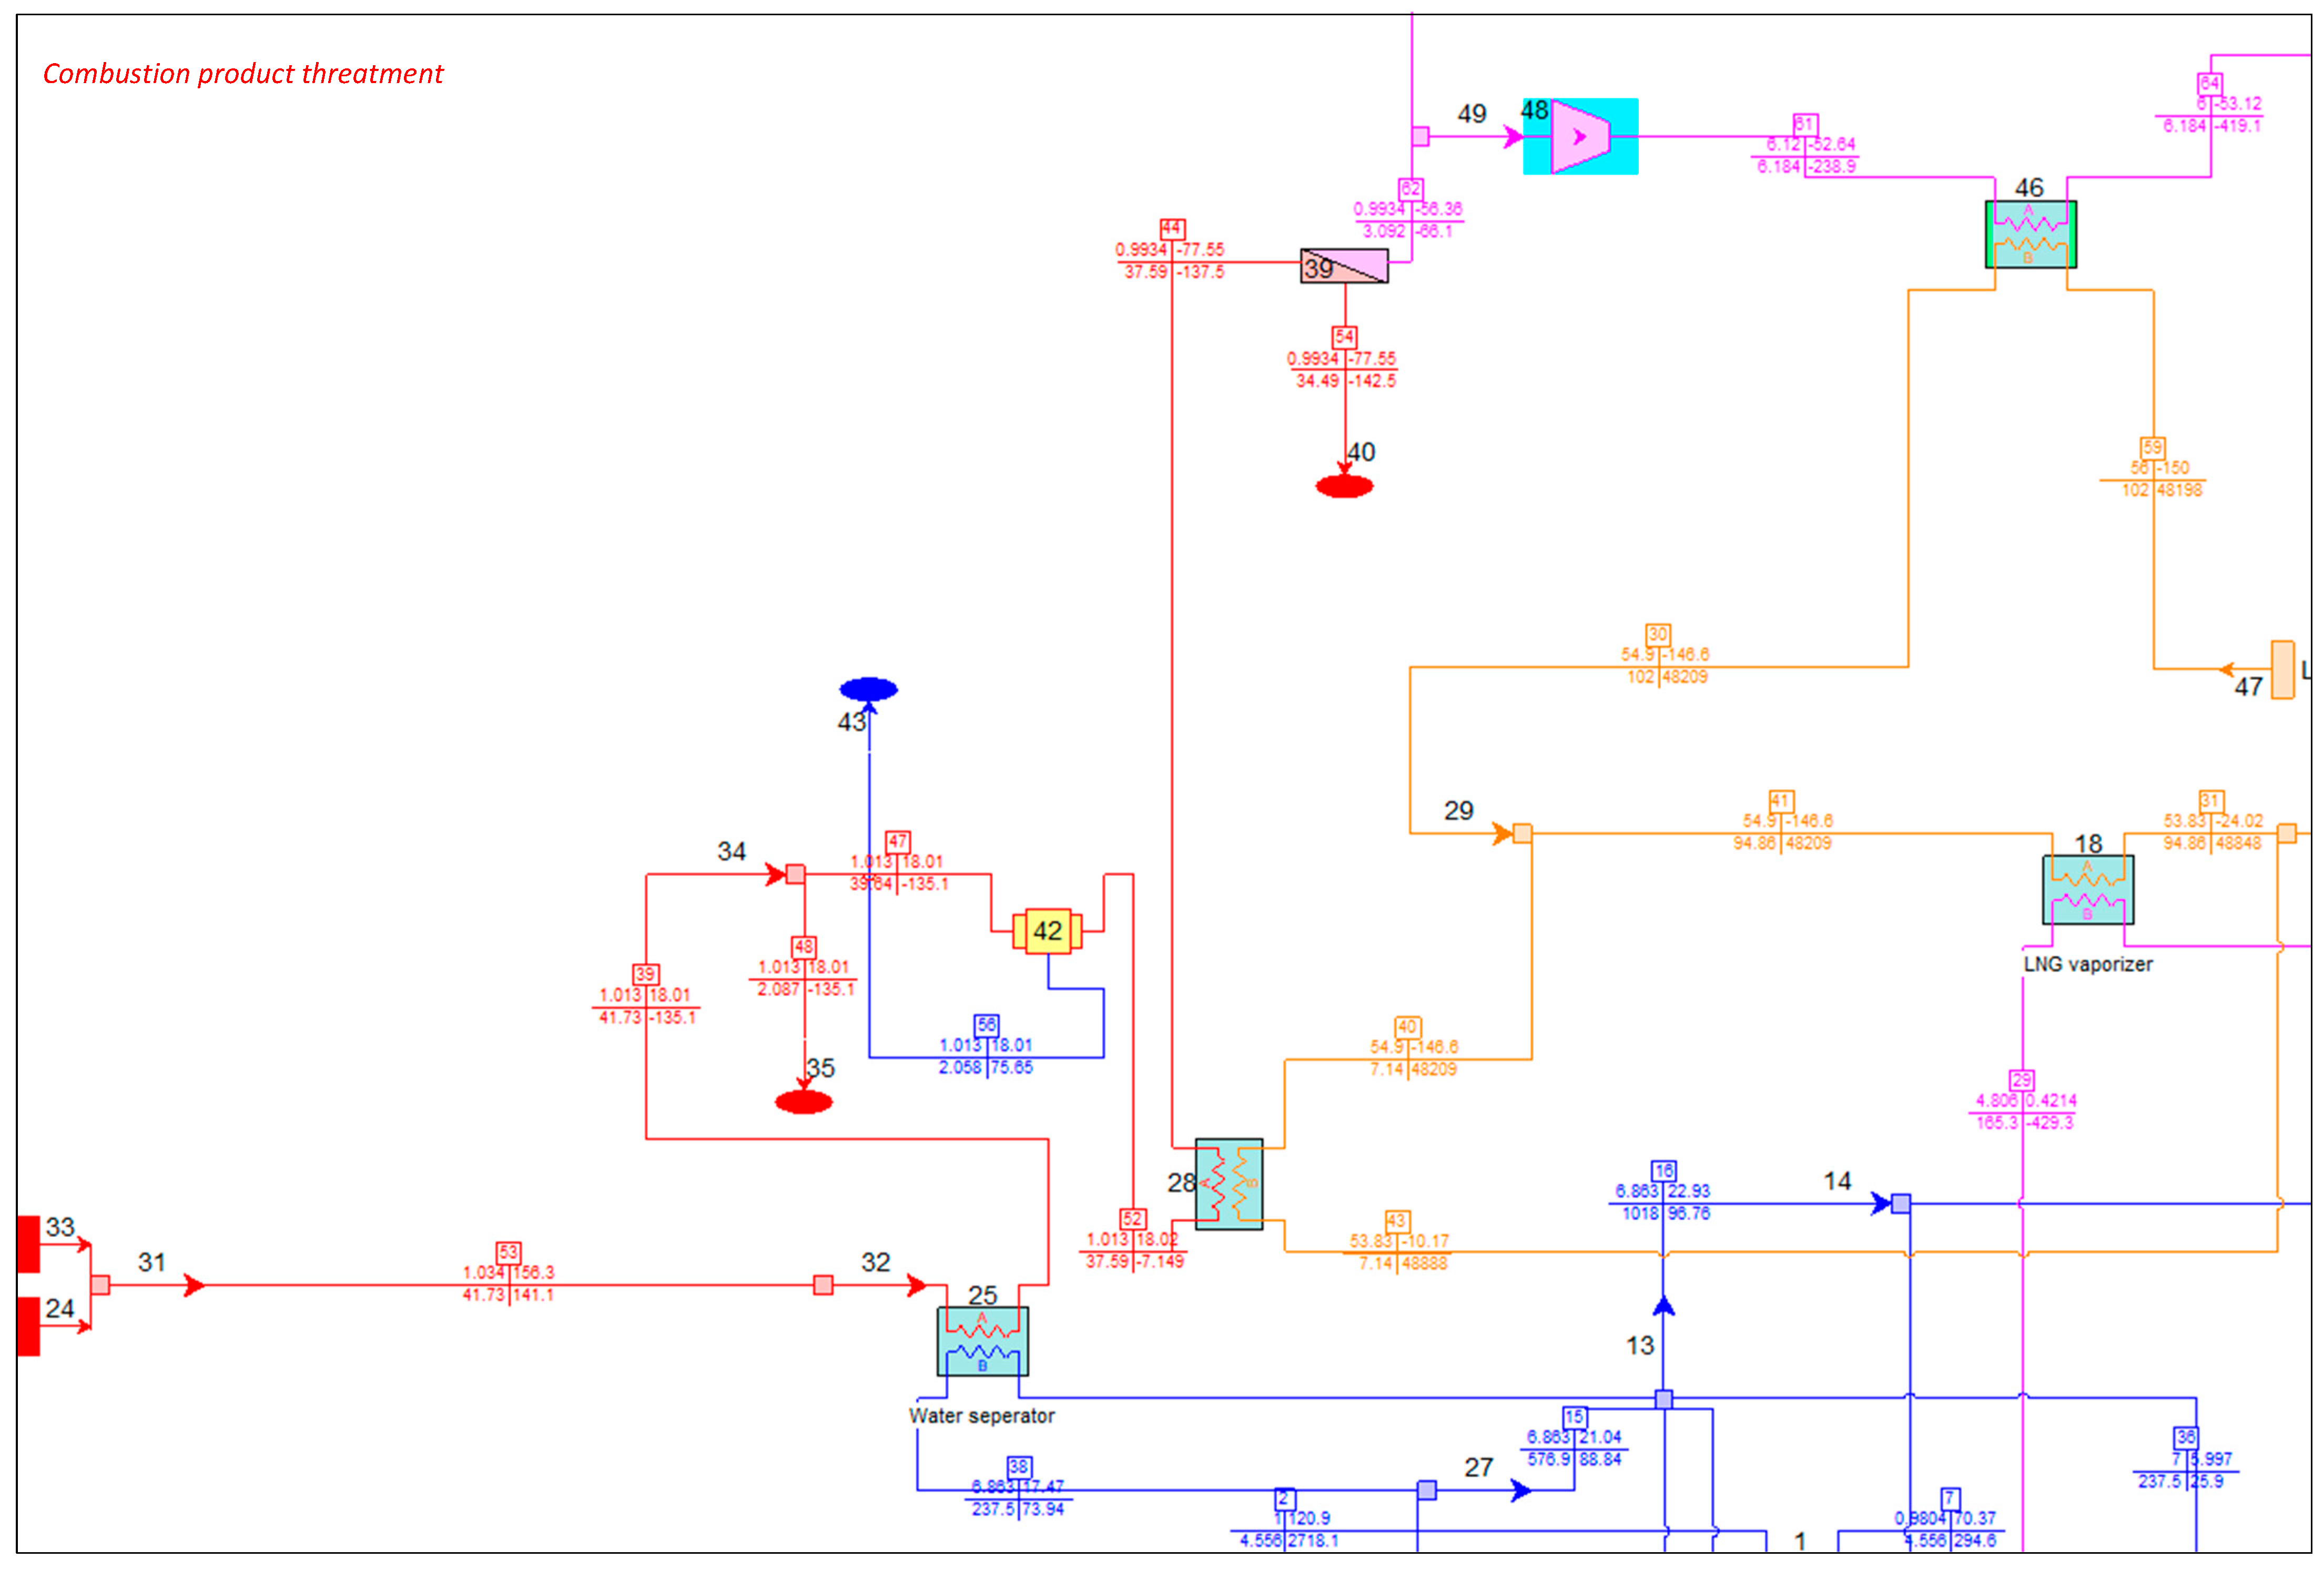
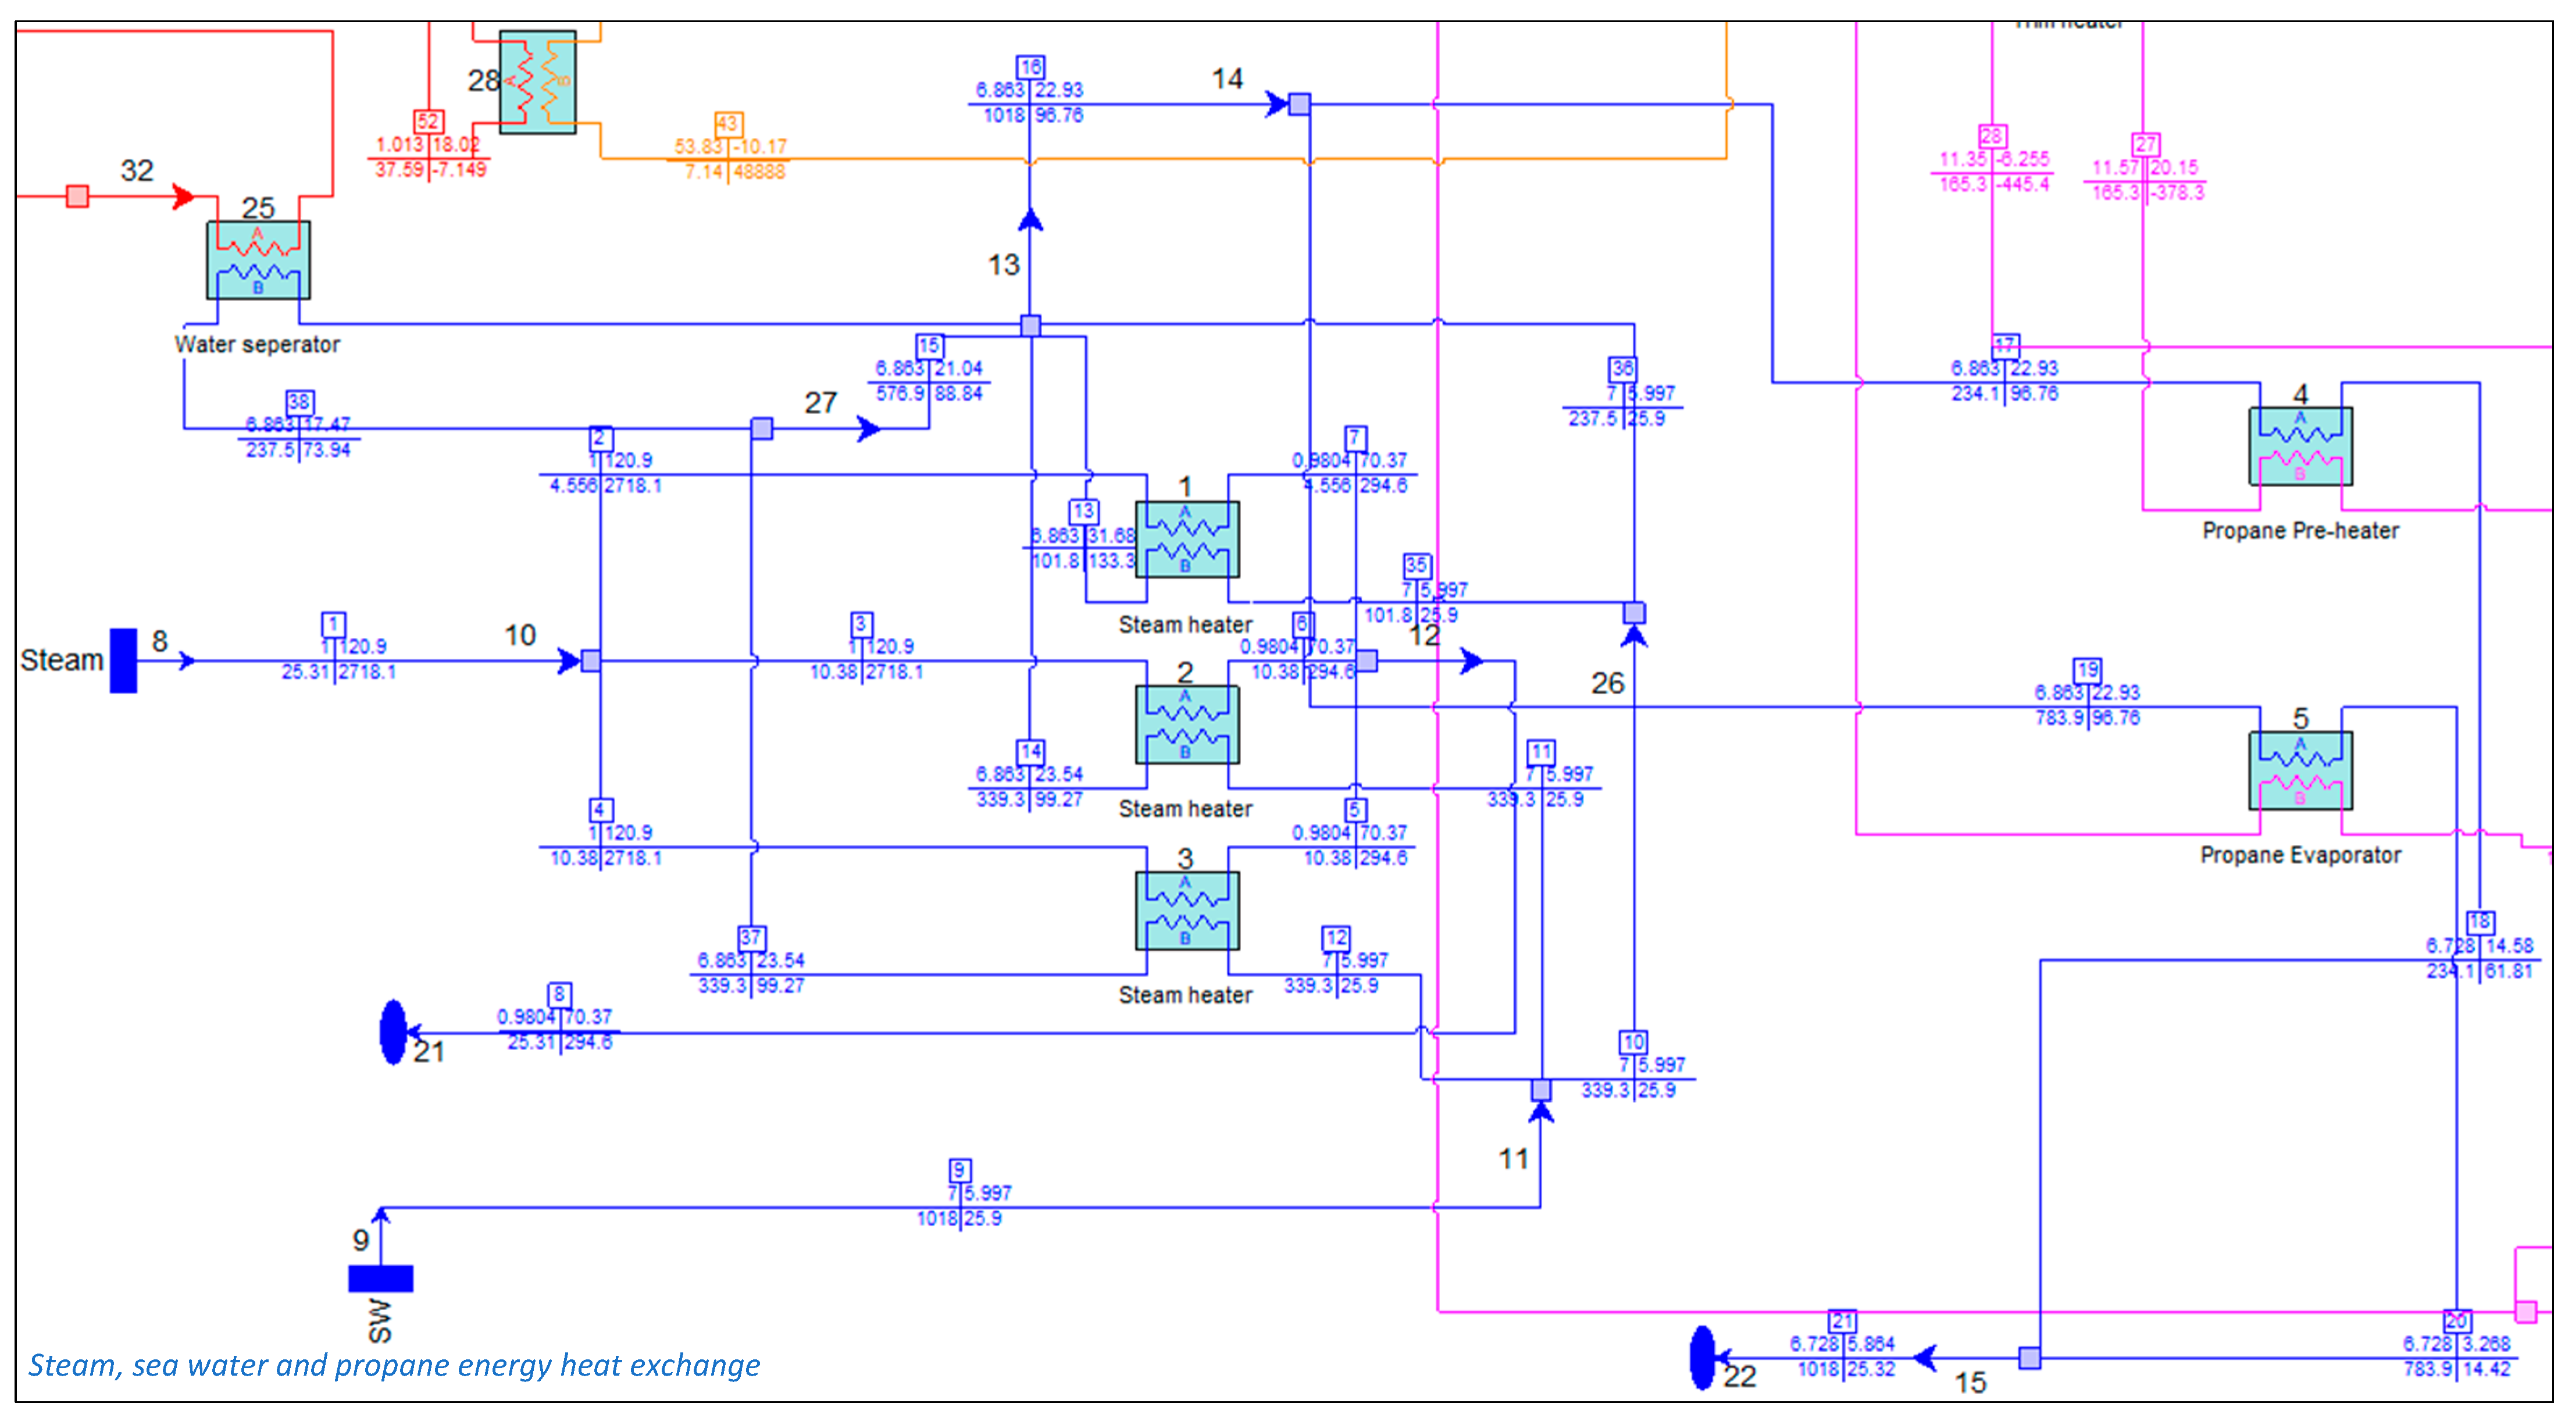
Result of simulated multifaceted system is presented in Figure A3.
In the completed simulation, the exhaust gas stream is composed of two inlets: one from the engines and another from the regasification boilers. The combined flue gas flow is directed to a water separator, where moisture is removed as condensate. This process includes additional heat exchangers that contribute to system efficiency by transferring flue gas heat to sea water. In the first stage, seawater is heated within a heat exchanger, utilizing residual energy from the flue gases.
Subsequently, dry exhaust gas is cooled in another heat exchanger before being processed in the refrigerant converter unit, where CO2 is separated from the gas mixture. The remaining exhaust gas is then emitted into the atmosphere. The separated CO2 is compressed to achieve liquefaction, with an additional heat exchanger incorporated to regulate its temperature and maintain it in a liquid state [30]. The integration of this system ensures that the carbon capture and cryogenic cooling process operates within the functional constraints of the existing FSRU without disrupting its primary purpose. Additionally, the system enhances fuel efficiency and enables complete CO2 liquefaction. A further benefit is realized through heat exchange between LNG and CO2, where the cooling of CO2 simultaneously aids the regasification process. This study demonstrates the feasibility of retrofitting CCC into a typical FSRU while addressing previously identified challenges in the literature regarding system adaptation for carbon capture.
Supplementing Figure 5, the simulated operational performance capacity is summarized below.
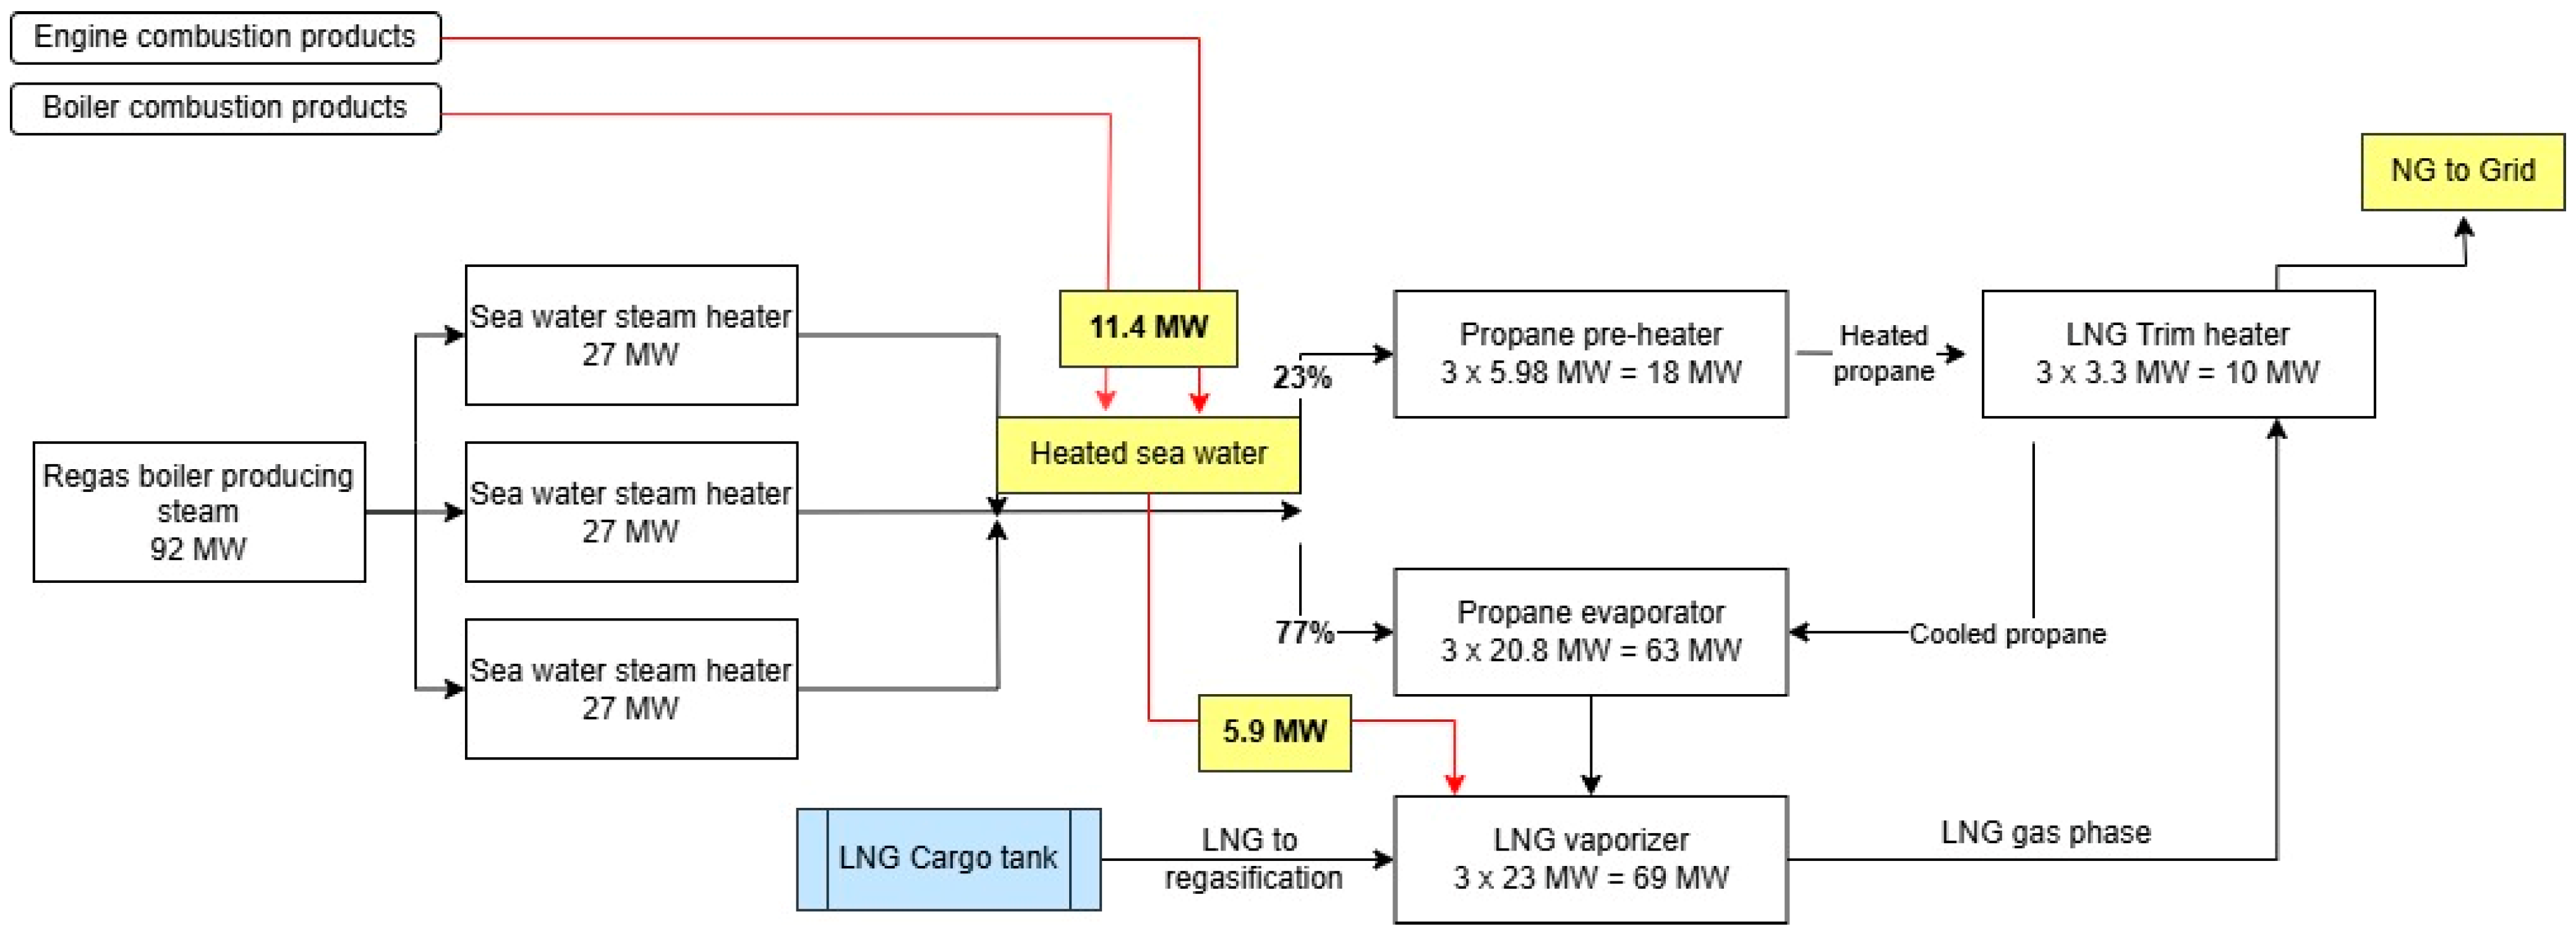
  • Exhaust gas cooler (28) = 4851 kW;
  • Water separator (25) = 11,411 kW;
  • Exhaust gas cooler (46) = 1103 kW;
  • Total thermal energy required for CO2 capture = 17,365 kW.
Looking further into the simulation, the sea water loop is analysed (Figure 6). The sea water condition at inlet (5) is specified to be the same water conditions as before: temperature 6 °C, mass flow 1018 kg/s. Due to the available heat exchanger (25), the sea water distribution streams are modified. A sea water splitter (26) is simulated which controls sea water flow to the heat exchanger (25), 70% of flow, and heat exchanger (1), 30% of flow. To the remaining steam heaters (2) and (3), the mass flow is equal to 339.3 kg/s. Accordingly, due to the additional steam heater (25), steam production is reduced to 25 kg/s. Spitter (10) divides the steam proportionally: 11 kg/s each to steam heaters (2) and (3) and 5 kg/s to steam heater (1). Steam heaters’ sea water outlet temperatures are 24 °C from heater (3), 24 °C from heater (2), and 32 °C from heater (1). All four streams flow into a common line and with a combined sea water condition of 23 °C and 6.8 bar pressure. Total heat exchange: 11,411 kW (25); 10,931 kW (1); 24,898 kW (2); 24,898 kW (3).
Heated sea water from the main stream is transferred to the propane pre-heater and propane evaporator. Flow is distributed accordingly: 23% is directed to the pre-heater and 77% to the evaporator. At the propane pre-heater, the propane is heated from 1 °C up to 20 °C, with a heat exchange capacity of 8100 kW. Then, accordingly, at the trim heater the propane transfers heat to natural gas by heating it from −23 °C up to 15.5 °C. The propane transfers heat which cools it down to −6.2 °C from where it is streamed to the propane evaporator for evaporation at 1 °C. At the propane evaporator, the sea water temperature decreases and at the outlet is 3.2 °C.
The LNG vaporizer heats LNG from −146.6 °C up to −24 °C converting it into gas phase; the operational pressure is stable at 54 bar pressure. The propane is cooled down and at 0.4 °C is transferred back to its buffer tank.
The simulation generated the following parameters of heat exchange which is summarised in Table 4:
  • LNG vaporizer: heat transfer of 60,632 kW;
  • Trim heater: heat transfer of 10,982 kW;
  • Propane pre-heater: heat transfer of 8101 kW;
  • Propane evaporator: heat transfer of 63,903 kW;
  • Total: 143,618 kW.

4. Discussion

The evaluation of the structural modification of the FSRU‘s regasification system and the energy balance modelling carried out confirm the effectiveness of the proposed solution by applying the CCC principle when the regasification system operates in a closed-loop regime at nominal load.
An analysis of the FSRU’s performance over the year was conducted, identifying that fuel consumption mainly correlates with seawater temperature. It has been determined that when the water temperature falls below 13 °C, the system transitions to a closed cycle, wherein the heat source is the boiler system responsible for producing steam to boost sea water temperature after regasification for the recirculating cycle. This process consequently leads to additional LNG fuel consumption, resulting in an increase in CO2 emissions. Modification of the FSRU system is proposed to evaluate regasification performance regimes in relation to the sea water temperature. A further research goal is to evaluate performance parameters by setting up a few variable conditions, where regasification operates in an open-loop regime with the aim of performing a sensitivity analysis to evaluate how different operating conditions (e.g., CO2 capture rate, or varying regasification demand) affect actual fuel savings. Although the FSRU operates year-round, and fuel consumption is lower in open-loop regasification mode, CO2 emissions persist due to continuous engine operation. Therefore, further research will focus on the application of variational simulation to assess the impact of key operational parameters, including water temperature fluctuations and varying load conditions, on LNG regasification capacity.
Further detailed analysis will facilitate a more precise assessment of the modification’s overall effectiveness in enhancing CO2 capture efficiency and optimizing fuel consumption. Additionally, further investigation will be required to quantify the economic implications of these improvements, ensuring that the proposed modifications contribute to both environmental sustainability and operational cost-effectiveness.

5. Conclusions

  • The decarbonisation of FSRUs is inherent in the IMO’s strategy objectives, which are reflected in international regulations covering the reduction in emissions from ships. Apart from the CII, EEXI, and EEDI indexes, the financial impact on emissions generation is seen through the guidelines of the EU ETS. Under the EU ETS framework until 2030, CO2 emission taxes are subsidized with a gradual annual reduction. This financial mechanism compels shipowners to seek effective solutions to lower CO2 emissions. Currently, LNG as a fuel complies with maritime industry regulations; however, it is recognized as a transitional fuel source until truly carbon-neutral or zero-emission alternative fuel infrastructure is widely developed and available. Today, significant attention is given to LNG fuel’s compliance with the Carbon Intensity Indicator, with projections suggesting that by approximately 2030, LNG-fuelled ships will need to adopt additional technologies—such as carbon capture systems or blending with bio-LNG or synthetic LNG—to meet increasingly stringent carbon intensity standards. Therefore, LNG-fuelled vessels and the growing FSRU market require a thorough assessment of alternative technologies to ensure compliance with environmental performance regulations;
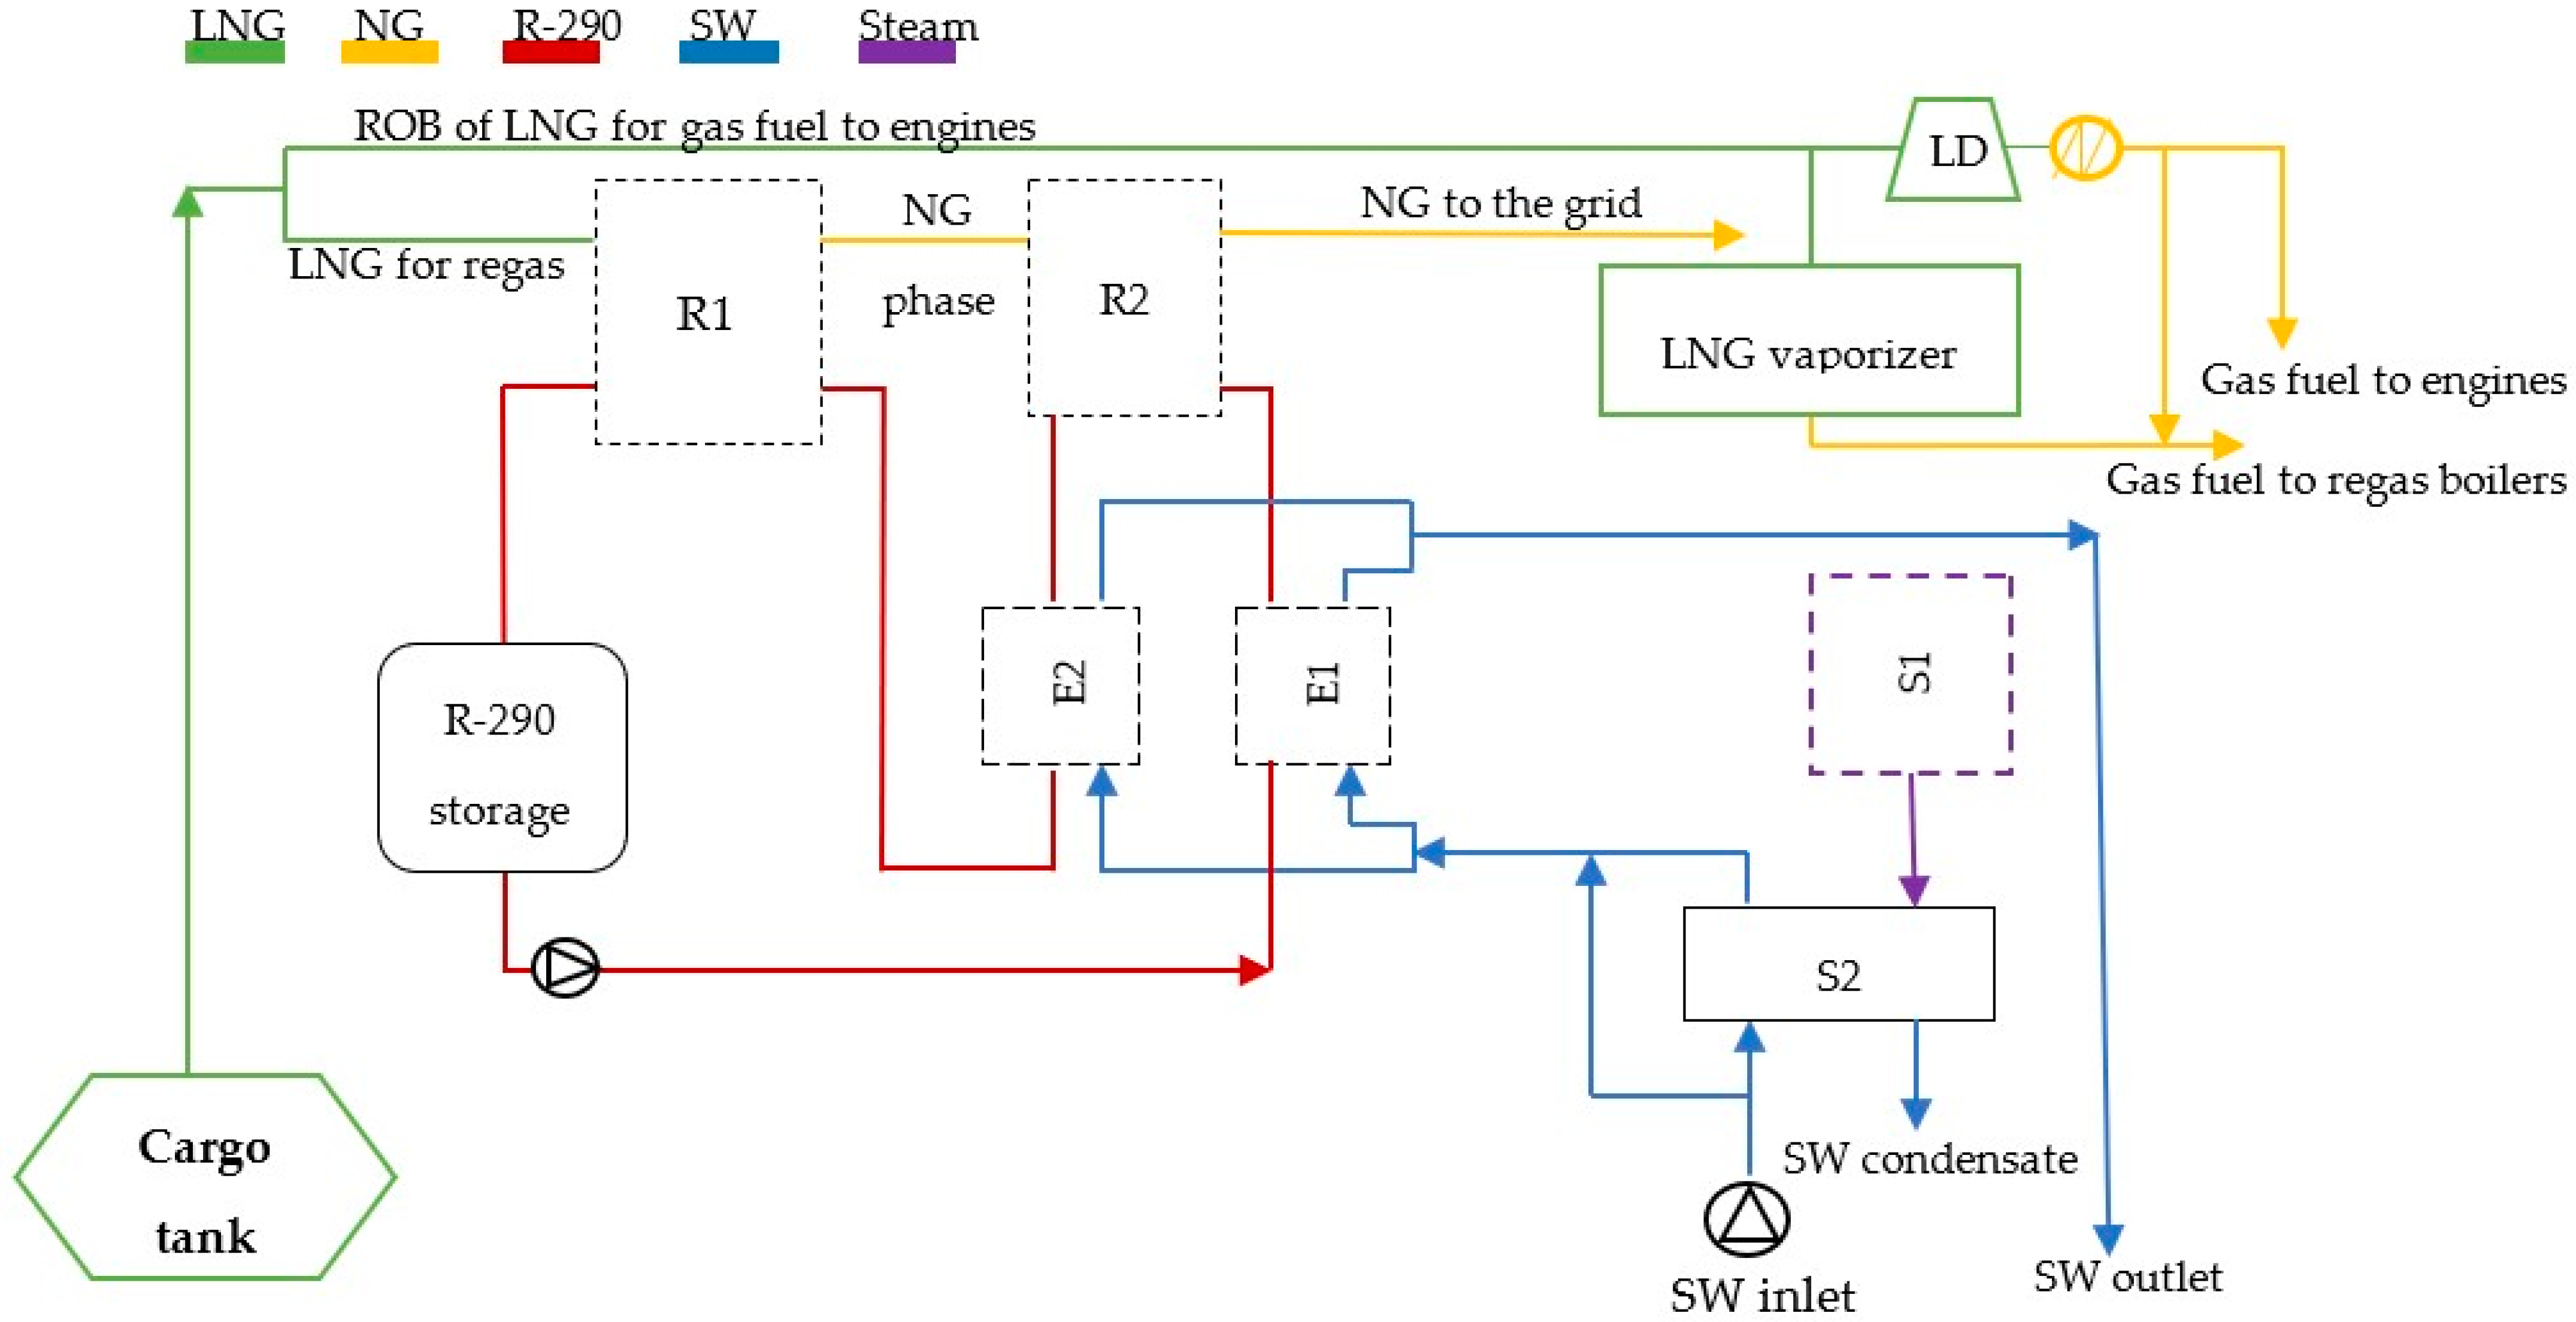
  • To achieve long-term decarbonisation results, this research investigates a solution for the modification of the FSRU energy system was proposed and functional decarbonisation indicators were investigated. The efficiency of these indicators is characterised by the 100% CO2 liquefaction of exhaust gas generated by boilers of 2 × 65,000 kg/h capacity and the four units of Wärtsilä electric-diesel generators Wärtsilä 8L50DF 7800 kW and 1 × 6L50DF 5850 kW. The implementation principle is predicated on modifying the energy balance of the existing system by integrating exhaust gas heat recovery to preheat water. This approach reduces the boiler load, thereby lowering direct fuel consumption. The system facilitates the cooling of flue gases through water injection, enabling the subsequent liquefaction of CO2 to utilize the cryogenic potential of LNG. The object of the research is characterised by the typical structure of regasification systems, meaning that the solutions implemented in the study share common features that enable practical application which is essential considering the limited availability of studies evaluating FSRU regasification systems with a focus on assessing CCC integration;
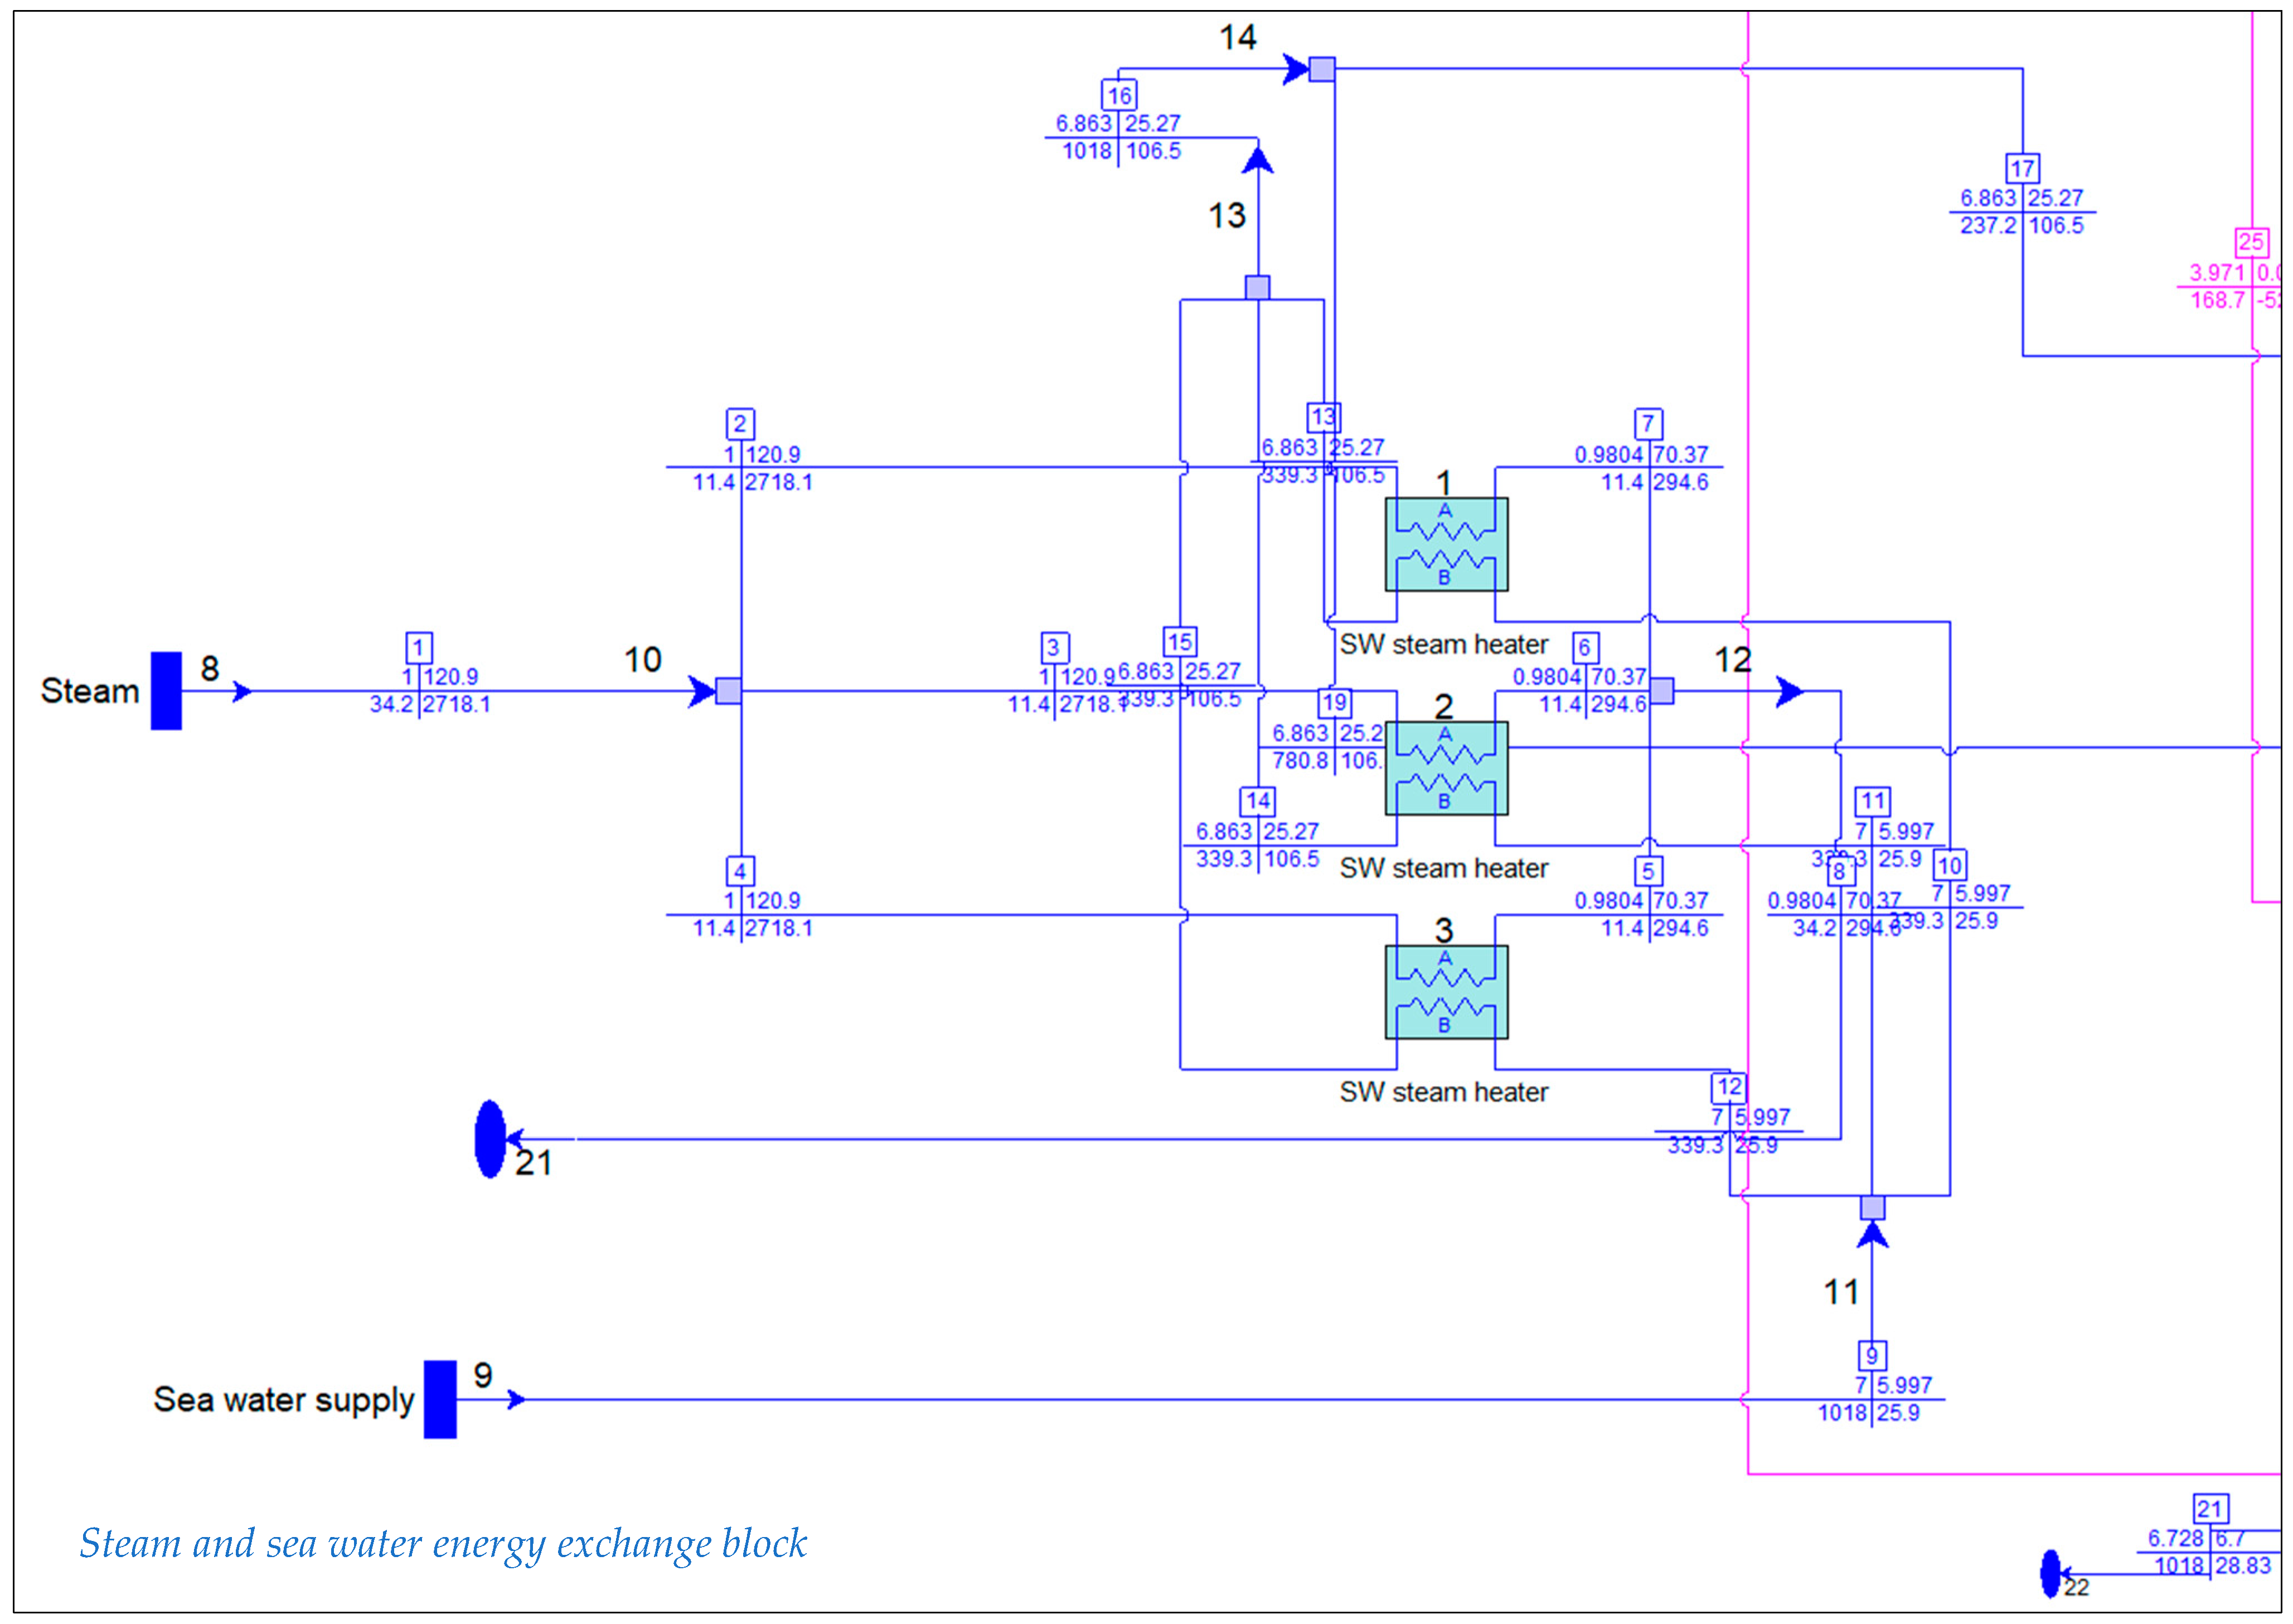
  • This study employed Thermoflow Thermoflex 32 software to simulate the regasification performance of an LNG vessel operating at 100% load, enabling a comprehensive evaluation of system modifications for integrating CCC technology. The simulations facilitated the conceptual design of a retrofit solution aimed at enhancing energy efficiency and reducing emissions. Results indicate that the regasification boiler load can be reduced by approximately 22%, allowing for the utilization of 11.4 MW of energy to separate water (H2O) from the engine exhaust gas. Additionally, an extra 5.9 MW of recovered energy can be used for LNG regasification and the liquefaction-based CO2 capture process. Simulation results showed that LNG regasification with the CCC system requires 78 MW of energy, to achieve a 15.5 °C send-out temperature. It is important to highlight that the simulation results achieved with Thermoflex 32 software indicate solid accuracy compared to the actual FSRU system performance where the deviation between simulated and actual system equipment in the sea water steam heater case is below 1%. The generated simulation foundation will allow us to further modify the system and assess equipment performance changes;
  • These achieved results underscore the potential of an optimized CCC integration onboard LNG vessels to contribute to decarbonization efforts by leveraging waste heat for CO2 capture. Further studies are necessary to validate the feasibility of these modifications under real operating conditions, considering dynamic load variations and economic factors. Future research should also explore the scalability of the proposed CCC system across different LNG carrier designs and operational profiles to support industry-wide adoption. Further research is essential to comprehensively evaluate the practical implementation of the proposed system modification;
  • The integration of cryogenic carbon capture in FSRUs has significant social and theoretical implications. Socially, it enhances environmental sustainability by reducing emissions, aligns with regulatory frameworks, and strengthens the LNG industry’s commitment to decarbonization, improving public perception and economic viability. Theoretically, this study advances research on CCC in maritime applications, providing insights into system optimization, scalability, and integration with onboard energy systems. These findings could pave the way for broader adoption across floating energy platforms, contributing to a more sustainable and efficient LNG supply chain.

Author Contributions

Conceptualization, S.L.; methodology, S.L.; formal analysis, A.M.; investigation, A.M. and S.L.; resources, A.M.; data curation, A.M.; writing—original draft preparation, A.M.; writing—review and editing, A.M. and S.L.; visualization, A.M.; supervision, S.L.; project administration, A.M.; software, A.M. All authors have read and agreed to the published version of the manuscript.

Funding

The research was financed by Research Council of Lithuania and the Ministry of Education, Science and Sport Lithuania (Contract No. S-A-UEI-23-9).

Data Availability Statement

The original contributions presented in this study are included in the article. Further inquiries can be directed to the corresponding authors.

Acknowledgments

The authors would like to express their gratitude to Klaipėda University for developing a comprehensive infrastructure that provides access to international databases, e-journals, and e-books. The authors separately would like to express separate gratitude to the Thermoflow software developers and managing team who supported this research with familiarisation and advice on adopting available software tools.

Conflicts of Interest

The authors declare no conflicts of interest.

Appendix A

Figure A1. FSRU regasification simulation: steam/sea water heat exchanger.
Jmse 13 00770 g0a1
Figure A2. FSRU regasification process simulation: propane, sea water, and LNG heat exchangers.
Jmse 13 00770 g0a2

Appendix B

Figure A3. FSRU closed-loop regasification system with integrated CCC.
Jmse 13 00770 g0a3

References

  1. Wang, Z.; Lu, M.; Dong, S.; Tang, M.; Yan, X.; Li, K.; Yang, H. Study of ship-based carbon capture optimization considering multiple evaluation factors and main engine loads. J. Clean. Prod. 2024, 478, 143996. [Google Scholar] [CrossRef]
  2. Cret, L.; Baudry, M.; Lantz, F. How to implement the 2023 IMO GHG strategy? Insights on the importance of combining policy instruments and on the role of uncertainty. Mar. Policy 2024, 169, 106332. [Google Scholar] [CrossRef]
  3. Caiafa, C.; Hattori, T.; Nam, H.; Coninck, H. International technology innovation to accelerate energy transitions: The case of the international energy agency technology collaboration programmes. Environ. Innov. Soc. Transit. 2023, 48, 100766. [Google Scholar] [CrossRef]
  4. Park, S.; Lee, H.; Kim, D. Regulatory compliance and operational efficiency in maritime transport: Strategies and insights. Transp. Policy 2024, 155, 161–177. [Google Scholar] [CrossRef]
  5. Chen, Y.; Zhou, X.; Chen, S.; Mi, J. LNG freight rate and LNG price, carbon price, geopolitical risk: A dynamic connectedness analysis. Energy 2024, 302, 131517. [Google Scholar] [CrossRef]
  6. European Commission. Regulation of the European Parliament and of the Council on the Use of Renewable and Low-Carbon Fuels in Maritime Transport and Amending Directive 2009/16/EC; European Commission: Brussels, Belgium, 2021.
  7. Bayramoğlu, K. The effects of alternative fuels, cruising duration and variable generators combination on exhaust emissions, energy efficiency existing ship index (EEXI) and carbon intensity rating (CII). Ocean Eng. 2024, 302, 117723. [Google Scholar] [CrossRef]
  8. Balcombe, P.; Staffell, I.; Kerdan, I.G.; Speirs, J.; Brandon, N.; Hawke, A.D. How can LNG-fuelled ships meet decarbonisation targets? An environmental and economic analysis. Energy 2021, 227, 120462. [Google Scholar] [CrossRef]
  9. GIIGNL Annual Report 2024. Available online: https://www.scribd.com/document/804232933/GIIGNL-2024-Annual-Report-1 (accessed on 14 November 2024).
  10. SEA-LNG Ltd. LNG-Fuelled Vessels Accelerate to 6% of the Global Fleet. Available online: https://sea-lng.org/2024/10/lng-fuelled-vessels-accelerate-to-6-of-the-global-fleet/?utm_source=chatgpt.com (accessed on 4 December 2024).
  11. Tianbiao, H.; Jibao, Z.; Ning, M.; Praveen, L. Organic Rankine cycle integrated with hydrate-based desalination for a sustainable energy–water nexus system. Appl. Energy 2021, 291, 116839. [Google Scholar]
  12. Mazyan, W.; Ahmadi, A.; Ahmed, H.; Hoorfar, M. Market and technology assessment of natural gas processing: A review. J. Nat. Gas Sci. Eng. 2016, 30, 487–514. [Google Scholar] [CrossRef]
  13. Feenstra, M.; Monteiro, J.; Akker, J.; Abu-Zahra, M.; Gilling, E.; Goetheer, E. Ship-based carbon capture onboard of diesel or LNG-fuelled ships. Int. J. Greenh. Gas Control 2019, 85, 1–10. [Google Scholar] [CrossRef]
  14. DNV. Energy Transition Outlook 2024: Maritime Forecast to 2050. Available online: https://www.dnv.com/maritime/publications/maritime-forecast/ (accessed on 10 November 2024).
  15. DNV. Standards and Guidelines. Available online: https://www.dnv.com/focus-areas/ccs/standards-and-guidelines/ (accessed on 21 September 2024).
  16. Kanbur, B.; Xiang, L.; Dubey, S.; Choo, F.H.; Duan, F. Cold utilization systems of LNG: A review. Renew. Sustain. Energy Rev. 2017, 79, 1171–1188. [Google Scholar] [CrossRef]
  17. Shen, M.; Tong, L.; Yin, S.; Liu, C.; Wang, L.; Feng, W.; Ding, Y. Cryogenic technology progress for CO2 capture under carbon neutrality goals: A review. Sep. Purif. Technol. 2022, 299, 121734. [Google Scholar] [CrossRef]
  18. Enobong, H.; Chukwuebuka, N.; Victor, O. Carbon capture, utilization, and storage (CCUS) technologies: Evaluating the effectiveness of advanced CCUS solutions for reducing CO2 emissions. Results Surf. Interfaces 2024, 18, 100381. [Google Scholar]
  19. The Global CCS Institute. Global Status of CCS Report 2024; The Global CCS Institute: Melbourne, Australia, 2024. [Google Scholar]
  20. Park, J.; Kim, Y.; Lim, D.; Kim, J.; Lee, J.; Cho, H. Advancing greener LNG-fueled vessels: Compact simultaneous reduction system for CH4, NOX and CO2 emissions. J. Clean. Prod. 2024, 478, 143902. [Google Scholar] [CrossRef]
  21. Sultan, H.; Muhammad, H.; Bhatti, U.; Hong Min, G.; Il Hyun Baek Baik, Y.; Nam, S. Reducing the efficiency penalty of carbon dioxide capture and compression process in a natural gas combined cycle power plant by process modification and liquefied natural gas cold energy integration. Energy Convers. Manag. 2021, 244, 114495. [Google Scholar] [CrossRef]
  22. Alsanousie, A.; Attia, A.; Elhelw, M.; Elsamni, O. Towards nearly zero emissions natural gas-fired power plants using cryogenic carbon dioxide capture technology. Int. J. Greenh. Gas Control 2023, 127, 103928. [Google Scholar] [CrossRef]
  23. Ballout, J.; Al-Rawashdeh, M.; Al-Mohannadi, D.; Rousseau, J.; Burton, G.; Linke, P. Assessment of CO2 capture and storage onboard LNG vessels driven by energy recovery from engine exhaust. Clean. Eng. Technol. 2024, 22, 100802. [Google Scholar] [CrossRef]
  24. Wood, D.A.; Kulitsa, M. Chapter 7—LNG carriers and floating storage and regasification units: Opportunities to improve their operational efficiency. In The Fundamentals and Sustainable Advances in Natural Gas Science and Engineering, Sustainable Liquefied Natural Gas; Elsevier: Amsterdam, The Netherlands, 2024; Volume 3. [Google Scholar]
  25. Rifka, T.; Morosuk, T.; Tsatsaronis, G. Carbon capture and storage using low-temperature post-combustion technologies. Energy Sources Part A Recovery Util. Environ. Eff. 2019, 43, 3371–3380. [Google Scholar] [CrossRef]
  26. Naveiro, M.; Gómez, M.R.; Arias-Fernández, I.; Baaliña Insua, A. Thermodynamic and environmental analyses of a novel closed loop regasification system integrating ORC and CO2 capture in floating storage regasification units. Energy Convers. Manag. 2022, 257, 115410. [Google Scholar] [CrossRef]
  27. Lebedevas, S.; Malukas, A. The Application of Cryogenic Carbon Capture Technology on the Dual-Fuel Ship through the Utilisation of LNG Cold Potential. J. Mar. Sci. Eng. 2024, 12, 217. [Google Scholar] [CrossRef]
  28. Thermoflow. Available online: https://www.thermoflow.com/products_generalpurpose.html (accessed on 17 December 2024).
  29. Tianbiao, H.; Jie, M.; Huigang, M.; Tao, J. Exploiting cold energy associated with LNG regasification processes. In The Fundamentals and Sustainable Advances in Natural Gas Science and Engineering, Sustainable Liquefied Natural Gas; Elsevier: Amsterdam, The Netherlands, 2024; Volume 3. [Google Scholar]
  30. Enayatizadeh, H.; Arjomand, A.; Tynjälä, T.; Inkeri, E. Cryogenic carbon capture design through CO2 anti-sublimation for a gas turbine exhaust: Environmental, economic, energy, and exergy analysis. Energy 2024, 304, 132244. [Google Scholar] [CrossRef]
Figure 1. Simplified scheme of the closed-loop regasification system integrated on the FSRU vessel. LNG—liquefied natural gas; NG—natural gas; R-290—propane loop; SW—sea water loop; Steam—water in steam phase loop; LD—low-duty compressor; R1—LNG regas vaporizer; R2—NG trim heater; E1—R290 pre-heater; E2—R290 evaporator; S1—SW steam from regas boilers; S2—sea water heater.
Jmse 13 00770 g001
Figure 2. Regasification in a closed loop, with heat exchange distribution at 100% load. General note: the scheme represents three regasification units as one. LNG—liquefied natural gas; MW—megawatt; NG—natural gas.
Jmse 13 00770 g002
Figure 3. Regasification in a closed loop with integration of the exhaust gas interface.
Jmse 13 00770 g003
Figure 4. FSRU regasification simulation based on Thermoflex 32 software.
Jmse 13 00770 g004
Figure 5. FSRU closed-loop regasification system with integrated CCC.
Jmse 13 00770 g005
Figure 6. FSRU regasification performance with CCC, sea water, and steam loop.
Jmse 13 00770 g006
Table 1. General specifications of the analysing FSRU vessel.
ItemDescription
Type of FSRU vesselGTT Mark III membrane system of 170,000 m3 storage capacity; boil-off rate of 0.15%
Engine systemsDual-fuel diesel-electric propulsion system
(LNG boil-off gas with pilot fuel and Marine diesel oil. with pilot fuel):
3 × Wärtsilä -Hyundai 8L50DF 7800 kW
1 × Wärtsilä -Hyundai 6L50DF 5850 kW
(Wärtsilä Itali SPA, Trieste, Italy)
Open-loop operational sea water temperatureSW > 13 °C
Closed-loop operational sea water temperatureSW < 13 °C
Regas boilers2 × 65,000 kg/h
Seawater/steam heaters for closed-loop, capacity3 × 36%;
Heat exchange capacity: 3 × 27 MW
Operating fluid for the heat exchangePropane R-290 type
Number of regasification trainsFour individual regasification trains with a send-out capacity of 3 × 142,799 Nm3/hour at 0 °C + one redundancy unit
Table 2. Exhaust gas parameters.
CO2H2OO2N2
5%10%10%75%
EnginesMass flow12.17 kg/sTemperature267 °C
Regas boilersMass flow29.56 kg/sTemperature110 °C
Table 3. FSRU regasification process simulation: performance of heat exchangers.
Propane Pre-Heater, Propane SidePropane Evaporator, Propane SideTrim Heater, LNG SideLNG Vaporizer, LNG Side
Inlet pressure, bar10.94.0554.954.3
Outlet pressure, bar10.74.053.853.8
Inlet temperature, °C−5.5−5.9−25.0−25.0
Outlet temperature, °C22.3−0.117.217.2
Table 4. Summarized simulation results comparing regasification system performance before and after CCC integration.
Steam Heater 1Steam Heater 2Steam Heater 3Propane Pre-HeaterPropane EvaporatorTrim HeaterLNG
Vaporizer
Total
Before27,35327,35327,35312,01566,27112,13265,761238,238
After10,93124,89824,898810163,90310,98260,632221,710
Compensating heatersWater separator (25): 11,411Flue gas cooler (28): 4851CO2 cooler (18): 1103
Disclaimer/Publisher’s Note: The statements, opinions and data contained in all publications are solely those of the individual author(s) and contributor(s) and not of MDPI and/or the editor(s). MDPI and/or the editor(s) disclaim responsibility for any injury to people or property resulting from any ideas, methods, instructions or products referred to in the content.

