Article

Experimental Study on the Hydraulic Characteristics and Shape Optimization of Ship Lock Water Conveyance Systems

1
Tianjin Research Institute for Water Transport Engineering, Ministry of Transport, Tianjin 300456, China
2
Key Laboratory of Engineering Sediment, Ministry of Transport, Tianjin 300456, China
*
Author to whom correspondence should be addressed.
J. Mar. Sci. Eng. 2025, 13(4), 784; https://doi.org/10.3390/jmse13040784
Submission received: 25 February 2025 / Revised: 5 April 2025 / Accepted: 11 April 2025 / Published: 15 April 2025
(This article belongs to the Section Ocean Engineering)

Abstract

:
To enhance the passing capacity of the Bailongtan Ship Lock on the Hongshui River, this study focused on the design scheme of its water conveyance system reconstruction and expansion project. A three-dimensional mathematical model meeting the experimental accuracy requirements was established based on the RNG k-ε turbulence model and the Volume of Fluid (VOF) free-surface tracking method. A 1:30 scale ship lock water conveyance system physical model was built and used the independently developed system for hydraulic test monitoring, acquisition, and control. Experimental research on the hydraulic characteristics and shape optimization of the water conveyance system was carried out. The experimental results show that, under the condition of a maximum head difference of 16.0 m between the upstream and downstream of the ship lock, in the design scheme, the flow in the corridor after the filling valve fails to diffuse adequately, forming a high-velocity zone and a significant pressure difference between the inner and outer sides, which poses an operational risk. By optimizing the shape of the corridor after the valve (deepening the bottom end by 2.0 m and adjusting the turning angle from 75° to 70°), the range of the high-velocity zone can be shortened from 3.0 m to 1.5 m. The pressure difference between the inner and outer sides of the corridor at the horizontal turning section is reduced by 19.2% from 5.35 m to 4.32 m of the pressure head at the moment of maximum flow rate, and the velocity in the horizontal section is less than 15 m/s. Physical model tests confirmed these improvements, with mooring forces within safety limits (longitudinal ≤ 32 kN, transverse ≤ 16 kN). The research findings indicate that integrating numerical simulation with physical model testing can effectively mitigate risks in the original design of the ship lock water conveyance system. This approach notably enhances the reliability and safety of the design scheme, as demonstrated by the significant reduction in high-velocity zones and pressure differentials. Moreover, it offers a robust scientific basis and practical technical reference for in-depth hydraulic research and targeted optimization of ship lock water conveyance systems.

1. Introduction

The hydraulic characteristics of ship lock water conveyance systems are core issues affecting the navigation efficiency and safety of ships. With the vigorous development of shipping, the working head and size of ship locks are gradually expanding. Scholars at home and abroad have carried out a series of studies on the analysis of the hydraulic characteristics of water conveyance systems [1,2,3]. Currently, there are various research methods for the hydraulic characteristics of ship lock water conveyance systems, mainly including prototype observation research, physical model test research, and numerical simulation research.
Early research focused on the selection of water conveyance systems and the research on hydraulic calculation theories [4,5,6]. Prototype observation [7,8,9] mainly monitors the hydrodynamic characteristics of existing water conveyance systems and issues such as the cavitation and erosion of valves. The monitoring data are crucial for theoretical correction. However, the workload is usually large and time-consuming. Hu et al. [10,11] conducted systematic observations on the No. 1 Ship Lock of Gezhouba and the Dahua Ship Lock and focused on analyzing the cavitation characteristics of the water conveyance gates. They revealed that fissure cavitation may occur between the bottom edge and the bottom plate at the initial moment of valve opening and studied the significant impact of the valve opening speed on the pressure pulsation in the corridor. Additionally, the U.S. Army Corps of Engineers Waterways Experiment Station has carried out a large number of physical model test studies on the hydraulics of ship lock water conveyance systems [12,13,14].
Physical model test research mainly includes experimental studies on the hydraulic characteristics of filling and emptying water in the water conveyance system, the pressure distribution in the water conveyance corridor, the filling and emptying time of the ship lock, the water flow conditions at the inlet and outlet, and the mooring force of ships, and then guides the optimization of the design shape. Many scholars [15,16,17] have carried out physical model test studies on different ship lock water conveyance system projects using various engineering scales. By analyzing the experimental results and carrying out corresponding optimizations, the hydraulic indicators of the ship lock water conveyance system can meet the corresponding requirements, playing a good guiding role in the construction of practical projects and reflecting the importance of physical model test research.
Relying on the advantages of high-precision and good economy of three-dimensional numerical simulation, it is more convenient to study the hydraulic characteristics of ship lock water conveyance systems and further guide the optimization of the design shape. Hammack E A [18] conducted a three-dimensional numerical simulation study on the water conveyance valve corridor of the John Day Lock, analyzed the velocity and pressure distributions under typical valve opening conditions, and obtained the corresponding hydraulic characteristic parameters. Other scholars [19,20,21] have also carried out a large number of research works based on mathematical models. Through numerical simulation research on ship lock water conveyance systems, the goals of monitoring hydraulic characteristic parameters and optimizing the shape can be achieved, playing an important guiding role in the construction of practical projects.
However, ship lock water conveyance systems involve multiple disciplines such as hydraulics, structural mechanics, fluid mechanics, and control science. The water conveyance process is complex. Currently, in-depth research on multi-disciplinary coupling is relatively scarce. Although the numerical simulation method has become mature, some research still remains at the stage of local hydraulic characteristic research [22]. Although numerous scholars have conducted research on hydraulic characteristic parameters such as velocity, pressure distribution, and flow field patterns in ship lock water conveyance systems, and physical model tests are close to the actual operation of ship locks, the test control and monitoring methods directly affect the accuracy of the collected data. Conducting shape optimization research that relies on physical models is time-consuming and costly, and repeated modifications of the model will also affect the accuracy of the test results. Therefore, due to the inherent differences in hydraulic characteristics among various systems, the research results of hydraulic characteristics and shape optimization carried out by a single test method may deviate from the actual operation situation. It is necessary to further enhance experimental research methods and develop relevant monitoring and control systems to provide a basis for real-time control strategies.
The Hongshui River is an important waterway for shipping to the sea in Southwest China. The existing Bailongtan Navigation and Hydropower Junction has a 500-ton-class ship lock. To improve the passing capacity, a reconstruction and expansion project is planned, and it is designed to accommodate ships with a maximum capacity of 1000 tons. To further clarify the hydraulic characteristics of the water conveyance system and the variation law of the water conveyance curve, this paper established a three-dimensional numerical model, a 1:30-scale physical model of the Bailongtan Ship Lock water conveyance system, and the physical model used the independently developed system for hydraulic test monitoring, acquisition, and control (hereinafter abbreviated as the independently developed system). Through the research method of combining the numerical simulation and physical model, the hydraulic characteristics and water flow patterns of different shapes were compared and analyzed. According to the test results, an optimization scheme for the design shape was proposed, which is helpful for improving the accuracy of the test research results of the ship lock water conveyance system and provides effective guidance for the design scheme of the Bailongtan Ship Lock reconstruction and expansion project.

2. Materials and Methods

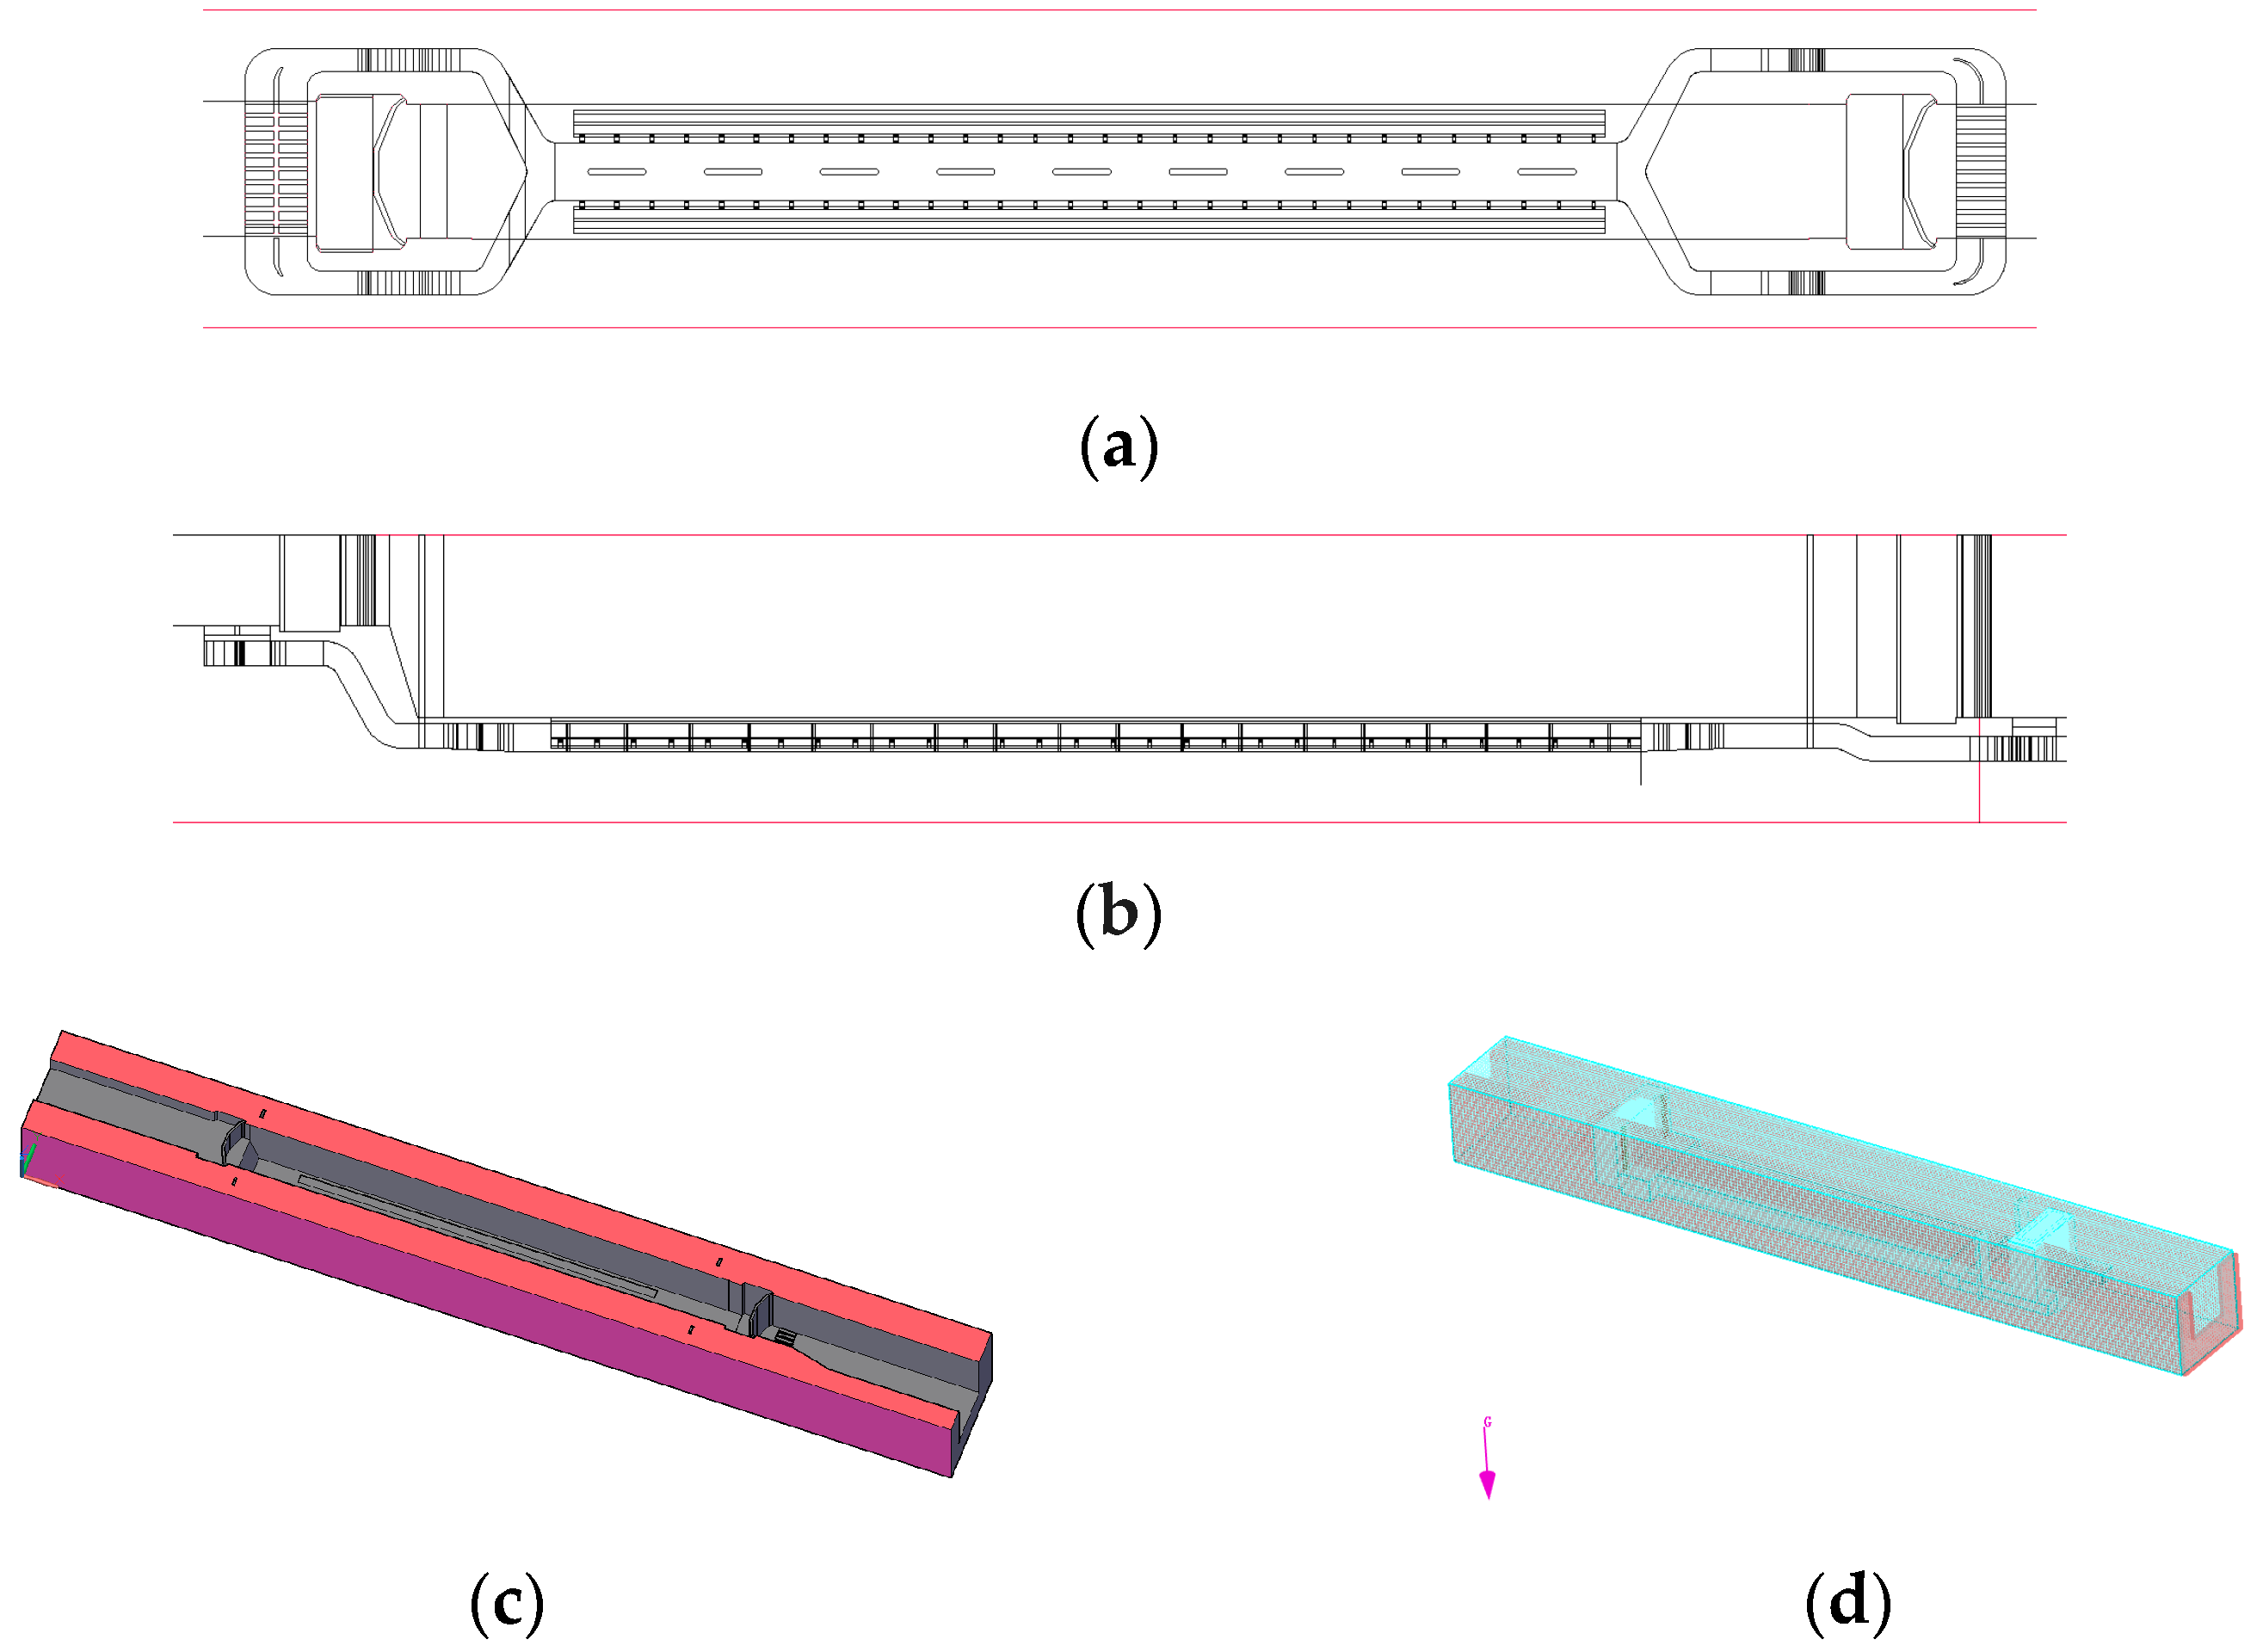
2.1. Construction of the Three-Dimensional Mathematical Model

2.1.1. Basic Theory

The control equations of fluid flow can accurately describe the spatial distribution of various physical quantities of the fluid and their evolution over time. The RNG turbulence model is an improved k-ε model. By reflecting the influence of small-scale motions in the large-scale motion and the modified viscosity term, the small-scale motions are systematically removed from the control equations. The RNG k-ε model can better handle flows with high strain rates and large streamline curvatures and has stronger versatility. It has been widely applied in the field of water conservancy projects [23,24,25,26]. The obtained turbulent kinetic energy k equation and dissipation rate ε equation are as follows:
ρ k t + ρ k u i x i = x j α k μ e f f k x j u i u j ¯ + G k ρ ε
ρ ε t + ρ u i ε x i = x j α ε μ e f f ε x j + C 1 ε * ε k G k C 2 ε ρ ε 2 k
In the equations, α k = α ε = 1.39 and μ e f f = μ + μ t , μ is the dynamic viscosity coefficient, and μ t is the turbulent viscosity coefficient, with the unit of Pa·s; G k is the generation term of turbulent kinetic energy k caused by the average velocity gradient, G k = μ t u i x j + u j x i u i x j ; C 1 ε , C 2 ε are constants with ε , C 1 ε = 1.42 , C 2 ε = 1.68 ; C 1 ε * = C 1 ε η 1 η / η 0 1 + β η 3 , η = 2 E i j · E i j 1 2 k ε , E i j = 1 2 u i x j + u j x i , η 0 = 4.377 , β = 0.012 .
The VOF method [27,28,29] is used to handle the water surface in the model. This method is a widely used free-surface treatment technology in water conservancy engineering research. It was proposed by Hirt and Nichols in 1981 [30]. The k-ε model with the VOF method has the same form as the single-phase flow k-ε model.
In this paper, the finite-difference method is used to discretize the control equations. The finite-difference method is the earliest numerical calculation method adopted in computational fluid dynamics. The basic idea of this method is to divide the solution domain into a set of grid intersection points parallel to the coordinate axes and replace the continuous solution domain with a finite number of grid intersection points to establish algebraic equations.

2.1.2. Model Scope

To explore the water flow pattern of the water conveyance system, a three-dimensional mathematical model was constructed according to the preliminary design scheme used FLOW 3D (https://www.flow3d.com/). The calculation area includes part of the approach channel and the entire lock chamber, with a total length of 463.00 m. The overall width of the model is 54.50 m, and the effective scale of the lock chamber is 230.00 m × 23.00 m × 4.80 m, and the amount of water in one cycle is approximately 85,000 cubic meters (head difference in H = 16.00 m). The corridors on the left and right sides of the lock chamber are arranged symmetrically. Due to the large calculation range and the complex structure of the ship lock water conveyance system, the overall grid is divided while meeting the basic calculation requirements. The valve corridor section, grid energy-dissipation chamber, side branch holes of the bottom corridor, and other key areas are focused on grid encryption. The total number of calculation grids is 1.8 million. The three-dimensional mathematical model of the Bailongtan Ship Lock water conveyance system in the design scheme is shown in Figure 1.

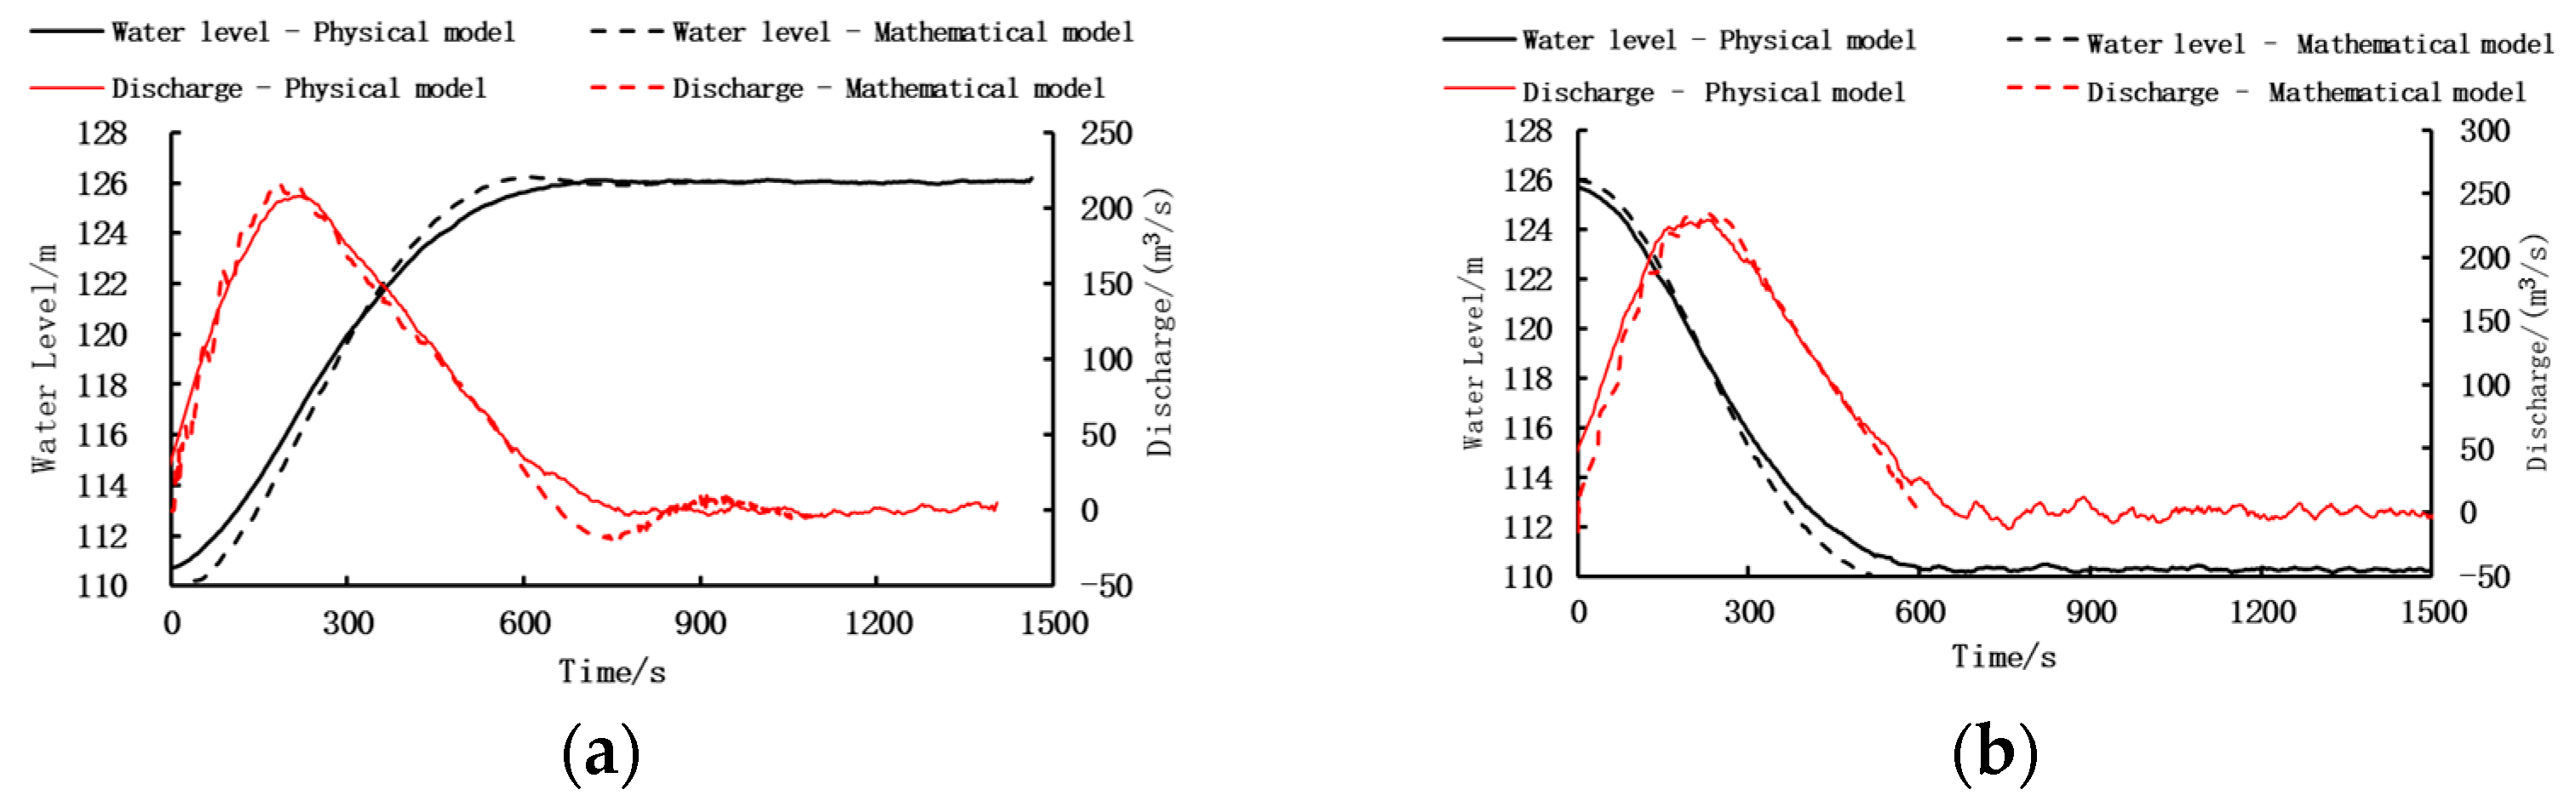
2.1.3. Model Verification

The working condition with a maximum head difference in H = 16.00 m between the upstream and downstream was selected as the research condition, and the opening and closing time of the gate was 5 min. From the filling and emptying processes, it can be seen that the filling and emptying process curves of the mathematical model and the physical model are in good agreement (Figure 2). After deviation calculation, the deviations are all controlled within a reasonable range (Table 1). The relevant results show that the accuracy of the mathematical model meets the experimental requirements.

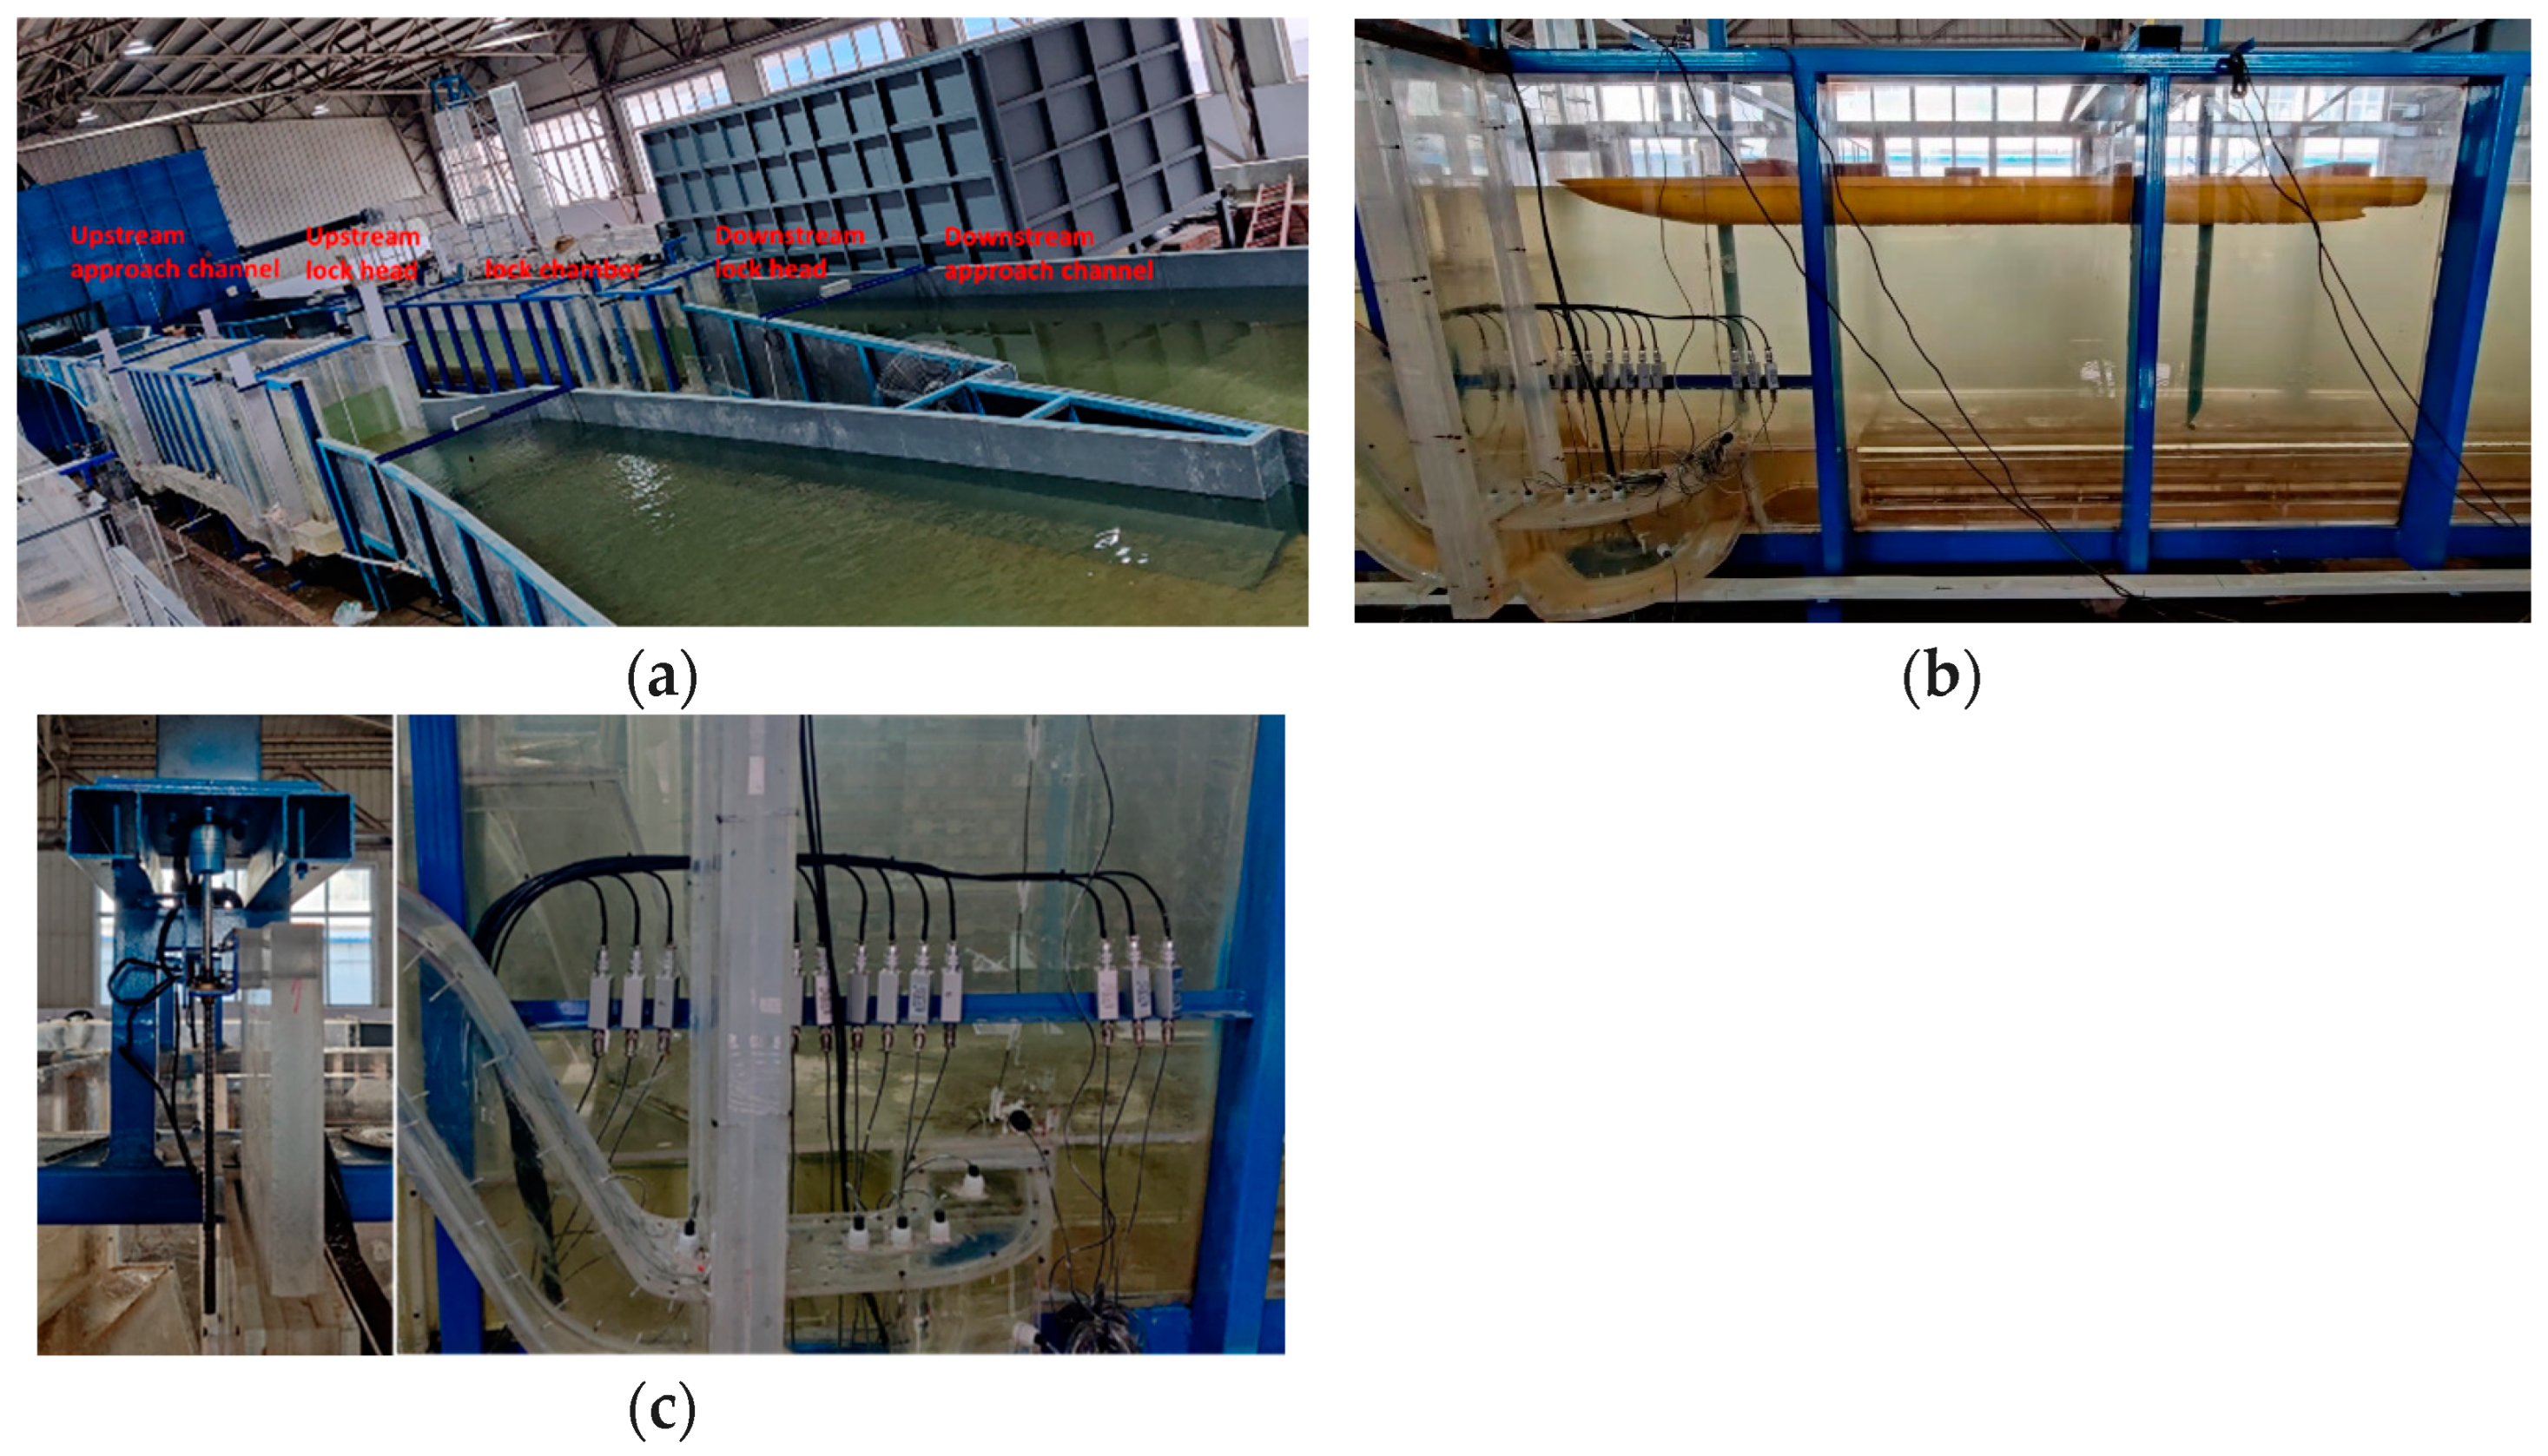
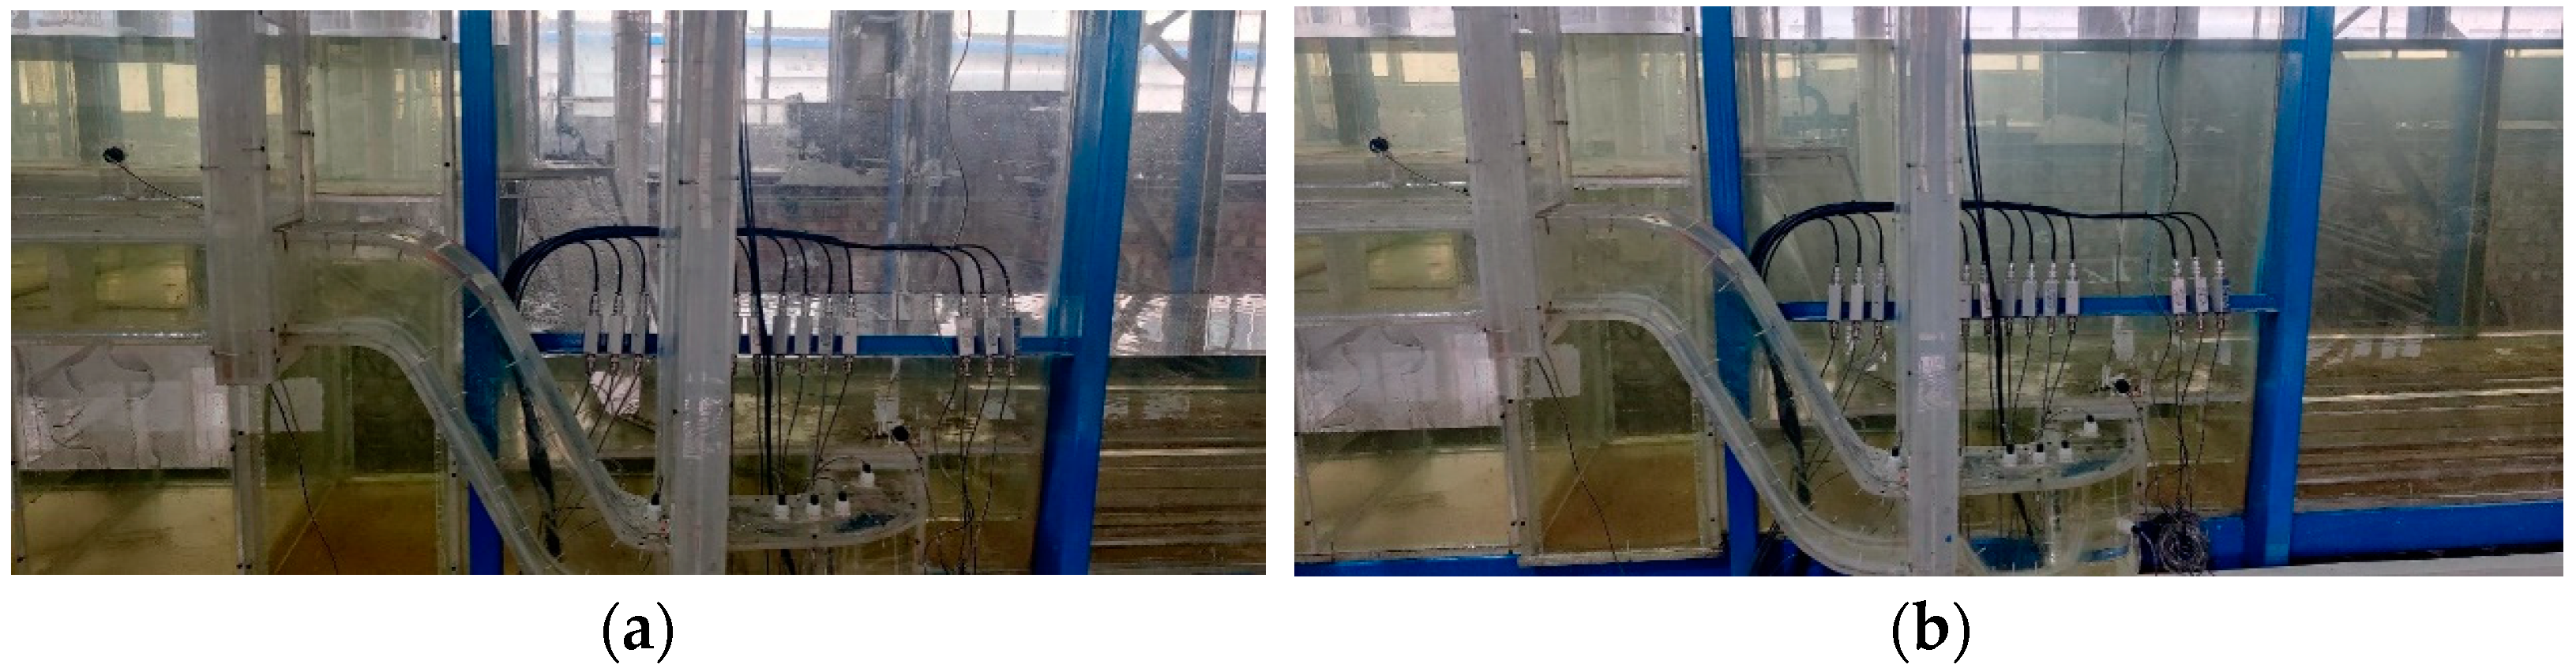
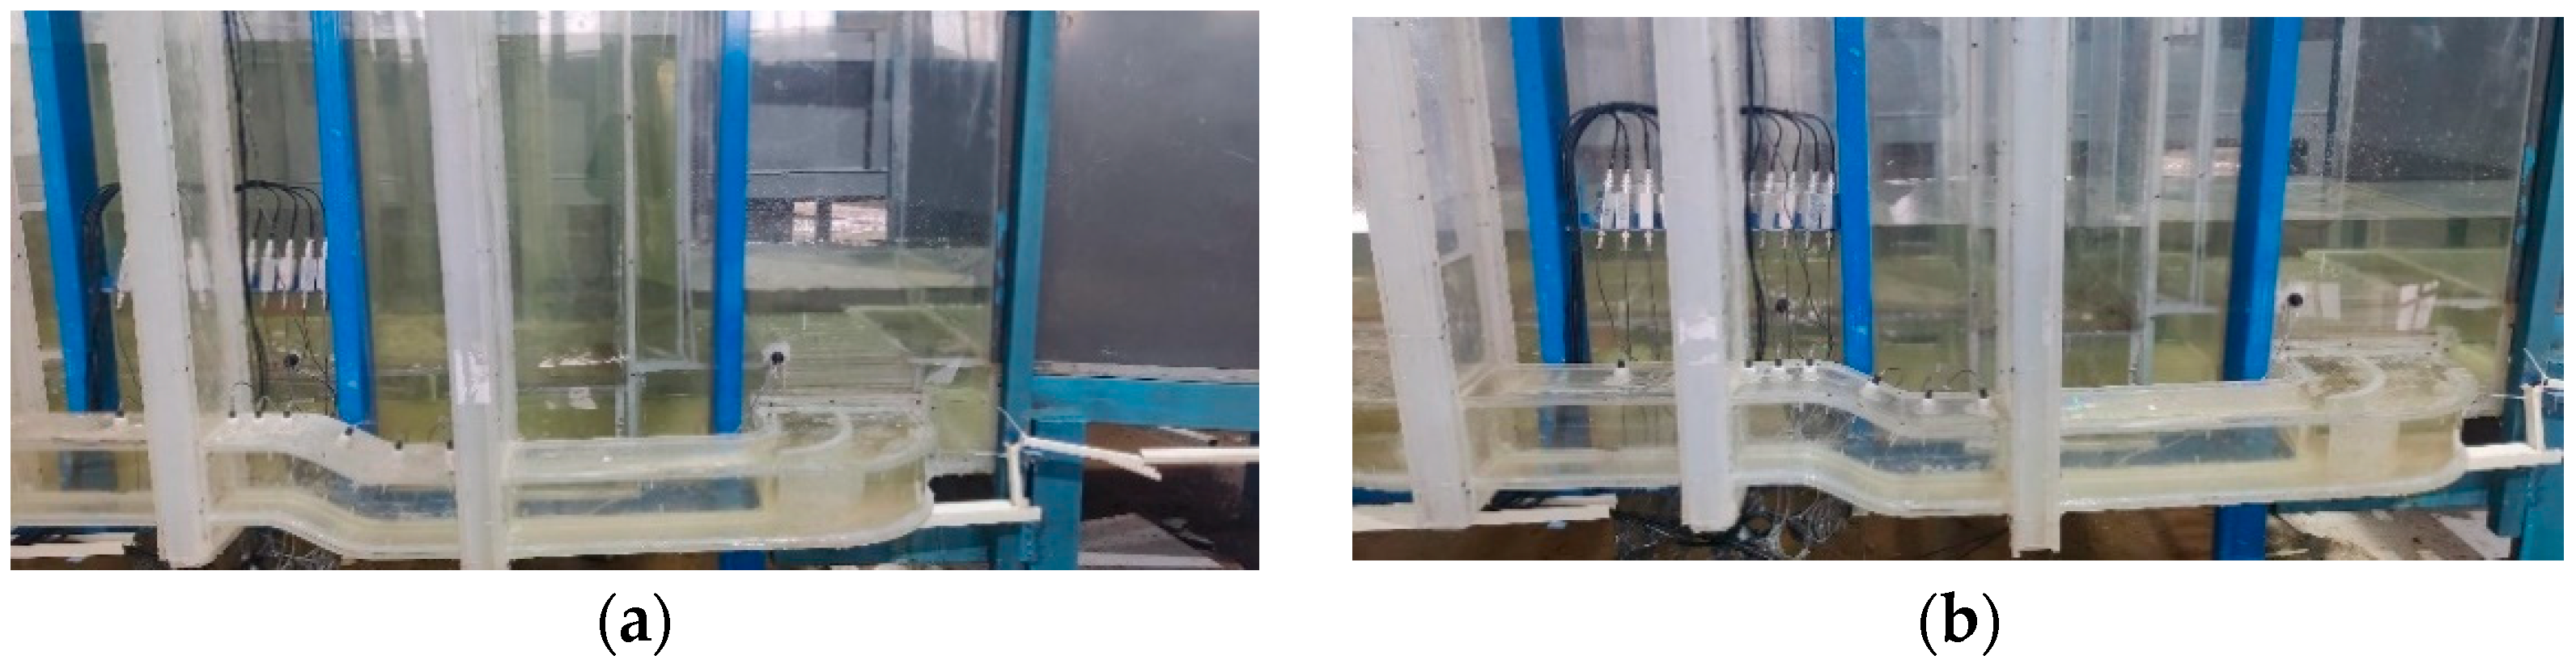
2.2. Construction of the Physical Model

2.2.1. Physical Model

An overall physical model of the ship lock water conveyance system with a geometric scale of 1:30 was established in the laboratory (Tianjin Research Institute for Water Transport Engineering, Tianjin, China;). The physical model is a normal-scale model; at the same time, the experiment comprehensively considered scale parameters such as the velocity scale, flow rate scale, time scale, roughness scale, force scale, draft scale, and displacement scale. The scope of the physical model includes the upstream approach channel (navigation and alignment section), inlet section, upper and lower lock heads of the ship lock, lock chamber, water conveyance system (including the downstream valve section, water conveyance corridor branch hole section), downstream outlet section, downstream approach channel, and test ship model of the prototype, as shown in Figure 3a,b.
The experiment uses an overflow-type flat flume to control the upstream and downstream water levels, and the independently developed system can adjust the opening and closing speed of the valve. Sensors are arranged at different monitoring positions in the corridor to monitor the pressure at the measuring points, and force-measuring sensors are arranged on the test ship to monitor the mooring force, as shown in Figure 3c.
The independently developed system can realize the control of the upstream water level, the opening and closing control of the valve, and the real-time acquisition of data at the monitoring points.

2.2.2. Sensor Arrangement

Two pressure sensors are arranged at the top of the corridor in front of the upstream working valve of the lock chamber, numbered #1 and #2, with an interval of 0.10 m. Six pressure sensors are arranged at the top of the corridor behind the working valve, numbered #3 to #8, where the interval between sensors #3 and #6 is 0.05 m each, and the interval between sensors #6 and #8 is 0.10 m each. One pressure sensor is arranged on the outer and inner sides of the turning section, numbered #9 and #10, respectively, as shown in Figure 4a.
Two pressure sensors are arranged at the top of the corridor in front of the downstream working valve of the lock chamber, numbered #11 and #12, with an interval of 0.10 m. Six pressure sensors are arranged at the top of the corridor behind the working valve, numbered #13 to #18, where the interval between sensors #13 and #15 is 0.05 m each, and the interval between sensors #15 and #18 is 0.10 m each. The sensor arrangement is shown in Figure 4b.

2.3. Experimental Content

In this paper, the experimental working condition of filling and emptying water selects the maximum head difference in H = 16.00 m between the upstream and downstream of the lock chamber as the research condition; that is, the normal storage water level of 126 m is selected for the upstream, and the lowest navigable water level of 110 m is selected for the downstream. The navigable water levels of the upstream and downstream of the Bailongtan Ship Lock are shown in Table 2.
For the three-dimensional numerical simulation research, based on relevant standards and hydraulic theory calculations [31], a design shape scheme for the Bailongtan Ship Lock water conveyance system was proposed. By establishing a three-dimensional numerical model that meets the experimental accuracy requirements, numerical simulations of the filling process were carried out according to the experimental working conditions, and the hydraulic characteristics of the corridor during the filling process and the water flow patterns of typical sections were analyzed. The problems existing in the design shape were studied and optimized, and further study on the hydraulic characteristics of the optimized shape was carried out based on the three-dimensional mathematical model.
For the physical model test research, after the results of the model shape optimization met the requirements, a physical model was established. With the help of the independently developed system, the hydraulic characteristics of the lock chamber during the filling and emptying process, the corridor pressure characteristics at different positions, and the mooring stability of the ship model were monitored, the experimental laws were clarified, and the rationality of the recommended optimized shape was further analyzed.

3. Results and Discussion

3.1. Numerical Analysis Results of the Mathematical Model

3.1.1. Shape Optimization

In the design scheme, at the moment when the pressure at the top of the corridor behind the filling valve is the largest, in the horizontal turning section where the corridor behind the valve is connected to the main bottom corridor of the lock, the water flow converges into the main bottom corridor of the lock along the outer side of the wall. Due to the small opening of the valve, the water flow cannot effectively diffuse within a short straight section behind the valve, forming a large-range high-velocity zone. The range of the horizontal section with a velocity greater than 15 m/s is about 3 m. Therefore, the outer side wall of the turning section of the corridor is impacted by a relatively high velocity, resulting in a pressure head of 10.18 m, while the pressure head on the inner side wall at the same time is 6.29 m, and the pressure difference between the inner and outer side walls is 3.89 m of pressure head.
In response to the problems in the design scheme, a series of optimizations were carried out on the shape of the corridor behind the filling valve. Through numerical model analysis and calculation, the optimized shape was determined. Specifically, a 1.00 m long straight section is reserved behind the valve. The bottom end of the corridor behind the filling valve is deepened downward by 2.00 m at an angle of 60°, then lifted to an elevation of 99.5 m at an angle of 30° and connected to the main bottom corridor of the lock to force the contracted water flow to diffuse. Within the allowable range of the upper lock head layout, the horizontal turning angle in the design scheme is adjusted from 75° to 70°.
The valve corridors before and after optimization are shown in Figure 5.

3.1.2. Hydraulic Characteristics of Chamber Filling

When the valve opening time is 5 min with bilateral uniform opening, the numerical simulation results of the filling process of the ship lock water conveyance system with the designed and optimized shapes are compared. The characteristic parameters of the filling process are shown in Table 3. Through comparative analysis, it can be seen that by optimizing the shape of the corridor on the back side of the filling valve, the filling completion time of the optimized scheme is slightly longer than that of the designed scheme, but the maximum flow rate, the sectional velocity of each part, and the inertial super-elevation of the chamber water surface are all reduced, which improves the operation safety of the ship lock water conveyance system.

3.1.3. Pressure Characteristics of Mathematical Model Valve Section Corridor

During the filling process, as the filling valve gradually opens, the pressure head at monitoring points number #1–#3 in front of the valve shows a trend of first decreasing significantly and then increasing significantly, while the pressure head at monitoring points #4–#10 behind the valve shows a trend of first decreasing slightly and then increasing significantly, as shown in Figure 6. The minimum top pressure occurs at position #5 behind the valve, with values of 3.61 m and 4.97 m, respectively.
During the emptying process, as the release valve gradually opens, the pressure head at monitoring points #11–#13 in front of the valve shows a significant decreasing trend, and the pressure head at monitoring points #14–#20 behind the valve shows a trend of first decreasing and then increasing, as shown in Figure 7. The minimum top pressure occurs at position #15 behind the valve, which is 0.95 m.
The optimized scheme has a sudden-expansion treatment at the bottom of the corridor on the back side of the filling valve. The minimum pressure heads at the top and bottom of the corridor behind the valve during the filling process are both greater than zero. The experimental results show that there is no negative pressure in the valve section corridor, and the corridor shape is safe during operation.
The formation of the minimum pressure behind the valve is attributed to the flow contraction effect. During the initial stage of valve opening, the valve opening degree is small, causing a sudden reduction in the cross-sectional area of the flow passage. This leads to a sudden increase in flow velocity, and according to Bernoulli’s equation, an increase in velocity is accompanied by a decrease in pressure.
During the filling process, the pressure at the horizontal turning section increases significantly (as shown in Figure 8). Among them, compared with the designed scheme, the pressure head on the outer side wall of the optimized scheme decreases, and the pressure head on the inner side wall increases. At the moment of the maximum flow rate, the pressure head difference between the inner and outer side walls is 4.32 m; at the moment of the minimum pressure in the valve section corridor, the pressure head difference between the inner and outer side walls is 1.52 m, which are both lower than the pressure head difference between the inner and outer side walls of the turning section of the filling corridor in the designed scheme (Table 4). It shows that by optimizing the shape and adjusting the angle of the horizontal turning section from 75° to 70°, the inner and outer pressures and the pressure difference inside the horizontal turning section corridor are all reduced, which is beneficial to the safe operation of the corridor.

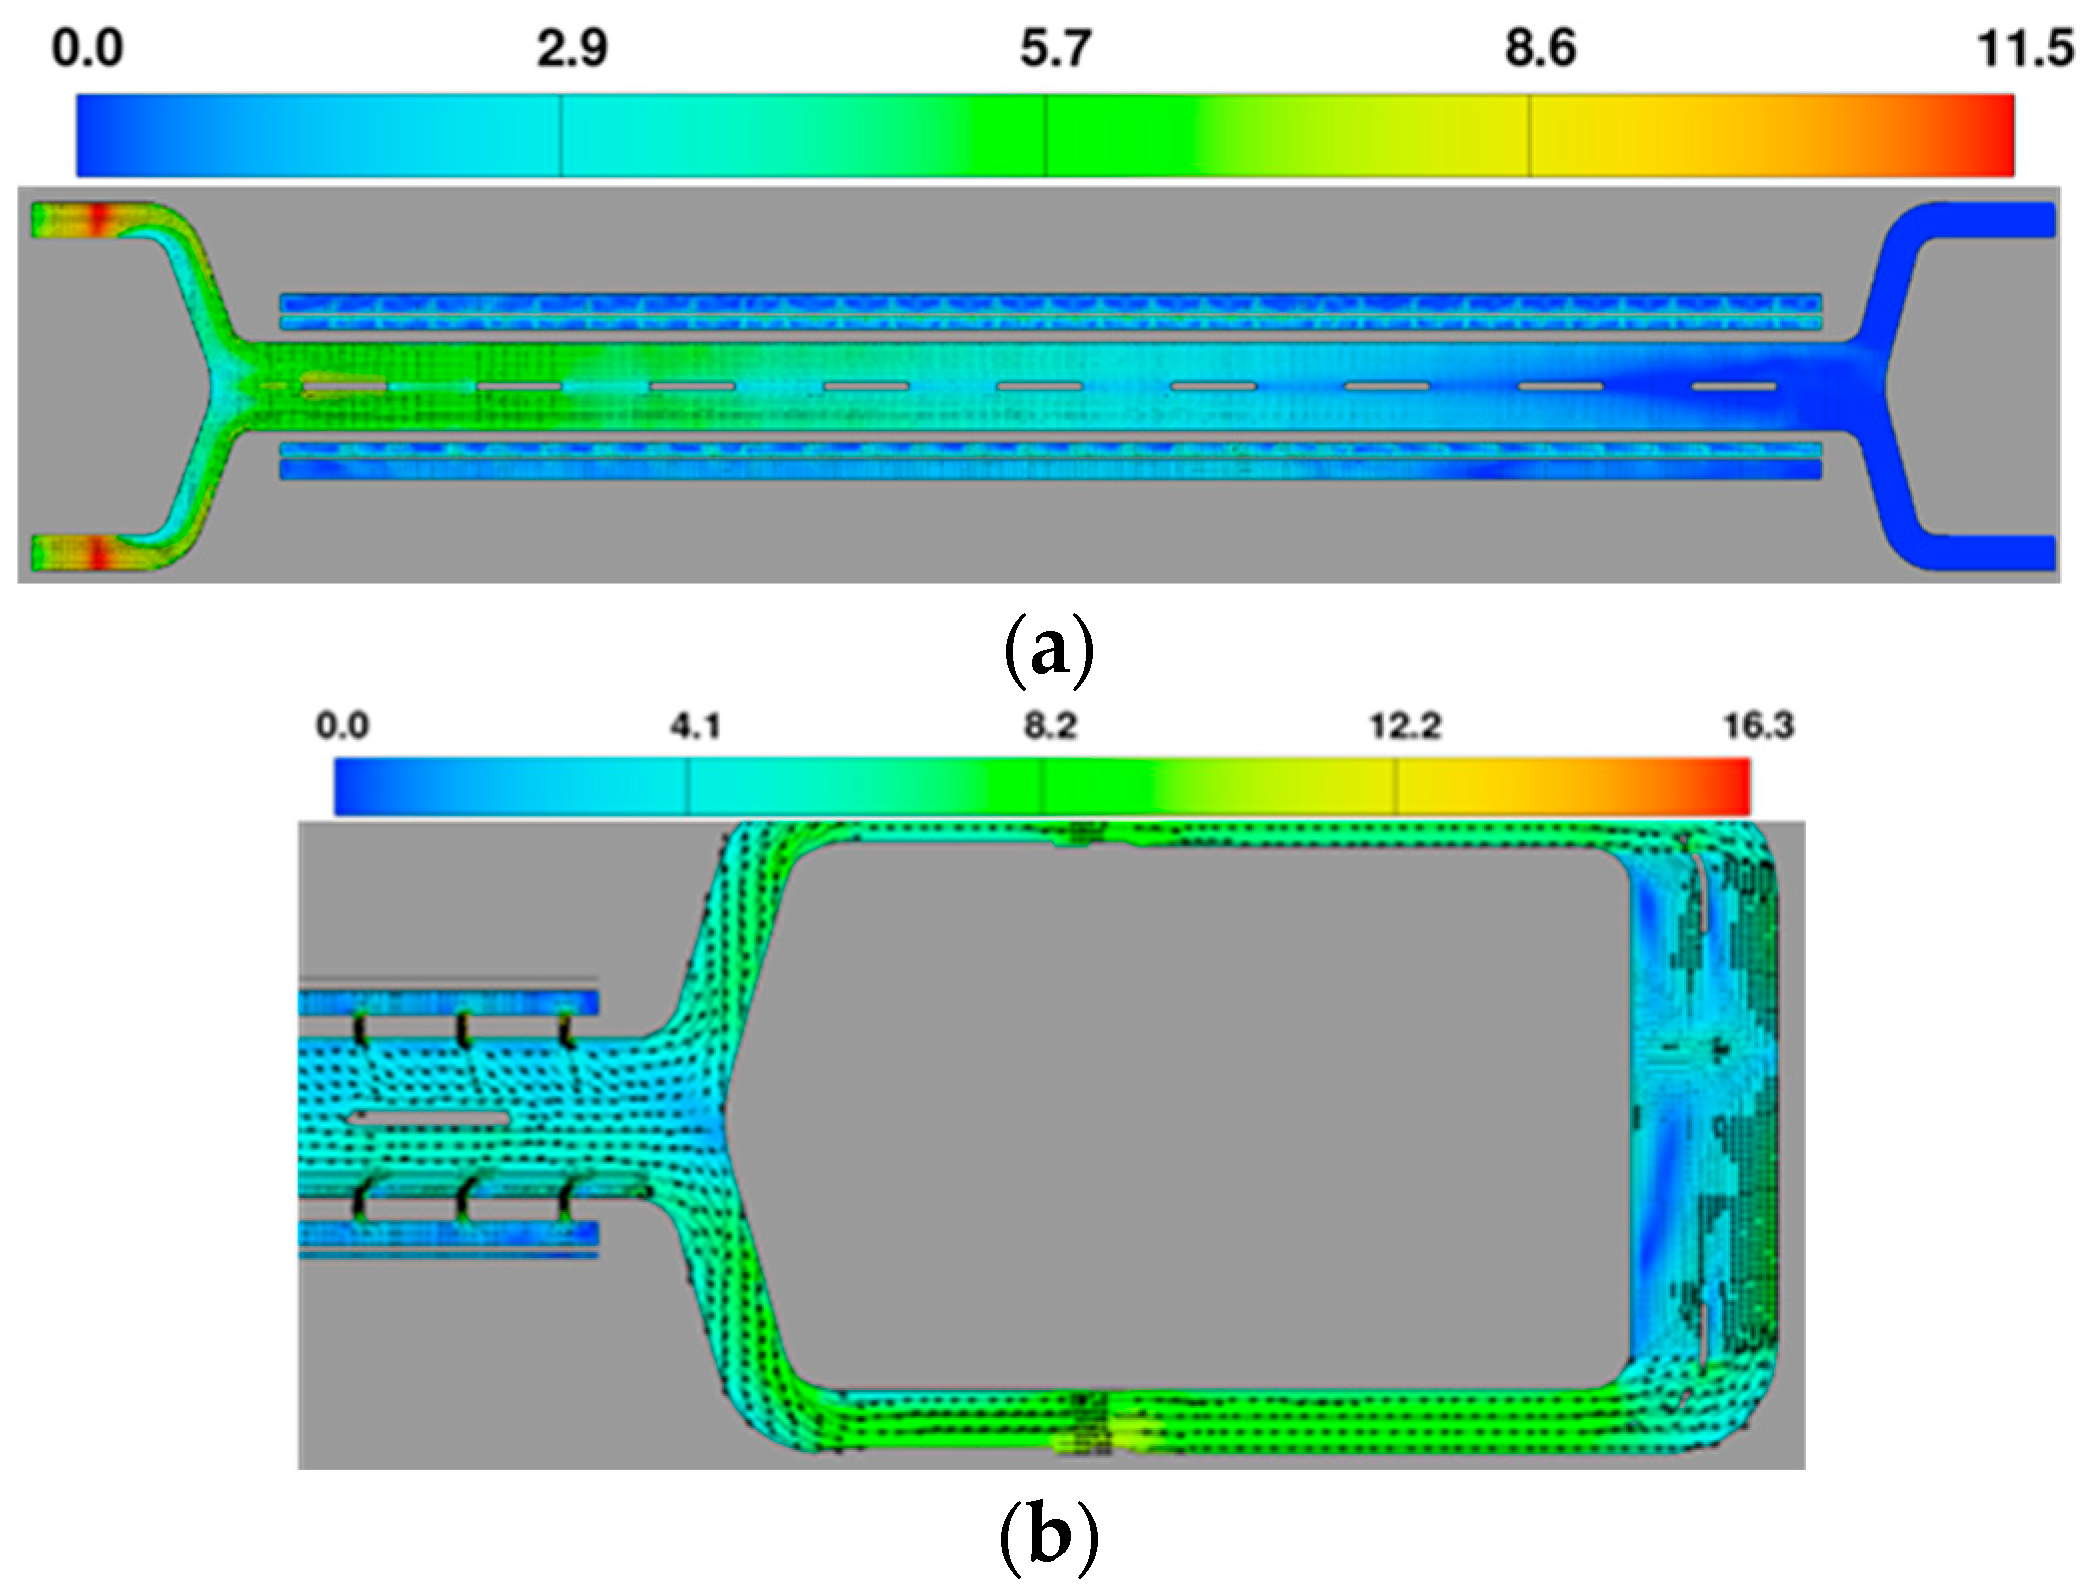
3.1.4. Water Flow Patterns in Typical Sections

(1)
Water Flow Pattern in the Filling Valve Section
When the pressure at the top of the filling valve corridor is the minimum under different schemes, it is selected as the comparison and analysis moment, and the plane and elevation flow field distributions of the filling valve corridor section and the horizontal turning section under different calculation schemes are extracted. As shown in Figure 9a,b, through deepening the bottom of the corridor and optimizing the horizontal turning angle at the same time, although the water flow field still converges into the main bottom corridor of the lock along the outer side of the turning section, and the phenomenon of the outer side wall of the bend-confluence section being impacted by the water flow still exists, in the horizontal and elevation profiles, the velocity value and the action range of the large-velocity zone are significantly reduced, and the water flow is diffused to a certain extent within the limited straight section.
(2)
Water Flow Pattern in the Emptying Valve Corridor Section
The typical-moment emptying flow patterns of the emptying valve corridor section are shown in Figure 10. When the valve is opening, the velocity at the lower end of the valve is relatively high. When the valve opening is small (Figure 10a), a swirling water flow is generated behind the valve. As the valve opening gradually increases, the swirling water flow gradually disappears (Figure 10b). Except for the short-distance corridor (the section of the corridor between the rear end of the valve and the horizontal turning section) flow field behind the valve being relatively disorderly, the flow fields of the remaining sections are relatively smooth.
At the moment of the maximum flow rate (TQmax) in the lock chamber, the flow field diagrams of the remaining parts of the water conveyance system are extracted (shown in Figure 11). It can be seen from the flow field diagrams that the plane flow patterns of each part of the bottom corridor of the water conveyance system are generally in a smooth state, as shown in Figure 11a.

3.2. Experimental Analysis Results of the Physical Model

3.2.1. Hydraulic Characteristics of Chamber Water Conveyance

(1)
Filling and Emptying Processes
Experimental research was carried out under the working condition of the maximum design head difference. The change processes of the water level and flow rate in the lock chamber and the filling and emptying completion time under different opening times of the filling and emptying valves were monitored and analyzed. The experimental working conditions of the filling and emptying processes of the ship lock water conveyance system are shown in Figure 12 and Figure 13.
(2)
Flow Coefficient of the Water Conveyance System
According to the relevant experimental regulations [32], the flow coefficient of the ship lock water conveyance system during the filling and emptying processes was measured. Multiple water-level-difference working conditions after the full opening of the filling and emptying valves during the filling and emptying processes were selected, and the average value of multiple experimental results was taken. The flow coefficient of the water conveyance system when the filling valve is fully open is calculated to be 0.61, and the flow coefficient of the water conveyance system when the emptying valve is fully open is 0.63.
(3)
Hydraulic Characteristics
The experimental variable is the valve opening time, which is 3 min, 4 min, 5 min, and 6 min, respectively. Through statistics (Table 5), as the valve opening time increases, the filling and emptying completion time gradually increases, and the maximum flow rate and the average sectional velocity of each part decrease. The typical hydraulic characteristic curves are shown in Figure 14. The maximum average velocity of the inlet section during the filling process is less than the standard value of 2.5 m/s; the maximum velocity of the water conveyance corridor section at the valve during the filling and emptying processes is less than the standard-required 15 m/s; under different valve opening times, the super-elevation or super-depression value of the chamber filling and emptying is less than 0.25 m, which meets the safe operation requirements of the ship lock.

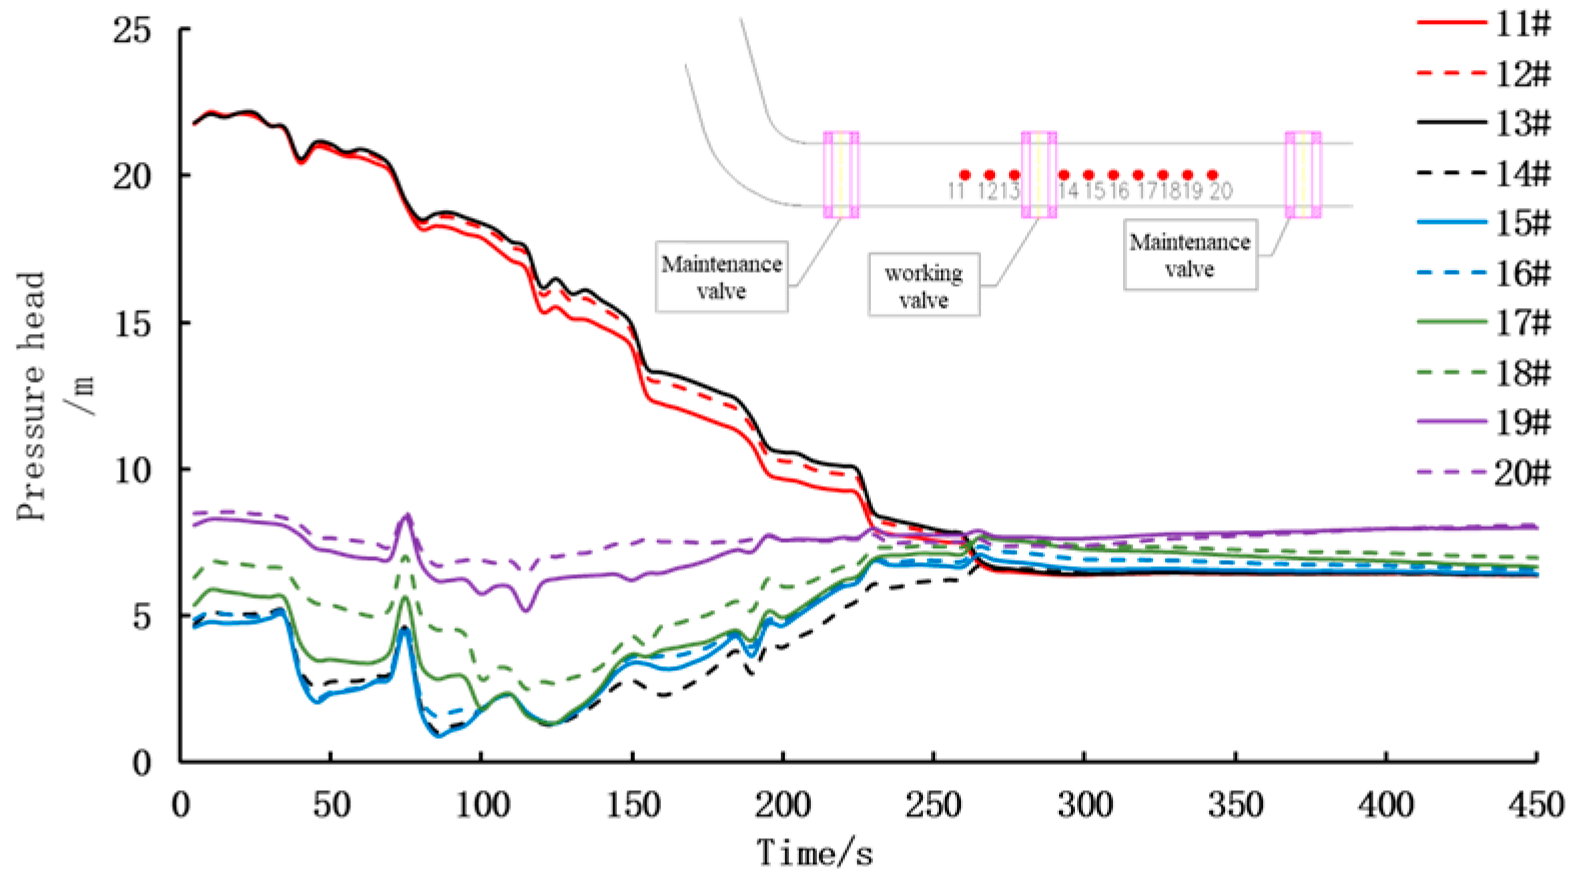
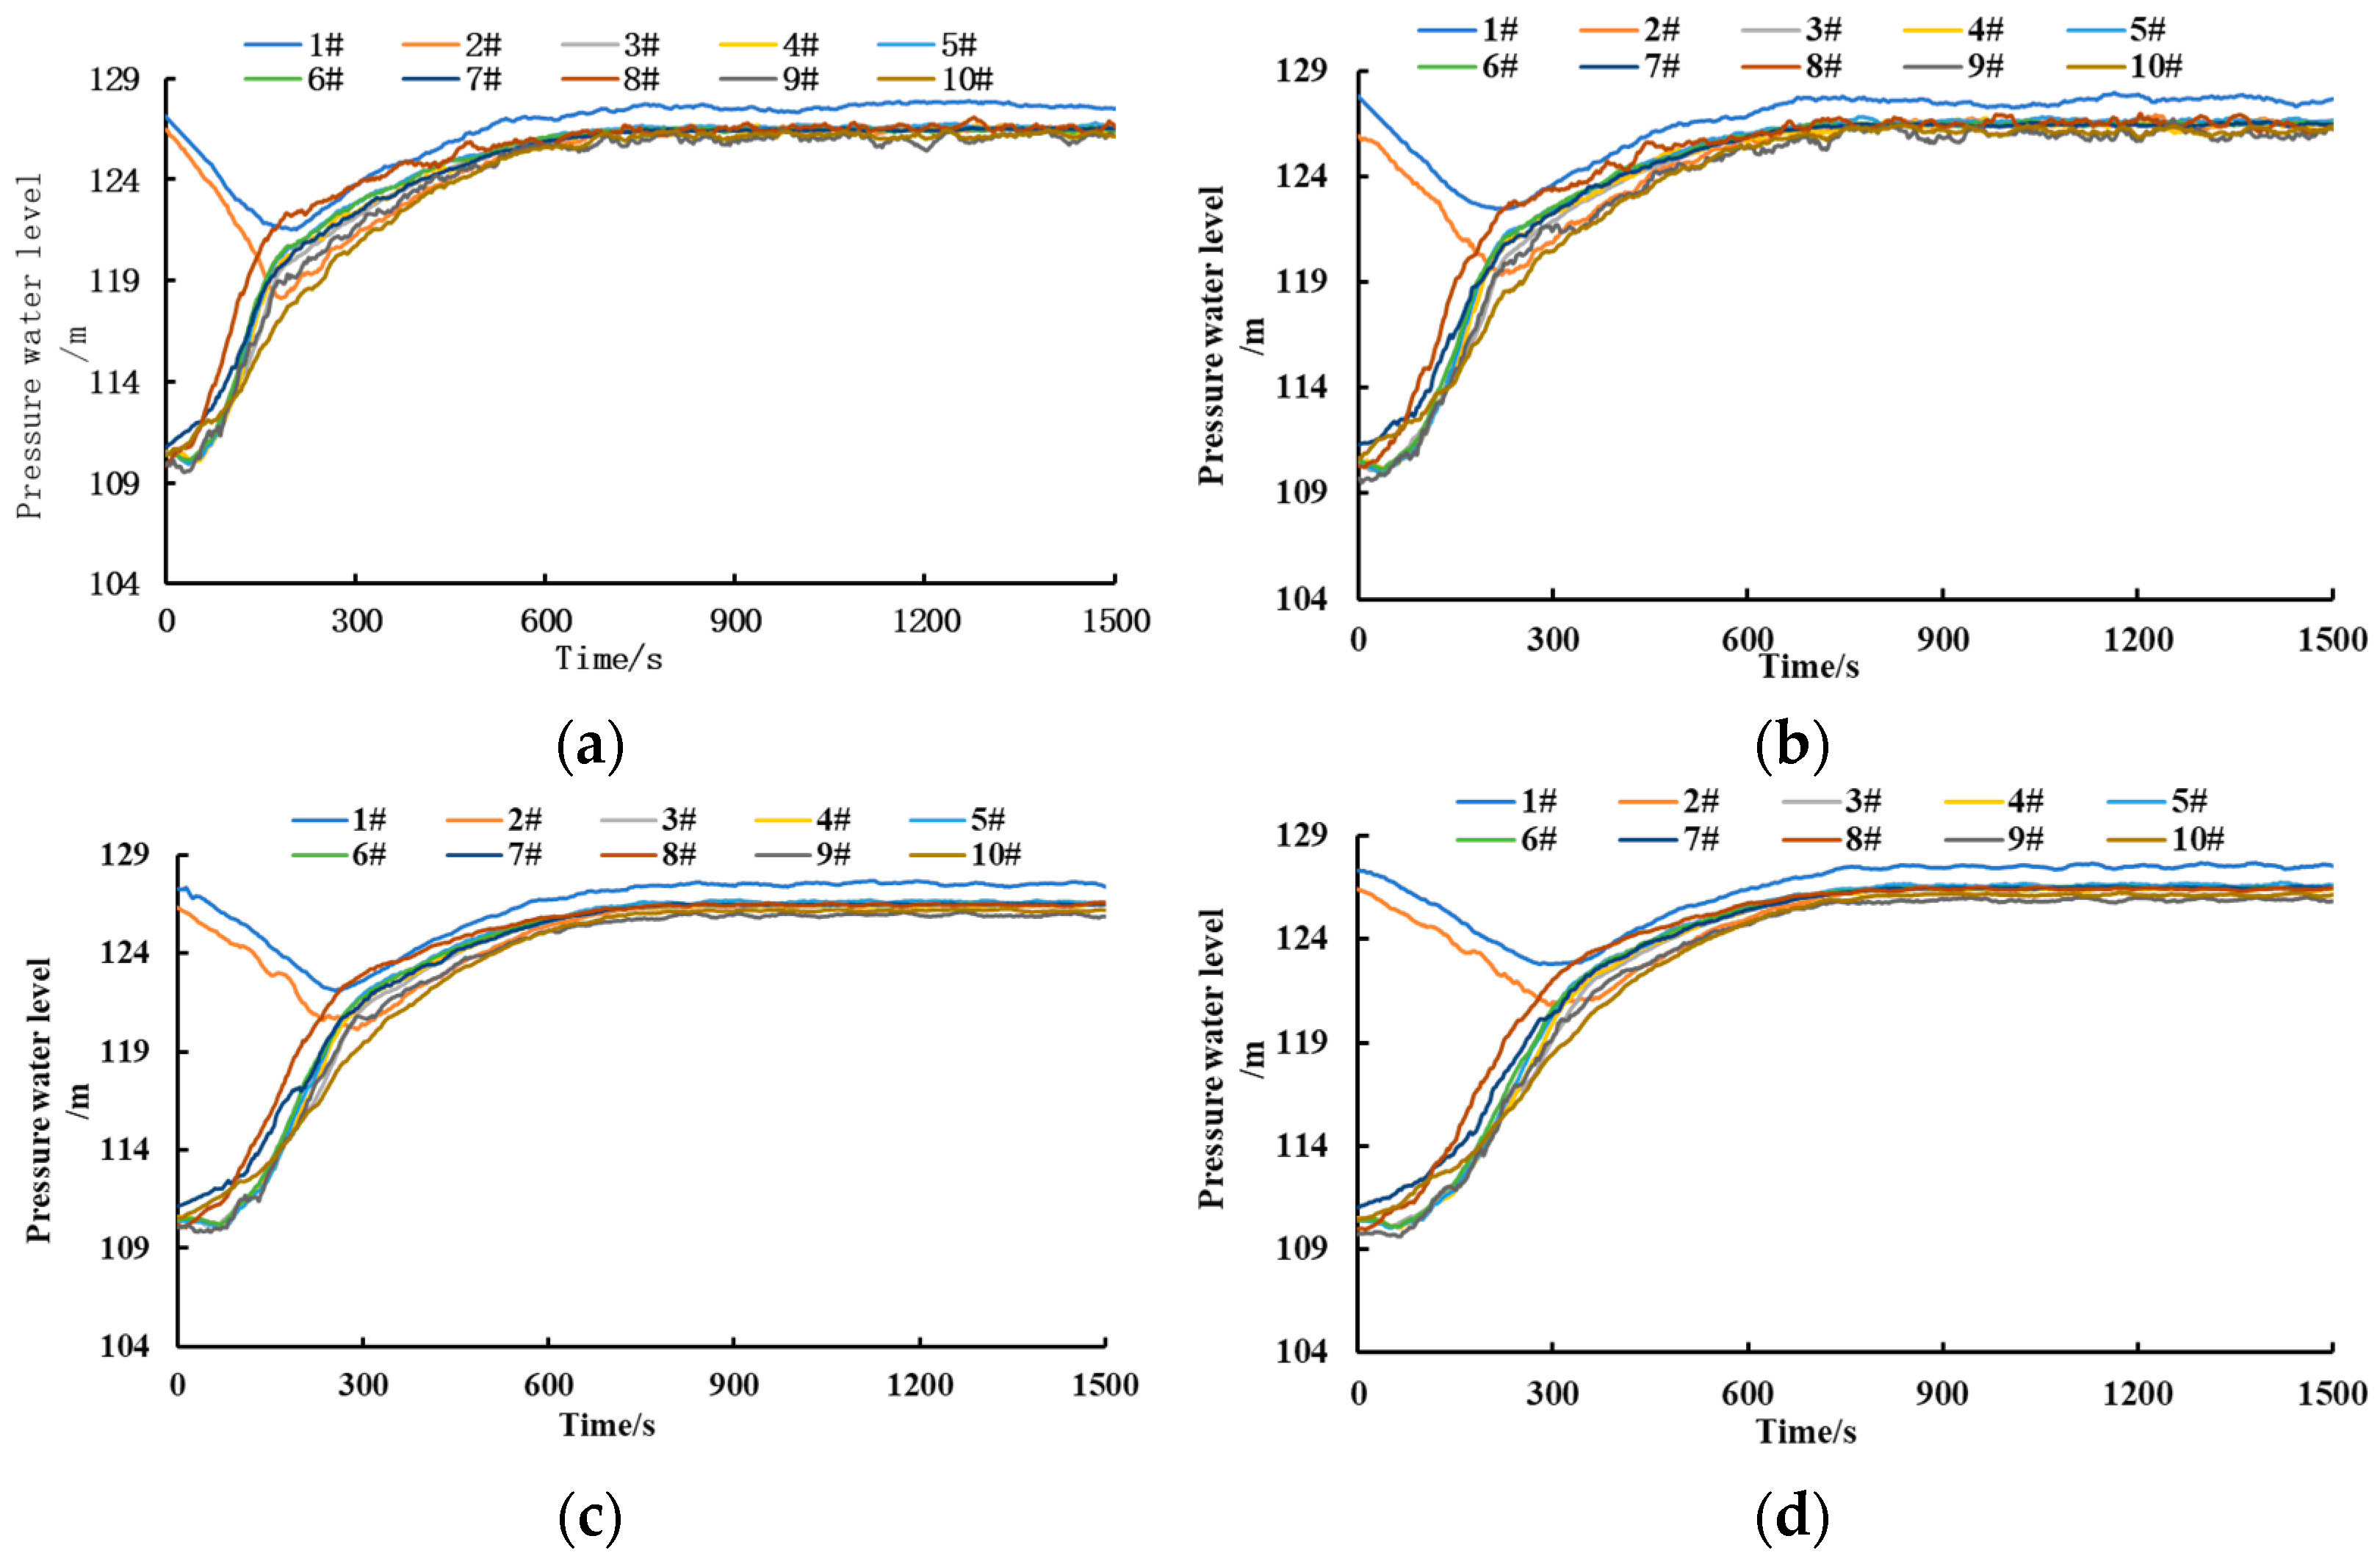
3.2.2. Pressure Characteristics of Physical Model Valve Section Corridor

(1)
Pressure Characteristics of the Upstream Corridor of the Lock Chamber
In the experiment, eight pressure sensors were installed at the top of the corridor in front of and behind the filling valve, and one pressure sensor was installed on the inner and outer sides of the turning section of the inlet corridor, respectively, to measure the unsteady-flow pressure at the top of the corridor in front of and behind the filling valve and at the turning section during the opening process of the filling working valve. When the bilateral uniform opening time of the valve is 3 min, 4 min, 5 min, and 6 min, and the head difference is between the upstream and downstream, the variation results of the unsteady-flow pressure with time are shown in Figure 15.
The pressure process lines of the monitoring points in the corridor under different working conditions were analyzed, and the positions and values of the minimum pressure water levels under different working conditions were counted. When the lock chamber is filling water, the minimum pressure water level of the filling corridor occurs at position #3 behind the valve, and as the valve opening time prolongs, the minimum pressure at the top of the corridor gradually increases. Under different valve opening time working conditions, there is no negative pressure in the inlet corridor, which meets the safe operation requirements of the ship lock.
(2)
Pressure Characteristics of the Downstream Corridor of the Lock Chamber
In the experiment, eight pressure sensors were installed at the top of the corridor in front of and behind the emptying valve to measure the unsteady-flow pressure at the top of the corridor in front of and behind the emptying valve during the opening process of the emptying working valve. When the bilateral uniform opening time of the valve is 3 min, 4 min, 5 min, and 6 min, and the head difference is between the upstream and downstream, the variation results of the unsteady-flow pressure with time are shown in Figure 16.
It can be analyzed that the minimum pressure water level under different working conditions occurs at the #14 measuring point behind the emptying valve, and as the valve opening time prolongs, the minimum pressure at the top of the corridor gradually decreases. Under different valve opening time working conditions, there is no negative pressure in the inlet corridor, which meets the safe operation requirements of the ship lock.
Although no negative pressure was observed under the experimental conditions of this study, there is a potential risk of negative pressure under other operating conditions. For example, excessively rapid valve opening could further increase the flow velocity behind the valve, creating a possibility of negative pressure formation. Therefore, it is recommended to avoid excessive rapid valve opening during actual engineering operations.

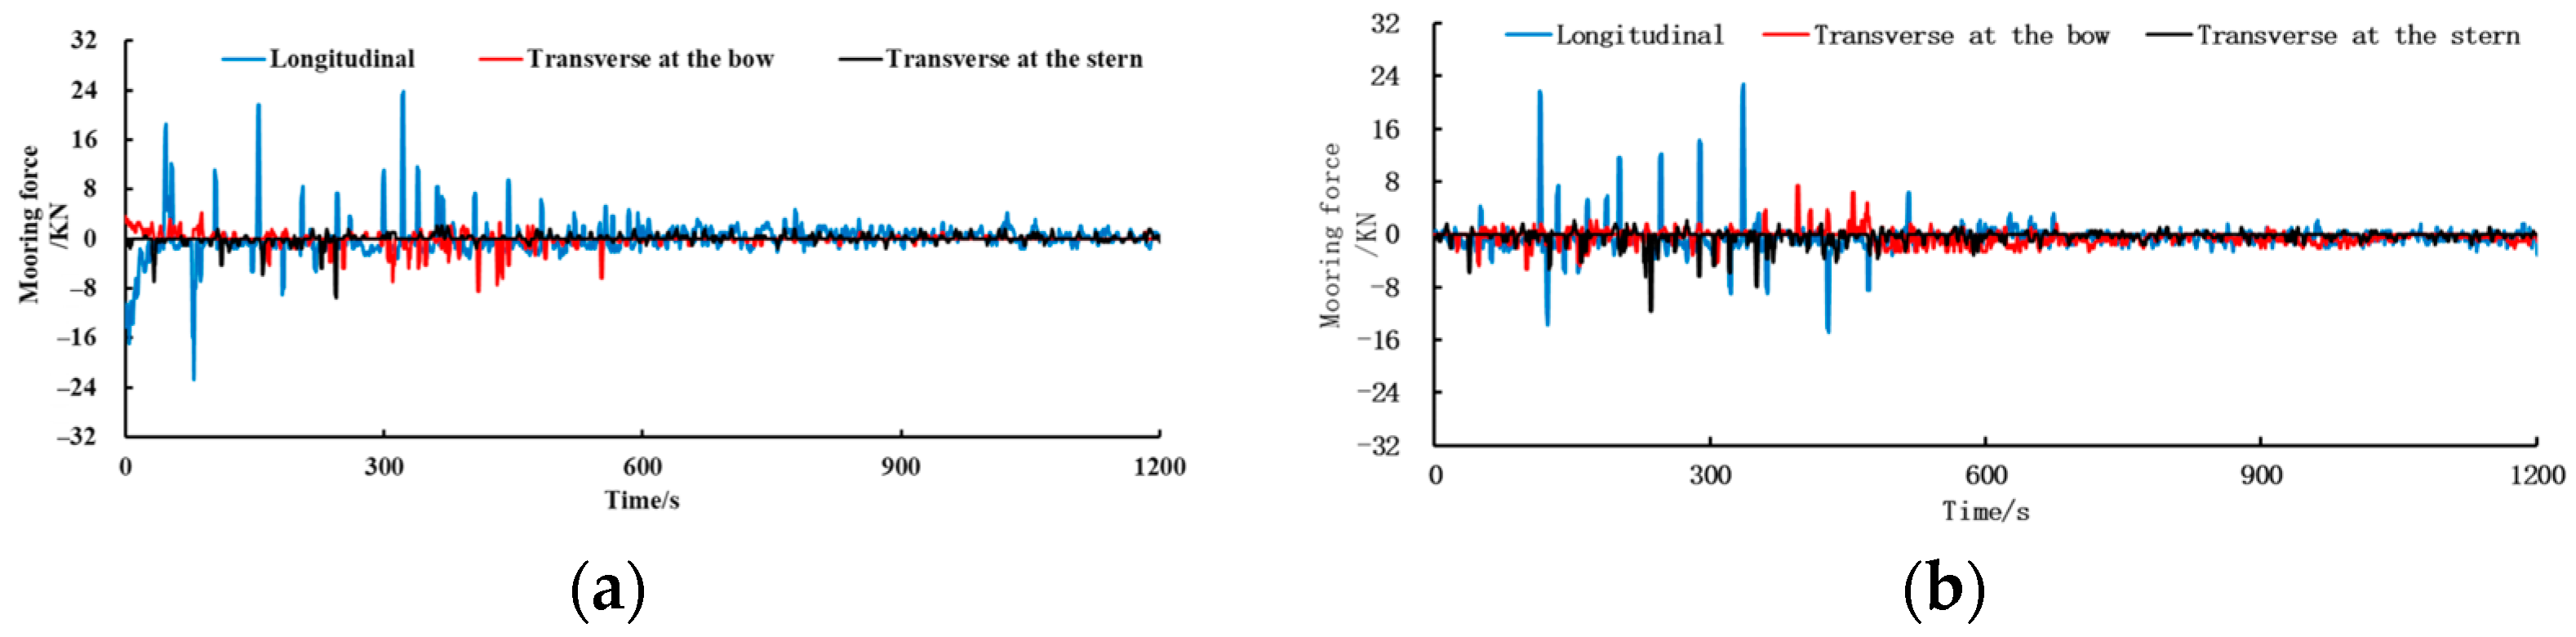
3.2.3. Ship Stability

During the experiment, the ship model was moored at the upper, middle, and lower sections of the lock chamber, respectively. The change processes of the longitudinal mooring force of the ship and the transverse mooring forces at the bow and stern of the ship during the filling and emptying processes of the lock chamber were monitored (taking the mooring of the ship model in the middle section of the lock chamber as an example, as shown in Figure 17), and the extreme values of the mooring forces on different parts of the ship under different experimental working conditions were counted. The statistical results are shown in Table 6. Under different filling and emptying experimental working conditions, when the bilateral opening time of the water conveyance corridor valve is 3 min, the longitudinal mooring force does not exceed 32 kN, and the transverse mooring force does not exceed 16 kN, which meets the standard requirements. This indicates that the water flow conditions during the filling and emptying processes of the lock chamber meet the mooring stability requirements of the ship. At the same time, it can be seen that during the water conveyance process, the longitudinal mooring force at the rear section of the lock chamber is greater than that at the front section, and the water flow conditions at the rear section of the lock chamber are better than those at the front section.

4. Conclusions

The research is based on the design scheme of the side-branch-hole layout of the long bottom corridor of the water conveyance system of the Bailongtan Ship Lock. For the hydraulic characteristics of the water conveyance system, the shape of the design scheme was optimized through three-dimensional numerical simulation research, and further physical model test research on the optimized shape was carried out. The main conclusions are as follows:
(1)
By performing a sudden-expansion treatment on the bottom of the corridor behind the valve and reducing the angle of the turning section, the contracted water flow behind the valve can be forced to diffuse, effectively reducing the range of the high-velocity zone behind the valve and the hydrodynamic pressure on the outer side wall of the bend-confluence section. In the optimized shape scheme, the range of the high-velocity zone is shortened from 3.0 m to 1.5 m, and the velocity in the horizontal section is less than 15 m/s. The pressure difference between the inner and outer sides of the horizontal turning section corridor is reduced from 5.35 m to 4.32 m of pressure head at the moment of maximum flow rate, effectively ensuring the safe operation of the corridor.
(2)
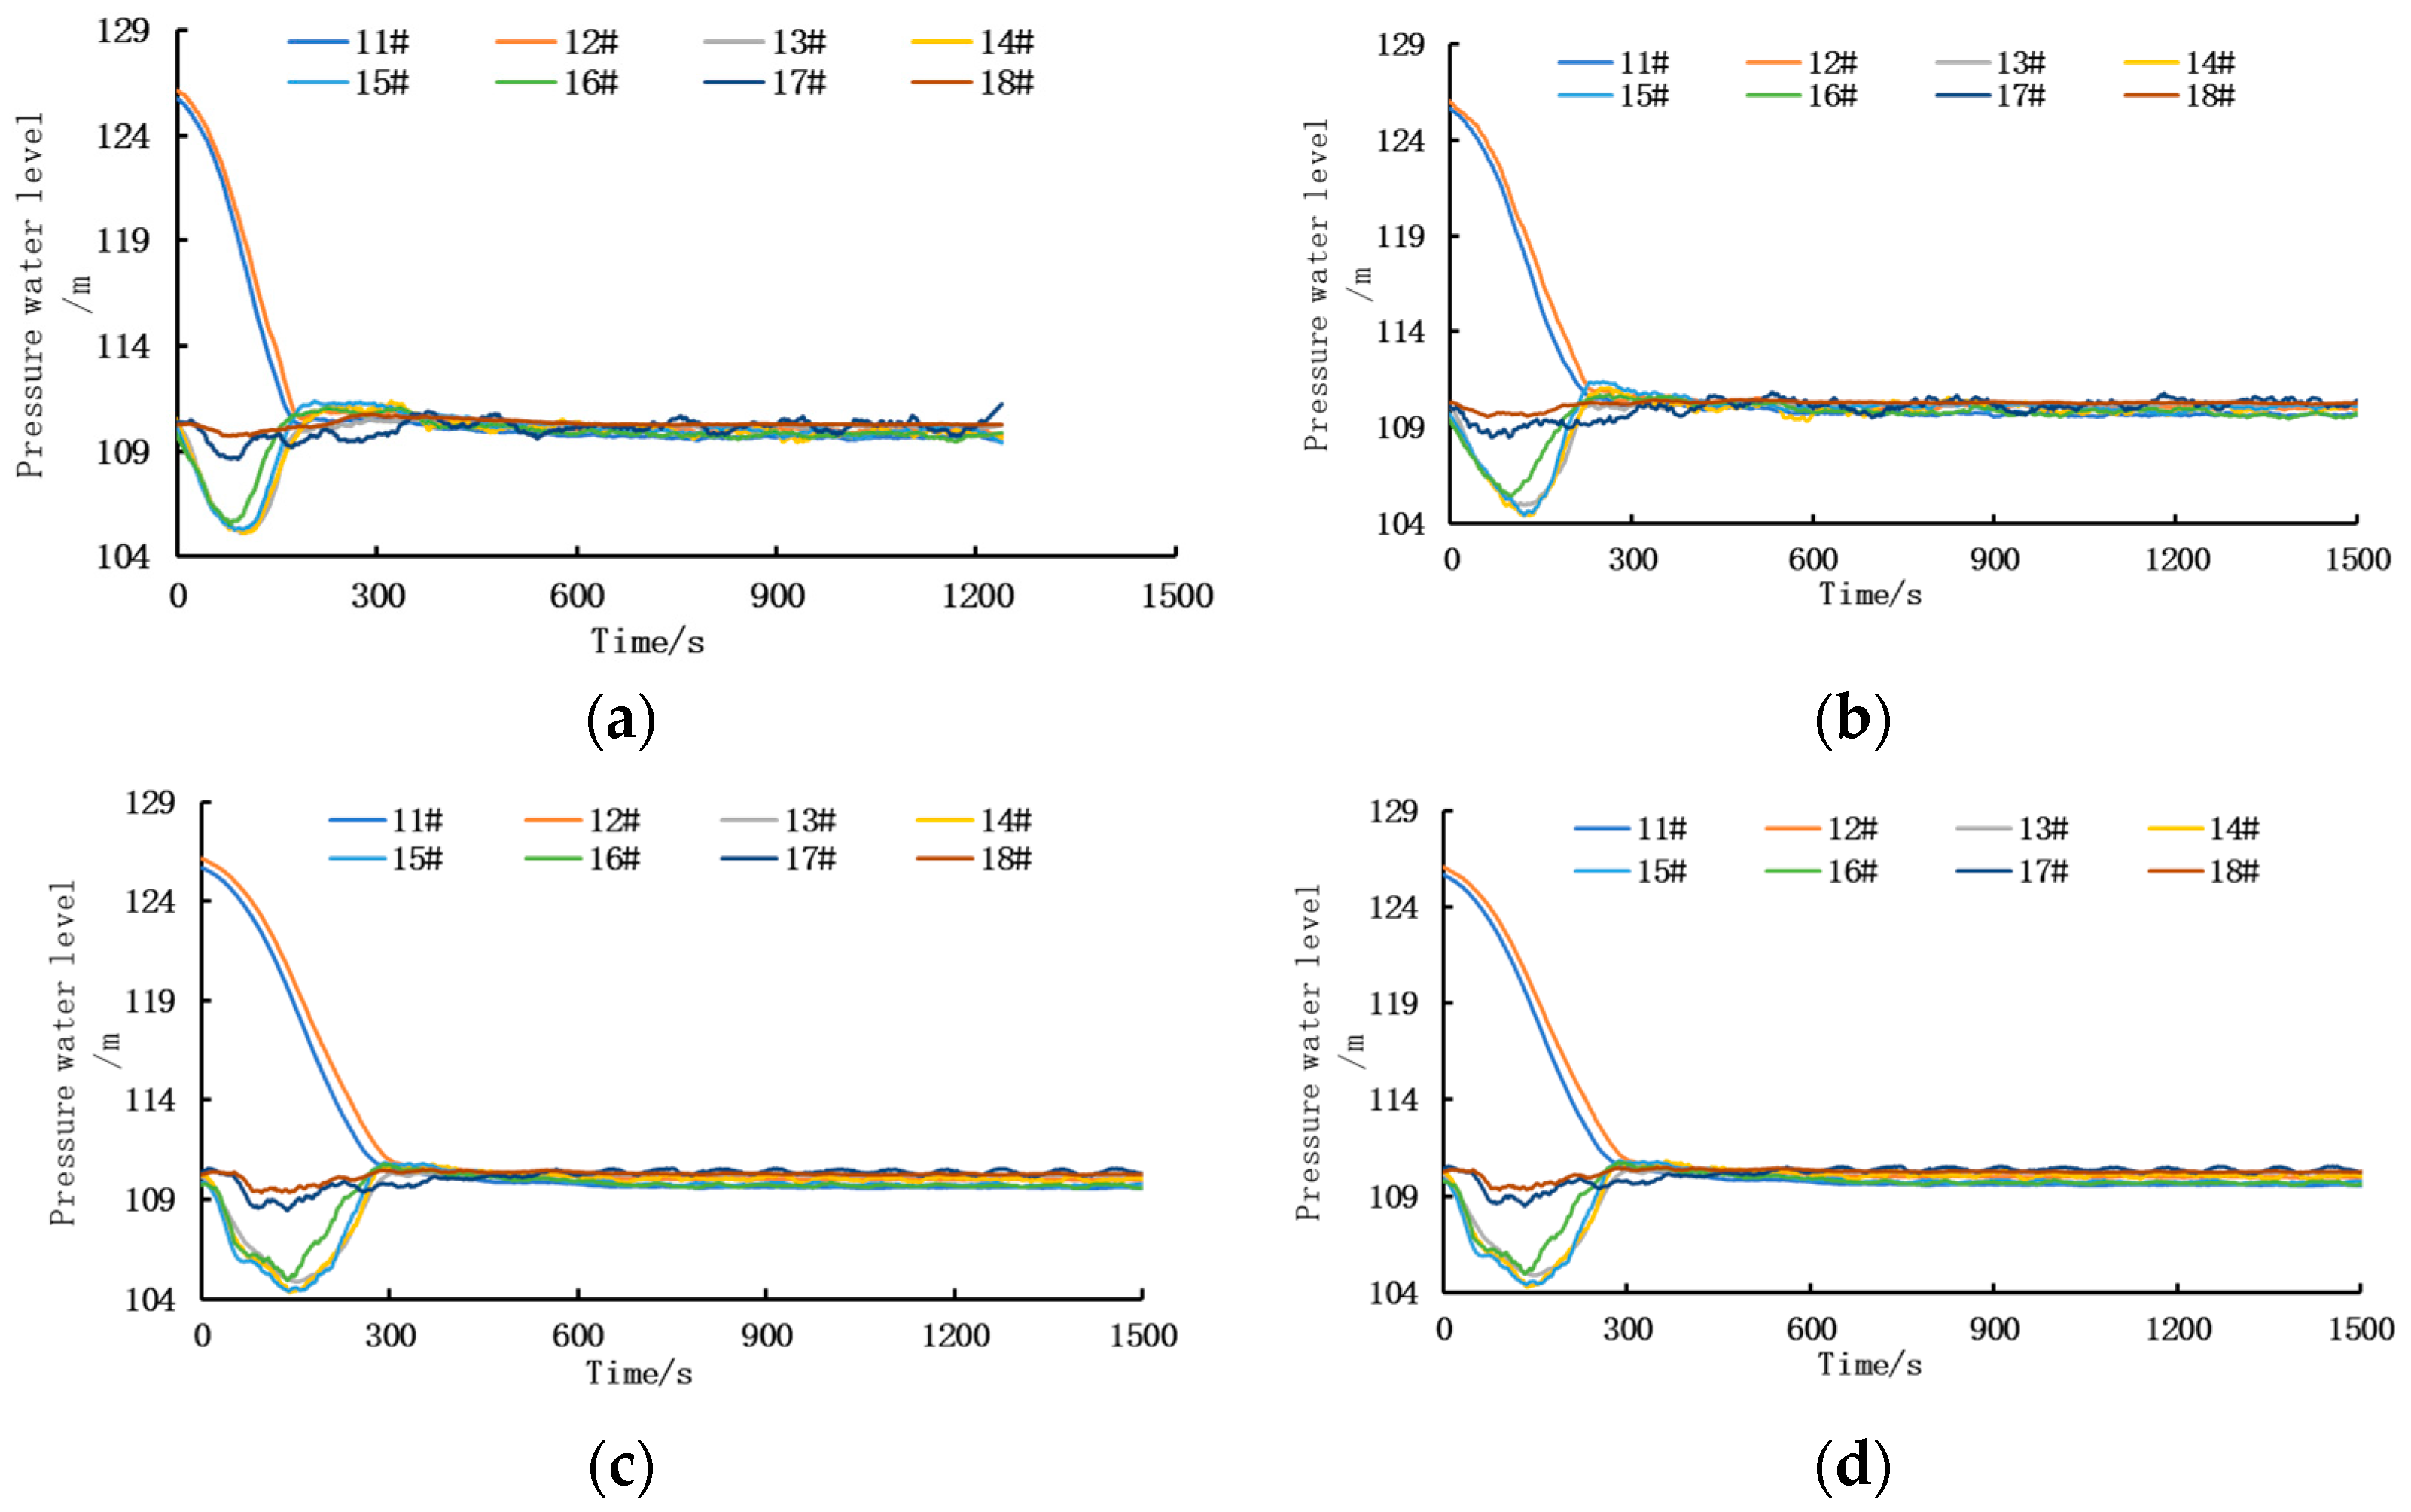
During the filling process, as the filling valve gradually opens, the pressure head in front of the valve shows a trend of first decreasing significantly and then increasing significantly, while the pressure head behind the valve shows a trend of first decreasing slightly and then increasing significantly. During the emptying process, as the emptying valve gradually opens, the pressure head in front of the valve shows a significant decreasing trend, and the pressure head behind the valve shows a trend of first decreasing and then increasing. During the research process, special attention should be paid to the pressure head situation in the corridor behind the valve to avoid the occurrence of negative pressure.
(3)
As the opening time of the corridor valve increases, the water conveyance completion time gradually increases, and the maximum flow rate and the average sectional velocity of each part decrease. In the research of the filling process, as the valve opening time is prolonged, the minimum pressure at the top of the corridor gradually increases; in the research of the emptying process, as the valve opening time is prolonged, the minimum pressure at the top of the corridor gradually decreases.
(4)
The three-dimensional numerical model constructed in this paper can clearly display the water flow pattern characteristics of each part. The independently developed system can effectively monitor the hydraulic characteristics of the physical test model and the stability of the ship. The combination of the research results of the numerical model and the physical model can effectively ensure the scientific nature of the research. The research method proposed in this paper can effectively optimize the design shape scheme and further improve the scientific nature of the optimized scheme, providing effective technical guidance for engineering construction.

Author Contributions

Y.D.: methodology, software, experimental research, writing—review and editing; D.M.: methodology, funding acquisition, project administration, writing—review and editing; W.G.: data reduction, graph, experimental research; C.J.: data reduction, software, graph, validation; J.Z.: formal analysis, experimental research, writing—review and editing. All authors have read and agreed to the published version of the manuscript.

Funding

This research was funded by National Key Research and Development Program of China, grant number 2023YFB2603800. Guangxi Science and Technology Major Program, grant number AA23062045, AA23062035, and AA23062052. Scientific Research and Innovation Fund Project of TIWTE, grant number TKS20230110 and TKS20240101.

Data Availability Statement

The original contributions presented in this study are included in the article. Further inquiries can be directed to the corresponding author.

Conflicts of Interest

The authors declare no conflicts of interest. The funders had no role in the design of the study; in the collection, analyses, or interpretation of data; in the writing of the manuscript; or in the decision to publish the results.

References

  1. Natale, L.; Savi, F. Minimization of filling and emptying time for navigation locks. J. Waterw. Port Coast. Ocean. Eng. 2000, 126, 274–280. [Google Scholar] [CrossRef]
  2. Wang, S.M.; Jiang, Y.Z.; Wu, Y.Z.; Li, J. Research on the water conveyance system of large-scale ship locks with ultra-high water head. Yangtze River 2017, 48, 75–79. [Google Scholar]
  3. Chen, M.; Xuan, G.X.; Chen, M.D. A review of hydrodynamic research on ship lock water conveyance systems. J. Chongqing Jiaotong Univ. (Nat. Sci.) 2013, 32, 157–160+168. [Google Scholar]
  4. Richard, L.S.; Frank, M.N.; Victor, L.Z. Hydraulic calculations for flow in lock manifolds. J. Hydraul. Eng. 1991, 117, 1026–1041. [Google Scholar]
  5. Lucas, E.; Calvo, G. Design of the filling and emptying system of the new Panama Canal locks. J. Appl. Water Eng. Res. 2013, 1, 28–38. [Google Scholar]
  6. Hite, J.E.; Stockstill, R.L. Hydraulic design of a longitudinal culvert for lock filling and emptying systems. J. Hydraul. Eng. 2004, 130, 381–388. [Google Scholar] [CrossRef]
  7. Liu, P.C.; Zhou, J.Y.; Wang, Z.B.; Ding, S.Q. Prototype observation research on the hydraulics of the water conveyance system of Jinpanzi Ship Lock on Qujiang River. J. Chongqing Jiaotong Univ. (Nat. Sci.) 2011, 30, 1396–1399+1419. [Google Scholar]
  8. Wang, L.J.; Liu, H.J.; Wu, Y.Z.; Jiang, Y.Z. Prototype observation research on the hydraulics of the water conveyance system of Xinglong Ship Lock on Hanjiang River. Yangtze River 2020, 51, 340–343. [Google Scholar]
  9. Ouyang, B.; Chen, L.; Ou, Z.Q.; Shu, Y.J.; Wang, Z.B. Prototype observation on hydraulic characteristics and full-scale ship test of the second-line ship lock of Qingyuan Hub on Beijiang River. Port Waterw. Eng. 2022, 6, 112–118. [Google Scholar]
  10. Hu, Y.A.; Zheng, C.P. Prototype monitoring of the cavitation characteristics of the water delivery valve of Gezhouba No.1 Ship Lock. Adv. Water Sci. 1994, 3, 235–241. [Google Scholar]
  11. Hu, Y.A.; Li, J.; Li, Z.H. Prototype debugging research on the hydraulic characteristics of the water conveyance system of Dahua Ship Lock on Hongshui River. Port Waterw. Eng. 2008, 3, 87–92+98. [Google Scholar]
  12. Ables, J.H.; Boyd, M.B. Filling and Emptying System Cannelton Main Lock, Ohio River, and Generalized Tests of Sidewall Port Systems for 110- by 1200- ft Locks. Hydraulic Model Investigation; U.S. Army Engineer Waterways Experiments Station: Vicksburg, MS, USA, 1966; pp. 2–713. [Google Scholar]
  13. Pickett, E.B.; Neilson, F.M. Lock Hydraulic System Model and Prototype Study Data; U.S. Army Engineer Waterways Experiment Station: Vicksburg, MS, USA, 1988. [Google Scholar]
  14. Hite, J.E. Model Study of Marmet Lock Filling and Emptying System, Kanawha River; U.S. Army Engineer Waterways Engineer Station: Vicksburg, MS, USA, 1999. [Google Scholar]
  15. Ning, W.; Li, J.; Xuan, G.X.; Guo, C.; Huang, Y. Layout and hydraulic model test research on the water conveyance system of the second-line ship lock of Honghua on Liujiang River. Port Waterw. Eng. 2017, 10, 154–159. [Google Scholar]
  16. Kan, Y.J.; Li, J.; Xuan, G.X.; Xu, X.M.; Zhao, Y.H. Hydraulic model test of the water conveyance system of Shushan Pumping Station Hub Ship Lock. Port Waterw. Eng. 2017, 9, 126–130+143. [Google Scholar]
  17. Tom, R.P.; Roux, S.; De Regge, J.; Wong, J.; De Mulder, T. Physical Model for the Filling and Emptying System of the Third Set of Panama Locks; CNR—Consorcio Pos Panamax: Paris, France, 2008. [Google Scholar]
  18. Hammack, E.A.; Stockstill, R.L. 3D numerical modeling of lock filling systems for hydraulic efficiency optimization. J. Hydraul. Eng. 2020, 146, 04020065. [Google Scholar]
  19. Yang, Z.C.; Yang, B.; Chen, M.D.; Hu, X.M. Simulation research on the hydraulic characteristics during the valve opening process of high-head ship locks. J. Chongqing Jiaotong Univ. (Nat. Sci.) 2009, 28, 758–762. [Google Scholar]
  20. Yang, Z.C.; Yang, B.; Chen, M.D.; Hu, X.M. Three-dimensional numerical simulation of the shape optimization of the valve section of high-head ship locks. Adv. Water Resour. Sci. Technol. 2010, 30, 10–13. [Google Scholar]
  21. Stockstill, R.L.; Berger, R.C. A three-dimensional numerical model for flow in a lock filling system. In Proceedings of the Great Rivers: World Environmental and Water Resources Congress, Kansas City, MS, USA, 17–21 May 2009; pp. 2737–2746. [Google Scholar]
  22. Badano, N.D.; Menéndez, Á.N. Numerical modeling of Reynolds scale effects for filling/emptying system of Panama Canal locks. Water Sci. Eng. 2021, 14, 237–245. [Google Scholar] [CrossRef]
  23. Tornstrom, T. Flow and Thermal Characteristics of Warm Plane Air Jets (Measurements and Predictions using Different k-ε models). In Proceedings of the Tenth International Conference on Computational Methods and Experimental Measurements, Alicante, Spain, 4–6 June 2001; pp. 33–44. [Google Scholar]
  24. Zhang, L.P. The 3D Flow Numerical Simulation Study on High-Lift Lock. Ph.D. Thesis, Chongqing Jiaotong University, Chongqing, China, 2008. [Google Scholar]
  25. Chen, M.; Liang, Y.C.; Xuan, G.X.; Chen, M.D. Dynamic simulation research on the three-dimensional hydraulic characteristics during the ship lock water conveyance process. J. Hydrodyn. Ser. A 2013, 28, 559–565. [Google Scholar]
  26. Chen, M.; Liang, Y.C.; Xuan, G.X.; Chen, M.D. Numerical simulation of the mooring force of ships in the lock chamber during the water conveyance process. J. Ship Mech. 2015, 1, 78–85. [Google Scholar]
  27. Dodaro, G.; Tafarojnoruz, A.; Stefanucci, F.; Adduce, C.; Calomino, F.; Gaudio, R.; Sciortino, G. An experimental and numerical study on the spatial and temporal evolution of a scour hole downstream of a rigid bed. In River Flow 2014; CRC Press: London, UK, 2014. [Google Scholar]
  28. Calomino, F.; Alfonsi, G.; Gaudio, R.; D’Ippolito, A.; Lauria, A.; Tafarojnoruz, A.; Artese, S. Experimental and Numerical Study of Free-Surface Flows in a Corrugated Pipe. Water 2018, 10, 638. [Google Scholar] [CrossRef]
  29. Lauria, A.; Alfonsi, G.; Tafarojnoruz, A. Flow Pressure Behavior Downstream of Ski Jumps. Fluids 2020, 5, 168. [Google Scholar] [CrossRef]
  30. Hirt, C.W.; Nichols, B.D. Volume of fluid (VOF) method for the dynamics of free boundary. J. Comput. Phys. 1981, 39, 201–225. [Google Scholar] [CrossRef]
  31. JTJ 306-2001; Code for Design of Ship Lock Water Conveyance Systems. China Communications Press: Beijing, China, 2001.
  32. DL/T 5244-2010; Code for Conventional Hydraulic Model Tests of Hydropower and Water Conservancy Projects. China Electric Power Press: Beijing, China, 2010.
Figure 1. Schematic diagrams of the three-dimensional mathematical model of the water conveyance system. (a) Top-view block diagram; (b) elevation-view block diagram; (c) overall solid diagram; (d) grid-division diagram.
Jmse 13 00784 g001
Figure 2. Verification process of filling and emptying of the ship lock water conveyance system. (a) Filling process curve; (b) emptying process curve.
Jmse 13 00784 g002
Figure 3. Physical model and representative ship model. (a) Overall physical model of the ship lock hydraulic test; (b) test ship model; (c) valve opening and closing system and sensors.
Jmse 13 00784 g003
Figure 4. Sensor arrangement diagrams of the valve corridor. (a) Upstream valve corridor; (b) downstream valve corridor.
Jmse 13 00784 g004
Figure 5. Schematic diagram of the water filling corridor optimization. (a) Original design configuration; (b) optimized configuration.
Jmse 13 00784 g005
Figure 6. Pressure process line at the top of the corridor behind the filling valve. (a) Designed scheme; (b) optimized scheme.
Jmse 13 00784 g006
Figure 7. Pressure process line at the top of the corridor behind the emptying valve.
Jmse 13 00784 g007
Figure 8. Pressure process lines of typical measuring points at the bend confluence of the filling corridor and the main bottom corridor of the lock.
Jmse 13 00784 g008
Figure 9. Local flow field diagrams of the designed and optimized shape schemes. (a) Plane plow pield of the designed scheme; (b) plane flow field of the optimized scheme; (c) elevation flow field of the designed scheme; (d) elevation flow field of the optimized scheme.
Jmse 13 00784 g009
Figure 10. Flow patterns of the emptying valve corridor section of the optimized scheme: (a) at the moment of minimum pressure (Tpmin); (b) at the moment of maximum p (Tpmax).
Jmse 13 00784 g010
Figure 11. Flow patterns of typical sections during the emptying process at the moment of maximum flow rate (TQmax). (a) Bottom corridor; (b) emptying corridor and below the grid.
Jmse 13 00784 g011
Figure 12. Chamber filling process of the ship lock water conveyance system. (a) Before chamber filling; (b) after chamber filling.
Jmse 13 00784 g012
Figure 13. Chamber emptying process of the ship lock water conveyance system. (a) Before chamber emptying; (b) after chamber emptying.
Jmse 13 00784 g013
Figure 14. Hydraulic characteristic curves of the lock chamber. (a) Filling process; (b) emptying process.
Jmse 13 00784 g014
Figure 15. Pressure process lines at the top of the corridor in front of and behind the filling valve: (a) 3 min; (b) 4 min; (c) 5 min; (d) 6 min.
Jmse 13 00784 g015
Figure 16. Pressure process lines at the top of the corridor in front of and behind the emptying valve: (a) 3 min; (b) 4 min; (c) 5 min; (d) 6 min.
Jmse 13 00784 g016
Figure 17. Mooring force process lines during water conveyance when the ship model is moored in the middle of the lock chamber. (a) Filling process; (b) emptying process.
Jmse 13 00784 g017
Table 1. Verification results of the accuracy of the three-dimensional mathematical model.
ItemsFilling ProcessEmptying Process
Filling Completion Time (s)Maximum Discharge (m3/s)Emptying Completion Time (s)Maximum Discharge (m3/s)
Numerical Simulation Results631216.29589220.45
Physical Model Results648208.18600229.27
Deviation−2.59%3.90%1.80%−3.85%
Table 2. Navigable water levels of the Bailongtan Ship Lock.
Upstream Navigable Water Level (m)Downstream Navigable Water Level (m)
Upstream navigable water level126.00//
Highest upstream navigable water level131.73Highest downstream navigable water level127.48
Lowest upstream navigable water level (m)125.00Lowest downstream navigable water level110.00
Table 3. Characteristic parameter table of chamber filling process.
Calculation SchemeFilling Process
Designed SchemeOptimized Scheme
Filling completion time T0 (s)625631
Time of maximum flow rate TQmax (s)296277
Maximum flow rate Qmax (m3/s)221.92216.29
Sectional velocity of valve corridor at maximum flow rate VQmax (m/s)6.946.76
Maximum velocity of grid section Vmax (m/s)1.481.44
Inertial super-elevation of water surface H0 (m)0.260.24
Table 4. Statistics of the pressures on the inner and outer side walls of the horizontal turning section corridor under different calculation schemes.
Water Conveyance MethodCalculation SchemeTypical MomentInner Side Wall Pressure Head/mOuter Side Wall Pressure Head/mPressure Head Difference Between Inner and Outer Sides/m
Filling processDesigned schemeTQMAX14.3319.68 m5.35
Optimized scheme14.4918.814.32
Designed schemeTPMIN6.2910.183.89
Optimized scheme7.759.271.52
Table 5. Hydraulic characteristic values of chamber water conveyance under the working condition of a head difference of 16 m.
Valve Opening Time (min)Filling/Emptying Time (s)Maximum Flow Rate (m3/s)Maximum Average Sectional Velocity of Inlet (m/s)Maximum Sectional Velocity of Valve Corridor (m/s)Inertia Ultra-High/Over-Low Value (m)
Filling3590233.291.567.290.12
4621220.261.476.880.11
5648208.181.396.510.08
6670196.651.316.150.10
Emptying3574256.30-8.01−0.17
4586244.94-7.65−0.13
5600229.27-7.16−0.16
6610219.17-6.84−0.15
Table 6. Extreme values of mooring cable forces during the water conveyance process in different parts of the ship model berthing chamber.
Water Conveyance TypeShip Berthing PositionLongitudinal Force/kNBow Lateral Force/kNStern Lateral Force/kN
FillingFront17.465.298.47
Middle29.8110.479.53
Rear31.8111.649.00
EmptyingFront13.769.009.35
Middle22.767.4111.64
Rear24.879.538.47
Disclaimer/Publisher’s Note: The statements, opinions and data contained in all publications are solely those of the individual author(s) and contributor(s) and not of MDPI and/or the editor(s). MDPI and/or the editor(s) disclaim responsibility for any injury to people or property resulting from any ideas, methods, instructions or products referred to in the content.

