Article

The Phytoplankton Community Exhibited Restored Species Diversity but Fragile Network Stability Under Potential Sustainable Aquaculture Approach of Marine Ranching

1
School of Pharmacy, Binzhou Medical University, Yantai 264003, China
2
Laboratory of Coastal Biology and Biological Resource Conservation, Yantai Institute of Coastal Zone Research, Chinese Academy of Sciences, Yantai 264003, China
3
Yantai Marine Center, Ministry of Natural Resources, Yantai 264006, China
4
Shandong Provincial Key Laboratory of Restoration for Marine Ecology, Shandong Marine Resource and Environment Research Institute, Yantai 264006, China
*
Authors to whom correspondence should be addressed.
These authors contributed equally to this work.
J. Mar. Sci. Eng. 2025, 13(5), 835; https://doi.org/10.3390/jmse13050835
Submission received: 20 March 2025 / Revised: 15 April 2025 / Accepted: 21 April 2025 / Published: 23 April 2025

Abstract

:
Mariculture is currently experiencing rapid growth in response to the rising global food demand, while simultaneously posing significant challenges to environmental issues, such as pollution stress and ecological degradation. To achieve a balance between ecosystem maintenance and seafood supply, marine ranching has flourished as a sustainable approach through the implementation of artificial reef construction, stock enhancement, and strategic releasing. However, few studies have evaluated the ecological impacts through a comparison of in situ survey data across geographical areas. Phytoplankton are vital organisms in marine ecosystems that function as essential indicators of seawater quality and biological diversity, reflecting environmental health and ecological sustainability. In this study, we investigated the species diversity, community structure, and co-occurrence network of phytoplankton based on 175 samples collected from 75 sites encompassing all 26 marine ranching seawater areas, along with their corresponding surrounding areas in Yantai’s coastal sea. A total of 112 species were identified across three phyla of diatoms, dinoflagellates, and chrysophytes; among them, diatoms dominated the community with a notably high proportion of 98.83%. Their diversity and structure exhibited significant variations across different seasons and geographic locations. Moreover, no preference was observed between the marine ranching seawater and the surrounding areas. Nevertheless, a co-occurrence network analysis demonstrated that lower values for average degree, clustering coefficient, and average path length were exhibited in marine ranching, indicating that aquaculture activities have reduced connectivity among potential interactions. Additionally, it showed reduced stability as indicated by the remaining nodes and the natural connectivity indices, regardless of the proportion of nodes removed. These findings illustrate that while marine ranching processes can mitigate species losses with maintaining phytoplankton community structure, they still alter association among species and reduce overall stability. This research recommends that scientifically informed expansion of marine ranching necessitates robust environmental monitoring datasets and systematic validation to ensure holistic sustainability.

Graphical Abstract

1. Introduction

Mariculture has experienced rapid global growth due to the extensive utilization of land resources and the growing demand for high-quality food. According to the State of World Fisheries and Aquaculture 2024, marine and coastal aquaculture production reached 42.9 million tons in 2022, accounting for approximately 19.2% of total fisheries and aquaculture production. However, massive expansion of mariculture has resulted in escalating pressures on the surrounding environment [1]. Intensive mariculture practices have led to an elevated nitrogen concentration, causing eutrophication and harmful algal blooms (HABs) in adjacent coastal waters [2]. Consequently, excessive nutrient consumption by these blooms could result in unexpected kelp mortality events due to nutritional competition. The extensive use of antibiotics poses risks of resistance selection while facilitating antibiotic resistance propagation [3]. Scallops’ excretion of bioavailable dissolved organic carbon (DOC) could accelerate dissolved oxygen (DO) depletion through decomposition, thereby promoting in situ hypoxia occurrence.
To address adverse issues, marine ranching has developed as an important solution for promoting the cultivation and preservation of seafood resources, restoring marine eco-environment conditions, and ensuring sustainable exploitation of marine resources [4]. Its primary operation involves releasing substantial quantities of hatchery-reared juveniles into the sea to undergo feeding and growth processes by preying on natural food sources. Subsequently, these fish are recaptured to augment the overall biomass of the fishery and facilitate stock enhancement [5,6]. Artificial reefs, considered a proactive approach to assist ecosystem rehabilitation, have been proven to not only improve fisheries production and fish species diversity but have also worked as a management tool to protect seabed habitats [7,8]. Since the 1980s, China began to explore marine ranching through widespread implementation of proliferation and release activities, as well as conducting experiments on artificial reefs. As of 2021, there were 153 national-level marine ranching demonstration areas established along the coastal line of 11 provinces in China, with a total coverage area reaching approximately 2.58 × 10³ km2 [9]. Although the instrumental role of marine ranching in environmental improvement is widely acknowledged, there remains a scarcity of studies employing traditional survey methods to substantiate its ecological impacts. Such research is essential not only for comprehending the response characteristics of marine ecosystems but also for fostering more effective methods towards sustainable development [10].
Phytoplankton play a vital role as primary producers and energy capturers in aquatic ecosystems, with their community characteristics being highly sensitive to environmental fluctuations. Therefore, they serve as efficient bio-indicators for assessing environment changes [11]. The community succession of phytoplankton revealed that the dominant species in the aquaculture system underwent changes attributed to an increase in salinity and a decrease in silicate concentrations [12]. Changes in water transparency resulting from different cultivated organisms significantly influence the abundance, diversity, and light availability of phytoplankton [13]. Evaluating the health status of sea areas can be achieved by analysis of phytoplankton abundance and diversity, which effectively assesses the ecological effects of modern marine ranching. For example, higher phytoplankton abundance was observed in a seaweed farm, attributed to improved water clarity and enhanced water column stability during seaweed cultivation [14]. Grazing pressure can shift phytoplankton communities from diatom-dominated to dinoflagellate-dominated types with potential adverse impacts on scallop health [15]. Furthermore, it reflects whether modern marine ranching can create ecological conditions similar to natural water bodies while maintaining marine ecosystems diversity and stability [16,17]. A co-occurrence network based on a Spearman correlation analysis is a robust tool for investigating the community or cross-community level responses to environmental disturbance, which provides comprehensive insights into biotic interactions, such as food web, quorum sensing, and niche competition [18,19]. By utilizing a co-occurrence network analysis, it has been demonstrated that aquaculture activities conducted within artificial reefs promote more intricate interactions among phytoplankton communities and enhance their resilience to external environmental disturbances. For instance, artificial reefs increased the modularity coefficients of microorganisms networks, which may lead to niche differentiation in artificial reefs, indicating that artificial reefs affect the ecosystem complexity and stability [20].
Mariculture had been practiced in Yantai since the mid-20th century, benefiting from its favorable geographical conditions and climatic conditions. The extensive offshore aquaculture and excessive fishing activities had greatly boosted the output value of marine fisheries, while they had also led to coastal environmental deterioration and posed threats to fish resources. In response, Yantai initiated the construction of marine ranching activities. By 2022, a total of 46 marine ranches covering over 900 km2 had been established, including 20 national marine ranching demonstration areas, accounting for one-eighth of marine ranches nationwide. Integrated multi-trophic aquaculture is commonly adopted as an approach that combines species cultivation, such as sea cucumber, sea urchin, scallop, and abalone, with non-fed shellfish and algae as ecological components to mitigate eutrophication in coastal waters [21]. Shellfish utilize phytoplankton and particulate organic matter as a food source, leading to significant depletion of suspended solids and total organic carbon during the culture period, effectively mitigating eutrophication and algal bloom [22]. Seaweed can contribute to alleviating ocean acidification and deoxygenation while reducing greenhouse gas emissions [23]. To bridge the assessment gap regarding their ecological benefits, we extensively collected samples from 75 representative sites situated within or outside marine ranches. This study characterizes seasonal, geographic, and regional variations in the composition and diversity of phytoplankton communities, as well as elucidates species interactions and community stability through the construction of ecological network patterns, proposing the hypothesis that the construction of marine ranches can maintain the biodiversity and community structure of local marine ecosystems. The stability of a co-occurrence network exhibits seasonal variation, while mariculture activities within the marine ranching systems exert measurable influences on this stability to some extent. Our findings provide valuable insights into the response of phytoplankton communities to aquaculture operations in marine ranching ecosystems. The results establish a scientific foundation for formulating sustainable development strategies and improved management practices in future marine ranching planning and operation.

2. Materials and Methods

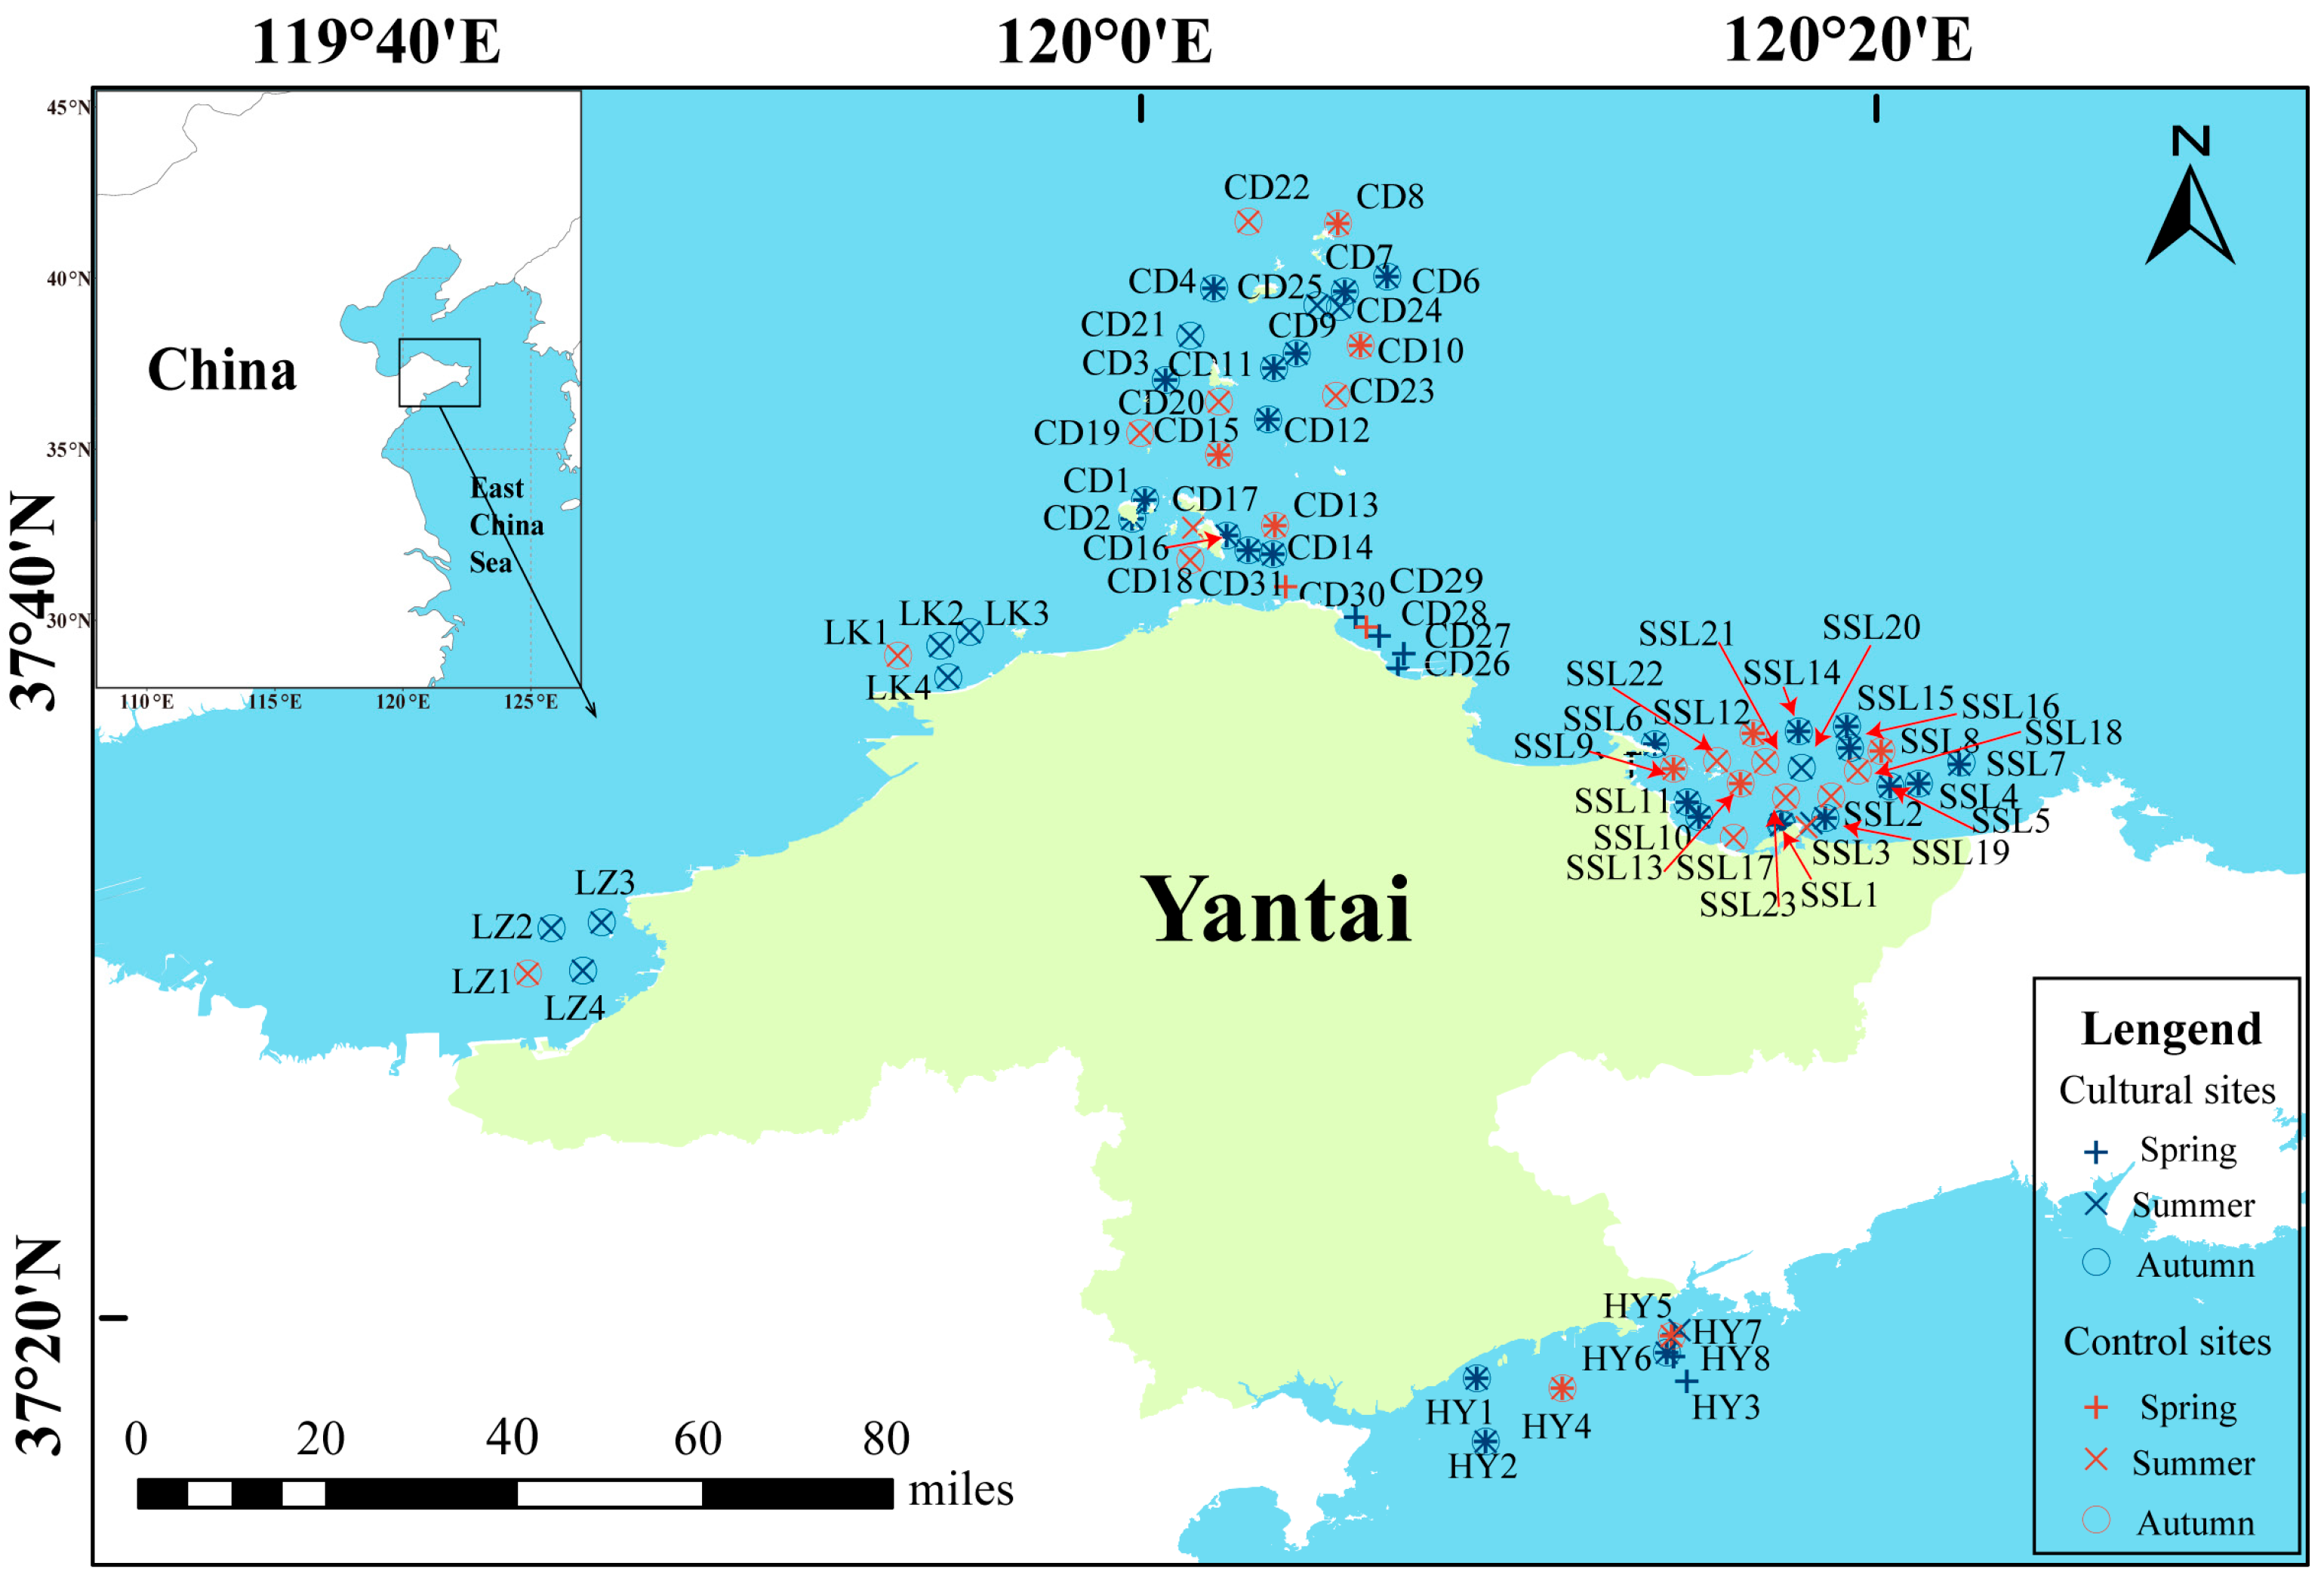
2.1. Description of the Study Area

The Yantai coastal area is situated in the northern Shandong Peninsula, China (36°53′–38°32′ N, 119°68′–121°82′ E), characterized by regular semi-diurnal tides and mainly affected by water masses from the Yellow Sea Cold Water Mass [24]. It is also a typical temperate zone, with the water temperature in spring, summer, and autumn ranging from 7.9 to 17.1 °C, 21.8 to 26.8 °C, and 14.6 to 18.5 °C, respectively. The water quality here is not only affected by mariculture but also by industrial, agricultural, and domestic sewage discharges by surrounding districts. The mean nutrient concentrations of NH4+, NO2, NO3, and PO43− during the study period were 26.72 μg/L, 23.50 μg/L, 62.26 μg/L and 15.38 μg/L, respectively, which adhere to Grade-II seawater quality standards. Moreover, higher nutrient levels were observed in Longkou Bay (LK). Red tide occurrences were frequently observed from May to September, as reported in the Communiques of Marine Environmental Quality of Yantai.
The entire investigation area of this study encompasses the coastal zones of five major bays: Sishili Bay (SSL), Changdao Island (CD), Laikou Bay (LK), Laizhou Bay (LZ), and Haiyang Bay (HY) (Figure 1). The seawater in SSL experiences limited exchange with long retention time due to its special seabed terrain. This leads to an annual occurrence of bottom hypoxia during summer, triggered by the decomposition of mariculture deposits, which negatively impact the zooplankton community by reducing their abundance and diversity levels [25]. CD is characterized by a greater depth compared to the other areas, reaching up to 25 m, with a maximum depth of 43 m. It boasts extensive offshore deep-water marine ranching that provides excellent aquatic conditions and abundant fishery resources. LZ is one of the largest bays in the Bohai Sea region. Its physical and hydrological features are influenced by river outflows, including those from Wei River, Bailang River, Jiaolai River, and Xiaoqing River, which exert great impacts on phytoplankton dynamics and food webs [26]. Additionally, since the 1990s, there has been severe water pollution in LZ due to rapid growth in aquaculture enterprises.

2.2. Sampling Collection

Three sampling studies were conducted during the spring (April to May), summer (August to September), and autumn (October to November) of 2022. The survey areas selected for the spring expedition included SSL, CD, and HY. To gain a comprehensive understanding of marine ranching in Yantai, the LK and LZ areas were considered for the summer and autumn expeditions. A total of 45 representative sampling sites were chosen from various marine ranching areas (MA), while 30 sites were selected from adjacent control areas (CA). The dataset comprises 175 samples, including 48 collected during spring and 63 during summer and autumn. We compared variation in phytoplankton abundance and composition between MA (inside) and CA (outside) to assess the impact of aquaculture activities on the phytoplankton community.

2.3. Phytoplankton Cell Enumeration

The phytoplankton community structure was analyzed using traditional morphological identification methods. Phytoplankton samples were collected using vertical net hauls (the pore diameter was 0.077 mm). The phytoplankton abundance was determined in 250 mL water samples preserved with 1.0–1.5% of Lugol’s iodine solution, stored in Niskin bottles, and transported to the laboratory for analysis of phytoplankton abundance and composition by inverted microscopy (OLYMPUS IMT-2).
After a minimum of 24 h of sedimentation, the samples were concentrated to a volume of 100–150 mL. Subsequently, 0.5 mL of each sample was uniformly siphoned onto the counting plate for enumeration and identification. The Utermöhl method was employed to count phytoplankton cells at magnifications of 200× and 400×, depending on the specific phytoplankton taxa under consideration. The identification of phytoplankton taxa was carried out at the species level. The phytoplankton density was calculated by the number of algae cells per liter of seawater (cells/L).

2.4. Statistical Analysis

The study area was plotted by ArcGIS 10.8. All statistical analyses were performed using R software (version 4.3.0) in the RStudio environment. Species absolute and relative abundances were visualized in bar charts using R package ggplot2 (version 3.5.1) [27]. After transforming the species abundance data by Hellinger, non-metric multidimensional scaling (NMDS) was employed to visualize differences in phytoplankton composition on a two-dimensional plane using the ‘metaMDS’ function. Permutational multivariate analysis of variance (PERMANOVA), using the ‘adonis2’ function and a two-way analysis of similarity (ANOSIM), was conducted to identify the statistical differences of the phytoplankton communities in the seasonal, geographic, and outside/inside marine ranching groups, respectively. The analysis was based on Euclidean dissimilarity with 999 permutations by the R package Vegan (version 2.6.10) [28].
The α diversity of the phytoplankton community, encompassing Shannon (H’), Simpson (D), and Chao 1 indices, were calculated according to the following equations [29,30]:
H = i = 1 s n i N log 2 n i N
D = 1 i = 1 s n i 2 N 2
Chao   1 = s + n 1 n 1 1 2 n 2 + 1
where N is the abundance of phytoplankton, n i is the abundance of species i in each sample, s is the total number of phytoplankton species, n1 is the number of species containing only one count, and n2 is the number of species containing only two counts. Their significant variations were assessed with one-way analysis of variance (ANOVA) and Tukey’s multiple comparison test (p < 0.05).
The number of unique and shared species of phytoplankton communities across various seasons and locations were visualized by Venn diagrams. A linear discriminant analysis (LDA) effect size (LEfSe) was performed to identify the indicator species exhibiting significant differences between the groups using the MicrobiotaProcess (version 1.14.1) package in R [31].

2.5. Network Construction and Stability Analysis

A network analysis was performed using the ggClusterNet (version 0.1.0) [32] and igraph (version 2.1.4) [33] packages. To investigate the dynamics of phytoplankton ecological networks, the samples were categorized into six groups based on different seasons within or outside MA. Subsequently, phytoplankton ecological networks based on Spearman correlation were constructed using the SparCC method [34]. The correlation networks were constructed by having correlation coefficients (absolute value) greater than 0.6 and being statistically significant (p < 0.05). Then, the interactive platform Gephi (Version: 0.9.2) was utilized for visualizing the co-occurrence network and calculating its topological properties [35]. These parameters include several metrics, such as the average degree and path length, clustering coefficient, and modularity, which can provide indications for assessing the complexity and robustness of phytoplankton networks. For instance, metrics such as average degree and path length reflect the level of node association, while modularity delineates niche differentiation in a community, thereby indicating the network’s potential for division into distinct modules.
Betweenness centrality is a fundamental measure of centrality in graph theory that assesses the significance of a node based on its capacity to serve as a crucial link along the shortest paths connecting other nodes. Betweenness centrality of a node v is computed using the following expression [36]:
C B v = s , t v σ s , t v σ s , t
where v represents the set of nodes, σ(s, t) denotes the count of shortest (s, t)-paths, and σ(s, t\v) is the number of such paths that traverse through node v instead of s or t. In cases where s = t, σ(s, t) = 1 holds true; similarly, if vs, t, then σ(s, t\v) = 0.
The identification of keystone species in the topological networks was based on their high betweenness centrality and degree values [37]. Network robustness was calculated as the proportion of nodes that remained when randomly removing 50% of the nodes. The assessment of network robustness relied on the inherent connectivity between nodes in a static network [38] using the R package patchwork (version 1.3.0) [39].

3. Results

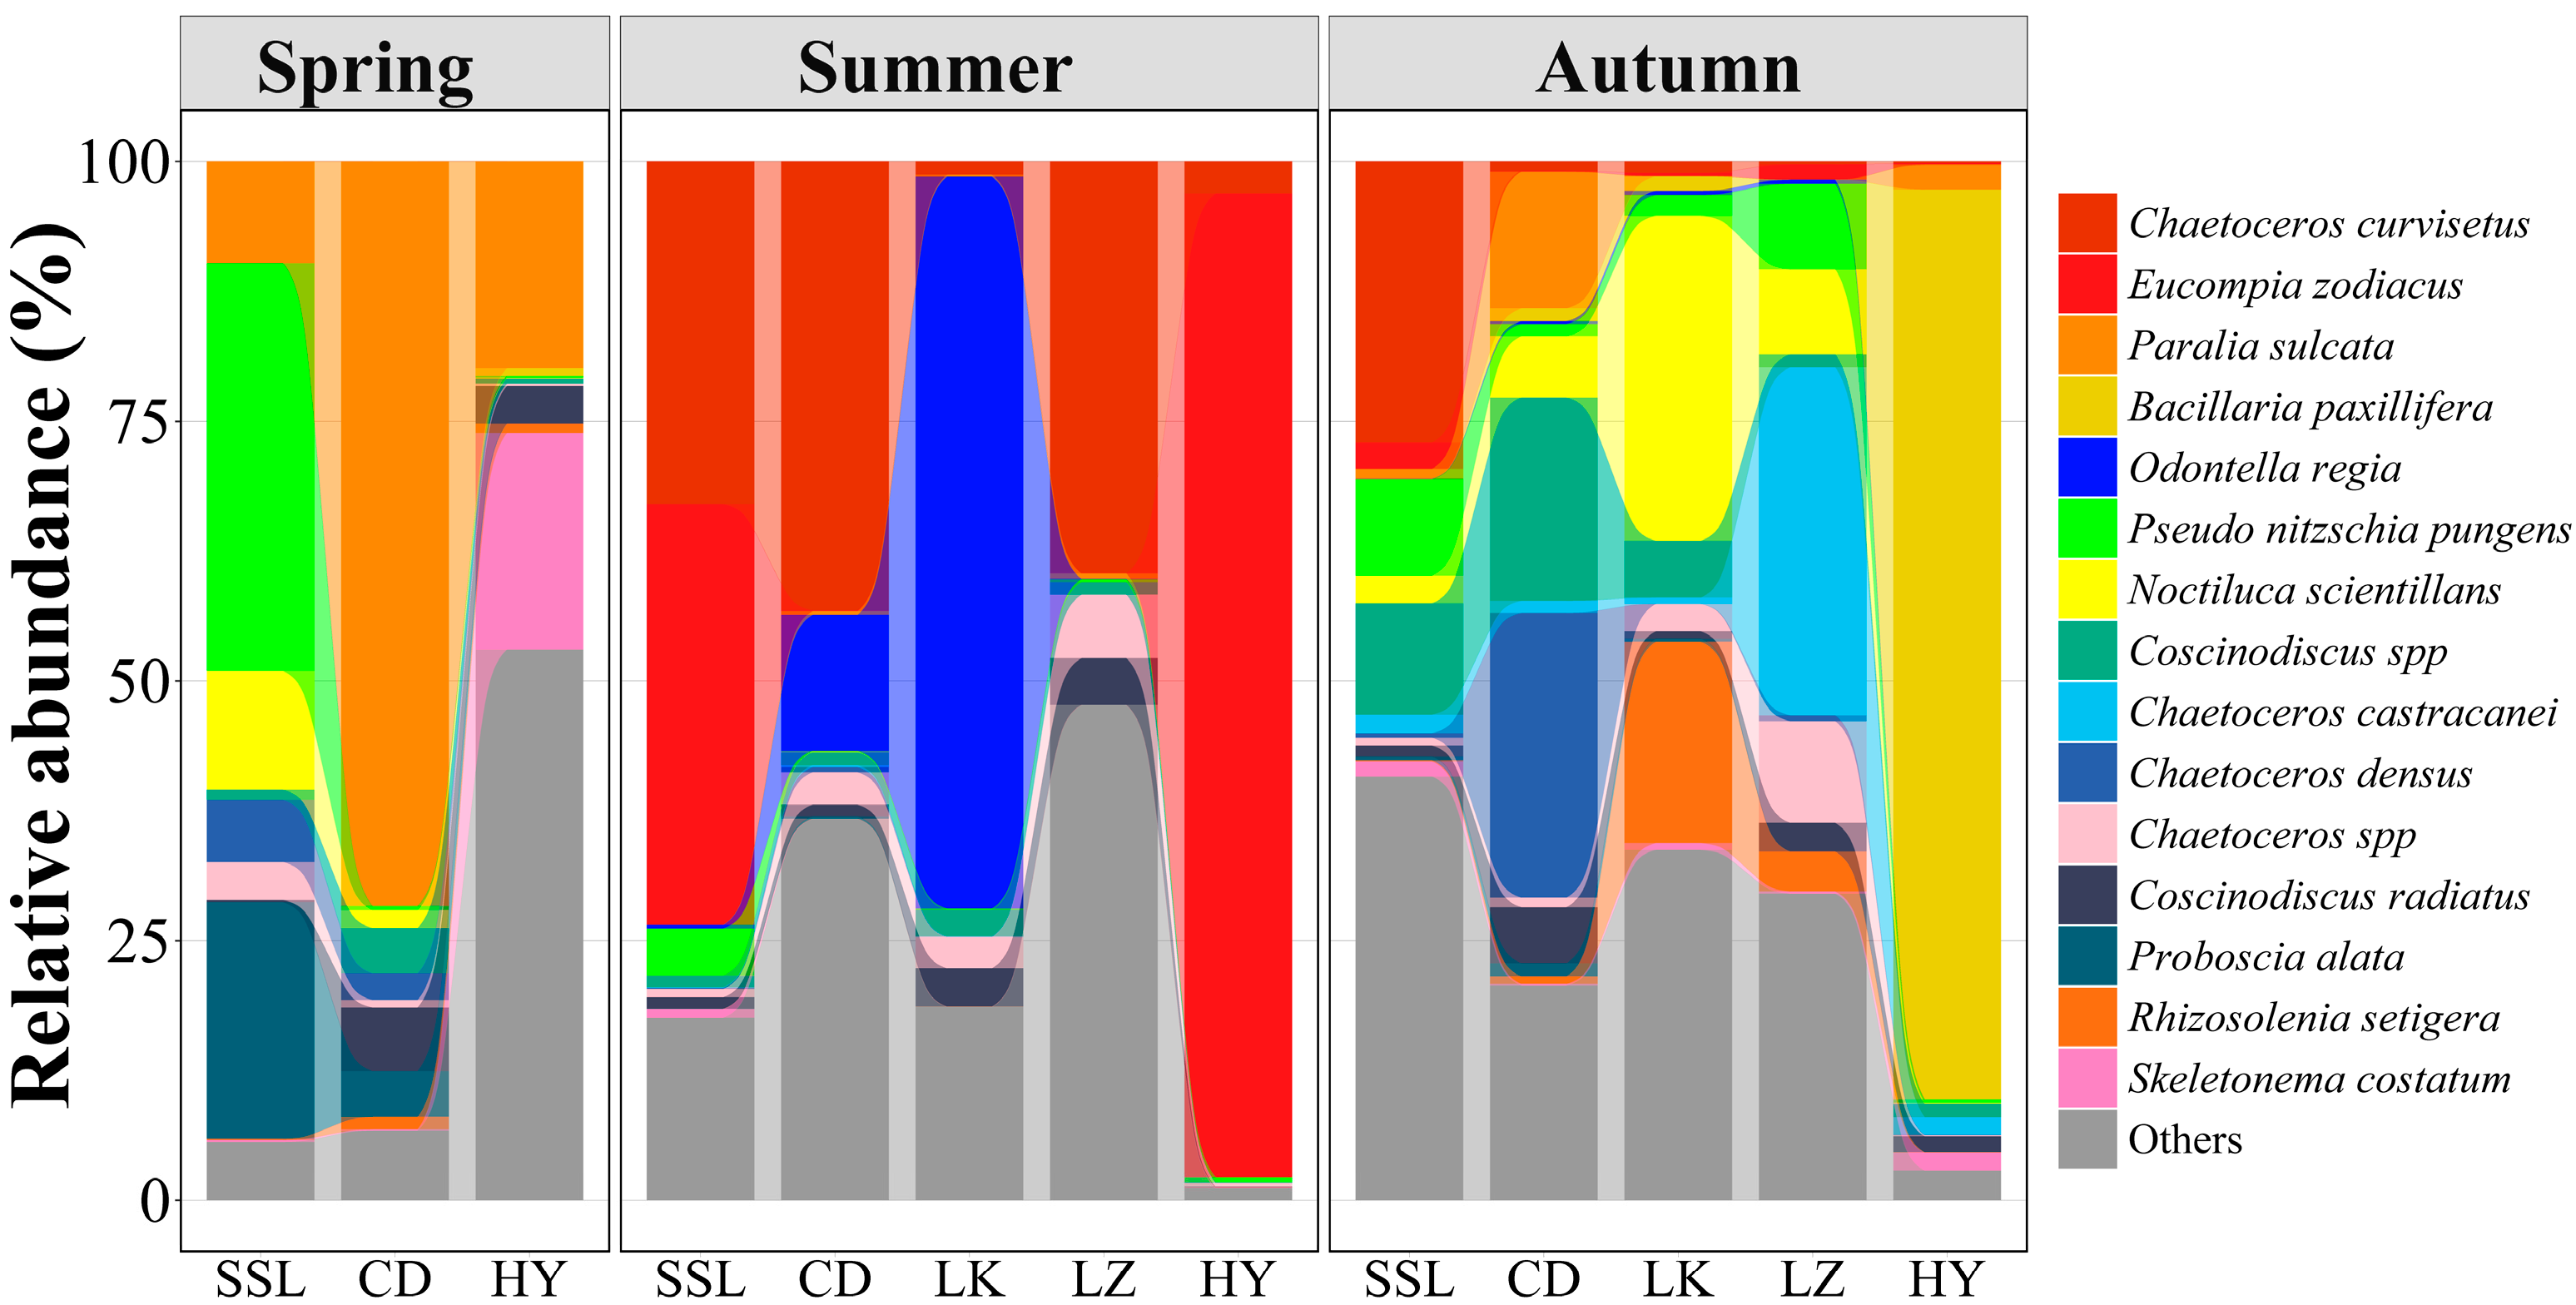
3.1. Phytoplankton Community Abundance and Composition

The phytoplankton abundance exhibited a remarkable disparity, with 105 cells/L in spring and autumn, which increased to 107 cells/L in summer (Figure 2a). Geographically, the abundance varied among the five locations in each season, with HY displaying considerably higher abundance compared to the other four locations, averaging 2.46 × 10⁸ cells/L during summer. At the phylum level classification of phytoplankton species, three domains were identified as diatoms, dinoflagellates, and chrysophytes. Diatoms contributed greatly to the total population at all the locations, accounting for approximately 98.83% of the overall abundance of phytoplankton, followed by dinoflagellates (1.15%) and chrysophytes (0.01%). The lowest and highest abundances of diatoms were recorded in HY, ranging from 2.13 × 10⁴ cells/L in spring up to 2.46 × 10⁸ cells/L in summer (Figure 2b). Dinoflagellates had lower abundances compared to diatoms, ranging from 1.15 × 10³ cells/L (HY, spring) to 6.09 × 10⁵ cells/L (CD, summer, Figure 2c). The ratios of dinoflagellates/diatoms abundance were all lower than 1 (Figure 2d). The highest cell abundance ratio of dinoflagellates/diatoms was observed in LK during autumn, accounting for 63.03%. HY had the highest abundance of diatoms and the lowest abundance of dinoflagellates (0.03% of the dinoflagellates/diatoms abundance ratio). There was quite a similar value of the ratios between MA (4.85%) and CA (4.39%).
The species’ compositions were also determined within the study area (Figure 3). A total of 112 species were identified in all of the samples. Diatoms constituted the dominant group, with 89 identified species, accounting for 79.46% of the overall phytoplankton taxa. Dinoflagellates comprised 22 identified species and accounted for 19.64% of taxa. Chrysophytes exhibited lower richness with only one species present. In spring, Paralia sulcata (46.53%), Pseudo nitzschia pungens (15.59%), and Proboscia alata (11.53%) were abundant; however, their relative abundances varied among the locations. For instance, P. pungens dominated in SSL (39.27%), P. sulcata in CD (71.66%), and Skeletonema costatum in HY (20.85%). During summer, Eucompia zodiacus and Chaetoceros curvisetus emerged as the two most dominant species, constituting 34.27% and 33.38%, respectively. E. zodiacus, with a percentage of 94.72% in HY, and C. curvisetus were evenly distributed across SSL, CD, and LZ, while Odontella regia, with a percentage of 70.45%, dominated in LK. In autumn, C. curvisetus (27.05%), Chaetoceros densus (27.43%), Noctiluca scintillans (31.29%), Chaetoceros castracanei (33.50%), and Bacillaria paxillifera (87.58%) were the most dominant species in SSL, CD, LK, LZ, and HY, respectively.
We assessed β diversity by NMDS analysis among the variation of phytoplankton community in seasonal, geographic, and outside/inside of marine ranching zones based on Euclidean distance (Figure 4). The NMDS stress represents the dissimilarity between the spatial distances formed by the samples after dimensionality reduction and their distances in the original multidimensional space. As the NMDS stress was below 0.2, the degree of difference between the samples can be accurately reflected by NMDS. The analysis of β diversity with NMDS indicated that the phytoplankton communities showed marked significant differences among the seasons (Figure 4a; Adonis, R2 = 0.06, p = 0.001; ANOSIM, R = 0.18, p = 0.001) and locations (Figure 4b; Adonis, R2 = 0.14, p = 0.004; ANOSIM, R = 0.09, p = 0.006), suggesting that seasonality and geographic location were predominant factors for separating data across the dataset. However, the distribution between MA and CA was more scattered (Figure 4c; Adonis, R2 = 0, p = 0.617; ANOSIM, R = 0.03, p = 0.208).

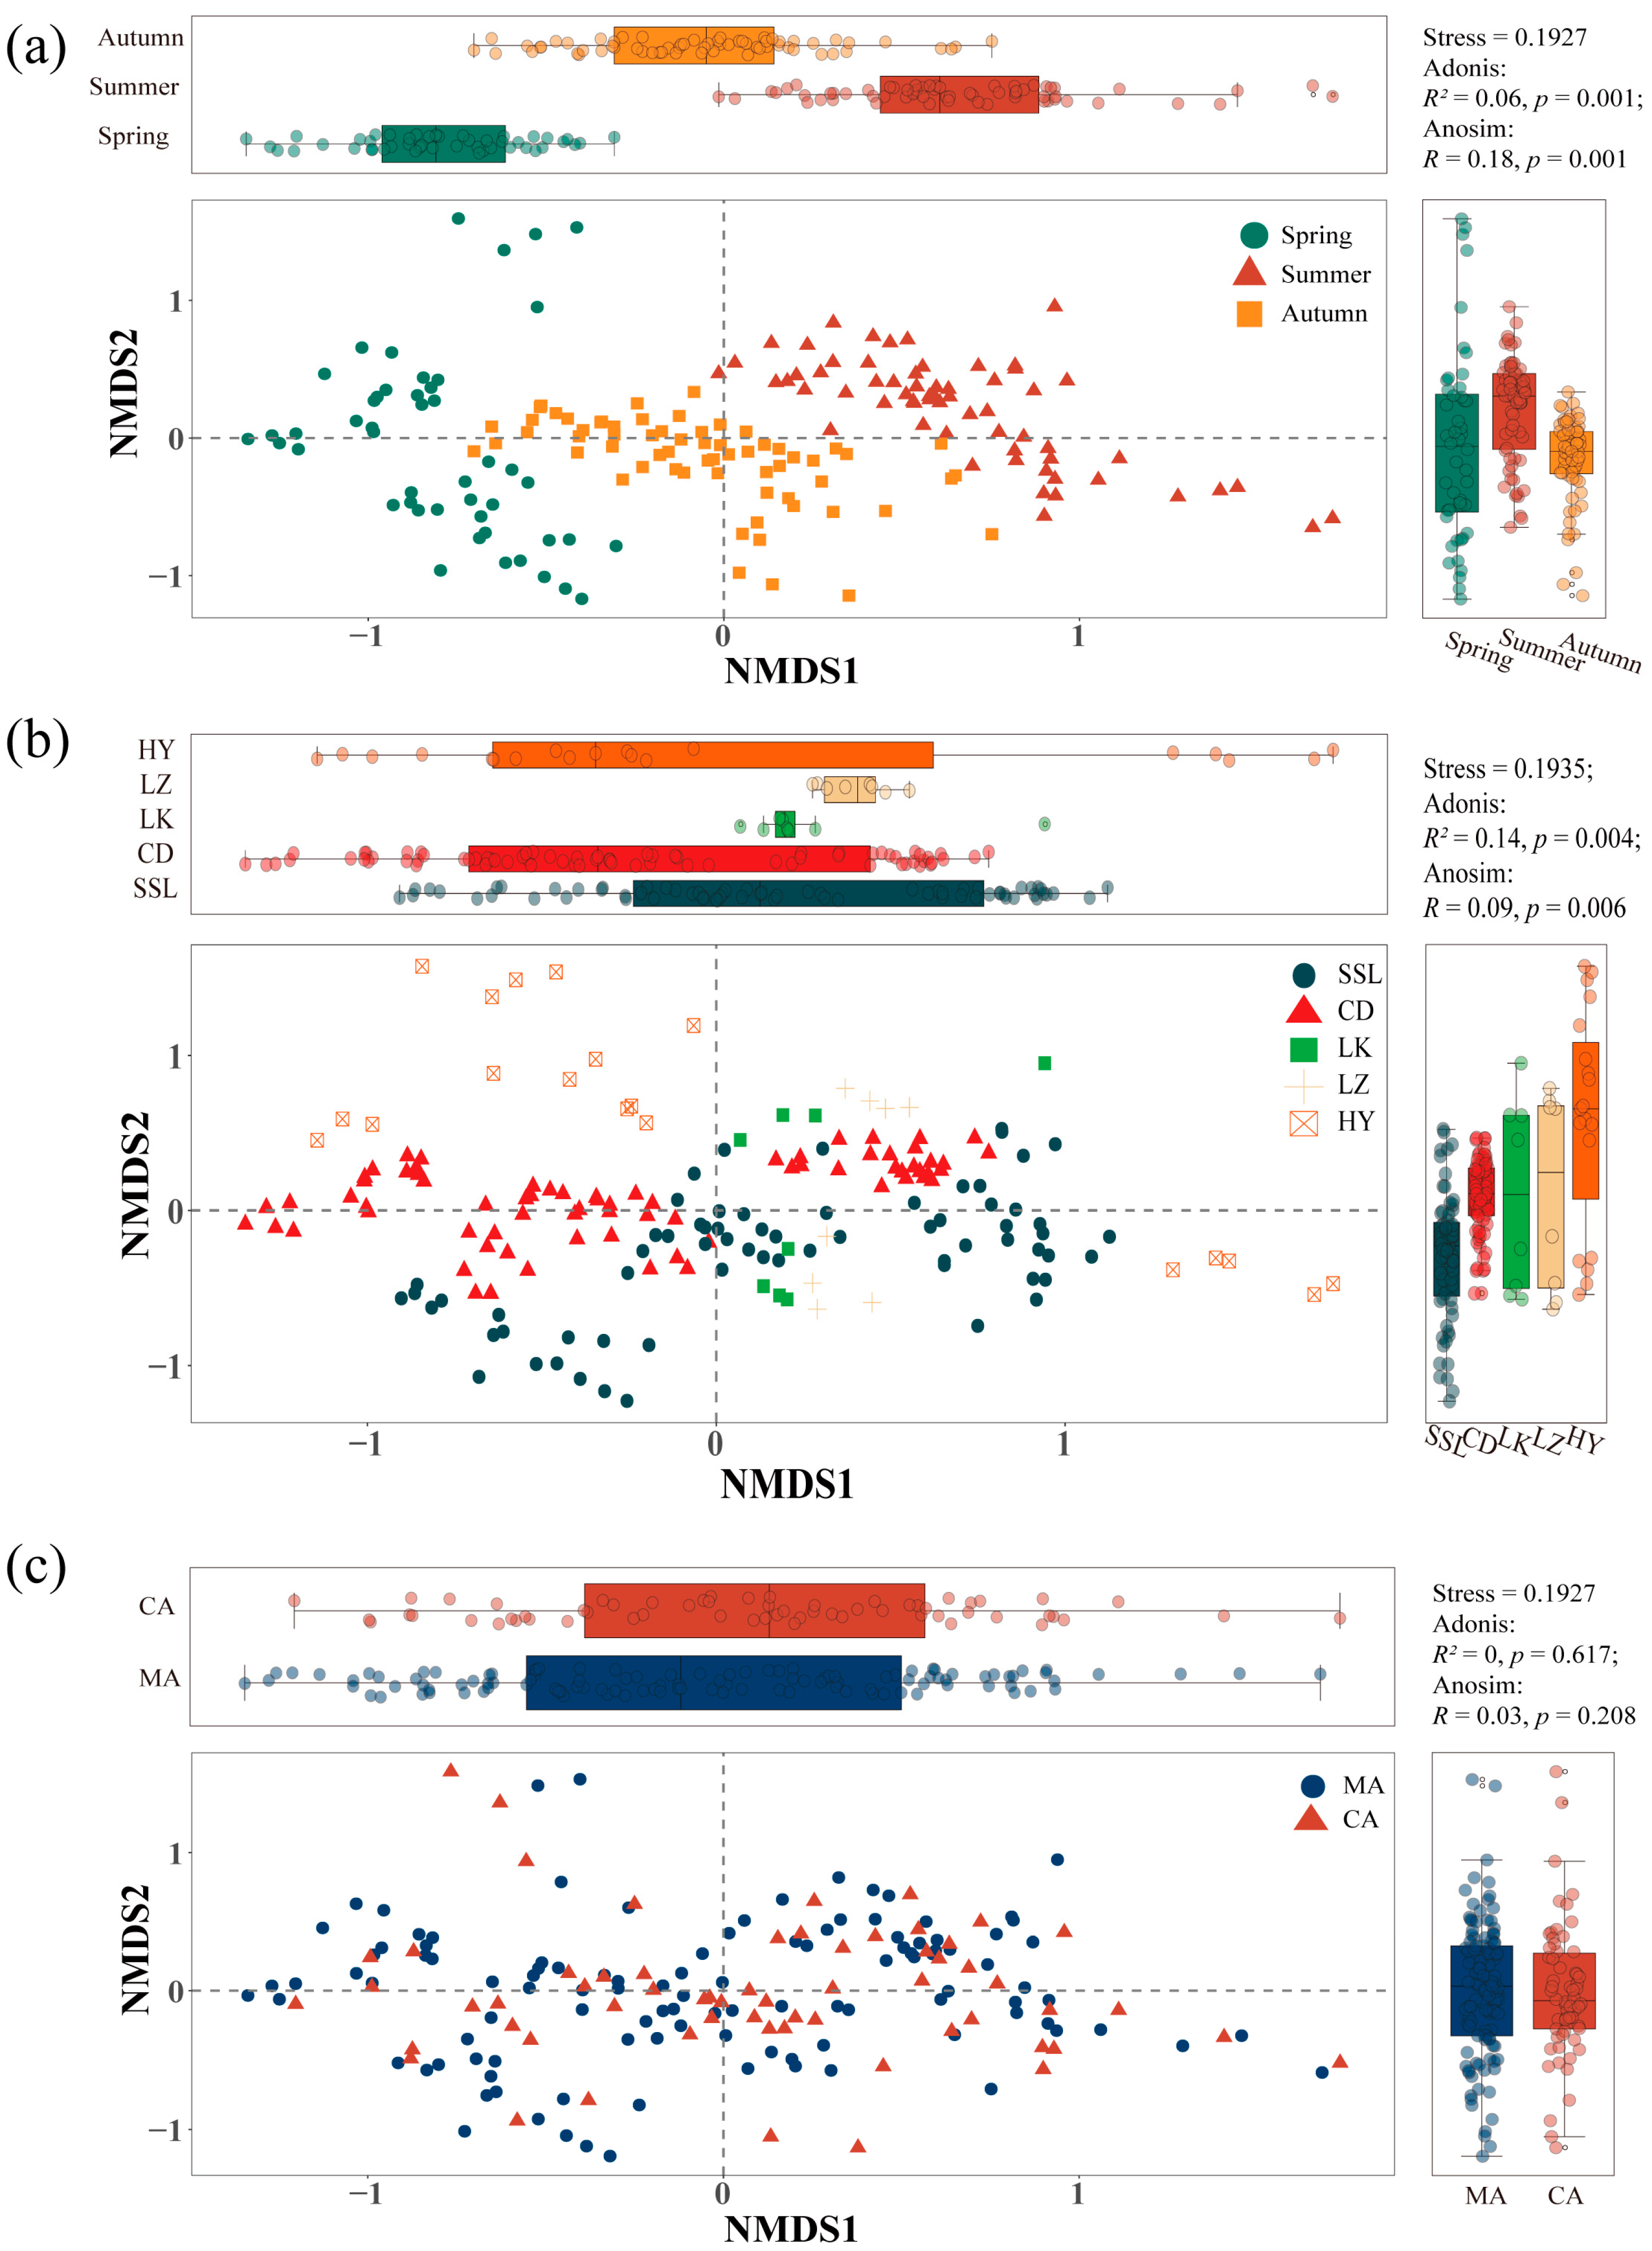
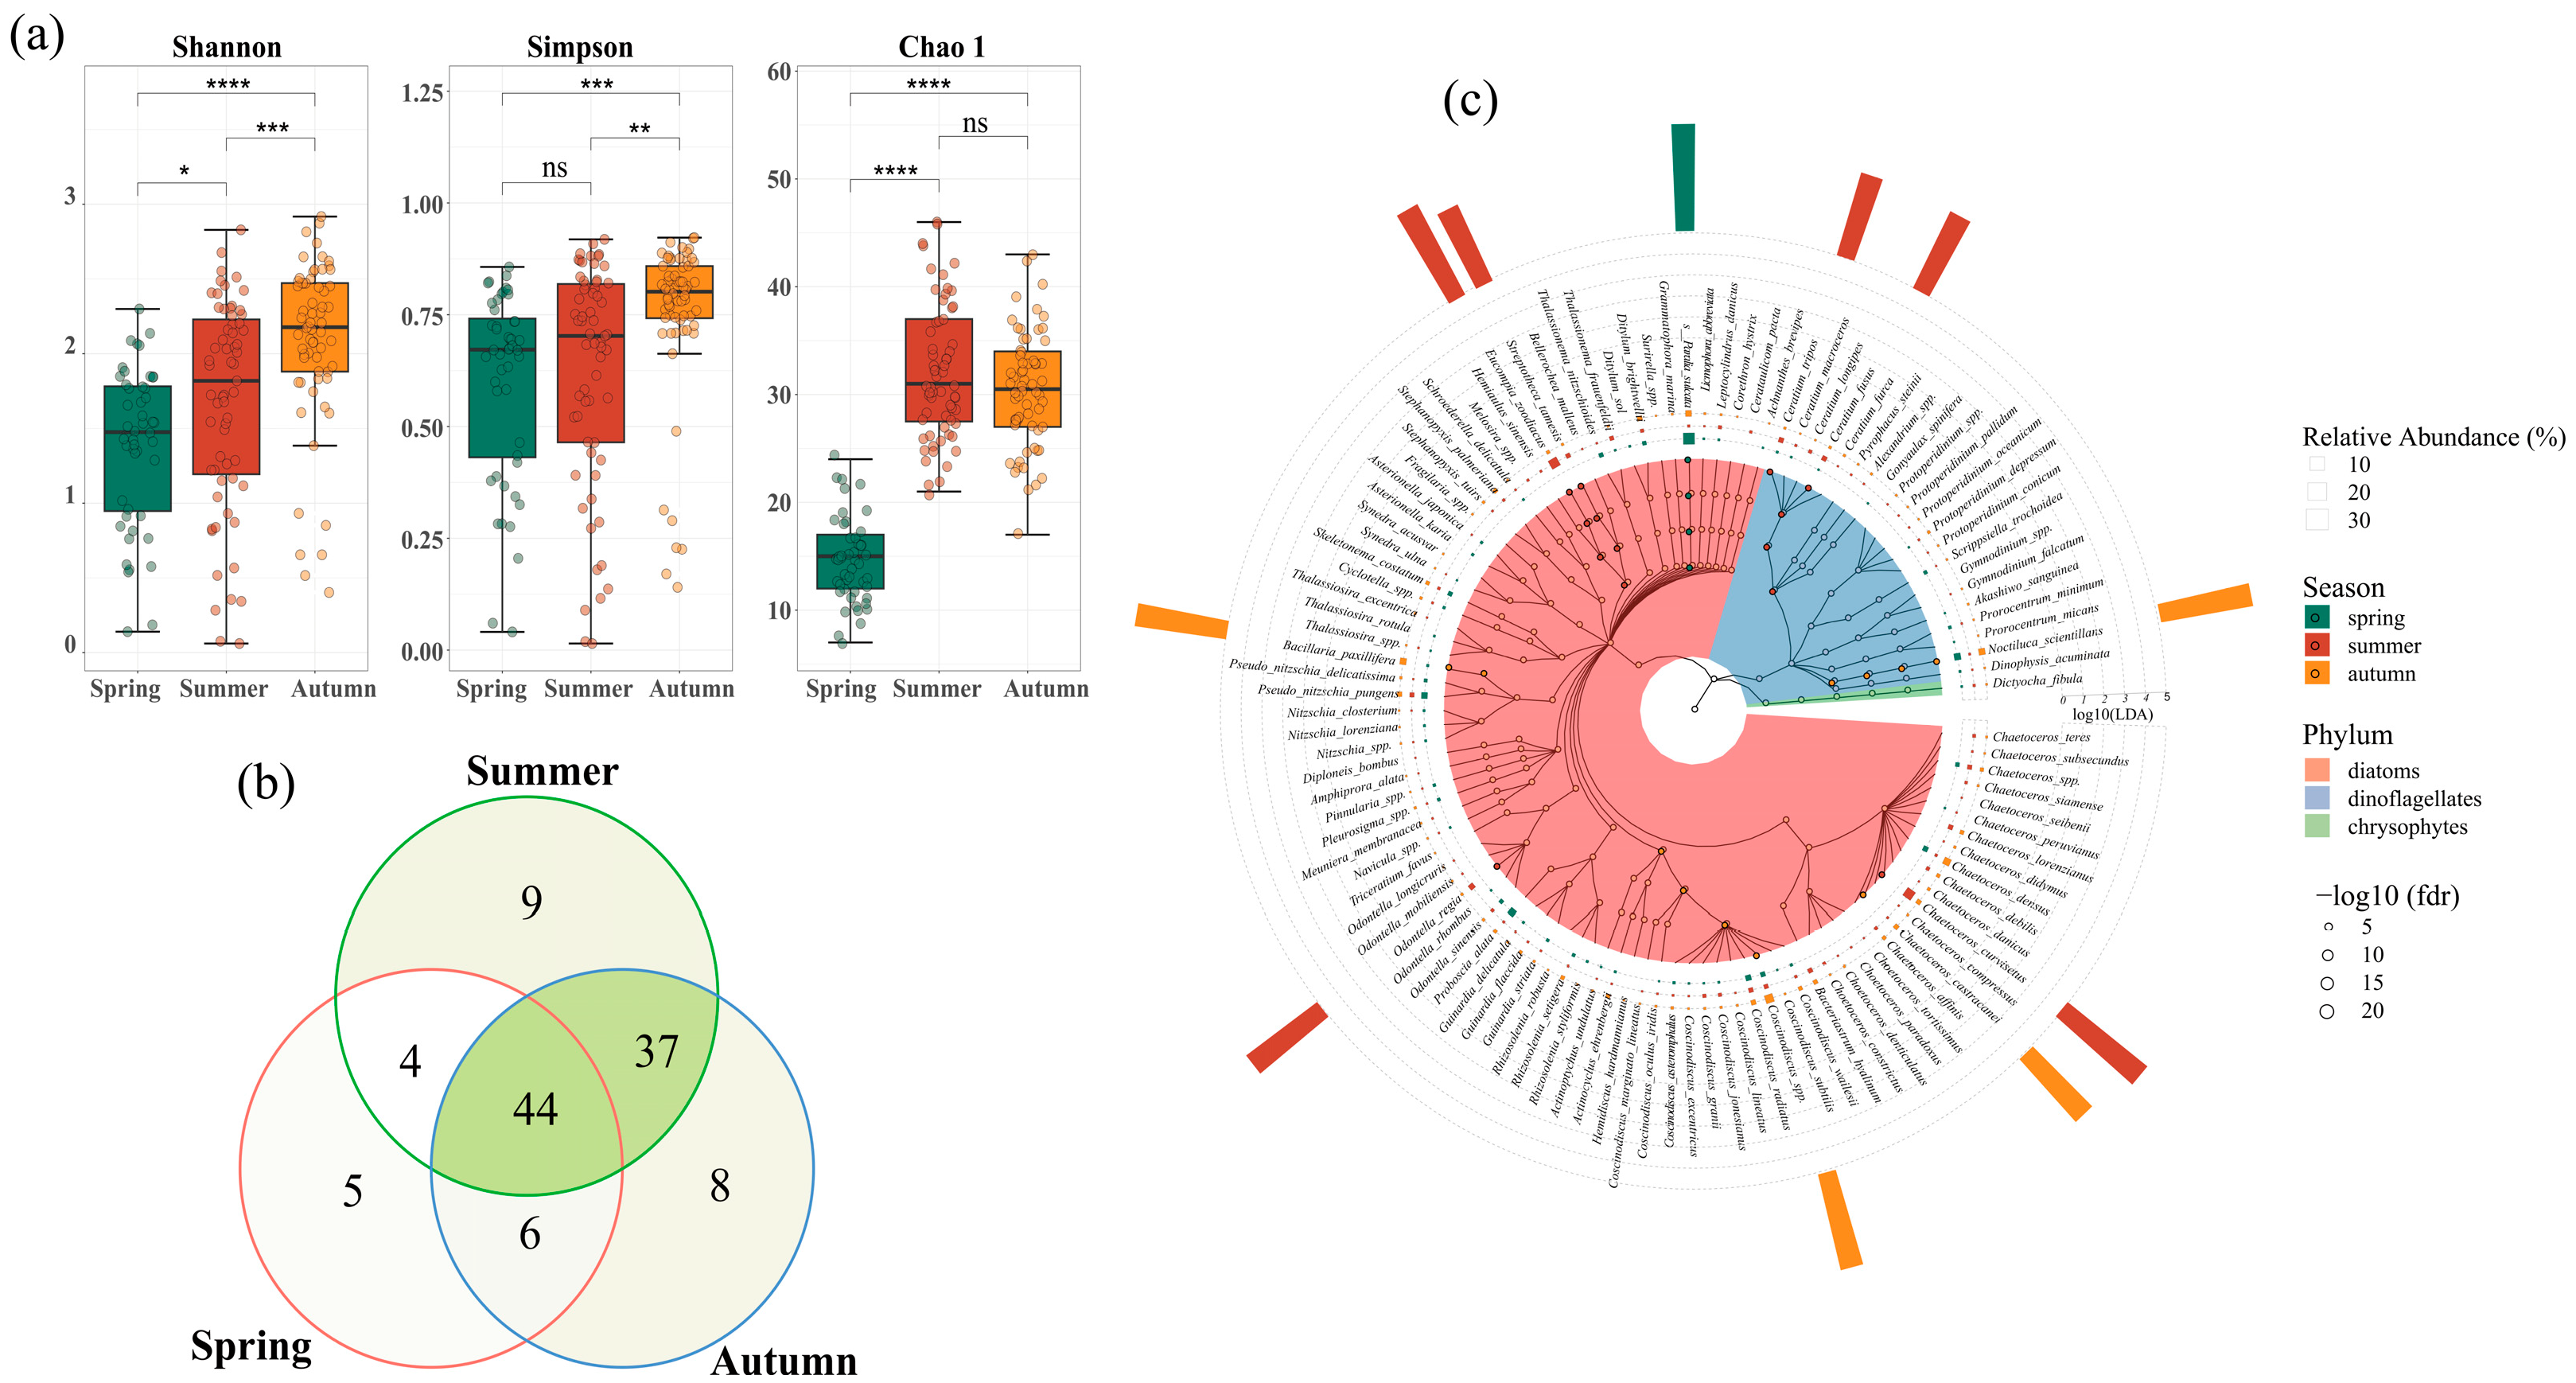
3.2. Seasonal Variations of Phytoplankton Communities

The comparison of α diversity values revealed differences in Shannon, Simpson, and Chao 1 indices of phytoplankton across the three seasons (Figure 5a). Autumn exhibited the highest Shannon index (2.08) and Simpson index (0.75), which were significantly different from those observed in spring and summer (p < 0.01). Spring showed the lowest Chao 1 index value of 14.58, which was significantly lower than that of summer (32.08) and autumn (30.45, p < 0.05). The Venn diagram demonstrated that a total of 44 species shared all three seasons, with a substantial overlap between phytoplankton composition during summer and autumn, where they shared 81 species (Figure 5b). While some species were present throughout all three seasons, others exhibited season-specific occurrences. For example, the diatom specie P. pungens was consistently detected across all three seasons, while O. regia did not occur in spring but dominated during summer.
The identification of biomarkers via LEfSe provides critical insights into spatiotemporal community dynamics, linking taxonomic shifts to ecological processes across habitats and time scales. By statistically resolving taxa that are differentially abundant in specific temporal phases or spatial niches, LEfSe reveals patterns of succession, biogeographic distribution, and environmental adaptation. The LEfSe analysis identified a total of eleven biomarkers corresponding to seasonal changes (Figure 5c, p < 0.05, LDA > 4.0). Notably, P. sulcata exhibited enrichment specifically during spring as the most dominant species. During summer, Ceratium fusus, Ceratium tripos, S. tamesis, E. zodiacus, O. regia, and C. curvisetus displayed high relative abundances. In contrast, N. scientillans, B. paxillifera, Coscinodiscus spp., and C. castracanei exhibited significant enrichment during autumn.

3.3. Spatial Distribution of Phytoplankton Communities

The spatial distribution exhibited relatively reduced distinctiveness in phytoplankton composition yet remained statistically significant. The highest values of Shannon, Simpson, and Chao 1 indices were recorded in LK (2.10, 0.75 and 30.68, respectively) and LZ (2.08, 0.75 and 29.50, respectively, Figure 6a). Except LZ, the Chao 1 in LK exhibited a significantly higher value compared to the other locations (p < 0.05). The Shannon and Simpson indices in HY displayed significantly lower values (Figure 6a, p < 0.01). A Venn diagram illustrated that out of the total phytoplankton compositions, 47 species were shared by all five locations (Figure 6b).
The LEfSe analysis revealed the presence of 10, 5, and 6 potential biomarkers during spring, summer, and autumn, respectively (Figure 6c and Figure S2, p < 0.05, LDA > 4.0). Noticeable variations were observed in the dominant species within the communities across all five locations throughout the three seasons. During springtime in the SSL community, N. scientillans, C. densus, P. alata, and P. pungens exhibited higher abundances. In CD’s community during this season, P. sulcata was primarily indicated. Scrippsiella acuminata, Ditylum brightwellii, S. costatum, Prorocentrum cordatum, and Thalassionema nitzschioides displayed high relative abundances in the HY location. In summer, Thalassionema frauenfeldii showed significant enrichment in the CD location. S. tamesis and O. regia were indicative species of the LK location, whereas Coscinodiscus granii and E. zodiacus were enriched in the LZ and HY locations, respectively. In autumn, D. brightwellii had a high relative abundance in the SSL location, while P. sulcata and C. densus were identified as the predominant species in CD. Sundstroemia setigera, C. castracanei, and B. paxillifera demonstrated significant enrichment in LK, LZ, and HY, respectively.

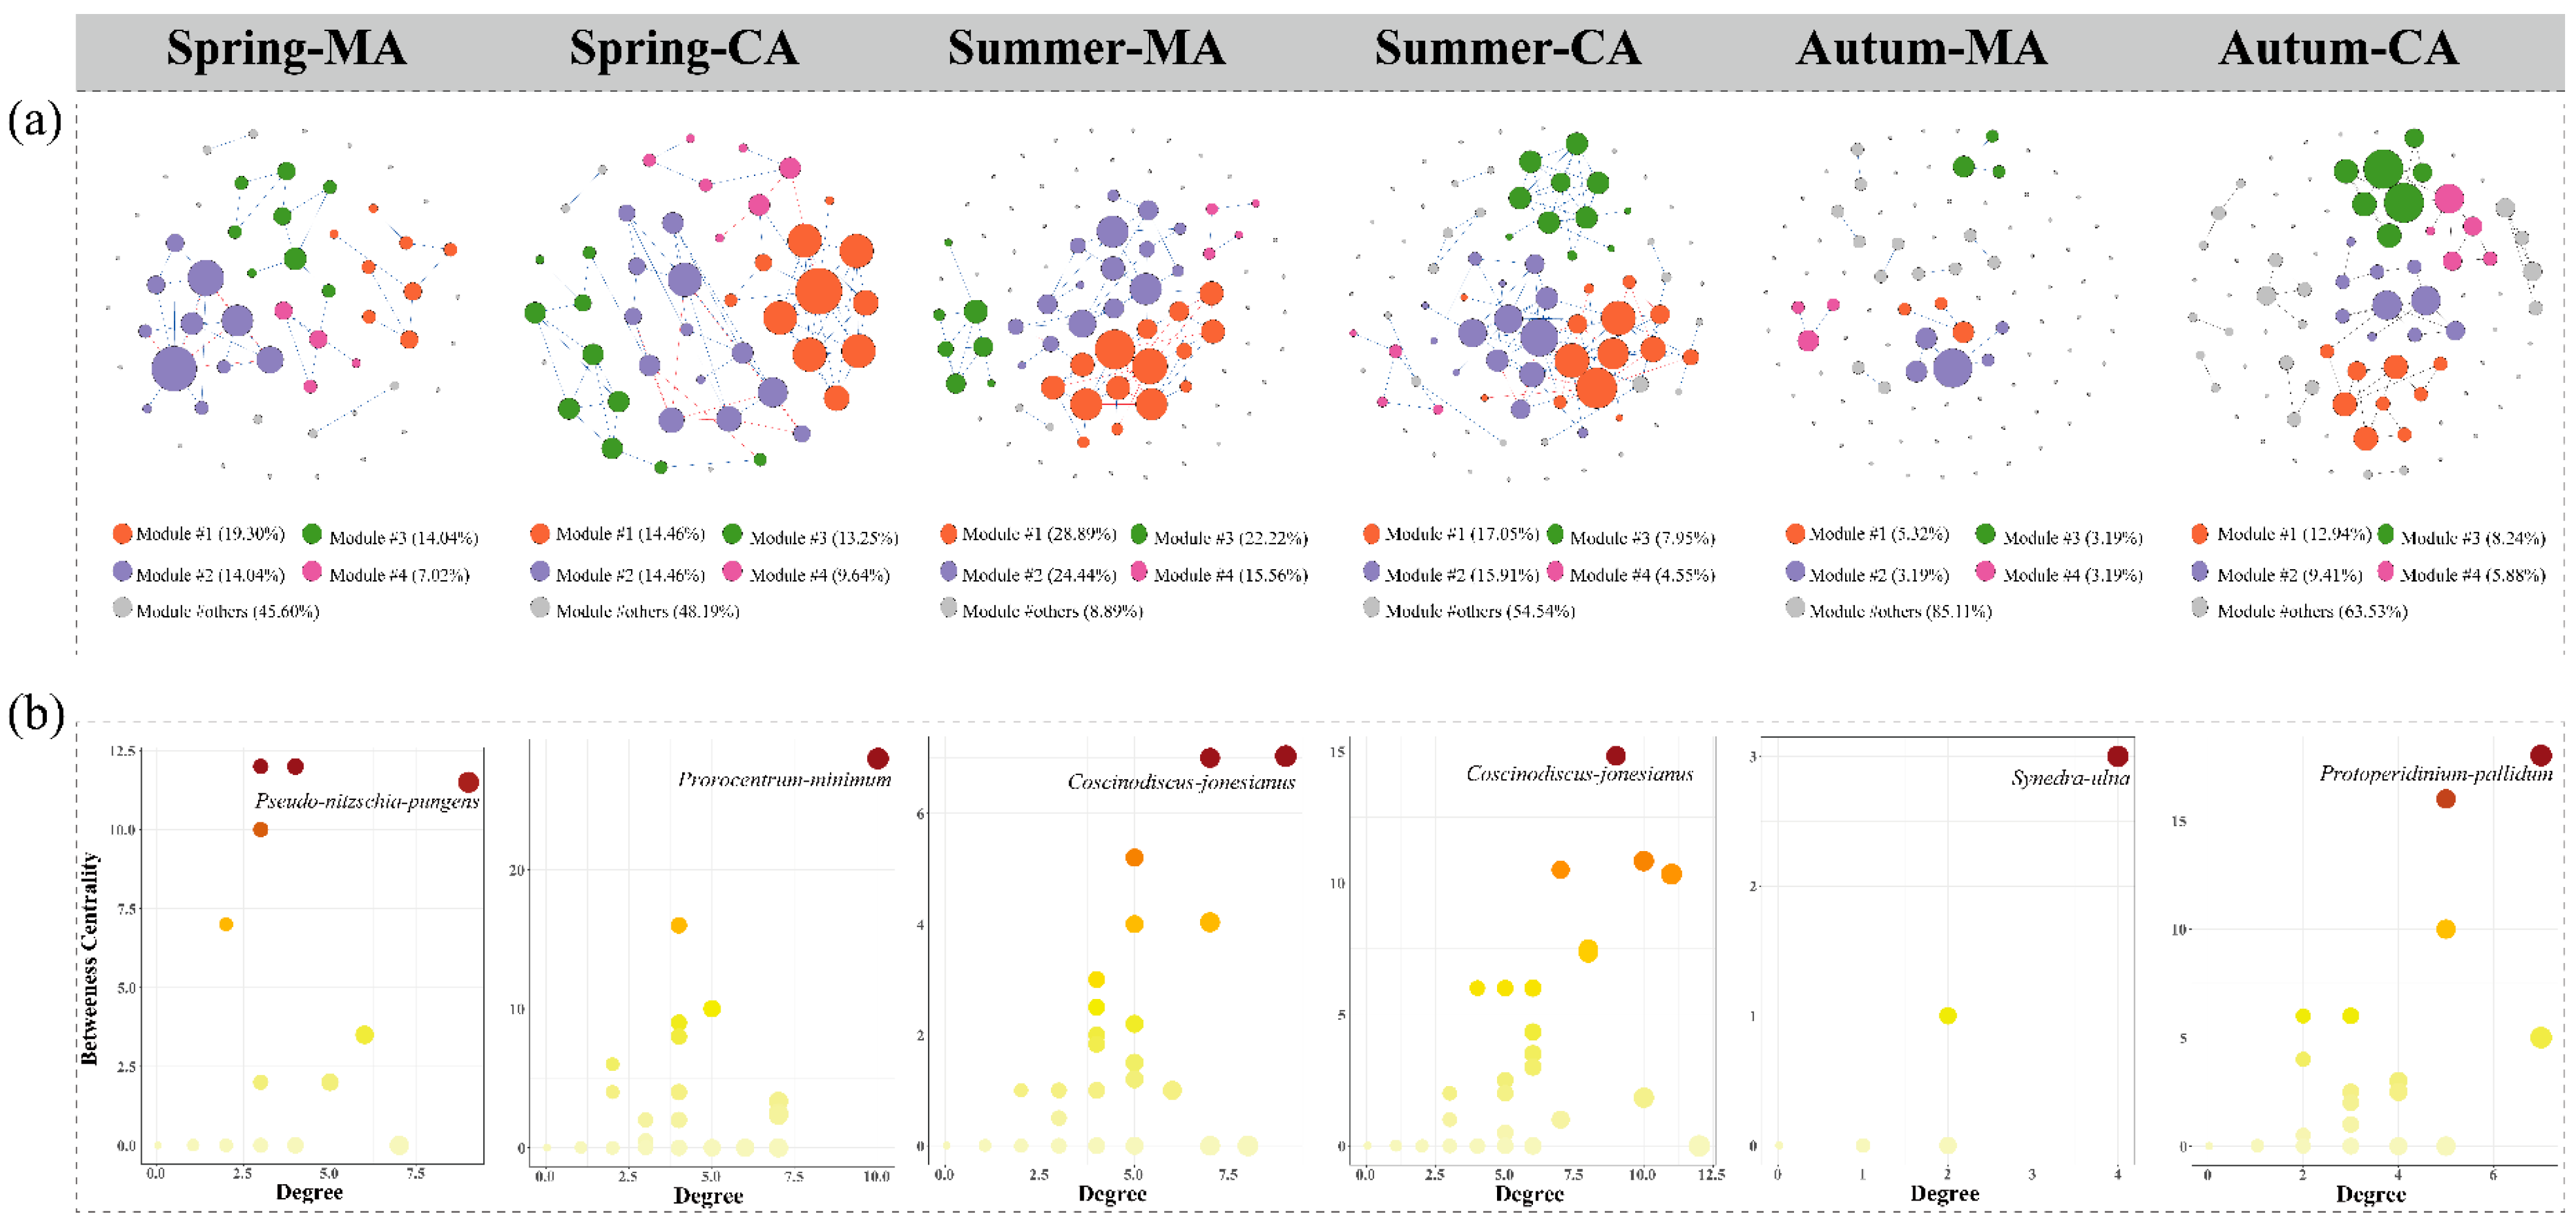
3.4. Impacts of Marine Ranching on Phytoplankton Communities

The α diversity values indicated that there was no statistically significant difference between MA and CA (Figure S3a, R2 = 0.002, p = 0.621). Furthermore, the Venn diagram revealed that MA (14) had a greater number of specific species than CA (4) across the three seasons (Figure S3b). Based on these analyses, it can be concluded that the differences in phytoplankton diversity and abundance between MA and CA were relatively small, while there were more specific species observed in MA.
Symbiotic networks were constructed to investigate the potential interactions in phytoplankton communities within MA or CA during the same season (Figure 7a). The patterns of phytoplankton networks varied across the seasons and regions. The co-occurrence networks of all the phytoplankton species in MA and CA were partitioned into four major modules, accounting for 54.4% (spring), 51.81% (summer), and 14.89% (autumn) in MA, respectively. In comparison to MA, the proportion of four modules in the co-occurrence networks of phytoplankton in CA was relatively higher, comprising 91.11% (spring), 45.46% (summer), and 36.47% (autumn). Additionally, the network robustness, as indicated by the nodes remaining (Figure S4a) and the natural connectivity (Figure S4b) after random node removals, was also relatively higher in CA than in MA, suggesting greater stability and complexity within the network structure.
The topological parameters characterizing phytoplankton communities are summarized in Table 1. The average degree of network nodes provides insight into the connectivity among various species within the phytoplankton network. In the MA networks, a higher number of nodes but lower edges were observed. All the phytoplankton networks exhibit dominance of positively correlated connections, ranging from 82.28% to 100%. Nodes with a higher average degree demonstrate strong connections with numerous other nodes, playing a crucial role in maintaining the network’s structure. A high clustering coefficient suggests strong interactions and interconnections within phytoplankton communities, indicating a more complicated network. Additionally, the average path length of the network reflects the proximity between its species, so that a lower average path length indicates higher network closeness. The co-occurrence networks in MA displayed lower values of average degree, clustering coefficient, and average path length. This suggests that interactions between phytoplankton species in the MA co-occurrence networks were comparatively weaker than those in the CA networks, indicating greater complexity in the ecological networks within CA than MA.
The keystone species in each topological network were identified and characterized based on their high degree values and betweenness centrality (Figure 7b, Table S1). In the MA networks during spring, summer, and autumn, P. pungens, Coscinodiscus jonesianus, and Synedra ulna were found to be the keystone species, respectively. Conversely, P. cordatum, C. jonesianus, and Protoperidinium pallidum emerged as the keystone species in the CA networks. The values of adding percent (%) were defined as the proportional increase of MA relative to CA, calculated as follows: (%) = [(MA − CA)/CA] × 100%.

4. Discussion

In this study, the dominant species determined by morphological analysis primarily belonged to Coscinodiscus and Chaetoceros, consistent with previous investigations conducted in Bohai Sea via the same microscopic techniques [40] and HPLC pigment analysis [41]. The phytoplankton communities exhibited temporal and spatial variations (Figure 4). Both the abundance and α diversity of phytoplankton were lowest during spring, which is attributed to temperature-induced effects on metabolic reactions that directly influence phytoplankton population growth [42]. As temperatures increased, there was an acceleration in phytoplankton growth, reaching its peak during summer. Among all the locations studied, HY displayed the greatest distinctiveness with the highest abundance but the lowest values of diversity. HY is shared by the Yellow Sea, while the other locations belong to the Bohai Sea, which is greatly influenced by diluted water from the Yellow River. Consequently, differences in nutrient status and hydrographic conditions may contribute to the significant variations in phytoplankton abundance and diversity between HY and the other locations. The results are consistent with previous studies in that the distribution of the phytoplankton community exhibited spatial heterogeneity across distinct aquaculture types, which may be attributed to small-scale habitats formed under these specific aquaculture practices [43]. Furthermore, temporal dynamics in the phytoplankton community structure were consistently observed irrespective of the aquaculture culture systems [13]. Our findings also reveal that there was a noticeable increase in the proportion of shared species rather than unique species between MA and CA from spring to autumn (Figure S3b), indicating that seasonal variations could overshadow the impact of mariculture activities on differences in species richness [44]. Moreover, MA consistently had a higher number of phytoplankton compositions compared to CA, supporting that mariculture activities have the potential to foster habitat-specific species and create unique biogeochemical processes [45].
The development of the mariculture industry has created negative feedback, leading to eutrophication, which may cause the increase and expansion of HABs, and the increasing prevalence of HABs is associated with the economic losses of the aquaculture industry [46]. In this study, harmful algal species were identified based on the Taxonomic Reference List of Harmful Micro Algae (IOC-UNESCO) [47]. Some of these species possess the capability to produce toxins. For instance, Gonyaulax spinifera generates yessotoxin, which is linked to recurrent mussel toxicity events [48], and P. pungens, which produces domoic acid, causing amnesic shellfish poisoning (ASP) by accumulating in filter-feeding marine shellfish [49,50]. A relatively higher abundance of harmful algae species, including Prorocentrum micans, P. cordatum, Pseudo nitzschia delicatissima, N. scientillans, P. pungens, S. costatum, Akashiwo sanguinea, R. setigera, Alexandrium spp., Dinophysis acuminata, G. spinifera, and Leptocylindrus danicus, was recorded in marine ranching (Figure S1). Additionally, some of them were exclusively found in marine ranching areas during certain seasons, such as A. sanguinea, G. spinifera, and L. danicus in spring, Pseudo. delicatissima and D. acuminata in summer, and P. cordatum and P. micans in autumn. Based on the result, the impacts of mariculture activities may lead to the formation of transient niches, which will promote greater diversity of HAB species [51]. As evidenced by the elevated abundance and diversity of HAB species in marine ranching zones, heightened attention should be directed toward monitoring and managing HAB communities during mariculture operations.
Within the phytoplankton community, diatoms and dinoflagellates are the major groups [52]. Diatoms contribute to approximately 40% of the marine primary production [53] and play a crucial role in the functioning and biodiversity of marine ecosystems [54]. Dinoflagellates, which account for 75% of harmful phytoplankton species, are primarily associated with HABs [55]. The previous research conducted in the Bohai Sea reported that dinoflagellates were responsible for the most frequent HAB events and the largest impact areas [51]. The population dynamics of diatoms and dinoflagellates are recognized as a crucial factor that could constrain the productivity and quality of cultivated organisms [56], as well as exert influence on the growth and survival of these cultivated organisms [57]. Over the past few decades, the phytoplankton community has undergone distinct successional processes from a diatom-dominated to a diatom–dinoflagellate-dominated community in Bohai Sea. This shift exhibited responses to eutrophication possibly caused by mariculture activities [58]. In this study, the phytoplankton community was dominated by diatoms, and the ratio of dinoflagellate/diatom abundance did not show significant seasonal changes between the marine ranching and control areas (Figure 2d). This may be due to the cultivation species, such as shellfish, which can utilize phytoplankton and particulate organic matter as a food source, avoiding eutrophication and algal bloom in aquaculture zones [22]. The dinoflagellates’ abundance reached a peak in LK (38.65% of the total phytoplankton abundance, autumn). This finding is consistent with previous investigations conducted in locations with mariculture activities, where there was a notable increase in dinoflagellates’ abundance attributed to elevated levels of organic matter and ammonia [59]. The sustained equilibrium in dinoflagellate/diatom abundance ratios demonstrated that marine ranching systems function as critical regulators of marine ecosystem resilience. By stabilizing the phytoplankton community structure, these anthropogenic ecosystems may effectively mitigate ecological risks associated with dinoflagellate proliferation, specifically HABs and hypoxia.
The analysis of co-occurrence network can provide insights into the interactions among species [60]. Different topological features along the networks of different environments suggest unique phytoplankton co-occurrence patterns. The lower edge numbers in marine ranching suggest a lower density of interactions in that environment. The lower values of average degree and path length and the clustering coefficient in marine ranching indicate a reduced level of network connectivity between species and decreased complexity of potential interactions. Complex networks with numerous interconnections have more potential to resist a disturbance and buffer responses to environmental changes [61]. Thus, the reduced network connectivity in marine ranching may indicate decreased resistance of phytoplankton communities to future disturbances. Previous studies have indicated that low temperatures limit the growth of most phytoplankton, resulting in reduced complexity and stability of the phytoplankton network [62]. In this study, however, a lower temperature was exhibited in spring, but lower network stability occurred in autumn, especially in the marine ranching zone, suggesting that the effect of aquaculture activities on the stability of the co-occurrence networks could be superimposed over that of low temperature. According to the marine fishery resources conservation and management system in China, the fishing season is closed in the studied areas from 1 May to 1 September 2022. However, the survey period in autumn is the peak of the fishing season (1 September–1 May), and intense fishing activities may disturb the phytoplankton community structure; therefore, the co-occurrence network in marine ranching had higher vulnerability and lower robustness than the co-occurrence network in the control zone. This was consistent with previous research, which demonstrated that the aquaculture activities in coastal environments reduce the complexity of the co-occurrence networks of plankton communities [63].
Keystone species play a more essential role in maintaining the network structure than their abundance, as they are known to have a disproportionate deleterious effect on the community upon their removal [64]. Keystone species identified in the network pattern generally exhibit low abundance but may have a strong impact on community structure by their promotion or reduction in species interactions [65]. Species with high betweenness centrality scores can act as bridges between species. In this study, the keystone species in the topological networks identified in marine ranching zone were affiliated with phylum diatoms, P. pungens, C. jonesianus, and S. ulna, respectively. P. pungens has been detected in aquaculture sites and linked to the massive mortalities in cultivated organisms [66]. C. jonesianus was dominant in the coastal water, and the growth and reproduction of C. jonesianus was drastically promoted by temperature [67]. S. ulna, a freshwater diatom, was still detected in marine ranching, which may be caused by the inflow of nearshore rivers. S. ulna is considered an indicator of metal pollution [68]. Previous studies showed that a higher concentration of Cu was observed near sewage outfall sites of Zhifu Island sewage treatment plant and mariculture activities from 2021 to 2022, likely reflecting that industrial discharges and mariculture activities can elevated Cu levels [69]. As shown in Table S1, the keystone species detected in marine ranching exhibited significantly lower values of degree and betweenness centrality than those in the control area. This result implies that keystone species in marine ranching demonstrated weaker ecological connectivity with other species and played a diminished role in stabilizing the community structure and functionality. Their reduced topological importance within the co-occurrence network may reflect a limited capacity to mediate species interactions or constrained contributions to ecosystem resilience.

5. Conclusions

The present study aimed to assess the effects of aquaculture activities on phytoplankton communities in marine ranching areas through an analysis of spatiotemporal trends and patterns in comparison with control areas. Diatoms, dinoflagellates, and chrysophytes were identified as the predominant species, with diatoms constituting an overwhelmingly high proportion of 98.83% in total abundance. The composition and α diversity of phytoplankton communities displayed significant variations across seasons and locations; however, no notable differences were observed between the marine ranching and control areas. The analysis of co-occurrence networks unveiled discrepancies between marine ranching areas and control areas. The network associated with marine ranching exhibited lower values for average degree, clustering coefficient, and average path length, indicating that aquaculture activities have reduced connectivity among potential interactions, resulting in decreased complexity and stability of the phytoplankton communities. This fragile network stability could potentially compromise the resistance of phytoplankton communities to disturbances. Furthermore, the values of degree and betweenness centrality of keystone species in marine ranching were significantly lower than those in the control area. This study investigated phytoplankton community structure and demonstrated that the establishment of marine ranching effectively maintained the biodiversity and ecological functions of marine ecosystems but altered association among the species and reduced overall stability. Marine ranching serves as an equilibrium strategy between fishery-driven economic development and ecological conservation; however, its large-scale implementation necessitates robust environmental monitoring datasets and systematic validation to ensure holistic sustainability. Scientifically informed expansion initiatives must prioritize the integration of multi-parameter ecological assessments to reconcile productivity objectives with long-term ecosystem integrity.

Supplementary Materials

The following supporting information can be downloaded at: https://www.mdpi.com/article/10.3390/jmse13050835/s1, Figure S1: Abundances of HAB species in marine ranching and control areas; Figure S2: LEfSe identified the abundant species among the five locations within seasons; Figure S3: Alpha diversity of phytoplankton (a) and Venn diagram showing the number of unique and shared phytoplankton species (b) between the marine ranching area and control area within different seasons; Figure S4: Dynamics of network robustness, computed by calculating the proportion of nodes remaining (a) and natural connectivity (b) after randomly removing a certain number of nodes; Table S1: The top keystone phytoplankton taxa based on the high values of degree and betweenness centrality.

Author Contributions

Methodology, B.L.; Validation, X.W.; Investigation, D.J.; Resources, B.L.; Data curation, L.Q.; Writing—original draft, D.W. and Z.X.; Writing—review & editing, J.L. and B.L.; Project administration, S.Q.; Funding acquisition, J.L. All authors have read and agreed to the published version of the manuscript.

Funding

This research was financially supported by the National Natural Science Foundation of China (No. 42176131)and the Background Investigation and Effect Evaluation of Marine Ranch in Yantai (No. SDGP370600000202202000671). This paper contributes to the science plan of the Ocean Negative Carbon Emissions (ONCE) Program. The data analysis is supported by the High-Performance Computing Platform of Yantai Institute of Coastal Zone Research, Chinese Academy of Sciences.

Data Availability Statement

Data available on request due to restrictions.

Conflicts of Interest

The authors declare that they have no known competing financial interests or personal relationships that could have appeared to influence the work reported in this paper.

References

  1. Naylor, R.L.; Hardy, R.W.; Buschmann, A.H.; Bush, S.R.; Cao, L.; Klinger, D.H.; Little, D.C.; Lubchenco, J.; Shumway, S.E.; Troell, M. A 20-year retrospective review of global aquaculture. Nature 2021, 591, 551–563. [Google Scholar] [CrossRef]
  2. Liu, D.; Keesing, J.K.; He, P.; Wang, Z.; Shi, Y.; Wang, Y. The world’s largest macroalgal bloom in the Yellow Sea, China: Formation and implications. Estuar. Coast. Shelf Sci. 2013, 129, 2–10. [Google Scholar] [CrossRef]
  3. He, L.-X.; He, L.-Y.; Gao, F.-Z.; Zhang, M.; Chen, J.; Jia, W.-L.; Ye, P.; Jia, Y.-W.; Hong, B.; Liu, S.-S.; et al. Mariculture affects antibiotic resistome and microbiome in the coastal environment. J. Hazard. Mater. 2023, 452, 131208. [Google Scholar] [CrossRef]
  4. Yu, J.; Zhang, L. Evolution of marine ranching policies in China: Review, performance and prospects. Sci. Total. Environ. 2020, 737, 139782. [Google Scholar] [CrossRef]
  5. Nakahara, H. Japanese Efforts in Marine Ranching Development. In Resources and Environment in Asia’s Marine Sector; Taylor and Francis: New York, WA, USA, 1992; pp. 199–216. [Google Scholar]
  6. Salvanes, A.G.V. Ocean Ranching. In Encyclopedia of Ocean Sciences; Steele, J.H., Ed.; Academic Press: Cambridge, MA, USA, 2001; pp. 1973–1982. [Google Scholar] [CrossRef]
  7. Pickering, H.; Whitmarsh, D.; Jensen, A. Artificial Reefs as a Tool to Aid Rehabilitation of Coastal Ecosystems: Investigating the Potential. Mar. Pollut. Bull. 1999, 37, 505–514. [Google Scholar] [CrossRef]
  8. Lee, M.O.; Otake, S.; Kim, J.K. Transition of artificial reefs (ARs) research and its prospects. Ocean Coast. Manag. 2018, 154, 55–65. [Google Scholar] [CrossRef]
  9. Ministry of Agriculture and Rural Affairs of the People’s Republic of China. Announcement No.515 of the Ministry of Agriculture and Rural Affairs of the People’s Republic of China. 2022. Available online: http://www.moa.gov.cn/nybgb/2022/202202/202203/t20220324_6393765.htm. (accessed on 5 January 2022).
  10. Gao, S.; Shi, Y.; Zhang, S.; Gao, C. Temporal and spatial variation patterns of chlorophyll α in marine ranching under global interannual events. Mar. Environ. Res. 2024, 202, 106760. [Google Scholar] [CrossRef] [PubMed]
  11. Huang, H.; Chen, S.; Xu, Z.; Wu, Y.; Mei, L.; Pan, Y.; Yan, X.; Zhou, C. Comparative metabarcoding analysis of phytoplankton community composition and diversity in aquaculture water and the stomach contents of Tegillarca granosa during months of growth. Mar. Pollut. Bull. 2023, 187, 114556. [Google Scholar] [CrossRef]
  12. Qiao, L.; Chang, Z.; Li, J.; Chen, Z. Phytoplankton community succession in relation to water quality changes in the indoor industrial aquaculture system for Litopenaeus vannamei. Aquaculture 2020, 527, 735441. [Google Scholar] [CrossRef]
  13. Zhu, Y.; Wang, Z.; Song, L.; Gu, J.; Ye, Z.; Jin, R.; Wu, J. Spatiotemporal variation of phytoplankton communities and water quality among seaweed, shellfish and cage fish culture systems. Sci. Total. Environ. 2023, 896, 165305. [Google Scholar] [CrossRef]
  14. Jiang, Z.; Liu, J.; Li, S.; Chen, Y.; Du, P.; Zhu, Y.; Liao, Y.; Chen, Q.; Shou, L.; Yan, X.; et al. Kelp cultivation effectively improves water quality and regulates phytoplankton community in a turbid, highly eutrophic bay. Sci. Total. Environ. 2020, 707, 135561. [Google Scholar] [CrossRef] [PubMed]
  15. Yu, Z.; Liu, C.; Wang, F.; Xue, Z.; Zhang, A.; Lu, G.; Wang, L.; Song, L. Diversity and annual variation of phytoplankton community in Yesso scallop (Patinopecten yessoensis) farming waters of North Yellow Sea of China. Aquaculture 2019, 511, 734266. [Google Scholar] [CrossRef]
  16. Frühe, L.; Cordier, T.; Dully, V.; Breiner, H.W.; Lentendu, G.; Pawłowski, J.; Martins, C.I.M.; Wilding, T.A.; Stoeck, T. Supervised machine learning is superior to indicator value inference in monitoring the environmental impacts of salmon aquaculture using eDNA metabarcodes. Mol. Ecol. 2020, 30, 2988–3006. [Google Scholar] [CrossRef] [PubMed]
  17. Liu, W.; Wen, S.; Cheng, Z.; Tan, Y. Insights into ecological effects of fish and shellfish mariculture on microeukaryotic community. Environ. Res. 2024, 245, 117976. [Google Scholar] [CrossRef] [PubMed]
  18. Strogatz, S.H. Exploring complex networks. Nature 2001, 410, 268–276. [Google Scholar] [CrossRef]
  19. Goberna, M.; Verdú, M. Cautionary notes on the use of co-occurrence networks in soil ecology. Soil Biol. Biochem. 2022, 166, 108534. [Google Scholar] [CrossRef]
  20. Zhu, W.; Qin, C.; Ma, H.; Xi, S.; Zuo, T.; Pan, W.; Li, C. Response of protist community dynamics and co-occurrence patterns to the construction of artificial reefs: A case study in Daya Bay, China. Sci. Total. Environ. 2020, 742, 140575. [Google Scholar] [CrossRef]
  21. Liu, S.; Zhou, X.; Zeng, C.; Frankstone, T.; Cao, L. Characterizing the development of Sea ranching in China. Rev. Fish Biol. Fish. 2022, 32, 783–803. [Google Scholar] [CrossRef]
  22. Jiang, Z.; Du, P.; Liao, Y.; Liu, Q.; Chen, Q.; Shou, L.; Zeng, J.; Chen, J. Oyster farming control on phytoplankton bloom promoted by thermal discharge from a power plant in a eutrophic, semi-enclosed bay. Water Res. 2019, 159, 1–9. [Google Scholar] [CrossRef]
  23. Duarte, C.M.; Bruhn, A.; Krause-Jensen, D. A seaweed aquaculture imperative to meet global sustainability targets. Nat. Sustain. 2022, 5, 185–193. [Google Scholar] [CrossRef]
  24. Zhang, S.W.; Wang, Q.Y.; Lü, Y.; Cui, H.; Yuan, Y.L. Observation of the seasonal evolution of the Yellow Sea Cold Water Mass in 1996–1998. Cont. Shelf Res. 2008, 28, 442–457. [Google Scholar] [CrossRef]
  25. Hou, C.; Yuan, X.; Ma, Y.; Zhang, W.; Liu, Y.; Zhang, C.; Wang, L.; Dong, Z.; Zhao, J. Zooplankton community variations in response to summer hypoxia in Sishili Bay, North Yellow Sea, China. J. Oceanol. Limnol. 2024, 42, 1880–1894. [Google Scholar] [CrossRef]
  26. Jin, X.; Shan, X.; Li, X.; Wang, J.; Cui, Y.; Zuo, T. Long-term changes in the fishery ecosystem structure of Laizhou Bay, China. Sci. China Earth Sci. 2013, 56, 366–374. [Google Scholar] [CrossRef]
  27. Ginestet, C. Ggplot2: Elegant Graphics for Data Analysis. J. R. Stat. Soc. Ser. A Stat. 2011, 174, 245–246. [Google Scholar] [CrossRef]
  28. Oksanen, J.; Blanchet, F.G.; Kindt, R.; Legendre, P.; Minchin, P.; O’Hara, B.; Simpson, G.; Solymos, P.; Stevens, H.; Wagner, H. Vegan: Community Ecology Package; R Package Version 2; R Core Team: Vienna, Austria, 2015. [Google Scholar]
  29. Shen, A.; Ishizaka, J.; Yang, M.; Ouyang, L.; Yin, Y.; Ma, Z. Changes in community structure and photosynthetic activities of total phytoplankton species during the growth, maintenance, and dissipation phases of a Prorocentrum donghaiense bloom. Harmful Algae 2019, 82, 35–43. [Google Scholar] [CrossRef]
  30. Chao, A. Non parametric estimation of the classes in a population. Scand. J. Stat. 1984, 11, 265–270. [Google Scholar]
  31. Xu, S.; Zhan, L.; Tang, W.; Wang, Q.; Dai, Z.; Zhou, L.; Feng, T.; Chen, M.; Wu, T.; Hu, E.; et al. MicrobiotaProcess: A comprehensive R package for deep mining microbiome. Innovation 2023, 4, 100388. [Google Scholar] [CrossRef]
  32. Wen, T.; Xie, P.; Yang, S.; Niu, G.; Liu, X.; Ding, Z.; Xue, C.; Liu, Y.; Shen, Q.; Yuan, J. ggClusterNet: An R package for microbiome network analysis and modularity-based multiple network layouts. iMeta 2022, 1, e32. [Google Scholar] [CrossRef]
  33. Horvát, S.; Podkalicki, J.; Csárdi, G.; Nepusz, T.; Traag, V.; Zanini, F.; Noom, D. IGraph/M: Graph theory and network analysis for Mathematica. J. Open Source Softw. 2023, 8, 4899. [Google Scholar] [CrossRef]
  34. Friedman, J.; Alm, E.J. Inferring Correlation Networks from Genomic Survey Data. PLOS Comput. Biol. 2012, 8, e1002687. [Google Scholar] [CrossRef]
  35. Bastian, M.; Heymann, S.; Jacomy, M. Gephi: An Open Source Software for Exploring and Manipulating Networks. In Proceedings of the 3rd International AAAI Conference on Web and Social Media, San Jose, CA, USA, 17–20 May 2009; Volume 3, pp. 361–362. [Google Scholar] [CrossRef]
  36. Brandes, U. On variants of shortest-path betweenness centrality and their generic computation. Soc. Netw. 2008, 30, 136–145. [Google Scholar] [CrossRef]
  37. Hu, Y.; Fair, H.; Liu, Q.; Wang, Z.; Duan, B.; Lu, X. Diversity and co-occurrence networks of bacterial and fungal communities on two typical debris-covered glaciers, southeastern Tibetan Plateau. Microbiol. Res. 2023, 273, 127409. [Google Scholar] [CrossRef] [PubMed]
  38. Peng, G.-S.; Wu, J. Optimal network topology for structural robustness based on natural connectivity. Phys. A: Stat. Mech. Appl. 2016, 443, 212–220. [Google Scholar] [CrossRef]
  39. Pedersen, T. Patchwork: The Composer of Plots, R package version 1.3. 0.9000; 2024; Available online: https://github.com/thomasp85/patchwork (accessed on 20 April 2025).
  40. Chen, Y.-H.; Gao, Y.-H.; Chen, C.-P.; Liang, J.-R.; Sun, L.; Zhen, Y.; Qiao, L. Seasonal variations of phytoplankton assemblages and its relation to environmental variables in a scallop culture sea area of Bohai Bay, China. Mar. Pollut. Bull. 2016, 113, 362–370. [Google Scholar] [CrossRef] [PubMed]
  41. Pan, H.; Li, A.; Cui, Z.; Ding, D.; Qu, K.; Zheng, Y.; Lu, L.; Jiang, T.; Jiang, T. A comparative study of phytoplankton community structure and biomass determined by HPLC-CHEMTAX and microscopic methods during summer and autumn in the central Bohai Sea, China. Mar. Pollut. Bull. 2020, 155, 111172. [Google Scholar] [CrossRef]
  42. Kremer, C.T.; Thomas, M.K.; Litchman, E. Temperature- and size-scaling of phytoplankton population growth rates: Reconciling the Eppley curve and the metabolic theory of ecology. Limnol. Oceanogr. 2017, 62, 1658–1670. [Google Scholar] [CrossRef]
  43. Jiang, Z.-B.; Chen, Q.-Z.; Zeng, J.-N.; Liao, Y.-B.; Shou, L.; Liu, J. Phytoplankton community distribution in relation to environmental parameters in three aquaculture systems in a Chinese subtropical eutrophic bay. Mar. Ecol. Prog. Ser. 2012, 446, 73–89. [Google Scholar] [CrossRef]
  44. Zeng, J.; Lin, Y.; Zhao, D.; Huang, R.; Xu, H.; Jiao, C. Seasonality overwhelms aquacultural activity in determining the composition and assembly of the bacterial community in Lake Taihu, China. Sci. Total. Environ. 2019, 683, 427–435. [Google Scholar] [CrossRef]
  45. Wei, Y.; Bu, J.; Long, H.; Zhang, X.; Cai, X.; Huang, A.; Ren, W.; Xie, Z. Community Structure of Protease-Producing Bacteria Cultivated From Aquaculture Systems: Potential Impact of a Tropical Environment. Front. Microbiol. 2021, 12, 638129. [Google Scholar] [CrossRef]
  46. Bouwman, L.; Beusen, A.; Glibert, P.M.; Overbeek, C.; Pawlowski, M.; Herrera, J.; Mulsow, S.; Yu, R.; Zhou, M. Mariculture: Significant and expanding cause of coastal nutrient enrichment. Environ. Res. Lett. 2013, 8, 044026. [Google Scholar] [CrossRef]
  47. Lundholm, N.; Bernard, C.; Churro, C.; Escalera, L.; Hoppenrath, M.; Iwataki, M.; Larsen, J.; Mertens, K.; Moestrup, Ø.; Murray, S.; et al. (Eds.) IOC UNESCO Taxonomic Reference List of Harmful Micro Algae. 2009. Available online: www.marinespecies.org/hab (accessed on 15 October 2021).
  48. Riccardi, M.; Guerrini, F.; Roncarati, F.; Milandri, A.; Cangini, M.; Pigozzi, S.; Riccardi, E.; Ceredi, A.; Ciminiello, P.; Dell’aversano, C.; et al. Gonyaulax spinifera from the Adriatic sea: Toxin production and phylogenetic analysis. Harmful Algae 2009, 8, 279–290. [Google Scholar] [CrossRef]
  49. Lopes, V.M.; Rosa, R.; Costa, P.R. Presence and persistence of the amnesic shellfish poisoning toxin, domoic acid, in octopus and cuttlefish brains. Mar. Environ. Res. 2018, 133, 45–48. [Google Scholar] [CrossRef] [PubMed]
  50. Zabaglo, K.; Chrapusta, E.; Bober, B.; Kaminski, A.; Adamski, M.; Bialczyk, J. Environmental roles and biological activity of domoic acid: A review. Algal Res. 2016, 13, 94–101. [Google Scholar] [CrossRef]
  51. Li, X.-Y.; Yu, R.-C.; Richardson, A.J.; Sun, C.; Eriksen, R.; Kong, F.-Z.; Zhou, Z.-X.; Geng, H.-X.; Zhang, Q.-C.; Zhou, M.-J. Marked shifts of harmful algal blooms in the Bohai Sea linked with combined impacts of environmental changes. Harmful Algae 2023, 121, 102370. [Google Scholar] [CrossRef] [PubMed]
  52. Sommer, U.; Stibor, H.; Katechakis, A.; Sommer, F.; Hansen, T. Pelagic food web configurations at different levels of nutrient richness and their implications for the ratio fish production:primary production. Hydrobiologia 2002, 484, 11–20. [Google Scholar] [CrossRef]
  53. Nelson, D.M.; Tréguer, P.; Brzezinski, M.A.; Leynaert, A.; Quéguiner, B. Production and dissolution of biogenic silica in the ocean: Revised global estimates, comparison with regional data and relationship to biogenic sedimentation. Glob. Biogeochem. Cycles 1995, 9, 359–372. [Google Scholar] [CrossRef]
  54. Serôdio, J.; Lavaud, J. Diatoms and their ecological importance. In Life Below Water; Filho, W.L., Azul, A.M., Brandli, L., Salvia, A.L., Wall, T., Eds.; Springer: Cham, Switzerland, 2022; pp. 304–312. [Google Scholar]
  55. Smayda, T.J.; Reynolds, C.S. Strategies of marine dinoflagellate survival and some rules of assembly. J. Sea Res. 2003, 49, 95–106. [Google Scholar] [CrossRef]
  56. Chassot, E.; Bonhommeau, S.; Dulvy, N.K.; Mélin, F.; Watson, R.; Gascuel, D.; Le Pape, O. Global marine primary production constrains fisheries catches. Ecol. Lett. 2010, 13, 495–505. [Google Scholar] [CrossRef]
  57. Kong, N.; Liu, Z.; Yu, Z.; Fu, Q.; Li, H.; Zhang, Y.; Fang, X.; Zhang, F.; Liu, C.; Wang, L.; et al. Dynamics of phytoplankton community in scallop farming waters of the Bohai Sea and North Yellow Sea in China. BMC Evol. Biol. 2022, 22, 1–12. [Google Scholar] [CrossRef]
  58. Wei, Y.; Luan, Q.; Shan, X.; Cui, H.; Qu, K.; Cui, Z.; Sun, J. Temperature and nutrients drive distinct successions between diatoms and dinoflagellates over the past 40 years: Implications for climate warming and eutrophication. Sci. Total. Environ. 2024, 931, 172997. [Google Scholar] [CrossRef]
  59. Lee, H.-G.; Kim, H.M.; Min, J.; Park, C.; Jeong, H.J.; Lee, K.; Kim, K.Y. Quantification of the paralytic shellfish poisoning dinoflagellate Alexandrium species using a digital PCR. Harmful Algae 2020, 92, 101726. [Google Scholar] [CrossRef] [PubMed]
  60. Needham, D.M.; Sachdeva, R.; Fuhrman, J.A. Ecological dynamics and co-occurrence among marine phytoplankton, bacteria and myoviruses shows microdiversity matters. ISME J. 2017, 11, 1614–1629. [Google Scholar] [CrossRef] [PubMed]
  61. Philippot, L.; Griffiths, B.S.; Langenheder, S. Microbial Community Resilience across Ecosystems and Multiple Disturbances. Microbiol. Mol. Biol. Rev. 2021, 85, e0026-20. [Google Scholar] [CrossRef]
  62. Ding, X.; Liu, J.; Liu, W.; Dai, S.; Ke, Z.; Guo, J.; Lai, Y.; Tan, Y. Phytoplankton Communities Miniaturization Driven by Extreme Weather in Subtropical Estuary under Climate Changes. Water Res. 2023, 245, 120588. [Google Scholar] [CrossRef]
  63. Xu, H.; Zhao, D.; Zeng, J.; Mao, Z.; Gu, X.; Wu, Q.L. Evaluating the effects of aquaculture on the freshwater lake from the perspective of plankton communities: The diversity, co-occurrence patterns and their underlying mechanisms. Environ. Pollut. 2022, 309, 119741. [Google Scholar] [CrossRef]
  64. Power, M.E.; Tilman, D.; Estes, J.A.; Menge, B.A.; Bond, W.J.; Mills, L.S.; Daily, G.; Castilla, J.C.; Lubchenco, J.; Paine, R.T. Challenges in the quest for keystones: Identifying keystone species is difficult—But essential to understanding how loss of species will affect ecosystems. Bioscience 1996, 46, 609–620. [Google Scholar] [CrossRef]
  65. Yang, X.; Tan, J.; Sun, K.H.; Jiang, L. Experimental demonstration of the importance of keystone communities for maintaining metacommunity biodiversity and ecosystem functioning. Oecologia 2020, 193, 437–447. [Google Scholar] [CrossRef]
  66. Husson, B.; Hernández-Fariñas, T.; Le Gendre, R.; Schapira, M.; Chapelle, A. Two decades of Pseudo-nitzschia spp. blooms and king scallop (Pecten maximus) contamination by domoic acid along the French Atlantic and English Channel coasts: Seasonal dynamics, spatial heterogeneity and interannual variability. Harmful Algae 2016, 51, 26–39. [Google Scholar] [CrossRef] [PubMed]
  67. Yang, H.; Zhao, Y.; Zhang, H.; Dai, G.X.; Ding, J.; Chen, J. Study on the impact of water environmental factors on dominant species of phytoplankton around the power plant in Xiangshan Bay. Adv. Mater. Res. 2012, 610–613, 3371–3374. [Google Scholar] [CrossRef]
  68. Pandey, L.K.; Bergey, E.A. Exploring the status of motility, lipid bodies, deformities and size reduction in periphytic diatom community from chronically metal (Cu, Zn) polluted waterbodies as a biomonitoring tool. Sci. Total Environ. 2016, 550, 372–381. [Google Scholar] [CrossRef]
  69. Rahman, M.A.; Pan, D.; Lu, Y.; Liang, Y. Spatial temporal distribution and eutrophication evaluation of nutrients and trace metals in summer surface seawater of Yantai Sishili Bay, China. Front. Mar. Sci. 2024, 11. [Google Scholar] [CrossRef]
Figure 1. Study area and sampling sites. Different codes of sampling sites indicate their locations at Sishili bay (SSL), Changdao (CD), Laikou bay (LK), Laizhou bay (LZ), or Haiyang (HY).
Jmse 13 00835 g001
Figure 2. Abundances of total phytoplankton communities (a), diatoms (b), dinoflagellates (c), and the cell abundance ratio of diatoms/dinoflagellates (d) obtained in various locations across seasons.
Jmse 13 00835 g002
Figure 3. Relative abundance of phytoplankton species in different locations across seasons.
Jmse 13 00835 g003
Figure 4. The non-metric multidimensional scaling (NMDS) of the phytoplankton composition performed based on the Euclidean distance among the seasons (a), locations (b), and regions (c).
Jmse 13 00835 g004
Figure 5. Seasons’ variables of the phytoplankton composition: alpha diversity (Shannon, Simpson, and Chao 1 index) of phytoplankton based on ANOVA test (a), Venn diagram showing the number of unique and shared phytoplankton species (b), and LEfSe identified the differentially abundant species among the three seasons (c). The biomarkers in the seasons are represented by color, and no color nodes represent phytoplankton species that do not play important roles. Cladogram indicating differences at king to species levels. Each circle represents phylogenetic level. ns: not significant; *: p < 0.05; **: p < 0.01; ***: p < 0.001; ****: p < 0.0001.
Jmse 13 00835 g005
Figure 6. Spatial dynamics of the phytoplankton composition: alpha diversity (Shannon, Simpson, and Chao 1 index) of phytoplankton based on ANOVA test (a), Venn diagram showing the number of unique and shared phytoplankton species (b), and LEfSe identified the most differentially abundant species among the three seasons (c) among five locations. *: p < 0.05; **: p < 0.01; ***: p < 0.001.
Jmse 13 00835 g006
Figure 7. Co-occurrence networks of the phytoplankton community in each group (a). Each connection shown has a correlation coefficient |r| 0.6 and a p value < 0.05. Each node presents one species, and its size is proportional to the number of connections (degree). The species are colored by module division. Blue line: a positive interaction between two individual nodes; red line: a negative interaction between two individual nodes. The keystone networks of the marine ranching and control areas in spring, summer, and autumn, respectively (b). Each node in the network represents one individual species. Element size represents the value of degree, with red color intensity denoting higher values of betweenness centrality.
Jmse 13 00835 g007
Table 1. Topological properties of the ranching area and control area phytoplankton co-occurrence networks across seasons.
SpringSummerAutumn
MACAAdding Percent (%)MACAAdding Percent (%)MACAAdding Percent (%)
Node574526.6788836.02948510.59
Edge4779−40.5179107−26.171765−73.85
Positive connections (%)85.1184.810.3582.2883.18−1.0810092.318.33
Negative connections (%)14.8915.19−1.9717.7216.825.3507.69−100.00
Average degree0.8251.756−53.020.8981.289−30.330.1810.765−76.34
Modularity0.6790.6553.660.6050.592.540.8510.7947.18
Average clustering coefficient0.1390.205−32.200.0890.134−33.580.0120.140−91.43
Average path length1.6981.743−2.581.4321.529−6.341.1901.690−29.59
Disclaimer/Publisher’s Note: The statements, opinions and data contained in all publications are solely those of the individual author(s) and contributor(s) and not of MDPI and/or the editor(s). MDPI and/or the editor(s) disclaim responsibility for any injury to people or property resulting from any ideas, methods, instructions or products referred to in the content.

