Abstract
To address the demand for high-precision exploration of natural gas hydrates in the northern South China Sea, this paper presents a novel high-precision small-scale 3D seismic exploration technology. The research team independently developed a seismic acquisition system, incorporating innovative designs such as a narrow trace spacing of 3.125 m and a short streamer length of 150 m. By integrating advanced processing techniques, including pre-stack noise suppression, spectral broadening, and refined velocity analysis, the system significantly enhances the precision and spatial resolution of shallow seismic data. During field trials in the Qiongdongnan basin, the system successfully acquired 3D seismic data over an area of 50 km2, enabling fine-scale imaging of sub-seabed strata within the upper 300 m. This represents a notable improvement in resolution compared to conventional 3D seismic technologies. When benchmarked against international counterparts such as P-cable, our system demonstrates distinct advantages in terms of exploration depth (reaching 1800 m) and dominant frequency range (spanning 10~390 Hz). The research findings provide a reliable technical approach for the detailed characterization of natural gas hydrates and the inversion of reservoir parameters, thereby holding significant practical value for advancing the industrial development of natural gas hydrates in China’s offshore areas.
1. Introduction
Marine streamer seismic exploration is essential for resource exploration [1,2]. Although cost-effective, 2D seismic struggles to capture complex subsurface heterogeneities [3,4,5,6]. In contrast, 3D seismic, with its areal acquisition geometry, is better at identifying small-scale structures and reservoirs [7,8,9,10,11]. As a result, 3D seismic has become the primary method for characterizing natural-gas hydrate systems, shifting from initial anomaly detection with 2D to delineating internal architectures and boundaries. However, traditional 3D systems are limited by their wide channel spacing (≥12.5 m) and long streamers (>1 km), which lead to insufficient resolution for imaging shallow strata (<300 m) and capturing hydrate reservoir details. This highlights the urgent need to develop a high-precision, small-scale 3D seismic system, where the streamer trace spacing is smaller and the streamer separation is shorter compared to conventional streamers.
Internationally, progress is evident. Norway, along with the UK and Germany, developed the P-cable system [12], which was successfully deployed in the Gulf of Mexico (2008) [13,14] and the Arctic (2013) [14]. Available from Geometrics, it tows 6–24 short streamers (25–200 m long) with narrow streamer spacing (1.5625–12.5 m) and fine trace spacing (3.125–12.5 m), providing a more straightforward, more efficient high-resolution solution that can be operated by a small crew.
In China, hydrate exploration mainly relies on high-resolution 2D or quasi-3D methods (single/dual-source with a single streamer) [15,16]. There is a heavy dependence on imported equipment for conventional 3D surveys, which limits the flexibility in streamer and trace spacing configuration. While techniques like pre-stack noise attenuation and spectral broadening (e.g., deconvolution) are well established in conventional seismic processing, their use in addressing the unique challenges of small-scale, high-density 3D acquisition systems remains underexplored. The main innovation of our processing approach is not in inventing new algorithms but in developing an integrated workflow specifically designed to overcome the inherent limitations of compact systems, such as reduced noise immunity and limited spatial coverage. Therefore, creating autonomous equipment and adapting key technologies are crucial for China’s advanced hydrate exploration.
To address this, the Guangzhou Marine Geological Survey and domestic institutions developed a high-precision, small-scale 3D seismic system. Its main innovations include a very narrow channel spacing (3.125 m), short streamers (150 m), and a dual-source, four-streamer alternating shooting mode. This setup greatly improves lateral and vertical resolution for shallow targets, closing the capability gap of conventional 3D systems. The system provides more flexibility and accuracy in data acquisition but requires more advanced data processing. It is especially suitable for detailed localized exploration. Using multi-element piezoelectric streamers, the system was tested in the Qiongdongnan basin, collecting data over 50 km2. After optimized processing tailored to the data, it produced high-quality imaging results.
2. Geological Background
The study area is located in the Qiongdongnan basin of the northern South China Sea, specifically on the Songnan low uplift within the central depression of the basin. It is surrounded by the Ledong–Lingshui sag, the Songnan–Baodao sag, and the Changchang sag, forming a typical “multi-sag encirclement” tectonic framework. This area serves as a primary target for hydrocarbon migration and accumulation [17,18,19,20]. The tectonic activity of the Songnan low uplift is controlled by the overall tectonic movements of the Qiongdongnan basin, having undergone successive stages, including a rift phase from the Paleocene to the early Oligocene, a rift-to-sag transition phase during the late Oligocene, and a sag phase from the Miocene to the Quaternary. From bottom to top, the strata developed in sequence include the Yacheng formation, Lingshui formation, Sanya formation, Meishan formation, Huangliu formation, Yinggehai formation, and Pleistocene strata [17,21,22,23,24,25].
Gas hydrates in the Qiongdongnan basin mainly form in deep-water turbidite sand bodies within the Miocene Huangliu and Meishan formations. The Yinggehai formation itself generally is not the primary reservoir for natural gas hydrates in the basin; however, it acts as an important source rock and seal layer. The hydrate deposits in this region show significant dynamic and active features and are closely linked to deep petroleum systems. Seismic profiles across the area often show extensive vertical migration pathways, like gas chimneys, mud diapirs, and fault systems. These features usually appear as chaotic reflections, pull-downs, or acoustically blurred zones, indicating a continuous upward flow of fluids and gases. Direct hydrocarbon indicators such as acoustic blanking and bright spots are commonly observed in the sections, pointing to the presence of substantial free gas along with gas hydrates in shallow formations. Due to active gas migration, the bottom simulating reflector (BSR) usually appears as discontinuous with weak amplitude, showing much less continuity than in the Shenhu area. The distribution of gas hydrate reservoirs strongly correlates with deep structures like diapirs and gas chimneys, supporting a “lower-generation, upper-accumulation” reservoir formation model.
In 2018 and 2020, the Guangzhou Marine Geological Survey deployed a quasi-3D seismic survey grid in the Qiongdongnan basin to conduct detailed investigations of favorable areas for gas hydrates (Figure 1). Additionally, three gas hydrate drilling and coring operations were carried out in the region in 2018, 2019, and 2021, yielding physical samples of gas hydrates [26,27,28,29,30,31,32]. This paper focuses on the processing and analysis of line01, within the high-precision small-scale 3D seismic exploration area, passing through the W09 drilling site (Figure 1b).
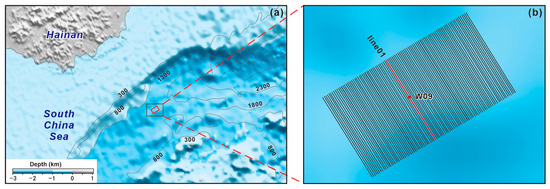
Figure 1.
(a) Location map of the studyarea. The red rectangle represents the location of the 3D seismic study area. (b) Seismic survey lines. W09 is the drilling and coring site for gas hydrate exploration conducted in 2019.
The primary target layer for high-precision small-scale 3D seismic exploration in this study area is the Quaternary strata. The seafloor reflection appears as a continuous, strong-amplitude peak reflection across the entire survey area on seismic profiles. The bottom boundary of the Quaternary, which is the top interface of the Yinggehai formation and the bottom interface of the Ledong formation, shows highly continuous, medium-amplitude peak reflections in the shallow-marine to semi-deep-marine uplift regions. In deep-sea areas, this reflection remains visible but shows significant variations in continuity and amplitude. Between these two interfaces, multiple stable-block, flow-interface reflection events are consistently observed throughout the entire study area, indicating favorable seismic–geological conditions for the implementation and application of seismic methods.
3. High-Precision Small-Scale 3D Seismic System
3.1. Acquisition System
The high-precision small-scale 3D seismic exploration system is designed to achieve high-resolution imaging of shallow subsurface structures, particularly for natural-gas hydrate exploration. In contrast to conventional 3D seismic systems, the key innovations of this system lie in its acquisition geometry and instrumental configuration—notably, the use of short streamers (150 m in length) and an ultra-dense channel spacing of 3.125 m. These features significantly enhance horizontal and vertical resolution for targets within 300 m below the seafloor.
The system employs a dual-source and four-streamer acquisition configuration (Figure 2). Each streamer contains 48 hydrophones grouped into operational sections, with a total active section of 150 m. A single leading section (400 m long) is used to connect the streamers to the vessel, which simplifies deployment, reduces tangling risks, and offers greater operational flexibility compared to multi-lead systems. This design also provides sufficient clearance for seismic source operation.
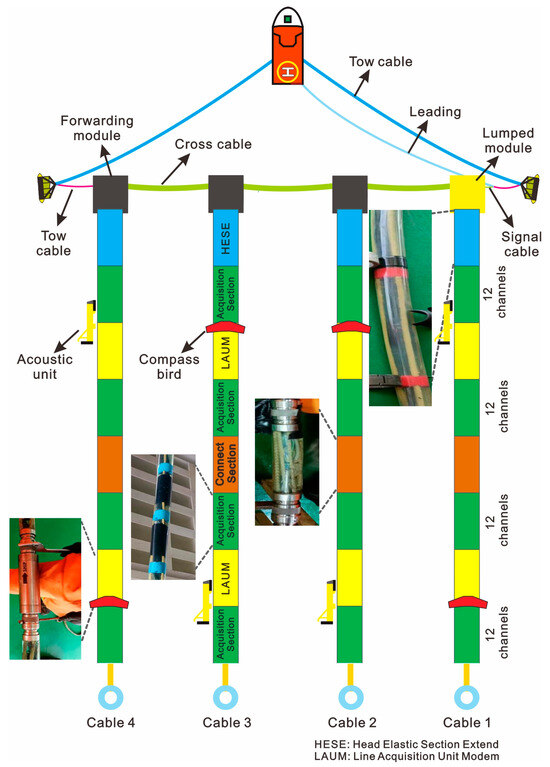
Figure 2.
Schematic diagram of underwater equipment connections for seismic acquisition system.
Signal acquisition and transmission are optimized for high-channel-count data. Each acquisition node services multiple hydrophone channels, reducing the number of underwater electronic units. Data are digitized near the sensors and transmitted via a hierarchical network of acquisition section, LAUM, and the leading section back to the onboard recording system. The system uses advanced positioning and depth control devices (acoustic units and compass birds) (Figure 2) to maintain accurate streamer geometry. This streamlined and high-density acquisition approach differentiates the system from conventional 3D towed-streamer configurations and enables high-resolution imaging suited to the detailed characterization of gas hydrate reservoirs.
3.2. Observation System
The high-precision small-scale 3D seismic exploration system utilizes various positioning and depth control devices. These include RGPS, acoustic units, and compass birds. The acoustic units function as simultaneous multichannel transceiver nodes within the acoustic network. The compass birds supply depth adjustment and measurement for the streamers. The system also features spacing control devices such as spacing ropes and bridles. Together, these components enable real-time monitoring of positions and precise control of the distance between the streamer and the seismic source. Compared to conventional 3D seismic surveys, it has shorter receiver streamer lengths, narrower trace intervals, and smaller streamer separations. The system’s overall parameters include transverse streamer spacing, source spacing, number of sources, firing interval, bin coverage, and others.
To maximize coverage and ensure data quality, the high-precision small-scale 3D seismic survey uses a dual-source alternating shooting acquisition method, achieving sixfold bin coverage. Under the dual-source and four-streamer acquisition mode, to prevent “blank zones” in the bins during single-pass acquisition, the transverse streamer spacing must be at least twice the source spacing, and the bin size is directly proportional to both streamer and source spacing. From a field implementation difficulty perspective, a larger transverse streamer spacing reduces the risk of streamer entanglement, enhancing operational feasibility and improving field efficiency. However, the lateral resolution of field acquisition is inversely proportional to bin size, necessitating smaller bins for precise imaging in 3D seismic surveys, which creates a trade-off between these two factors.
A practical combination of streamer and source deployment depths can reduce the impact of virtual reflections (ghost effects) from the seawater surface. Cable-source depth simulations (Figure 3) showed that when the source depth is 2 m and the streamer depth ranges from 2 to 3 m, there are no notches in the frequency band (Figure 3a). When the source depth is 3 m and the streamer depth ranges from 2 to 3 m, only a single notch appears at high frequencies (Figure 3b). As the streamer depth increases, multiple notches emerge within the frequency band (Figure 3a,b). With increasing source depth, notches shift to lower frequencies and become deeper (Figure 3c,d). In summary, shallower source and streamer depths generally reduce the impact of notches on seismic signals. However, shallower deployments are more susceptible to external disturbances such as waves, leading to poorer signal-to-noise ratios (SNRs) in the seismic data. Therefore, considering sea conditions and noise at the survey site, a source depth of 3 m and a streamer depth of 5 m were selected [33].
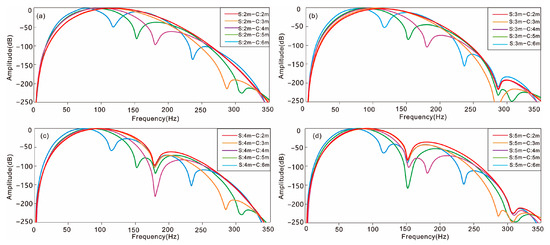
Figure 3.
Comparison of the superimposed responses for cable and source depth combination (a–d): (a) source depth: 2 m; cable depths: 2~6 m; (b) source depth: 3 m; cable depths: 2~6 m; (c) source depth: 4 m; cable depths: 2~6 m; (d) source depth: 5 m; cable depths: 2~6 m.
Considering the water depth of 1600 to 1800 m in the study area and the need for precise imaging of subsurface layers shallower than 300 m, along with operational challenges, efficiency, and the safety of underwater equipment, we proposed acquisition parameters for a dual-source and four-streamer high-precision small-scale 3D seismic survey. A comparison with conventional 3D seismic parameters (taking R/V Hai Yang Di Zhi Ba Hao as an example) is presented in Table 1.

Table 1.
3D seismic acquisition parameters.
4. Methods
Compared to conventional 3D seismic acquisition methods, the high-precision small-scale 3D seismic exploration technology uses high-frequency sources and small trace intervals, resulting in higher horizontal and vertical resolution in the acquired data. During the data processing for this operation, various measures were taken to use high-resolution data to obtain detailed subsurface structures beneath the seafloor without losing resolution. These include applying pre-stack noise attenuation to suppress swell noise; using a constant velocity-scanning method based on regional velocities for short-spread 3D data; researching spectral-broadening techniques and optimizing seismic data migration and processing parameters with commercial surface-consistent, reflection-wave, and residual-static-correction method software (paradigm2017, Houston, TX, USA) tailored to the characteristics of 3D seismic data; and applying to pick-up, decompose, and apply minor residual-time-shift, static-correction methods, eliminating static time differences and improving the SNR and resolution.
4.1. Pre-Stack Noise-Attenuation Technology
In the study area, ghost waves are not well-developed, and the primary noise types are swell noise and linear noise with stable apparent velocity, showing significant differences in signal and noise characteristics. Since swell noise has low frequency (<10 Hz) and high energy, this study applies high-pass filtering to suppress it. During processing, line01 was processed with high-pass filtering using parameters set to HP (8, 10), which achieved satisfactory results, as shown in Figure 4. As the linear interference noise exhibits a stable apparent velocity (1500 m/s) that significantly differs from that of the signal, spherical divergence compensation was first applied to address overall amplitude attenuation caused by geometric spreading and restore seismic wave energy. Subsequently, F-K dip filtering was used to suppress the energy of this linear noise. Comparison of shot gathers and stacked sections before and after processing demonstrates the effective removal of linear interference (Figure 5).
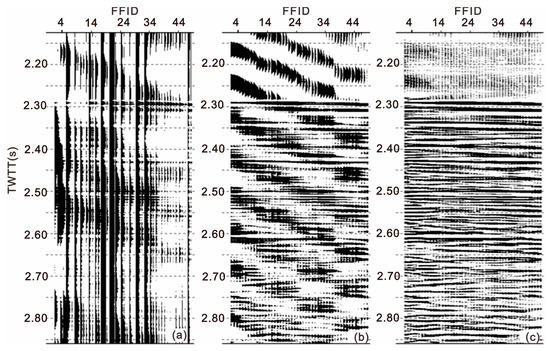
Figure 4.
Shot gather records at different noise attenuation stages. The raw data (a) contain intense swell noise and linear interference, which are effectively suppressed in (b) and (c), respectively.
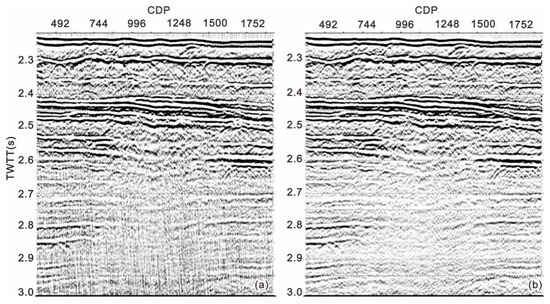
Figure 5.
Stacked sections before (a) and after (b) F-K dip filtering.
4.2. Spectral-Broadening Technique
The raw data from the high-precision small-scale 3D seismic exploration system (Dynageo Systems Co., Ltd., Beijing, China) show a relatively high SNR, providing a solid foundation for enhancing data resolution through spectral broadening. This paper employs a one-step statistical wavelet-deconvolution method to process the line01 survey line. The core of this process is that the wavelet is statistically estimated from the seismic data within a designated time window. Specifically, statistical wavelet deconvolution is applied solely in the shot domain to broaden the spectrum, adjust the wavelet shape, and improve wave group characteristics, thereby fully leveraging and exploring the resolution advantages and potential of 3D seismic data.
Comparisons of shot gathers, shot gather spectra, stacked sections, and wavelet autocorrelation sections before and after processing show that wavelet consistency improves significantly after processing at a 150 Hz dominant frequency (Figure 6b). This effectively addresses the issue of wavelet shape variability, resulting in largely consistent waveforms and frequencies in the seismic records, a notable increase in dominant frequency, and better wave group characteristics. For the processing results at a 220 Hz dominant frequency, while the wavelet is further compressed and noise energy increases, leading to a slight decrease in the SNR (as indicated by the yellow box in Figure 6), the wavelet consistency remains good (Figure 6c). This provides richer interlayer information and highlights small-scale variations in strong reflection events more prominently (as shown by the red arrows in Figure 6).
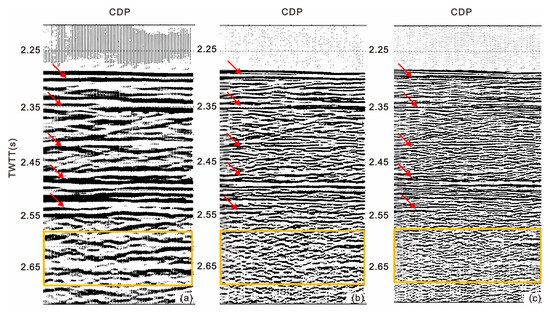
Figure 6.
One-step statistical wavelet deconvolution results (stacked sections): (a) pre-deconvolution; (b) post-deconvolution with a dominant frequency of 150 Hz; (c) post-deconvolution with a dominant frequency of 220 Hz.
4.3. Post-Stack Phase-Shift Time Migration
By referencing the migration methods used in both domestic and international P-cable 3D and short-streamer 3D seismic data processing, the phase-shift migration method, which is widely adopted in production practices, was selected for post-stack time migration. Following migration, diffracted waves and inclined events were largely accurately repositioned, with distinct breakpoints. Meanwhile, characteristics in the section, such as disordered phases of events and irregular variations in amplitude and frequency caused by the presence of natural gas, were also made highly visible (Figure 7).
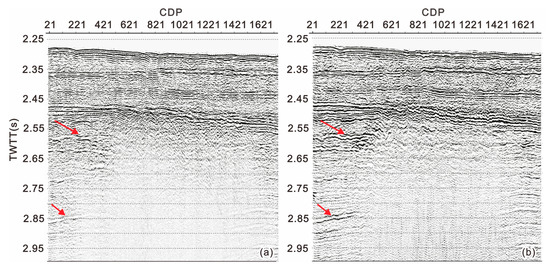
Figure 7.
Comparison of seismic sections before (a) and after (b) migration.
4.4. Velocity Analysis Technique
The high-precision small-scale 3D seismic exploration system uses short streamers, resulting in less distinct hyperbolic reflection wave characteristics in CDP (common depth point) gathers. Consequently, conventional stacking velocity spectra show poor focusing, making it challenging to obtain subsurface velocity information effectively. This limitation necessitates a tailored approach to velocity analysis. While the use of regional velocities from historical 3D data as a reference could be potentially risky if the geological conditions were not consistent, this risk was mitigated in our study. The historical data were acquired from the immediate vicinity of our current survey area, ensuring geological representativeness. The regional stacking velocities, which ranged from approximately 1500 m/s at the seabed to around 1900–2100 m/s at the target depth, served as a robust initial model rather than a direct substitute. This model was geographically calibrated to our survey coordinates and formed the basis for our subsequent constant-velocity scanning, ensuring that a geologically reasonable starting point constrained the derived velocities. For this processing task, regional velocities from historical 3D data were used as reference velocities, and a constant-velocity scanning method based on these reference velocities was adopted for single-point velocity analysis to provide a velocity field for normal moveout (NMO) correction. Single-point velocity analysis is suitable for research areas with relatively simple structural conditions. When the stratigraphic dip is significant or the structure is complex, multi-point velocity analysis is used, with multi-point velocity curves interpolated along the spatial direction to establish a stacking velocity field. Given the relatively simple structural conditions of the target horizons in the operational area of this project, single-point velocity analysis was selected. By repeatedly comparing CMP (common middle point) gathers and stacked profiles, the optimal velocity was determined based on the criteria of flattened event axes in the gathers and maximum signal energy in the stacked profiles. After NMO correction, the event axes in the CMP gathers of line01 were essentially flattened, and the signal energy in the stacked profiles was enhanced, indicating high-velocity accuracy (Figure 8). Ultimately, a stacking velocity field with stable lateral velocities and vertically varying velocities was developed.
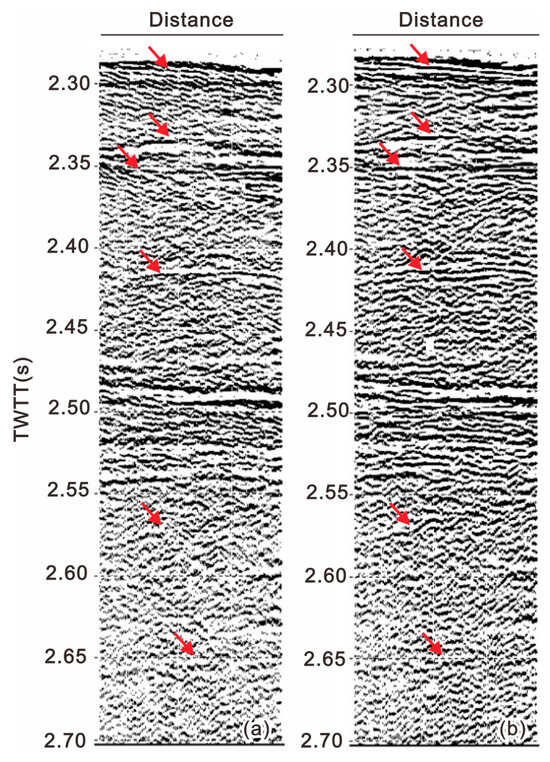
Figure 8.
Comparison of stacked sections before (a) and after (b) NMO correction.
4.5. Residual-Static Correction Technique
Residual-static correction processing for high-precision small-scale 3D seismic exploration is a vital step performed after NMO correction. Its purpose is to eliminate time differences among traces within CDP gathers, align the reflection wave event phases across all traces in the gather, enhance stacking effects, improve the SNR and resolution, and highlight signal characteristics. For high-precision small-scale 3D seismic data, the datum surface is approximately a plane located 2 m below the sea surface. Time differences caused by factors such as streamer bending, depth variations from sea breezes and swells, variations in source depth, and errors in stacking velocities are relatively small. They can be treated as residual-static-correction time differences.
To address small-amplitude time differences, the high-precision small-scale 3D seismic exploration technology employs a surface-consistent, reflection-wave, and residual-static correction method. Satisfactory processing results are achieved when the correlation analysis time window is set to 2100–2800 ms, and the time shift is set to twice the sampling interval (−2–2 ms). The surface-consistent, reflection-wave, and residual-static correction method is a commonly used approach for eliminating short-wavelength static-correction time differences. Its specific implementation involves the following three stages: time difference picking, decomposition, and correction. This method utilizes CDP gather records after NMO correction, taking the stacked record trace as the model trace. Based on the cross-correlation method, it statistically calculates the time differences between each trace within the CDP gather and the model trace. According to surface-consistent conditions, these time differences are decomposed into shot point and receiver point components, thereby correcting the static-correction time differences. After processing, the SNR, resolution, and wave group characteristics of the stacked profile are improved (Figure 9).
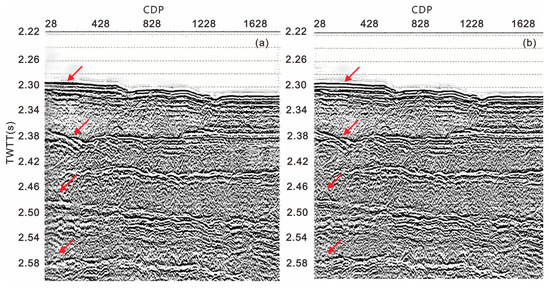
Figure 9.
Comparison of stacked sections before (a) and after (b) residual-static correction.
5. Results
Figure 10 presents the seismic profile of line01 passing through station W09. The high-precision small-scale 3D seismic data exhibit excellent continuity, strong energy, and clearly highlight micro-topographic structures in shallow seafloor reflections. Features, such as mass transport deposits, gas cloud zones, bright spots, faults, and locally enhanced reflections, are readily identifiable. Previous hydrate drilling and comprehensive studies have confirmed that hydrate enrichment is closely related to these mass transport deposits and shallow deformation structures. The high-resolution imaging of shallow sedimentary geological features provides critical support for understanding deep-water sedimentary dynamics and assessing hydrocarbon resource potential.
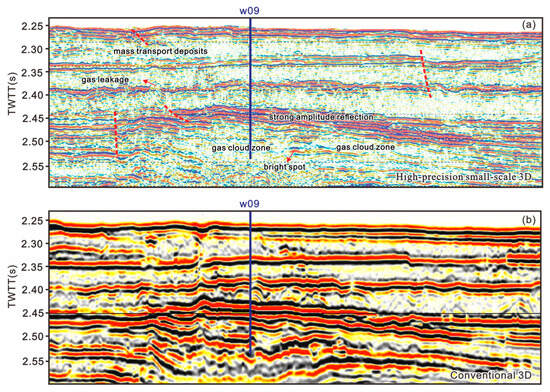
Figure 10.
Comparison of high-precision small-scale 3D processing results for line01 (a) and conventional processing results (b). W09 is a drilling and coring well used for gas hydrate exploration.
Compared to conventional 3D seismic data (Figure 10b) acquired at the same location, the high-precision small-scale 3D profile (Figure 10a) shows richer stratigraphic information with more precise boundaries and more detailed structures. Assuming a velocity of 2000 m/s, the high-precision 3D data (with a dominant frequency of 150 Hz, for example) provides a theoretical resolution of about 3.3 m, whereas conventional data (60 Hz) resolves at roughly 8.3 m. In practice, the high-precision system can distinguish layers as thin as 3–4 m, much better than the 8–9 m possible with conventional methods. Small-scale variations at reflection interfaces are highlighted, gas-related blur zones are more distinct, and fault features are more clearly defined. Although both datasets have similar SNRs, the high-precision data reveal more detailed fluid-dynamic, superior-resolution information. Conversely, the conventional processing results lack clarity and do not preserve fine structural and stratigraphic details.
The high-precision small-scale 3D seismic data significantly improve the dynamic and kinematic characteristics of reflected waves, such as amplitude, frequency, and phase. This provides a strong basis for high-resolution geophysical inversion and resource assessment. By establishing a reasonably low-frequency model, extracting high-quality seismic wavelets, and selecting suitable inversion parameters, systematic seismic attribute analysis and acoustic impedance inversion were performed. Using the relationship between hydrate saturation from well logs and velocity from cross-plot analysis, key parameters, including gas hydrate saturation and porosity in the target reservoir, were calculated (Supplementary Figure S1). Integrating geological interpretation and geophysical inversion results, key evaluation parameters such as BSR distribution area and adequate thickness were obtained. Quantitative assessments of both gas hydrate resources and free-gas resources within the survey area were then conducted using the volumetric method.
6. Discussion
6.1. Comparison Between High-Precision Small-Scale 3D Seismic Data and P-Cable Data
According to Petersen (2010) [12], P-cable technology can also be used for high-resolution 3D seismic exploration of natural gas hydrates. The P-cable system utilizes shorter streamer arrays, typically consisting of 12 to 24 compact receiver cables measuring from 25 to 50 m. These cables feature hydrophone intervals of about 3.125 m and are deployed with cross-cable spacing of 6 to 12 m. The operational water depth for P-cable surveys is generally less than 1300 m, with target frequency ranges of 10 to 300 Hz (expandable to 10 to 400 Hz) and dominant frequencies concentrated between 120 and 170 Hz. In contrast, the high-precision small-scale 3D seismic survey in this study was conducted in water depths of 1500 to 1800 m, achieving a broader target frequency range of 10 to 390 Hz with dominant frequencies spanning from 120 to 220 Hz. This wider frequency bandwidth demonstrates superior vertical resolution, enabling detailed characterization of small-scale geological features (Figure 11).
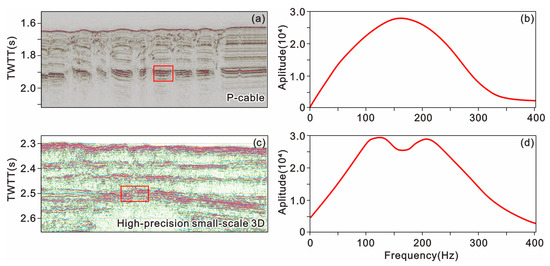
Figure 11.
Comparison of processing results between the high-precision small-scale 3D seismic system and the foreign P-cable system: (a) P-cable seismic profile [34]; (b) spectrum of the P-cable seismic profile [34]; (c) high-precision small-scale 3D seismic profile; (d) spectrum of a high-precision small-scale 3D seismic profile.
This configuration, however, entails inherent trade-offs. The lower fold and narrower cross-line aperture, compared to larger P-cable arrays, may limit the signal-to-noise ratio and spatial sampling for larger-scale subsurface features in the cross-line direction. Consequently, system selection requires balancing the pursuit of ultra-high vertical resolution against the benefits of broader azimuth coverage and higher fold afforded by systems with more streamers.
6.2. Considerations for Data-Processing Parameter Selection
Spectral broadening technology holds significant scientific and practical value in seismic exploration. Its core mechanism involves expanding the frequency bandwidth of seismic signals—particularly by recovering or enhancing high-frequency components—to improve data resolution and geological interpretation accuracy substantially. This technology reduces the seismic wavelet size, allowing for the identification of thinner strata and surpassing the traditional resolution limits to achieve meter-scale or even finer precision. Simultaneously, it clearly reveals subtle structural features such as minor faults and micro-fractures, significantly improving reservoir characterization and providing solid evidence for accurately mapping internal reservoir architectures. Based on the principles mentioned above, this study employs line01 as a case example, utilizing one-step statistical wavelet deconvolution for spectral broadening. During processing, two sets of output wavelet-dominant frequencies were configured—150 Hz and 220 Hz—yielding two distinct processing results—a high-SNR dataset (150 Hz) and a high-resolution dataset (220 Hz).
The final high-SNR result profile is shown in Figure 12a. This profile displays strong-amplitude, well-continuous reflection events with high-SNR qualities. The target formation exhibits a frequency range from 6 to 400 Hz, a dominant bandwidth from 10 to 360 Hz, and a dominant frequency of 140 Hz (Figure 12c). The lateral resolution along the main survey line is 3.125 m, while the vertical resolution ranges from 2 to 3 m. The final high-resolution result profile is presented in Figure 12b. For the target formation (shallower than 300 m below the seafloor), the dominant bandwidth spans from 10 to 390 Hz with a dominant frequency of 200 Hz (Figure 12d). The lateral resolution remains 3.125 m, while the vertical resolution improves to 1–2 m. This processing outcome features higher dominant frequencies, broader bandwidths, and greater wavelet compression, resulting in decomposed composite waves and attenuated individual reflection amplitudes. To preserve gas-induced reflection anomalies and small-scale structural features, post-stack noise attenuation was intentionally minimized. Nevertheless, the primary reflection events maintain strong amplitudes and good continuity, indicating an overall moderate SNR for this dataset.
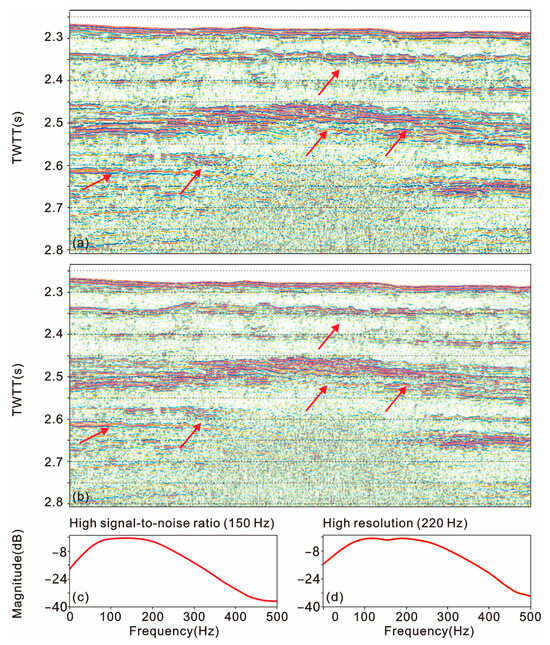
Figure 12.
Comparative analysis of the high-SNR processed seismic profile (a) and the high-resolution processed seismic profile (b). Panels (c,d) show the spectral diagrams corresponding to the high-SNR processed profile and the high-resolution processed profile, respectively.
Regarding the target strata, a comparison of the two processed seismic profile results reveals the following:
- In terms of SNR, the high-SNR processing result is superior. The continuity of strong-amplitude events is better, making them easier to trace across the entire profile. Amplitude and phase anomalies caused by fluids are more pronounced. Due to the improved resolution, composite events in the high-resolution profile are separated, with weaker amplitudes and less continuity, which makes accurate identification, interpretation, and tracing more challenging.
- In terms of resolution, the high-resolution processing result is superior. The processed profile provides a more detailed depiction of the seafloor’s characteristics and primary reflective interfaces within the target layer, providing richer information on faults and fracture systems. The correlation between fluids and fracture systems is more prominent.
7. Conclusions
This paper presents an independent research and development project for a high-precision small-scale 3D seismic exploration system. By optimizing acquisition parameters (such as small trace spacing and short streamers) and data-processing methods (including pre-stack noise attenuation and spectral broadening), the system significantly enhances the vertical and horizontal resolution, as well as the imaging quality, of seismic data. Compared to conventional seismic techniques, this system demonstrates higher precision and flexibility in the exploration of shallow gas hydrates, providing reliable technical support for natural-gas hydrate exploration.
The research team completed a 50 km2 3D seismic acquisition operation in the Qiongdongnan basin, northern South China Sea, successfully achieving precise imaging of sub-seafloor strata within 300 m depth. Through comparison with conventional 3D seismic data, the high-precision small-scale 3D seismic data exhibit superior advantages in terms of resolution and detailed depiction, offering crucial evidence for the precise identification of gas hydrates and the acquisition of reservoir parameters.
Although the current system is equipped with only four streamers, its low cost, high precision, and flexible operation indicate promising application prospects. In the future, by increasing the number of streamers, the system can further enhance exploration efficiency, providing technical assurance for the industrial development of natural gas hydrates. Additionally, the successful application of this technology offers new solutions for deep-water resource exploration and marine geological research.
Supplementary Materials
The following supporting information can be downloaded at: https://www.mdpi.com/article/10.3390/jmse13091703/s1, Figure S1. (a) P-wave impedance profile. (b) Gas saturation in hydrate. (c) Gas hydrate saturation. (d) Hydrate saturation.
Author Contributions
Conceptualization, D.Z., S.L., X.Z., Q.Z., Q.Y., and Z.M.; methodology, L.G., S.L., and D.Z.; software, L.G., J.L., J.Z. (Jingjing Zhang), and J.Z. (Jiafa Zhang); validation, S.L.; formal analysis, S.L. and Q.Z.; investigation, D.Z., X.H., Q.Y., J.S., and Z.H.; resources, X.Z.; data curation, D.Z.; writing—original draft preparation, D.Z., S.L., L.G., J.L., J.Z. (Jingjing Zhang), J.Z. (Jiafa Zhang), J.S., Z.M., and Z.H.; writing—review and editing, S.L., D.Z., and X.Z.; visualization, S.L. and L.G.; supervision, S.L., X.Z., and X.H.; project administration, X.H.; funding acquisition, X.H. and Q.Z. All authors have read and agreed to the published version of the manuscript.
Funding
This work is supported by the National Key Research and Development Program of China (grant no. 2024YFC2813303).
Data Availability Statement
The original contributions presented in this study are included in the article. Further inquiries can be directed to the corresponding author.
Acknowledgments
We are grateful to the crew of the R/V Hai Yang Di Zhi Ba Hao, as well as the scientists and technicians, for their valuable contributions during the HYDZ8-202205 and HYDZ8-202301 cruises. We are deeply grateful to Pengfei Wen for his expert guidance and insightful suggestions for this paper.
Conflicts of Interest
The authors declare no conflicts of interest.
References
- Du, L.Z.; Qiu, J.H.; Zhang, Q.; Zhang, X.P. Development and application of a high-fidelity and high-resolution telemetry seismic data acquisition system. Chin. J. Geophys. 2019, 62, 3964–3973, (In Chinese with English abstract). [Google Scholar]
- Zhou, D.S.; Zeng, X.J.; Yang, C.; Zhai, J.F. Technical Analysis of the P-cable High Resolution 3D Marine Acquisition System. J. Ocean Technol. 2022, 41, 51–60. [Google Scholar]
- Markl, R.; Bryan, G.; Ewing, J. Structure of the Blake-Bahama Outer Ridge. J. Geophys. Res. Atmos. 1970, 75, 4539–4555. [Google Scholar] [CrossRef]
- Shipley, T.; Houston, M.; Buffler, R.; Shaub, F.; McMillen, K.; Ladd, J.; Worzel, J. Seismic Evidence for Widespread Possible Gas Hydrate Horizons on Continental Slopes and Rises. Aapg Bull. 1979, 63, 2204–2213. [Google Scholar]
- Holbrook, W.; Hartley, H.; Wood, W.; Stephen, R.; Daniel, L. Methane Hydrate and Free Gas on the Blake Ridge from Vertical Seismic Profiling. Science 1996, 273, 1840–1843. [Google Scholar]
- Hornbach, M.; Demian, M.; Holbrook, W.; Avendonk, H.; Gorman, A. Three-dimensional seismic imaging of the Blake Ridge methane hydrate province: Evidence for large, concentrated zones of gas hydrate and morphologically driven advection. J. Geophys. Res. 2008, 113, B07101. [Google Scholar] [CrossRef]
- Hyndman, R.; Spence, G.A. seismic study of methane hydrate marine bottom simulating reflectors. J. Geophys. Res. 1992, 97, 6683–6698. [Google Scholar] [CrossRef]
- Hobro, J.; Minshull, T.; Singh, S. Tomographic seismic studies of the methane hydrate stability zone in the Cascadia Margin. Geol. Soc. Lond. Spec. Publ. 1998, 137, 133–140. [Google Scholar] [CrossRef]
- Riedel, M. Three-Dimensional Seismic Investigations of Northern Cascadia Marine Gas Hydrates. Doctoral Dissertation, University of Victoria, Victoria, BC, Canada, 2001. [Google Scholar]
- Rensbergen, P.; Batist, M.; Klerkx, J.; Hus, R.; Poort, J.; Vanneste, M.; Granin, N.; Khlystov, O.; Krinitsky, P. Sub-lacustrine mud volcanoes and methane seeps caused by dissociation of gas hydrates in Lake Baikal. Geology 2002, 30, 631–634. [Google Scholar] [CrossRef]
- Popescu, I.; Gilles, L.; Nicolae, P.; Batist, M.; Gillet, H. Seismic expression of gas and gas hydrates across the western Black Sea. Geo-Mar. Lett. 2007, 27, 173–183. [Google Scholar] [CrossRef]
- Petersen, C.J.; Bünz, S.; Hustoft, S.; Mienert, J.; Klaeschen, D. High-resolution P-Cable 3D seismic imaging of gas chimney structures in gas hydrated sediments of an Arctic sediment drift. Mar. Pet. Geol. 2010, 27, 1981–1994. [Google Scholar] [CrossRef]
- Bangs, N.L.; Hornbach, M.J.; Berndt, C. The mechanics of intermittent methane venting at South Hydrate Ridge inferred from 4D seismic surveying. Earth Planet. Sci. Lett. 2011, 310, 105–112. [Google Scholar] [CrossRef]
- Bünz, S.; Polyanov, S.; Vadakkepuliyambatta, S. Active gas venting through hydrate-bearing sediments on the Vestnesa Ridge, offshore W-Svalbard. Mar. Geol. 2012, 332–334, 189–197. [Google Scholar] [CrossRef]
- Xu, H.N.; Shu, H.; Li, L.Q.; Zhang, M.; Zhang, G.X. 3-D seismic data processing techniques for gas hydrate by the single-source and single-cable acquisition method. Prog. Geophys. 2009, 24, 1801–1806. [Google Scholar]
- Zhang, X.D.; Wen, P.F.; Xu, Y.X.; Zhang, B.J. Footprint analysis and supperss processing of dual-source and single cable 3D seismic data for gas hydrate. Mar. Geol. Front. 2015, 31, 55–61. [Google Scholar]
- Zhu, Y.M.; Sun, L.T.; Hao, F.; Tuo, L. Geochemical composition and origin of tertiary oils in the Yinggehai and Qiongdongnan basins, offshore South China Sea. Mar. Pet. Geol. 2018, 96, 139–153. [Google Scholar] [CrossRef]
- Huang, B.J.; Tian, H.; Li, X.S.; Wang, Z.F.; Xiao, X.M. Geochemistry, origin and accumulation of natural gases in the deep water area of the Qiongdongnan Basin, South China Sea. Mar. Pet. Geol. 2016, 72, 254–267. [Google Scholar] [CrossRef]
- Li, Y.Y.; Pang, L.; Wang, Z.D.; Meng, Q.X.; Guan, P.; Xu, X.M.; Fang, Y.X.; Lu, H.L.; Ye, J.L.; Xie, W.W. Geochemical characteristics and significance of organic matter in hydrate-bearing sediments from Shenhu area, South China Sea. Molecules 2022, 27, 2533. [Google Scholar] [CrossRef]
- Cui, H.P.; Su, X.; Chen, F.; Melanie, H.; Yang, S.X.; Liang, J.Q.; Su, P.B.; Dong, H.L.; Hou, W.G. Microbial diversity of two cold seep systems in gas hydrate-bearing sediments in the South China Sea. Mar. Environ. Res. 2019, 144, 230–239. [Google Scholar] [CrossRef]
- Liang, J.Q.; Zhang, W.; Lu, J.A.; Wei, J.G.; Kuang, Z.G.; He, Y.L. Geological occurrence and accumulation mechanism of natural gas hydrates in the eastern Qiongdongnan Basin of the South China Sea: Insights from site GMGS5-W9-2018. Mar. Geol. 2019, 418, 106042. [Google Scholar] [CrossRef]
- Zhu, W.L.; Huang, B.J.; Mi, L.J. Geochemistry, origin, and deep-water exploration potential of natural gases in the Pearl River Mouth and Qiongdongnan basins, South China Sea. AAPG Bull. 2009, 93, 741–761. [Google Scholar] [CrossRef]
- Liang, Q.Y.; Hu, Y.; Feng, D.; Peckmann, J.; Chen, L.Y.; Yang, S.X.; Liang, J.Q.; Tao, J.; Chen, D.F. Authigenic carbonates from newly discovered active cold seeps on the northwestern slope of the South China Sea: Constraints on fluid sources, formation environments, and seepage dynamics. Deep Sea Res. Part I Oceanogr. Res. Pap. 2017, 124, 31–41. [Google Scholar] [CrossRef]
- Ma, M.; Li, C.; Lv, C.F.; Chen, G.J.; Yang, F.; Yan, Y.K.; Yin, N.; Zhang, G.C. Geochemistry and provenance of a multiple-stage fan in the Upper Miocene to the Pliocene in the Yinggehai and Qiongdongnan basins, offshore South China Sea. Mar. Pet. Geol. 2017, 79, 64–80. [Google Scholar] [CrossRef]
- Zhang, W.; Liang, J.Q.; Wei, J.G.; Lu, J.A.; Su, P.B.; Lin, L.; Huang, W.; Guo, Y.Q.; Deng, W.; Yang, X.L.; et al. Geological and geophysical features of and controls on occurrence and accumulation of gas hydrates in the first offshore gas-hydrate production test region in the Shenhu area, northern South China Sea. Mar. Pet. Geol. 2020, 114, 104191. [Google Scholar] [CrossRef]
- Lei, C.; Ren, J.L.; Pei, J.X.; Lin, H.T.; Yin, X.Y.; Tong, D.J. Tectonic framework and multiple episode tectonic evolution in deepwater area of Qiongdongnan Basin, northern continental margin of South China Sea. Earth Sci. 2011, 36, 151–162. [Google Scholar] [CrossRef]
- Wei, J.G.; Liang, J.Q.; Lu, J.A.; Zhang, W.; He, Y.L. Characteristics and dynamics of gas hydrate systems in the northwestern South China Sea: Results of the fifth gas hydrate drilling expedition. Mar. Pet. Geol. 2019, 110, 287–298. [Google Scholar] [CrossRef]
- Lai, H.F.; Fang, Y.X.; Kuang, Z.G.; Ren, J.F.; Liang, J.Q.; Lu, J.A.; Wang, G.L.; Xing, C.Z. Geochemistry, origin and accumulation of natural gas hydrates in the Qiongdongnan Basin, South China Sea: Implications from site GMGS5-W08. Mar. Pet. Geol. 2021, 123, 104774. [Google Scholar] [CrossRef]
- Lai, H.F.; Qiu, H.J.; Liang, J.Q.; Kuang, Z.G.; Fang, Y.X.; Ren, J.F.; Lu, J.A. Geochemical characteristics and gas-to-gas correlation of two leakage-type gas hydrate accumulations in the western Qiongdongnan Basin, South China Sea. Acta Geol. Sin. 2022, 96, 680–690. [Google Scholar] [CrossRef]
- Fang, Y.X.; Wei, J.G.; Lu, H.L.; Liang, J.Q.; Lu, J.A.; Fu, J.; Cao, J. Chemical and structural characteristics of gas hydrates from the Haima cold seeps in the Qiongdongnan Basin of the South China Sea. J. Asian Earth Sci. 2019, 182, 103924. [Google Scholar] [CrossRef]
- He, Y.L.; Liang, J.Q.; Kuang, Z.G.; Deng, W.; Ren, J.F.; Lai, H.F.; Meng, M.M.; Zhang, W. Migration and accumulation characteristics of natural gas hydrates in the uplifts and their slope zones in the Qiongdongnan Basin, China. China Geol. 2022, 5, 234–250. [Google Scholar] [CrossRef]
- Klauda, J.; Sandler, S. Global distribution of methane hydrate in ocean sediment. Energy Fuels 2005, 19, 459–470. [Google Scholar] [CrossRef]
- Zhou, D.S.; Yang, C.; Zeng, X.J.; Gou, L.M.; Yao, Q.W.; Hu, T.Y. Application of high-precision small 3D seismic acquisition technology in deep water gas hydrate exploration. Acta Geol. Sin. 2024, 98, 2678–2685. [Google Scholar]
- Singhroha, S.; Bünz, S.; Plaza-Faverola, A. Gas hydrate and free gas detection using seismic quality factor estimates from high-resolution P-cable 3D seismic data. Interpretation 2016, 4, SA39–SA54. [Google Scholar] [CrossRef]


Disclaimer/Publisher’s Note: The statements, opinions and data contained in all publications are solely those of the individual author(s) and contributor(s) and not of MDPI and/or the editor(s). MDPI and/or the editor(s) disclaim responsibility for any injury to people or property resulting from any ideas, methods, instructions or products referred to in the content. |
© 2025 by the authors. Licensee MDPI, Basel, Switzerland. This article is an open access article distributed under the terms and conditions of the Creative Commons Attribution (CC BY) license (https://creativecommons.org/licenses/by/4.0/).