1. Introduction
Population growth and resource consumption are root causes of degrading coastal coral reefs [
1,
2]. Global net population expansion equates to the creation of a new City of Miami every two days and a new United States every four years [
3,
4]. A population living in proximity to the Florida Reef of more than six million people has pressured the region’s coral reefs into extreme degradation, despite the region’s extensive history of innovative marine management [
2,
4,
5,
6,
7]. While stakeholders acknowledge the reef system’s degradation, they do not connect it to climate change [
8,
9]. The current study explores stakeholders’ views about climate change and coral reefs, and it examines seafood purchasing as an untapped resource and to reveal motivations for sustainable management.
1.1. The Florida Reef Context, Stakeholders, and Climate Change
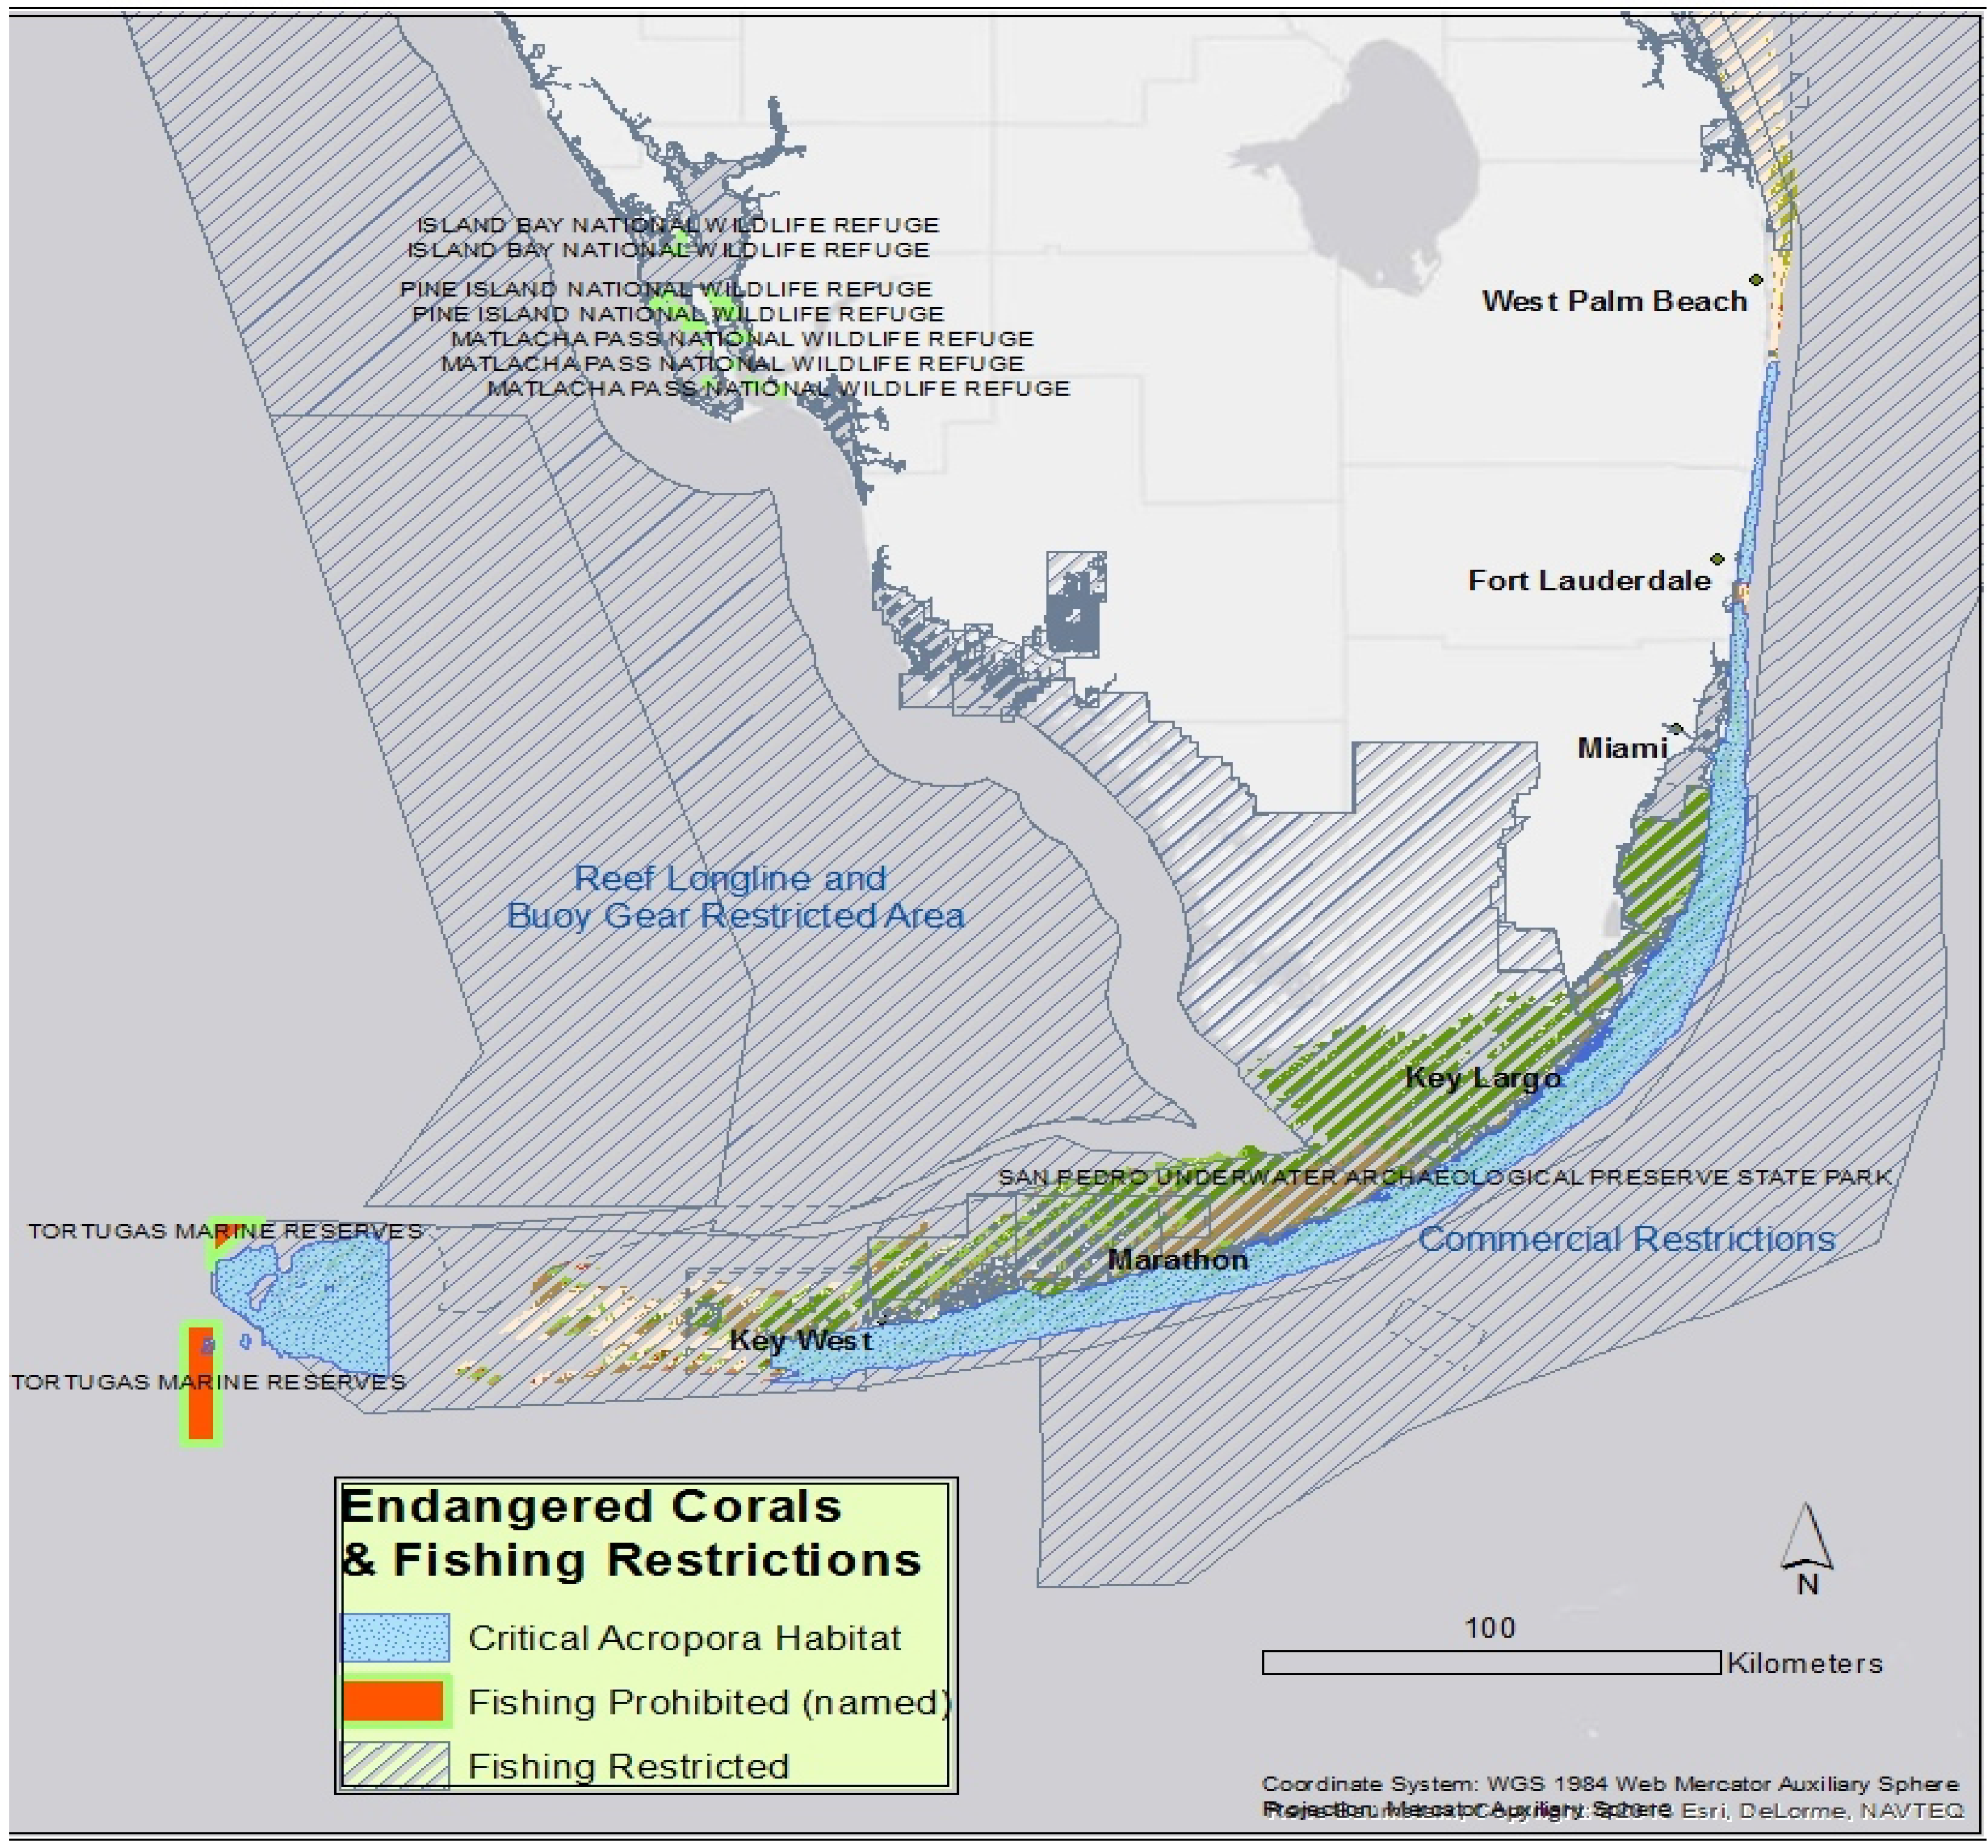
The Florida Reef forms a mostly continuous biological arc of 560 kilometers in length that parallels the Atlantic shoreline of southeastern Florida, and an adjacent human arc of coastal urbanization extends from Key West to north of Palm Beach County (see
Figure 1) [
9,
10,
11,
12]. Florida Keys’ residents within Monroe County, representing 1% of the five-county region’s population, have intense cultural and economic connections with the Florida Reef, whereas residents of the economically heterogenous, four mainland counties are disconnected and lacking in basic, existential awareness [
4,
8,
9,
13].
Sparse peer-reviewed, social science literature addresses preferences and perceptions of the Florida Reef, and although technical and governmental reports provide insights, influential factors are not consistent across studies [
14,
15,
16,
17,
18]. Comparisons of research find that travel cost methods inflate coral reef values, whereas contingent valuation, employed in the current study, may underestimate them [
19,
20]. Contingent valuation has a strong theoretical foundation and has been used widely in studies of coral reefs [
19,
20,
21].
While many issues affect coral reefs, the fundamental threat of climate change must be addressed if they are to have any chance at long-term survival [
5,
22]. Across four studies since 2006, climate change and global warming were not major apprehensions of mainland stakeholders [
8,
9,
14,
23]. In the Florida Keys, commercial fishers, dive operators, and environmental group members did not mention climate issues in a 2008 study [
7]. These five studies found a convergence in the perceptions of Florida’s coral reefs as declining resources and water quality as a major threat.
Regarding climate change attitudes of Florida residents, a 2008 study found that supermajorities accepted the reality of global warming and were willing to pay compensatory fees [
24]. As for coral reefs in Florida, 61% agreed (26% strongly) that global warming is causing damage, indicating a possible contrast with Florida Reef stakeholders [
24].
1.2. Fishing Regulation
Fishing is arguably the second most important industry associated with the Florida Reef, after tourism, yet research of its social institutions is lacking. Both commercial and recreational fishing regulations are exceedingly complex, highly time and space dependent, and distributed across a web of agencies [
25]. Overfishing is considered the oldest and largest local impact on Florida’s coral reefs [
26,
27].
Figure 1.
The Florida Reef extends from north of West Palm Beach to west of Key West. Two species of
Acropora corals listed under the U.S. Endangered Species Act have designated critical habitat within the region. Fishing near the Florida Reef is prohibited in two reserves and one state park, and offshore commercial fishing is broadly regulated [
28,
29].
An assemblage of agencies operate within the Florida Keys National Marine Sanctuary; moreover, the regulations for fishing vary by season and by zone, creating a labyrinth of fluctuating access and permitted harvesting within the Sanctuary [
30]. Strictly non-fishing areas or no take zones within the Sanctuary cover 6% of the hard bottom area [
30], and they have proven effective at increasing reef fish populations [
31]. In contrast, the Florida Reef’s mainland area has almost no place-based restrictions or marine protected areas and remains a broadly open pool resource [
32].
All rated “living resources” within the Sanctuary are assessed by the U.S. federal government as fair or poor, and none are improving, with key species such as corals and groupers ranking in the lowest category of “poor” [
31]. In Biscayne National Park, located immediately north of the Sanctuary, the majority of reef species are overfished, and the degradation documented is greater than similar declines across the Caribbean [
2,
26,
33].
1.3. Commercial Fishing Impacts
Cooke argues that recreational and commercial fishing should be considered as essentially equivalent in global impact [
25]. Recreational fishing has greater economic impact than the commercial harvesting sector in the U.S., and the distinction is especially pronounced in Florida [
34,
35]. Sales from Florida’s $7 billion-plus recreational fishing industry rival the entire nation’s sales from commercial harvesting at $10 billion [
34]. From 1990 to 2007, seafood imports in Florida increased 130% in value while commercial landings fell 42% [
36].
Even with decades of documented loss, a majority of commercial fishers in the mainland region believe that reef fisheries are improving [
23,
27]. This misconception may be partially explained by the reduction of effort within the industry, because the number of regional commercial fishers declined 38% from 1994 to 2009; moreover, these fewer fishing operators are less likely to target reef species and may conflate them with pelagic captures [
23].
1.4. Florida Recreational Fishing Industry
In southeastern Florida, the impact of recreational fishing on coral reefs is considered much larger than commercial fishing; for example, within a two-day mini season, more than 50,000 divers remove an estimated 80% to 90% of the spiny lobster stock [
23,
26]. The total harvest of recreational fishing is lower in biomass than commercial fishing [
36]; however, the number of fish caught recreationally may be underestimated, especially considering that approximately half of fish caught recreationally are not landed in the common practice of catch and release, a rate similar to a national estimate at 60% [
25,
26]. The strong, incremental growth of recreational fishing in Florida during the same period that commercial fishing contracted indicates a shift in the source of stakeholder impacts [
27,
36].
The number of Florida’s recreational fishers, or anglers, quadrupled between 1964 and 2000 [
27]. More than two million people hold a fishing license in Florida, with more than one million pertaining to saltwater fishing [
27,
37]. Related to fishing, the number of recreational vessels has skyrocketed in the region, and Monroe County witnessed a 1000% increase between 1964 and 2010 [
31].
1.5. Seafood Industry
Market-based approaches for coastal sustainability have been weakly exploited, and analysis of seafood consumption provides high potential [
38]. As of 2011, the U.S. had 16 of the 102 worldwide fisheries that are certified by Marine Stewardship Council, and its only U.S. Atlantic representative was the Mid-Atlantic deep-sea red crab fishery [
34]. In 2012, the first and only Florida-based operation was MSC certified [
39]. One study of a popular program called Seafood Watch found that it had no significant effect, and an experiment in California supermarkets found that sustainability labels suppressed overall sales of seafood [
40].
The U.S. ranks third in total seafood consumption behind Japan and China [
41]. Of the top 10 harvested species in the U.S., only shrimp is commonly harvested in southeastern Florida [
34]; however, reef-related species from Florida retain high value within the state. In Florida, the most valuable fisheries are, in order, shrimp, lobster, stone crabs, and grouper [
42]. In a regional study near the northern terminus of the Florida reef, the majority of residents reported eating seafood more than three times per week, and 31% of males claimed to eat only fish caught recreationally [
43].
High levels of seafood fraud have been documented in mass media, and in Florida, 62% of consumers showed an awareness that grouper had been sold under false identities. They expressed a willingness to pay a premium of $0.83 to $3.18 to guarantee a “Florida caught grouper” [
42]. Grouper fishing is regulated seasonally, and harvesting of goliath and Nassau grouper is prohibited [
44]. Florida’s recreational anglers express a desire to reopen the reef-associated Atlantic goliath grouper fishery, and they are willing to pay $34 to $79 to harvest a single grouper [
45]. The Florida or Caribbean spiny lobster (
Panulirus argus) is especially familiar to anglers in Florida as a reef-associated species [
10,
13], and they must obtain a $5 annual spiny lobster permit from the state in addition to a $17 annual saltwater fishing license [
44].
Despite various caveats and questions about seafood, including its origins from an environment that is less studied and understood than the terrestrial environment, seafood offers an unmatched societal connection to the ocean that is intuitive to understand and precisely valued in the marketplace.
3. Results
3.1. Marine Orientation and Demographics: Who Are the Stakeholders?
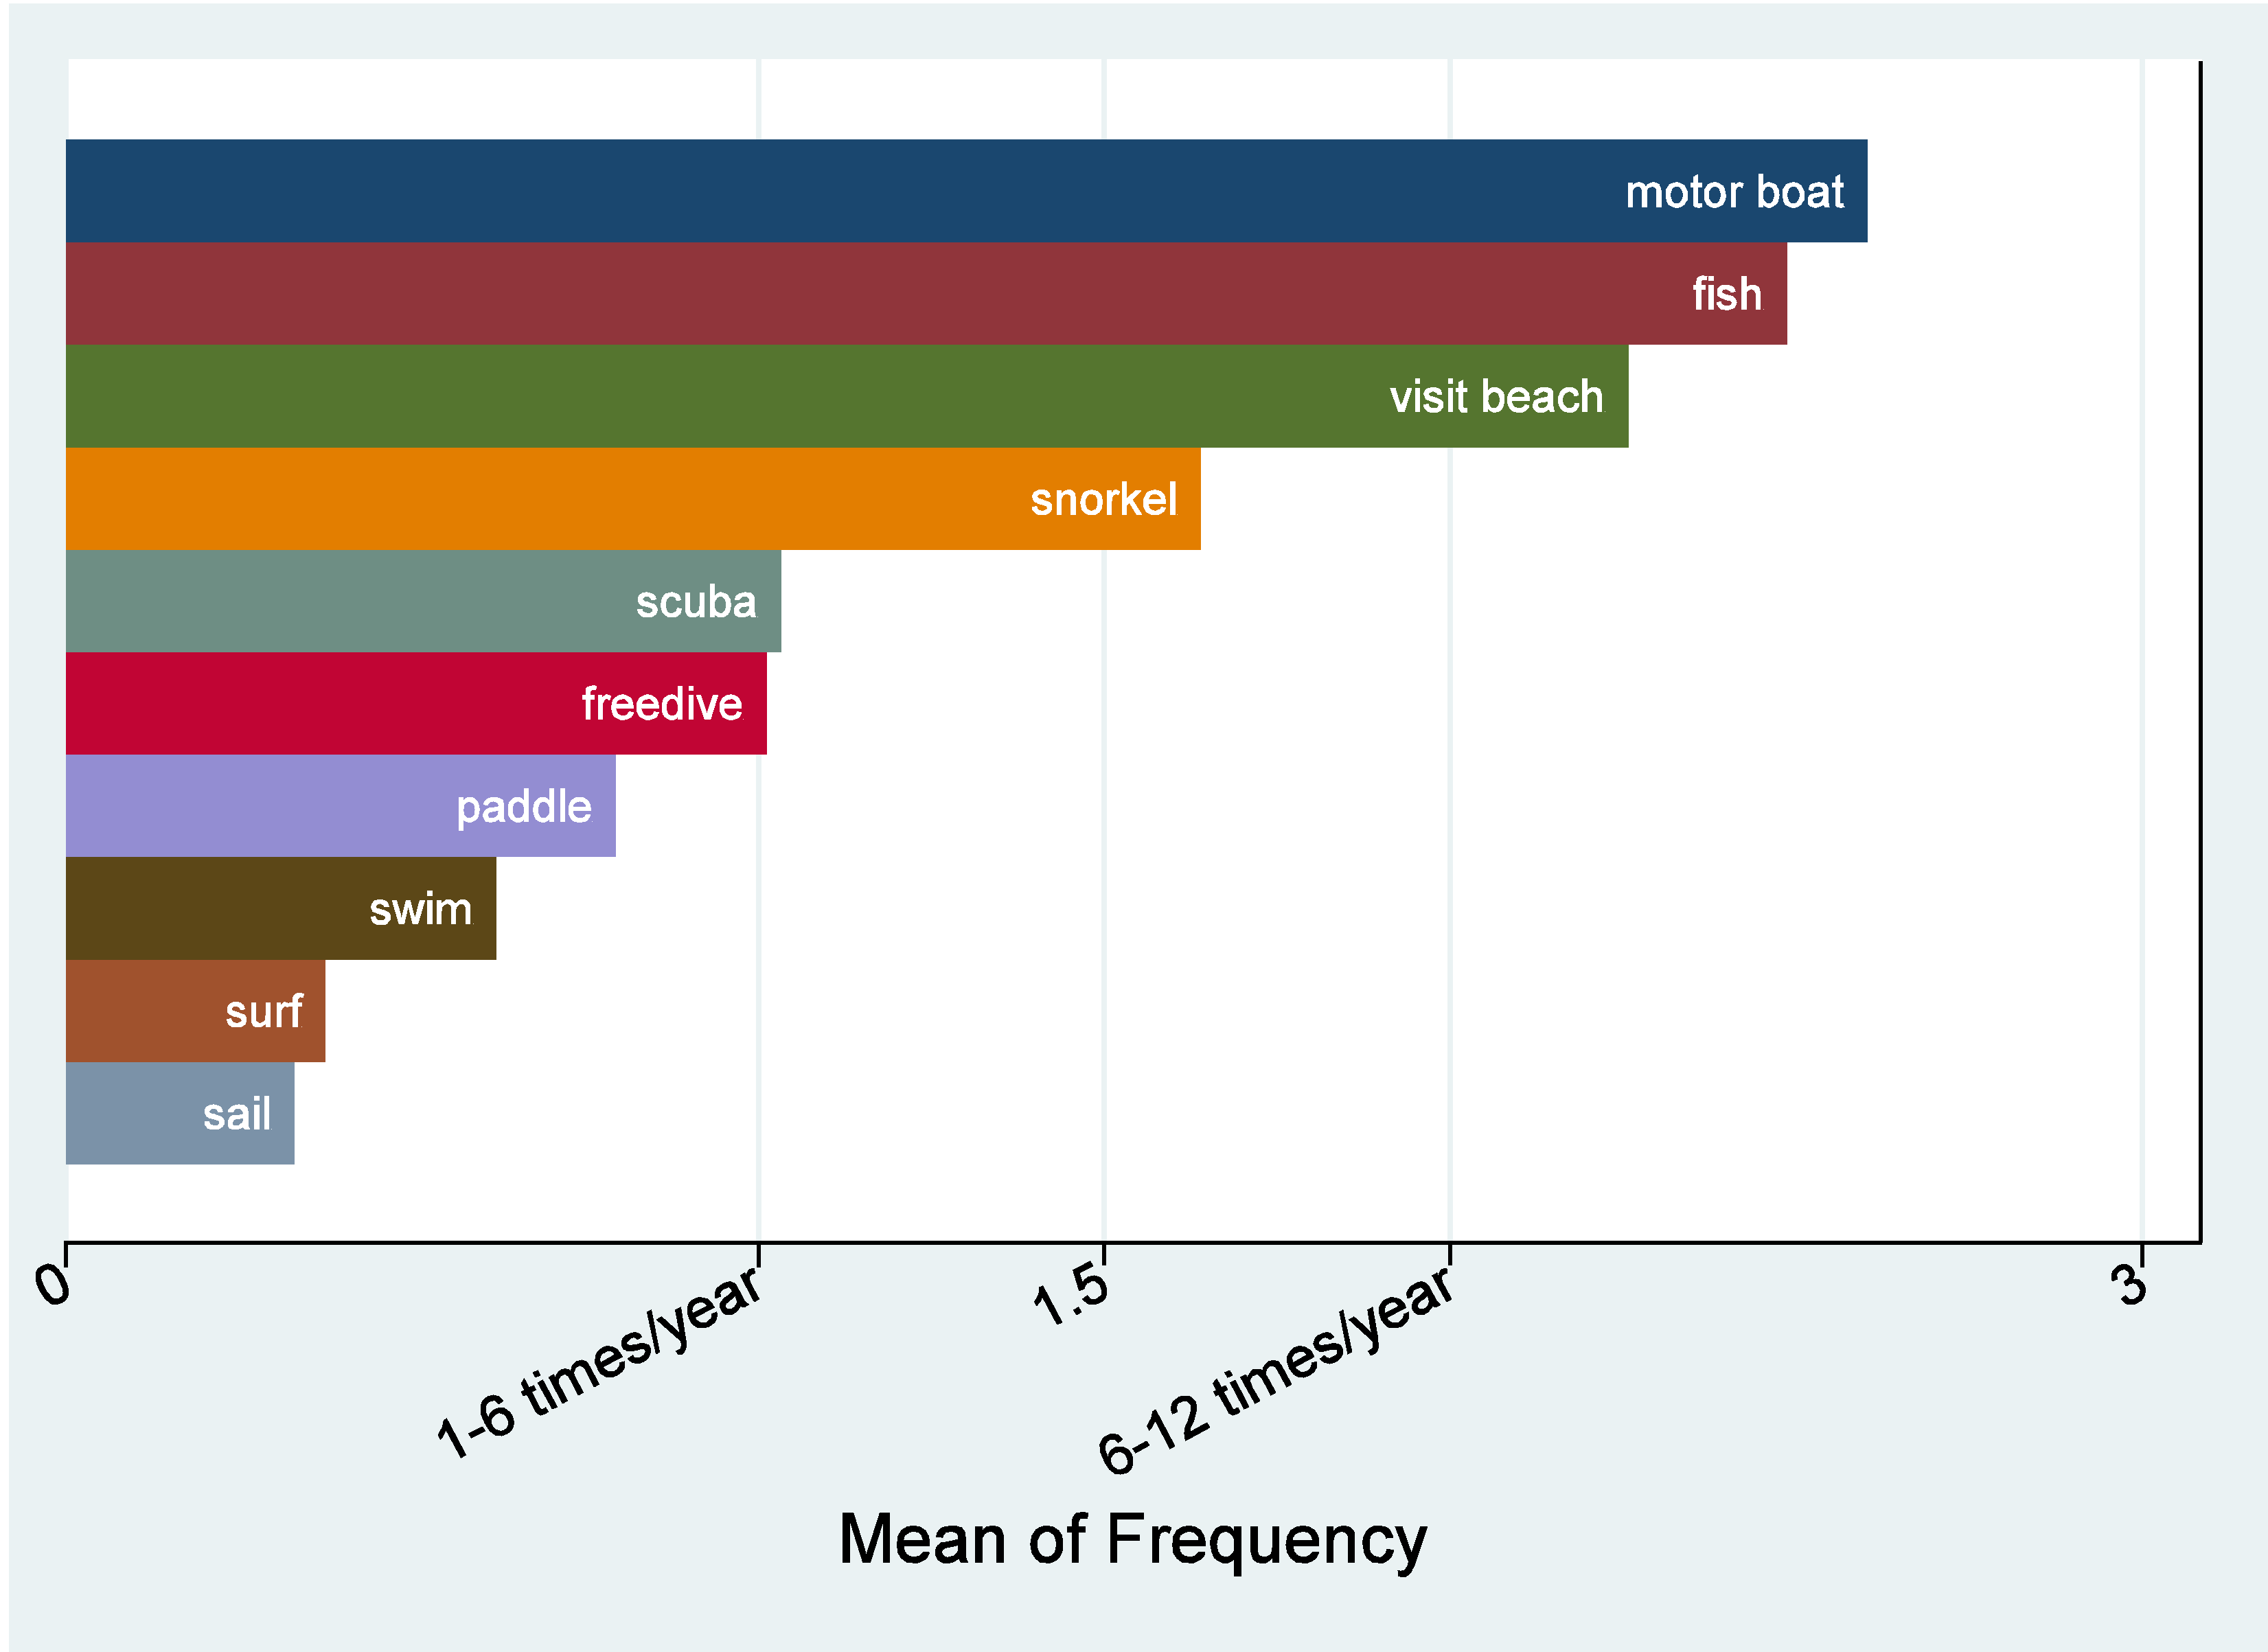
At least 1461 respondents answered initial questions, and 1100 respondents completed a question within the final section. From the total sample of attempted contact with 41,651 email addresses, the rate for survey completion was 2.6%. More than 90% of respondents had been sampled randomly from fishing license holders, and 96% practiced marine fishing within the past year. Marine motorboating is practiced by 95% of respondents, although it registers a slightly higher mean of frequency (see
Figure 2). Majorities also practiced visiting the beach, snorkeling, and scuba diving. Nearly a majority practice freediving, which is associated with spearfishing.
For the Florida Reef, 95% responded affirmatively to this question: “In the past 5 years, have you visited a coral reef in Florida? A visit could include fishing or other activities at the surface (such as snorkeling, surfing, or paddling) where you knew that reefs existed in that location.” For international coral reefs “at any location”, the mean visitation frequency was above the category of “10–20 times”.
The typical respondent is characterized by sex (83% male), race (82% white), ownership of a motorboat (70%), birthplace (57% in U.S. state other than Florida), and a mean age of 47 years. The mean household income registers within the category of $100,000 to $119,999 annually, and the mode is the category of greater than $200,000 annually. The average education level is higher than a two-year college degree, and greater than 99% of respondents completed high school.
Figure 2.
Marine activity by stakeholders is represented by the mean frequency of participation, based on a minimum of 1–6 times per year.
Figure 2.
Marine activity by stakeholders is represented by the mean frequency of participation, based on a minimum of 1–6 times per year.
Politically, the majority identifies as independent, with nearly 60% selecting one of the three categories of Independent/leans Republican, Independent, or Independent/leans Democrat. Selection of the two traditional political parties is 21% Republican and 14% Democrat. Comments for the category of Other (6%) show a tendency towards labels such as Libertarian, Tea Party, and conservative persuasions.
Several variables convey a strong environmental orientation, and 75% prioritize the environment ahead of the economy when forced to choose. Donation of time or money to environmental causes registers at 73% of respondents, and 33% had donated more than $200 in the previous year. On a ten-point scale, self-identification with the word “environmentalist” was 6.1.
Table 2 presents a summary of major variables employed in the current study.
3.2. Florida Reef Perceptions: How do Stakeholders Understand Coastal Resources?
Respondents rated the health of the world’s coral reefs between “mediocre” and “poor”, and a mapped, mainland segment of the Florida Reef registered as slightly better. For this mainland segment, six aquatic resources registered from worst to best: Canals, Corals Reefs, Wetlands, Drinking Water, Beaches, and Seafood.
Table 2.
Variable definitions and descriptive statistics
Table 2.
Variable definitions and descriptive statistics
| Description | Abbreviation | N | Min | Max | Mean | St. Dev. |
|---|
| Marine Activity, frequency |
| Motorboating | Recboat | 1453 | 0 | 4 | 2.602202 | 1.128174 |
| Fishing | Recfish | 1458 | 0 | 4 | 2.485597 | 1.110318 |
| Seafood |
| Consumer of Seafood | Food | 1461 | 0 | 1 | 0.973306 | 0.1612429 |
| Food Offer 1, sustainable | Foodoffer1 | 1956 | 2 | 12 | --- | --- |
| Food Offer 2, local | Foodoffer2 | 1956 | 1 | 6 | --- | --- |
| Will Pay for Sustainable Seafood | Foodsustainable | 1335 | 0 | 1 | 0.6292135 | 0.4831964 |
| Will Pay for Local Seafood | Foodlocal | 1330 | 0 | 1 | 0.7894737 | 0.4078358 |
| Certainty of Choice to Pay, for sustainable and local seafood | Foodcertain | 1329 | 1 | 11 | 9.280662 | 2.186747 |
| Trust in Seafood Labels | Foodtrust | 1329 | 1 | 11 | 7.337848 | 2.910733 |
| Weekly Seafood Budget, household | Foodbudget | 1261 | 1 | 11 | 4.215702 | 2.72486 |
| World’s Coral Reefs |
| Visited Any Coral Reef, frequency | Visitreefs | 1347 | 1 | 5 | 4.322197 | 1.167339 |
| Rate Health of World Reefs | Ratereefs | 1211 | 1 | 5 | 3.559868 | 1.000995 |
| Florida’s Coral Reefs and Threats |
| Visited Florida Reef | FLreef | 1328 | 0 | 1 | 0.9465361 | 0.2250413 |
| Threat of Sewage and Runoff | Threatsewage | 1329 | 1 | 5 | 4.359669 | 0.9026727 |
| Threat of Dredging and Construction | Threatdredge | 1331 | 1 | 5 | 4.196093 | 1.058379 |
| Threat of Invasive Species | Threatinvasive | 1332 | 1 | 5 | 4.141892 | 0.995928 |
| Threat of High Water Temperature | Threattemp | 1333 | 1 | 5 | 3.663916 | 1.223958 |
| Threat of Air Pollution | Threatair | 1328 | 1 | 5 | 3.195783 | 1.237171 |
| Threat of Hurricanes and Natural Disasters | Threathurricane | 1331 | 1 | 5 | 3.166041 | 1.154366 |
| Threat of Shipping and Boating | Threatshipping | 1330 | 1 | 5 | 2.97594 | 1.08316 |
| Threat of Fishing | Threatfishing | 1331 | 1 | 5 | 2.27423 | 1.016002 |
| Threat of Scuba Diving and Snorkeling | Threatscuba | 1330 | 1 | 5 | 1.840602 | 0.9286865 |
| Sources of Information about Coral Reefs |
| Personal Experience | Personal | 1167 | 1 | 8 | 6.017995 | 2.232733 |
| Scientific Literature | Scilit | 1097 | 1 | 8 | 5.321787 | 2.299915 |
| Magazines | Mag | 1037 | 1 | 8 | 5.229508 | 1.855124 |
| Newspapers (print or online) | News | 1023 | 1 | 8 | 4.943304 | 2.220856 |
| Television | Tv | 1047 | 1 | 8 | 4.659981 | 2.019729 |
| Email | Email | 1015 | 1 | 8 | 3.818719 | 1.970854 |
| Social Media | Social | 1029 | 1 | 8 | 3.444121 | 2.260306 |
| Radio | Radio | 1009 | 1 | 8 | 3.194252 | 1.893474 |
| Condition of Florida’s Mainland Aquatic Resources |
| Canals | Canal | 1234 | 1 | 5 | 3.264182 | 1.022804 |
| Coral Reefs | Reefrate | 1236 | 1 | 5 | 3.203883 | 0.891081 |
| Wetlands | Wetland | 1229 | 1 | 5 | 2.932465 | 0.9824994 |
| Drinking Water | Drink | 1234 | 1 | 5 | 2.721232 | 0.9799713 |
| Beaches | Beachrate | 1237 | 1 | 5 | 2.539208 | 0.8549061 |
| Seafood | Seafood | 1233 | 1 | 5 | 2.497972 | 0.9355206 |
| Climate Change Perspective, apprehension |
| Climate Change Concern Scale (combines next 5 variables) | Climate | 1116 | 5 | 25 | 17.00627 | 5.238608 |
| 1. Effect on coral reefs | Climatereef | 1116 | 1 | 5 | 3.69086 | 1.137359 |
| 2. Human influence | Climatehuman | 1116 | 1 | 5 | 3.537634 | 1.197688 |
| 3. Concern about climate change | Climateconcern | 1116 | 1 | 5 | 3.296595 | 1.174783 |
| 4. Concern about sea level rise | Climatesea | 1116 | 1 | 5 | 3.278674 | 1.222485 |
| 5. Effect on hurricanes | Climatehurricane | 1116 | 1 | 5 | 3.202509 | 1.164587 |
| When Climate Change Impacts Florida | When | 1110 | 1 | 6 | 4.673874 | 1.77599 |
| Coral Reef Perspective, agreement |
| Coral Reef Concern Scale (combines next 7 variables) | Coral | 1102 | 9 | 35 | 25.21053 | 5.013257 |
| 1. Acidification threatens corals | Coralacid | 1099 | 1 | 5 | 4.057325 | 0.9616454 |
| 2. Carbon dioxide threatens corals | Coralcarbon | 1099 | 1 | 5 | 3.725205 | 1.111708 |
| 3. Primary value is [not] providing human needs | Coralneeds | 1102 | 1 | 5 | 3.647913 | 1.135422 |
| 4. All reefs in Florida should be protected | Coralprotect | 1102 | 1 | 5 | 3.600726 | 1.286526 |
| 5. Water temperatures are rising too quickly for corals to adapt | Coraltemp | 1100 | 1 | 5 | 3.449091 | 1.087671 |
| 6. Reefs are more endangered than rainforests | Coralrain | 1100 | 1 | 5 | 3.409091 | 0.9394349 |
| 7. Human use should cease if damaging | Coraluse | 1102 | 1 | 5 | 3.354809 | 1.242697 |
| Demographics |
| Age in Years | Age | 1094 | 18 | 85 | 46.6042 | 12.05711 |
| Birthplace | Born | 1096 | 1 | 3 | 1.791971 | 0.6197432 |
| - Born in non-Florida U.S. state | BornUSA | 1096 | 0 | 1 | 0.5729927 | 0.4948692 |
| - Foreign | Bornforeign | 1096 | 0 | 1 | 0.1094891 | 0.3123944 |
| Sex | Sex | 1100 | 0 | 1 | 0.8309091 | 0.3750027 |
| Boat Ownership | Boat | 1098 | 1 | 3 | 2.479964 | 0.8257806 |
| - Own boat without a motor | NonMboat | 1098 | 0 | 1 | 0.0883424 | 0.2839216 |
| - Own boat with a motor | Mboat | 1098 | 0 | 1 | 0.6958106 | 0.4602729 |
| Income | Inc | 1043 | 1 | 11 | 6.230105 | 3.011936 |
| Income, in four categories | Inc4 | 1043 | 1 | 4 | 2.57814 | 1.079552 |
| Political Identity | Pol | 1085 | 0 | 5 | 2.61659 | 1.461846 |
| - Other | PolOther | 1085 | 0 | 1 | 0.0599078 | 0.2374254 |
| - Republican | PolRepub | 1085 | 0 | 1 | 0.2073733 | 0.4056122 |
| - Independent, leans Republican | PolIndRepub | 1085 | 0 | 1 | 0.2156682 | 0.4114748 |
| - Independent | PolInd | 1085 | 0 | 1 | 0.2258065 | 0.4183051 |
| - Independent, leans Democrat | PolIndDem | 1085 | 0 | 1 | 0.1557604 | 0.3627952 |
| - Democrat | PolDem | 1085 | 0 | 1 | 0.1354839 | 0.3423975 |
| Race | Race | 1083 | 1 | 7 | 1.503232 | 1.229166 |
| Education | Edu | 1089 | 1 | 6 | 3.785124 | 1.185745 |
| Education, in three categories | Edu3 | 1089 | 1 | 3 | 2.07989 | 0.6600813 |
| Environmental Identification |
| Prioritize Environment over Economy | Prioritizeenviro | 1081 | 0 | 1 | 0.7474561 | 0.4346726 |
| Donor to Environment | Donor | 1093 | 0 | 1 | 0.7337603 | 0.4421934 |
| Environmental Orientation | Enviro | 1038 | 1 | 10 | 6.085742 | 2.386754 |
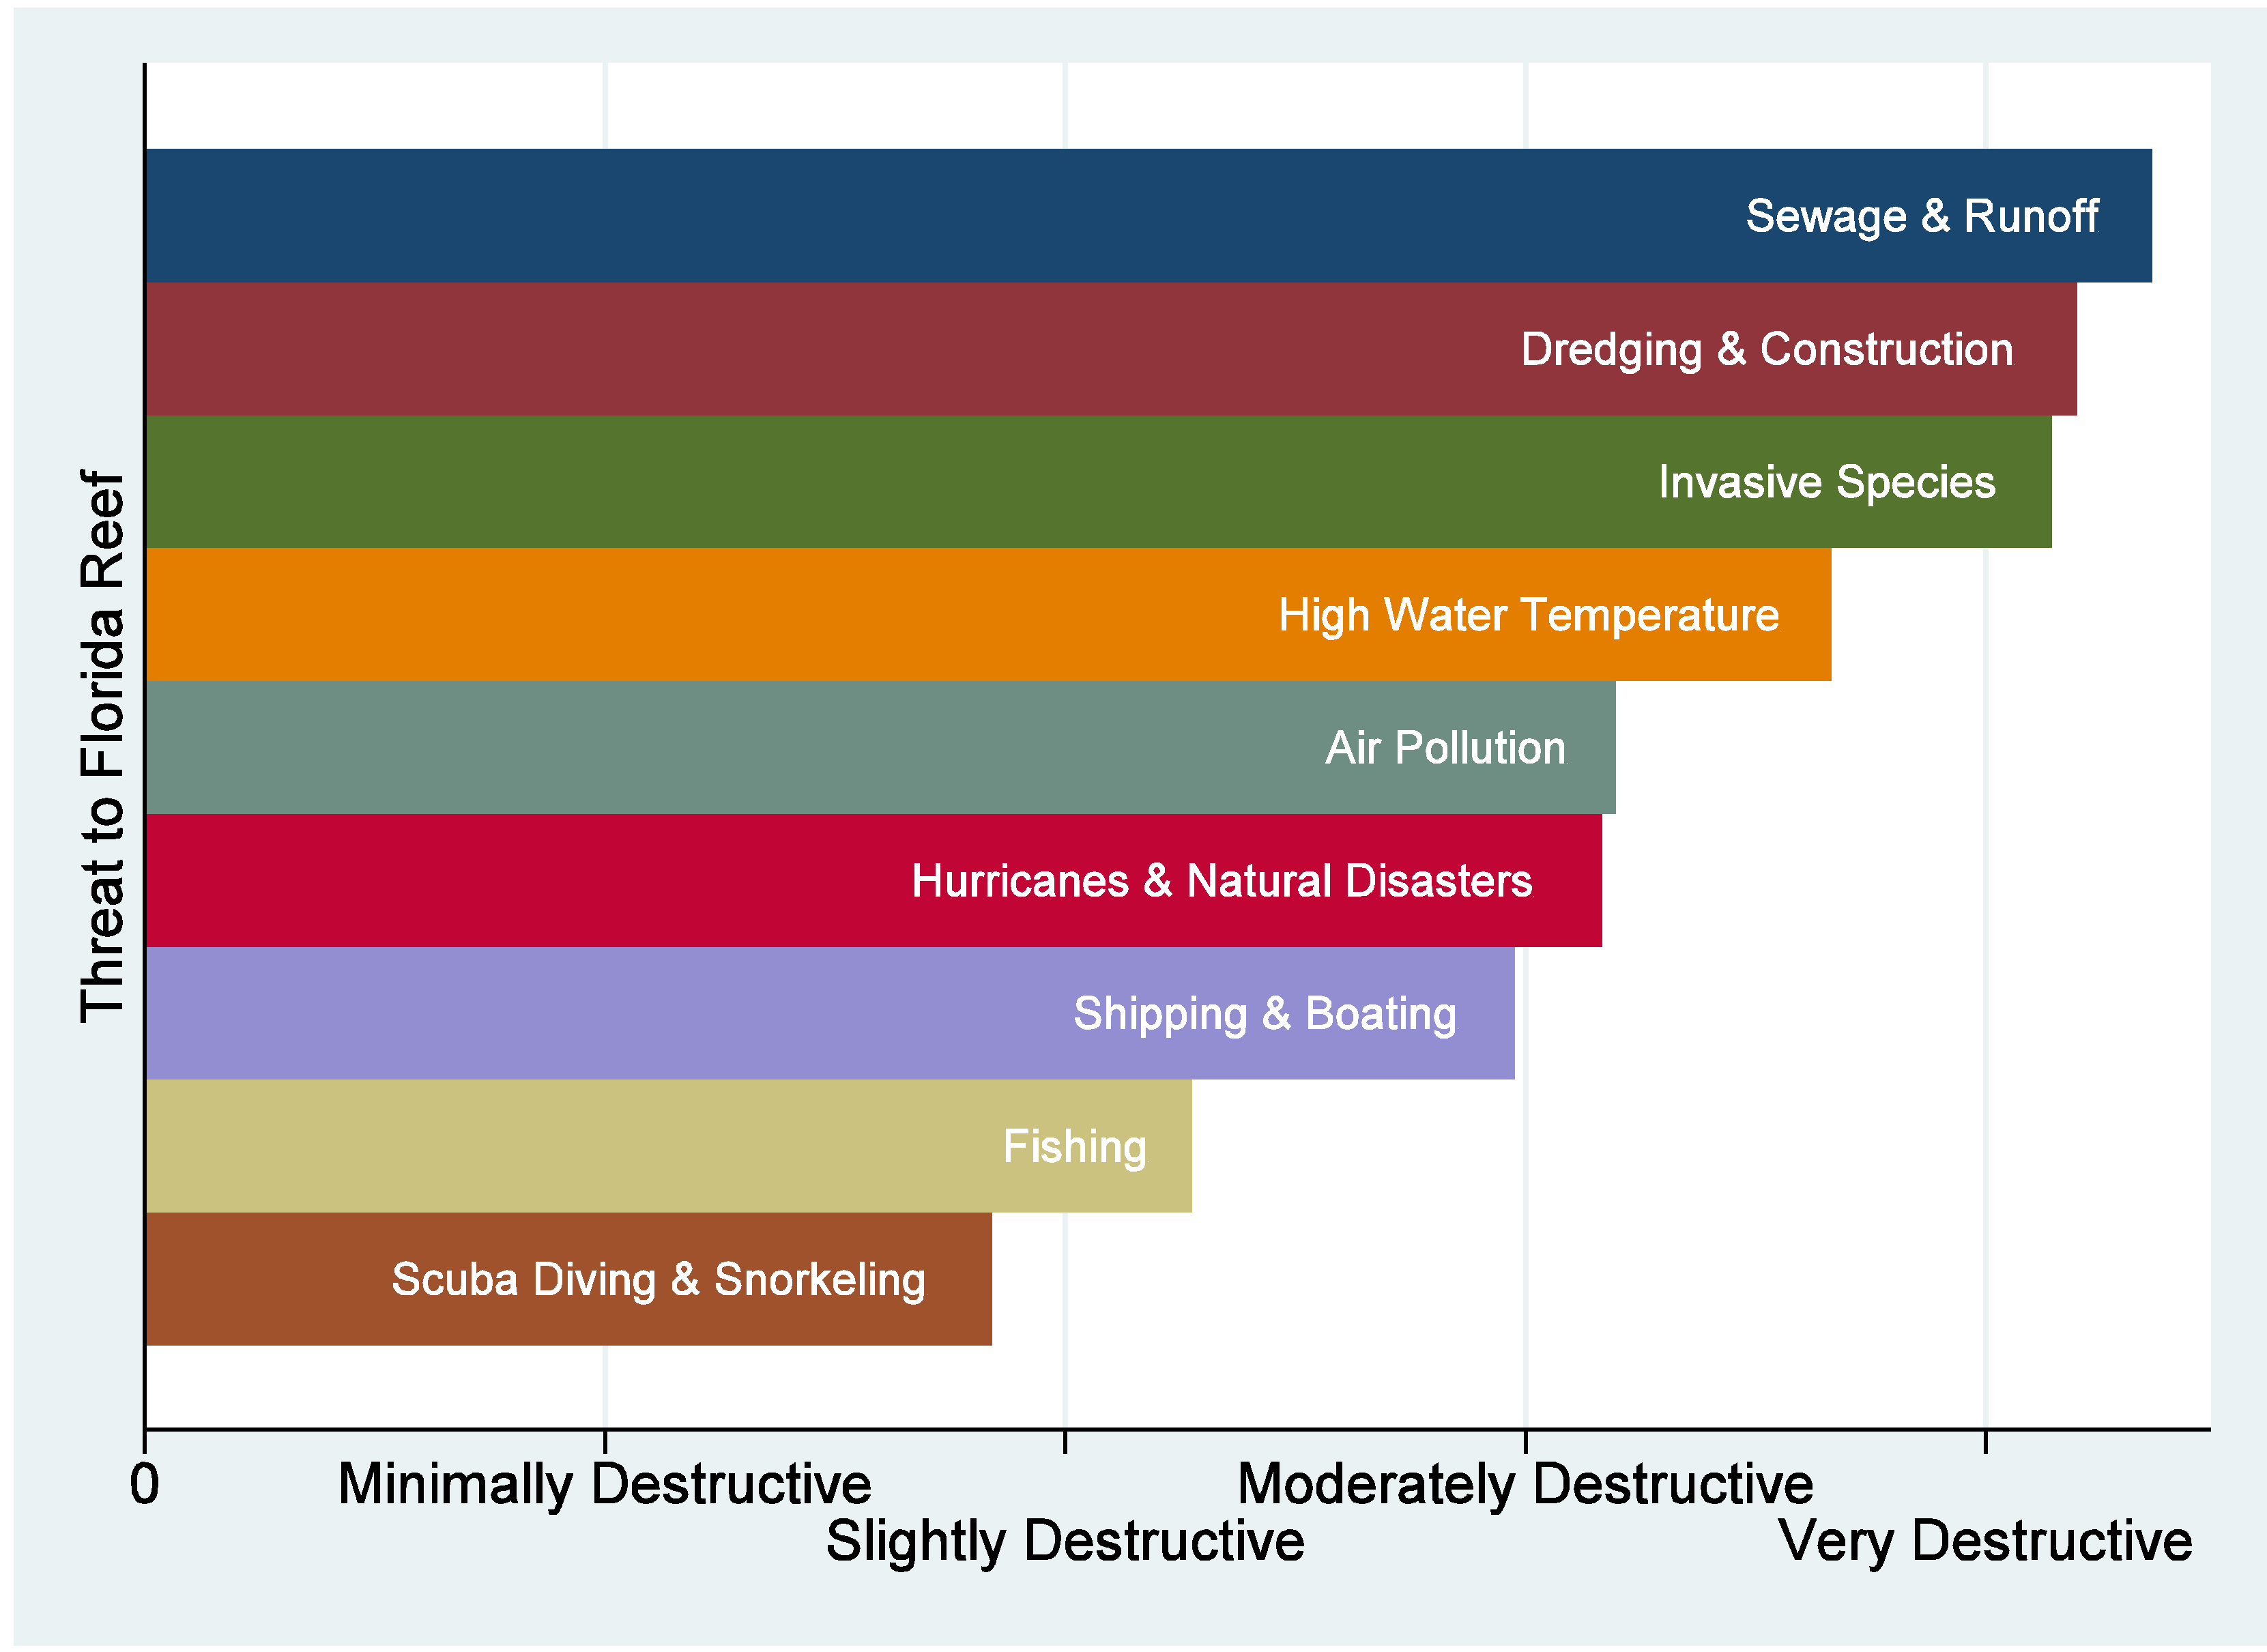
For all coral reefs in Florida, respondents ranked the perception of nine threats on a five-point scale from “minimally destructive” to “extremely destructive”. Sewage and Runoff ranks as most threatening, and Scuba Diving and Snorkeling ranks as least threatening. Fishing ranks as second least threatenting, and its mean registers near the category of “slightly destructive.” Climate-related variables cluster in the middle of the nine threats (
Figure 3).
Figure 3.
Perception of threats to the Florida Reef, mean.
Figure 3.
Perception of threats to the Florida Reef, mean.
As for information sources about coral reefs in Florida, the most popular choice was “Personal Experience”. This choice was followed in order by: Scientific Literature, Magazines, Newspapers (print or online), Television, Email, Social Media, and Radio. In this regard, electronic media trails print media, and print media yields to direct experience.
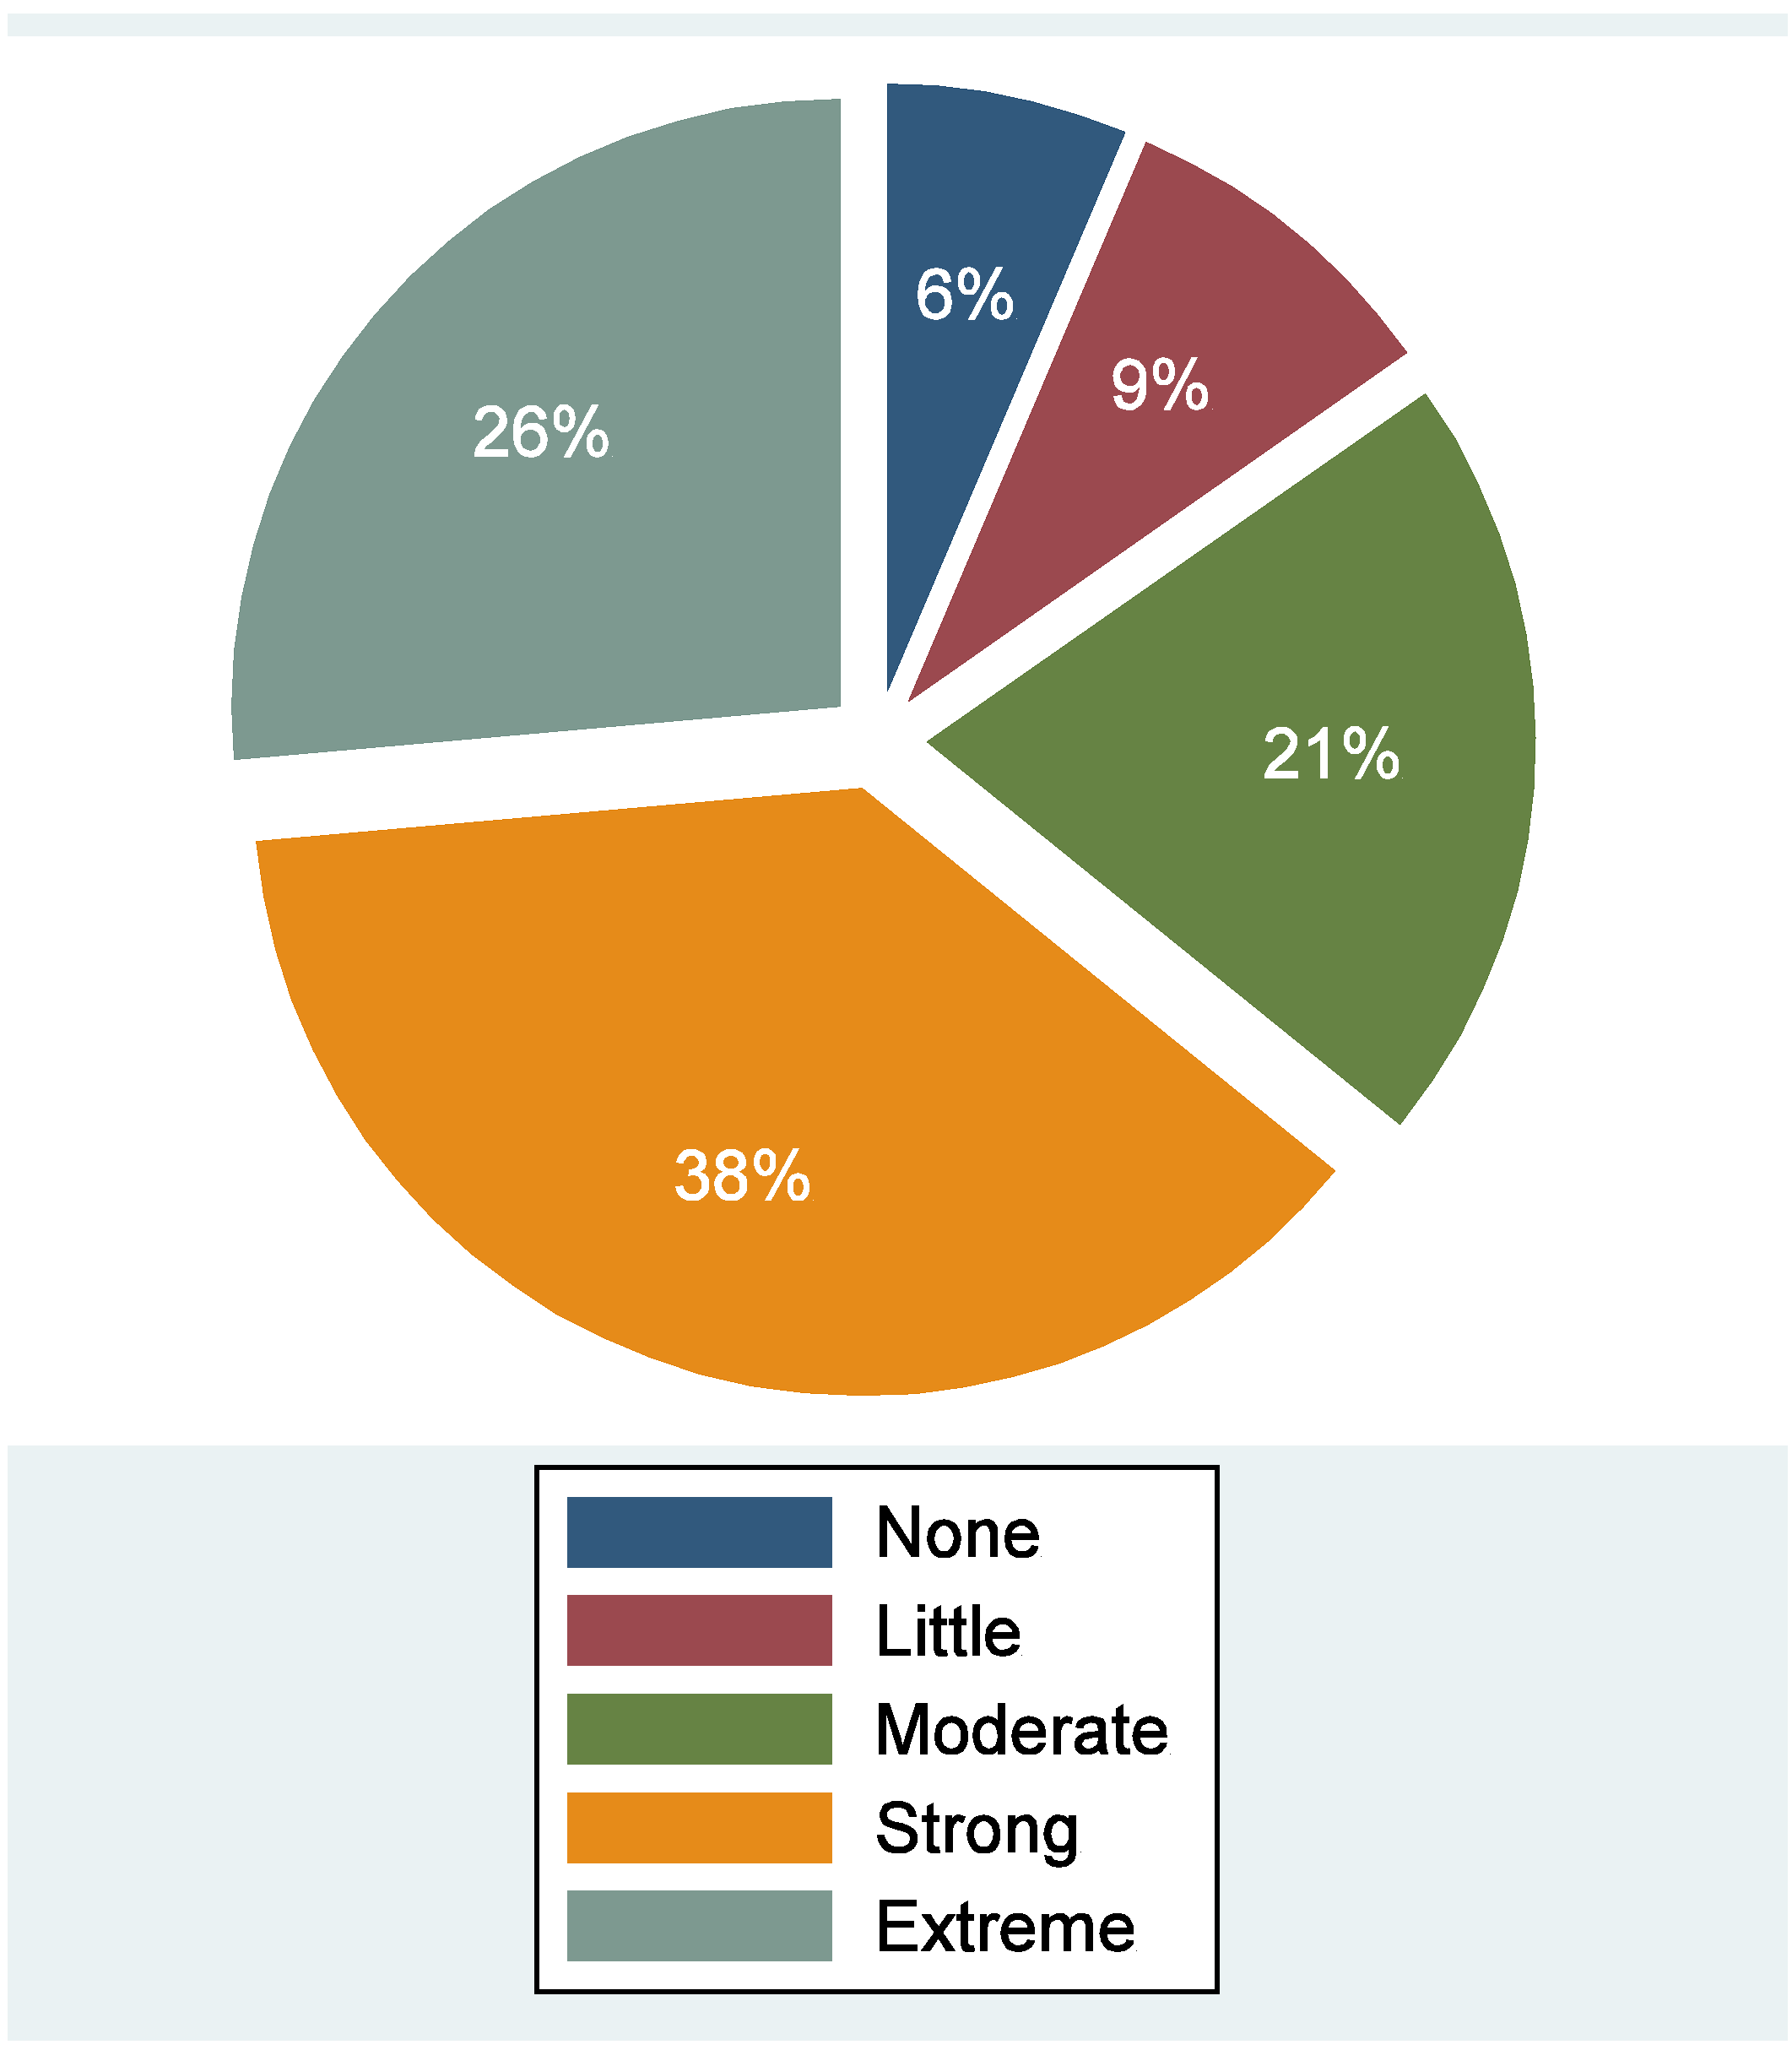
3.3. Perceptions and Scales for Climate Change, Coral Reefs: Is Climate Change a Concern?
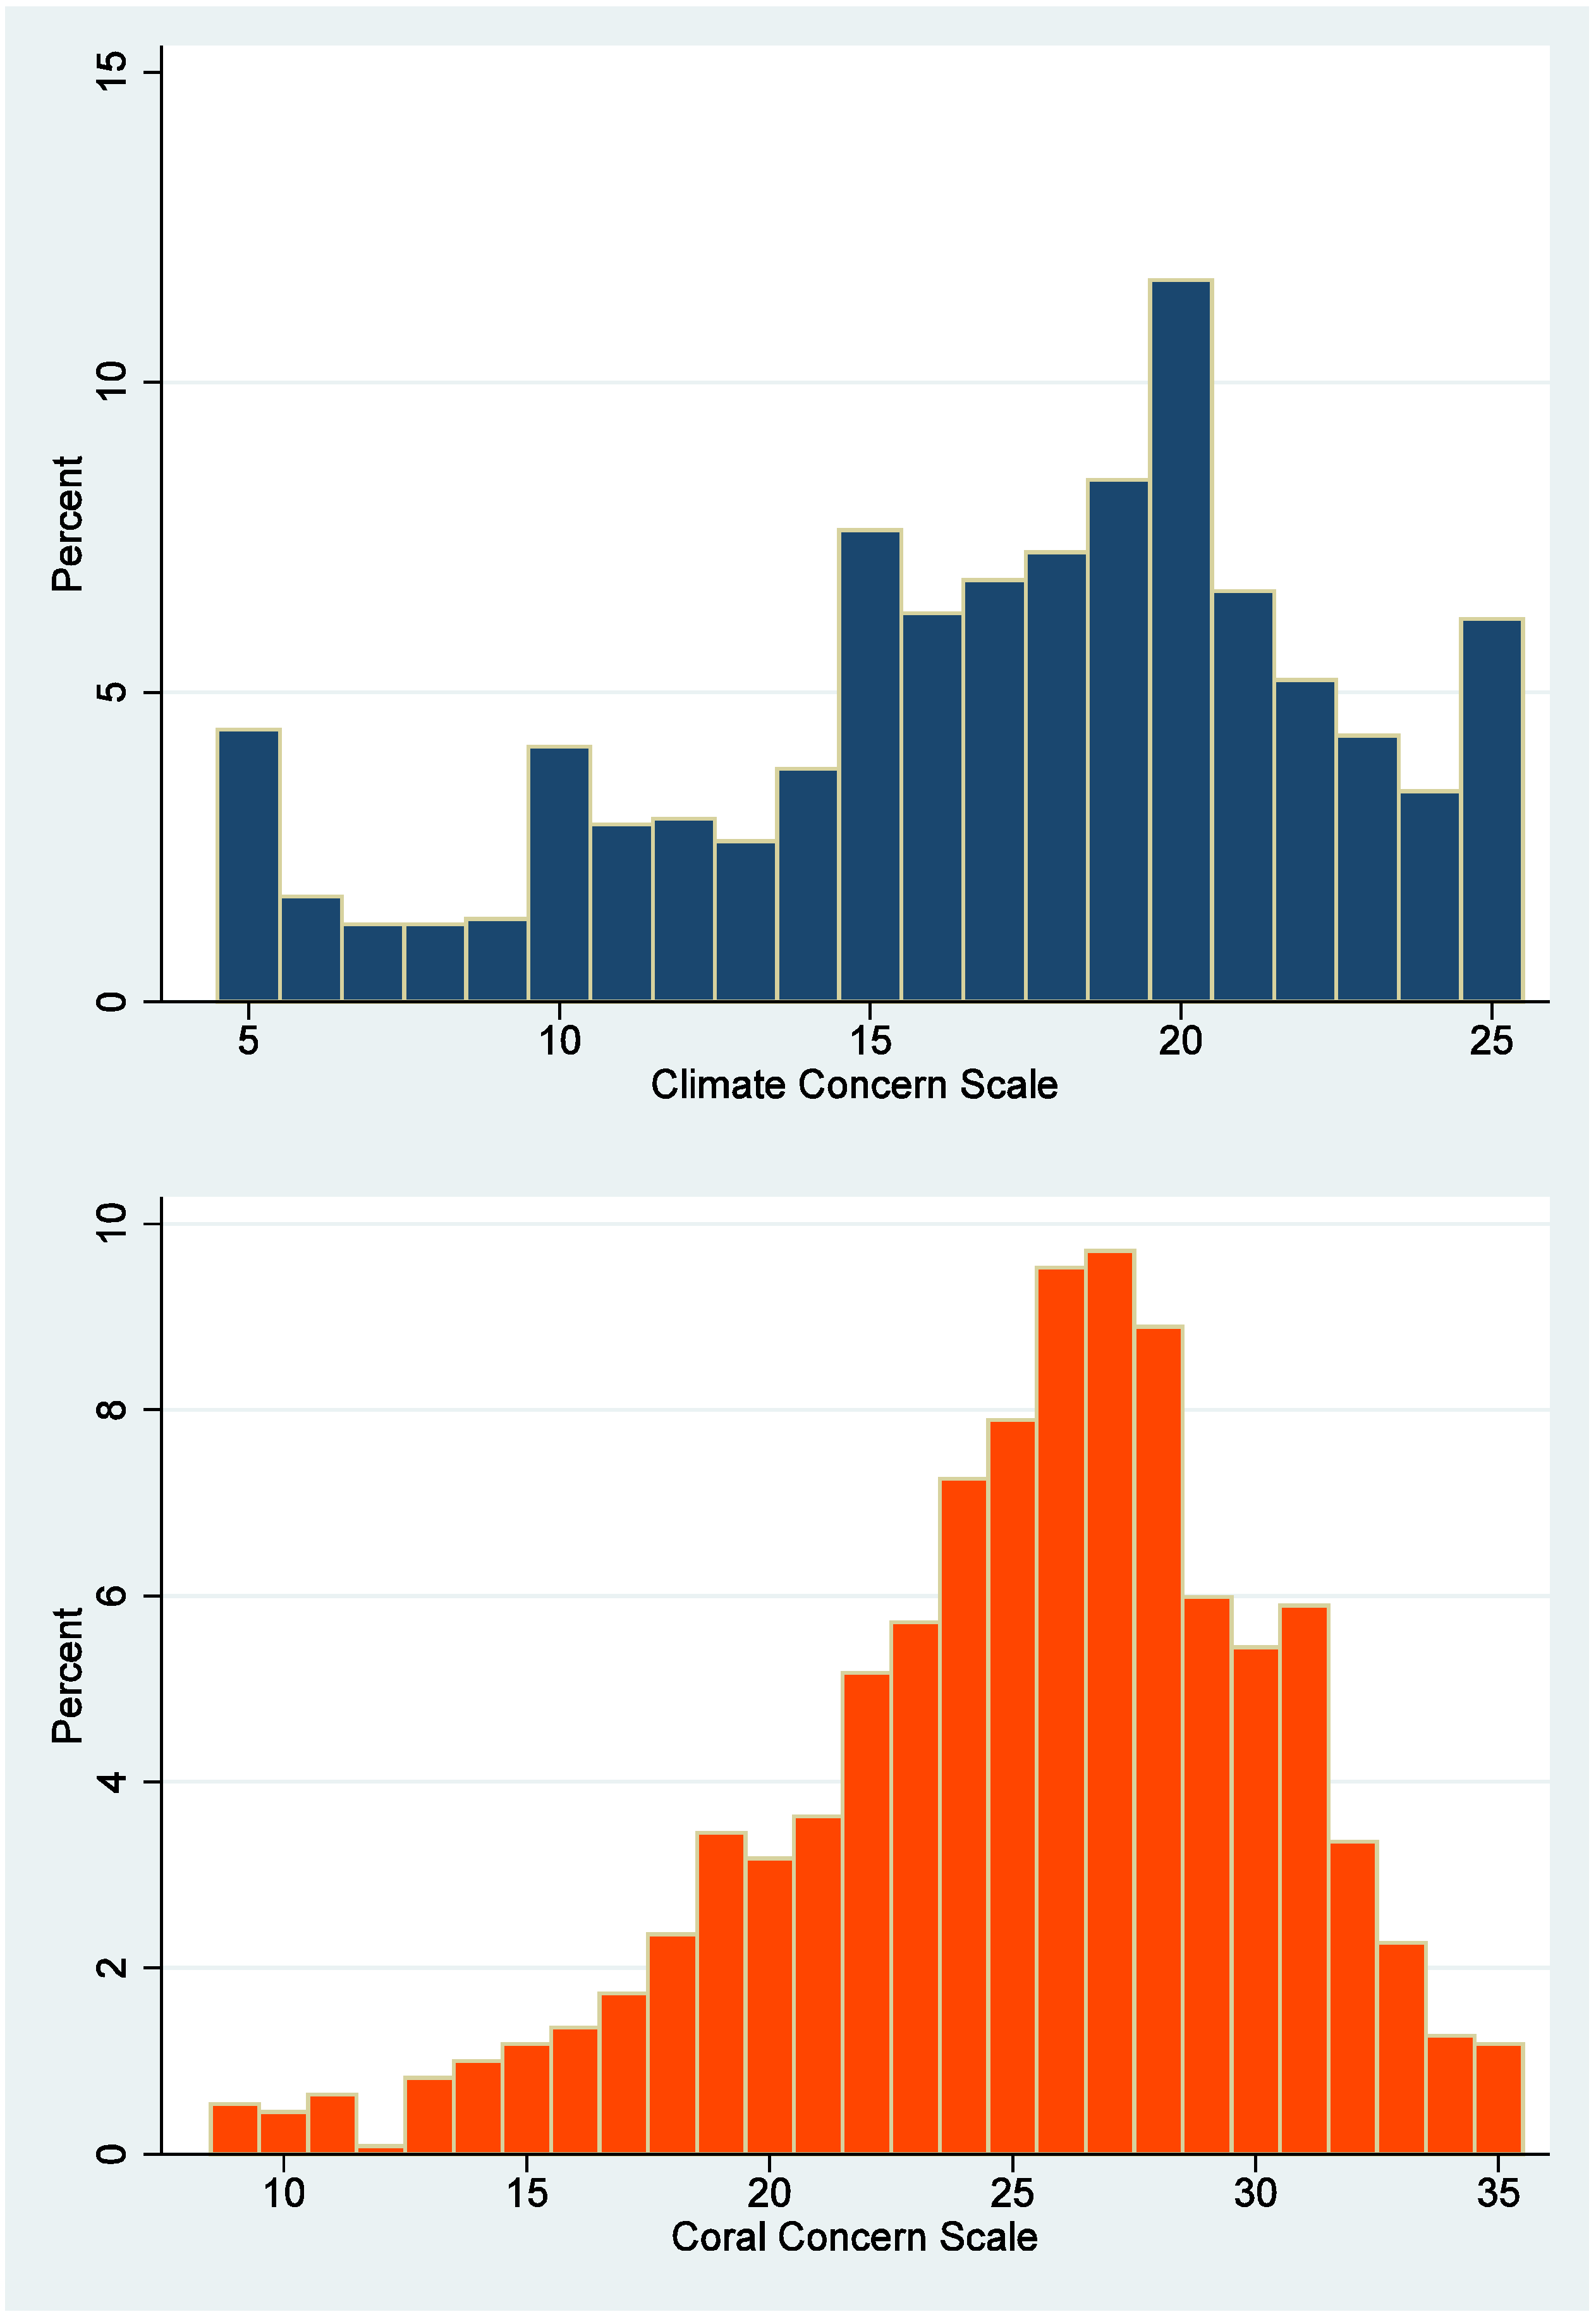
For concern about climate change and coral reefs, two scales were created based on sets of responses. The Climate Concern Scale combines a set of five responses to statements on a five-point Likert scale with a range of “none” to “extreme”. Scale totals per respondent represent the full range of possibilities from 5 to 25. Scores below 5 were dropped because they lacked all five responses, resulting in
N = 1116 and a mean of 17. As an example of one question represented within the scale,
Figure 4 summarizes responses for “the effect of climate change on coral reefs”.
Figure 4.
Stakeholders’ perception of climate change’s effect on coral reefs.
Figure 4.
Stakeholders’ perception of climate change’s effect on coral reefs.
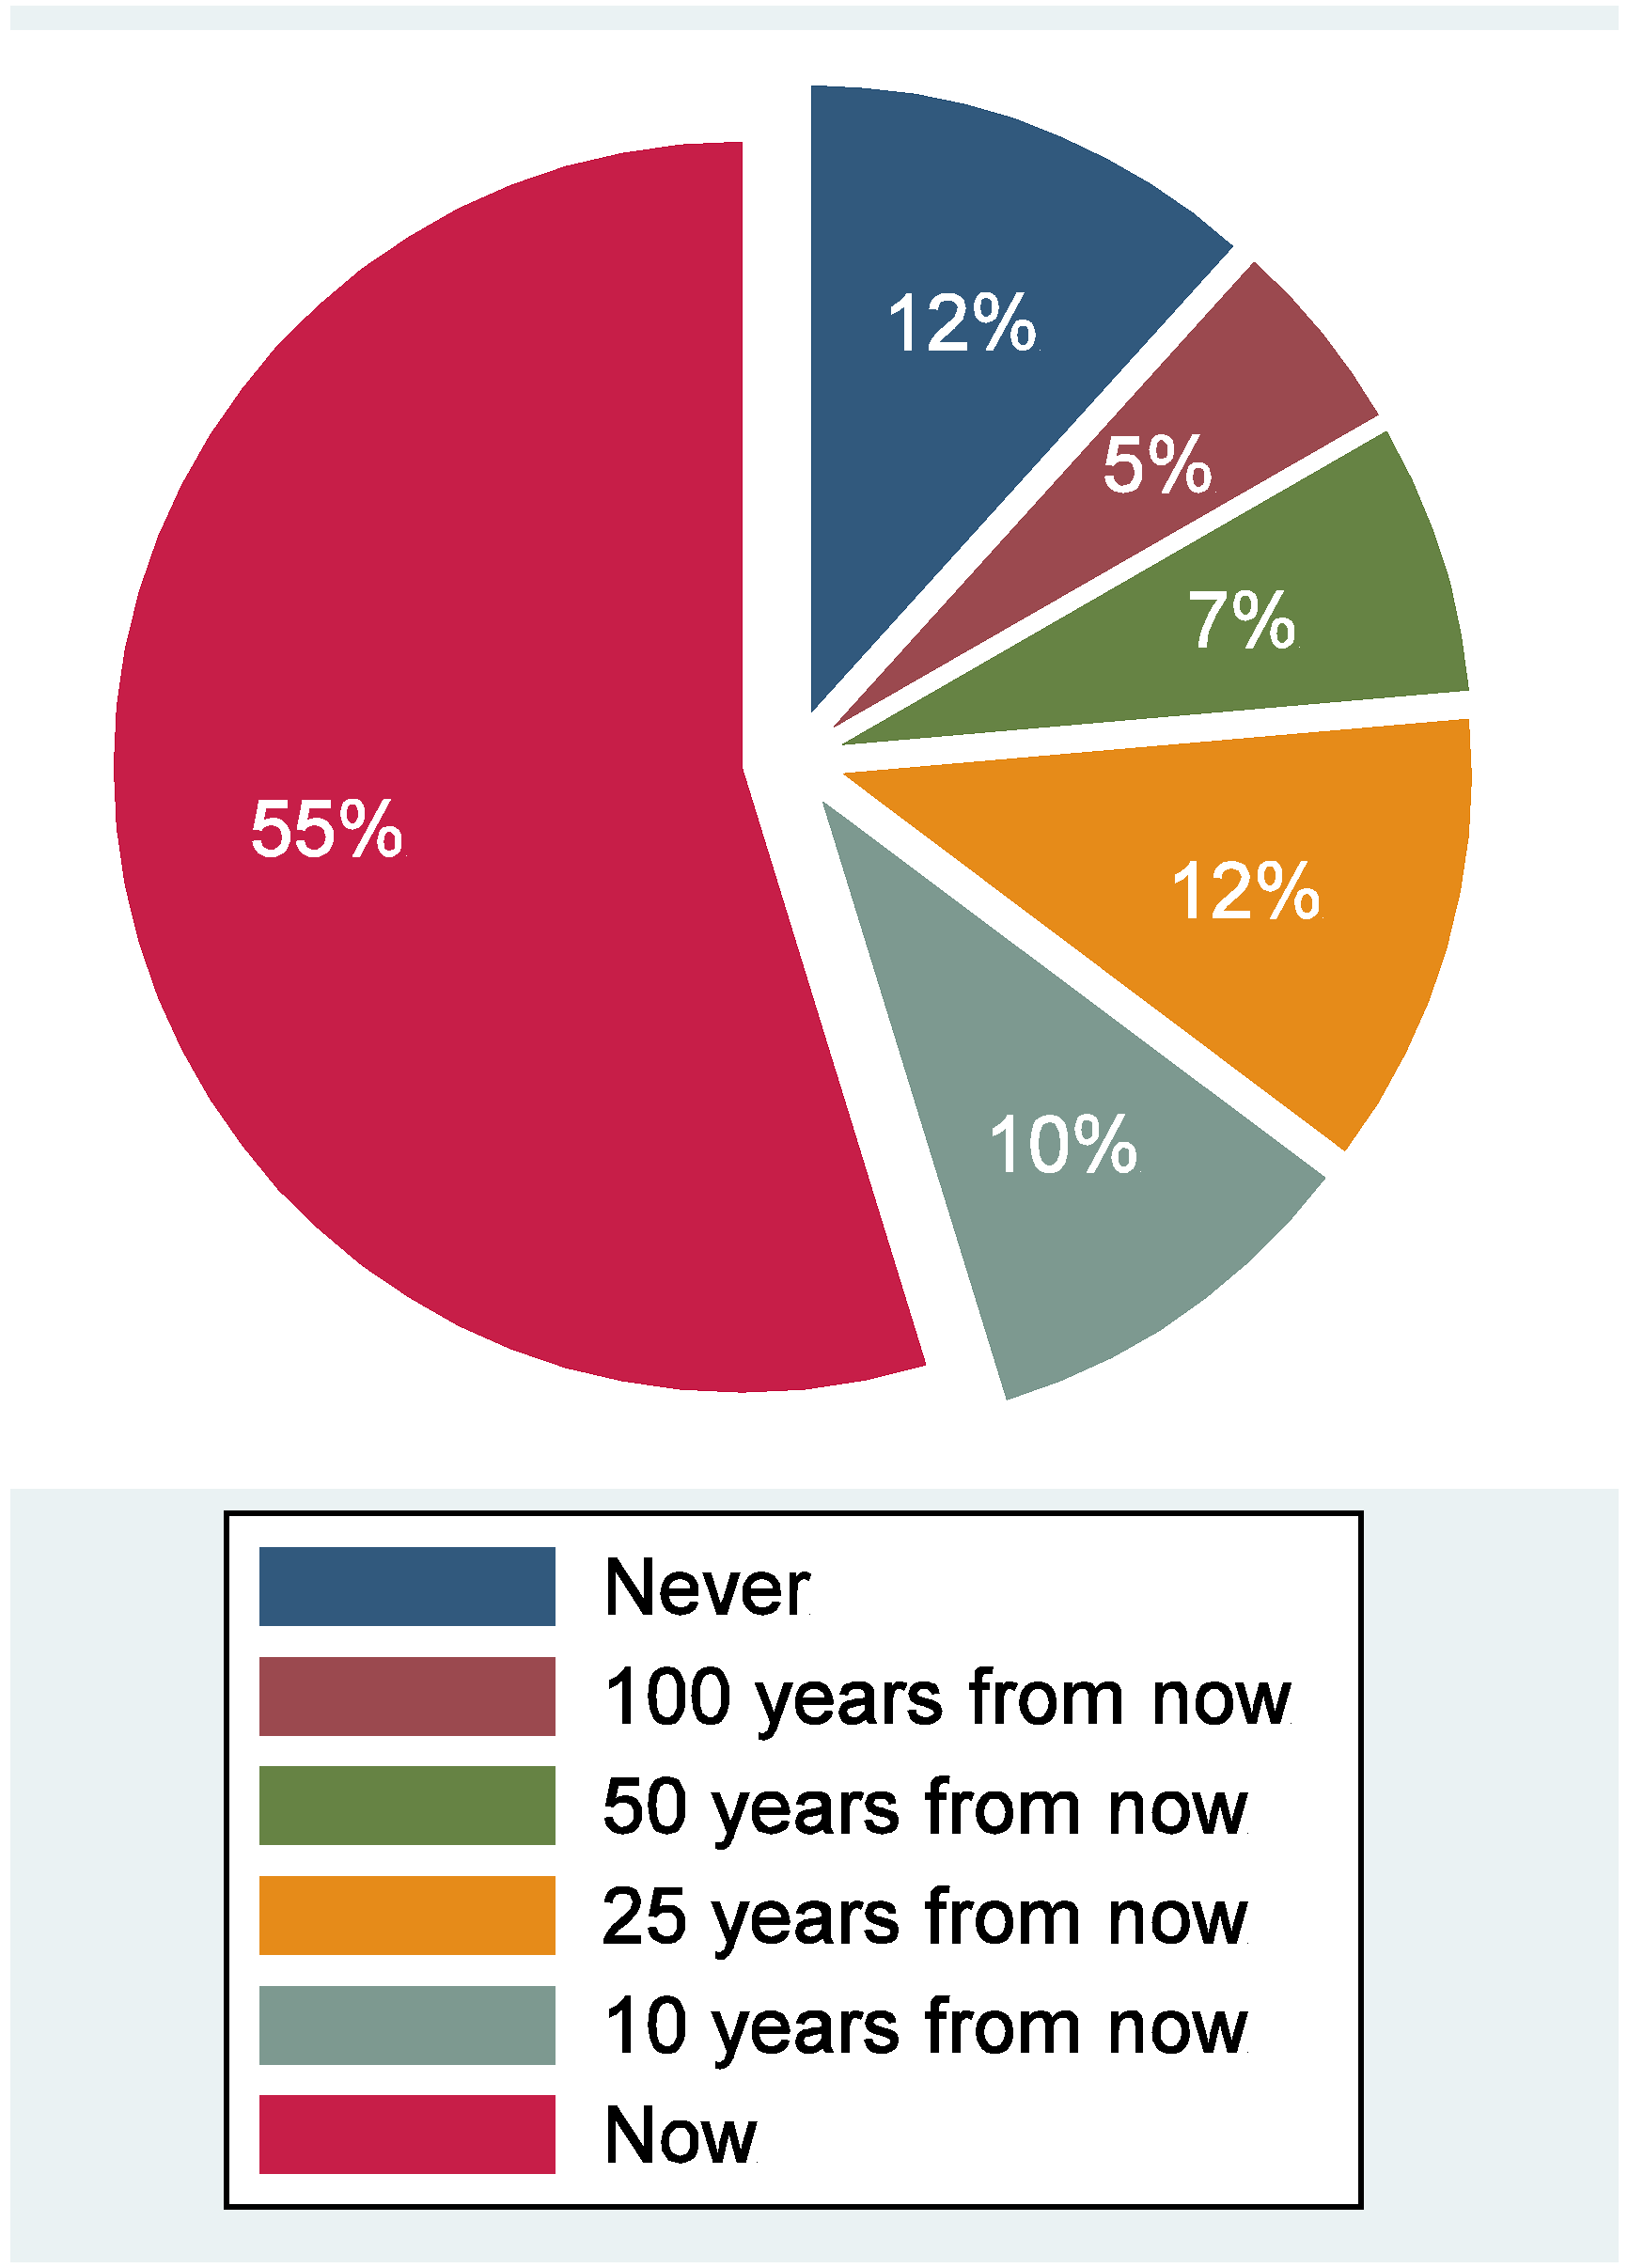
Figure 5.
Stakeholders’ perception of the timing of the arrival of climate change impacts in Florida.
Figure 5.
Stakeholders’ perception of the timing of the arrival of climate change impacts in Florida.
For the five sub-variables within the Climate Concern Scale, each mean registered above the midpoint and toward high levels of concern. The highest sub-variable mean referred to climate change affecting coral reefs (3.7), and it scored similarly to a sub-variable from the Coral Concern Scale about carbon dixoide threatening corals (3.7). An additional question about climate change, not included in the scale, asked about the perceived arrival of climate change impacts in Florida (
Figure 5). The mean is 4.7 on a 6-point scale, and 55% agree with “now” and 12% agree with “never”, indicating that 88% expect climate change impacts in Florida within 100 years.
The Climate Concern Scale displays strong reliability within the desired single factor in factor analysis. All five items score above 0.8, well above a basic standard of 0.4 [
50]. An orthogonal rotation confirms this reliability with loading scores on factor 1 above the standard of 0.4. Crombach’s alpha, a test of both validity and reliability, registers at 0.93, well above the standard of 0.8.
Figure 6.
Percentages for respondents’ scores within the scales of concern for climate change and for coral reefs. The climate scale compiled five responses, and the coral scale compiled seven responses.
Figure 6.
Percentages for respondents’ scores within the scales of concern for climate change and for coral reefs. The climate scale compiled five responses, and the coral scale compiled seven responses.
The same tests were conducted for the Coral Concern Scale, which combines seven responses on a five-point Likert scale that range from “strongly disagree” to “strongly agree”. No respondent scores registered at the minimum of 7, and they ranged from 9 to the maximum of 35, with N = 1102. On single factor analysis, six of the seven sub-variables scored above 0.5, with the third item (Coralneeds) scoring 0.1, below the standard of 0.4. Orthogonal rotation on factor 1 produced four scores above the 0.4 standard. With all seven items, the Crombach’s alpha score is 0.8. When the scale was tested without the lowest item, scores showed little improvement; therefore, all items were retained.
The highest agreement is for the sub-variable about ocean acidification threatening corals (mean of 4.1). All seven sub-variable means register above the midpoint, and five sub-variables have a mode of 4, meaning “Agree.” The lowest mean of 3.3 refers to a statement that “Human use of coral reef areas should not be allowed if it damages these areas.” Although it has a mode of “Agree,” it also has the highest percentage of disagreement at 29%.
Figure 6 shows density scores for both scales.
3.4. Seafood Preferences: What Is the Willingness to Pay of Stakeholders?
A set of six seafood-related questions averaged more than 1300 respondents per question, and more than 97% were eligible because they consume seafood. Mean household spending on seafood registered at greater than $30 per week. Trust in seafood labels had a broad range and a mean of 7 within a maximum of 11.
For the sustainable seafood scenario, 63% agreed to pay the premium offered, and each of the six levels earned majority approval. Favorable responses ranged from 55%, for the $12 offer, to 73%, for the $2 offer. For the local seafood scenario, 79% favored paying the additional premium. Agreement ranged from 73% to 83%. To estimate a simple average WTP amount per household, the percent favorable was multiplied by each offer amount, and those results were averaged. Because the local seafood offer was explained as an addition to the sustainable seafood premium, the results of the two scenarios may be combined for a weekly total of $6.83 per week per household, as shown in
Table 3.
Table 3.
Summary of Willingness to Pay (WTP) for seafood scenarios. The dollar amounts are averages based on premiums offered and the percent favorable per premium.
Table 3.
Summary of Willingness to Pay (WTP) for seafood scenarios. The dollar amounts are averages based on premiums offered and the percent favorable per premium.
| Scenario | Offer range | Favorable | Average WTP per Household |
|---|
| Sustainable Seafood | $2–$12 | 63% | $4.15 per week |
| Local Seafood | $1–$6 | 79% | $2.68 per week |
| Combined Average Amount | $6.83 per week |
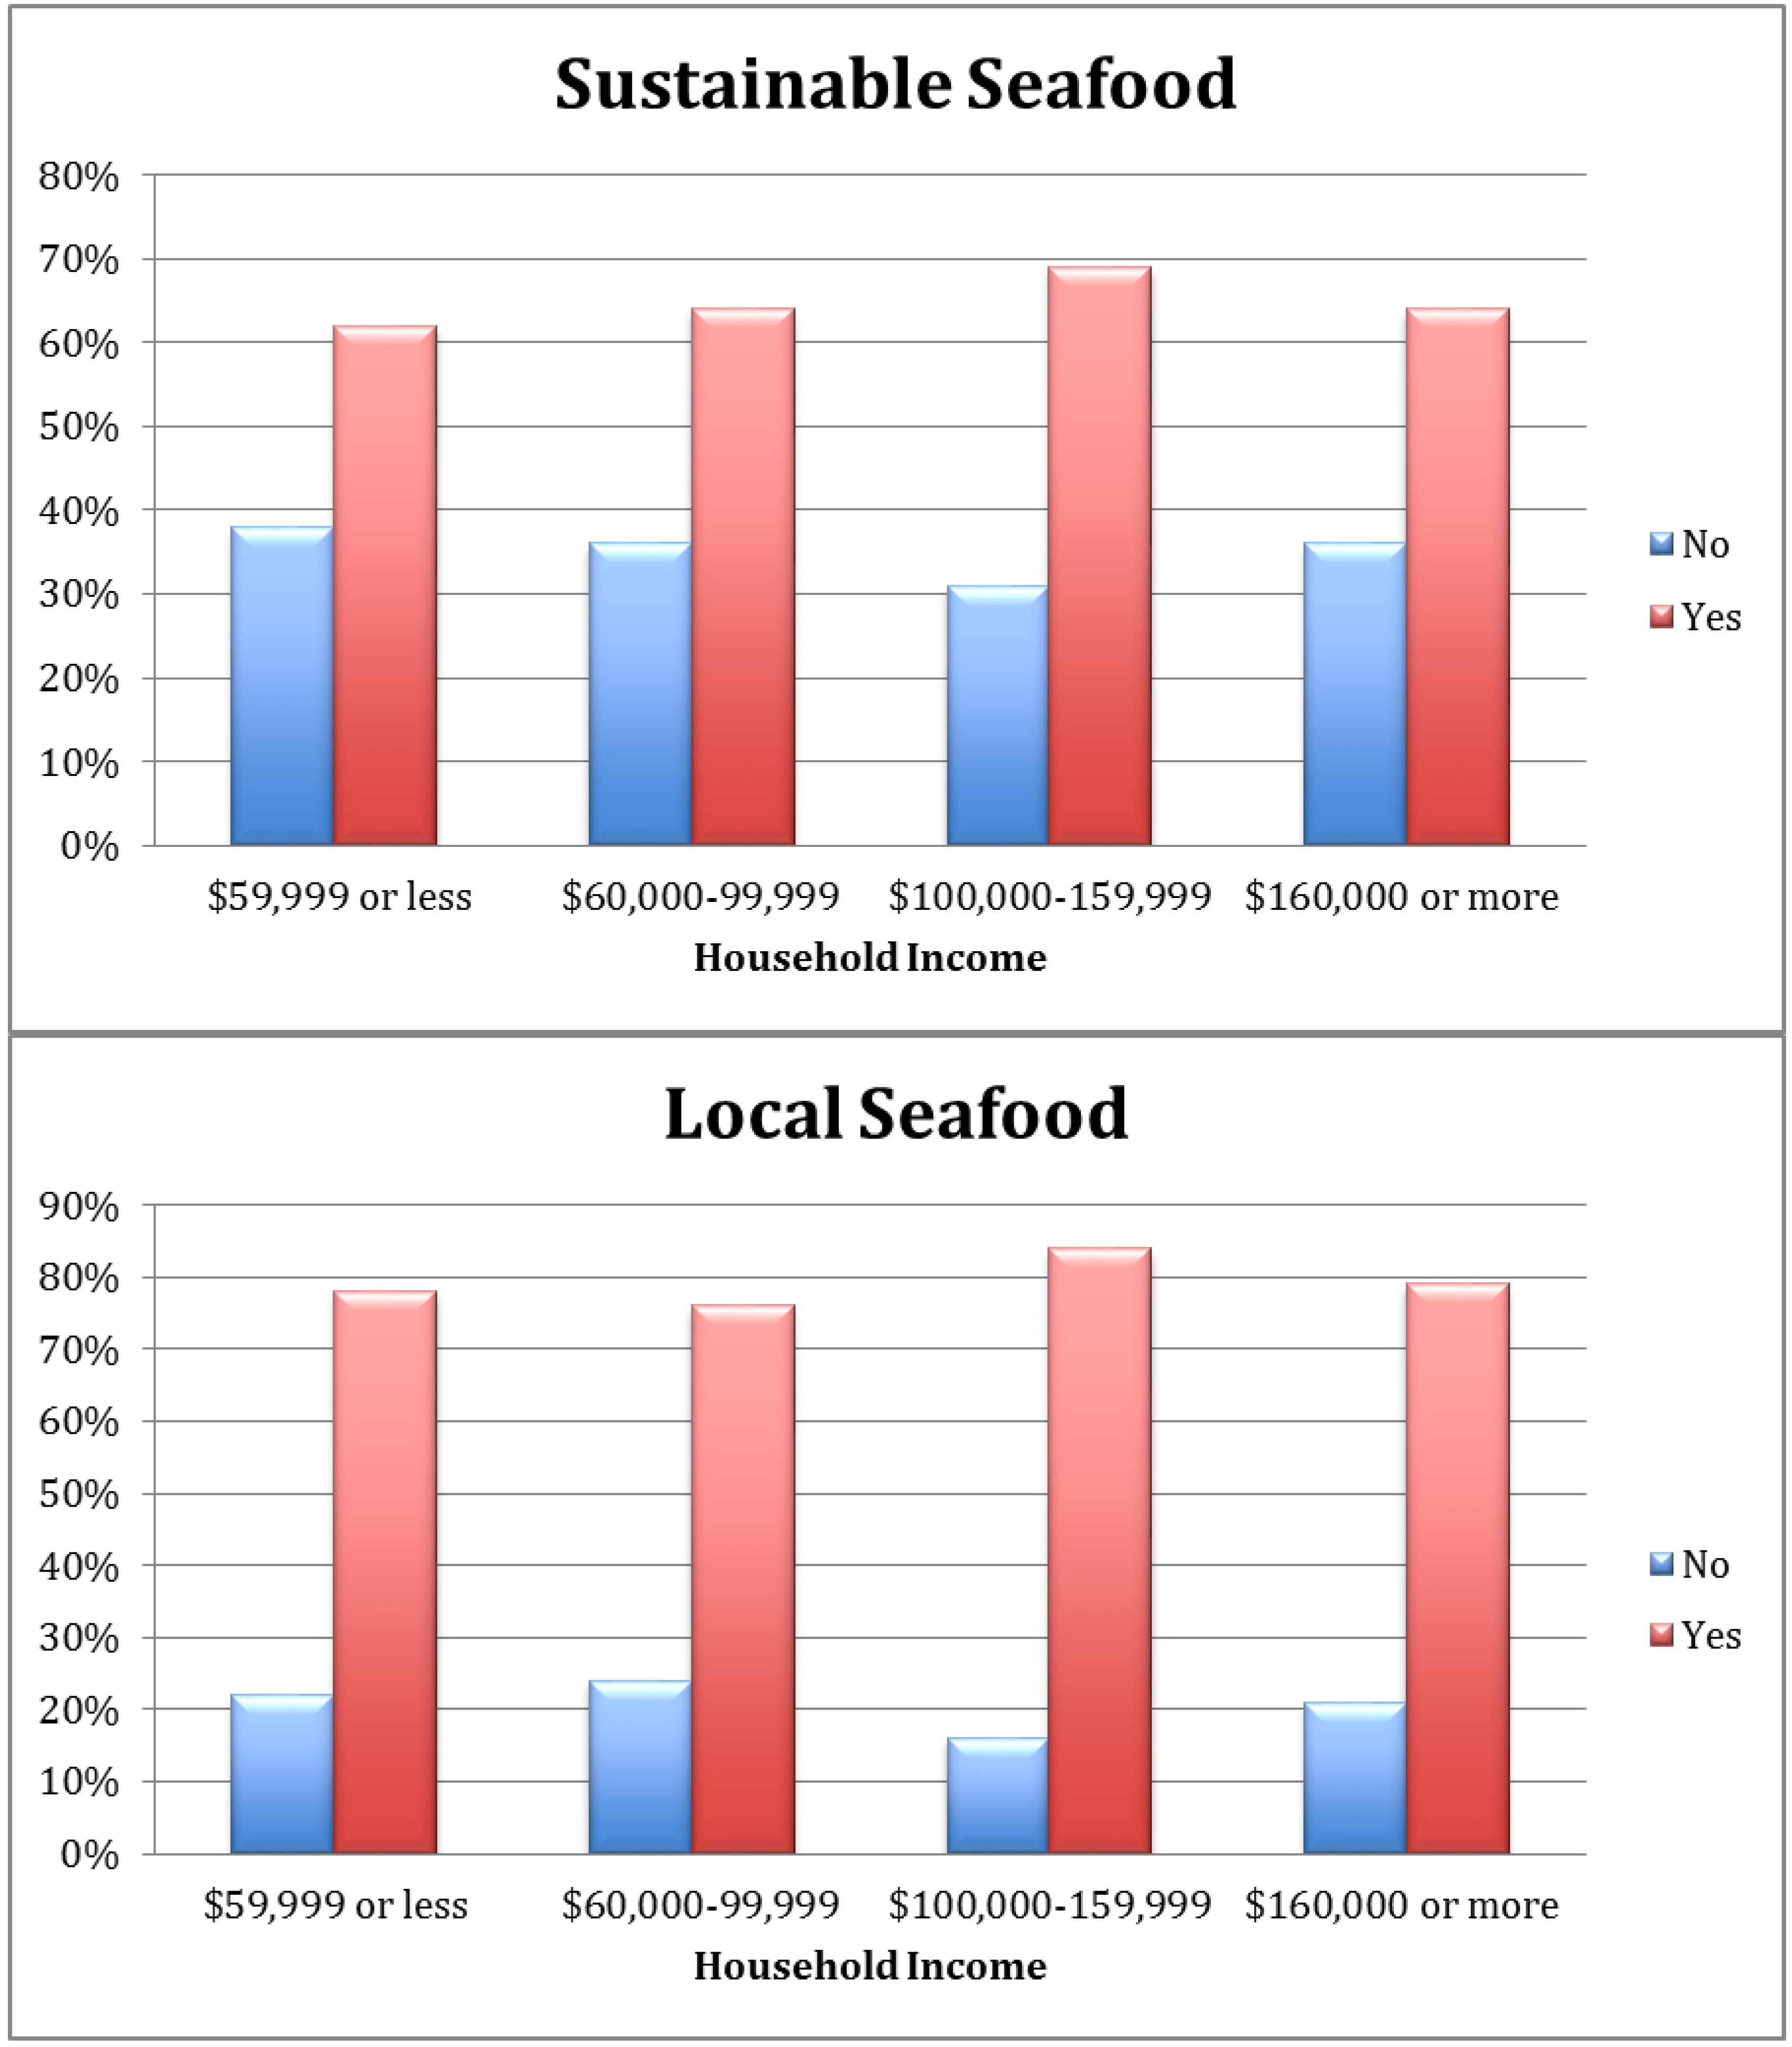
WTP for both seafood scenarios did not vary significantly by income or by education, based on chi-squared tests. To normalize the distributions for regressions, income was aggregated from eleven into four categories, and education was aggregated from six into three categories, which also addressed the category of “less than high school” having only seven respondents. Income’s influence appears relatively flat, and only the household income category of $100,000 to $159,999 shows slightly higher support for both scenarios (see
Figure 7).
Figure 7.
Willingness to pay a seafood premium, based on household income. The local seafood premium, a lesser amount, was explained as an addition to the sustainable seafood premium.
Figure 7.
Willingness to pay a seafood premium, based on household income. The local seafood premium, a lesser amount, was explained as an addition to the sustainable seafood premium.
Before aggregation of income, the category of $160,000 to $179,999 demonstrated support lower than the nine other income categories for sustainable seafood, and lower than most other income categories for local seafood. Support from the highest income category, $200,000 or moreore, was similar to the scenarios’ means. Education showed similar discrepancies, with lower than average support for both seafood scenarios from the categories of “Masters Degree”, “2-year College Degree” and “High School/GED”, and higher than average support from “Doctoral Degree” and “4-year College Degree”.
3.5. Regression Analysis for Seafood: What Affects Willingness to Pay?
Regressions for the two seafood scenarios were built stepwise from a parsimonious to an extended model. The variable of Income did not prove significant; however, a proxy variable of Weekly Seafood Budget demonstrated significance in the expected direction and was retained in all models.
Table 4 and
Table 5 present two models per scenario.
Table 4.
Logit models for sustainable seafood scenario.
Table 4.
Logit models for sustainable seafood scenario.
| | model 1, N = 900 | model 2, N = 915 |
|---|
| Variables | Coef. | P > |z| | Coef. | P > |z| |
| Foodoffer1 | −0.0803953 | 0.001 *** | −0.0841903 | 0.001 *** |
| Foodcertain | 0.0928251 | 0.021 ** | 0.0810342 | 0.045 ** |
| Foodtrust | 0.2257827 | 0.000 *** | 0.2289945 | 0.000 *** |
| Foodbudget | 0.1111182 | 0.002 *** | 0.1466274 | 0.000 *** |
| Climate | 0.0484604 | 0.016 ** | 0.0287828 | 0.181 |
| Coral | 0.0884343 | 0.000 *** | 0.092379 | 0.000 *** |
| Age | −0.0266097 | 0.000 *** | −0.0232003 | 0.002 *** |
| Inc | 0.0470067 | 0.104 | --- | --- |
| Enviro | 0.1095118 | 0.004 *** | --- | --- |
| Constant | −4.423484 | 0.000 *** | −5.6397 | 0.000 *** |
| Recboat | | | −0.1245968 | 0.134 |
| Visitreefs | | | 0.1991449 | 0.012 ** |
| Threatfishing | | | 0.1091315 | 0.223 |
| Born | | | 0.1244678 | 0.376 |
| Inc4 | | | 0.081112 | 0.333 |
| PolRepub | | | 0.4304033 | 0.225 |
| PolIndRepub | | | 0.3648938 | 0.296 |
| PolInd | | | 0.3584938 | 0.292 |
| PolIndDem | | | 1.061166 | 0.008 *** |
| PolDem | | | 0.7079881 | 0.067 * |
| Edu3 | | | 0.0194311 | 0.883 |
| Prioritizeenviro | | | 0.316652 | 0.118 |
| Donor | | | 0.291167 | 0.109 |
3.5.1. Sustainable Seafood Scenario
The parsimonious Model 1 of the sustainable seafood scenario has eight explanatory variables with significant differences at the 5% level or higher. The Food Offer is significant in the expected direction, and the only other variable in the negative direction is Age. Positive variables with significance include Certainty of Choice to Pay (5% level), Trust in Seafood Labels (1% level), Weekly Seafood Budget (1% level), Climate Change Concern Scale (5% level), Coral Reef Concern Scale (1% level), and Environmental Orientation (1% level).
The extended Model 2 for sustainable seafood has nine significant explanatory variables. Compared to the parsimonious model, significance of variables is the same except for Climate Change Concern Scale becoming insignificant, and the variable Environmental Orientation was dropped due to potential interactions with Political Identity. The variable Income was replaced by Income in four Categories and remained insignificant. Newly significant variables are Visited Any Coral Reef (5% level), Political Identities of Independent, leans Democrat (1%) and Democrat (10% level). Significant variables showing the highest levels of influence (a coefficient above 0.15) across both models for sustainable seafood are Trust in Seafood Labels, Visited Any Coral Reef, and Political Identities of Independent/leans Democrat, and Democrat.
Table 5.
Logit models for local seafood scenario.
Table 5.
Logit models for local seafood scenario.
| | model 3, N = 892 | model 4, N = 848 |
|---|
| Variables | Coef. | P > |z| | Coef. | P > |z| |
| Foodoffer2 | −0.1529689 | 0.005 *** | −0.1390913 | 0.020 ** |
| Foodcertain | 0.0474842 | 0.280 | 0.0622317 | 0.180 |
| Foodtrust | 0.2834743 | 0.000 *** | 0.28771 | 0.000 *** |
| Foodbudget | 0.0505875 | 0.170 | 0.0640936 | 0.088 * |
| Visitreefs | 0.3176295 | 0.000 *** | 0.2477996 | 0.022 ** |
| Climate | 0.0857666 | 0.000 *** | 0.0902794 | 0.001 *** |
| Coral | 0.0325172 | 0.190 | 0.0206164 | 0.424 |
| Age | −0.0216909 | 0.011 ** | −0.0241213 | 0.014 ** |
| Inc | 0.0392415 | 0.251 | --- | --- |
| Enviro | 0.0204871 | 0.640 | 0.0055226 | 0.908 |
| Constant | −3.5407 | 0.000 *** | −4.23086 | 0.000 *** |
| Recboat | | | −0.2408139 | 0.048 ** |
| Recfish | | | 0.0888242 | 0.429 |
| FLreef | | | 0.6066186 | 0.195 |
| Threatfishing | | | 0.0162311 | 0.887 |
| Seafood | | | 0.0248178 | 0.820 |
| BornUSA | | | 0.2140013 | 0.362 |
| Bornforeign | | | −0.8402287 | 0.009 *** |
| Boat | | | 0.1138659 | 0.460 |
| Inc4 | | | 0.0697739 | 0.493 |
| Pol | | | 0.079215 | 0.327 |
| Edu | | | 0.0945409 | 0.315 |
| Prioritizeenviro | | | −0.0207597 | 0.937 |
| Donor | | | 0.1622889 | 0.475 |
3.5.2. Local Seafood Scenario
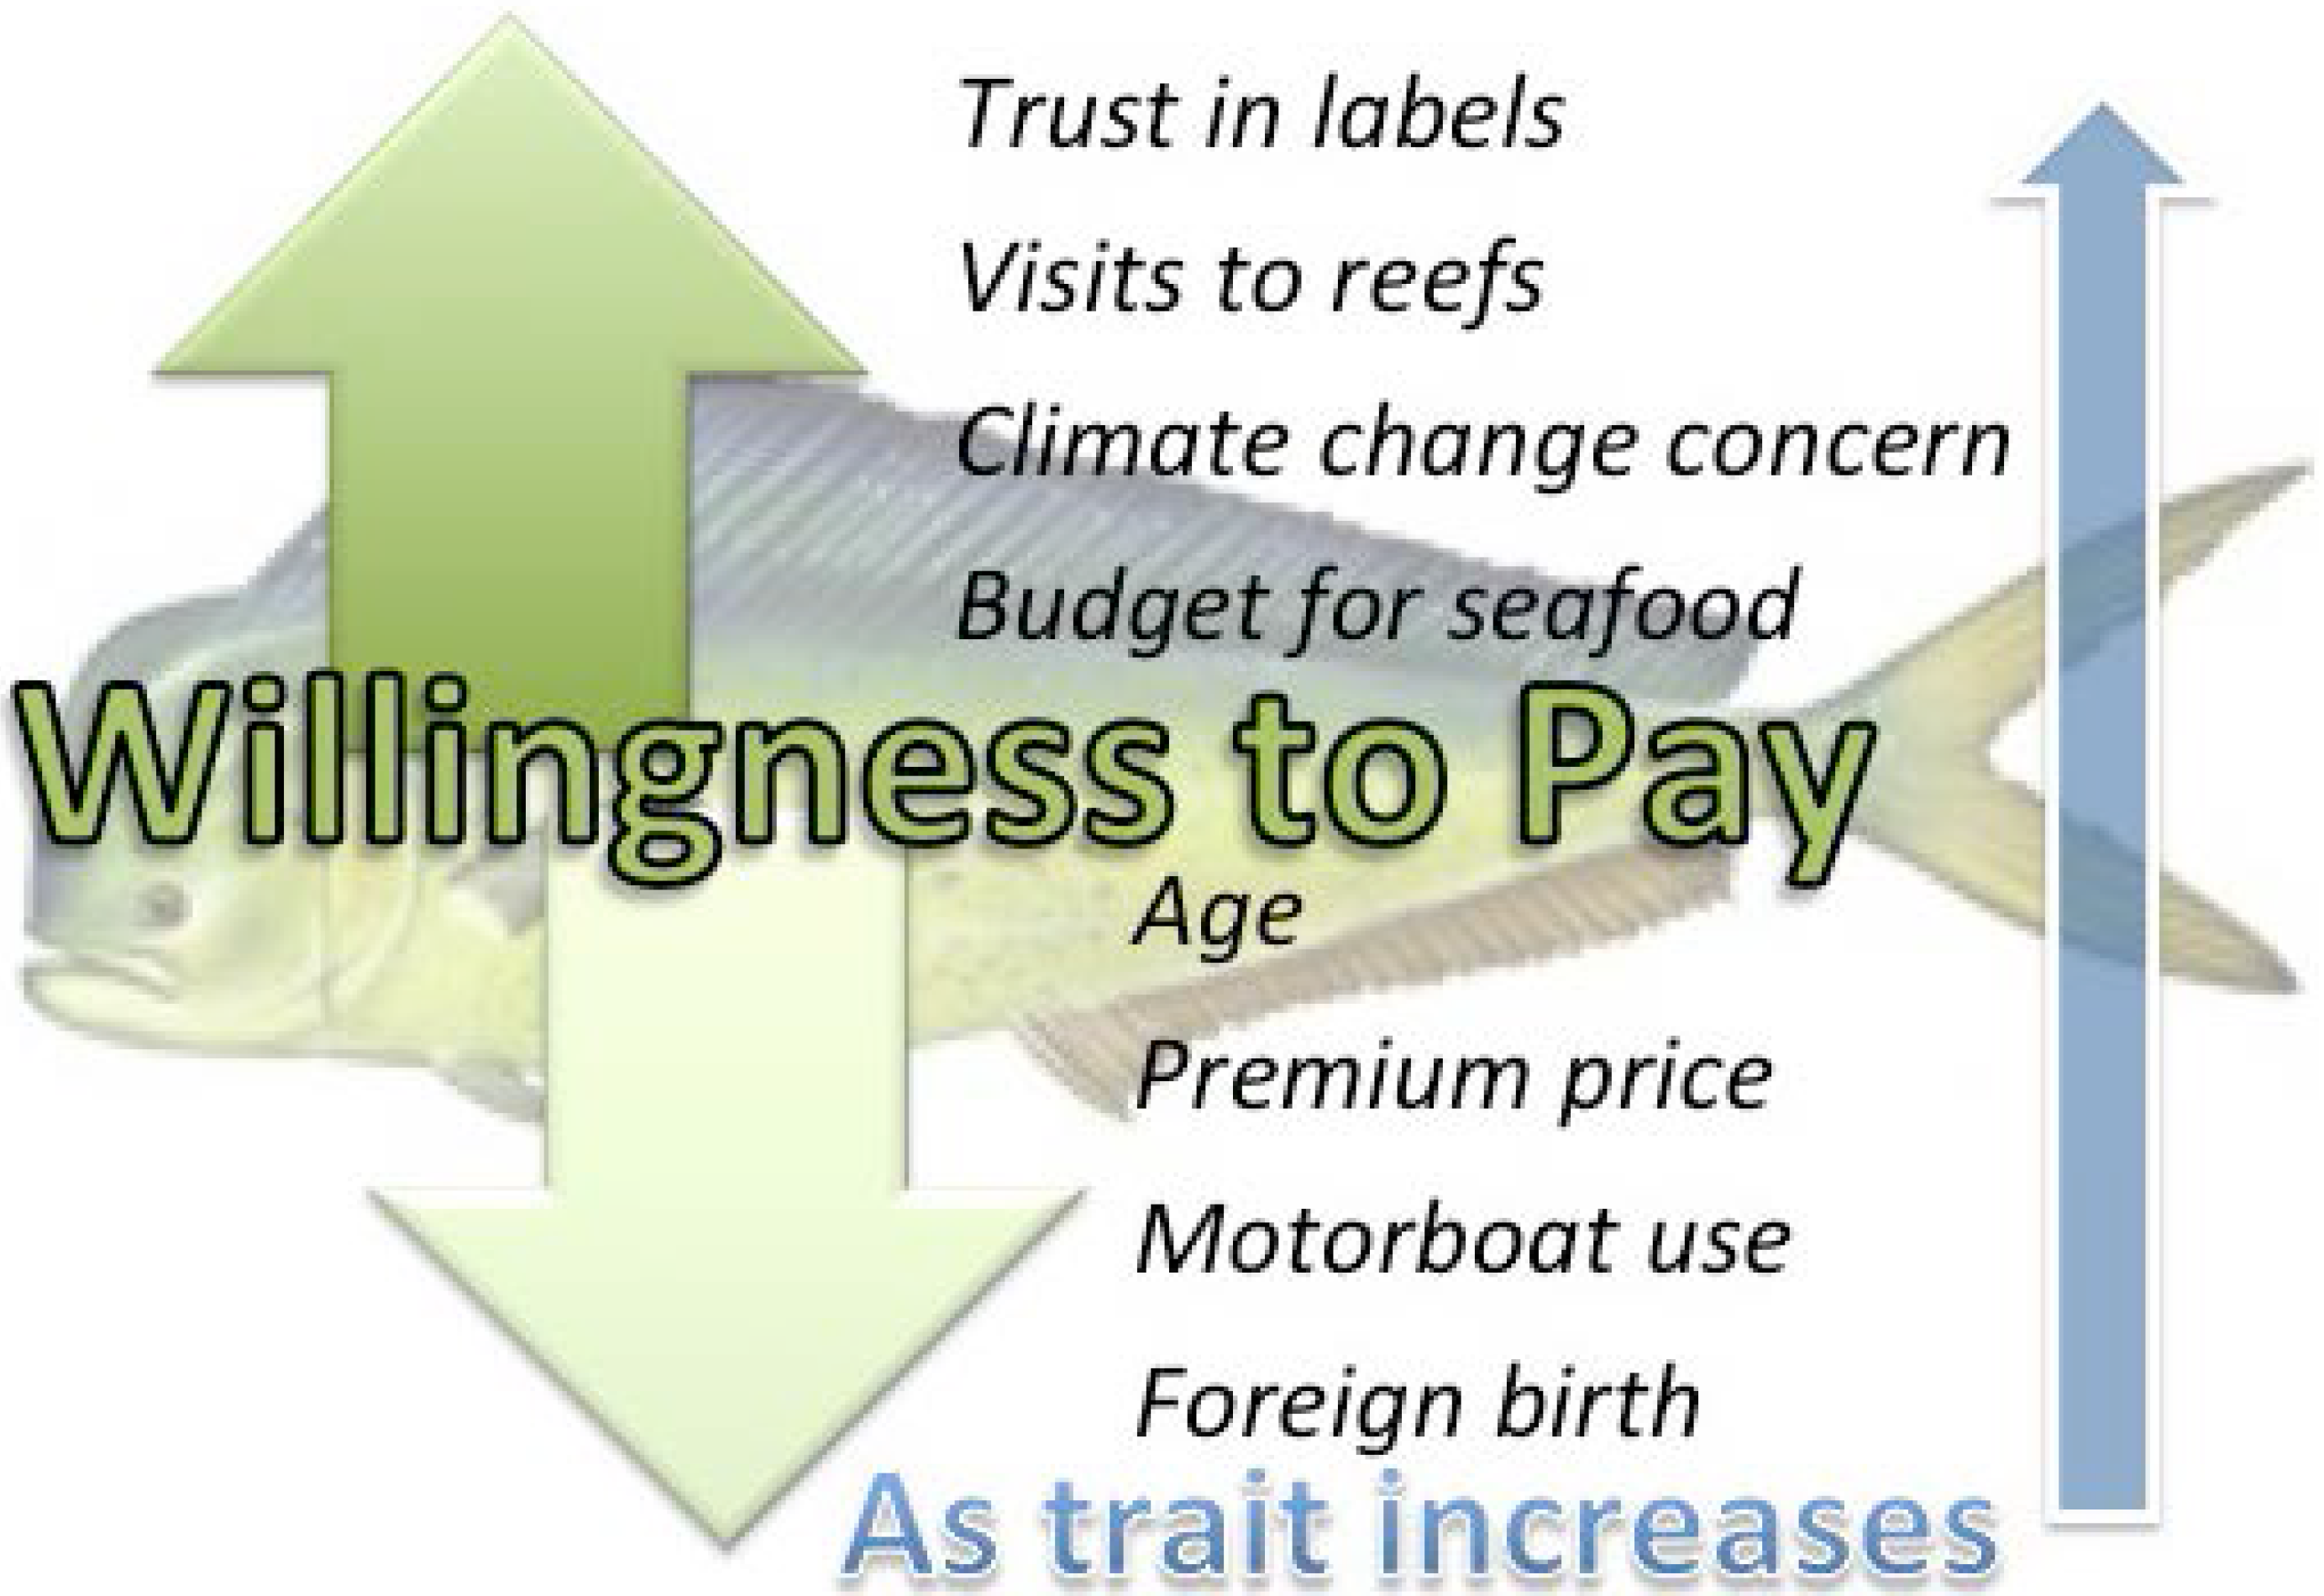
The parsimonious Model 3 for the local seafood scenario has five explanatory variables with significant differences at the 5% level or higher. The two variables of negative influence are the Food Offer (1% level) and Age (5% level). Three positive influences at the 1% level are Trust in Seafood Labels, Visited Any Coral Reef, and Climate Change Concern Scale. The extended Model 4 for local seafood has eight variables of significance (see
Figure 8). The four negative factors are the Food Offer (5% level), Age (5% level), Motorboating (5% level), and Birthplace-Foreign (1% level). Positive and significant variables are Trust in Seafood Labels (1% level), Weekly Seafood Budget (10% level), Visited Any Coral Reef (5% level), and Climate Change Concern Scale (1% level). Significant variables of particularly strong influence in these models are Trust in Seafood Labels, Visited Any Coral Reef, Motorboating, and Birthplace-Foreign.
Figure 8.
Summary of local seafood scenario’s significant traits (variables) and direction of influence on willingness to pay.
Figure 8.
Summary of local seafood scenario’s significant traits (variables) and direction of influence on willingness to pay.
3.6. Diagnostics for Seafood Regressions
The diagnostics show that a high percentage of observations are correctly classified; however, for model 2, the report of significance for the Pearson chi2 means that the model may be deficient (see
Appendix 3). The Hosmer-Lemeshow statistic shows that the model is likely valid, because it passes that test of being non-significant. Using the collinearity diagnostics command in Stata “collin,” none of the variables has a high variance inflation factor, and multicollinearity does not appear to be problematic.
4. Interpretations and Conclusions
The sample represents well the population of coral reef stakeholders living in southeastern Florida, and the selection process means that the vast majority of respondents were selected randomly from among the region’s owners of a Florida saltwater fishing license. Anglers are assumed to represent the typical respondent, because the number of recreational anglers far outnumbers commercial fishers. Less than 10% of respondents belong to the complied, non-random sample of various stakeholder groups, and many of them also practice marine fishing, as only 4% of the entire sample did not. Small percentages indicated that they had not visited a coral reef in Florida (5%) or elsewhere (3%). Vessel ownership is 73%, and majorities practice marine motorboating, fishing, beach visiting, snorkeling, and scuba diving; therefore, stakeholders enjoy ease of access, and their experience encompasses both surface and below surface observations of coral reef areas.
Demographics compare favorably, except for household income, with previous assessments of Florida Reef stakeholders [
52]. In comparison to recreational angler studies, the current study’s sample is much wealthier and better educated [
23,
53,
54,
55]. Their political orientation centers around the category of Independent and skews slightly towards Republican, or somewhat conservative. The comments from the 6% in the category of Other display a disregard for authority and traditional political affiliations. A fervent environmental identity is revealed by multiple variables showing upwards of three-quarters of agreement in support of environmental perspectives. The variable Environmental Orientation replicated a question about affinity with the word “environmentalist” from a U.S. survey about coral reef attitudes, and that study’s mean of 6.3 is nearly identical to the current study’s 6.1 [
46]. The variable Prioritize Environment Over Economy replicated another U.S. survey’s question and differed substantially: 55% in that 2009 study selected the Environment, versus 75% in the current study [
56]. Potential explanations are the wealth of stakeholders in the current study and improving economic conditions.
4.1. Climate Change and Other Perceptions
For the two scales of Climate Concern and Coral Concern, both demonstrate solid reliability, and their validity comes mainly from the replication of questions and statements from previous surveys. Overall, the findings relating to climate change show much greater concern and angst than previous findings from regional and national surveys. The angst over climate change contrasts with national surveys that find limited and stagnating concern for climate change [
57]. For example, in a 2009 national survey [
56], a slightly reworded question with the same response metric as this study asked: “When do you think global warming will start to harm people in the United States?” Only 34% responded “now”, and 15% choose “never”. In comparison, the current study found respective responses of 55% and 12%. In both studies, the majority display concern and belief in climate change, while a minority divides into several brackets of relatively lesser concern and doubt. More than three-quarters of Florida Reef stakeholders foresee climate change impacts within 50 years, and a majority see them now.
The finding of high concern about climate change, combined with the top ranked concerns about coral reefs as acidification and carbon dioxide, indicates a noteworthy modification in attitudes among stakeholders since 2006. The shift to high concern could be attributed to many factors that deserve further investigation, such as: increased media coverage of climate change, increased attention on southern Florida as extremely vulnerable to sea level rise, generally mild winter temperatures, and the effect of Superstorm Sandy in 2013. The expansion of scientific publication about ocean acidification may be reaching stakeholders, as they rank Scientific Literature as the second most common source of information about coral reefs.
4.2. Concern for Coral Reefs
The Coral Reef Concern Scale shows a smoother distribution than the scale for climate change, and it may reflect more nuanced understanding than for climate change, which clusters around numbers achieved when a respondents selects the same answer for all five items (
Figure 5). A coral scale score above 28 means that a respondent selected at least one answer of “strong agreement” with concern, and the average sub-variable score was 3.6, or leaning towards “agree.” Non-temperature related effects of climate change register as more worrisome than rising temperatures. From another perspective, the choice of “high water temperature” may have confounded respondents who recall the damage of cold water temperatures in Florida in 2010 [
31]. The many nuances in understanding and perception of the term “climate change”, while beyond the scope of this study, deserve further investigation.
Regarding perceived threats to Florida’s coral reefs, the three that ranked with a mean above “very destructive” must be considered very worrisome to stakeholders: Sewage and Runoff, Dredging and Construction, and Invasive Species. Only two threats register below the midpoint: Fishing, and Scuba Diving and Snorkeling. Considering that the vast majority of respondents are fishers, it comes as little surprise that they would consider fishing a minor threat. The threat variables appear to cluster into groups of three that place the highest anxiety around large-scale, regional development issues that affect water quality. The central cluster of threats represents global climate or supra-regional issues that may be considered beyond the scope of local management. The cluster of least destructive threats could be addressed locally, and they represent the stakeholders’ most common marine activities. The sample’s emphasis on recreational anglers may explain why seafood ranks as the highest quality resource from the mainland, and they distinguish it from coral reefs, which ranks second lowest.
4.3. Trust in Seafood
For the two seafood scenarios, local seafood earned 16% greater support than sustainable seafood, although each was favored by supermajorities. The term “local” was described in terms of its economic benefits to fishing communities, and the question explained that the premium would be additional to the premium for sustainable seafood. Yet respondents may not have read the question carefully enough to realize this cumulative effect, and they may have misinterpreted the lower premiums to indicate that local seafood would cost less than sustainable seafood. If there were no misunderstandings, the result indicates a much greater respect and demand for seafood with local origination. This finding compliments the 2014 choice experiment showing that Florida residents will pay more for local seafood [
58].
The supply of local seafood in Florida is decreasing, and this scarcity may be influencing an increase in demand [
36]. Recreationally, the number of fish caught remained relatively stable from 1990 to 2006, but the poundage decreased substantially [
36]. Reef-associated spiny lobsters in particular are fished heavily by both recreational and commercial sectors, and well-established harvesting seasons support sustainability in ways that could increase its desirability as a local product while also obscuring unsustainability in other fisheries. Further study could explicate conceptions of the term “local” and how much stakeholders apply it to specific fisheries.
Broader research of sustainable seafood preferences is too thin to offer much guidance. One study of labeled seafood purchases in California supermarkets found that seafood sales declined when sustainability labels were introduced; it also found education levels to be influential [
40]. In the current study, education curiously shows no consistent, significant pattern on willingness to pay. Perhaps knowledge and appreciation of the marine environment is disassociated with formal education in the U.S. Anglers could come from any educational background, and as indicated in the results, personal experience is the primary means of stakeholders’ knowledge about coral reefs. As for seafood, many Florida anglers display a preference or exclusivity for consuming fish caught recreationally [
43]. Florida Reef stakeholders across various socio-economic strata display a very strong preference for local seafood.
In contrast to the expectations of intuition and theory, the seafood scenario results show no significant correlation with income or education. Surprisingly, a person with relatively low education and annual household income below $60,000 is equally likely to pay the premium as a person with higher education and income above $160,000. One possible explanation comes from the follow-up question that asked about trust in sustainability labels. Although the mode was the top category of “highly credible”, the wide range of responses and a moderate mean of 7.3 (on a scale of 1 to 11) indicate disparities in trust among stakeholders as consumers. This variable proved very significant and influential in the regressions. Based on the log-odds ratio of the extended regressions, the variable of trust in seafood labels accounts for increased odds of 26% for a sustainable choice and 33% for a local seafood choice. In comparison, a study found that labels similar to dolphin-safe tuna influenced buyers in Florida to spend more, yet most Florida residents did not pay close attention to seafood labels of country of origin [
58].
The trust-choice connection may result from the novelty of seafood labeling schemes and the term “sustainable seafood” lacking clarity. Seafood labeling remains voluntary and heterogenous, and its effects on fisheries are opaque [
59,
60,
61]. Stakeholders from earlier generations will have personal purchasing histories that are devoid of such labels, whereas younger stakeholders may hold them as an expectation. Moreover, such generational differences, and particularly a baby boomer effect, may influence willingness to pay for an item that could be interpreted as a luxury.
4.3.1. Influences on Sustainable Seafood Decisions
Comparing the sustainable seafood’s parsimonious and extended models, the variables of Climate Change Concern and Environmental Orientation lost significance, and the latter was dropped from the model due to potential interactions with Political Identity. Respondents who visited coral reefs more often were much more likely to respond favorably, and their perspective may also be reflected in the sub-variables and scale for Coral Reef Concern. People having familiarity with marine environments would use this knowledge in making related decisions; still, it is unclear what specific marine activities engender the greatest support of sustainability. The sub-variables for Political Identity show extreme influence and may be interacting with climate related variables. The 16% of respondents who identify as Independent/leans Democrat show the strongest willingness to pay, accounting for 289% greater odds in the sustainable model’s odds ratio.
The profile of the person choosing to pay more for sustainable seafood emerges as someone who is oriented towards the Democratic political party, gives credibility and trust to food labeling schemes, and budgets more than typical amounts for seafood. He or she is typically from younger generations, interacts highly with coral reefs, and internalizes great angst about coral reefs. It is unclear if financial considerations or environmental issues have more influence, and the absence of significant effects from income and education indicates that ideology is much more important than status in this decision. The idea of seafood being “sustainable” appears to trigger very personal and political decision-making.
4.3.2. Influences on Local Seafood Decisions
Local seafood models differ from the sustainable seafood models in several ways. The variable Coral Reef Concern lacks significance, as does Environmental Orientation. Even the variable Political Identity lacks significance, whether regressed as one variable or by its sub-variables. Strongly influential variables revealed in the extended model for local seafood demonstrate the negative effect of using a motorboat and of being born in a foreign country. The latter makes intuitive sense if foreign-born respondents would favor seafood from their country of origin instead of from Florida. The variable of Motorboating was also negative and nearly significant in the sustainable seafood model. It is curious that ownership of a motorboat is not significant while the activity of using a motorboat is significant. There are close correlations between motorboating and fishing (chi2 = 0.5270 N = 1450) and visiting coral reefs (chi2 = 0.3062 N = 1340), yet the latter has an opposite effect on WTP. A hypothesis is that commercial fishers, who would use motorboats more regularly than recreational anglers, exhibit less WTP and account for this discrepancy.
4.4. Conclusion
The Florida Reef, its management, and its stakeholders have been partitioned in the literature, and more integrated conceptions offer opportunities for reassessment. By creating a unified socio-ecological portrait of a reef system connected to proximate centers of human population, a regional depiction emphasizes licensed recreational anglers and boat owners as the most typical stakeholders, and this conception differs from nearly all previous Florida Reef stakeholder studies. It remains unfortunate that tourists and general residents lack the necessary, basic awareness of the Florida Reef to engage in commentary.
Across the region, motorboating and fishing are prodigious forms of marine engagement that may obfuscate understanding of the ecosystem. These stakeholders rank local seafood as high in quality and fishing as among the lowest impacts to coral reefs. People who enjoy fishing at sea are privileged, and they may have a propensity to prioritize their enjoyment and privilege ahead of an impersonal, analytical assessment of the ecosystem, which is threatened by boating and overfishing. Their perspective is important, however, as informed citizens who could influence other constituencies. Stakeholders of the Florida Reef are wealthy, educated, and politically independent, thereby indicating the potential for higher than average economic and political influence.
Climate change has emerged from obscurity and into a prominent concern of stakeholders within the past decade. They recognize its detrimental effects on the ocean and coral reefs, and they use this perspective when making marine-related purchasing decisions, such as for seafood. Stakeholders worry somewhat more about non-temperature related climate change effects than global warming, and they perceive local development as the gravest threat to coral reefs.
Although poorly studied, seafood preferences offer promise as an assessment tool of stakeholder levels of commitment to sustainability. Regressions reveal several influences on purchasing decisions, and willingness to pay appears suppressed for stakeholders who are older, born abroad, and more frequent users of motorboats. Willingness to pay rises for stakeholders who have higher levels of trust in seafood labeling schemes, of visitation to coral reefs, of environmental concern, and of a political orientation leaning towards the Democratic party. A higher weekly seafood budget is also influential, but surprisingly, annual household income and education are not. These missing influences contradict theory and beg further investigation.
The thought process behind a personal assessment of coral reefs and of a marine product purchasing decision is exceedingly complex and only dimly illuminated by survey responses. The data indicates a potential bundle of issues around trust, with greater confidence in authority coming from younger, more environmentally conscious stakeholders or “locavores” who care about the origination of food. In contrast, less supportive stakeholders could be represented by the icon of
The Old Man and the Sea and his suspicion of authority, an independent spirit characteristic of residents of the Florida Keys, and frugality in spending on a product, seafood, that could be captured directly [
62]. While the continuation of such distrust and independence is problematic for a degrading resource, stakeholders as a whole appear to be moving in a new, more conciliatory direction. They express a strong willingness to pay for sustainable and especially local seafood, and they acknowledge a host of threats to the Florida Reef, including climate change, which also influences decision-making. These attitudes appear auspicious for the development of new management schemes. Unfortunately for the Florida Reef, its future rests not only in the hands of the hundreds of thousands of stakeholders and more than six million people living near it, but also with the more than seven billion people sharing the planet.


