1. Introduction
Wind-driven storm surge can cause great damage and loss of life in coastal regions. In August 2005, Hurricane Katrina struck the New Orleans, Louisiana, area and directly caused 1500 fatalities [
1] (p. 11). In November 2013 Super Typhoon Haiyan made landfall near Tacloban City in the Philippines, generating a 6 m surge that drowned thousands of people [
2]. Numerical models such as ADCIRC and Coupled Ocean Atmosphere Wave Sediment Transport (COAWST) seek to simulate the effects of tropical cyclones mathematically, and thereby provide timely forecasts for a threatened population. A real-time forecasting system can give advance warning to emergency managers in time to take action and perhaps order an evacuation. Static analyses of a port city’s vulnerability can assist civil authorities in their long-term planning.
COAWST is a modeling framework that integrates the atmospheric model WRF (Weather Research and Forecasting) with the ocean model ROMS (Regional Ocean Modeling System), the wave model SWAN (Simulating WAves Nearshore), and the Community Sediment Transport Model [
3]. COAWST provides a wetting and drying algorithm that simulates inundation and retreat of the ocean from the original shoreline [
4]. Prior studies have demonstrated that COAWST can simulate storm surge accurately in its two-dimensional mode, which runs faster than 3-D [
5,
6]. For this study COAWST/ROMS was driven by idealized winds, without coupling to WRF or SWAN.
Drews and Galarneau (2015) presented a new technique for analyzing the surge potential of a coastal city when the wind is blowing from eight different compass points [
6]. The present study expands this directional analysis and applies it to oblong enclosed bodies of water. The objective is to determine how a port city at the end of a long inlet is affected by storm surge. Is the port protected from winds outside a narrow range of directions? Or does a long narrow sea channel the surge toward the downwind end? The study results are applicable to several large coastal cities, such as New York City, NY, USA; Bangkok, Thailand; and St. Petersburg, Russia.
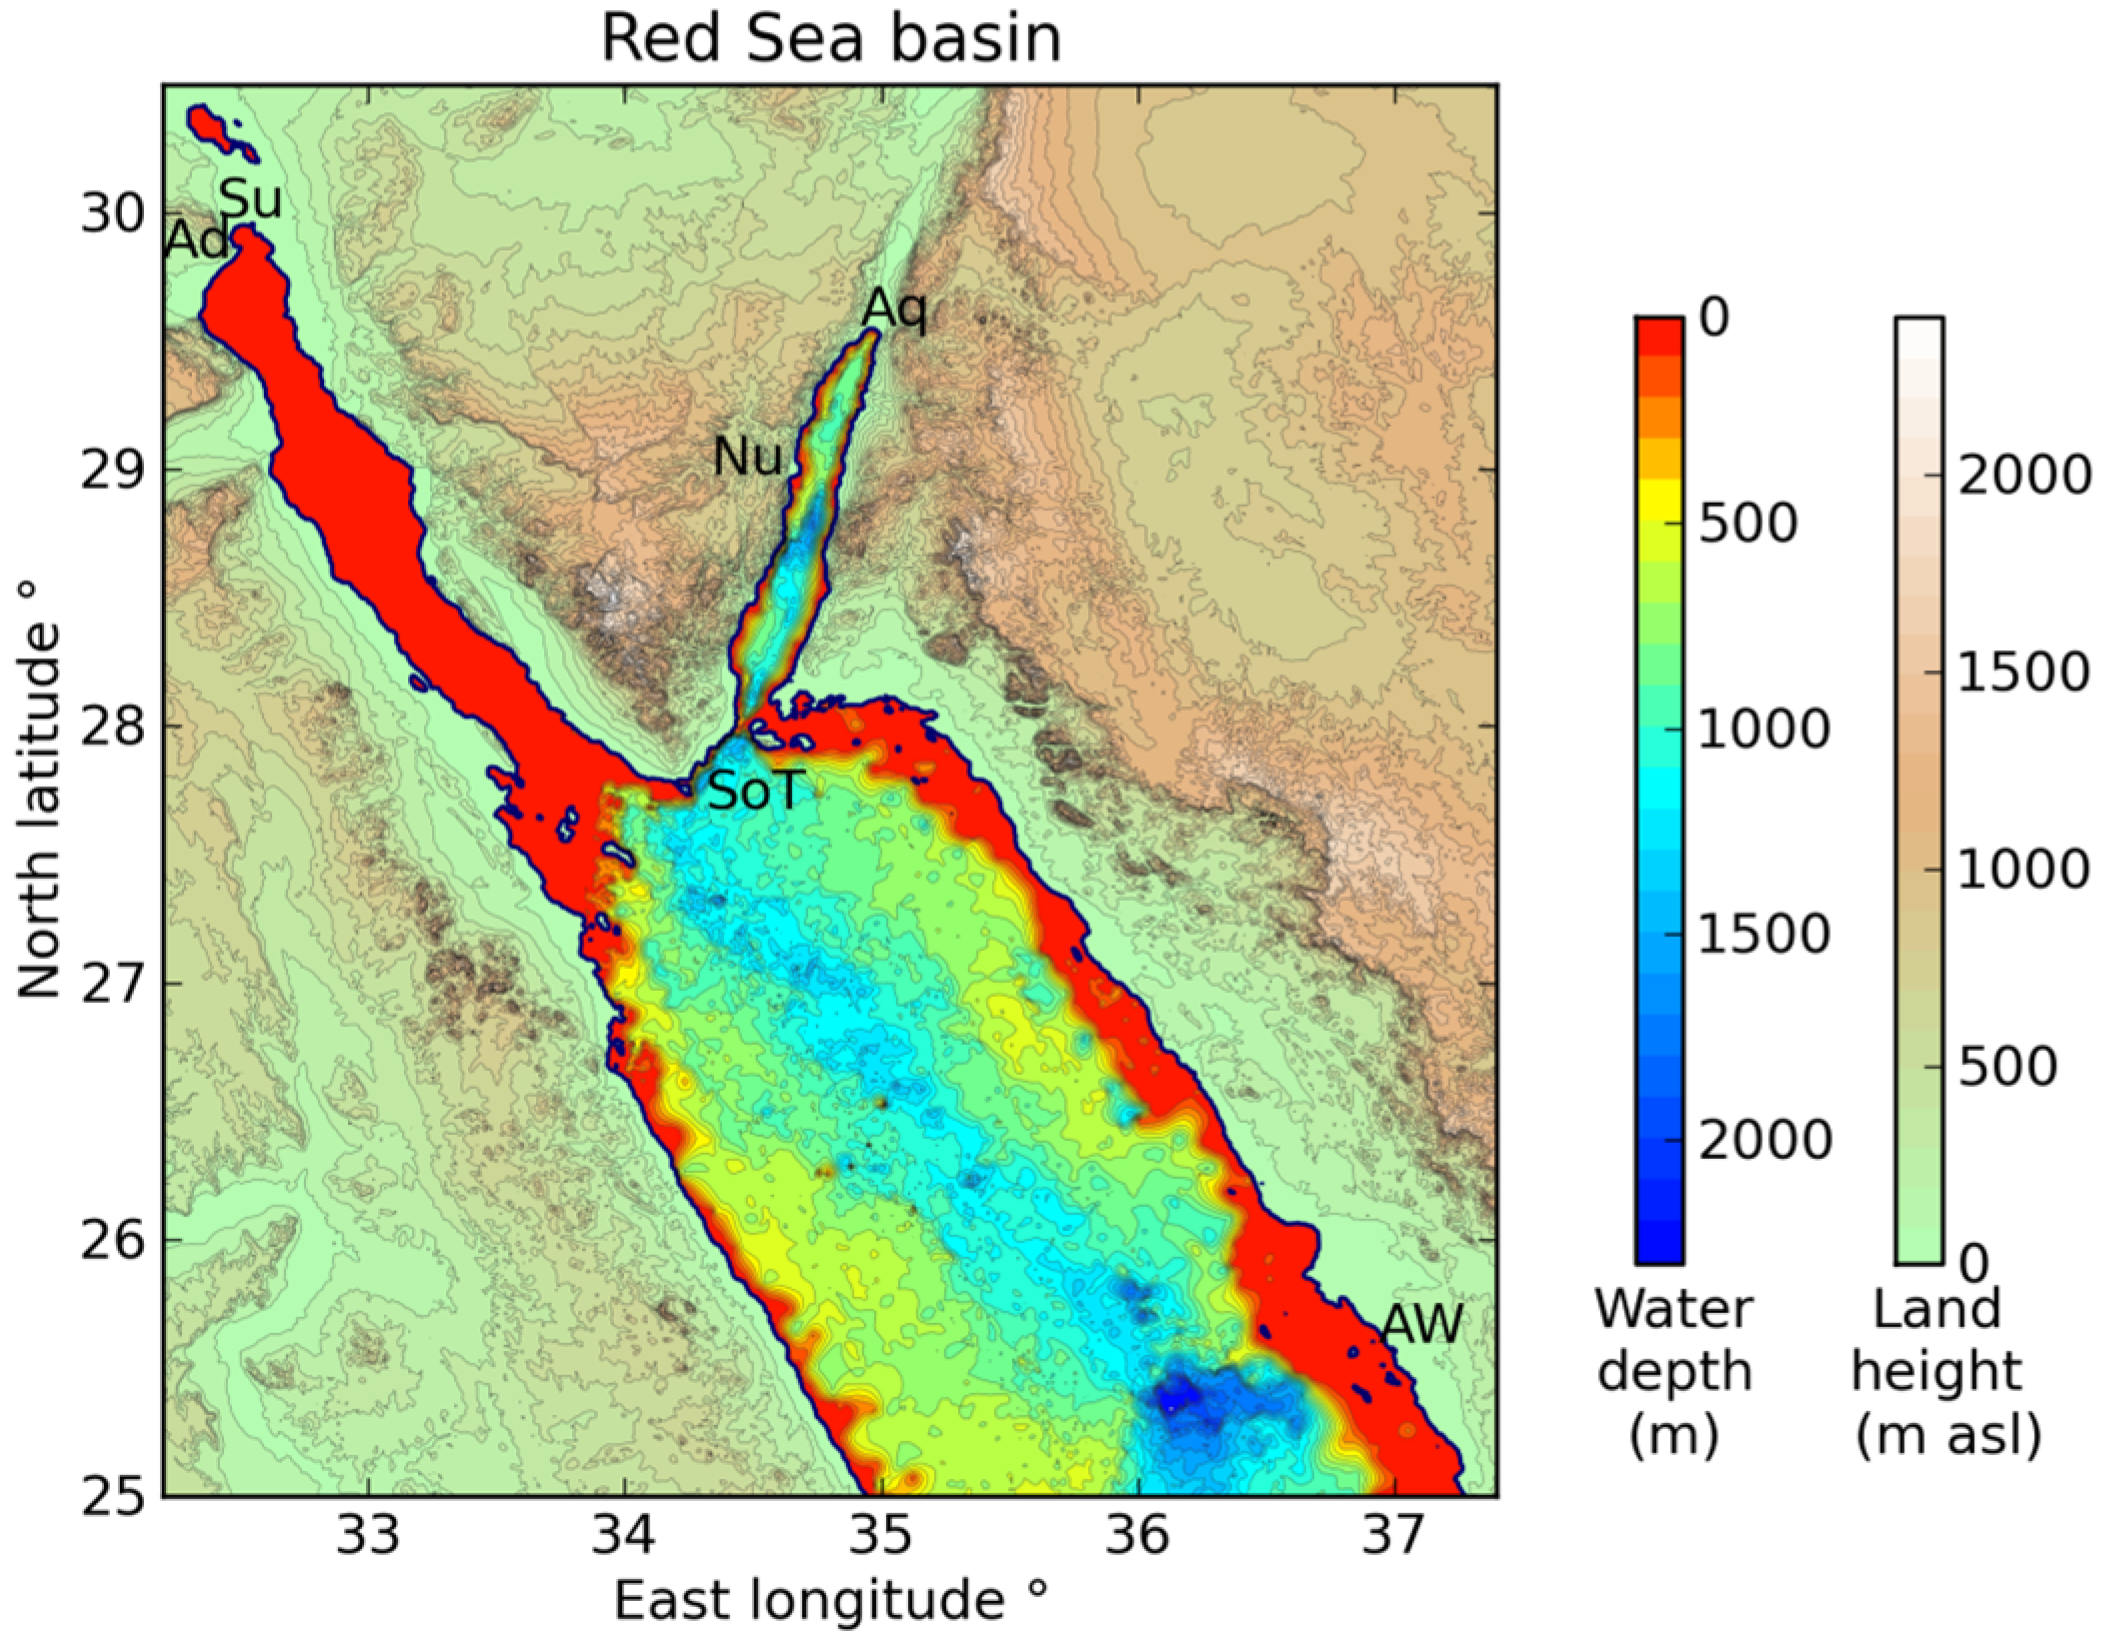
The Red Sea is a long narrow body of water between northeast Africa and the Arabian Peninsula. The northern end splits around the Sinai Peninsula into the shallow Gulf of Suez to the west, and the much deeper Gulf of Aqaba to the east (
Figure 1). The Red Sea proper (south of Sinai) is also deep. The Suez Canal terminates at the port of Suez, providing an important marine connection between the Mediterranean Sea and the Indian Ocean. Deep-draft vessels should recognize the effects of wind on water levels in the Gulf of Suez.
Table 1 lists the dimensions of bodies of water included in this study.
Figure 1.
Red Sea domain. The northern section of the Red Sea splits into the shallow Gulf of Suez to the west (left); and the deeper Gulf of Aqaba to the east (right). The contour interval is 100 m. Su = Suez; Ad = Adabiya; SoT = Straits of Tiran; Nu = Nuweiba; Aq = Aqaba; AW = Al-Wajh. Sill depths are: Nuweiba 780 m, Enterprise Passage 250 m through the Straits of Tiran.
Table 1.
Dimensions of seas and gulfs. The average depths are calculated by averaging all SRTM30 grid points below sea level. The Red Sea proper is south of the Sinai Peninsula and the Straits of Tiran. The modeled Red Sea domain extends south only to 25° North latitude.
Table 1.
Dimensions of seas and gulfs. The average depths are calculated by averaging all SRTM30 grid points below sea level. The Red Sea proper is south of the Sinai Peninsula and the Straits of Tiran. The modeled Red Sea domain extends south only to 25° North latitude.
| Name | Length (km) | Width (km) | Average Depth (m) |
|---|
| Gulf of Suez | 300 | 30 | 41 |
| Gulf of Aqaba | 180 | 18 | 546 |
| Red Sea proper | 1940 | 190 | 750 |
| Adriatic Sea | 790 | 130 | 218 |
Storm surge height increases with the fetch distance of open water along which the wind blows. For example, at Aqaba/Eilat the fetch distance is fairly short (~10 km) unless the wind direction is exactly aligned with the Gulf. The Gulf of Aqaba stretches 174 km from the Straits of Tiran to Aqaba.
Figure 2 shows the fetch distance at Aqaba plotted according to compass direction. One might expect the surge height at Aqaba to display a similarly narrow spike when the wind blows directly out of Tiran.
Figure 2.
Fetch distance by compass direction at Aqaba; Nuweiba; and Adabiya (10 km southwest of Suez). 0° and 360° = east; 90° = north; 180° = west; 270° = south. The fetch is defined as the straight-line distance across water before hitting land.
Figure 2.
Fetch distance by compass direction at Aqaba; Nuweiba; and Adabiya (10 km southwest of Suez). 0° and 360° = east; 90° = north; 180° = west; 270° = south. The fetch is defined as the straight-line distance across water before hitting land.
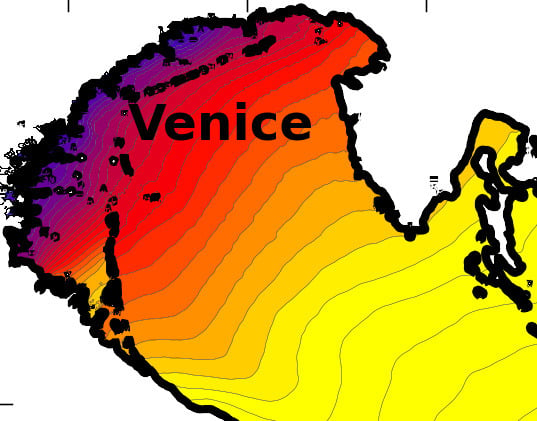
The Adriatic Sea lies between Italy to the southwest and Croatia to the northeast. The UNESCO World Heritage City of Venice is situated in a lagoon at the northwestern end of the Adriatic, about 53 km north of the Po River delta (
Figure 3). The Adriatic Sea becomes shallow toward Venice, and southeast winds cause flooding (
Acqua alta in Italian) every few years. If sea level rises, more frequent high water could damage the city. What range of wind directions poses a danger to Venice?
Figure 3.
Adriatic Sea domain. The contour interval is 100 m. Ve = Venice; Ch = Chioggia; Cr = Crespino; Pe = Pescara; Dk = Dubrovnik; Ds = Durres. The SRTM30 terrain data shows the Po coastal plain as below sea level.
Figure 3.
Adriatic Sea domain. The contour interval is 100 m. Ve = Venice; Ch = Chioggia; Cr = Crespino; Pe = Pescara; Dk = Dubrovnik; Ds = Durres. The SRTM30 terrain data shows the Po coastal plain as below sea level.
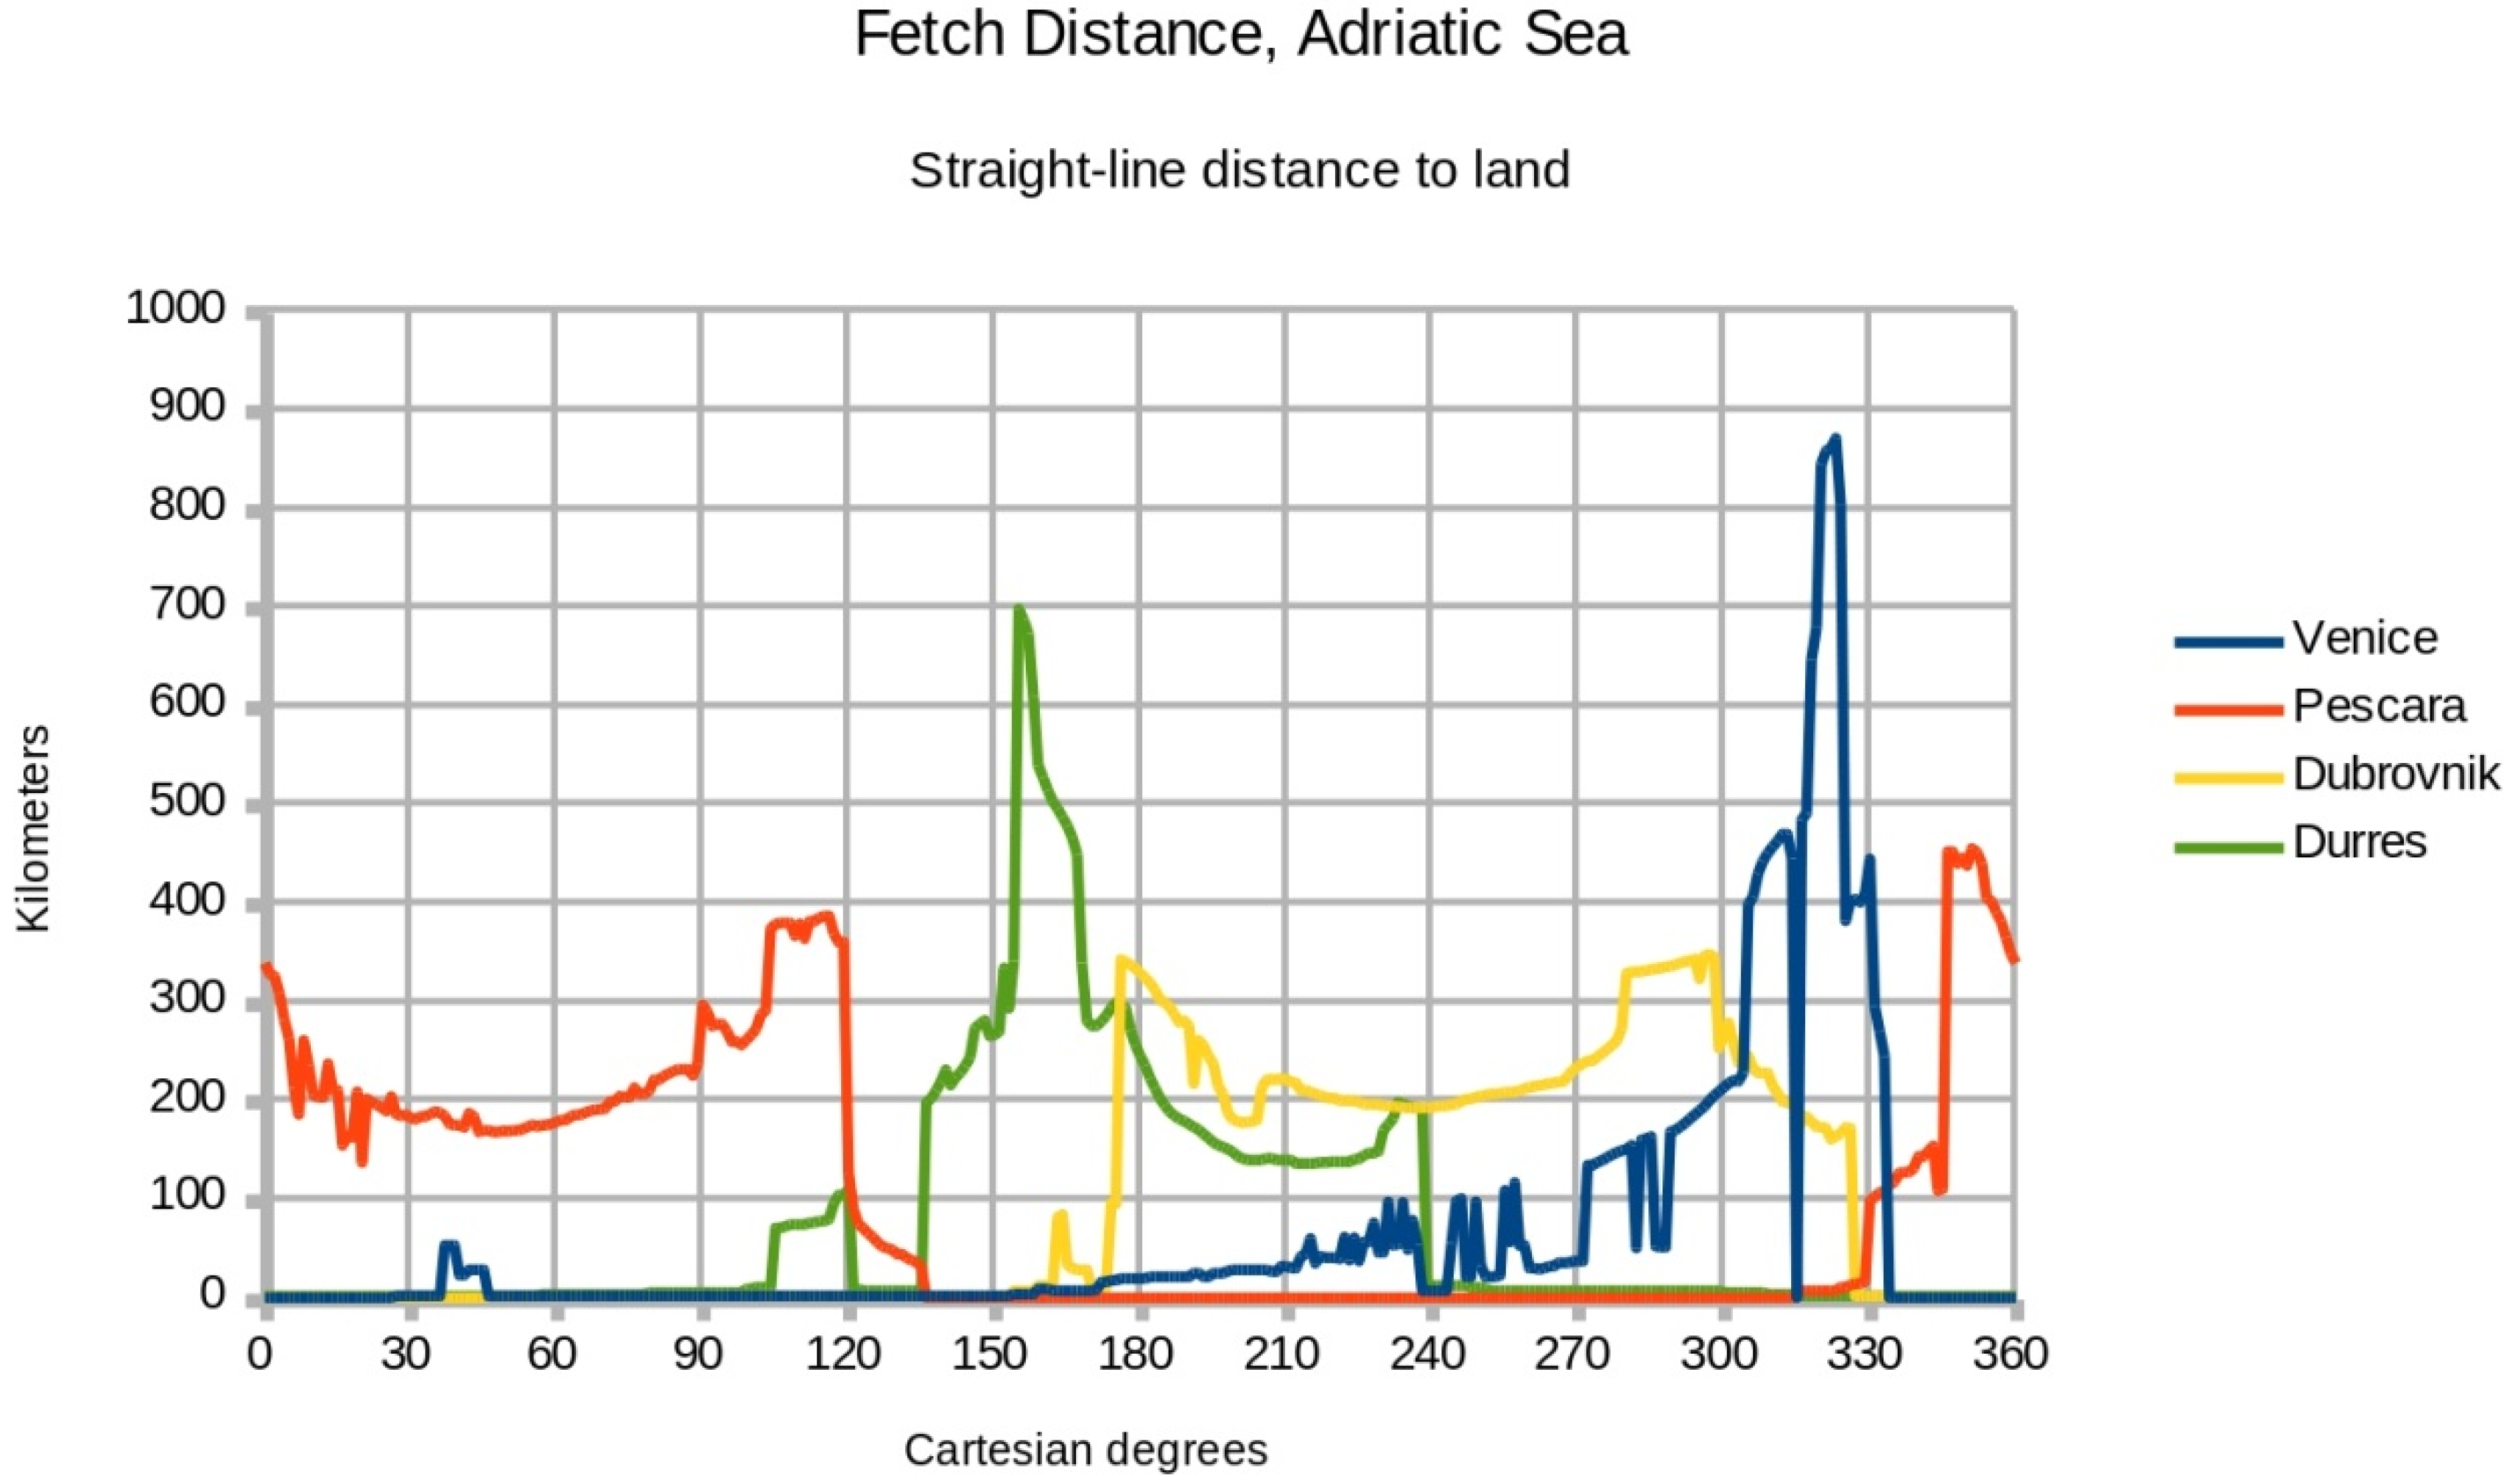
Figure 4 shows fetch distances along the coast of the Adriatic Sea, plotted according to compass direction. The fetch is the straight-line distance from the city across open water before hitting land, at the given angle. There are gaps in the fetch curve for Venice because small nearby islands block the fetch across the open sea.
Figure 4.
Fetch distance by compass direction for ports on the Adriatic Sea.
Figure 4.
Fetch distance by compass direction for ports on the Adriatic Sea.
Drews and Galarneau (2015) used angle increments of 45° for their directional analysis. The present study used increments of 10° to achieve more accurate resolution. I applied wind stress to the model domain in a single direction, allowed the water’s free surface to react to that wind stress over 24 h, and measured the resulting water level at several selected points along the coast. The wind direction was then rotated and the 24 h repeated, throughout the full 360° range of compass points. Winds blowing offshore generated wind setdown, a lowering of the water level, which is the opposite of storm surge.
2. Results
Figure 5 shows the water level in the northern Red Sea when winds are blowing out of the southeast (from 300° Cartesian). This wind direction generates the maximum surge at Suez, since the incoming wind is aligned with the Gulf of Suez and the Red Sea proper along the longest possible fetch distance. The surge height is 1.68 m at Suez and 1.54 m at Adabiya.
Table 2 shows the site names and locations for recording the simulated water level.
Figure 5.
Red Sea surge height with wind blowing from southeast (300° Cartesian).
Figure 5.
Red Sea surge height with wind blowing from southeast (300° Cartesian).
Table 2.
Site names and locations for the Red Sea and Adriatic Sea. Latitude and longitude are in decimal degrees north and east. The maximum simulated surge heights are in meters, and the wind directions are given in Cartesian degrees.
Table 2.
Site names and locations for the Red Sea and Adriatic Sea. Latitude and longitude are in decimal degrees north and east. The maximum simulated surge heights are in meters, and the wind directions are given in Cartesian degrees.
| Name | Latitude | Longitude | Country | Max Surge | Direction |
|---|
| Aqaba | 29.5397 | 34.9764 | Jordan | 0.055 | 230 |
| Nuweiba | 28.9838 | 34.7576 | Egypt | 0.026 | 220 |
| Tiran | 27.9858 | 34.4444 | Egypt/Saudi Arabia | 0.034 | 100 |
| Al-Wajh | 25.5467 | 36.9883 | Saudi Arabia | 1.43 | 205 |
| Adabiya | 29.8885 | 32.5486 | Egypt | 1.54 | 300 |
| Suez | 29.9449 | 32.5486 | Egypt | 1.68 | 300 |
| Venice | 45.4240 | 12.3505 | Italy | 2.02 | 320 |
| Chioggia | 45.2304 | 12.2729 | Italy | 1.94 | 330 |
| Crespino | 44.9834 | 11.9167 | Italy | 2.72 | 350 |
| Pescara | 42.4751 | 14.2251 | Italy | 0.57 | 70 |
| Dubrovnik | 42.6405 | 18.0942 | Croatia | 0.36 | 170 |
| Durres | 41.2620 | 19.4988 | Albania | 0.74 | 190 |
Simulation experiment RS11 extends the Red Sea domain southward from 25° to 20° North latitude. This change increases the storm surge height to 1.77 m at Suez and 1.62 m at Adabiya. Adding 555 km of fetch to the Red Sea increases the storm surge at Suez by less than 10 cm because the Red Sea proper is very deep and does not generate much surge. The original southern boundary of 25° North latitude is satisfactory for the present modeling study.
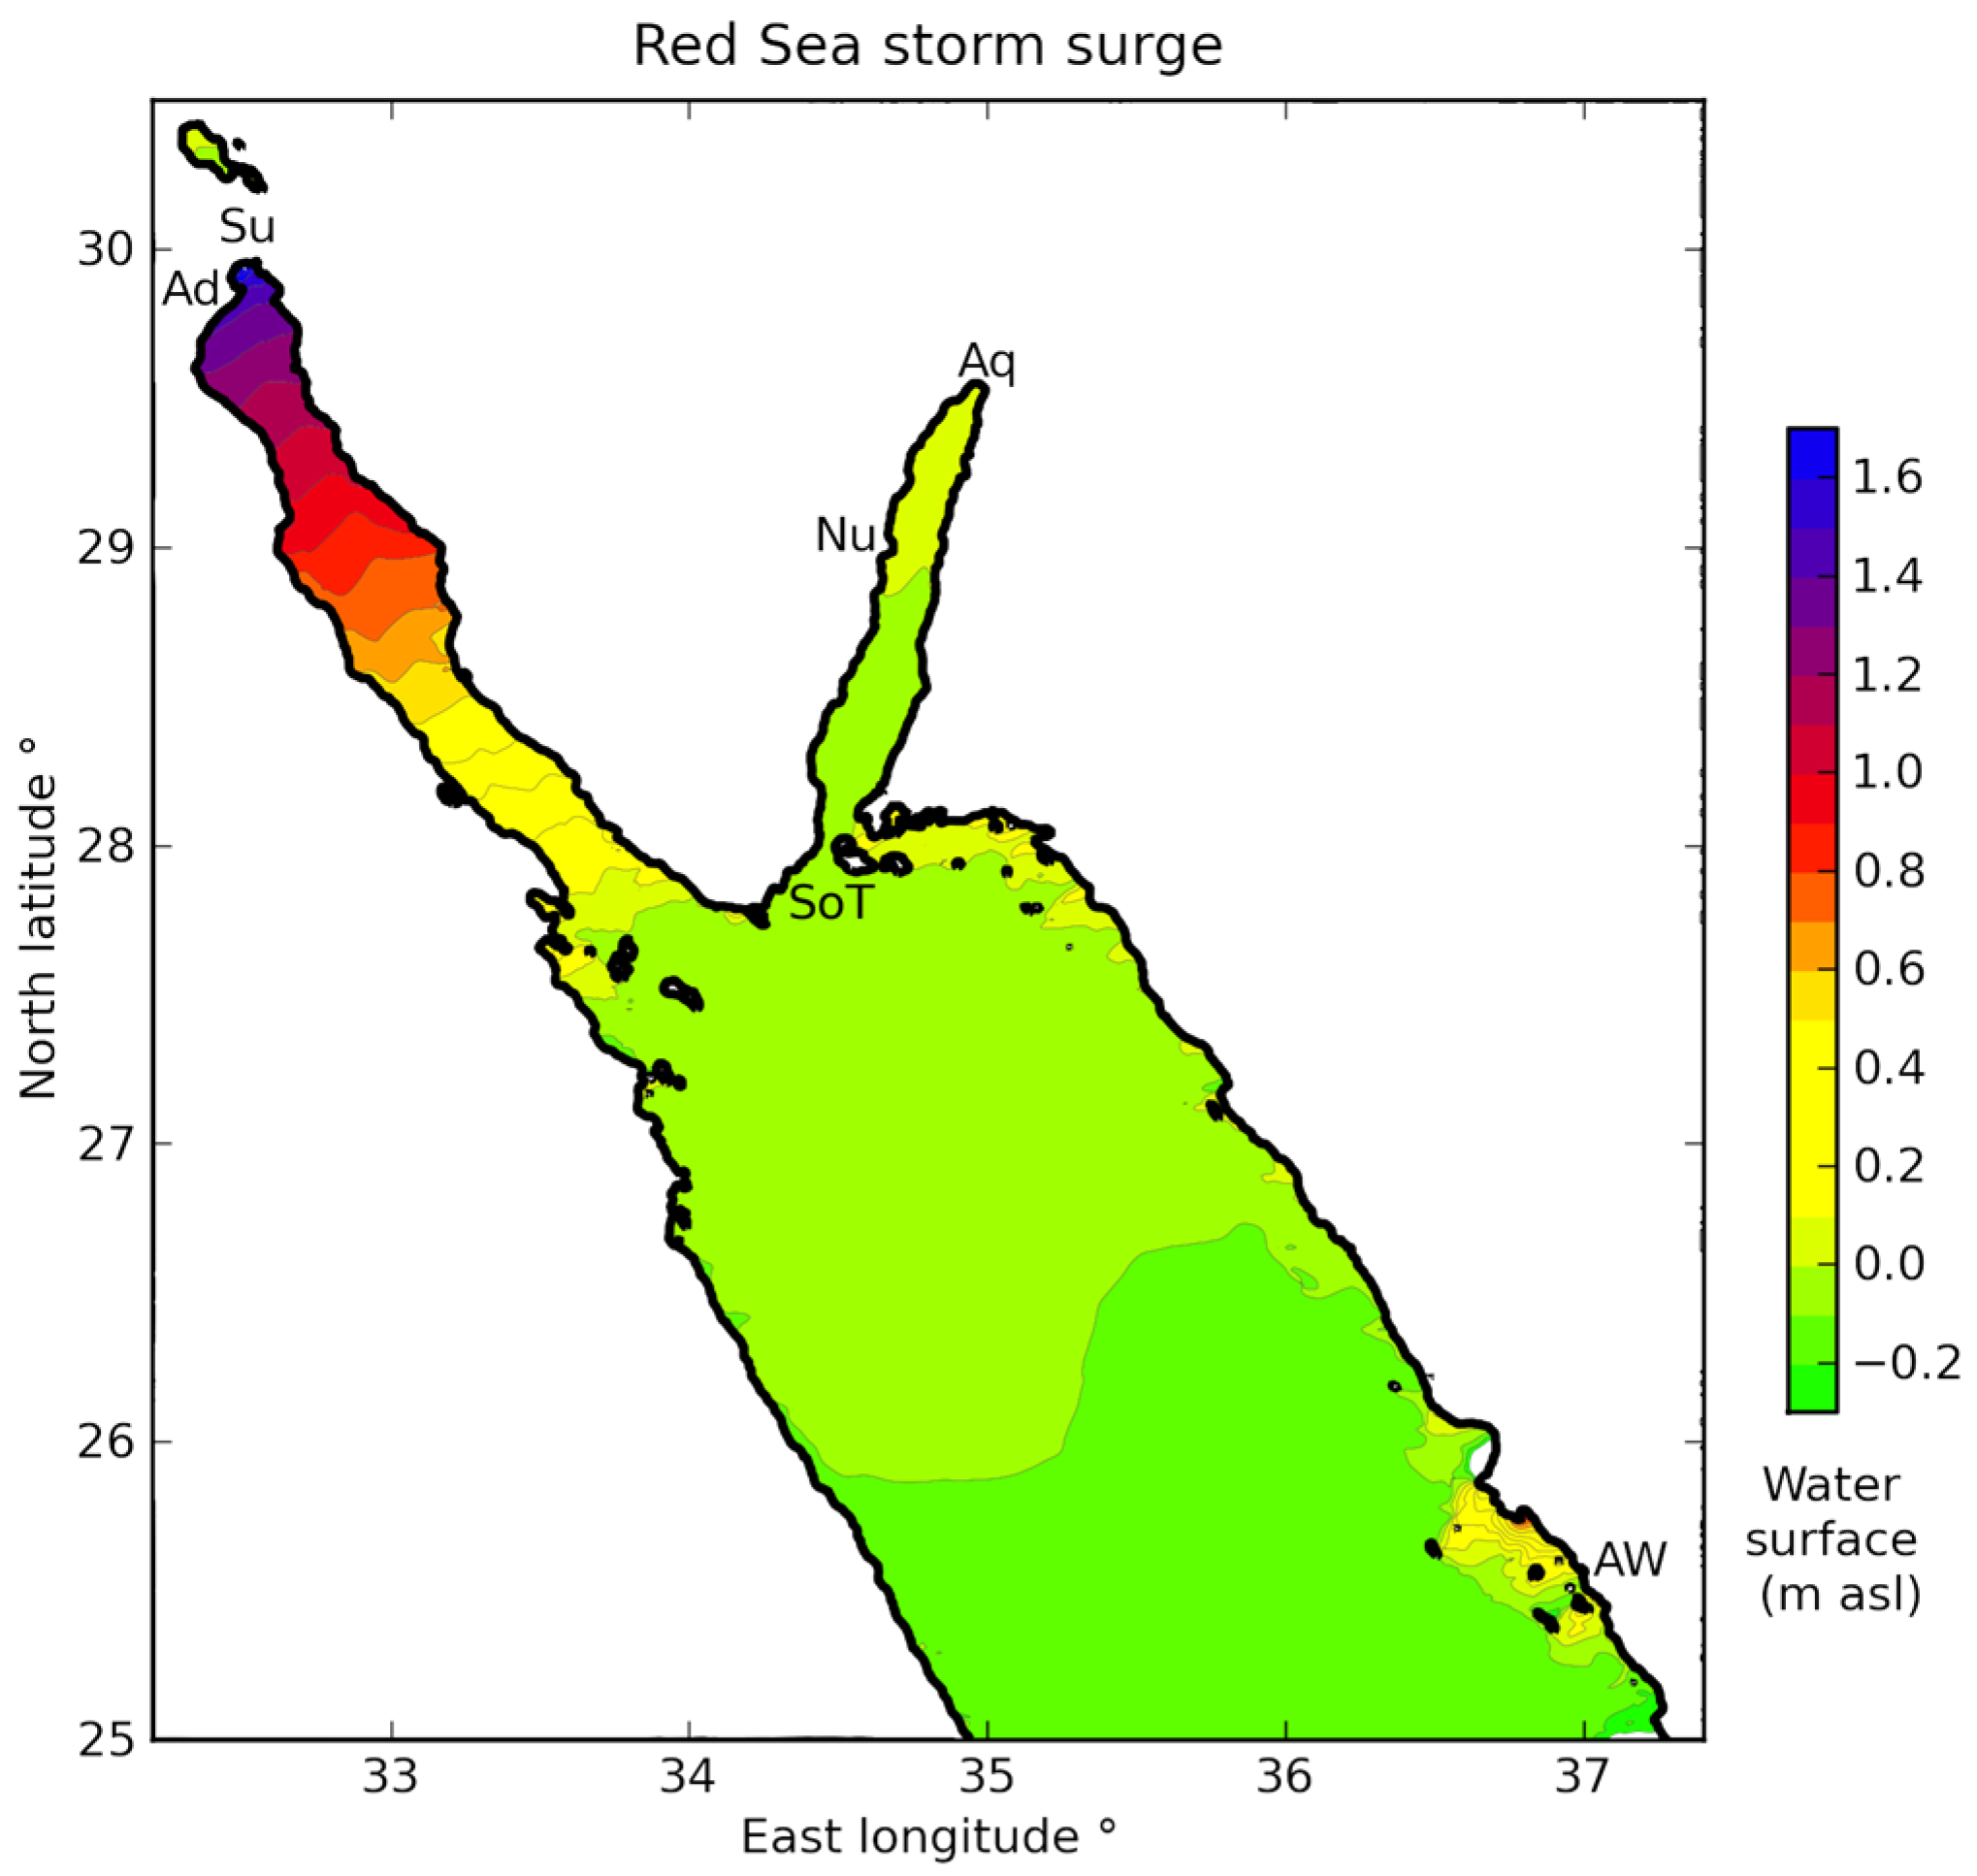
Figure 6 shows the water level when winds are from the southwest (from 230° Cartesian). This direction generates the maximum possible surge at Eilat/Aqaba, since the wind is aligned with the Gulf of Aqaba. The surge height is 0.055 m at Aqaba, 0.025 m at Nuweiba, and −0.014 m at the Straits of Tiran. Notice the extreme surge height (1.3 m) at Al-Wajh, a shallow shelf along the Saudi Arabian coast. Al-Wajh offers an exposed point on a straight shoreline to compare with the enclosed ports of Suez and Aqaba.
Figure 6.
Red Sea surge height with wind from southwest (230° Cartesian). Note the extreme storm surge at Al-Wajh.
Figure 6.
Red Sea surge height with wind from southwest (230° Cartesian). Note the extreme storm surge at Al-Wajh.
The directional analysis plots the surge height and wind setdown as a function of the wind angle.
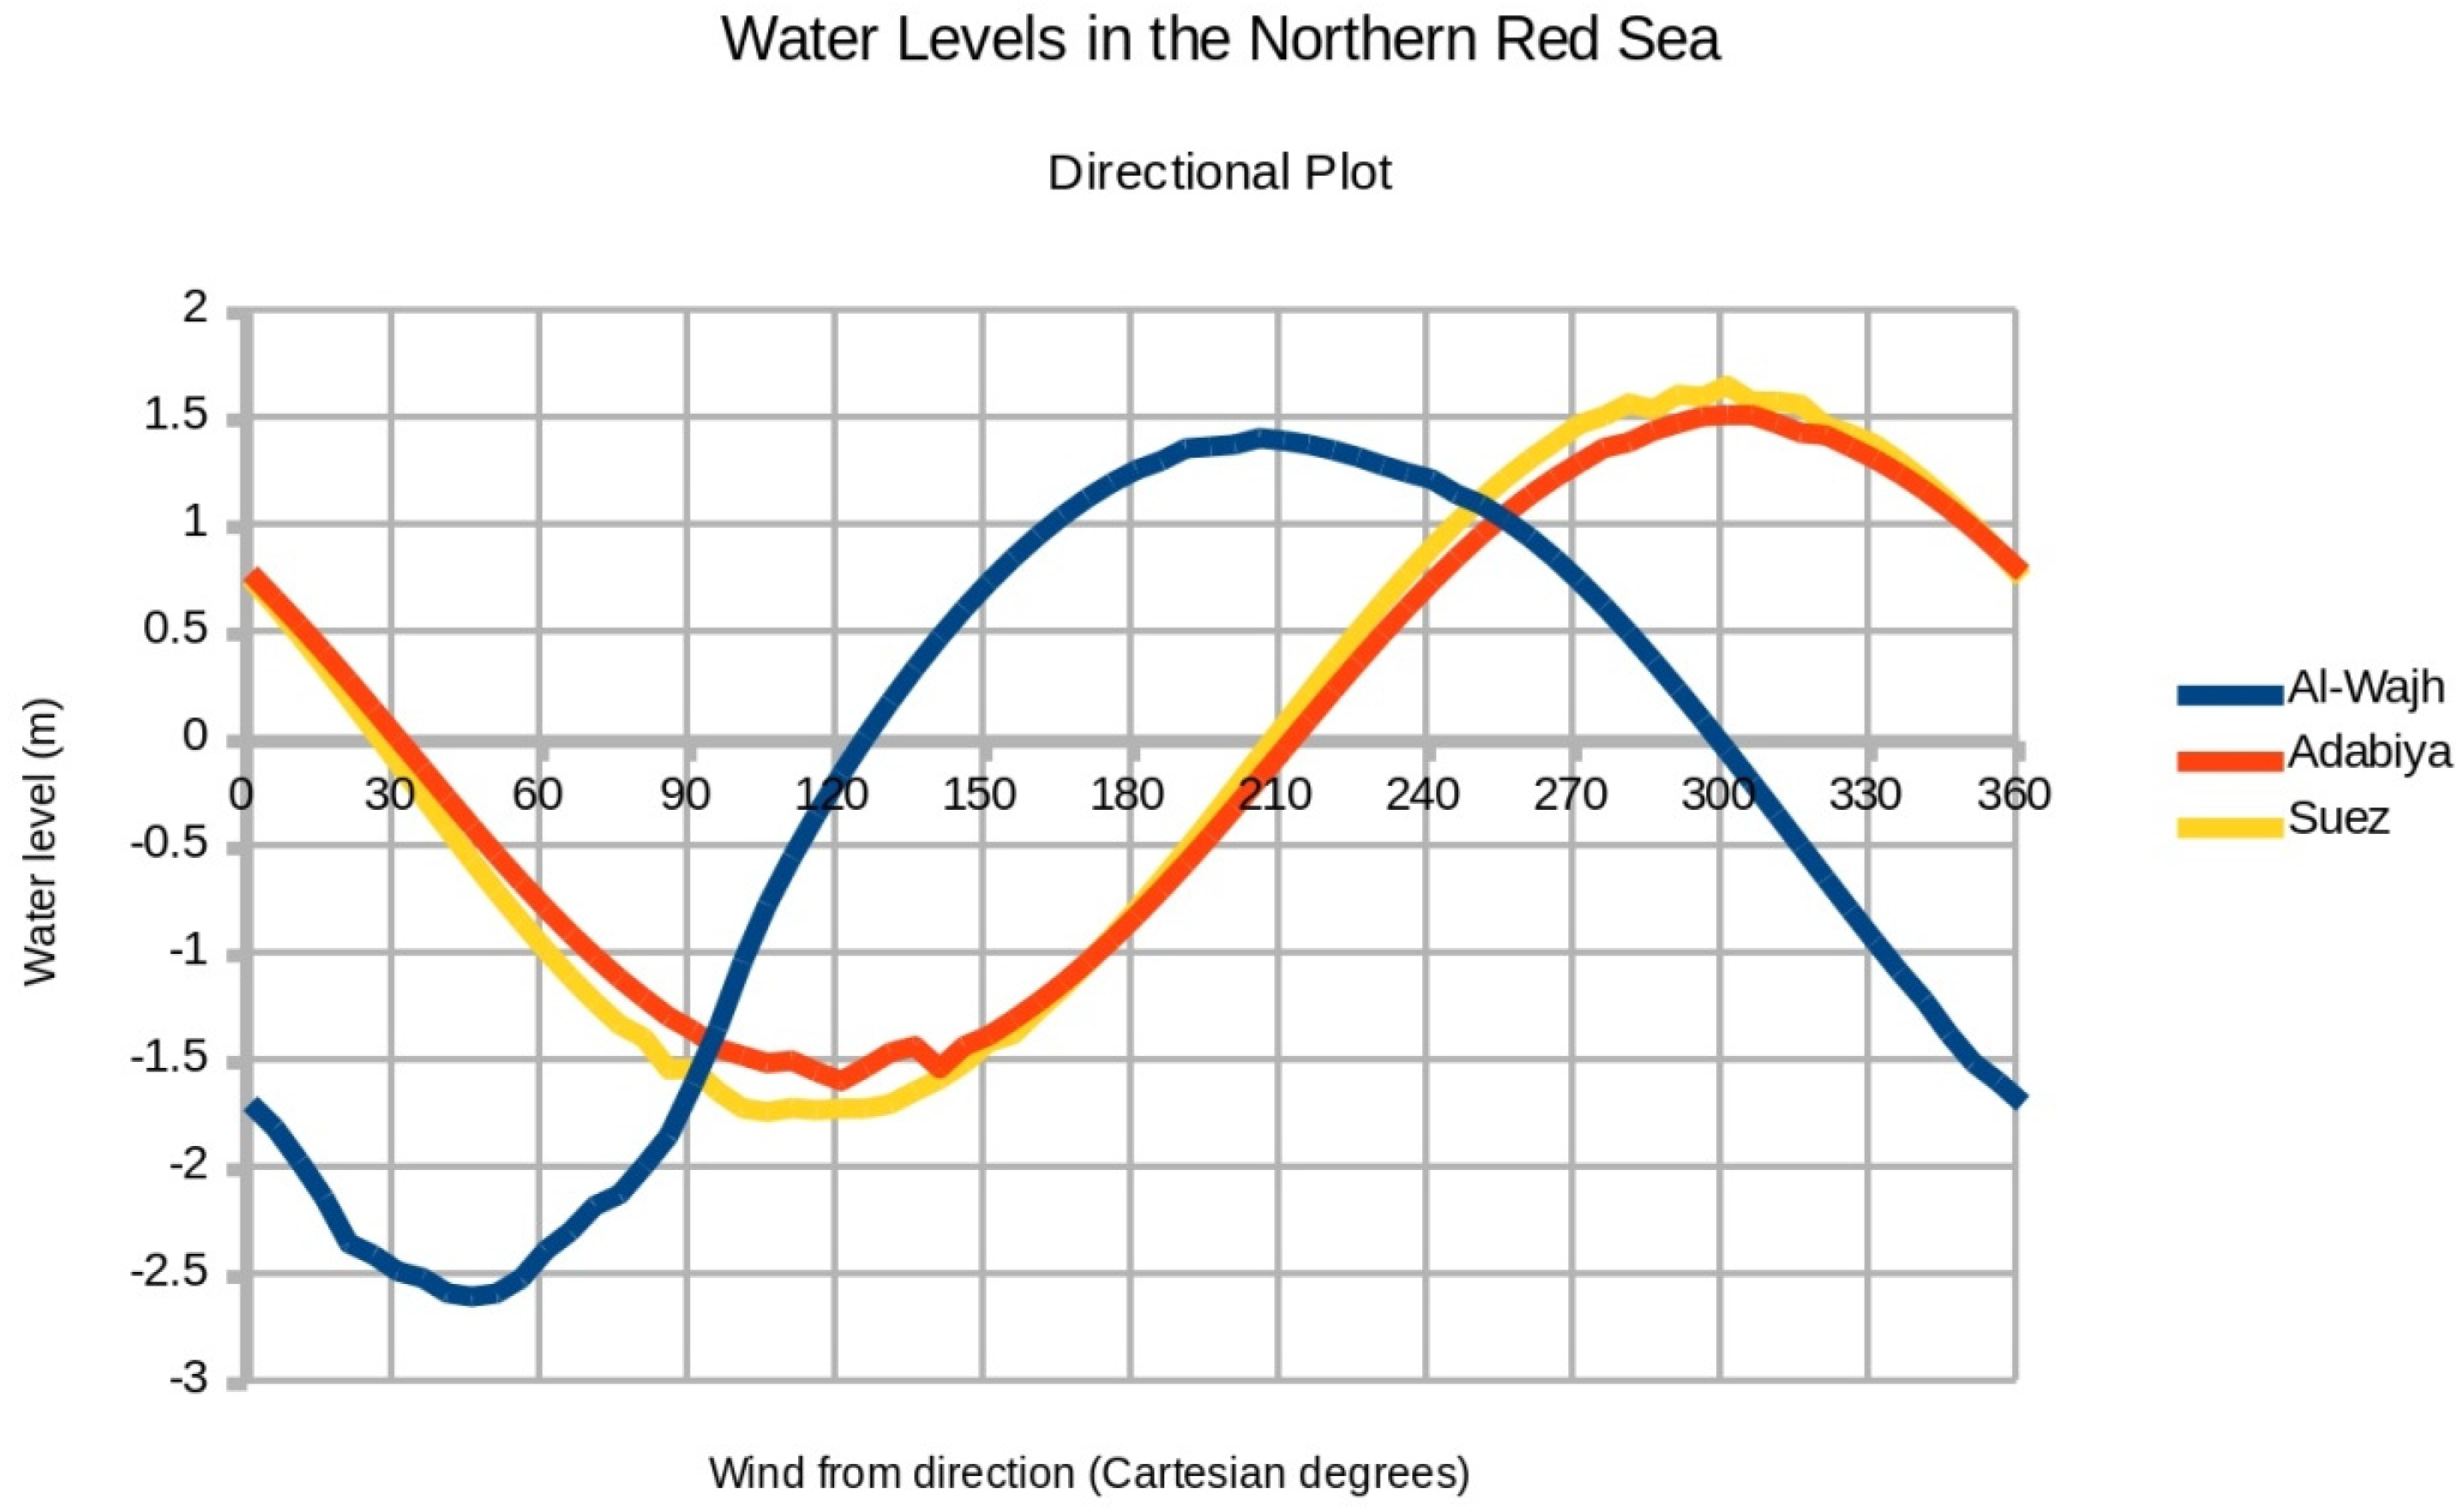
Figure 7 displays the results of experiment RS8 for Suez, Adabiya, and Al-Wajh. The lowest water levels reached are 1.72 m below sea level for Suez, 1.57 m below sea level for Adabiya, and 2.58 m below sea level for Al-Wajh.
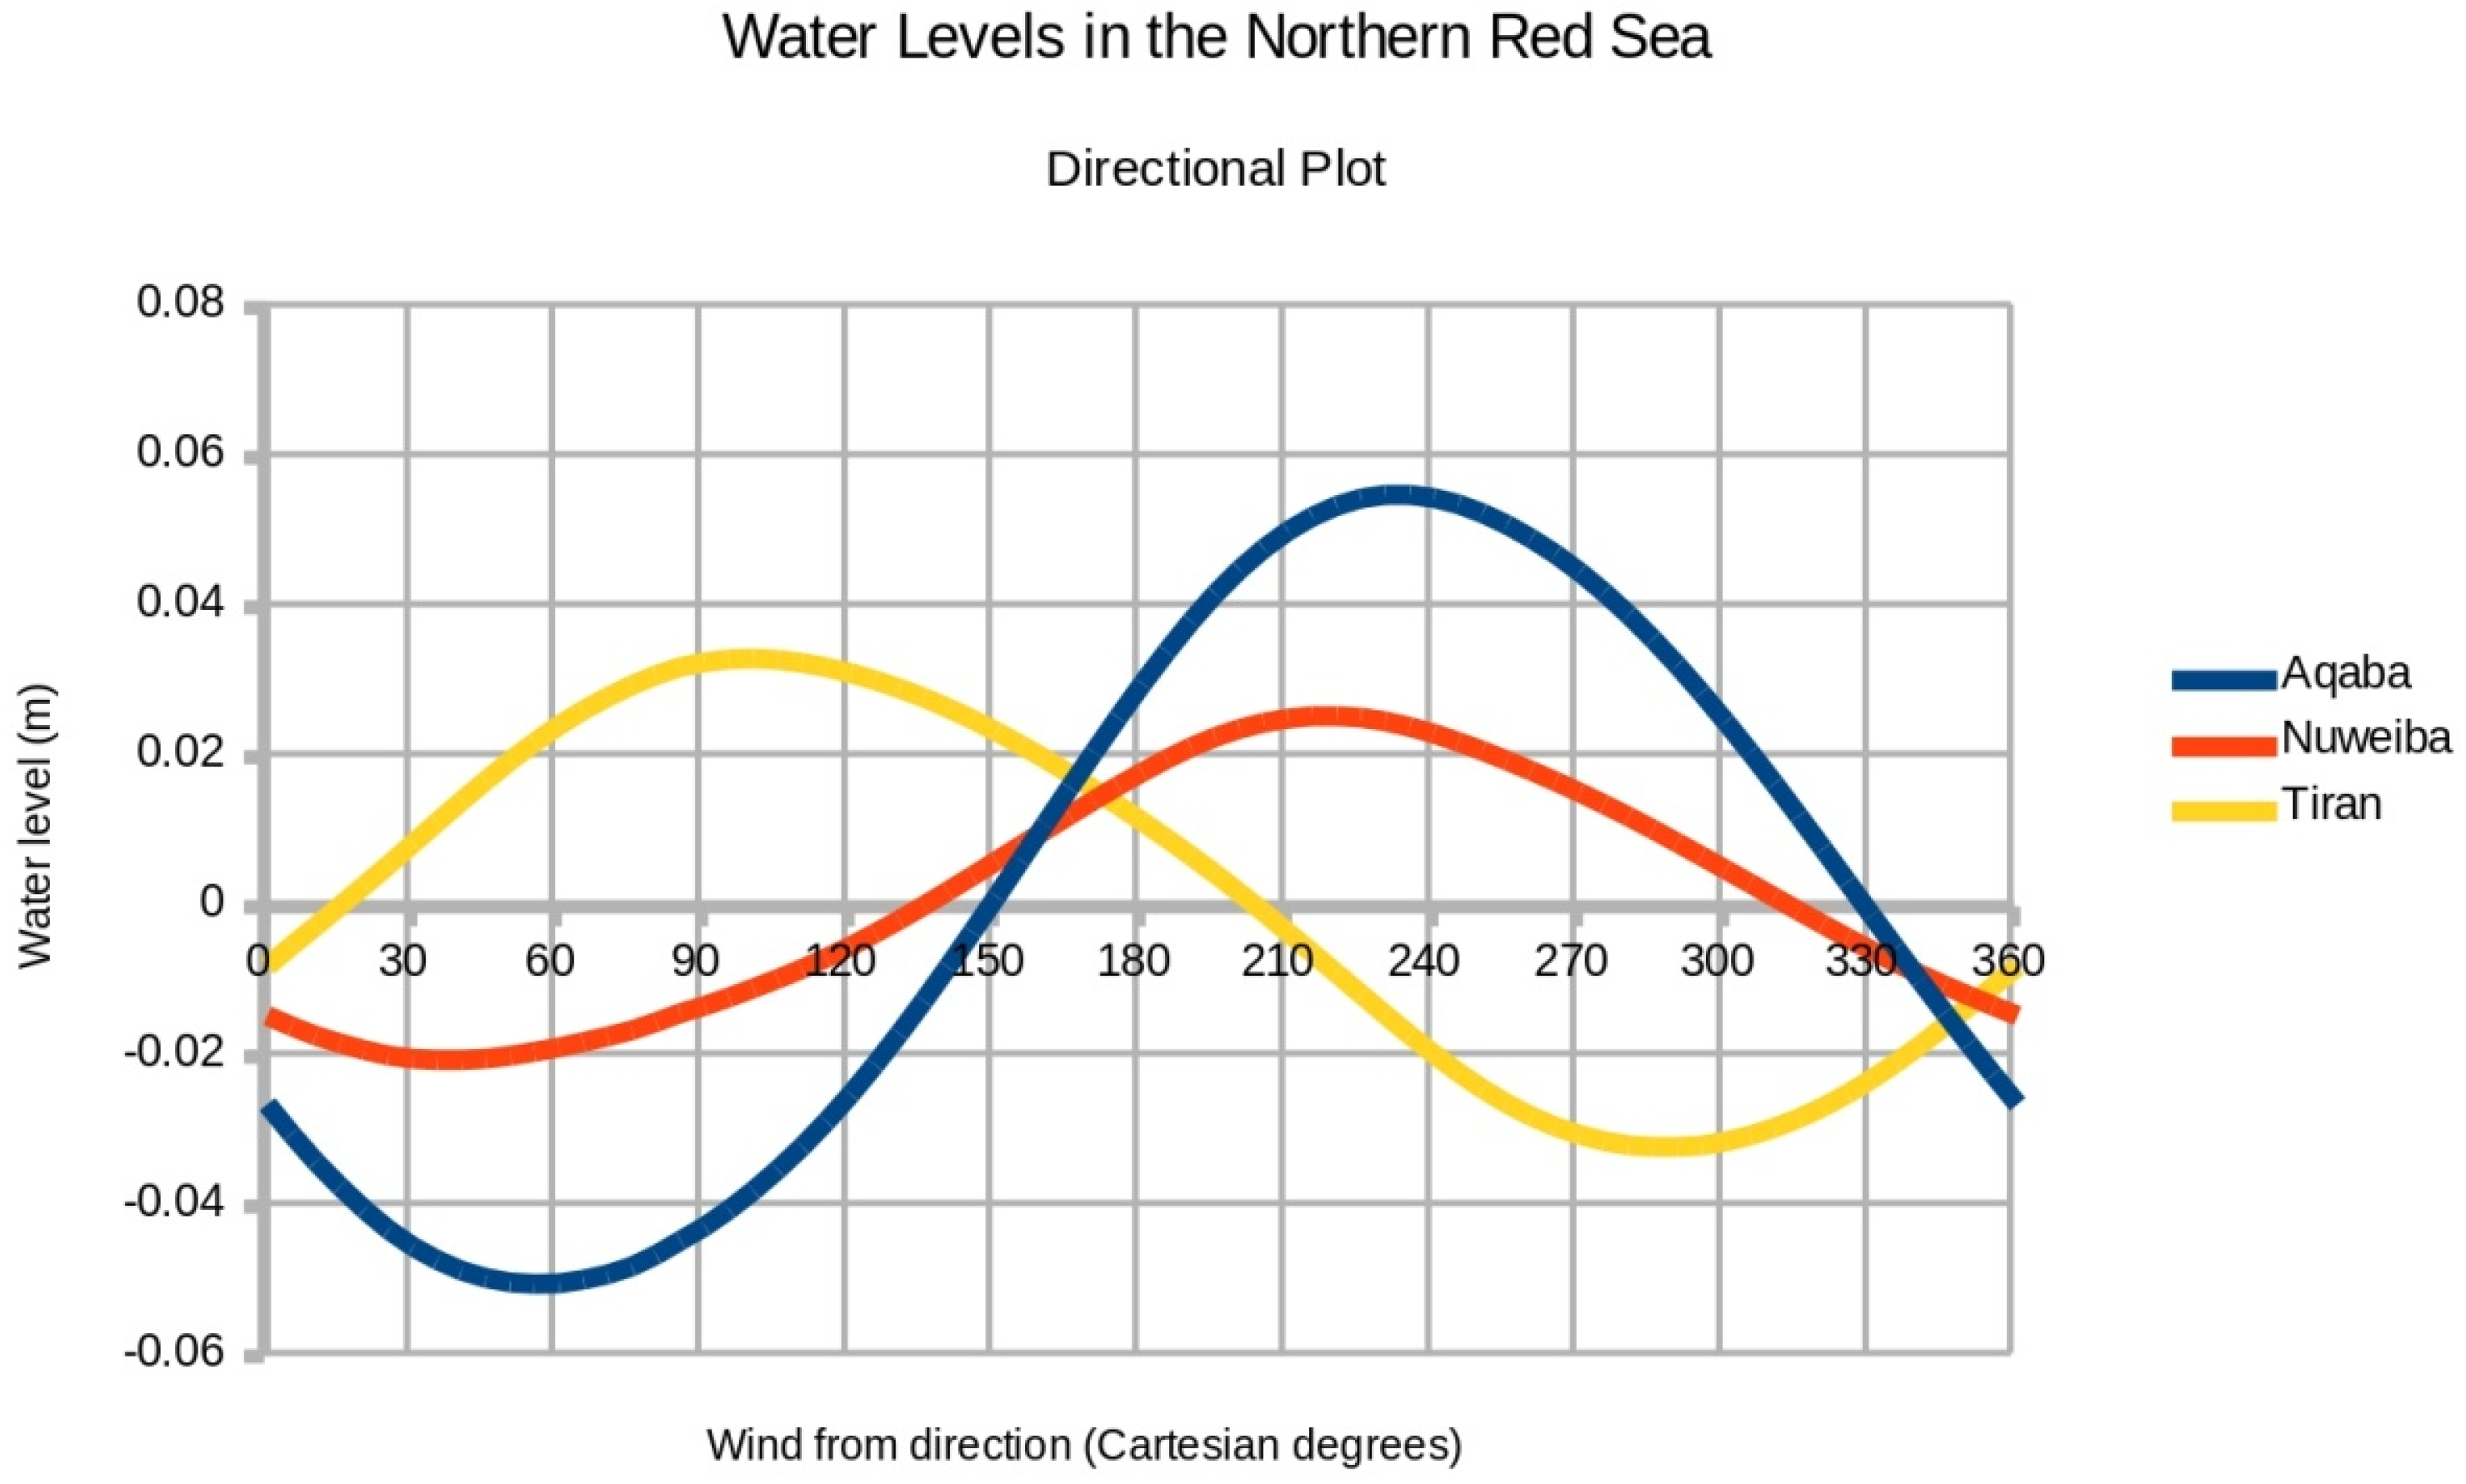
Figure 8 displays the results of RS8 for Aqaba, Nuweiba, and the Straits of Tiran; the vertical scale is different because the changes in water level are so much smaller in the Gulf of Aqaba. The lowest water levels reached are 0.050 m below sea level for Aqaba, 0.020 m below sea level for Nuweiba, and 0.032 m below sea level for Tiran.
Table 3 lists the simulation experiments performed for the Red Sea and the Adriatic Sea.
Figure 7.
Directional plot for Suez, Adabiya, and Al-Wajh. Cartesian degrees are: 0° and 360° = east; 90° = north; 180° = west; 270° = south.
Figure 7.
Directional plot for Suez, Adabiya, and Al-Wajh. Cartesian degrees are: 0° and 360° = east; 90° = north; 180° = west; 270° = south.
Figure 8.
Directional plot for Aqaba, Nuweiba, and Tiran.
Figure 8.
Directional plot for Aqaba, Nuweiba, and Tiran.
Table 3.
Simulation experiments performed.
Table 3.
Simulation experiments performed.
| Number | Domain | Purpose |
|---|
| RS8 | Red Sea | Directional analysis |
| RS9 | Red Sea | Shallow Red Sea proper |
| RS10 | Red Sea | Shallow Gulf of Aqaba |
| RS11 | Red Sea | Domain extended southward |
| A2 | Adriatic | Directional analysis |
The Suez Canal Authority is responsible for the safe navigation of ships that transit the canal. The extreme tidal range is 0.65 m in the north at Port Said, and 1.9 m in the south at Suez (peak-to-peak) [
7]. Strong and sustained winds blowing from the southeast or northwest would approximately add to these tides. Using 1.7 m as the maximum change in water level for storm surge and wind setdown (
Figure 7), the water level at Suez could drop to 2.65 m below mean sea level when setdown coincides with an extreme low tide. Suezmax deep-draft vessels should be made aware of such conditions. Both surge and setdown would cause unusually strong currents within the canal when they coincide with extreme tides.
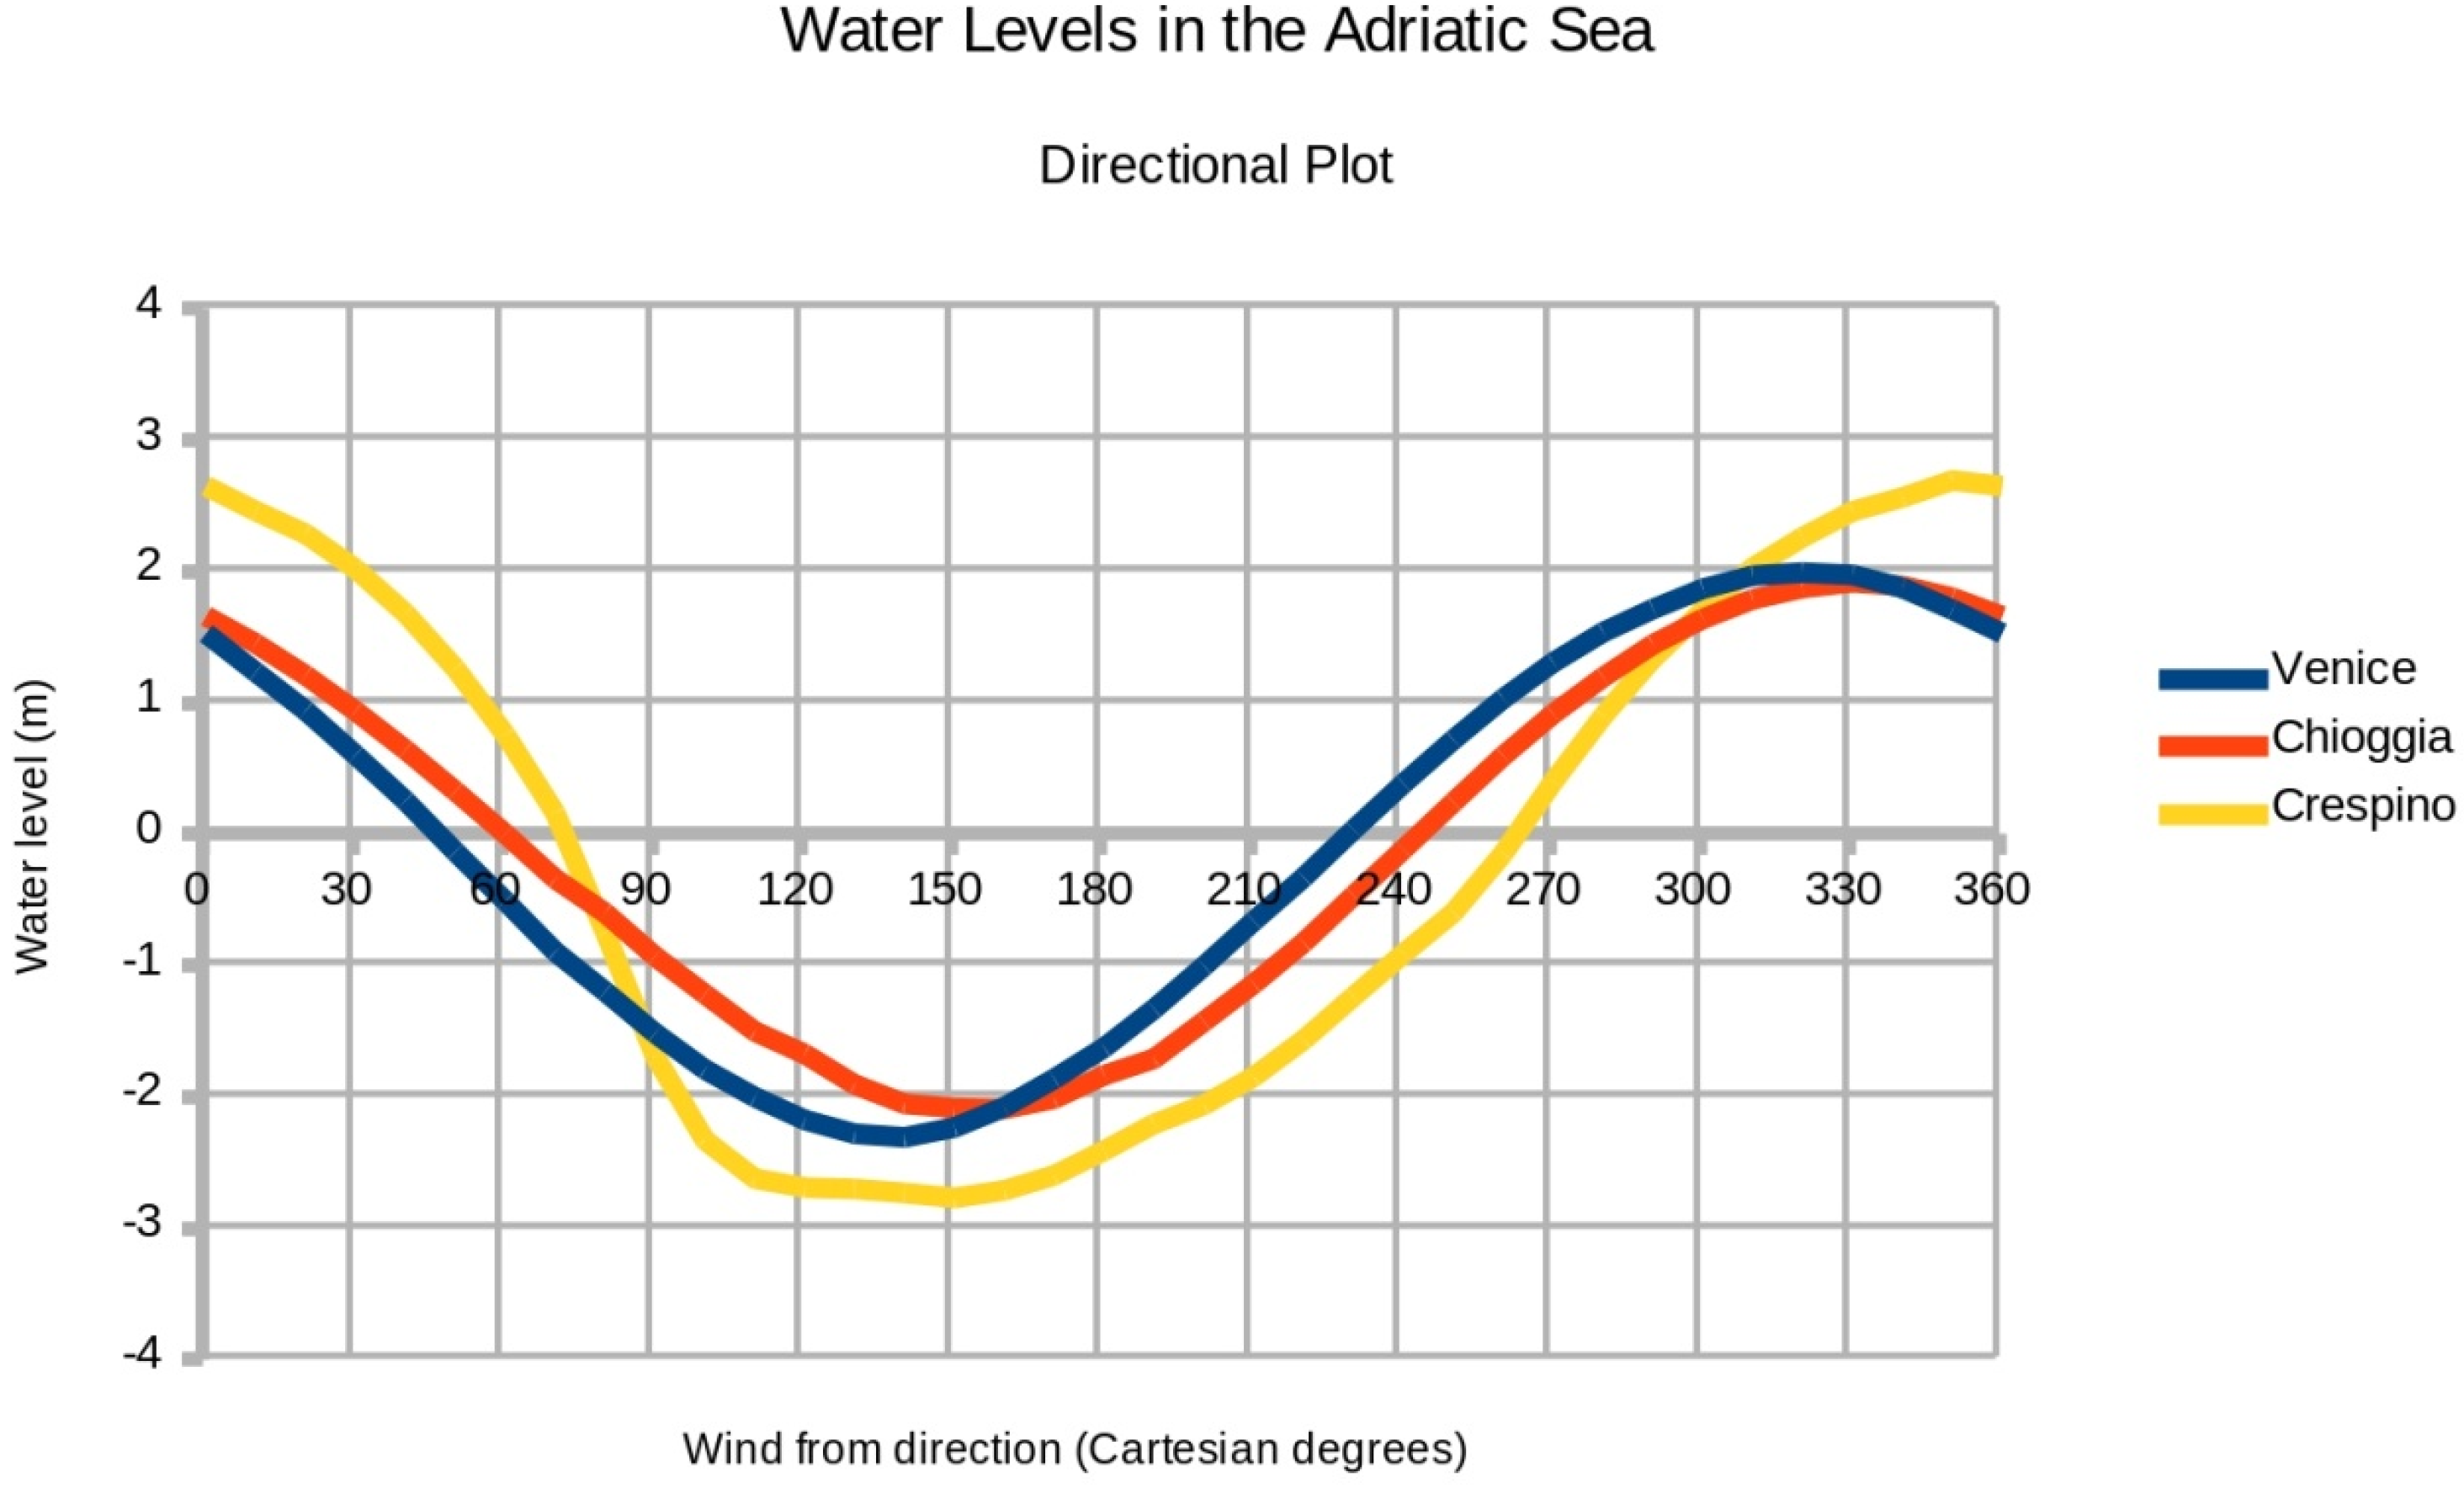
Figure 9 shows water levels in the Adriatic Sea when wind blows from the southeast. Storm surge at Venice reaches its maximum height of 2.02 m when wind is blowing from the southeast (from 320° Cartesian). The maximum wind setdown of 2.28 m below sea occurs at Venice when wind is blowing from the northwest (from 140° Cartesian). Wind setdown is slightly greater in magnitude than storm surge because shallow waters are more affected by wind stress.
Figure 9.
Adriatic surge height with wind from southeast (320° Cartesian).
Figure 9.
Adriatic surge height with wind from southeast (320° Cartesian).
The highest water level recorded in Venice occurred on November 4, 1966; the Adriatic Sea rose to 1.94 m above mean sea level [
8]. The maximum surge height of 2.02 m calculated by the directional analysis exceeded this observed maximum by 4%, demonstrating that these model results are realistic simulations of extreme surge events at Venice.
Figure 10 and
Figure 11 display the results of experiment A2 for ports on the Adriatic Sea;
Figure 10 shows the directional analysis for Venice, Chioggia, and Crespino. Crespino is a village on the Po River 52 km inland from the river’s mouth. The ocean model and SRTM30 data calculate extensive inland flooding of the Po coastal plain when wind blows from the southeast. The curve for Crespino is flattened on the bottom because water takes longer to drain out the Po river channel than to drain from the Venetian lagoon.
The maximum surge at Venice, and therefore the maximum vulnerability of the city to flooding, occurs when the wind blows from the southeast at 320° Cartesian. Surge height remains over 90% of the peak value for wind directions between 300° and 340°, or within ±20° of the “optimum” wind direction (
Figure 10). Venice is vulnerable to storm surge driven by winds blowing from directions substantially different than the theoretical optimum of 320°.
Figure 10.
Directional plot for Venice, Chioggia, and Crespino.
Figure 10.
Directional plot for Venice, Chioggia, and Crespino.
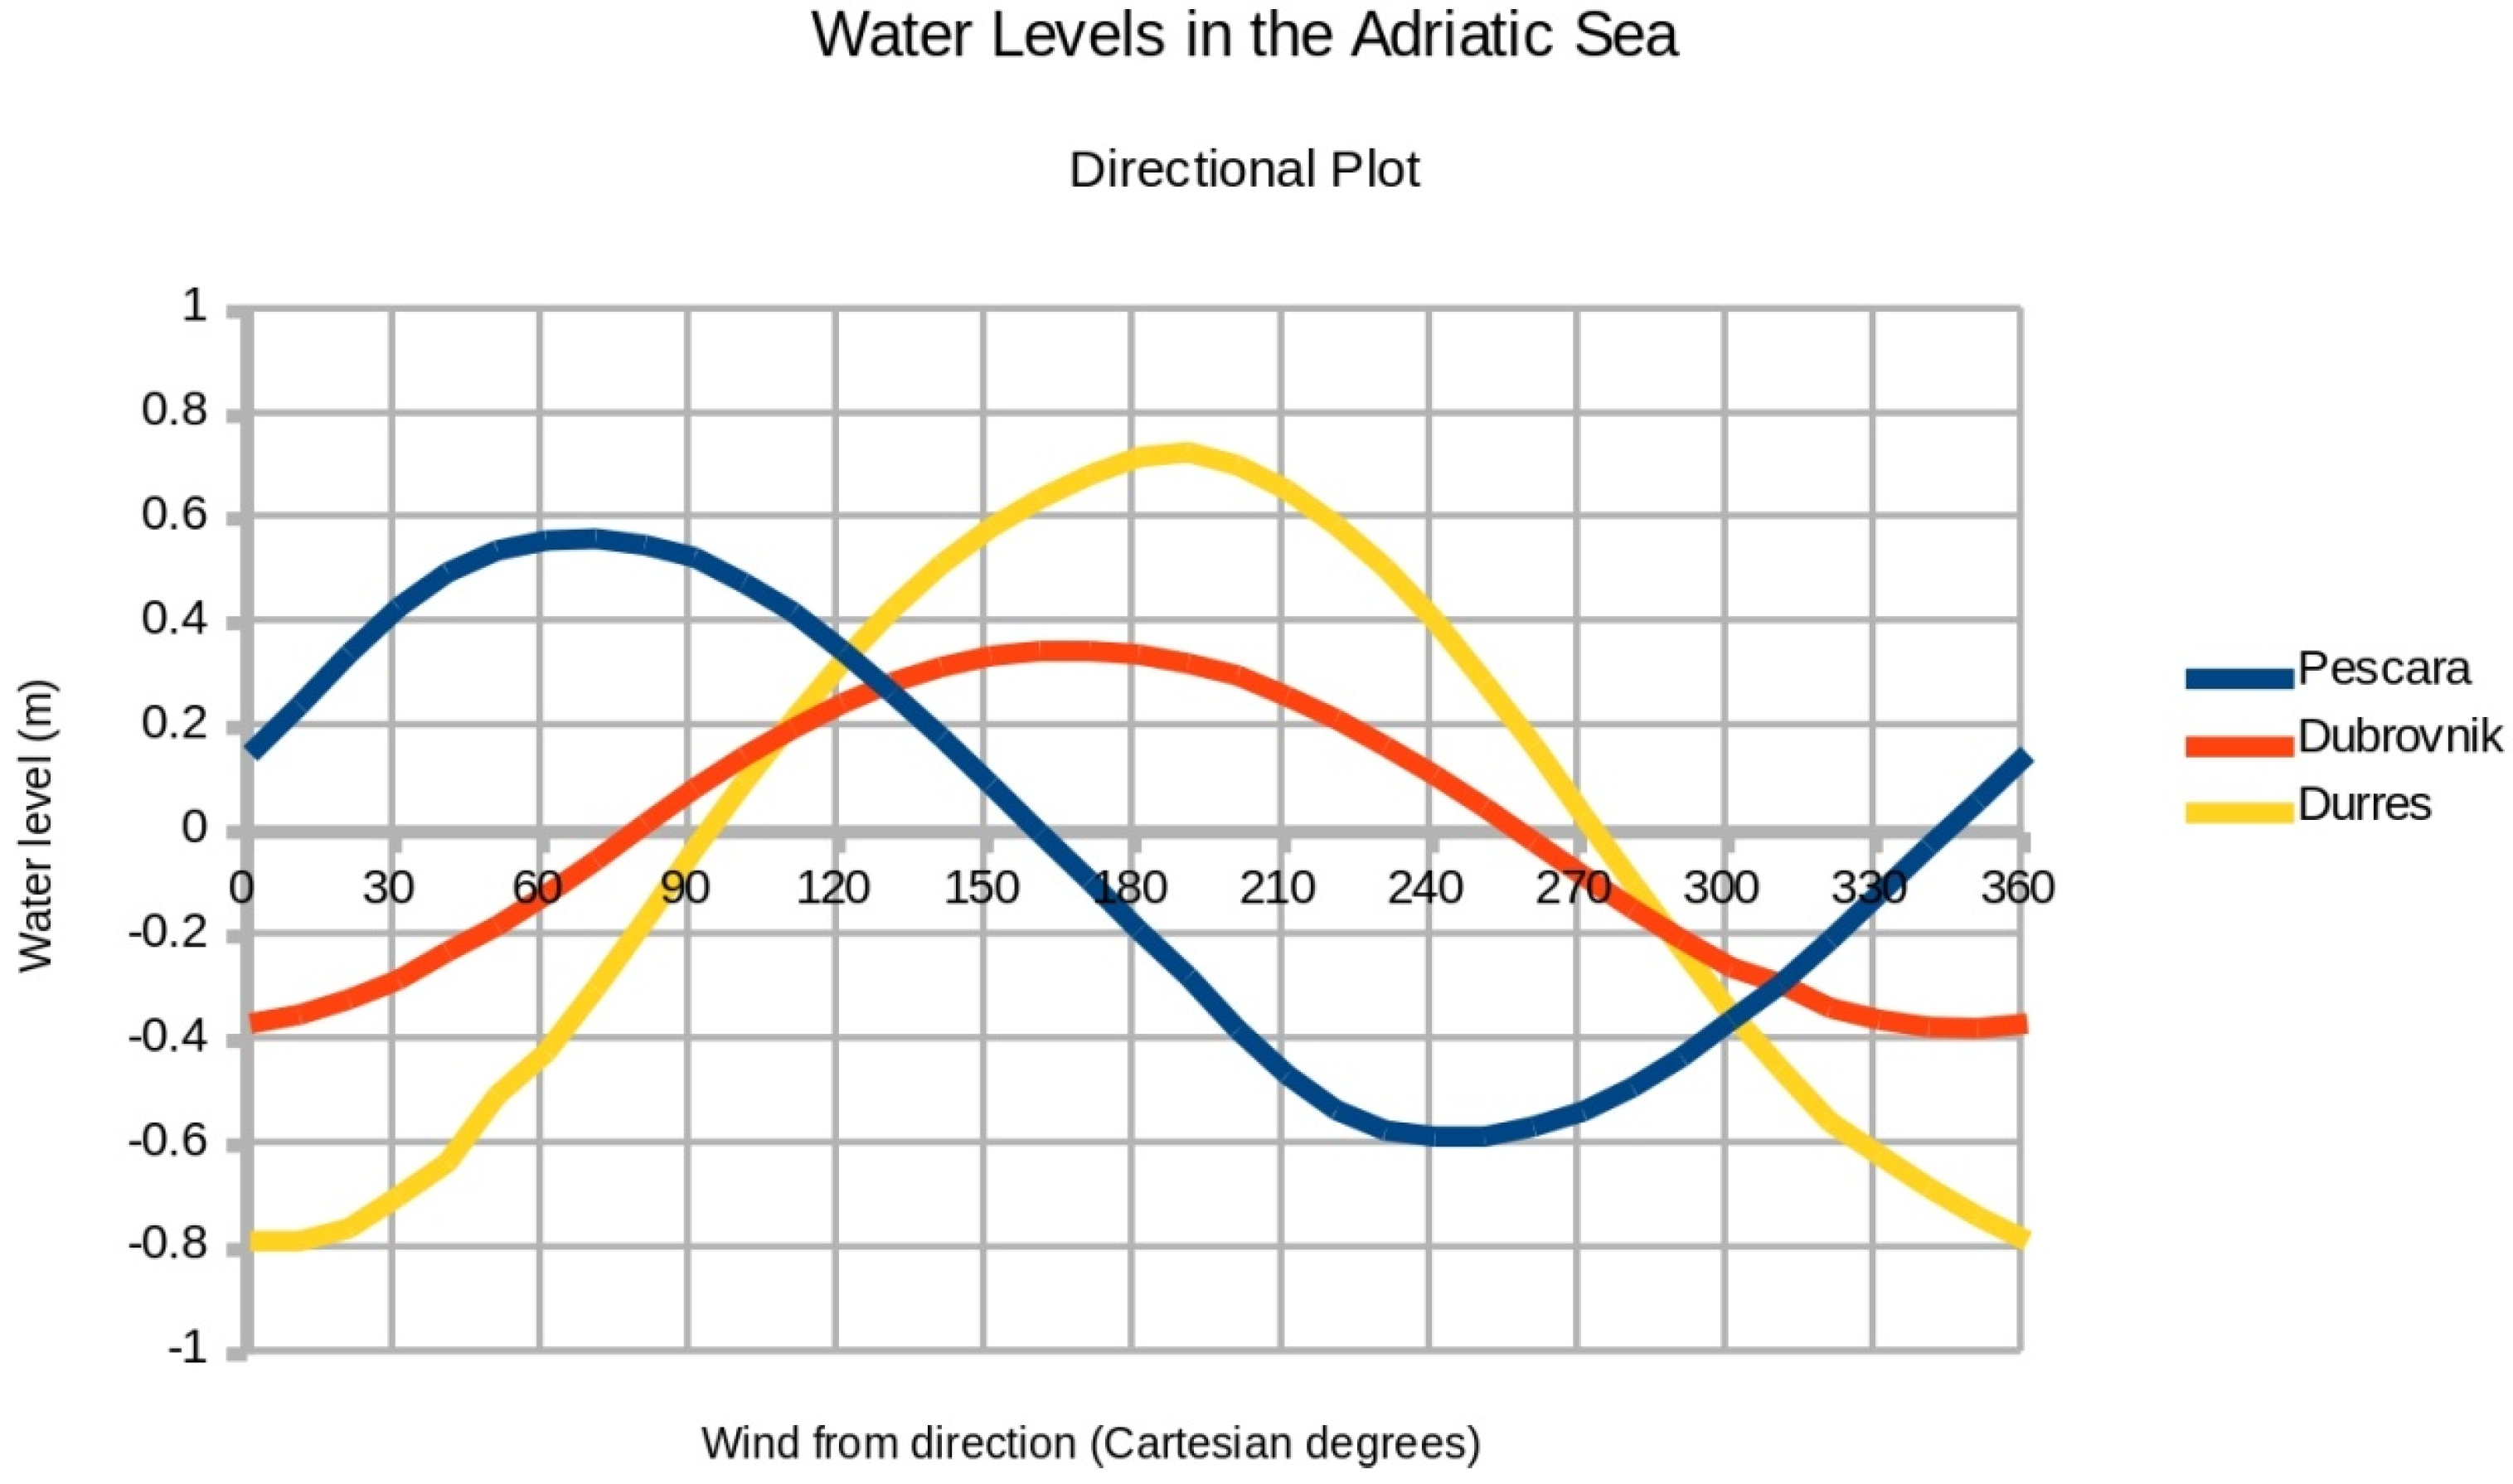
Figure 11 shows the results of the directional analysis for Pescara (Italy), Dubrovnik (Croatia), and Durres (Albania). Pescara was chosen as an exposed port city along a straight coastline; it serves as a comparison for the sheltered location of Venice. Water levels range from −0.58 to 0.57 m at Pescara, from −0.37 to 0.36 m at Dubrovnik, and from −0.78 to 0.74 m at Durres.
Figure 11.
Directional plot for Pescara, Dubrovnik, and Durres.
Figure 11.
Directional plot for Pescara, Dubrovnik, and Durres.
Plots of the directional analysis reveal an interesting result: There is no significant narrowing of the peak for port cities at the end of a long inlet. The plotted curves of water level as a function of wind angle are all sinusoidal. There is no qualitative difference between protected coastal sites and the exposed sites. Storm surge at Suez is affected by wind direction in the same way as storm surge at Pescara.
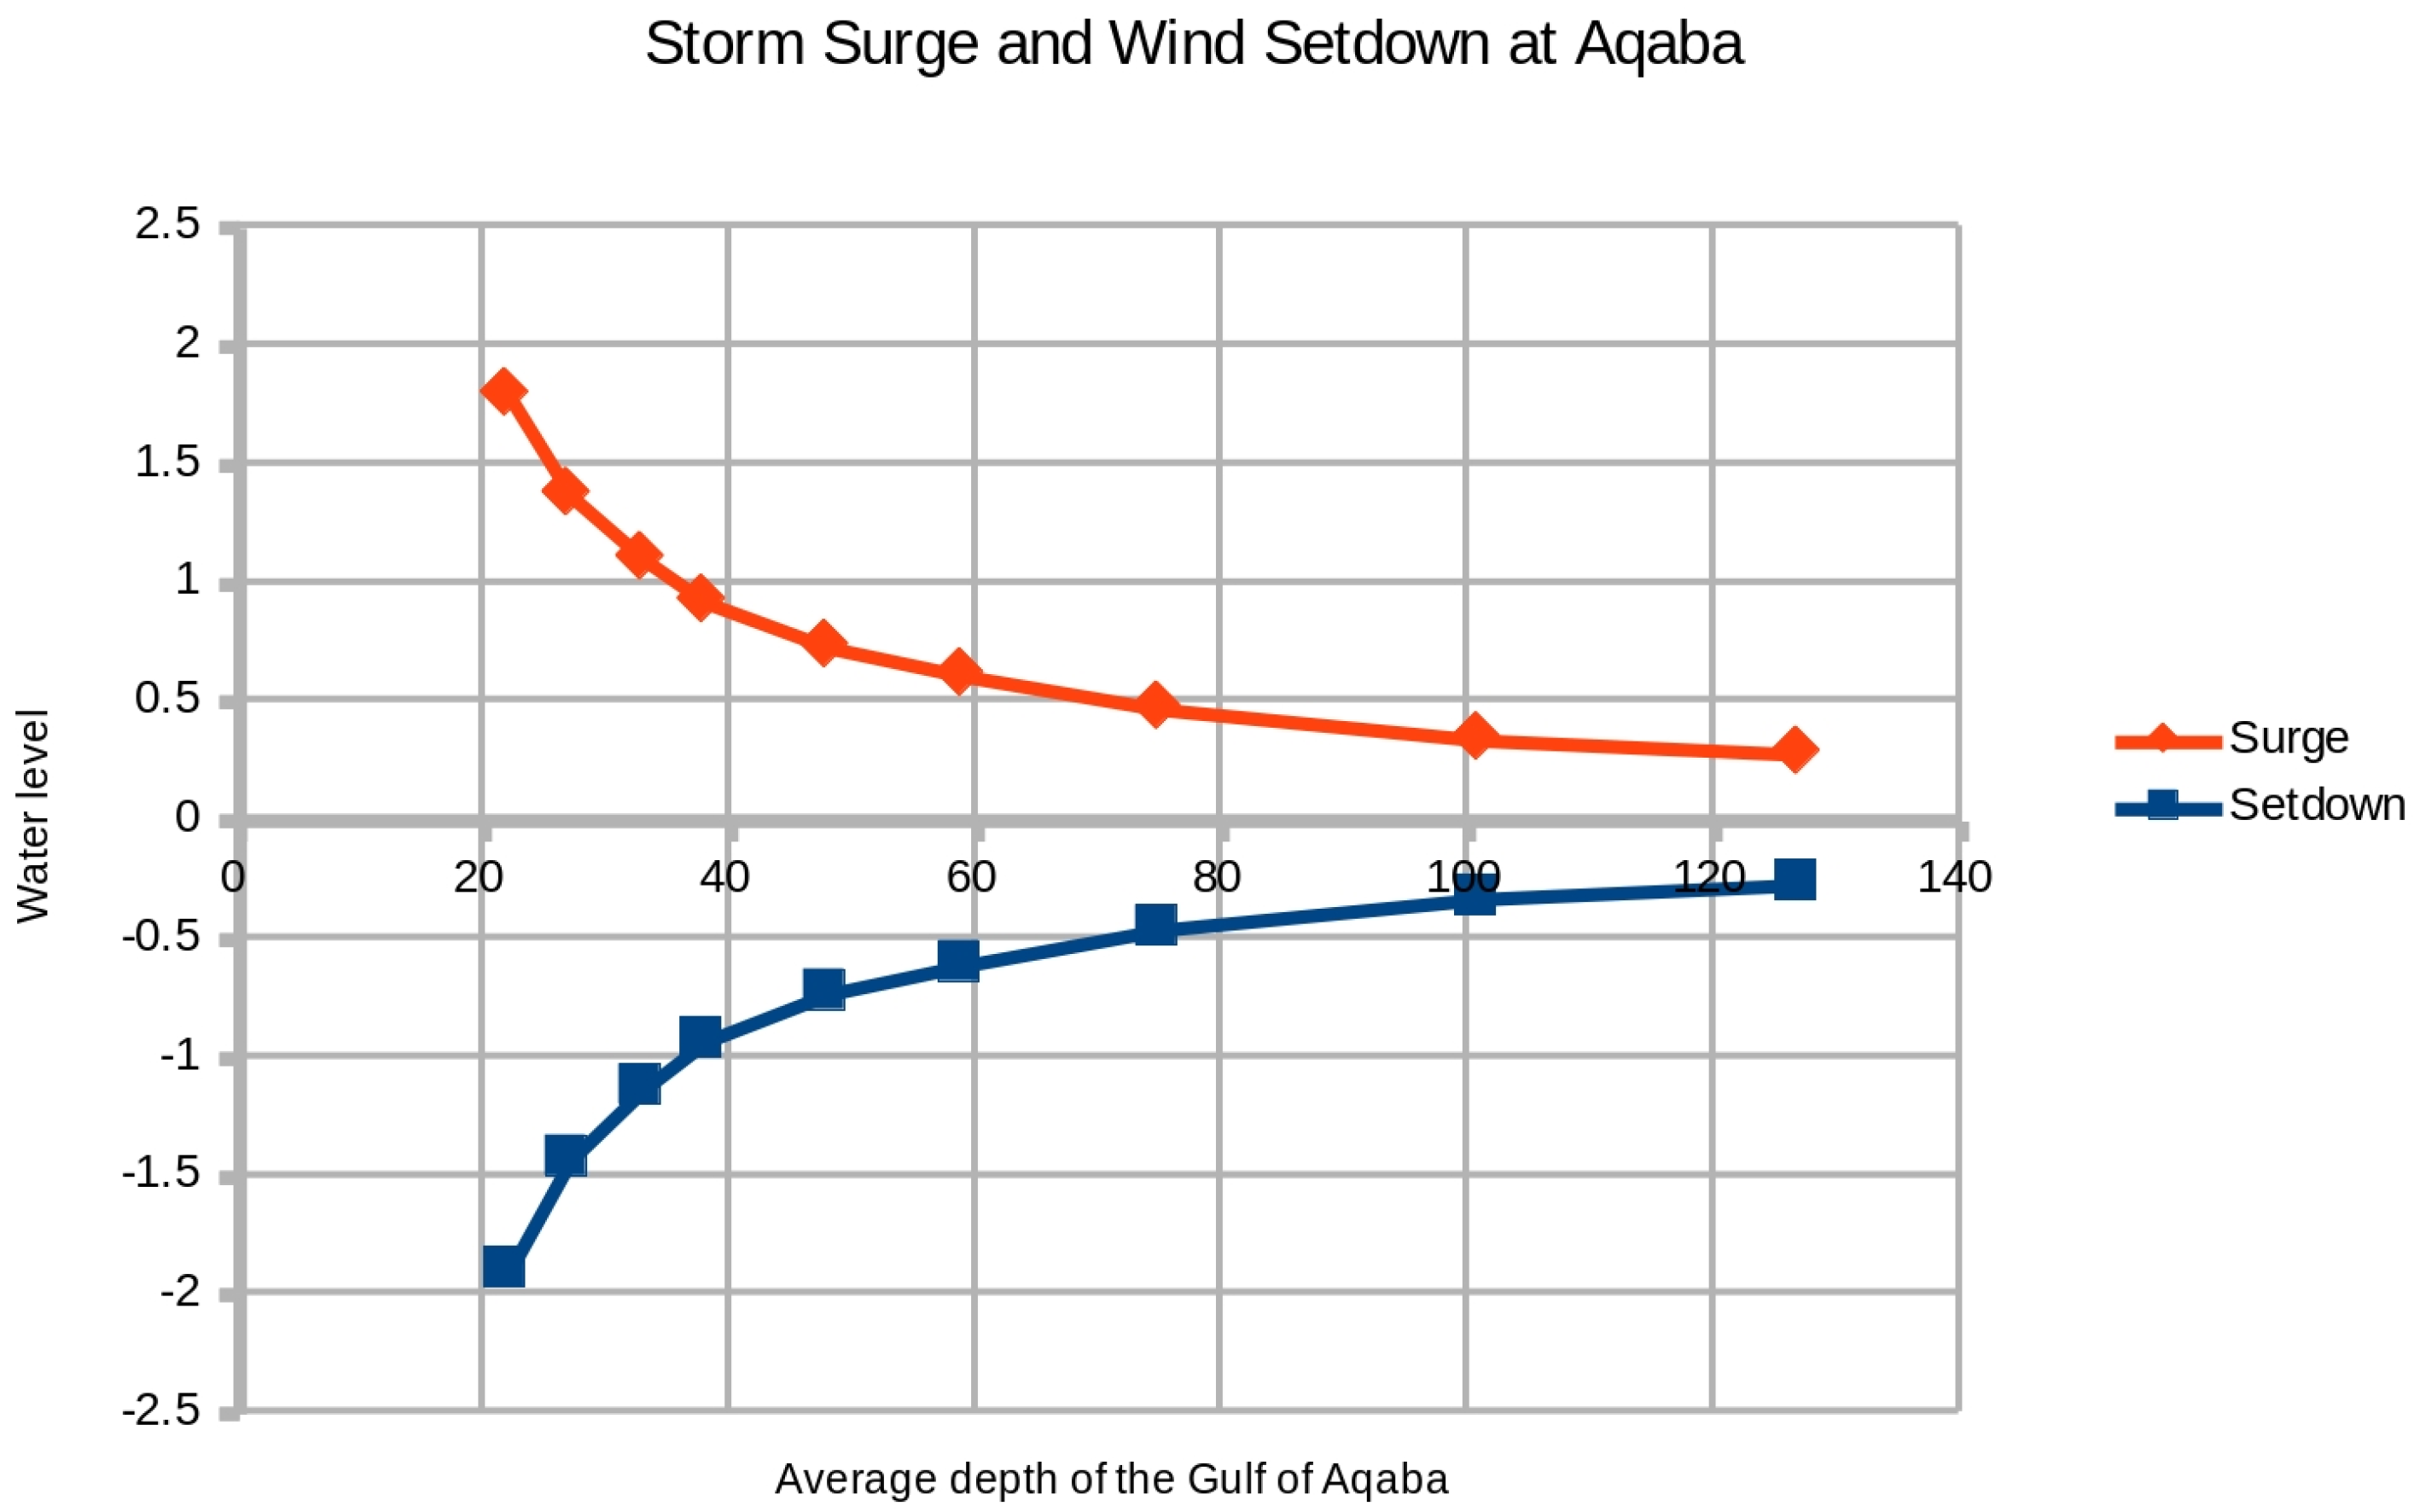
Why are surge heights so much smaller for the Gulf of Aqaba than for the Gulf of Suez? Part of the reason is that the Red Sea proper is aligned with the Gulf of Suez, and therefore water levels in the Red Sea tend to enhance the surge at Suez and diminish the surge at Aqaba. But the dominant reason is that the bathymetry of Aqaba is too deep to generate significant storm surge or wind setdown. Experiment RS10 tests this hypothesis by reducing the depth of the Gulf of Aqaba by 95%, making it comparable to the Gulf of Suez. The average depth becomes 48 m. When the bathymetry northeast of Tiran is modified in this manner, the water levels vary from −0.73 m to 0.73 m at Aqaba, from −0.42 to 0.42 at Nuweiba, and from −0.025 to 0.031 at the Straits of Tiran. Shallow water surges more.
Figure 12 shows the values of surge height and wind setdown that result from a range of shallow depths for the Gulf of Aqaba. Wind setdown is comparable in magnitude to storm surge.
Figure 12.
Storm surge and wind setdown at Aqaba when the Gulf of Aqaba is made shallow.
Figure 12.
Storm surge and wind setdown at Aqaba when the Gulf of Aqaba is made shallow.
To further illustrate the effect of water depth on storm surge, experiment RS9 reduced the depth of the Red Sea proper (south of Sinai) and measured the resulting water levels at Adabiya for wind angles of 120° and 300° (Cartesian). Storm surge at Adabiya rose to 1.95 m above sea level, and wind setdown dropped to 2.01 m below sea level. Thus the water displacement for a shallow Red Sea proper increased by 27% and 28%, respectively.
3. Materials and Methods
COAWST is configured to run in its two-dimensional mode, without coupling to WRF or SWAN. The air-to-sea drag coefficient is described by Oey
et al. [
9] To compensate for 2-D mode and the lack of waves, the calculated wind stress is multiplied by the same factor of 1.63 used in previous studies for Lake Erie [
5] and the Atlantic coast of the United States [
6]. The quadratic bottom drag coefficient (RDRG2) for ROMS is 1.0 × 10
−3. The ocean model does not include tides. The critical depth for wetting and drying is 0.5 m, and the time step is 2.0 s. Any open domain boundaries that are not land surface are no-slip walls.
The Shuttle Radar Topography Mission supplied bathymetry and topography at a grid resolution of 30 arc-seconds (SRTM30) [
10]. Grid cells for the Red Sea domain are about 900 m wide, and 800 m wide for the Adriatic Sea.
The wind speed ramps up from 0 to 28 m/s over a period of 24 h. This ramp-up time is necessary to avoid seiche oscillations within the enclosed seas. 28 m/s approximates a medium-strength tropical storm on the Saffir-Simpson scale of hurricane winds. Sea level measurements are recorded at the end of 24 h. The wind field for each test case is uniform in speed and direction across the entire domain. The wind direction rotates around the compass in increments of 10°, producing 36 test cases for each full experiment in the directional analysis.
Table 3 lists all the model experiments. The Gulf of Aqaba and the Red Sea proper were reduced in depth for experiments RS10 and RS9, respectively. Bathymetry deeper than the 25 m isobath was reduced by 95% according to the following transformation:
Underwater values in Equation (1) are positive. This transformation makes the Gulf of Aqaba and the Red Sea proper comparable in depth to the Gulf of Suez, while retaining some of the bottom roughness. Experiment RS10 replaces the fraction 0.05 in Equation (1) with a range of values from 0.00 to 0.20 (see
Figure 12).


