Article

Transcriptome Survey of a Marine Food Fish: Asian Seabass (Lates calcarifer)

1
Reproductive Genomics Group, Strategic Research Program, Temasek Life Sciences Laboratory, Singapore 117604, Singapore
2
Agri-Food and Veterinary Authority of Singapore, Singapore 608550, Singapore
3
Donnelly Centre for Cellular and Biomolecular Research, University of Toronto, Toronto, ON M5S 3E1, Canada
4
The Centre for Applied Genomics, The Hospital for Sick Children, Peter Gilgan Centre for Research and Learning, Toronto, ON M5G 0A4, Canada
5
Centre for Comparative Genomics, Murdoch University, Murdoch 6150, Australia
6
Department of Animal Sciences and Animal Husbandry, Georgikon Faculty, University of Pannonia, Keszthely H-8360, Hungary
*
Authors to whom correspondence should be addressed.
These authors contributed equally to this work.
J. Mar. Sci. Eng. 2015, 3(2), 382-400; https://doi.org/10.3390/jmse3020382
Submission received: 12 May 2015 / Accepted: 22 May 2015 / Published: 2 June 2015
(This article belongs to the Special Issue Genetic Breeding Technology and Its Application in Marine Aquaculture)

Abstract

:
The Asian seabass (or barramundi; Lates calcarifer) is a marine teleost and a popular food fish in Southeast Asia and Australia. To date, comprehensive genome and transcriptome sequence information has not been available for this species in public repositories. Here, we report a comprehensive de novo transcriptome assembly of the Asian seabass. These data will be useful for the development of molecular tools for use in aquaculture of Asian seabass as well as a resource for genome annotation. The transcriptome was obtained from sequences generated from organs of multiple individuals using three different next-generation sequencing platforms (454-FLX Titanium, SOLiD 3+, and paired-end Illumina HiSeq 2000). The assembled transcriptome contains >80% of the expected protein-coding loci, with 58% of these represented by a predicted full-length cDNA sequence when compared to the available Nile tilapia RefSeq dataset. Detailed descriptions of the various steps involved in sequencing and assembling a transcriptome are provided to serve as a helpful guide for transcriptome projects involving de novo assembly of short sequence reads for non-model teleosts or any species of interest.

1. Introduction

The Asian seabass (or barramundi; Lates calcarifer) is a marine teleost from the Latidae family. Apart from being a popular food fish in the Australian and Southeast Asian region [1], the species has several characteristics that make it interesting for scientific research, namely: (i) it is able to adapt and survive in a range of salinities [2]; (ii) it is catadromous, born in brackish water, moving to fresh water to spend the juvenile stages there and migrating back downstream to brackish water or seawater to breed [2]; and (iii) it is a protandrous sequential hermaphrodite, changing sex from male to female between the ages of 3 and 8 years [3,4].
For more than a decade, our group has been involved in the breeding and selection program for the Asian seabass. One particular focus has been studying the genetic information encoded by the protein-coding loci, which is vital for the development of molecular tools required for gene expression studies and genome annotation. The genome of the Asian seabass is estimated to be ~700 Mb and is currently being assembled and annotated [5], while the mitochondrial genome has previously been completely sequenced [6]. Transcriptome information for the Asian seabass to date is mainly represented by ~22,000 EST sequences in GenBank along with a limited number of organ-specific transcriptome studies and repetitive sequence analyses [7,8,9].
Comprehensive sequence characterization of the transcriptome is an essential first step to identify protein-coding/regulatory regions of the genome and the development of tools for gene expression studies. To this end, next-generation sequencing (NGS) technologies have enabled researchers to generate vast amounts of sequence data at ever-decreasing costs. However, there are several confounding variables pertaining to sample preparation and library construction that need to be optimized before sequencing is performed. Moreover, subsequent bioinformatic analyses following the data generation phase may pose a challenge for many small laboratories lacking expertise and/or computational resources.
Here, we describe the multi-platform sequencing and de novo assembly of the Asian seabass transcriptome. A multi-tiered approach was used wherein over one billion reads from three NGS sequencing platforms were assembled in a step-wise manner. The assembled transcriptome was represented by more than 200 thousand contigs, about half of which could be subsequently annotated using BLAST searches. In addition to analyses of pathways and identification of organ-specific transcripts, the transcriptome was also inventoried for microsatellite sequences. Limited sequence information is available thus far for the Asian seabass. The present report will serve as a useful resource for future studies on this species, since it provides information on the expressed regions of the genome. In addition, we have also summarized our observations from comparing the various intermediate assemblies, to serve as useful indicators for small non-genomics laboratories embarking on sequencing and assembling a transcriptome.
Our publication adds to the growing number of NGS-based transcriptome studies on the Asian seabass [7,8,9], and that of other food fishes such as Atlantic salmon (Salmo salar [10]), common carp (Cyprinus carpio [11]), European seabass (Dicentrarchus labrax [12,13]), rainbow trout (Oncorhynchus mykiss [14]), turbot (Scophthalmus maximus [15]), and striped bass (Morone saxatilis [16]).

2. Experimental Section

2.1. Sample and Library Preparation, Sequencing and Quality Control

At the start of the project, transcriptome information was first generated using the 454-FLX Titanium (Roche Diagnostics, Branford, CT, USA) and SOLiD 3+ (Life Technologies, Inc., Carlsbad, CA, USA) next-generation sequencing (NGS) platforms. Subsequently, the dataset was augmented by additional sequences in the form of pair-end reads generated on the Illumina HiSeq 2000 platform (Illumina Inc., San Diego, CA, USA) to provide sequence depth in order to improve the assembly. The 454 and SOLiD sequence data (incorporated and reassembled here) has been published and released previously [8]. The assembly from the initial round of Illumina HiSeq sequencing (HiSeq Round 1, HR1) was also utilized as part of a survey of repetitive elements in Asian seabass [7].
For the second round of Illumina HiSeq sequencing (HiSeq Round 2, HR2), total RNAs were extracted using the RNeasy Mini Kit (Qiagen, Hilden, Germany) from the following organs of multiple Asian seabass individuals: adult brain (male and female); transforming gonads; testis; ovary; spleen (vaccinated and unvaccinated); head kidney (vaccinated and unvaccinated); intestine (from fish fed with various feeds); liver (from fish fed with various feeds); brain (from fish fed with various feeds); and intestine (with probiotics treatment). Total RNAs were digested with DNase to remove trace levels of DNA contamination. mRNAs were enriched by depletion of the ribosomal RNAs. The resulting mRNA samples underwent strand-specific cDNA library synthesis [17] followed by ligation of an adaptor suitable for Illumina sequencing as well as incorporating a sample-specific barcode to mark the individual samples. Barcoded cDNA libraries were then pooled for efficient multiplex sequencing on the Illumina HiSeq 2000 platform to generate 2x100 bp paired-end reads of up to 700 bp well defined mate-pair distance (NCBI SRA BioProject Accession Number: SRP053272). Quality trimming and filtering was performed using fastq_quality_trimmer (with parameters: -t 25 -l 30) and fastq_quality_filter (with parameters: -q 20 -p 30) scripts available from FASTX-Toolkit (http://hannonlab.cshl.edu/fastx_toolkit/). For this dataset, an additional filtering step was also performed to remove perfect duplicate reads (100% identical sequences) that had count >100 times using PRINSEQ (with parameters: -min_len 30 -derep 1 -derep_min 101 -trim_tail_left 5 -trim_tail_right 5 -trim_ns_left 1 -trim_ns_right 1) in order to reduce the data size to facilitate assembly [18].

2.2. Filtering of Contaminating Reads

Following trimming of low-quality reads, the sequences were filtered for rRNA reads as well as those originating from microbial contaminants, which could have come from the environment of the fish or during sample collection. To perform this filtering, a database was created consisting of the Escherichia coli str. K-12 genome sequence (RefSeq accession number: NC_000913.2), 4174 viral genome sequences from NCBI RefSeq and 49 rRNA sequences of Asian seabass or zebrafish origin obtained from NCBI and SILVA [19]. All the reads and sequences incorporated in the assembly were first compared with this database, by mapping short-reads using Bowtie with default parameters and by aligning long reads using BLAST comparison [20]. Sequences identified to be of rRNA or microbial origin were removed only if they did not find a match in the zebrafish (Danio rerio) and Nile tilapia (Oreochromis niloticus) reference mRNA sequences (retrieved from UCSC and NCBI).

2.3. Sequence Assembly, Mapping and Redundancy Removal

The assembly of the filtered reads from various platforms was performed in a step-wise manner, as shown in the flowchart in Figure 1. The 454 and SOLiD data were co-assembled using the “De novo Assembly” tool in CLC Genomics Workbench (version 5.1; 80% length fraction, 80% similarity fraction, with default insertion, deletion and mismatch costs), and then merged with ~22,000 Asian seabass EST sequences from NCBI Genbank (Download date: 26 July 2012) as well as the published Asian seabass intestine assembly [9], using CAP3 (with default parameters). The resulting contigs were then further merged using CAP3 with an earlier HiSeq-based version of the transcriptome [6], to produce the multiplatform (MP) assembly. The HiSeq derived data were from strand-specific cDNA libraries, which marked the orientation of the reads with respect to the mRNA, greatly reducing the complexity of the assembly process. The data from HR2 comprising ten libraries were assembled independently using Trinity (version 10/11/2013), and the resulting assemblies were combined and subjected to a redundancy removal using cd-hit-est (CD-HIT version 4.6.1 with parameters -aS 0.98, -c 0.98) to produce a non-redundant dataset. Finally, the HR2 assembly was merged with the polished MP assembly (see Supplementary File 1 for polishing steps) to generate the “final multiplatform” (FMP) transcriptome sequence dataset [21].

2.4. GC Content and Microsatellites

The GC-content of the Asian seabass transcriptome was calculated using BedTools utilities using a 35 bp sliding window and further processed for plotting using in-house scripts [22]. The same analysis was performed for RefSeq mRNA datasets of Japanese medaka (Oryzias latipes), Nile tilapia, zebrafish and zebra mbuna (Maylandia zebra) for comparison.
An inventory of the microsatellites in the transcriptome was obtained using Censor version 4.2.28 with the following parameters: censor.ncbi <filename> -nofilter -show_simple -bprg blastn -mode norm. Mononucleotide repeats were ignored since they would be difficult to distinguish from polyadenylation and sequencing errors.
Figure 1. Pipeline describing the Asian seabass transcriptome assembly from three next-generation sequencing platforms. The 454 and SOLiD sequence datasets were first co-assembled, and later merged with Asian seabass ESTs from NCBI and a 454-based Asian seabass intestine assembly [9]. These sequences were then merged with a previous version of the Asian seabass transcriptome from the first round of HiSeq data [7] to produce a “multiplatform” assembly, which was further polished to remove low-coverage and redundant sequences. Independently, the second round of HiSeq data was assembled (library-wise) using Trinity, and then clustered to remove redundancies. Finally, these contigs were merged with the polished multiplatform assembly to generate the final Asian seabass transcriptome dataset. The coloured boxes indicate the datasets that were used for the downstream comparisons and analyses.
Jmse 03 00382 g001

2.5. Generating a Refined Nile Tilapia Sequence Dataset as a Reference for Asian Seabass Transcriptome Annotation

A sequence dataset from a closely related fish species, the Nile tilapia, was used to annotate the assembled Asian seabass transcriptome and estimate the completeness of the assembly. The Nile tilapia sequences were obtained from the NCBI RefSeq Protein database using the following search query: “Oreochromis niloticus”[PORGN: _txid8128] AND srcdb refseq[PROP], which resulted in a dataset of 46,501 sequences (downloaded in October 2013). However, this dataset contained redundant sequences and hence had to be filtered before it was utilized. Removal of exact sequence duplicates decreased the dataset to 39,796 sequences, and subsequently retaining only the longest sequence for those that have identical descriptions produced a refined Nile tilapia protein reference sequence dataset of 26,675 sequences [21].

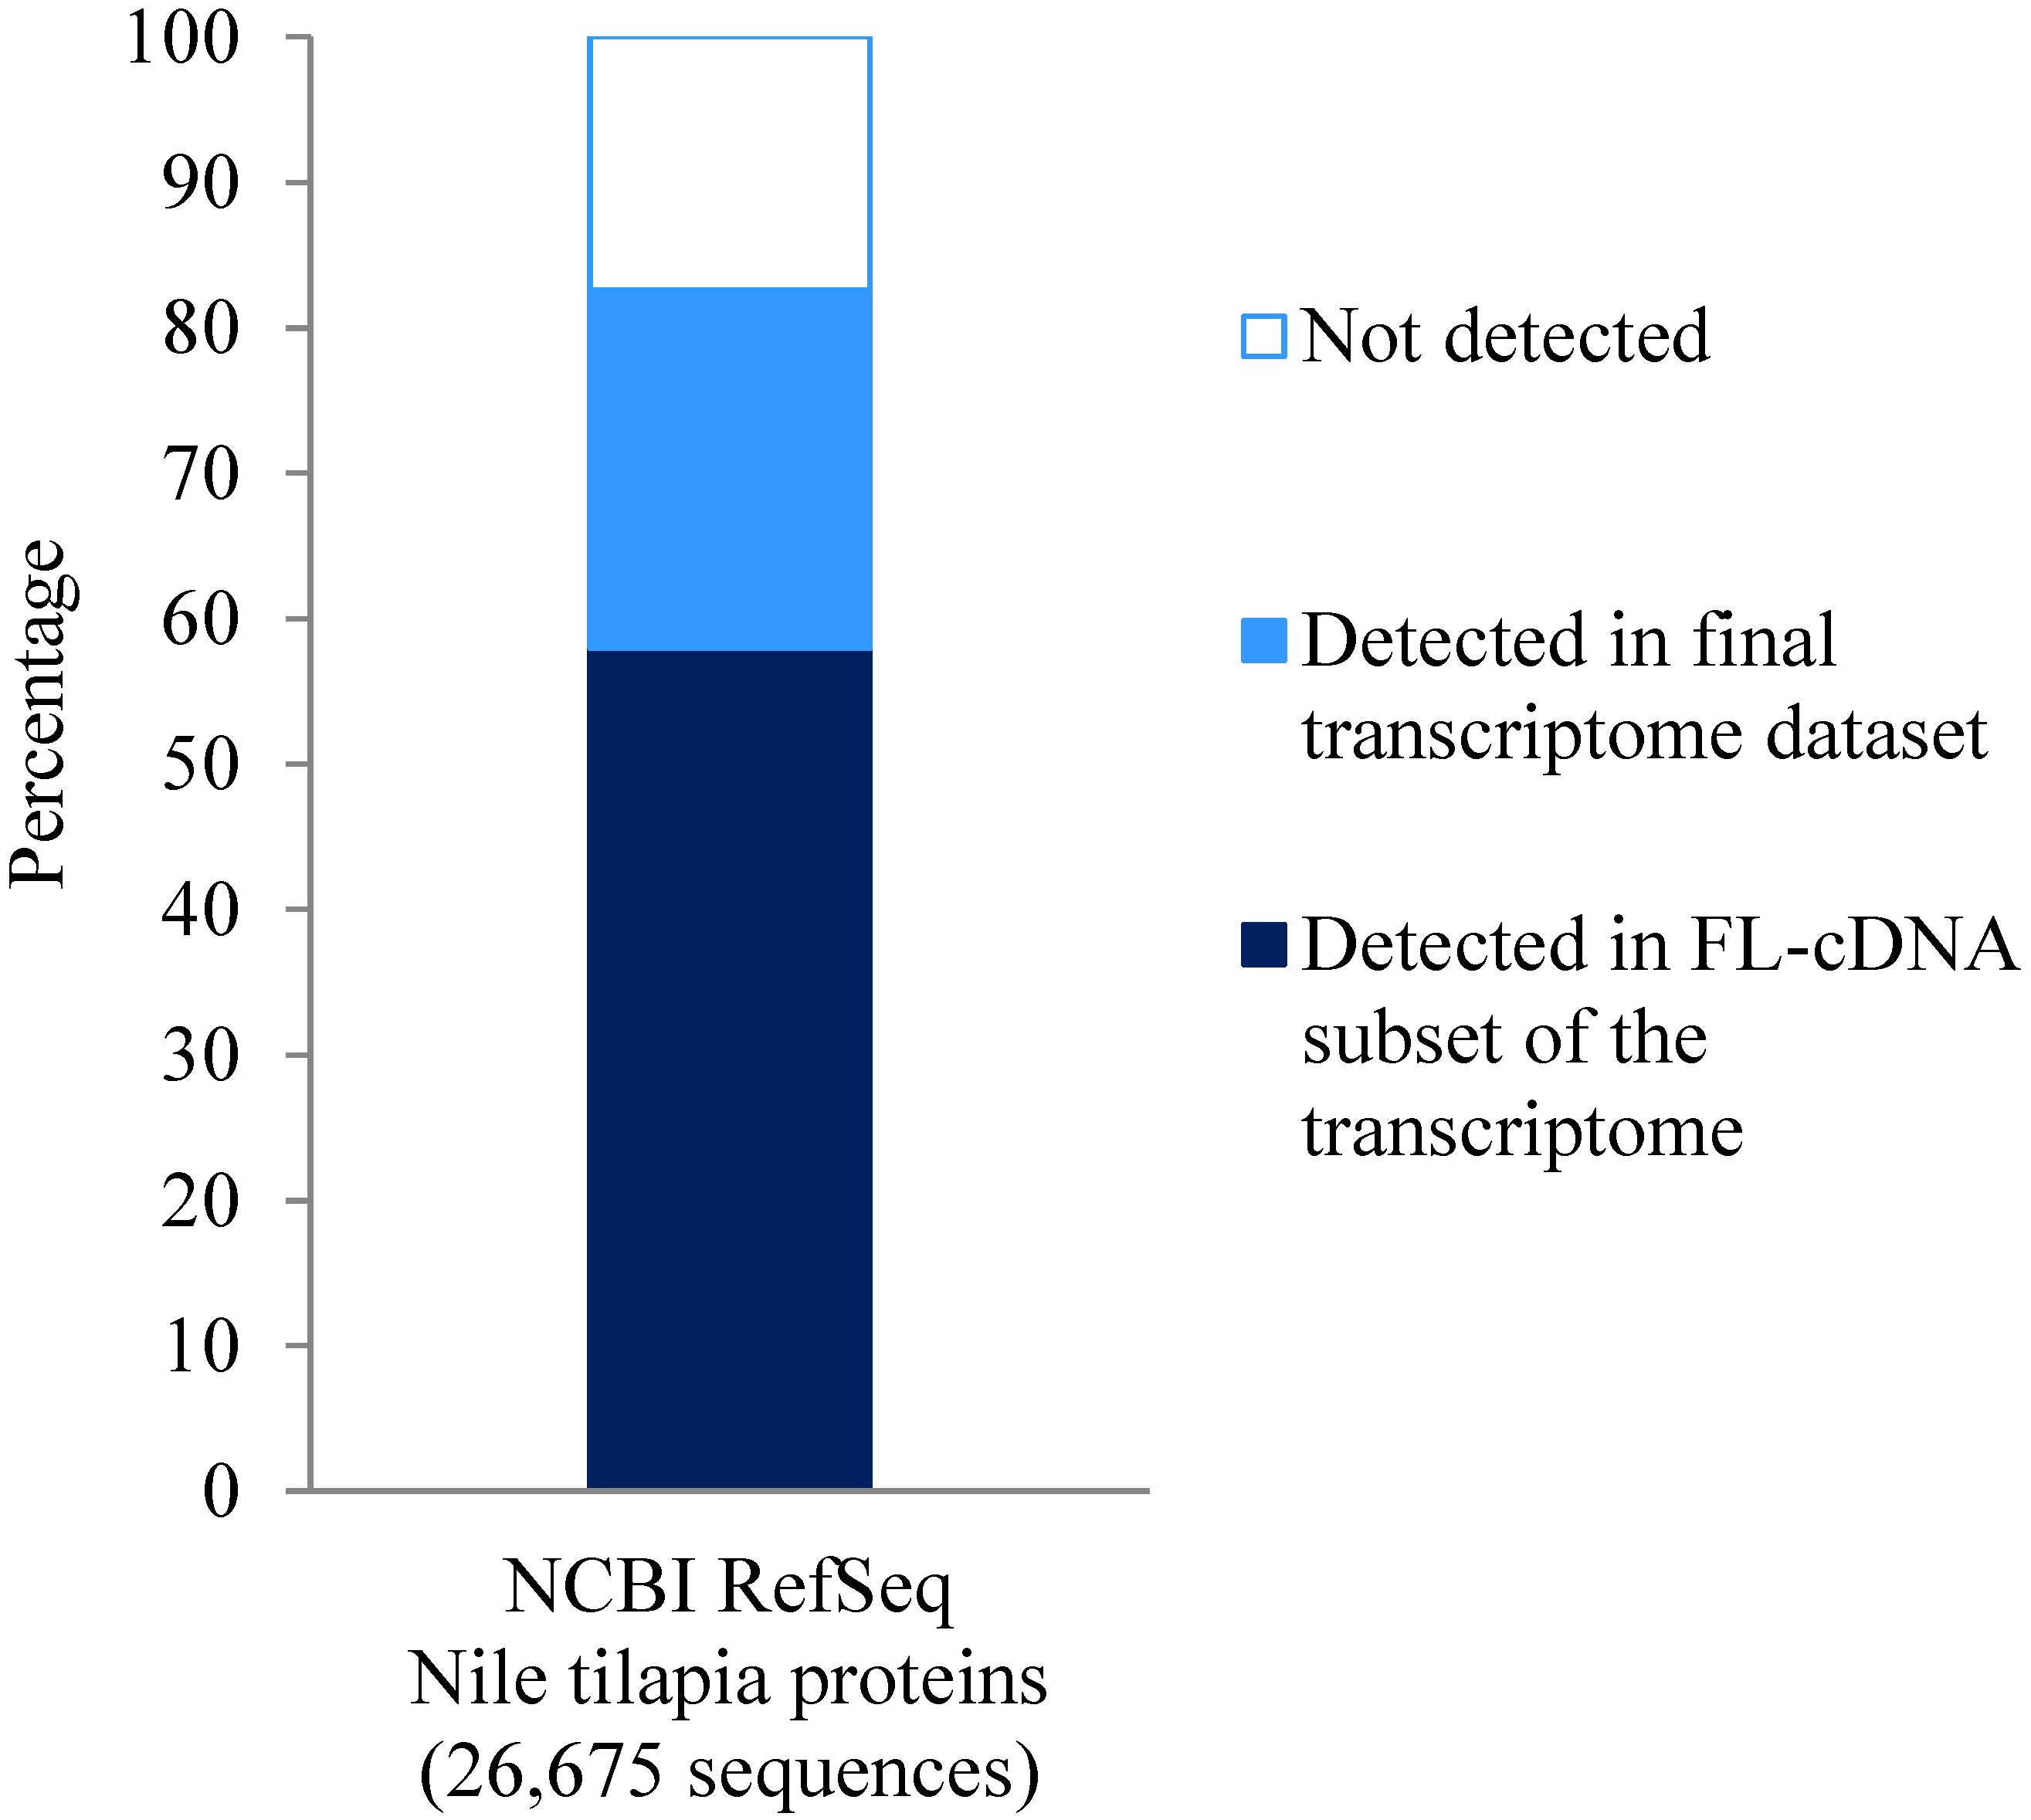
2.6. Sequence Annotation, Estimation of Completeness and Full-Length Sequence Prediction

Sequence annotation was performed using a BLASTX search of the assembled contigs against the Nile tilapia RefSeq protein dataset described above using an e-value of 1e−6 and retaining only the top hit. Only hits that had alignment length of at least 65 amino acids were selected, and the number of unique reference protein sequences represented by transcripts in our transcriptome was used to estimate the completeness of the assembly.
To provide annotation for the contigs in the final assembly that did not have a BLASTX match to the Nile tilapia protein sequence dataset, the search database was extended and the following BLAST searches were performed: (i) BLASTN against the Nile tilapia RefSeq mRNA sequences; (ii) BLASTX against a database of RefSeq protein sequences of twelve additional ray-finned fishes, namely zebrafish, rainbow trout, Burton’s mouthbrooder (Haplochromis burtoni), Japanese medaka (Oryzias latipes), channel catfish (Ictalurus punctatus), Pundamilia nyererei, spotted gar (Lepisosteus oculates), Atlantic salmon, zebra mbuna, spotted green pufferfish (Takifugu rubripes), Lyretail cichlid (Neolamprologus brichardi), and Southern platyfish (Xiphophorus maculatus); and (iii) BLASTN against a database of RefSeq mRNA sequences from the same 12 species listed above.
Augustus (version 2.5.5 with default parameters) was used to predict ORFs in the contigs that remained unannotated after the BLAST searches described above [23]. We then aligned the remaining unannotated contigs without predicted ORFs to a rough draft of the Asian seabass genome [5], to verify if they were bona fide Asian seabass sequences.
Prediction of full-length cDNAs in the final assembly was performed using Full-LengtherNEXT version 0.08 using the default parameters and the “vertebrates” taxon group as the reference database [24].

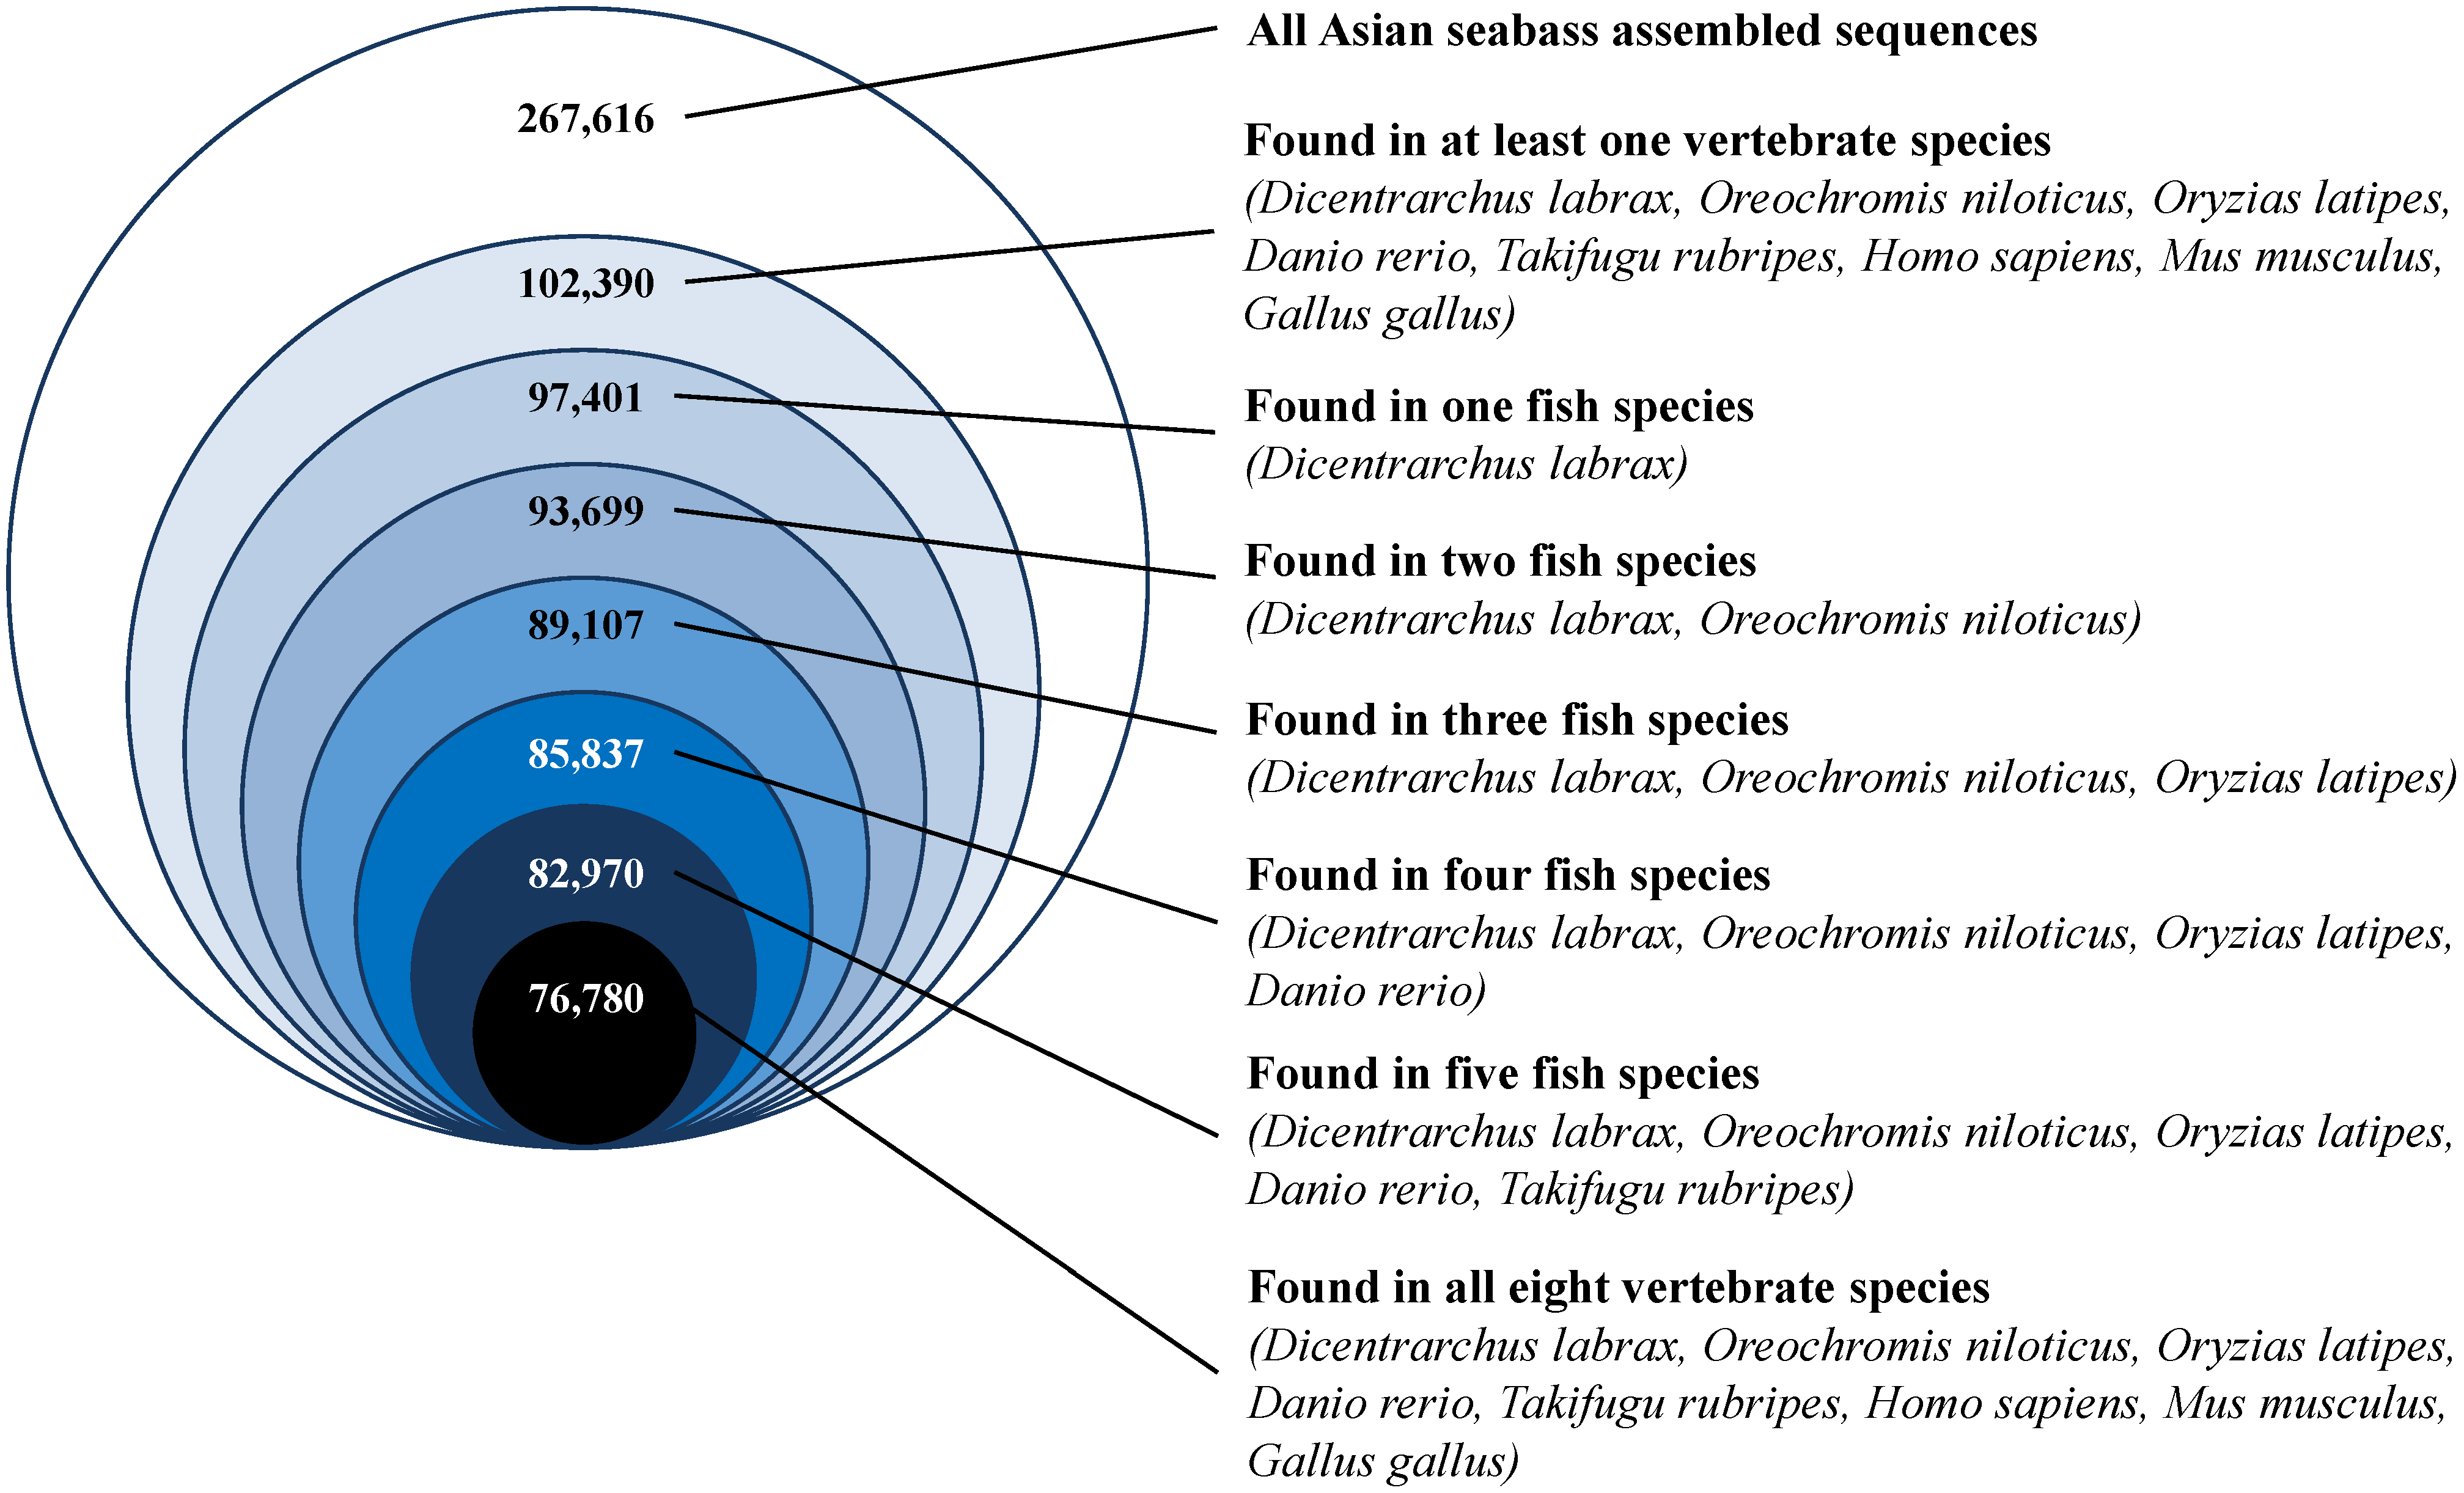
2.7. Sequence Conservation with Other Vertebrates

The final assembly was searched using BLASTX against seven vertebrate RefSeq protein sequence datasets, namely those from Nile tilapia, Japanese medaka, zebrafish, spotted green pufferfish, human, mouse and chicken to evaluate the conservation across the Asian seabass and these other species. Analysis was also extended to include the predicted protein sequence dataset of the recently published European seabass [25]. BLASTX alignment length cut-off was set at 65 amino acids.

2.8. Pathway Distribution and Analysis of Organ-Specific Sequences

Pathway analysis was performed on the annotated subset of the final assembly using the KEGG Automatic Annotation Server (KAAS), with the parameters set to the eukaryotic representative set and the “bi-directional best hit” assignment method [26]. The output data was parsed using in-house scripts to obtain the percentage of KEGG pathway genes represented in our transcriptome [27]. For comparison, the KEGG KAAS analysis was performed on the European seabass protein dataset and Nile tilapia RefSeq protein dataset, while the KEGG pathway genes represented in the common carp and crucian carp transcriptomes were also incorporated from published data [11,28].
Since the second round of Illumina HiSeq sequencing (HR2) was done on individual samples from different organs, a pair-wise comparison of the BLASTX results was performed to identify the protein-coding loci that were represented in different subsets of the organ-derived transcriptomes. As a measurement of sequence complexity, the cumulative contribution of each organ to the combined transcriptome was also determined.

2.9. Evaluation of Asian Seabass Transcriptome as a Reference for RNA-seq Experiments

An evaluation of the usefulness of the Asian seabass transcriptome as a reference for differential expression was performed by studying the differential expression between the testis and ovary RNA-seq dataset that was generated and used for the assembly of the transcriptome. The reference dataset was created from the Asian seabass full transcriptome by selecting sequences which had the greatest percentage-aligned length to the Nile tilapia RefSeq protein sequences (26,675 sequences). This resulted in a dataset of 22,022 Asian seabass sequences [21]. The testis and ovary reads were mapped against the reference dataset using the “Map reads to reference” tool in CLC Genomics Workbench (version 8.0, 95% length fraction, 95% similarity fraction with default insertion, deletion and mismatch costs). The BAM files were then imported into Partek® Genomics Suite® software (version 6.6, 2014) for differential gene expression analysis using the RNA-seq analysis workflow. As we did not have technical replicates in this RNA-seq experiment, the algorithm provides p-values using a chi-squared test with the assumption that the transcripts are evenly distributed across all samples. The p-values were then adjusted using the Bonferroni method. A list of differentially expressed genes between the testis and ovary was obtained with corrected p-value ≤0.05 and fold-change ≥5. The Gene Ontology terms of these differentially expressed genes were obtained using the Ensembl Biomart via the Nile tilapia RefSeq protein accession numbers [29].

3. Results

3.1. Sequencing, Quality Control and Filtering of Reads

The Asian seabass transcriptome sequence data was generated using three NGS platforms, namely 454-FLX Titanium (~1 million reads), SOLiD 3+ (~38 million 50 bp reads) and paired-end Illumina HiSeq 2000 (~1 billion reads from the two independent rounds of sequencing; Table 1). Adaptor and quality trimming, followed by removal of rRNA or contaminating microbial reads resulted in ~0.9 million, ~18.1 million, and ~993 million filtered reads from the 454, SOLiD and HiSeq platforms, respectively (Table 1, Supplementary File 1, Supplementary Figure S1).

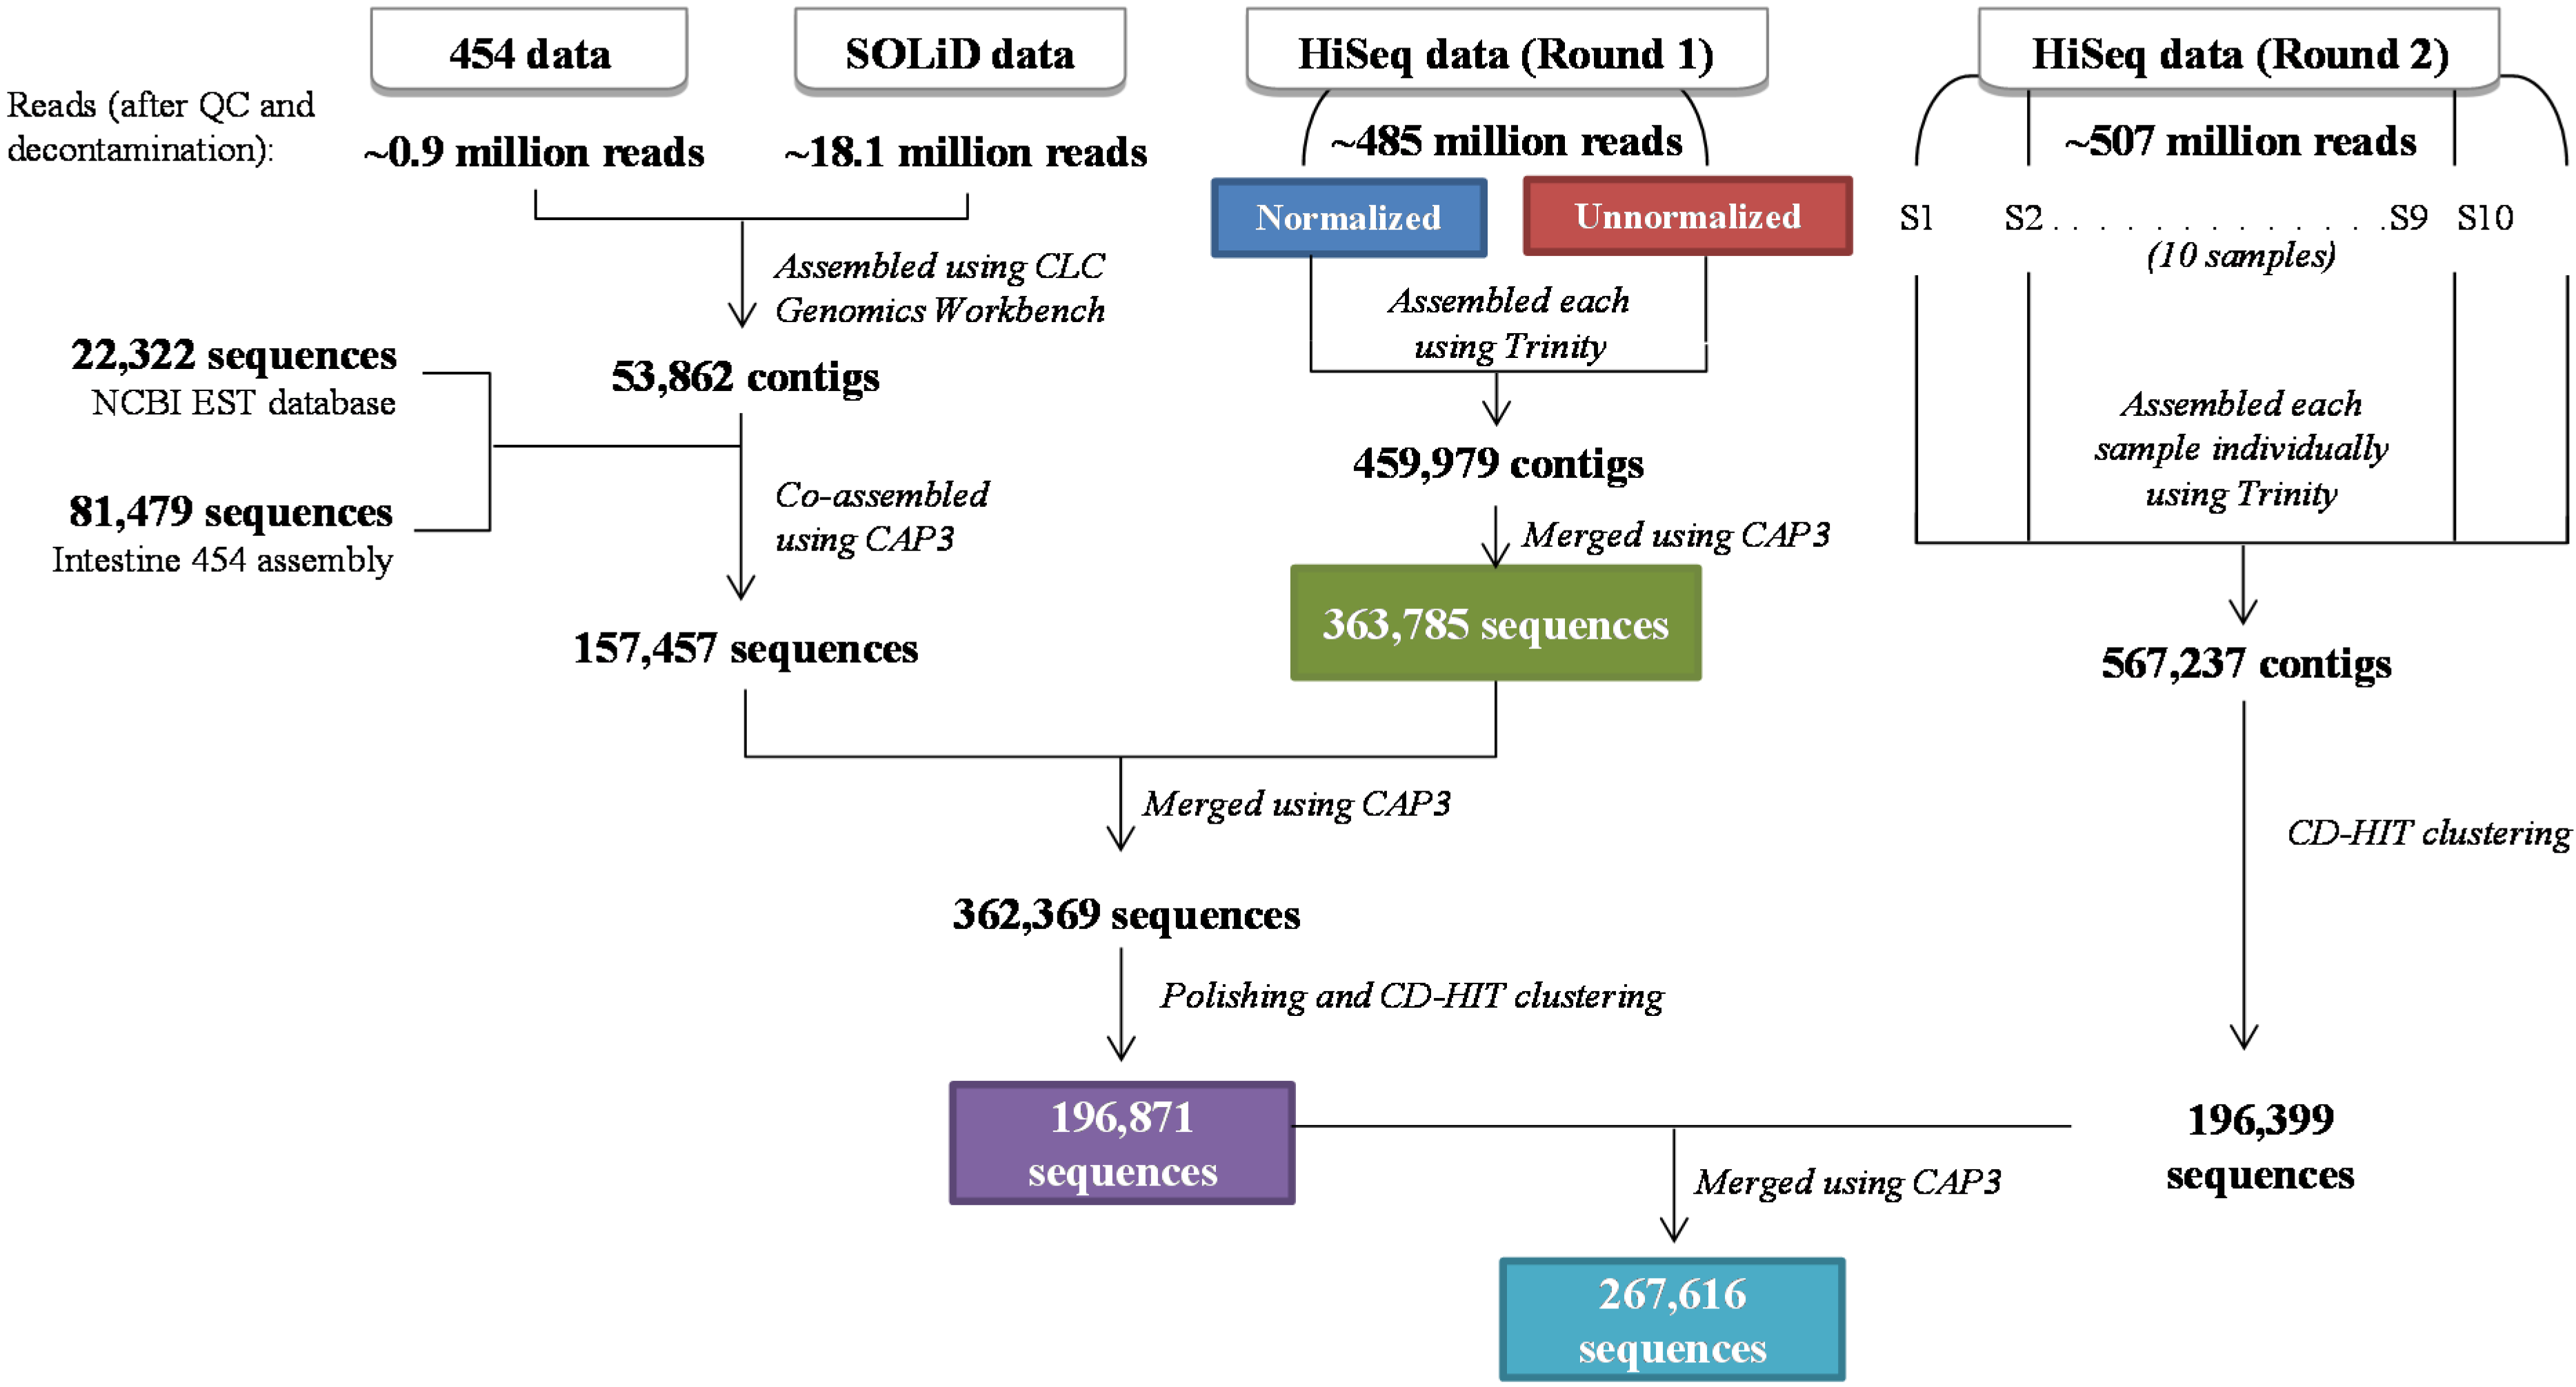
3.2. Assembly of the Asian Seabass Transcriptome

The sequence data from various platforms were assembled in a multi-step manner as shown in Figure 1. The assembly using combined 454 and SOLiD data generated 53,862 contigs, which were then merged with 22,322 NCBI EST sequences and 81,479 sequences from a 454-based Asian seabass intestine assembly published earlier [9], resulting in 157,457 contigs. A co-assembly of these contigs with the previously reported HiSeq Round 1 (HR1) assembly [7] resulted in 362,369 contigs. Since we observed the presence of contigs, which were identical except for short terminal overhangs, we performed a sequence clustering using cd-hit-est to retain only the longest representative for highly similar contigs, resulting in a polished “Multiplatform” (MP) dataset of 196,871 contigs (Figure 1, Table 2).
Table 1. Number of reads before and after quality check (QC) and filtering of rRNA and microbial reads.
454SOLiDHiSeq Normalized (HN)HiSeq Unnormalized (HU)HiSeq Round 2 (HR2)
Raw reads1,068,74338,336,497236,141,512284,842,758665,889,628
After adaptor and quality trimming1,043,80218,792,575225,382,446262,102,222520,397,768
98% *49%95%92%78%
After rRNA and microbial removal908,01918,189,484224,731,908260,937,802507,301,076
85%47%95%92%76%
* All percentages are approximate with respect to the raw read counts.
Table 2. Statistics for the intermediate Asian seabass transcriptome assemblies.
AssemblyNumber of ContigsNumber of Contigs after cd-hit-estNumber of Contigs ≥1 kb *Average Contig LengthMaximum Contig Length
HiSeq Normalized (HN)194,957106,76828,548 (27%)88517,036
HiSeq Unnormalized (HU)265,022126,37740,752 (32%)108230,061
HiSeq Round 1 (HR1)363,785182,91147,458 (26%)92731,251
Multiplatform (MP)362,369196,87151,947 (26%)96531,251
The reads from HiSeq Round 2 (HR2) were assembled in ten parts (one assembly per sample), generating a total of 567,237 contigs. Clustering of these contigs by cd-hit-est to collapse highly similar and redundant contigs resulted in a dataset of 196,399 sequences (Figure 1). Finally, these contigs were merged with the MP assembly to produce the “Final Multiplatform” (FMP) Asian seabass transcriptome assembly of 267,616 contigs with an average sequence length of 979 bp (Table 3).

3.3. GC-Content and Microsatellite Distribution

The GC-content of the Asian seabass transcriptome was ~46%, and the GC-content distribution was similar to several related fish species (Table 3, Supplementary Figure S2). A total of 40,330 microsatellites (or simple sequence repeats, SSRs) were identified. The most common repeat unit types were dinucleotides (43.4%), followed by trinucleotides (30.6%). The most common motif was AC (30.6%), followed by GGA, AG and GCA (13.1%, 9.7% and 5.9%, respectively; Supplementary Tables S1 and S2).
Table 3. Assembly statistics for the final multiplatform (FMP) Asian seabass transcriptome assembly.
Total length (bp)262,023,963
Number of contigs267,616
Number of contigs ≥1 kb70,588
Min length (bp)200
Max length (bp)31,251
Average length (bp)979
Total GC count (bp)121,345,916
GC-content (%)46.31

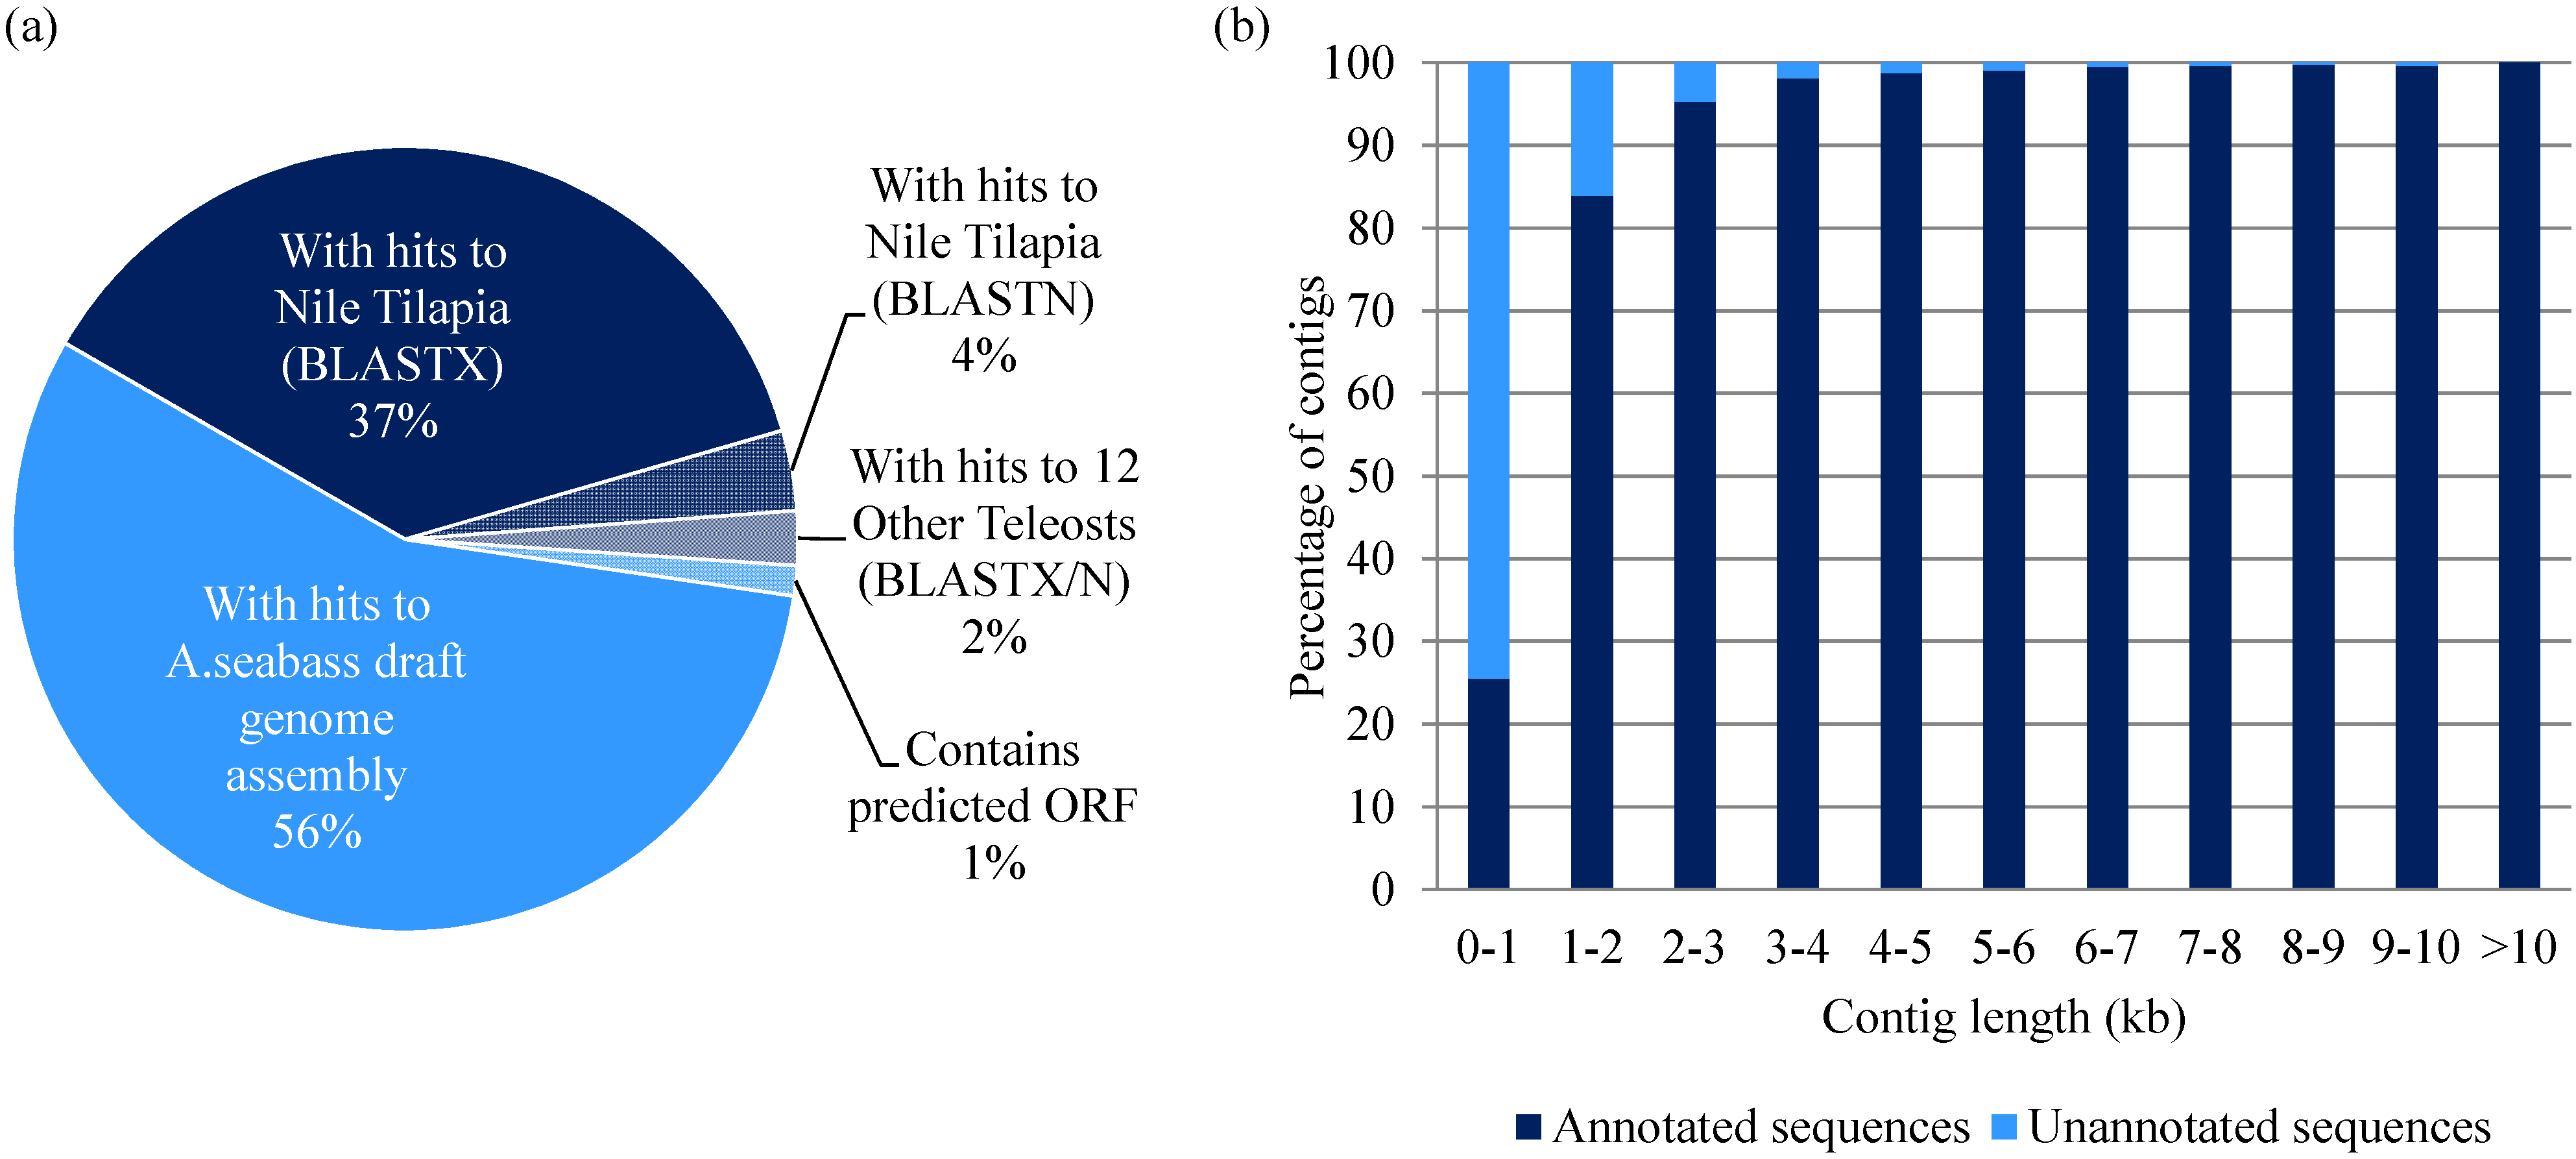
3.4. Sequence Annotation of Transcriptome Contigs and Prediction of Full-Length cDNAs

The filtered Nile tilapia protein sequence dataset obtained from NCBI RefSeq (26,675 sequences) was used as a benchmark to evaluate the assembled Asian seabass transcriptome. Approximately 37% of our assembled contigs showed a match to the predicted protein dataset using BLASTX (alignment length ≥65 amino acids; Supplementary Table S3). An additional 6% of the transcriptome contigs could be annotated by subsequent BLASTN/BLASTX-searches against the Nile tilapia NCBI RefSeq mRNA and datasets from 12 other fish species (Figure 2a). More than 99% of the annotated contigs were longer than 5 kb in length, while the majority of unannotated contigs were short (≤1 kb; Figure 2b).
An inspection of the remaining unannotated transcriptome contigs identified 1% with predicted ORFs, and the remaining contigs (56%) could be mapped to the Asian seabass genome draft sequence but could not be assigned ORFs with confidence (Figure 2a).
Of the 26,675 Nile Tilapia reference protein sequences, 22,021 (83%) were represented by one or more contigs in our assembled transcriptome (Figure 3). Notably, 37,360 full-length cDNAs (FL-cDNAs) were predicted from our assembled Asian seabass transcriptome, which correspond to 15,459 Nile tilapia reference protein sequences (Figure 3).
Figure 2. BLASTX/BLASTN-based annotation of the Asian seabass transcriptome. (a) Proportion of the transcriptome that showed BLASTX/BLASTN matches against the RefSeq datasets of Nile tilapia and 12 other teleosts. A total of 41% of the contigs had a BLASTX/BLASTN match against Nile tilapia, while another 2% found a match to 12 other teleosts, and 1% was predicted to contain ORFs. The remaining unannotated contigs showed sequence similarity to the Asian seabass draft genome. (b) Distribution of annotated and unannotated contig lengths. The unannotated sequences were found to be mostly short contigs (≤1 kb), while majority of the long contigs were annotated. All BLAST results were subjected to an alignment length cutoff: ≥200 bp for BLASTN and 65 amino acids for BLASTX.
Jmse 03 00382 g002
Figure 3. Proportion of the Nile tilapia RefSeq protein dataset that was detected in the final Asian seabass transcriptome as well as the full-length cDNA (FL-cDNA) subset. Using BLASTX, ~83% of the Nile tilapia RefSeq sequence homologs were detected in the Asian seabass transcriptome, while ~58% were represented in the FL-cDNA subset.
Jmse 03 00382 g003

3.5. Sequence Conservation with Other Vertebrate Species

To assess the degree of conservation between the Asian seabass and other teleost and vertebrate species, a BLASTX analysis of our final assembly was performed against five teleosts, namely European seabass, Nile tilapia, Japanese medaka, zebrafish, and spotted green pufferfish, as well as human, mouse and chicken. Of the 102,390 contigs (38% of the transcriptome) that had a match to at least one of the eight species, the European seabass had the largest number of BLAST-search matches with the Asian seabass transcriptome (Figure 4). Further, 82,970 (81%) of the contigs found BLASTX matches in all five fish species analyzed, and 76,780 (75%) found BLASTX-matches in all the eight vertebrate species (Figure 4).

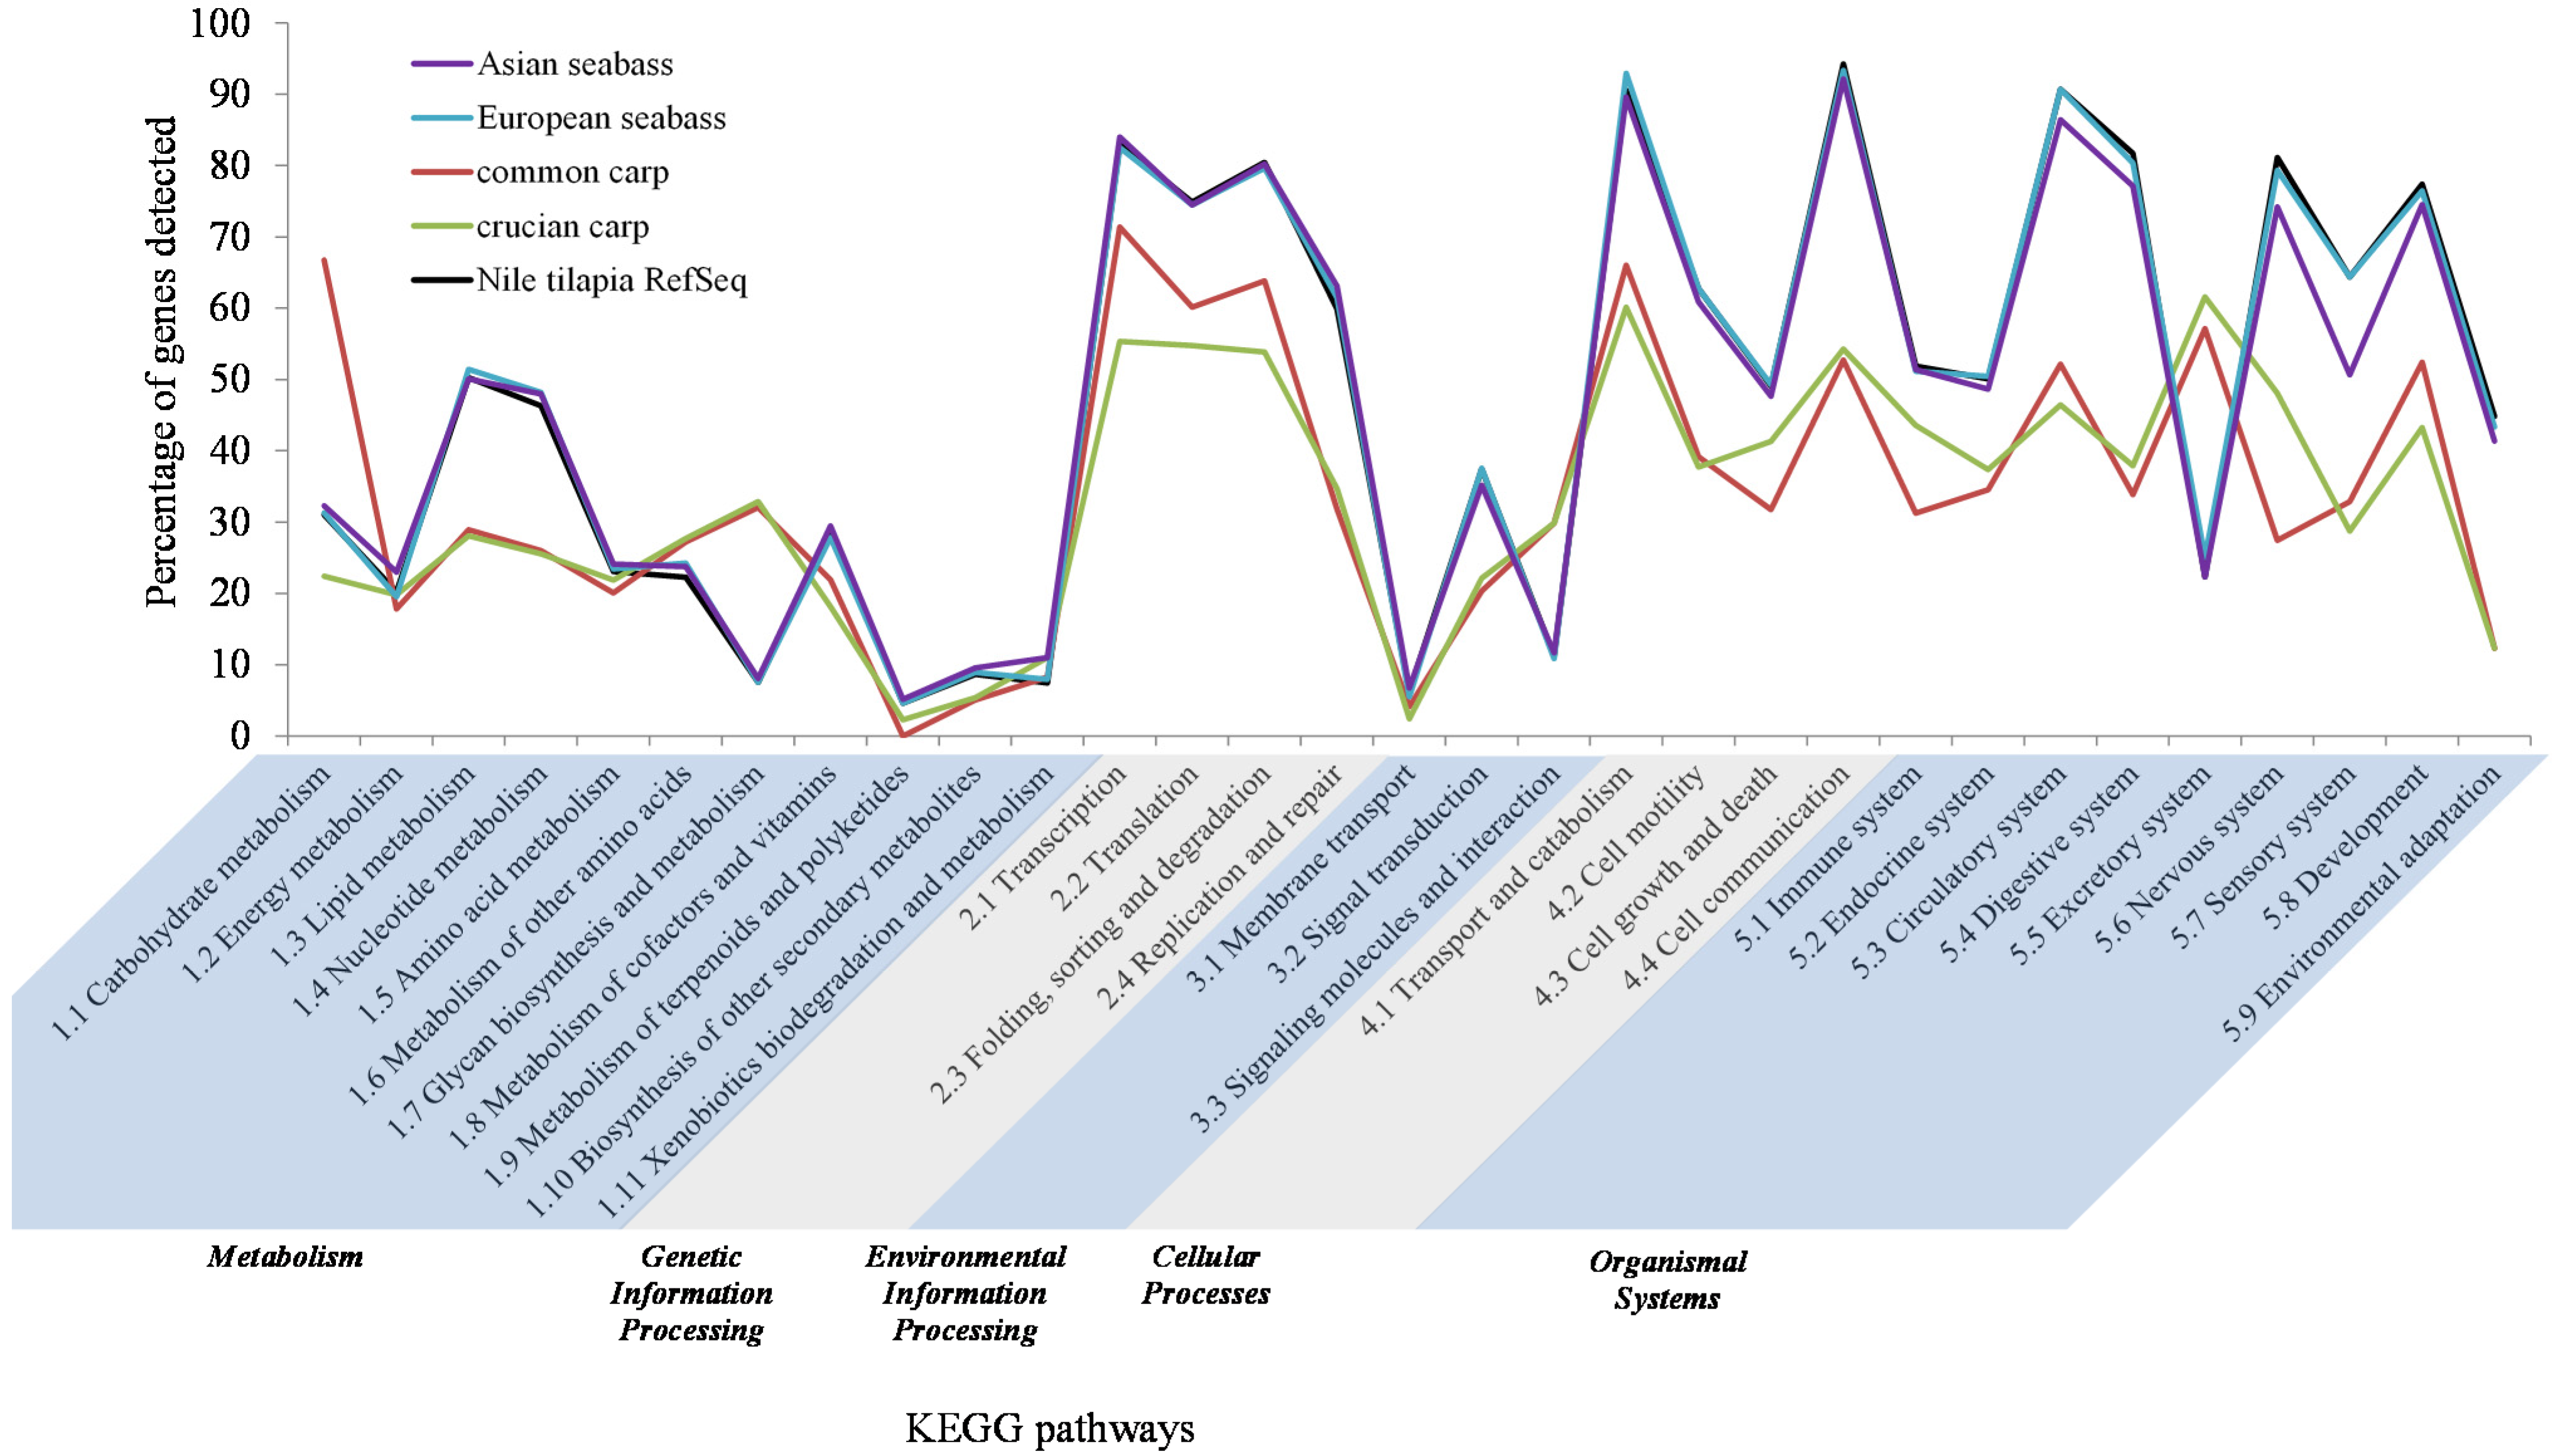
3.6. Pathway Distribution of Transcriptome Contigs

Pathway analysis was performed on the annotated subset of the final assembly using the KEGG Automatic Annotation Server (KAAS). A total of 6500 out of 15,682 (41%) KEGG pathway genes were represented by transcripts in the Asian seabass transcriptome (Supplementary Table S4). The following three KEGG pathway categories were well represented in our transcriptome: genetic information processing, cellular processes and organismal systems (75%, 71%, and 60%, respectively), while the metabolism and environmental information processing pathways had a lower representation (~25% for both; Supplementary Table S4). A similar trend was observed when the results were compared to that of the European seabass protein dataset, Nile tilapia RefSeq dataset and the transcriptome datasets of common carp and crucian carp (Figure 5).
Figure 4. Conservation of Asian seabass transcriptome sequences across eight vertebrate species, including five teleost fish species. Based on a BLASTX search of the final transcriptome assembly with the European seabass predicted protein dataset (Dicentrarchus labrax) and the RefSeq protein datasets of the Nile tilapia (Oreochromis niloticus), Japanese medaka (Oryzias latipes), zebrafish (Danio rerio), spotted green pufferfish (Takifugu rubripes), human, mouse and chicken, ~38% of the contigs were found to have a hit with at least one species, out of which ~81% were found in all five teleosts and ~75% were found in all eight vertebrates.
Jmse 03 00382 g004

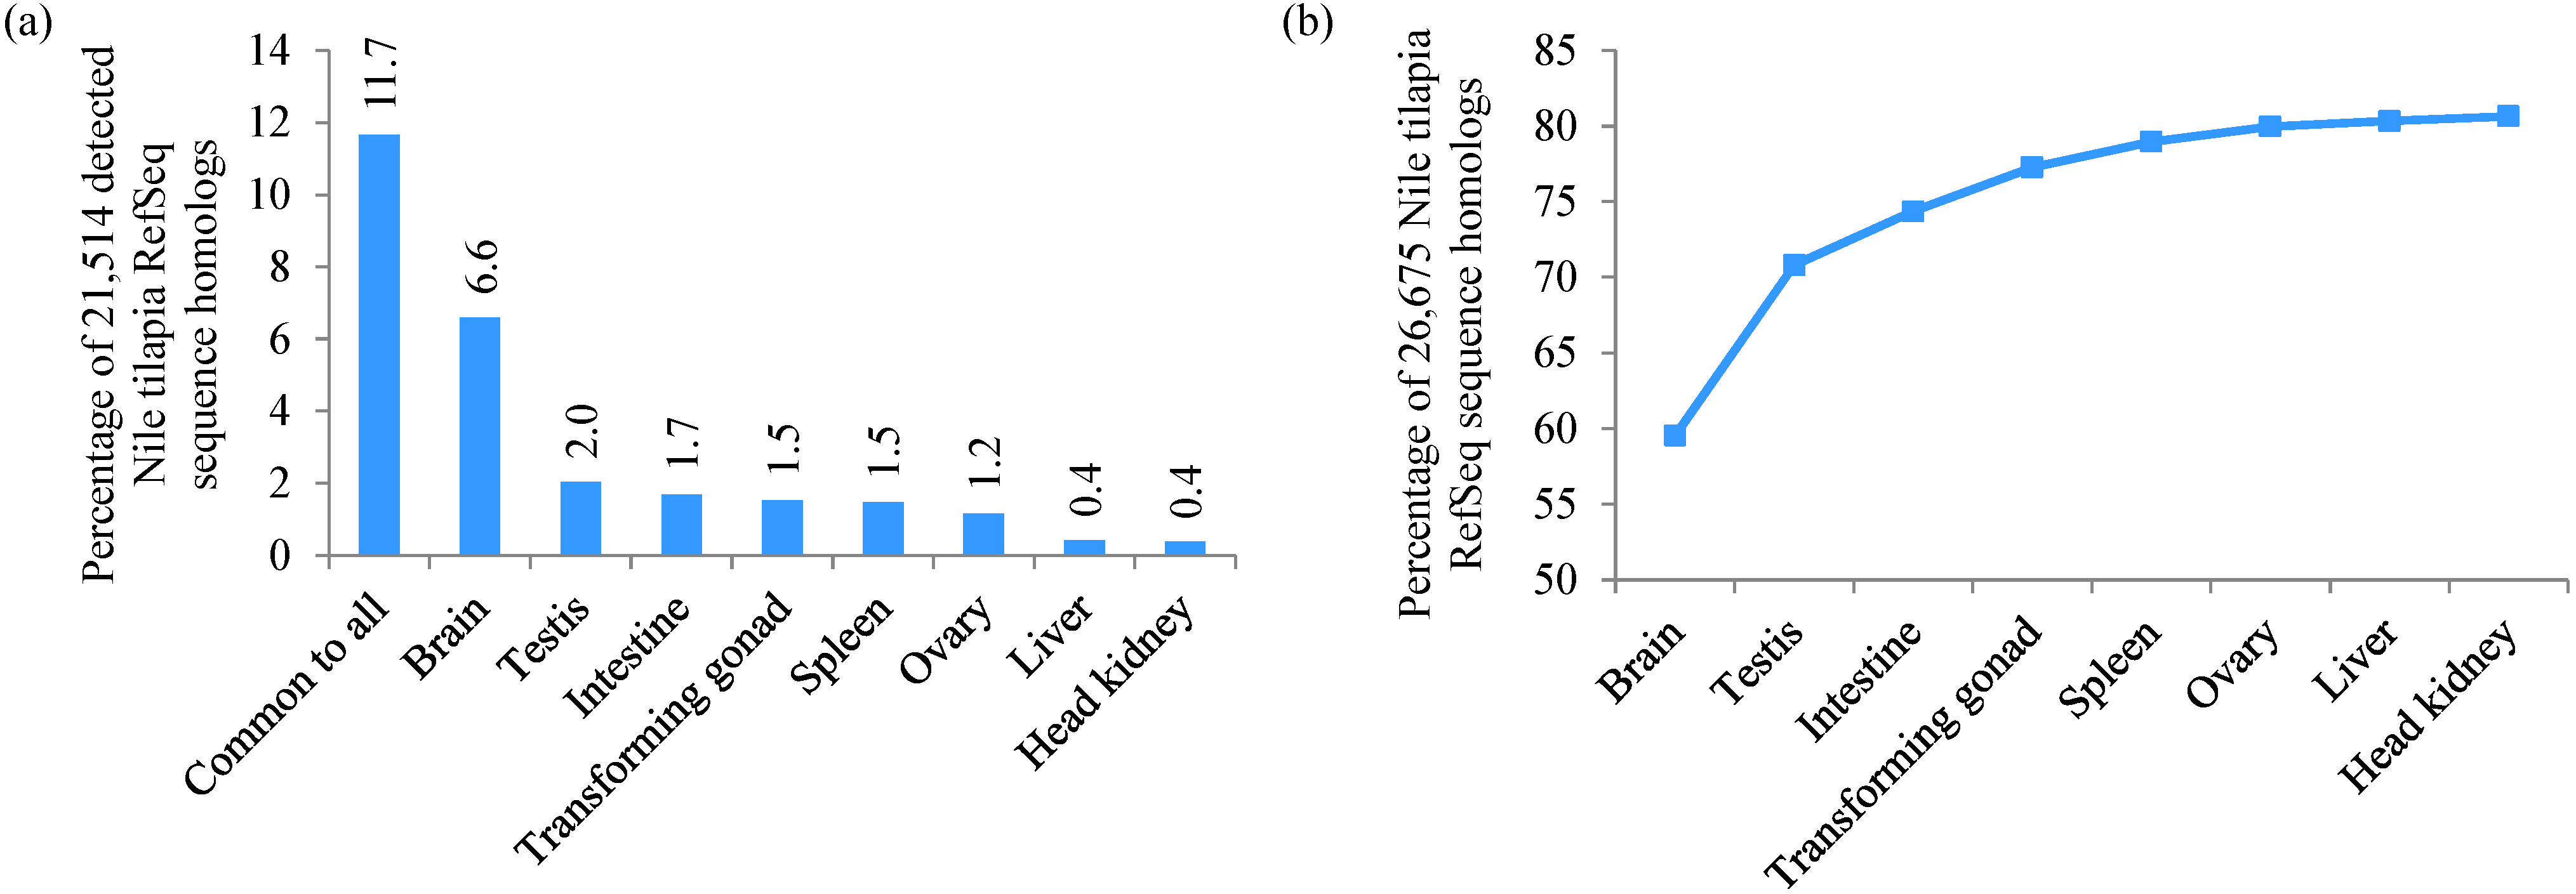
3.7. Analysis of Organ-Specific Transcripts

Making use of the individual organ assemblies from HR2 (Figure 1), we identified protein-coding sequences that were common to all organs as well as those that are unique to specific organs based on the BLASTX results against Nile tilapia protein reference sequences. At the limit of detection, a total of ~15% of the reference sequences were represented by transcripts in a single organ, while only ~12% of them were represented by transcripts in all the organs studied, indicating the importance of including multiple organs to obtain a comprehensive transcriptome (Figure 6a, Supplementary Table S5). The brain contributed ~60% of the expected protein-coding sequences and had the largest percentage (6.6%) of unique reference protein sequences represented by transcripts (Figure 6a). The percentage of detected sequence homologs increased to ~71% when the testis was included. Subsequent inclusion of the other organs showed a stepwise improvement of <5% from each organ (Figure 6b).
Figure 5. Percentage of KEGG pathway genes detected in the Asian seabass final transcriptome assembly, shown in comparison to the European seabass protein dataset, common carp and crucian carp transcriptomes, as well as the Nile tilapia RefSeq protein dataset. The KEGG pathways are shown in five main categories. The “genetic information processing”, “cellular processes” and “organismal systems” categories were well represented in the Asian seabass transcriptome, while the “metabolism” and “environmental information processing” categories had a lower representation.
Jmse 03 00382 g005

3.8. Application of the Asian Seabass Transcriptome for RNA-seq Experiments

Following a mapping of RNA-seq reads from testis and ovary samples against a reference dataset of 22,022 sequences derived from the Asian seabass transcriptome, a total of 6670 differentially expressed transcripts were obtained (Supplementary Table S6). These were made up of 2440 transcripts with lower and 4230 transcripts with higher expression in the testis compared to the ovary. Gene ontology terms of these differentially expressed genes included biological processes such as reproduction (GO:0000003), sexual reproduction (GO:0019953), the reproductive process (GO:0022414), the reproductive developmental process (GO:0003006), gamete generation (GO:0007276), fertilization (GO:0009566) and the reproductive cellular process (GO:0048610). Twenty-one of these transcripts were also shown to have sex-related roles or differential expression in the gonads in previous studies (Table 4) [8,30,31,32,33,34]. This finding showed that the assembled transcriptome could be reliably used as a reference for differential expression analyses.
Figure 6. Analyses of the organ-specific assemblies. (a) Percentage of protein sequence matches that were detected in all organs versus individual organs. Percentages were calculated with respect to the number of detected protein sequence homologs in the HiSeq Round 2 (HR2) assembly (21,514). About 12% of the detected homologs were common to all organs, with the brain having the highest percentage of uniquely detected sequence homologs; (b) The cumulative contribution of each organ to the transcriptome. The x-axis shows the organs as they were successively added to the tabulation (from left to right). For instance, the “Testis” data point shows the percentage of Nile tilapia protein sequence homologs detected when the brain and testis data were considered, and so on. The order of successively adding the data from the individual organs was based on the order of their unique contributions as depicted in (a).
Jmse 03 00382 g006
Table 4. Differentially expressed transcripts between the testis and ovary that show sex-related roles or expression.
TranscriptsDifferential Expression (vs. Ovary)Gene SymbolSex-Related Role or Expression *Reference
Contig9986Testis downdndDJOT[30]
Head_kidney_comp8086_c0_seq1Testis downtp53UO[8]
Ovary_comp51781_c4_seq1Testis downzp2UO[8]
Contig9942Testis downnanos3DJOT[30]
MP_Contig36467Testis downstra6Differentially expressed during gonad transformation[30]
Contig29413Testis downzp2UO[8]
Contig31358Testis downdvl2UO[8]
Contig26426Testis downcyp26a1UO[8]
Testis_comp111815_c0_seq1Testis uppiwil1UT[8]
Brain_comp205525_c3_seq2Testis upsept6UT[8]
Transiting_gonad_comp205341_c0_seq2Testis uparUT[8]
Contig32418Testis uptdrd7UT[8]
Contig15683Testis upesr1UT[8]
Contig31060Testis upsycp3UJOT[31]
Contig19652Testis upwt1bInfluence on PGC number during gonad development[32]
Testis_comp102806_c0_seq1Testis upcyp17a1UT[8]
Liver_comp139786_c2_seq1Testis upnr5a2UT[8]
Spleen_comp222831_c1_seq3Testis uppeli1UT[30]
Testis_comp113396_c0_seq1Testis upstarDJOT[30]
Contig5958Testis upcyp17a2Facilitate enzymatic reactions in the gonads[33]
Testis_comp195172_c0_seq1Testis upodf3bDifferentially expressed between wild type and PGC-depleted morphants at 22 dpf[34]
* DJOT: Down-regulated in juvenile ovotestis; UJOT: Up-regulated in juvenile ovotestis; UO: Up-regulated in the ovary; UT: Up-regulated in the testis.

4. Discussion

The Asian seabass is an important food fish, with widespread aquaculture prevalence in the Indo-West Pacific region. Although a few selective breeding programs do exist for this species, they are mainly constrained by the lack of sequence information, as well as the lack of sufficient relatedness to fish species with available sequence data. Here, we present the sequencing and de novo assembly of the Asian seabass transcriptome, which was performed using data from three platforms in a multi-step manner.
The bulk of the sequences were generated on the Illumina HiSeq platform, with relatively smaller amounts of data from the 454 and SOLiD platforms as well as from NCBI ESTs and published data [9]. A multi-step approach was used to obtain a final assembly with 267,616 contigs, of which 43% could be annotated by BLASTX/BLASTN. The contigs that contained unannotated ORFs could be either novel Asian seabass transcripts or reflect the absence of sequence homologs in the public databases, while the remaining unannotated contigs, which aligned to the draft genome, could possibly represent retained introns or non-coding regions. It was also noteworthy that the two longest transcripts (~30 kb and ~31 kb; Table 2) showed sequence homology to the Nile Tilapia titin and titin-like sequences. The human homolog of this gene is the largest known locus in the human genome comprising 363 exons encoding an exceptionally long mRNA transcript greater than 100 kb in length [35]. The assembled transcriptome will be useful for the ongoing annotation of the Asian seabass genome and also serve as a source of information for numerous applications such as expression and comparative studies.
A large number of microsatellites were identified in the Asian seabass contigs, with the dinucleotide count being higher than the trinucleotides. This trend is similar to microsatellite inventories reported in other fish species [11,28,36]. However, the number of microsatellites identified in our study was found to be considerably higher, possibly due to the larger amount of sequence data generated for the Asian seabass compared to the previously reported transcriptomes. These inventoried microsatellites will likely be a useful resource for future development of markers to aid in marker-assisted selection and breeding.
Organ-specific sequence analyses demonstrated the importance of prioritizing and more importantly, including organs with the highest contribution of unique transcripts (brain in this study) to a transcriptome. It is also equally important to incorporate as many organs and conditions as possible to achieve a comprehensive transcriptome, as seen in this study (~15% of predicted protein-coding sequences appeared to be unique in each organ).
Based on our effort to sequence and assemble the de novo transcriptome, and the observations from comparisons between the intermediate assemblies (Supplementary File 1), we have listed some guiding principles that would be useful for any non-genomics lab interested in embarking on a similar project (Supplementary File 2). In-depth reviews regarding assembly tools, metrics and pitfalls in dealing with transcriptome assemblies and analyses have also been previously provided by several groups [37,38,39,40]. Many transcriptome assemblies have relied on paired-end Illumina sequencing to achieve sequencing depth to obtain a comprehensive transcriptome. However, a number of these assemblies, including ours, have resulted in a high number of fragmented contigs [41,42,43]. As one of the vital factors for achieving a good assembly is the read length, the advent of long-read technologies such as Pacific Biosciences’ Isoform Sequencing could help in improving the contiguity of de novo transcriptome assemblies [44,45].
The transcriptome will be useful for the annotation of the genome, and can also be utilized for gene expression studies through the design of microarrays, as we have done for the Asian seabass [46], or by means of RNA-seq experiments [9,47,48]. In these RNA-seq studies, the transcriptome served as a reference for read mapping and quantification of differential expression.

5. Conclusions

In conclusion, we have sequenced and de novo assembled the transcriptome of Asian seabass, a commercially important food fish species. The annotation and various analyses reported here illustrate the useful information that can be derived from a transcriptome. Additionally, we identified full-length cDNA sequences and inventoried microsatellite information. As a supplement to our study, we have provided our observations from the various approaches taken towards sequencing the transcriptome, as well as several recommendations for non-genomics labs intending to study the transcriptome of any species of interest. On the whole, the present study provides a comprehensive inventory of the Asian seabass transcriptome which will be useful for the development of molecular tools to be used in aquaculture of the species as well as to serve as an important resource for genome annotation.

Supplementary Materials

Supplementary File 1

Acknowledgments

This research is supported by the National Research Foundation, Prime Minister’s Office, Singapore under its Competitive Research Program (CRP Award No. NRF-CRP7-2010-01).

Author Contributions

All co-authors contributed to the planning of the project. L.O. supervised, whereas J.J., S.V. and L.O. coordinated the work. J.J., J.M.S., P.K., H.Y.K. and S.Y.N. performed the sample collections and RNA extractions for RNA-Seq; A.T. performed the Illumina HiSeq library preparations and sequencing; N.M.T. and P.S.R.S. assembled the transcriptome, performed the data analysis and prepared the manuscript. S.V., W.C.L., I.S.K., X.S. and L.O. took part in discussions regarding the analyses. L.O., S.L. and S.V. reviewed and edited the manuscript.

Conflicts of Interest

The authors declare no conflict of interest.

References

  1. Vij, S.; Kathiresan, P.; Gopikrishna, G.; Lau, D.; Saju, J.; Shamsudheen, K.V.; Vinaya Kumar, K.; Basheer, V.S.; Gopalakrishnan, A.; Hossain, M.S.; et al. Barcoding of Asian seabass across its geographic range provides evidence for its bifurcation into two distinct species. Front. Mar. Sci. 2014, 1, 30. [Google Scholar] [CrossRef]
  2. Moore, R. Spawning and early life history of burramundi, Lates calcarifer (Bloch), in Papua New Guinea. Mar. Freshw. Res. 1982, 33, 647–661. [Google Scholar] [CrossRef]
  3. Guiguen, Y.; Cauty, C.; Fostier, A.; Fuchs, J.; Jalabert, B. Reproductive cycle and sex inversion of the seabass, Lates calcarifer, reared in sea cages in French Polynesia: Histological and morphometric description. Environ. Biol. Fish. 1994, 39, 231–247. [Google Scholar] [CrossRef]
  4. Moore, R. Natural sex inversion in the giant perch (Lates calcarifer). Mar. Freshw. Res. 1979, 30, 803–813. [Google Scholar] [CrossRef]
  5. Asian seabass Sequencing Consortium. The Asian seabass (Lates calcarifer) sequencing project. Manuscript in preparation. 2015. [Google Scholar]
  6. Lin, G.; Lo, L.C.; Zhu, Z.Y.; Feng, F.; Chou, R.; Yue, G.H. The complete mitochondrial genome sequence and characterization of single-nucleotide polymorphisms in the control region of the Asian seabass (Lates calcarifer). Mar. Biotechnol. (N.Y.) 2006, 8, 71–79. [Google Scholar] [CrossRef] [PubMed]
  7. Kuznetsova, I.S.; Thevasagayam, N.M.; Sridatta, P.S.; Komissarov, A.S.; Saju, J.M.; Ngoh, S.Y.; Jiang, J.; Shen, X.; Orban, L. Primary analysis of repeat elements of the Asian seabass (Lates calcarifer) transcriptome and genome. Front. Genet. 2014, 5, 223. [Google Scholar] [CrossRef] [PubMed]
  8. Ravi, P.; Jiang, J.; Liew, W.C.; Orban, L. Small-scale transcriptomics reveals differences among gonadal stages in Asian seabass (Lates calcarifer). Reprod. Biol. Endocrinol. 2014, 12, 5. [Google Scholar] [CrossRef] [PubMed]
  9. Xia, J.H.; Liu, P.; Liu, F.; Lin, G.; Sun, F.; Tu, R.; Yue, G.H. Analysis of stress-responsive transcriptome in the intestine of Asian seabass (Lates calcarifer) using RNA-seq. DNA Res. 2013, 20, 449–460. [Google Scholar] [CrossRef] [PubMed]
  10. Wang, S.; Furmanek, T.; Kryvi, H.; Krossoy, C.; Totland, G.; Grotmol, S.; Wargelius, A. Transcriptome sequencing of Atlantic salmon (Salmo salar L.) notochord prior to development of the vertebrae provides clues to regulation of positional fate, chordoblast lineage and mineralisation. BMC Genomics 2014, 15, 141. [Google Scholar] [CrossRef] [PubMed] [Green Version]
  11. Ji, P.; Liu, G.; Xu, J.; Wang, X.; Li, J.; Zhao, Z.; Zhang, X.; Zhang, Y.; Xu, P.; Sun, X. Characterization of common carp transcriptome: Sequencing, de novo assembly, annotation and comparative genomics. PLoS ONE 2012, 7, e35152. [Google Scholar] [CrossRef] [PubMed]
  12. Magnanou, E.; Klopp, C.; Noirot, C.; Besseau, L.; Falcón, J. Generation and characterization of the sea bass Dicentrarchus labrax brain and liver transcriptomes. Gene 2014, 544, 56–66. [Google Scholar] [CrossRef] [PubMed]
  13. Kaitetzidou, E.; Xiang, J.; Antonopoulou, E.; Tsigenopoulos, C.S.; Sarropoulou, E. Dynamics of gene expression patterns during early development of the European Sea Bass (Dicentrarchus labrax). Physiol. Genomics 2015, 47, 158–169. [Google Scholar] [CrossRef] [PubMed]
  14. Salem, M.; Rexroad, C.; Wang, J.; Thorgaard, G.; Yao, J. Characterization of the rainbow trout transcriptome using Sanger and 454-pyrosequencing approaches. BMC Genomics 2010, 11, 564. [Google Scholar] [CrossRef] [PubMed]
  15. Pereiro, P.; Balseiro, P.; Romero, A.; Dios, S.; Forn-Cuni, G.; Fuste, B.; Planas, J.V.; Beltran, S.; Novoa, B.; Figueras, A. High-throughput sequence analysis of turbot (Scophthalmus maximus) transcriptome using 454-pyrosequencing for the discovery of antiviral immune genes. PLoS ONE 2012, 7, e35369. [Google Scholar] [CrossRef] [PubMed] [Green Version]
  16. Reading, B.; Chapman, R.; Schaff, J.; Scholl, E.; Opperman, C.; Sullivan, C. An ovary transcriptome for all maturational stages of the striped bass (Morone saxatilis), a highly advanced perciform fish. BMC Res. Notes 2012, 5, 111. [Google Scholar] [CrossRef] [PubMed]
  17. Parkhomchuk, D.; Borodina, T.; Amstislavskiy, V.; Banaru, M.; Hallen, L.; Krobitsch, S.; Lehrach, H.; Soldatov, A. Transcriptome analysis by strand-specific sequencing of complementary DNA. Nucleic Acids Res. 2009, 37, e123. [Google Scholar] [CrossRef] [PubMed]
  18. PRINSEQ. PReprocessing and INformation of SEQuence data. Available online: http://prinseq.sourceforge.net/ (accessed on 12 May 2013).
  19. Quast, C.; Pruesse, E.; Yilmaz, P.; Gerken, J.; Schweer, T.; Yarza, P.; Peplies, J.; Glockner, F.O. The SILVA ribosomal RNA gene database project: Improved data processing and web-based tools. Nucleic Acids Res. 2013, 41, D590–D596. [Google Scholar] [CrossRef] [PubMed]
  20. Bowtie: An ultrafast memory-efficient short read aligner. Available online: http://bowtie-bio.sourceforge.net/index.shtml (accessed on 12 May 2013).
  21. Asian seabass (Lates calcarifer) Transcriptome Project. Available online: http://laszlo.tll.org.sg/asb_transcriptome/ (accessed on 8 May 2015).
  22. Scripts: Average_GC_Content_Analysis. Available online: https://github.com/ramadatta/Scripts/tree/master/Average_GC_Content_Analysis (accessed on 29 January 2015).
  23. Stanke, M.; Morgenstern, B. AUGUSTUS: A web server for gene prediction in eukaryotes that allows user-defined constraints. Nucleic Acids Res. 2005, 33, W465–W467. [Google Scholar] [CrossRef] [PubMed]
  24. Full-LengtherNEXT (0.0.8). Available online: https://www.omniref.com/ruby/gems/full_lengther_next/0.0.8 (accessed on 20 March 2014).
  25. Tine, M.; Kuhl, H.; Gagnaire, P.A.; Louro, B.; Desmarais, E.; Martins, R.S.; Hecht, J.; Knaust, F.; Belkhir, K.; Klages, S.; et al. European sea bass genome and its variation provide insights into adaptation to euryhalinity and speciation. Nat. Commun. 2014, 5, 5770. [Google Scholar] [CrossRef] [PubMed]
  26. Moriya, Y.; Itoh, M.; Okuda, S.; Yoshizawa, A.C.; Kanehisa, M. KAAS: An automatic genome annotation and pathway reconstruction server. Nucleic Acids Res. 2007, 35, W182–W185. [Google Scholar] [CrossRef] [PubMed]
  27. Scripts—KEGG_KAAS_Table. Available online: https://github.com/ramadatta/Scripts/tree/master/KEGG_KAAS_Table (accessed on 29 January 2015).
  28. Liao, X.; Cheng, L.; Xu, P.; Lu, G.; Wachholtz, M.; Sun, X.; Chen, S. Transcriptome analysis of crucian carp (Carassius auratus), an important aquaculture and hypoxia-tolerant species. PLoS ONE 2013, 8, e62308. [Google Scholar] [CrossRef] [PubMed]
  29. Ensembl Biomart. Available online: http://www.ensembl.org/biomart/martview (accessed on 30 April 2015).
  30. Jiang, J. Functional Genomic Analysis of Gonad Development in the Protandrous Asian Seabass. Ph.D. Thesis, National University of Singapore, Singapore, 2014. [Google Scholar]
  31. Sreenivasan, R.; Jiang, J.; Wang, X.; Bártfai, R.; Kwan, H.Y.; Christoffels, A.; Orbán, L. Gonad differentiation in zebrafish is regulated by the canonical wnt signaling pathway. Biol. Reprod. 2014, 90, 45. [Google Scholar] [CrossRef] [PubMed]
  32. Klüver, N.; Herpin, A.; Braasch, I.; Drieβle, J.; Schartl, M. Regulatory back-up circuit of medaka Wt1 co-orthologs ensures PGC maintenance. Dev. Biol. 2009, 325, 179–188. [Google Scholar] [CrossRef] [PubMed]
  33. Zhou, L.-Y.; Wang, D.-S.; Kobayashi, T.; Yano, A.; Paul-Prasanth, B.; Suzuki, A.; Sakai, F.; Nagahama, Y. A novel type of P450c17 lacking the lyase activity is responsible for C21-steroid biosynthesis in the fish ovary and head kidney. Endocrinology 2007, 148, 4282–4291. [Google Scholar] [CrossRef] [PubMed]
  34. Tzung, K.-W.; Goto, R.; Saju, J.M.; Sreenivasan, R.; Saito, T.; Arai, K.; Yamaha, E.; Hossain, M.S.; Calvert, M.E.; Orbán, L. Early depletion of primordial germ cells in zebrafish promotes testis formation. Stem Cell Rep. 2015, 4, 61–73. [Google Scholar] [CrossRef] [PubMed]
  35. Bang, M.L.; Centner, T.; Fornoff, F.; Geach, A.J.; Gotthardt, M.; McNabb, M.; Witt, C.C.; Labeit, D.; Gregorio, C.C.; Granzier, H.; et al. The complete gene sequence of titin, expression of an unusual approximately 700-kDa titin isoform, and its interaction with obscurin identify a novel Z-line to I-band linking system. Circ. Res. 2001, 89, 1065–1072. [Google Scholar] [CrossRef] [PubMed]
  36. Xu, J.; Ji, P.; Wang, B.; Zhao, L.; Wang, J.; Zhao, Z.; Zhang, Y.; Li, J.; Xu, P.; Sun, X. Transcriptome sequencing and analysis of wild Amur Ide (Leuciscus waleckii) inhabiting an extreme alkaline-saline lake reveals insights into stress adaptation. PLoS ONE 2013, 8, e59703. [Google Scholar] [CrossRef] [PubMed]
  37. Martin, J.A.; Wang, Z. Next-generation transcriptome assembly. Nat. Rev. Genet. 2011, 12, 671–682. [Google Scholar] [CrossRef] [PubMed]
  38. Wolf, J.B. Principles of transcriptome analysis and gene expression quantification: An RNA-seq tutorial. Mol. Ecol. Resour. 2013, 13, 559–572. [Google Scholar] [CrossRef] [PubMed]
  39. O’Neil, S.T.; Emrich, S.J. Assessing de novo transcriptome assembly metrics for consistency and utility. BMC Genomics 2013, 14, 465. [Google Scholar] [CrossRef] [PubMed]
  40. DeWoody, J.A.; Abts, K.C.; Fahey, A.L.; Ji, Y.; Kimble, S.J.; Marra, N.J.; Wijayawardena, B.K.; Willoughby, J.R. Of contigs and quagmires: Next-generation sequencing pitfalls associated with transcriptomic studies. Mol. Ecol. Resour. 2013, 13, 551–558. [Google Scholar] [CrossRef] [PubMed]
  41. Liu, S.; Zhang, Y.; Zhou, Z.; Waldbieser, G.; Sun, F.; Lu, J.; Zhang, J.; Jiang, Y.; Zhang, H.; Wang, X.; et al. Efficient assembly and annotation of the transcriptome of catfish by RNA-Seq analysis of a doubled haploid homozygote. BMC Genomics 2012, 13, 595. [Google Scholar] [CrossRef] [PubMed]
  42. Moghadam, H.K.; Harrison, P.W.; Zachar, G.; Szekely, T.; Mank, J.E. The plover neurotranscriptome assembly: Transcriptomic analysis in an ecological model species without a reference genome. Mol. Ecol. Resour. 2013, 13, 696–705. [Google Scholar] [CrossRef] [PubMed]
  43. Wang, W.; Hui, J.H.; Chan, T.F.; Chu, K.H. De novo transcriptome sequencing of the snail Echinolittorina malaccana: Identification of genes responsive to thermal stress and development of genetic markers for population studies. Mar. Biotechnol. (N.Y.) 2014, 16, 547–559. [Google Scholar] [CrossRef] [PubMed]
  44. Au, K.F.; Sebastiano, V.; Afshar, P.T.; Durruthy, J.D.; Lee, L.; Williams, B.A.; van Bakel, H.; Schadt, E.E.; Reijo-Pera, R.A.; Underwood, J.G.; et al. Characterization of the human ESC transcriptome by hybrid sequencing. Proc. Natl. Acad. Sci. USA 2013, 110, E4821–E4830. [Google Scholar] [CrossRef] [PubMed]
  45. Chang, Z.; Wang, Z.; Li, G. The impacts of read length and transcriptome complexity for de novo assembly: A simulation study. PLoS ONE 2014, 9, e94825. [Google Scholar] [CrossRef] [PubMed]
  46. Jiang, J.; Miyata, M.; Chan, C.; Ngoh, S.Y.; Liew, W.C.; Saju, J.M.; Ng, K.S.; Wong, F.S.; Lee, Y.S.; Chang, S.F.; et al. Differential transcriptomic response in the spleen and head kidney following vaccination and infection of Asian seabass with Streptococcus iniae. PLoS ONE 2014, 9, e99128. [Google Scholar] [CrossRef] [PubMed]
  47. Smith, S.; Bernatchez, L.; Beheregaray, L.B. RNA-seq analysis reveals extensive transcriptional plasticity to temperature stress in a freshwater fish species. BMC Genomics 2013, 14, 375. [Google Scholar] [CrossRef] [PubMed]
  48. Uren Webster, T.M.; Bury, N.; van Aerle, R.; Santos, E.M. Global transcriptome profiling reveals molecular mechanisms of metal tolerance in a chronically exposed wild population of brown trout. Environ. Sci. Technol. 2013, 47, 8869–8877. [Google Scholar] [CrossRef] [PubMed]

