3.1. Interpretation of Time Averaged Radar Images
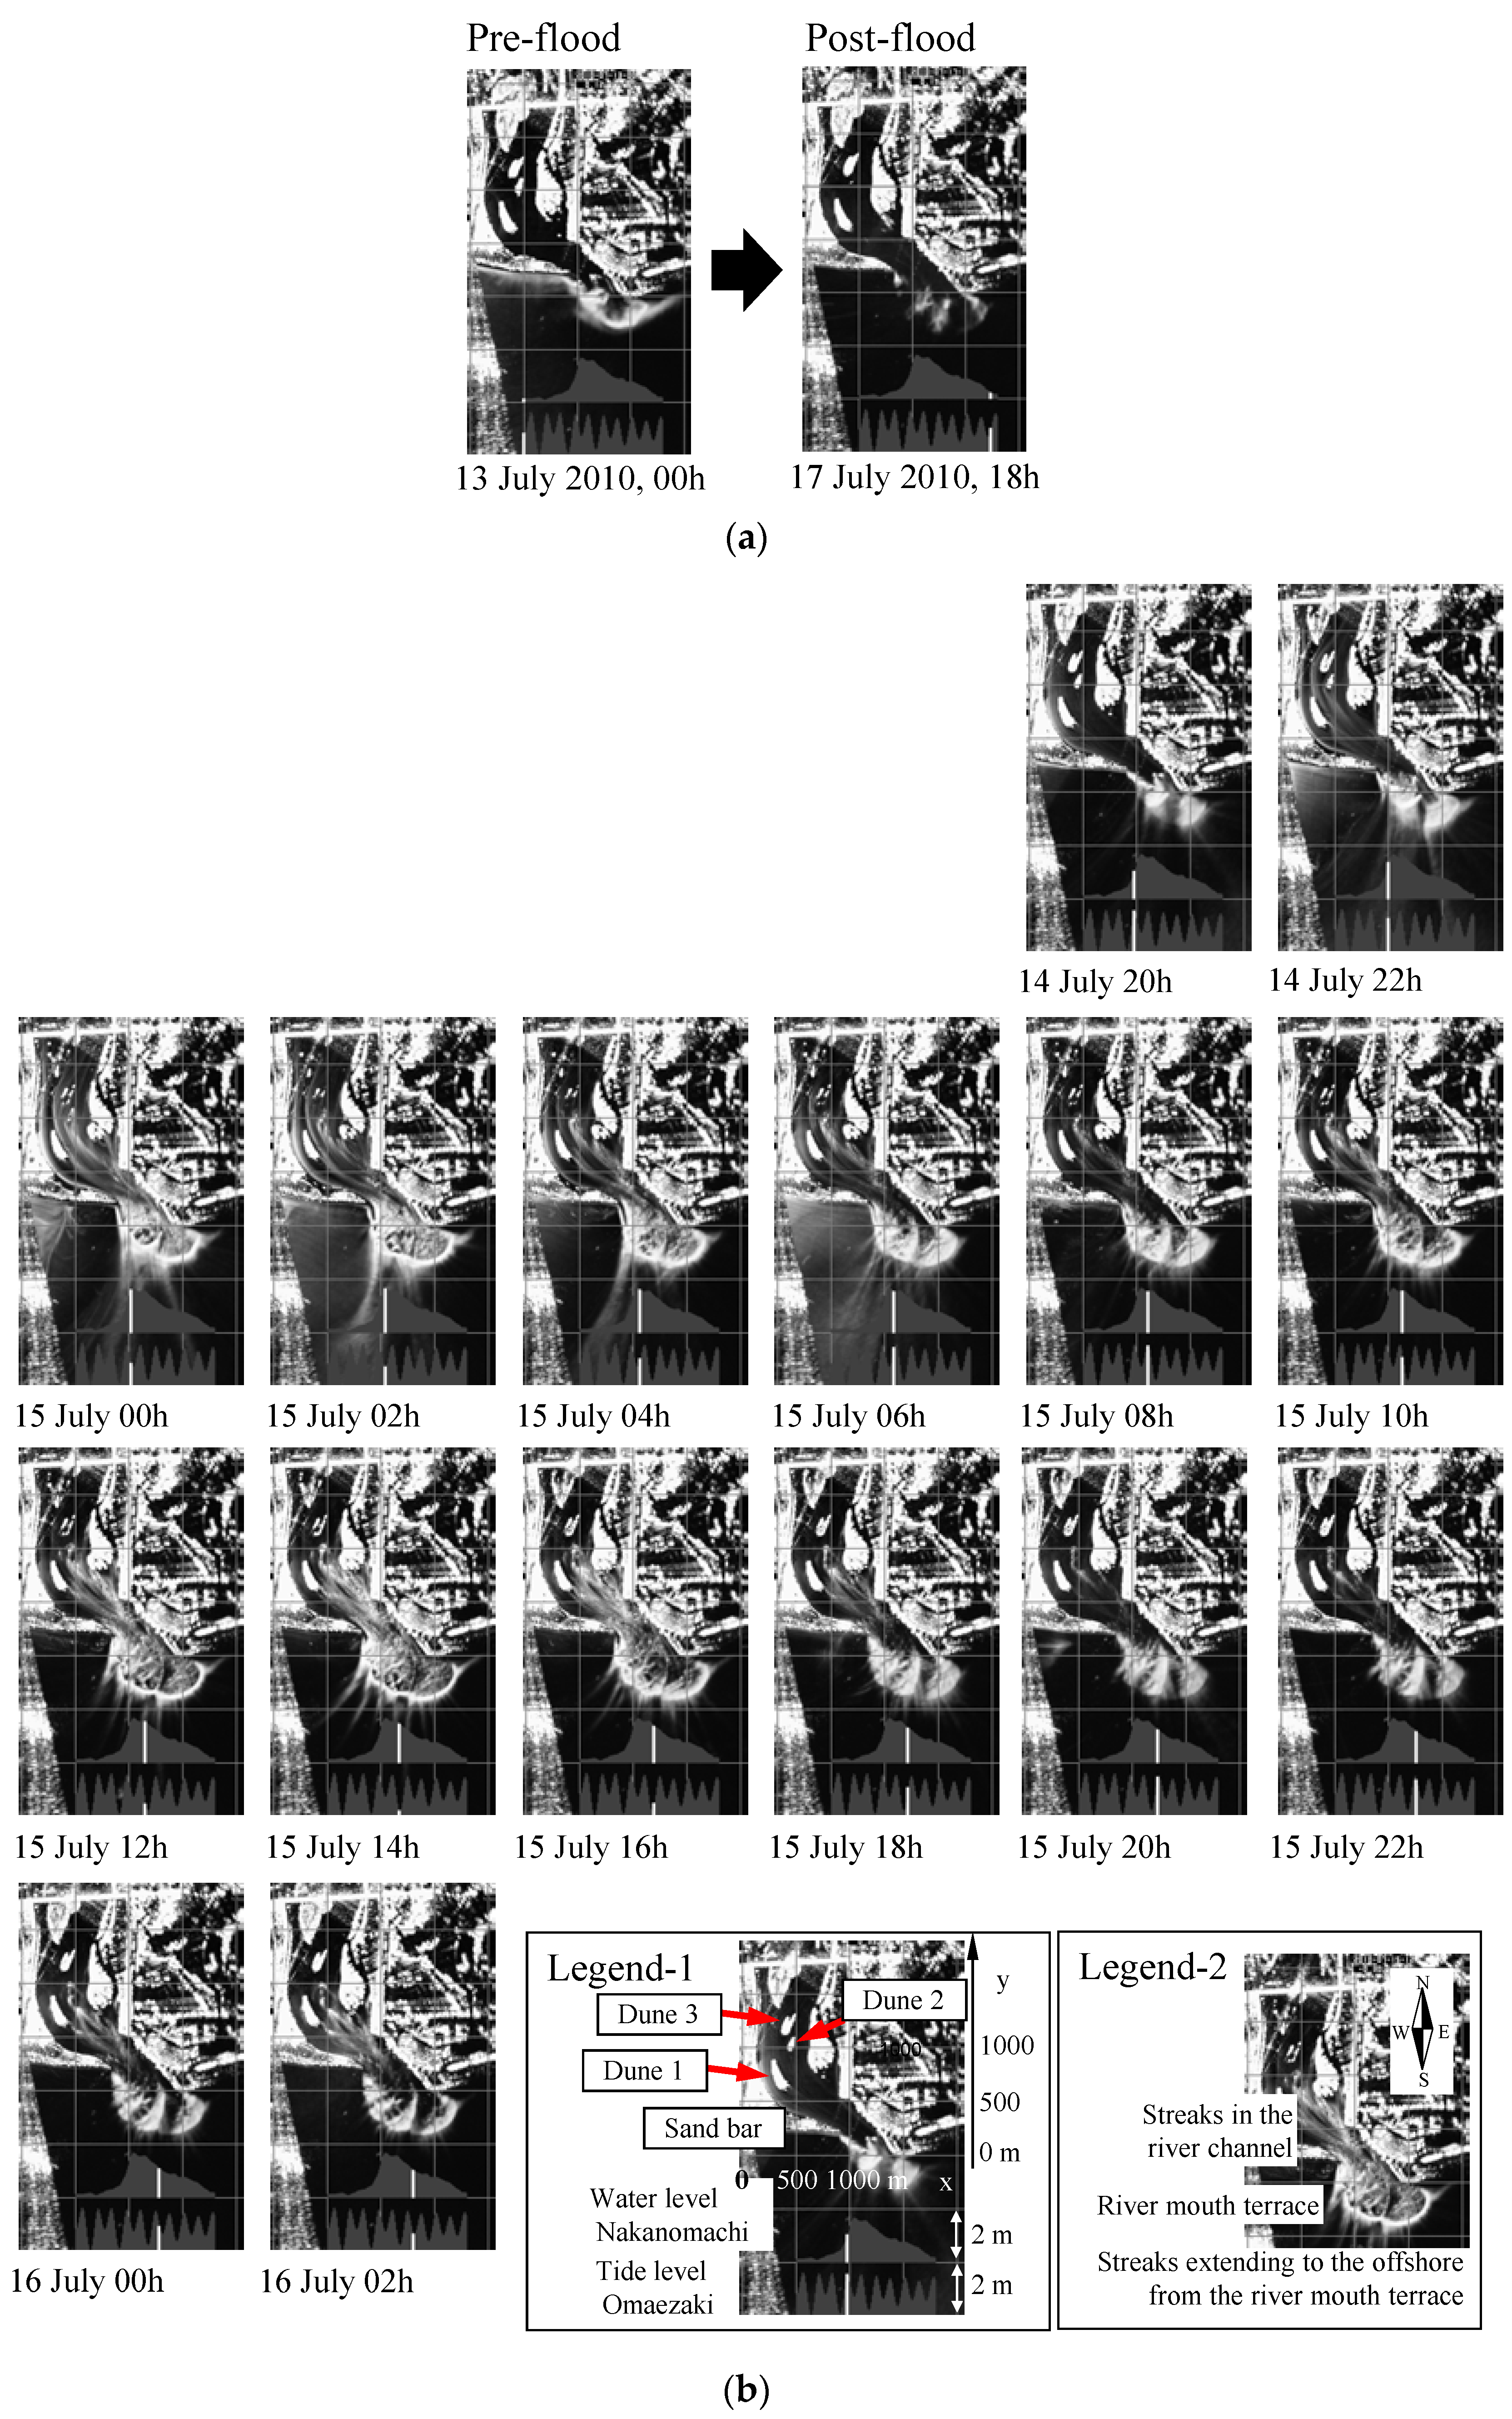
Figure 3a shows the time-averaged radar images for pre- and post- flooding, and
Figure 3b for even hours during the flood when the river discharge exceeded 3000 m
3/s for 30 h. The lower portion of each image shows the water level variations measured at the Nakanomachi station in the river and the Omaezaki tide level station. The white vertical line in this lower portion denotes the temporal position in the radar acquisition. As shown in Legends 1 and 2, dunes in the river are named ‘Dunes 1, 2, and 3’ in sequence from the river mouth, dunes extending from east to west at the river mouth are labeled ‘Sand bar’, and a fan-shaped deposition at the river mouth is designated ‘River mouth terrace’. An animation processed from the time-averaged radar image has been uploaded to YouTube [
8] and the results of image interpretation at different stages during the flood are summarized in
Table 1.
Comparing pre- and post-flood time-averaged images shown in
Figure 3a, the major changes due to the flood are that dune 2 was totally washed away and the width of the river mouth was widened to approximately 100 m. The configuration of dunes 1 and 3 and the main portion of the sand bar remain almost the same, suggesting that the river channel is not easily erodible even by a 30 year-return-period flood going through the area.
3.2. Erosion of the Sand Bar during the Flood
The waterline, boundary between the land and water surface, can be identified from the time-averaged radar images by manual digitization [
3]. Based on empirical experiences, the distribution of pixel intensity shows an abrupt change at the waterline, higher brightness for the sand covered surface and darker for the water body. Using this empirical rule, the waterlines along the sand bar at different times have been identified from the time-averaged radar images by manual operation.
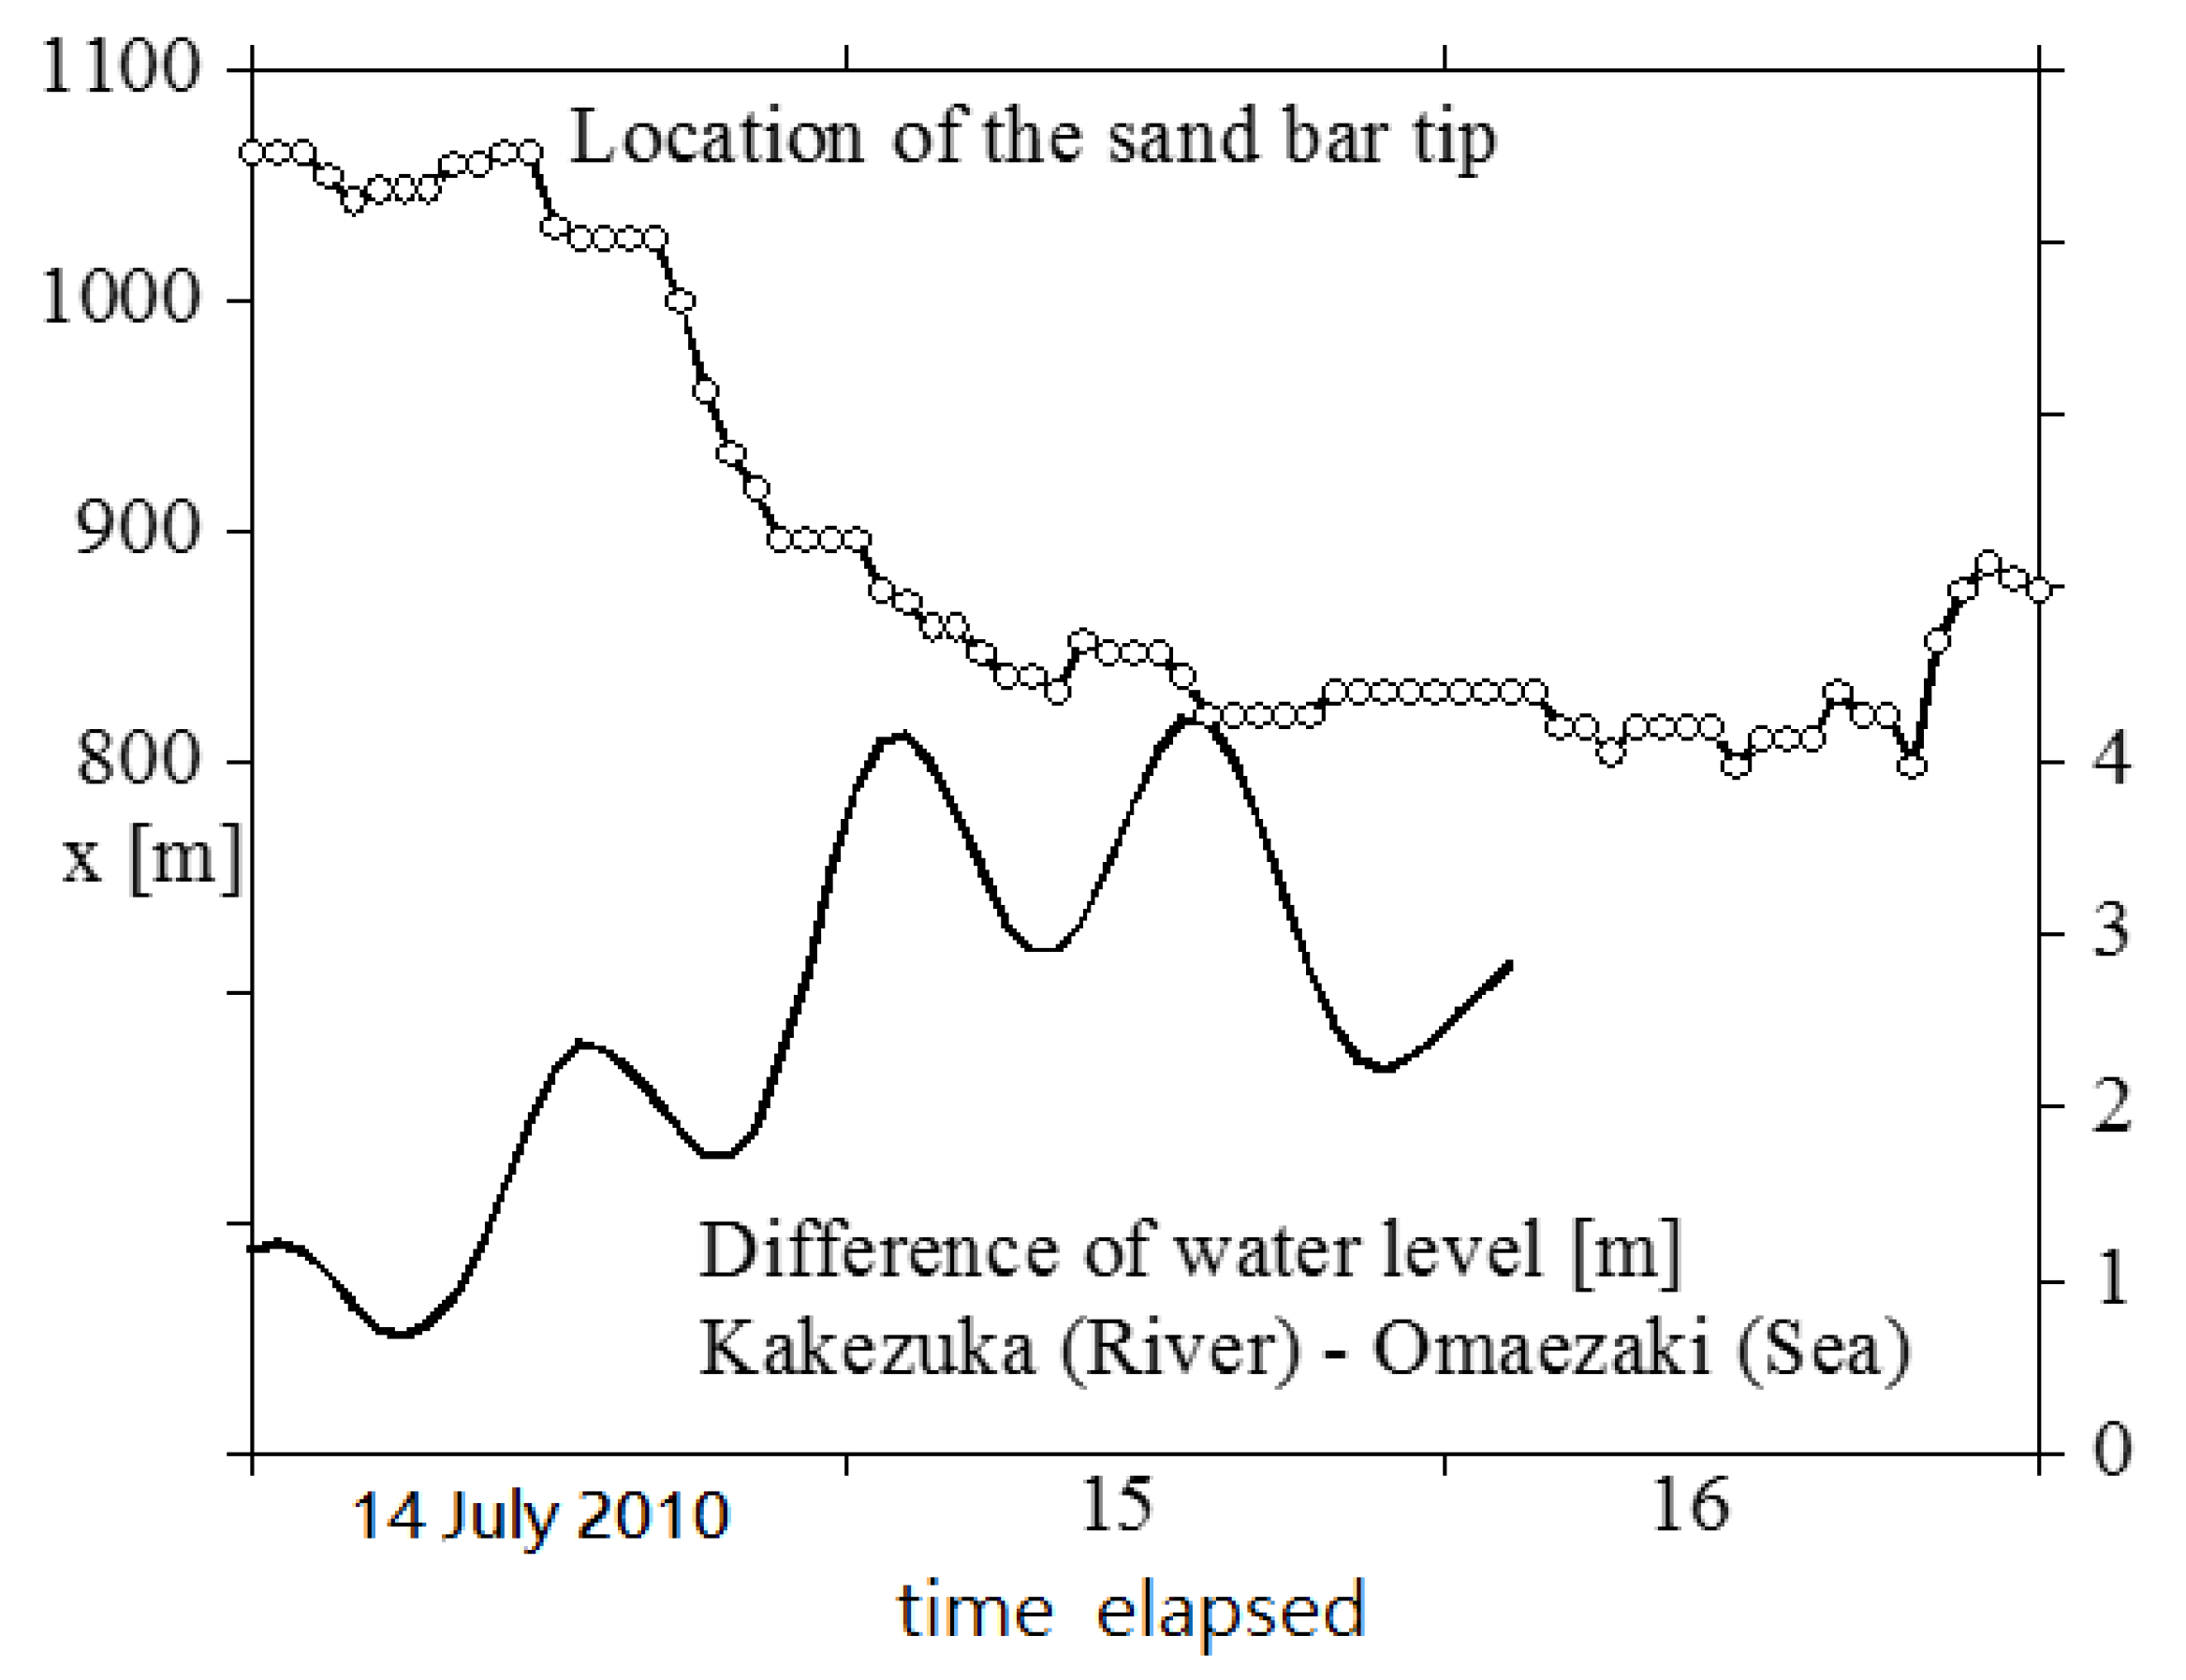
Figure 4 shows variation in the east-west position of the tip of the sand bar, with the water level difference between the river water level at the Kakezuka station and the tide level at the Omaezaki station. The variation in the water level difference may be regarded as a proxy of flow velocity change during the flood. The river mouth widened during the flood, as described in
Table 1, and this process can also be tracked from the display: when the difference in the water level between the river and sea starts to increase on 14 July 2010, the tip position begins to shift westwards, or erosion starts with a speed of approximately 25 m/h. After the water level difference reaches a maximum on 15 July 2010, the shifting and erosion of the tip of the sand bar has stopped. After this period, variation in the main channel becomes prominent, which will be described in the next section.
3.3. Migration Speeds of Radar Light-Dark Brightness Patterns along the Channel
Careful inspection of the sequence of time-averaged radar images and animation introduced above reveals that streaky light-dark patterns migrated downstream in the river channel, especially during the periods when the river water level was descending. As mentioned previously, these light-dark patterns are the result of strong backscattering from the water surface roughness, which becomes larger when the near surface flow is turbulent. The water flow may become turbulent in shallow areas, where active interaction between the water surface and river bottom occurs. Thus, we surmise that migrations of light-dark patterns are proxies of river bed variation during the flood. Unfortunately, exact determination of the origin of this light-dark pattern is difficult since no on-site measurement was done during the flood. To assess this speculation, migration speeds of the patterns were estimated by processing a time-stack image.
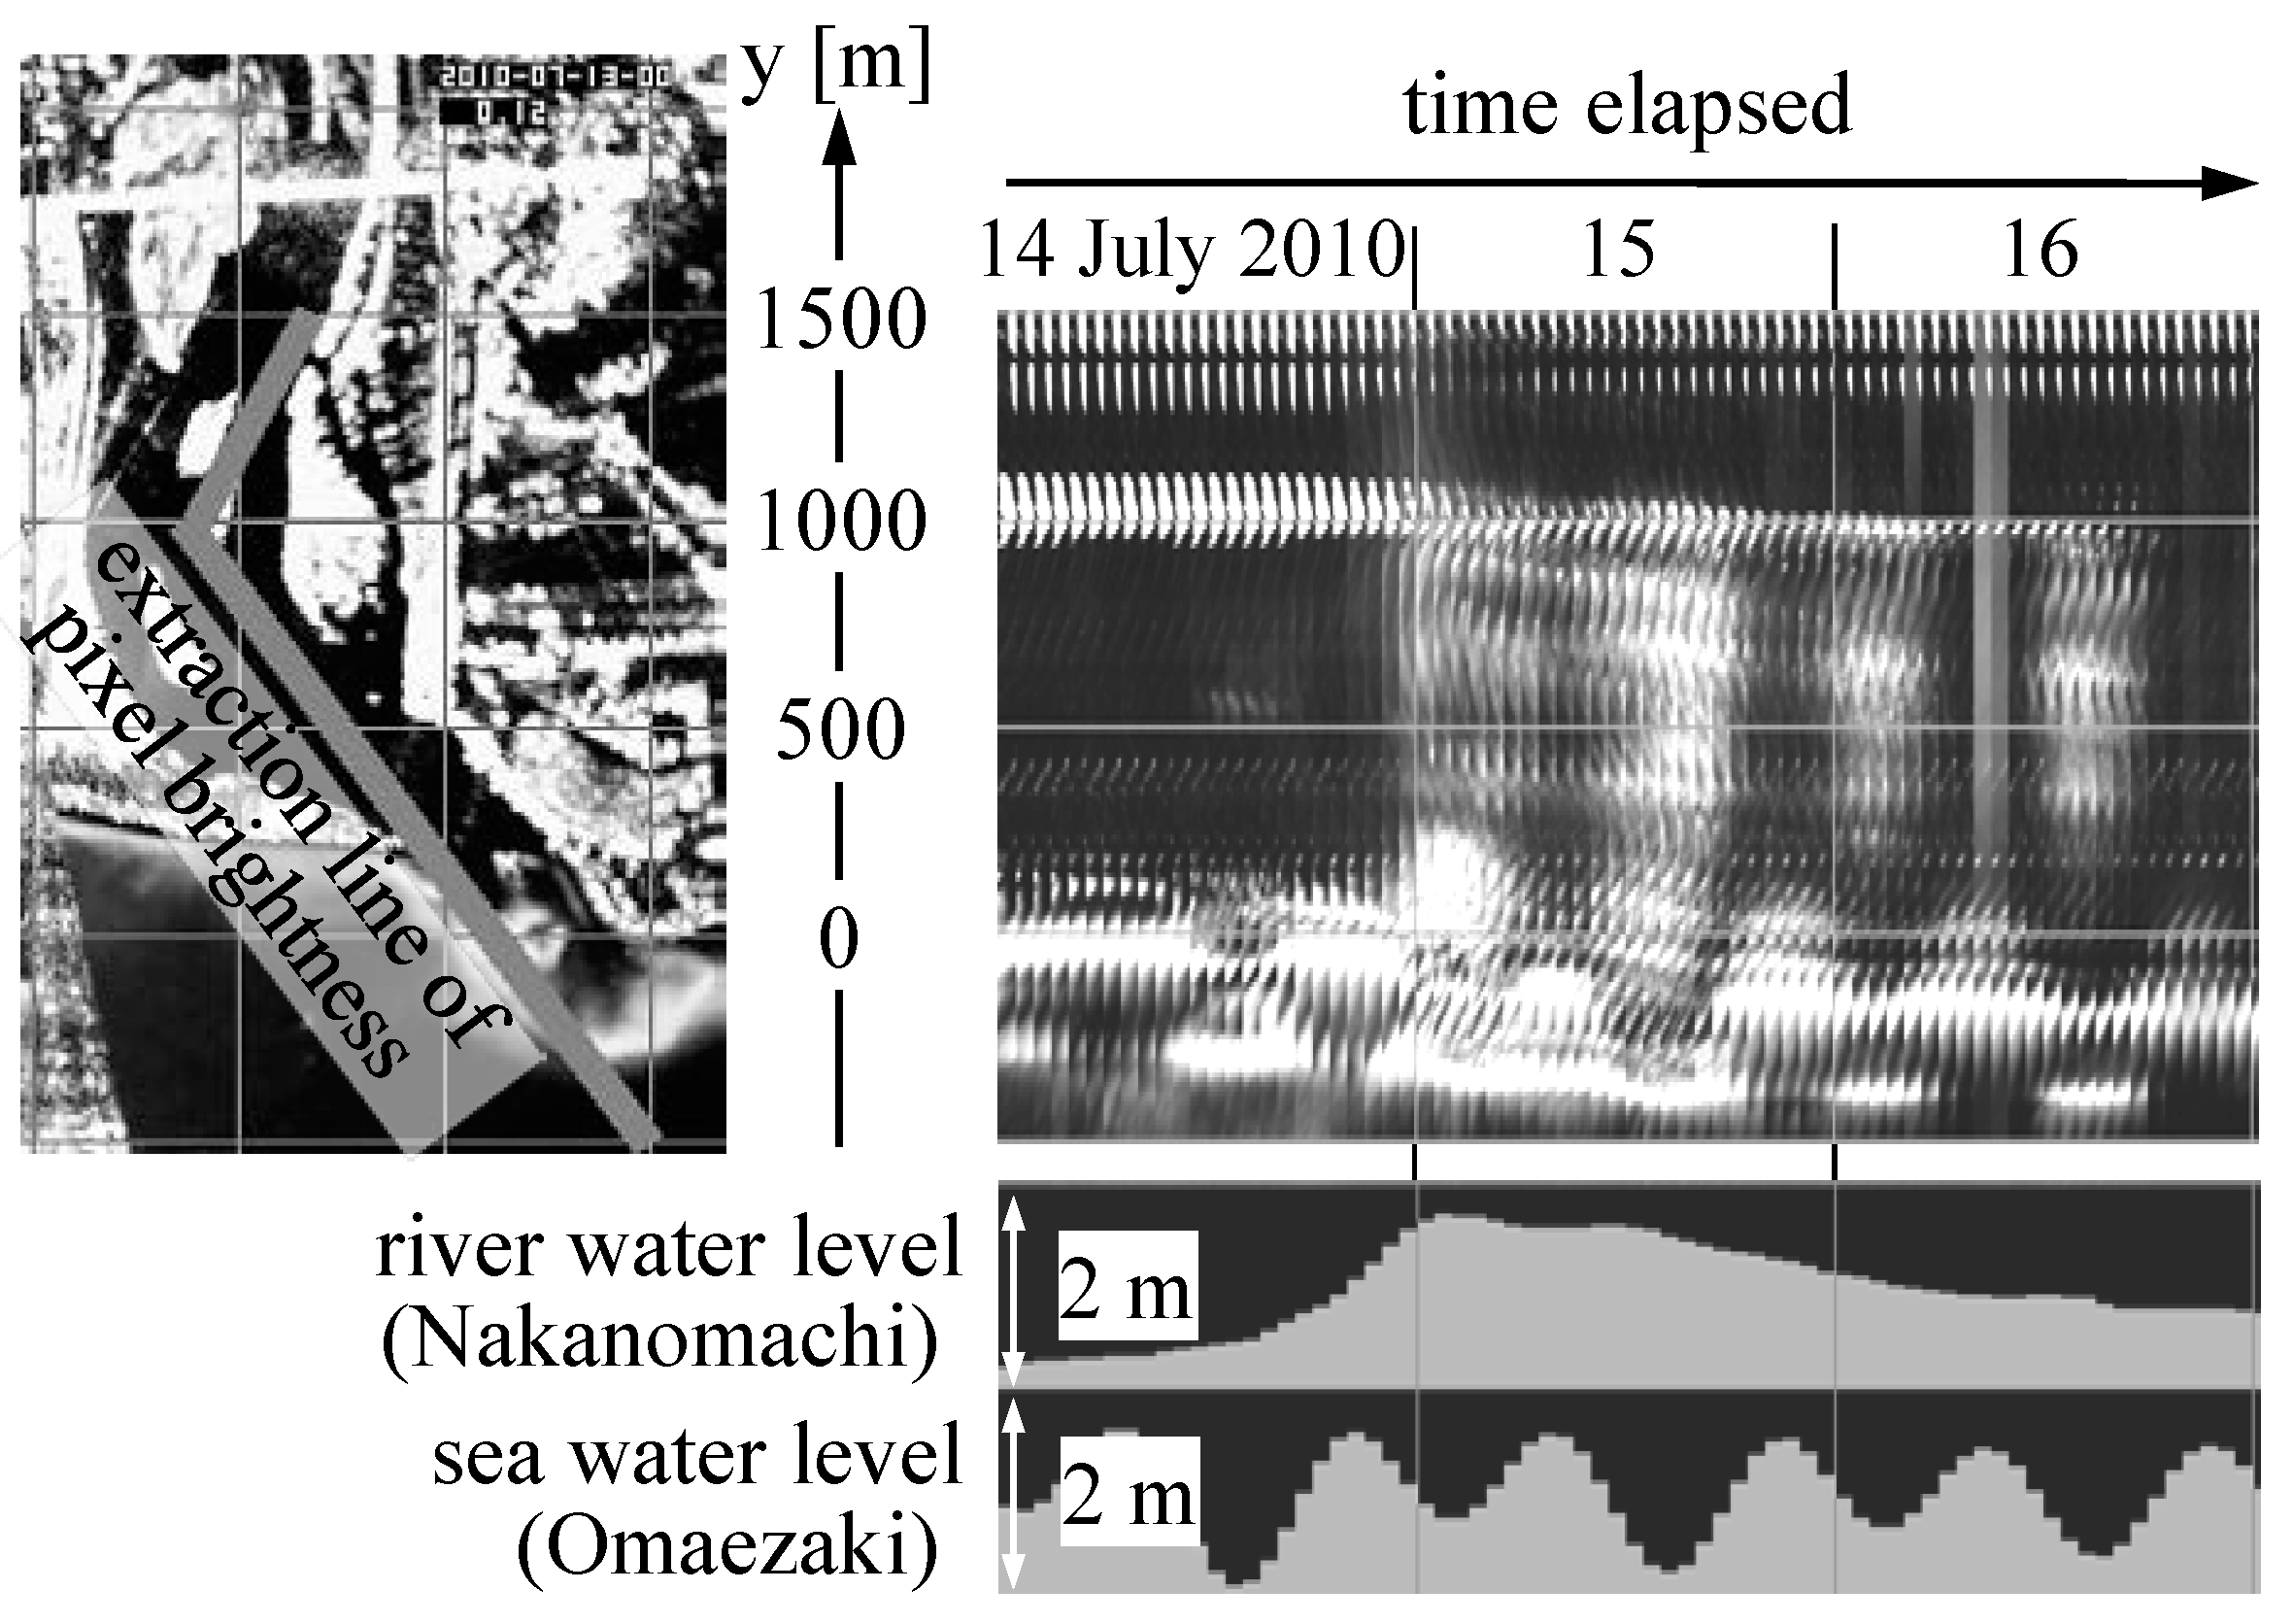
Figure 5 shows a time-averaged image on the left and a time stack image on the right. To obtain the time stack image, which has spatial extent in the vertical and temporal extent in the lateral, pixel intensities along the oblique grey bands shown in the time-averaged image, whose width in the lateral or east-west direction is 15 pixels or 81 m, were extracted and stacked in the vertical at specific times. This extraction was repeated for the following time-averaged images and stacking positions shifted in the lateral. In the lower right below the time stack image, the river water level variation measured at Nakanomachi and the tide level at Omaezaki are also shown.
In the time stack, oblique propagations towards the lower right can be seen, which indicate that light-dark patterns in the time-averaged image traveled in the down-flow along the extraction line. This becomes prominent for 15 and 16 July 2010 when the flood was decaying, especially during low tide. The local gradient of the oblique features seems to change with the water level variation.
A PIV (Particle Image Velocimetry)-like method was applied to detect local gradients of the oblique features in the time stack image [
9]. First, a 33 m or 6 pixel-long spatial template extending in the vertical in the times stack image was established at time
t0. Next, the most similar pattern was found at time
t0 + 1, by calculating the correlation coefficient, to estimate the hourly migration distance of the local light-dark pattern.
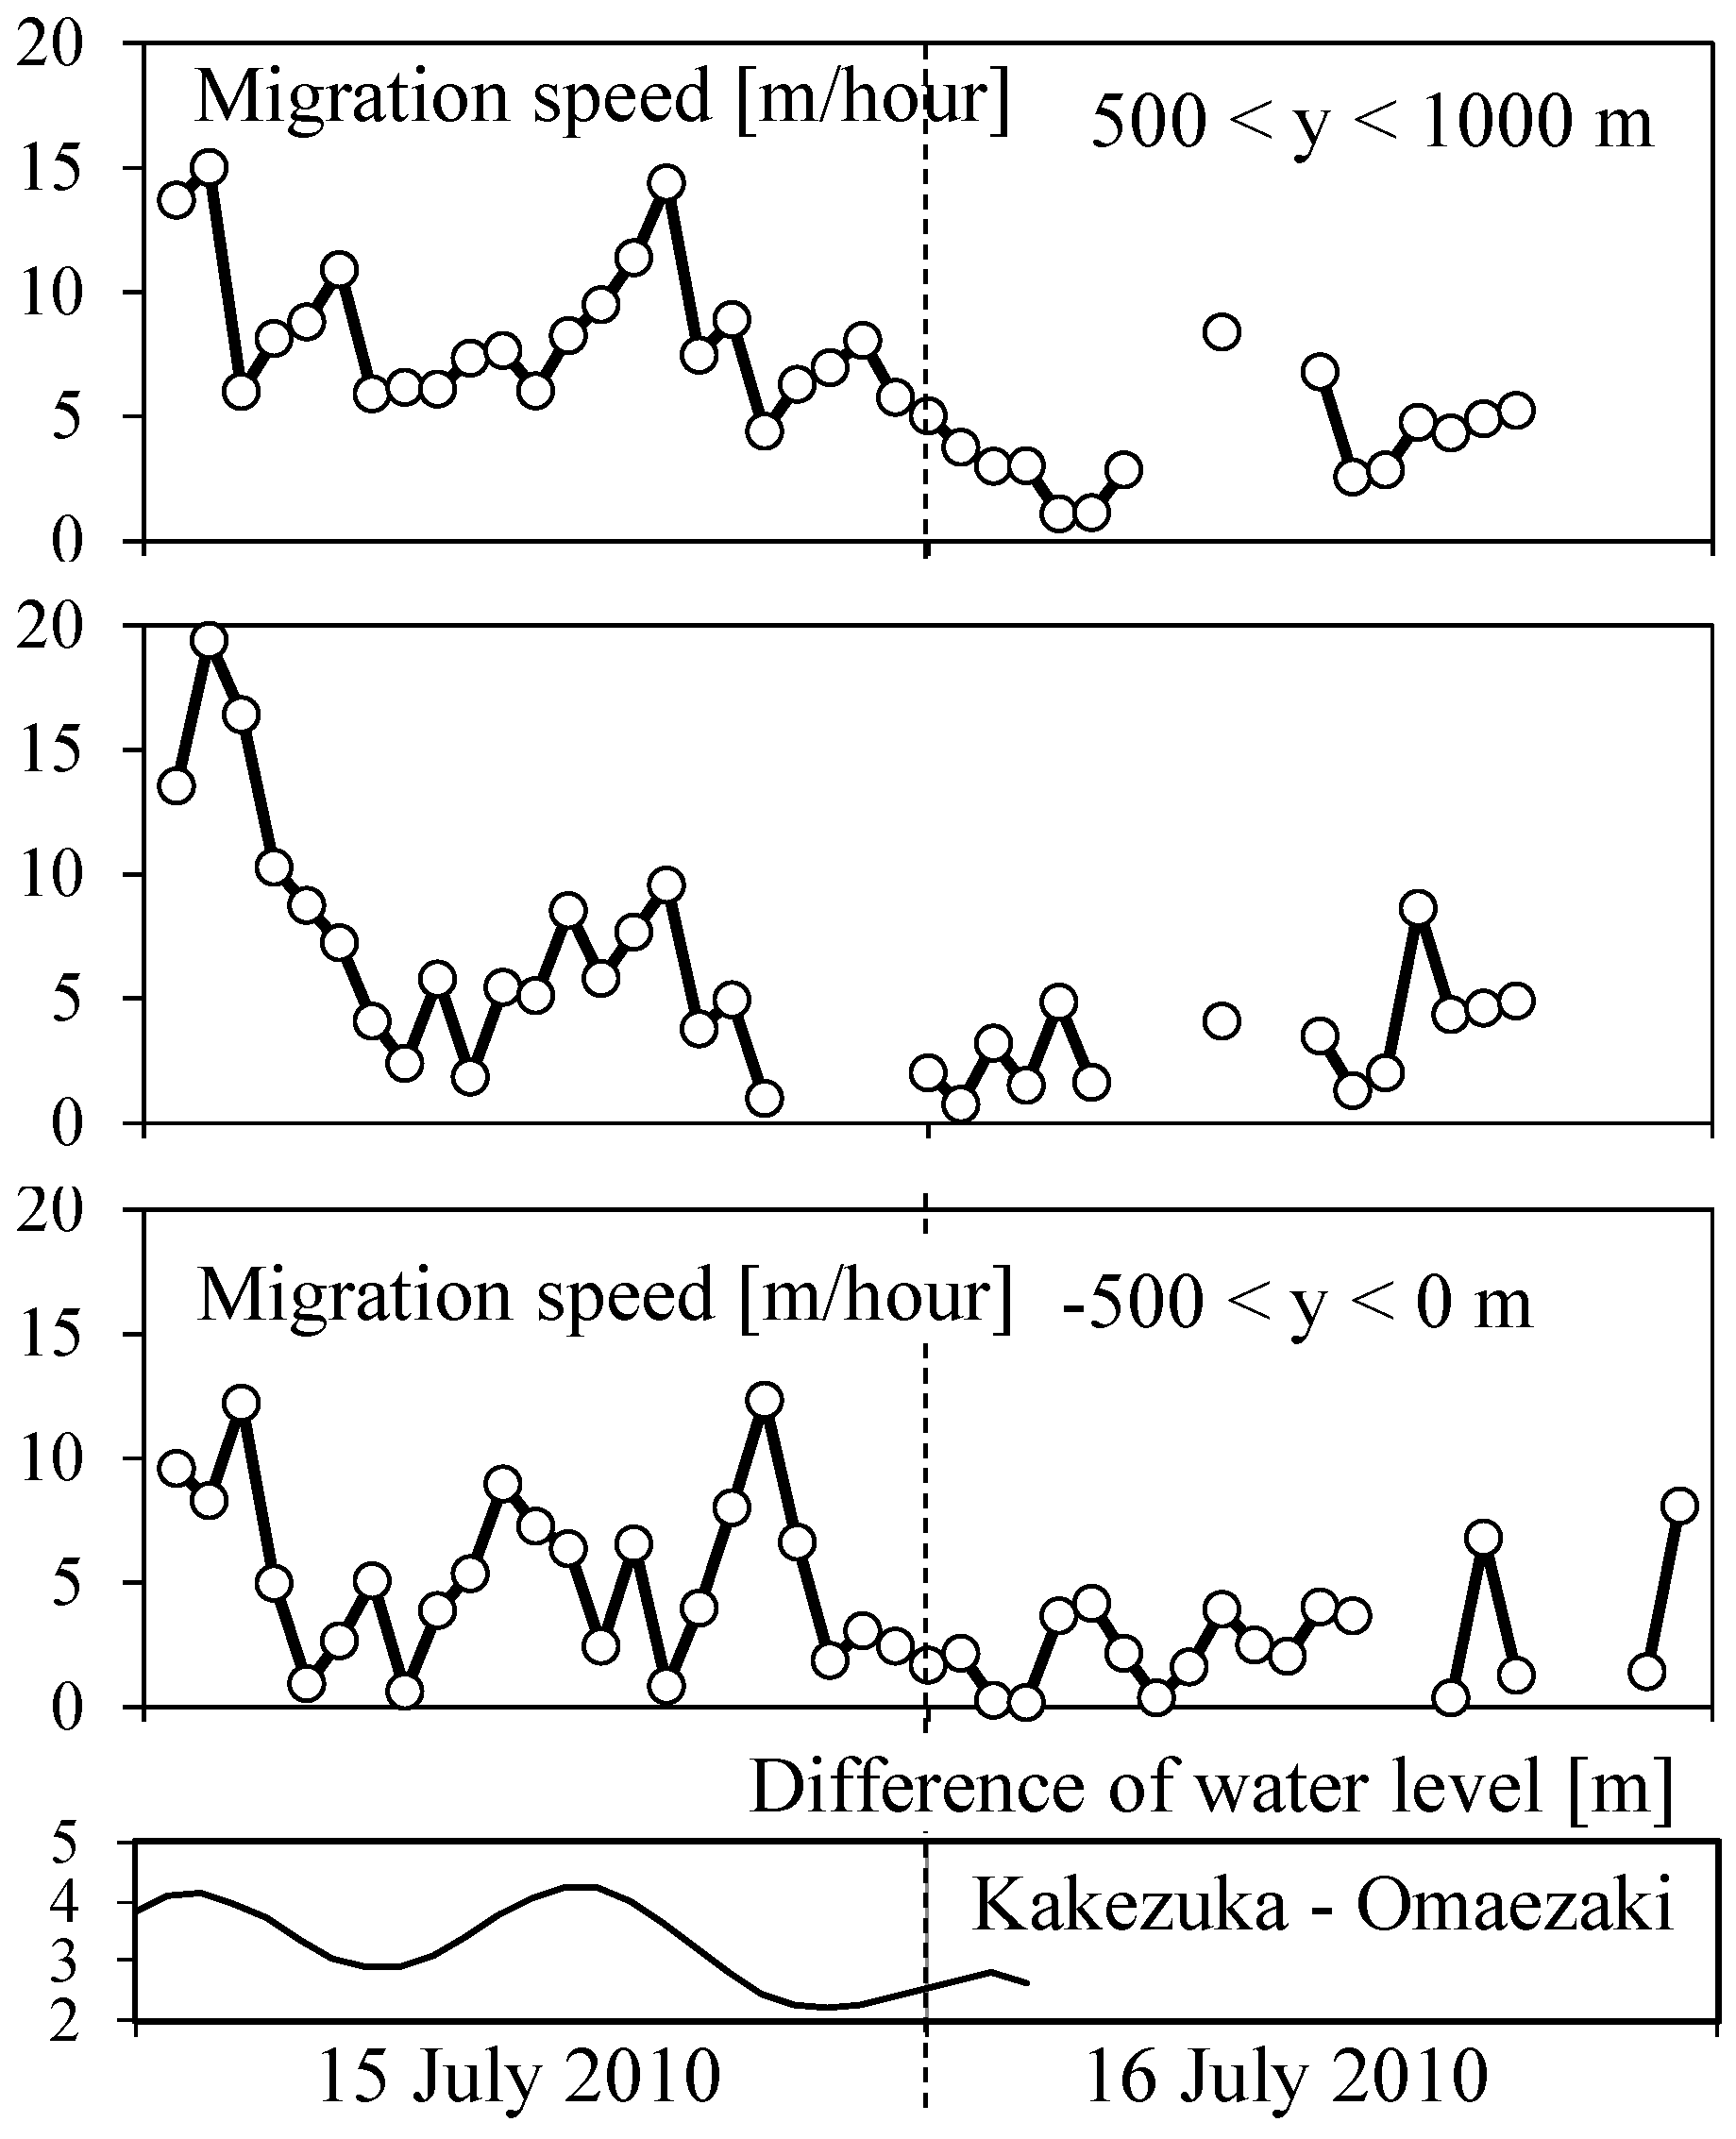
Figure 6 shows the variation of migration speeds averaged over 500 m in the north-south direction and the difference between the river water level at the Kakezuka station and the tide level at the Omaezaki station. Estimation at some times and locations, mostly when the tide level was high and rainy periods, are missing since the patterns were unclear to establish a correlation. We should notice that the velocity estimate here is a one-dimensional assessment: the estimated velocity is the migration speed of the light-dark pattern along the extraction line shown in
Figure 5. In other words, an assumption has been made that the light-dark pattern moves mainly along the extraction line.
Estimated migration speeds of the light-dark pattern were of the order of 10 m/h (~0.003 m/s) and varied in accordance with the water level gradient, which supports our speculation, or the proxy hypothesis, that light-dark patterns can be regarded as proxies of river bed variation during the flood.
Gaeuman and Jacobson [
10] made measurements on the change of bottom profiles in the Missouri River at a portion where the river width is several hundred meters. During brief water rises with flow rates of 5464 m
3/s, 4303 m
3/s, 4048 m
3/s, and 2831 m
3/s, they found migration speeds of the bed undulations were in the range of 1 to 6 m/h, which is of the same order as the results shown above. This further supports our proxy hypothesis.


