Article

Effects of Different Temperatures on the Softening of Red-Bed Sandstone in Turbulent Flow

1
School of Civil Engineering, Sun Yat-Sen University, Guangzhou 510275, China
2
Guangdong Engineering Research Centre for Major Infrastructures Safety, Guangzhou 510275, China
3
Research Center for Geotechnical Engineering and Information Technology, Sun Yat-Sen University, Guangzhou 510275, China
*
Author to whom correspondence should be addressed.
J. Mar. Sci. Eng. 2019, 7(10), 355; https://doi.org/10.3390/jmse7100355
Submission received: 29 August 2019 / Revised: 29 September 2019 / Accepted: 30 September 2019 / Published: 6 October 2019
(This article belongs to the Section Coastal Engineering)

Abstract

:
The rates of chemical reactions are highly dependent on temperature, meaning that the actual geological rock mass is affected by different temperatures. Only when the temperature effect is considered can the mechanism of the influence of temperature on the interaction between water and rock be further understood. It was found that the condition of turbulent flow is more likely to promote the softening of red-bed sandstone than the conditions of laminar flow and static water in an experimental study on the softening effects of different flow patterns on red-bed sandstone. Therefore, based on a multi-functional self-circulating open channel hydraulic test system, this paper designs and completes equal volume saturated tests of red-bed sandstone at low temperature (1 °C), medium temperature (23 °C), and high temperature (45 °C) under the turbulent conditions of three equal temperature gradients. The chemical action of the circulating solution in water flow at different temperatures, the propagation of micro-cracks in rock and the changes in mechanical indexes are discussed. The influence laws and mechanisms of the different temperatures on the softening of red-bed sandstone in turbulent flow are revealed. The results show that low-temperature flow can inhibit the softening of red-bed sandstone in the range of 1–45 °C. With the increase in water flow temperature, the development degrees of micro-structures and the mechanical damage of the corresponding rock become more notable. That is, temperature affects the physical and chemical water-rock interactions and then changes the internal structure of rock, thus affecting the softening and failure processes of red-bed sandstone. The study provides a theoretical basis for the further investigation of the softening laws and mechanisms of other red layered soft rocks by temperature under turbulent conditions.

1. Introduction

As a kind of special soft rock (that is, the rock whose strength characteristics and engineering forces conform to the parameters described in the literatures [1,2]) which is easy to soften and collapse in the event of water, it is often encountered in major engineering construction efforts, such as the Gezhouba hydraulic engineering project, the Three Gorges Reservoir area, and the South–North Water Transfer Project [3]. Many factors affect rock softening, including the temperature, confining pressure, porosity, and water content [4]. Currently, with the prominent problem of rock engineering in high-temperature environments, the influence of temperature on the mechanical properties of rock has become an important research direction. In the past, scholars mainly studied and summarized the influence of temperature on rock mechanics and physical and chemical properties through the direct action of temperature on the rock mass itself [5,6,7,8,9,10,11,12,13,14]. Among these studies, the studies of the rock elastic modulus, uniaxial compressive strength, and Poisson’s ratio with the temperature are the most prominent. For example, [15] studied the mechanical response of rock salt to a temperature rise and proposed that the compressive strengths of different types of rock salt decrease with increasing temperature. To a certain extent, with increasing temperature, the behavior of rock salt changes from showing brittleness to toughness. Reference [16], in a study of the effect of temperature on the engineering properties and fluid chemistry of chalk rocks containing opal, confirmed that in a brine-rock system, the temperature and original composition (mineralogy) are the active factors controlling chemical–mechanical interactions. Reference [17], based on the influence of temperature on the elastic constants of anisotropic rocks, found that an increase in temperature could lead to a decrease in the orthogonal constant. Reference [18] studied the thermal effects of temperature from 25 °C to 500 °C on the physical and mechanical properties (mass, density, porosity, longitudinal wave velocity, compressive strength, peak strain, modulus of elasticity) of rock. Reference [19] found that mineral dissolution and precipitation and the resulting porosity changes were related to temperature and pressure because the temperature and pressure affect the laws of mass action of the minerals and water-bearing substances involved in the equilibrium reaction. Reference [20] studied the effect of thermal damage on the physical properties, e.g., bulk density, P-wave velocity, effective porosity of carbonate rocks.
Scholars have formed a relatively perfect research theory on the variations in rock mechanical properties under the action of temperature in recent years. However, at present, most scholars only focus on the theoretical analysis of the temperature-induced damage to rock mechanics and various physical parameters, and ignore that the effect of temperature on the actual disaster processes of reservoir bank slopes, similar to those that have occurred in South China, is mainly based on the heat conduction of water indirectly affecting water-rock interactions. However, the disaster problems encountered in real riverbank slopes are often closely related to external factors. Previous studies have shown that the change in the environmental temperature is an important factor affecting the disintegration of red sandstone, and the increase in the temperature change can accelerate the process of the gradual disintegration of red sandstone [21].
Therefore, based on a multi-functional intelligent open channel hydraulic experimental system, saturated softening tests of red-bed sandstone in turbulent flow at different temperatures are carried out in this paper to study the physical, chemical, and mechanical laws of the influences of different temperatures on the softening of red-bed sandstone under dynamic water conditions. The study aims to further reveal the influences of different temperatures on the softening mechanism of red-bed sandstone in turbulent flow. The study can provide a certain theoretical reference for the analysis of the influence mechanism of a red-bed bank slope catastrophe.

2. Materials and Methods

2.1. Experimental Method

According to our preliminary research, the laboratory experimental study on the influences of different flow patterns on the softening of red-bed sandstone shows that different flow patterns have almost the same effect on electron surface migration and rock failure. As the flow of water increased, the alkalinity of the circulating solution became stronger, the speed of stabilization of the ion concentration became faster, the development of the microscopic structure of the corresponding rock became higher, and the decrease in mechanical strength became greater [4]. In view of previous studies on the influence of flow patterns on rock failure, this paper will no longer focus on this aspect. The soft rock (red sandstone) used in this paper refers to red clastic rock formed by the weathering of Mesozoic laterite in subtropical areas of south China. The mineral composition of red sandstone is mainly composed of detrital minerals and clay minerals, among which detrital minerals are mainly quartz, feldspar, calcite, and calcium. Because the flow of natural open channel is basically in turbulent state, the weak rock mass described in this paper is mainly aimed at the red slope river of open channel. Therefore, the designed flow conditions are turbulent. The flow condition is determined according to the section size and the flow pattern discriminant formula which accord with the turbulence condition. Realistic open channel flow patterns and the lowest, highest, and most common temperature variations on the surface in South China over the years are considered. Based on a self-developed multi-functional intelligent open channel hydraulic experimental system, constant volume cyclic saturated tests of red-bed sandstone at three equal gradient temperatures—namely, low temperature (1 °C), medium temperature (23 °C) and high temperature (45 °C)—were designed and carried out in this paper. The temperature conditions are set based on the lowest, highest, and common temperature changes in South China for many years. According to the variation rule of the pH value of the circulating water solution and the concentrations of main anions and cations in the process of water-rock interaction, the laws and mechanisms of water physics and chemical action in the process of saturated softening of sandstone in turbulent flow at different temperatures are expounded. Using scanning electron microscopy (SEM) and other analytical methods, the physical regularity of the fracture development degree of red-bed sandstone in turbulent flow at different temperatures and the variation in water content in the process of saturated rock are compared and analyzed. Uniaxial compressive strength test of rock is designed according to specifications for rock tests in water conservancy and hydroelectric engineering [22]. Using uniaxial compressive strength tests, the mechanical laws of the influences of different temperatures on the softening of red-bed sandstone in turbulent flow are compared (the UCS was repeated three times for each sample). Finally, based on the above three aspects, the influence mechanisms of the different temperatures on the softening of red-bed sandstone in turbulent flow are revealed. The samples used in this paper were taken from a project near the pearl river in south China.

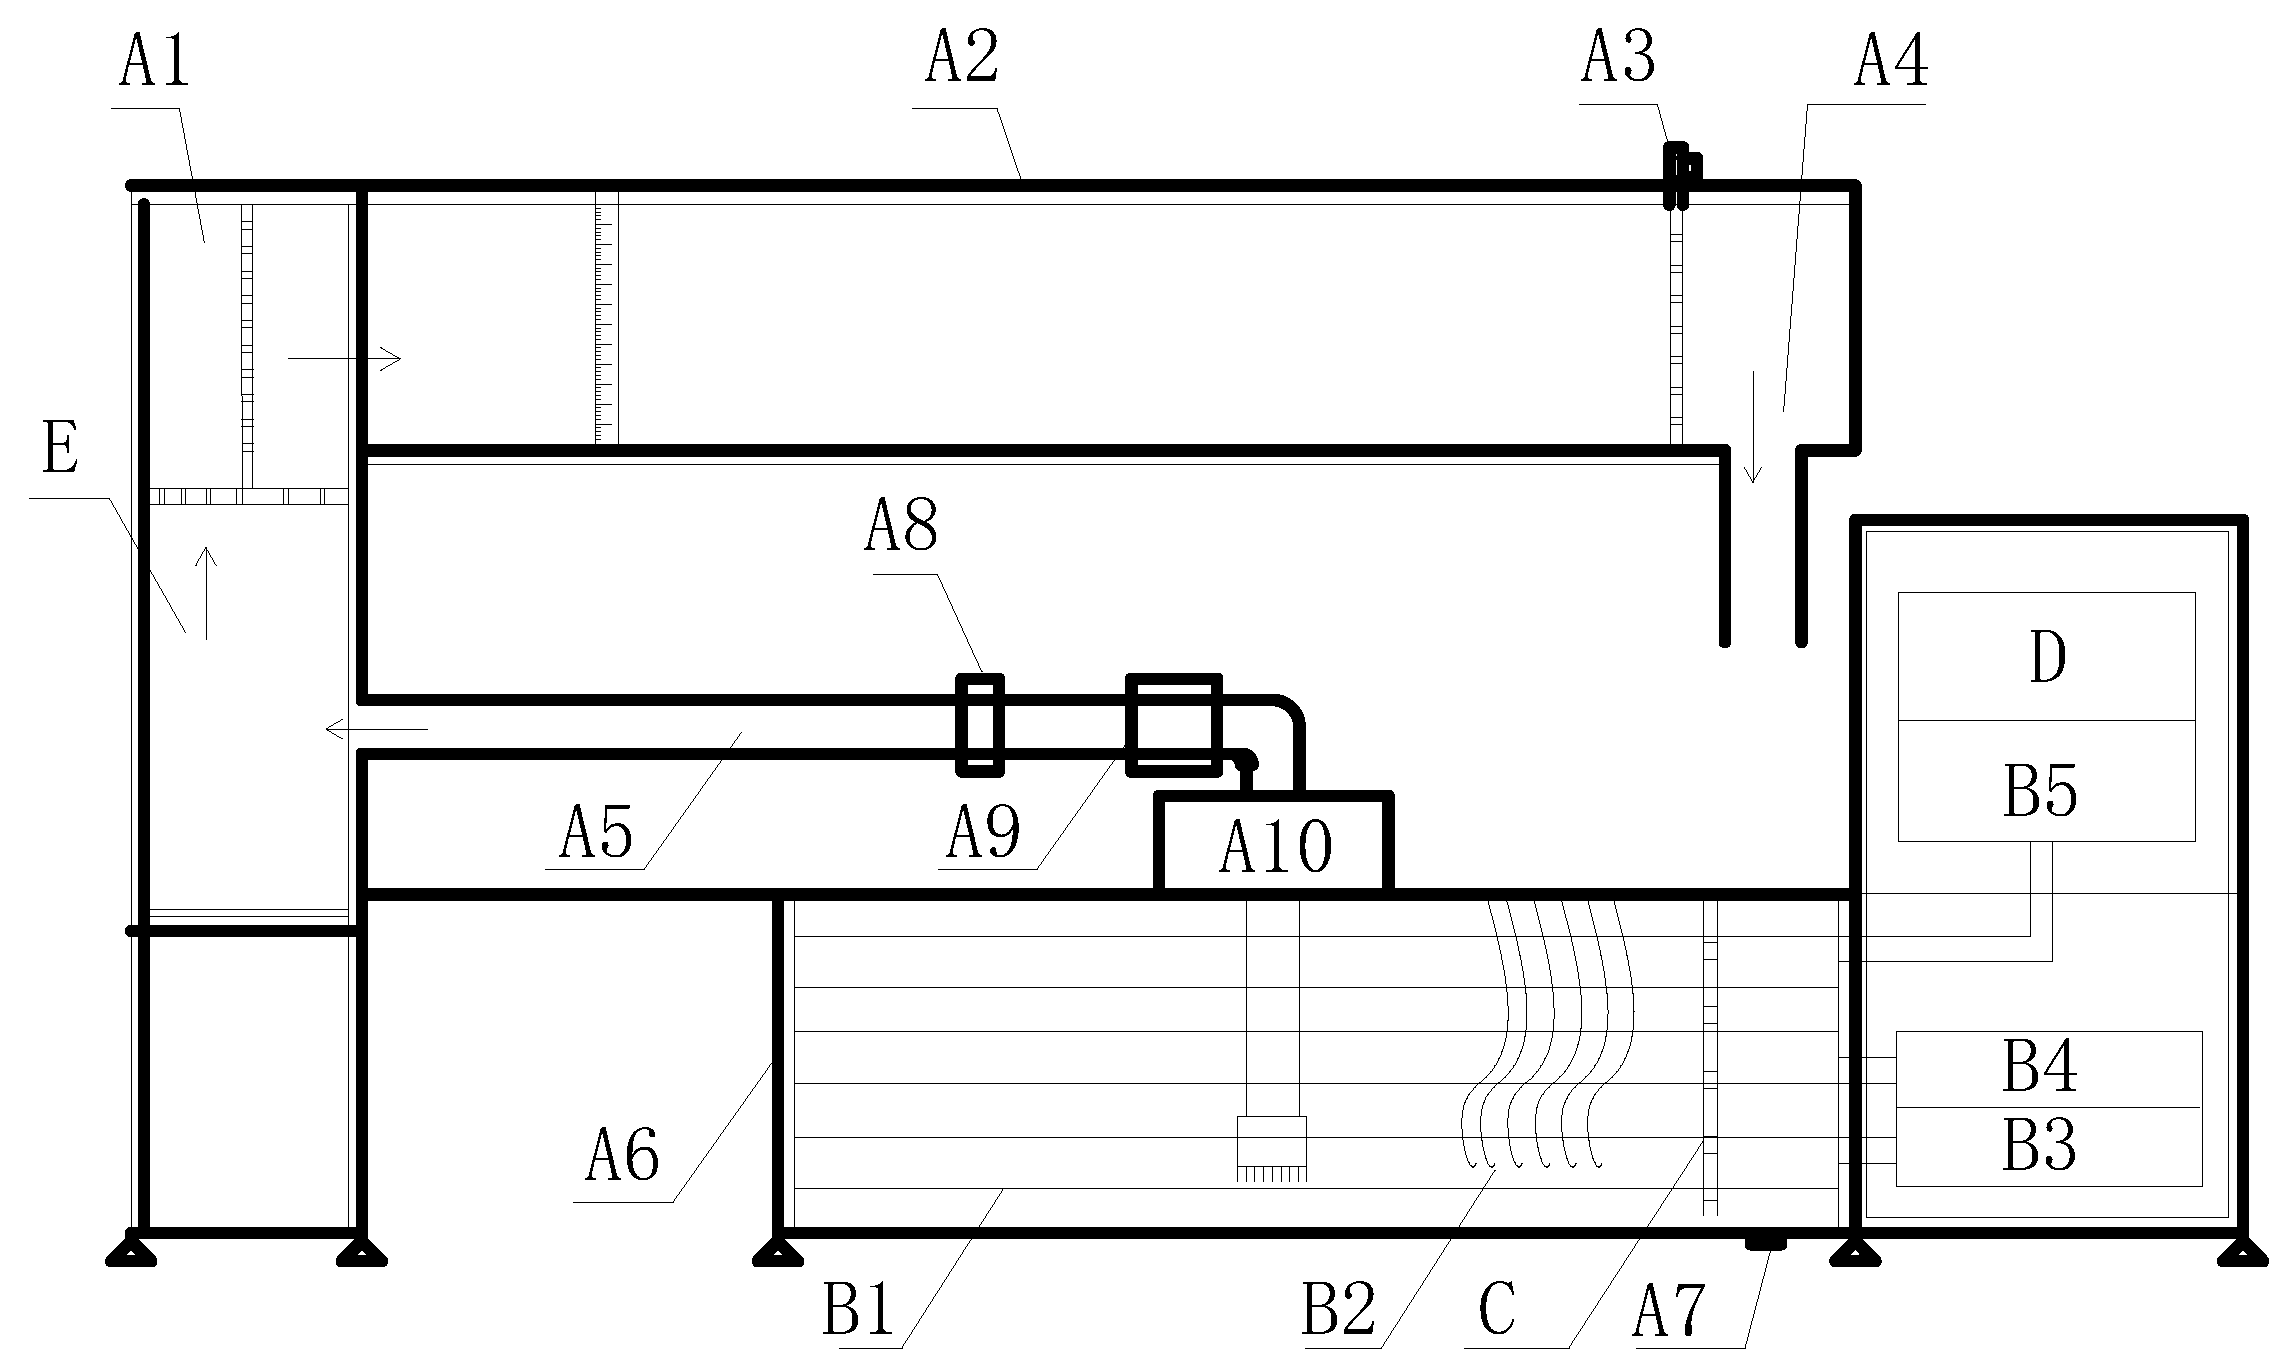
2.2. Development of Test Equipment

Based on the availability of small circulation equipment that can obtain stable and sustainable open channel water flow over a long period of time, this equipment adopts the design idea of a water flow cycle and automatic supplement water combined with the automatic control of temperature, and it adjusts the flow rate by means of an electromagnetic flow meter and tailgate opening wheel; finally, the equipment realizes the flow patterns under different water depths and velocities. The structural schematic diagram of the test equipment is shown in Figure 1. The equipment consists of three modules: flow control module, temperature control module and automatic make-up water module. The flow regulatory module was composed of a self-circulating open channel flume, an electromagnetic flow meter, a flow regulator, an electronic valve, and a recorder, which was used to obtain the flow states under different water depths and velocities. The temperature control module consisted of a temperature sensor, a heating instrument, a refrigeration instrument, a recorder and a temperature controller, which can be used to adjust and record the temperature in real time according to the experimental requirements. The automatic make-up water module consists of a liquid level sensor, a pressure switch, a water pump, an indicator light and a recorder, which was used to restore water to the initial water level over time and ensure that the total water volume remained unchanged. The size of the flume test section was as follows: length × width × height = 200 × 30 × 40 cm3, the velocity range of the equipment test section was 0–0.5 m/s, the flow range was 0–36 m3/s, and the temperature regulation range was 0–60 °C. The experimental equipment can sustain the integrated control of the flow, temperature and water level and then obtain the target flow pattern. As shown in Figure 2, this experimental study was based on the equipment shown in the graph. The equipment can supply water automatically and can be used for long-term water cycle experiments.

2.3. Test Contents and Process

Through the experimental study on the softening effects of different flow patterns on red-bed sandstone, it is found that red-bed sandstone more easily softens under turbulent conditions than under laminar flow and static water conditions, and the actual geological rock mass is affected by different temperatures. Only when the temperature effect is considered can the mechanism of the influence of temperature on the interaction of water and rock be further understood. Therefore, the effect of temperature on the softening of red-bed sandstone is further studied in experiments based on turbulent conditions. First, equal volume cyclic saturation tests of red-bed sandstone at three equal temperature gradients—low temperature (1 °C), medium temperature (23 °C), and high temperature (45 °C)—were designed and carried out. The test samples consisted of the typical soft rock of red-bed sandstone, which is widely distributed in South China. Twelve samples were randomly divided into four groups. Group A was used as a comparative reference test group of natural rock samples, group E was used for high-temperature testing (45 °C), group F was used for low-temperature testing (1 °C) and group G was used for room-temperature testing (23 °C), as shown in Figure 3. In this study, the interaction between water and rock under the condition of natural open channel rivers is studied, so the source of water is fresh water and it is weakly alkaline (similar to tap water). Therefore, tap water (contains trace amounts of chloride and dozens of milligrams per liter of calcium, magnesium and potassium) is chosen as the test source, and the multi-function self-circulating hydraulic open channel test device is used to obtain a steady flow pattern at a constant temperature. The average velocity of the test section was set as 29.5 cm/s according to the measured hydrologic forecast data of each hydrologic station of the Pearl River Commission Hydrology Bureau (this velocity can approximately represent the average velocity in the water-rich season of a partial section, such as the Suijiang river in south China’s pearl river basin). The total volume of circulating water was 500 L. Figure 4 is a low-temperature (1 °C) test state diagram under dynamic water conditions. Before lofting, the initial pH value of the water source and the concentrations of the main anion and cation were measured as contrast references. On the basis of the same saturation time, a Dionex DX-600 (American Thermo Fisher company) ion chromatograph, IRIS Advantage (high resolution (HR)) full spectrum direct reading plasma atomic emission spectrometer is used. The main anion and cation concentrations and pH values of the red-bed sandstone in the circulating solution at different temperatures were measured by a portable pH meter and other instruments. The micro-structures of the four groups of red-bed sandstone powders were observed by thermal field scanning electron microscopy (TSM, From Hitachi, Japan). Before the different temperature tests, the basic physical properties of the natural samples were also carried out as shown in Table 1.
Three groups of rock samples, E, F and G, were completely immersed in three equal temperature gradient flow patterns—namely, high temperature (45 °C), low temperature (1 °C), and room temperature (23 °C)—for the same time of water-rock interaction. A portable pH meter was used to determine the pH value of the solution every other day, and at the same time, the main anion and cation concentrations of the solution were sampled on the day of the test. The pH values of the three groups of solutions were detected on the same day, and the concentrations of major anions and cations and the saturated weight of the rock were recorded in real time for subsequent comparative analysis. At the same time, the total water quantity in the water-rock reaction process remained consistent with the initial water quantity by controlling via the addition of pure water. Moreover, the initial mass of each group of rock samples is calculated, and then weighed every 24 hours, the percentage of the increased mass and the initial mass ratio is the water content of the rock sample quality at the moment, and the average value of the water content of the three rock samples in each group is the average water content of each group of rock samples. For the SEM analysis, uniaxial compression tests were carried out on four groups of rock samples immersed in different temperature of water flow for the same time, and microcosmic scanning of clastic particles produced in similar parts of rock samples was carried out by scanning electron microscope (SEM) with a magnification of 3000 times (maximum multiple 300,000 times). SEM is used here to describe the development of meso-fissures in rocks rather than used to analyze the change of micro-structure the testing sample.

3. Results

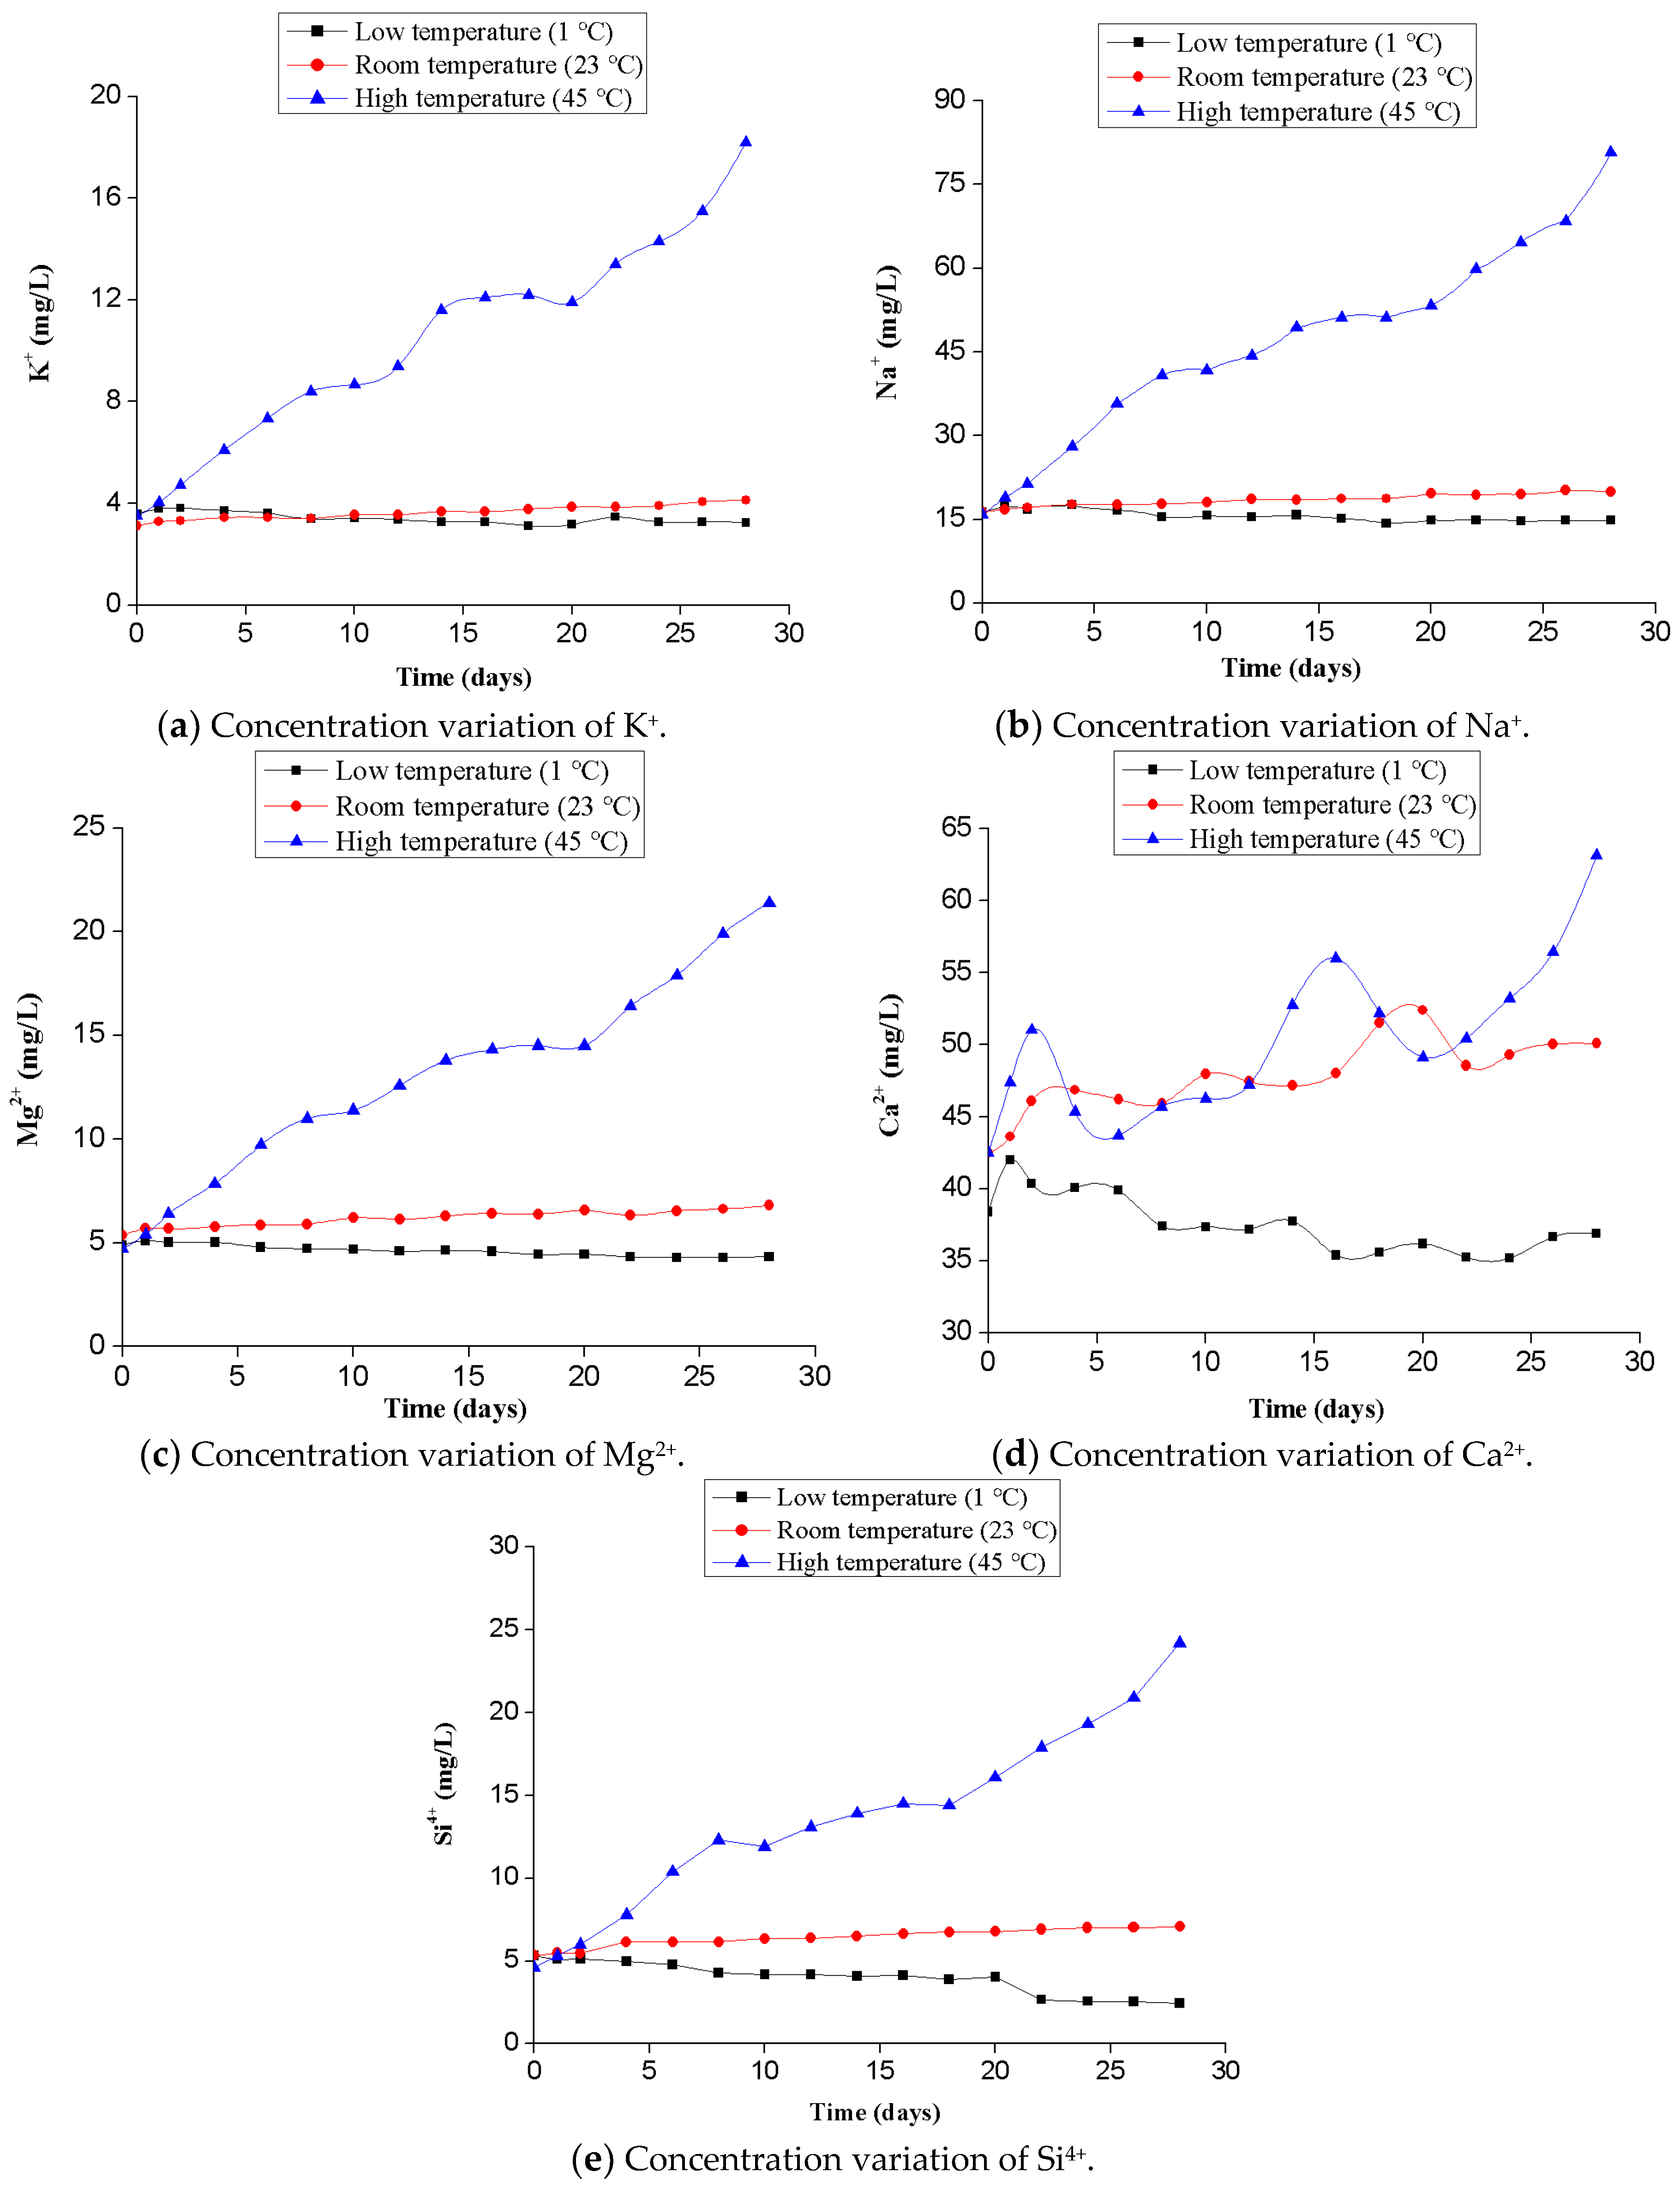
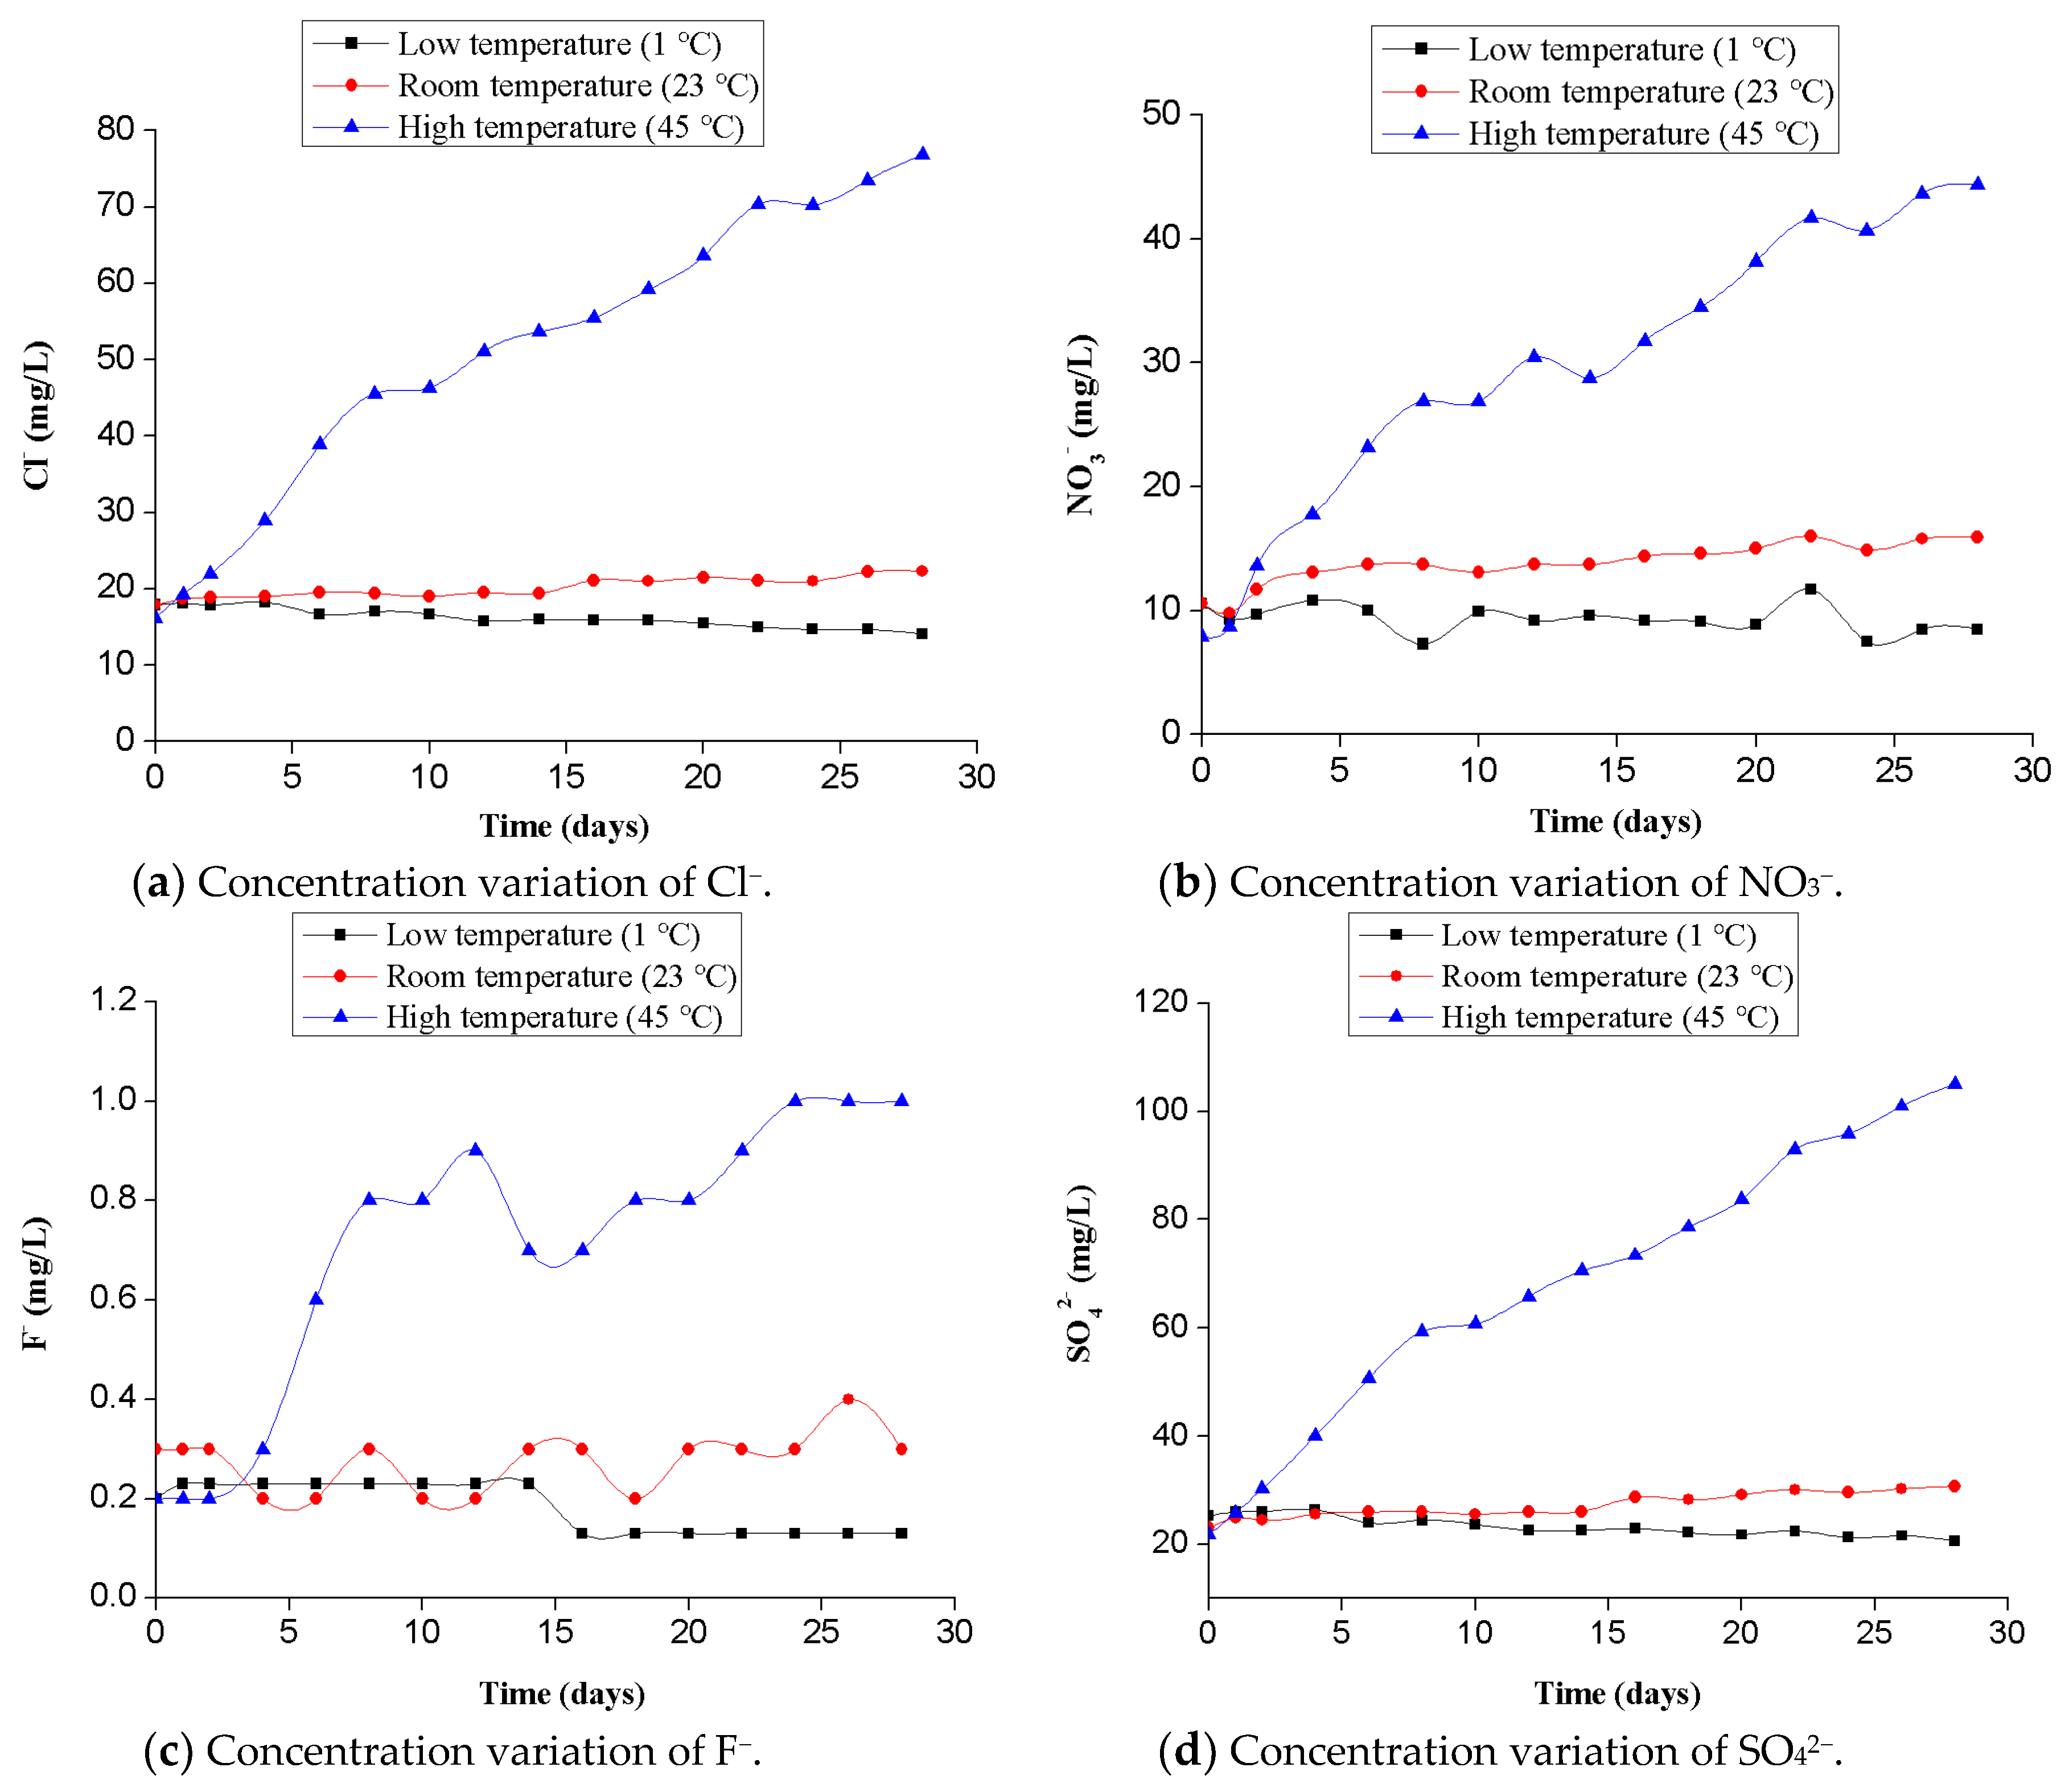
3.1. Chemical Laws of the Effects of Different Temperatures in Turbulent Flow

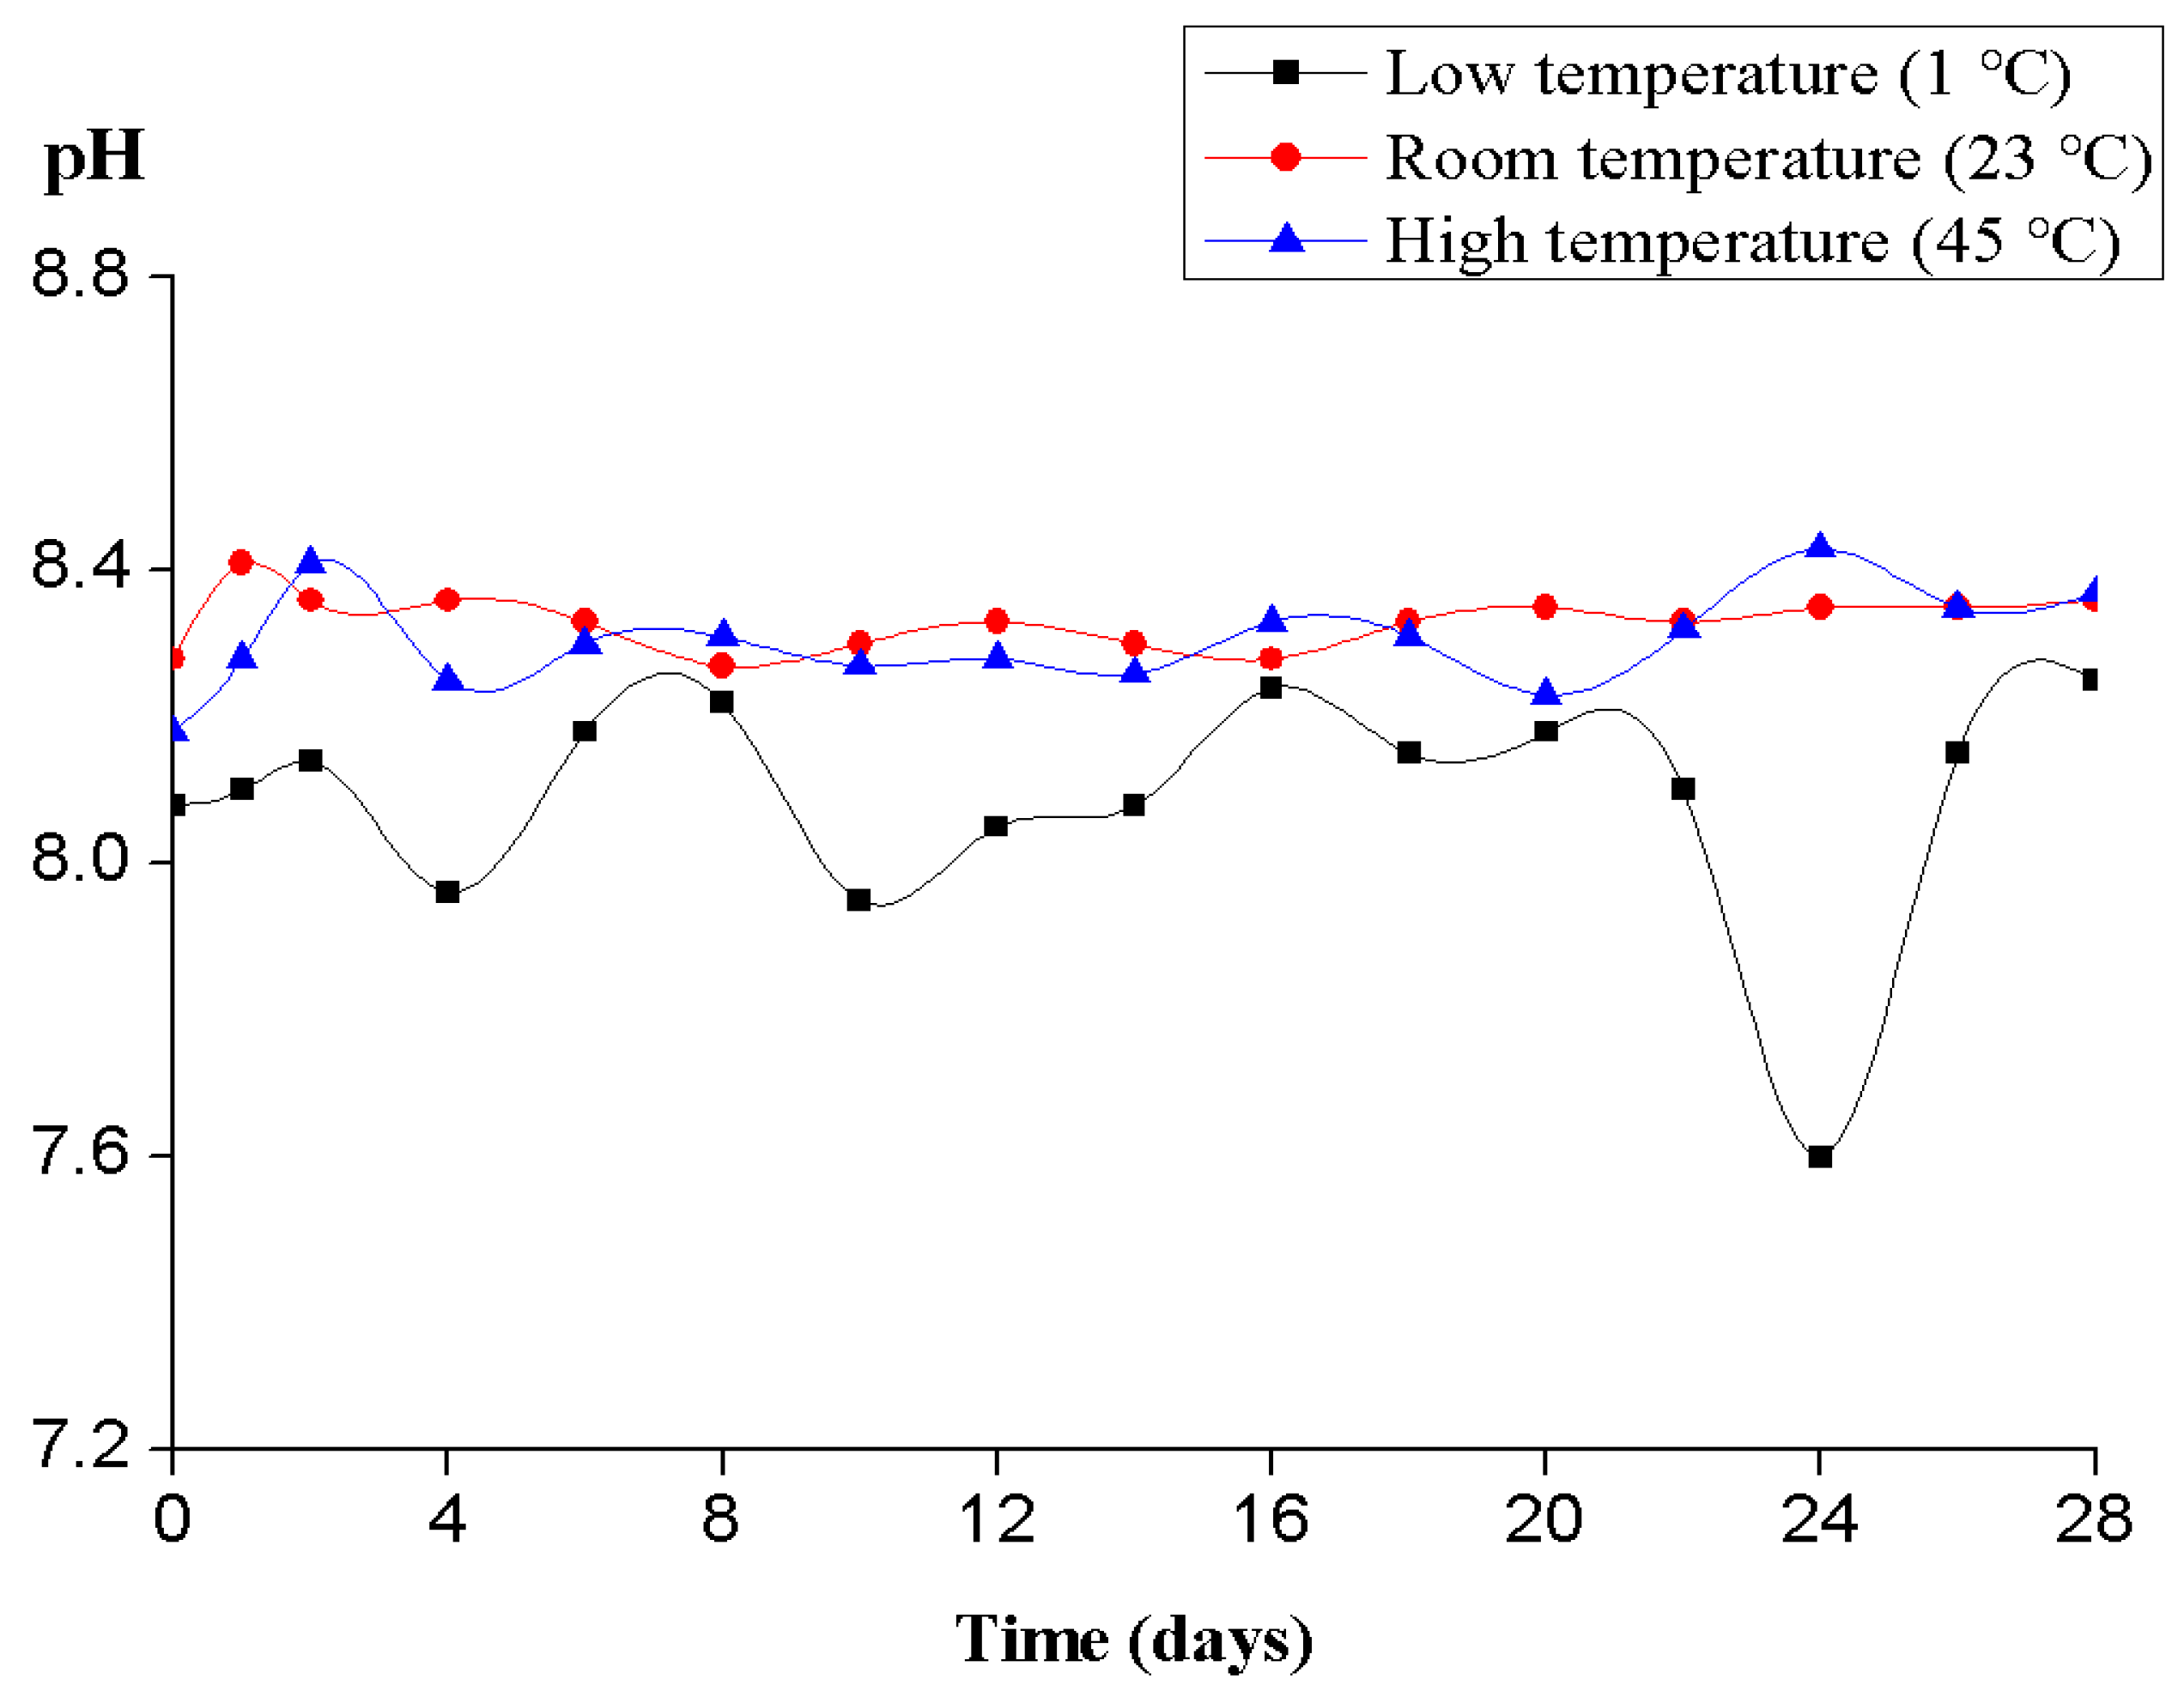
PH Value of the Circulating Aqueous Solution

Figure 5 shows the change process of the pH value of the recirculating water solution of red-bed sandstone at a high temperature (45 °C), medium temperature (23 °C), and low temperature (1 °C) for the same time in saturated water flow under dynamic water conditions. It can be seen from the diagram that the pH value of the circulating water solution at the high temperature is higher than that of the low-temperature flow, and the rise rate of the pH value of the high-temperature flow is higher than that of the low-temperature flow at the initial stage, and the amplitude of the pH value of the low-temperature flow is larger than those of the normal-temperature and high-temperature flows. Because of the low temperature condition, the period of reaction corresponding ions in the soft rock with the solution water molecules or ions which permeate into the soft rock became longer. At the same time, because of the accumulation effect of ions for a long time, the instantaneous amplitude of the reaction is larger. The authors believe that the reason why the overall pH level of the high-temperature water flow is higher than that of the low-temperature flow is because the low temperature lowers the reaction rates of the calcite in red-bed sandstone and calcium and iron cements, which are more easily corroded by an aqueous solution with H+ at a low temperature. Furthermore, the overall pH level of the solution is relatively lower than those of the high-temperature water flow and normal-temperature water flow. In the initial stage, the rise rate of the pH value of the high-temperature flow is higher than that of the low-temperature flow, which is also due to the water-rock reaction rate promoted by the high-temperature flow. The pH wave amplitude of the low-temperature water flow is larger than those of the normal-temperature and high-temperature flows. Because of the low temperature, the rate of water-rock ion reaction in the solution is positively inhibited, and the period of the solution water molecules or ions penetrating into the soft rock is longer than that of the corresponding ion reaction. At the same time, due to the accumulation of ions, the extent of the reaction also increases.
Figure 6 and Figure 7 are the variation curves of the concentrations of the main cations and anions, respectively, in the circulating water solution with time in the process of water-rock interaction at different temperatures. The curve shows that the variation in ion concentration in the aqueous solution during the saturated process of red-bed sandstone has the following characteristics:
(1) Cation
As shown in Figure 6, comparing the curves of the main cation concentration of the circulating water solution in the three kinds of temperature water flows, it can be seen that the main cation concentration of the circulating solution of the rock sample in the low-temperature water flow immersion has a decreasing trend, and the fluctuation range is relatively small, which is mainly due to the unstable initial water supply at low temperatures. The general level of the main cation concentration of the circulating solution is relatively stable in the immersion of the normal-temperature flow, and the rising trend of the ion concentration is the most notable in the immersion of the high-temperature flow. The concentrations of Na+, K+, Ca2+, Mg2+, and Si4+ increased linearly. The ion concentrations of Zn2+, Al3+, and Fe3+ and other cations that easily form insoluble sediments are close to zero in the experiment process, which are much lower than those of the main cations mentioned above. These results are consistent with the opinion of [23] that there is little involvement of this kind of ion in the chemical interaction between rock samples and water.
The authors believe that the solution ion reaction in the water-rock interaction process is positively inhibited at a low temperature, and only when the water solution molecules or ions further penetrate into the soft rock can the chemical reaction and ion exchange be carried out with more related ions in the soft rock, which makes the ion concentration change slightly. At high temperatures, the erosion, dissolution, and exchange of aqueous solution molecules or ions of rock minerals are promoted, and ion reactions are positively promoted. At the same time, the concentration of exchangeable ions is an important factor affecting the degrees of ion exchange and adsorption. The higher the concentration of exchangeable ions in the solution is, the faster the exchange reaction is [24]. The exchangeable ion concentration increases with increasing flow temperature, which promotes the destruction of the meso-structure of the rock. At the same time, two other mechanisms may be involved: (a) Solubility in water (saturated in rock) that depends on temperature; (b) filtration of rock, which depends on effective porosity and permeability.
(2) Anion
As shown in Figure 7, the variation in the main anion concentration of the solution immersing the soft rock under the three conditions is also quite different, and the concentrations of Cl, NO3−, and SO42− ions remain unchanged under the low-temperature and normal-temperature water flow conditions. However, the concentration of the main anions increases linearly in the short term under high-temperature flow conditions, which is much higher than those under the low-temperature and normal-temperature flow conditions. The concentration of the main anions in the circulating solution increases with increasing water flow temperature.
The change in the main anion concentration in the circulating solution also shows that the increase in the water flow temperature will accelerate the dissolution of ions in the soft rock during water-rock ion exchange and promote the chemical interactions between red-bed sandstone and water. At the same time, it was also found that the concentration of F- was lower in the experiment, which also confirmed the opinion of [24] that the ion was not involved in the chemical interactions between rock samples and water.

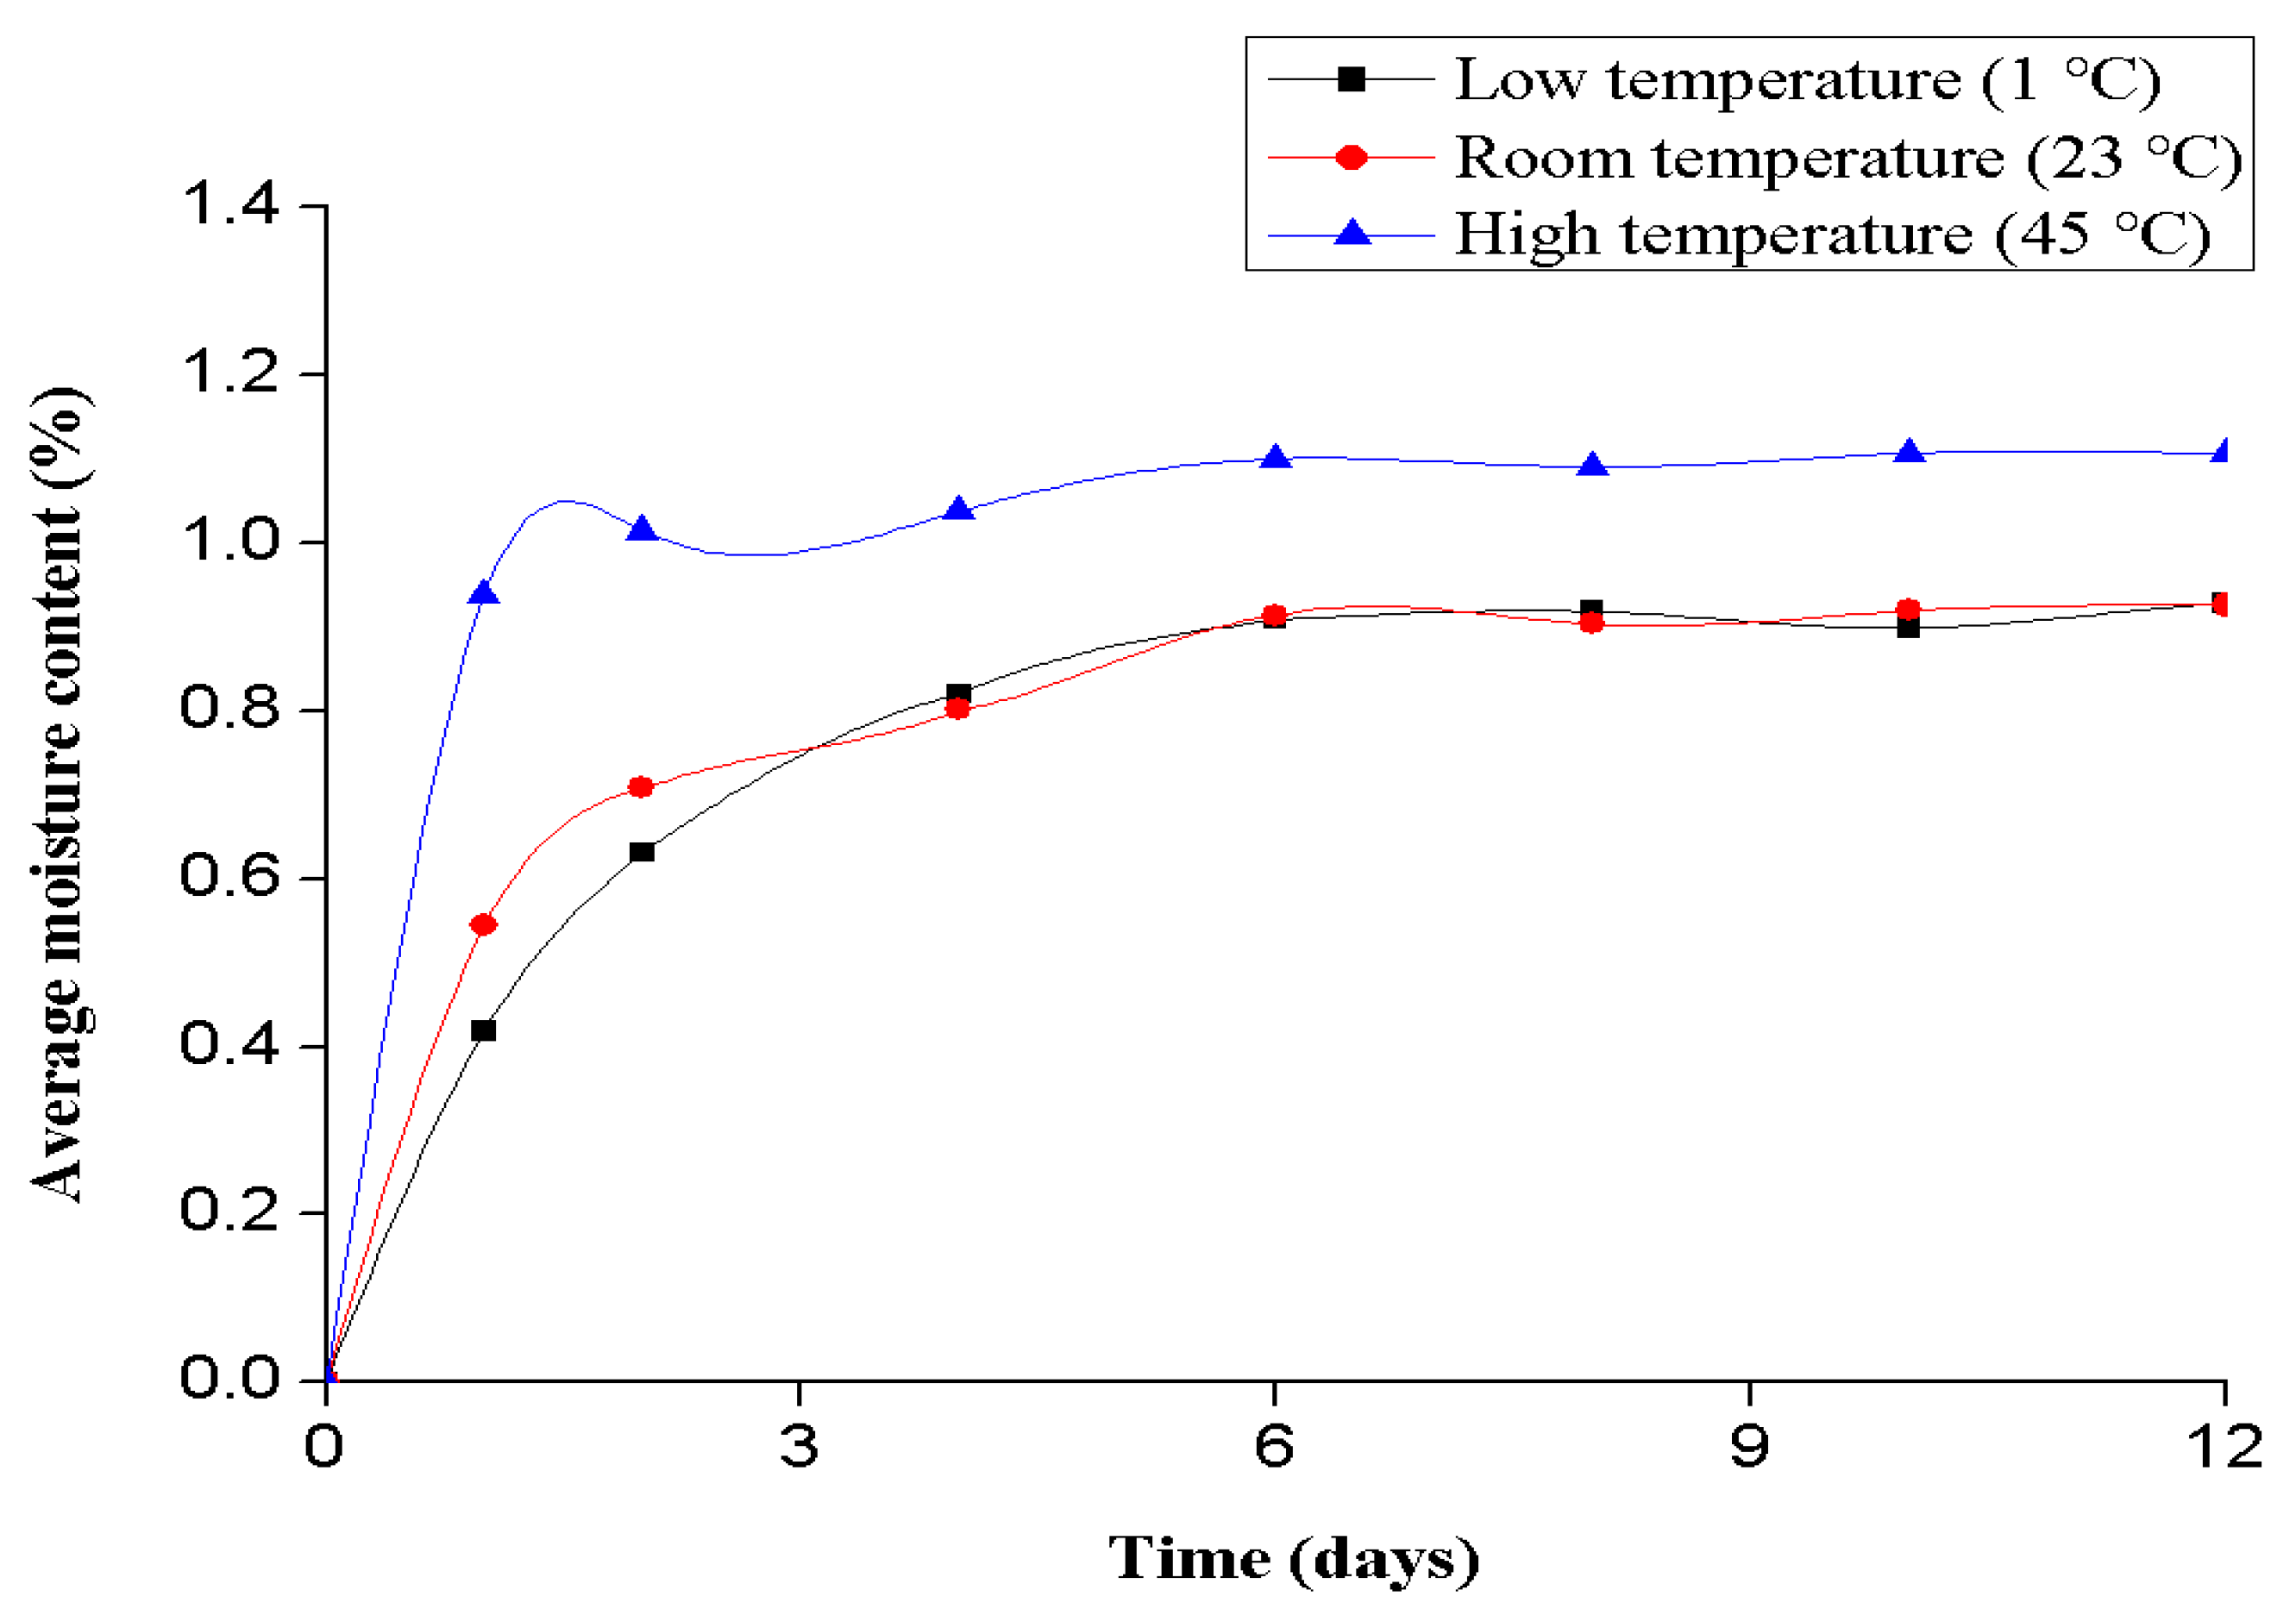
3.2. Physical Laws of the Effects of Different Temperatures in Turbulent Flow

3.2.1. Variation in the Moisture Content

According to the average moisture content variation curve of red-bed sandstone in the three kinds of temperature flows, it can be seen that the red-bed sandstone selected in this experiment is saturated for one week or so under dynamic water conditions. Compared with the normal-temperature flow, the high-temperature flow can promote red-bed sandstone to become saturated more rapidly, while the low-temperature flow can restrain the saturation rate of red-bed sandstone. The saturation rate of red-bed sandstone is positively correlated with the temperature under dynamic water conditions; that is, the higher the flow temperature is, the faster the saturation rate of the rock. Moreover, the water content of the specimen is higher under high temperature conditions, which is due to the intense chemical reaction of the water and rock under high temperature conditions, and the large amount of water absorption of the rock. In Figure 8, the average water content of red sandstone suddenly decreases, which may be related to the excessive evaporation and water loss of rock samples caused by the high ambient temperature during weighing. The higher average water content of rock samples at 45 °C is mainly due to the higher degree of fracture development, the easier access of water molecules to rock samples, and the fuller contact between water and rock under high temperature conditions.

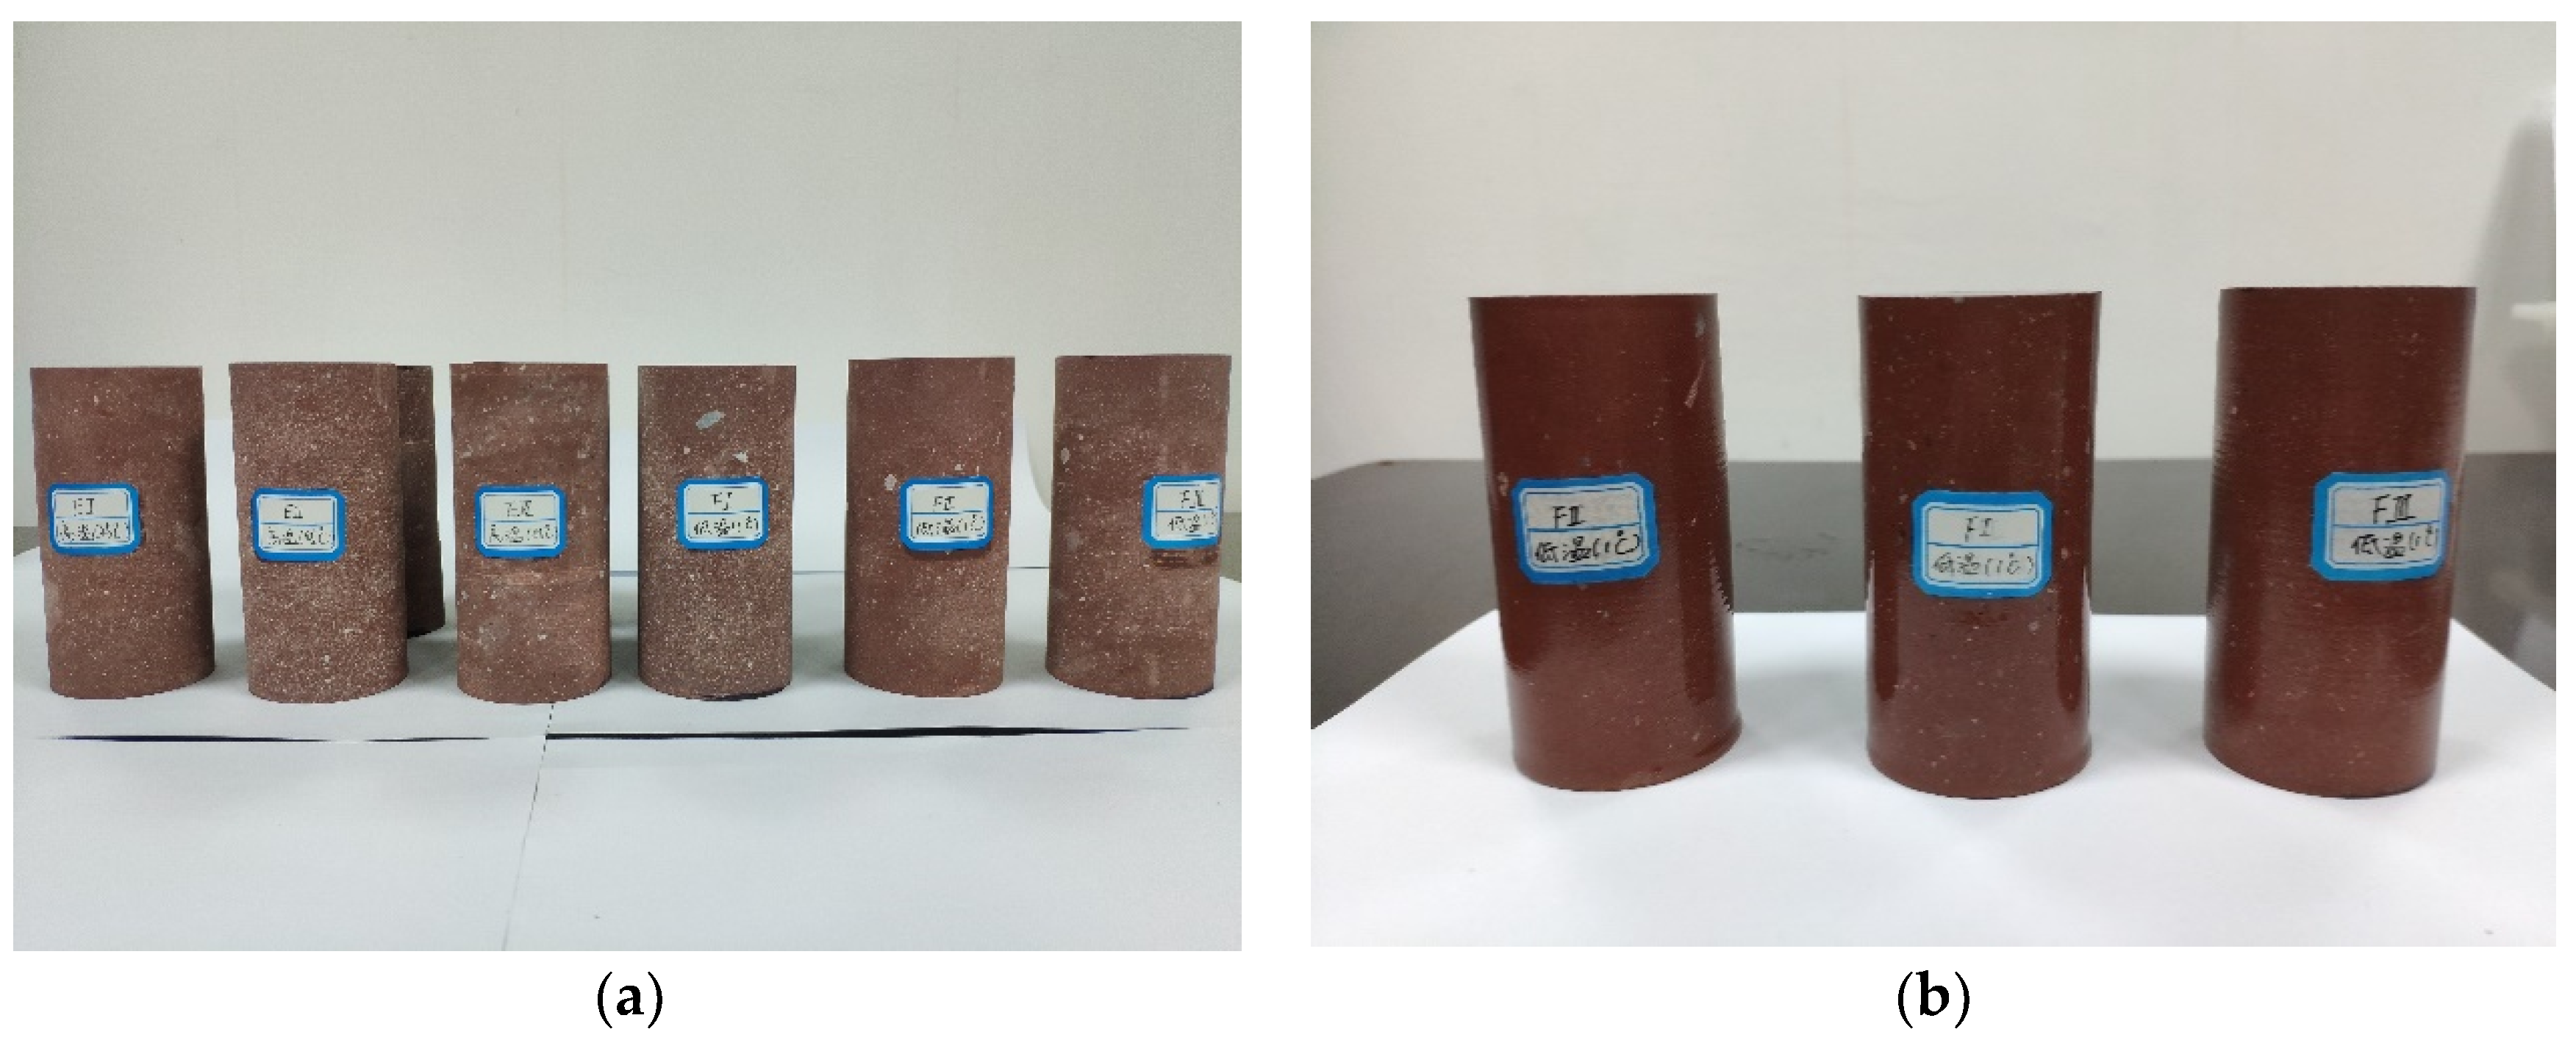
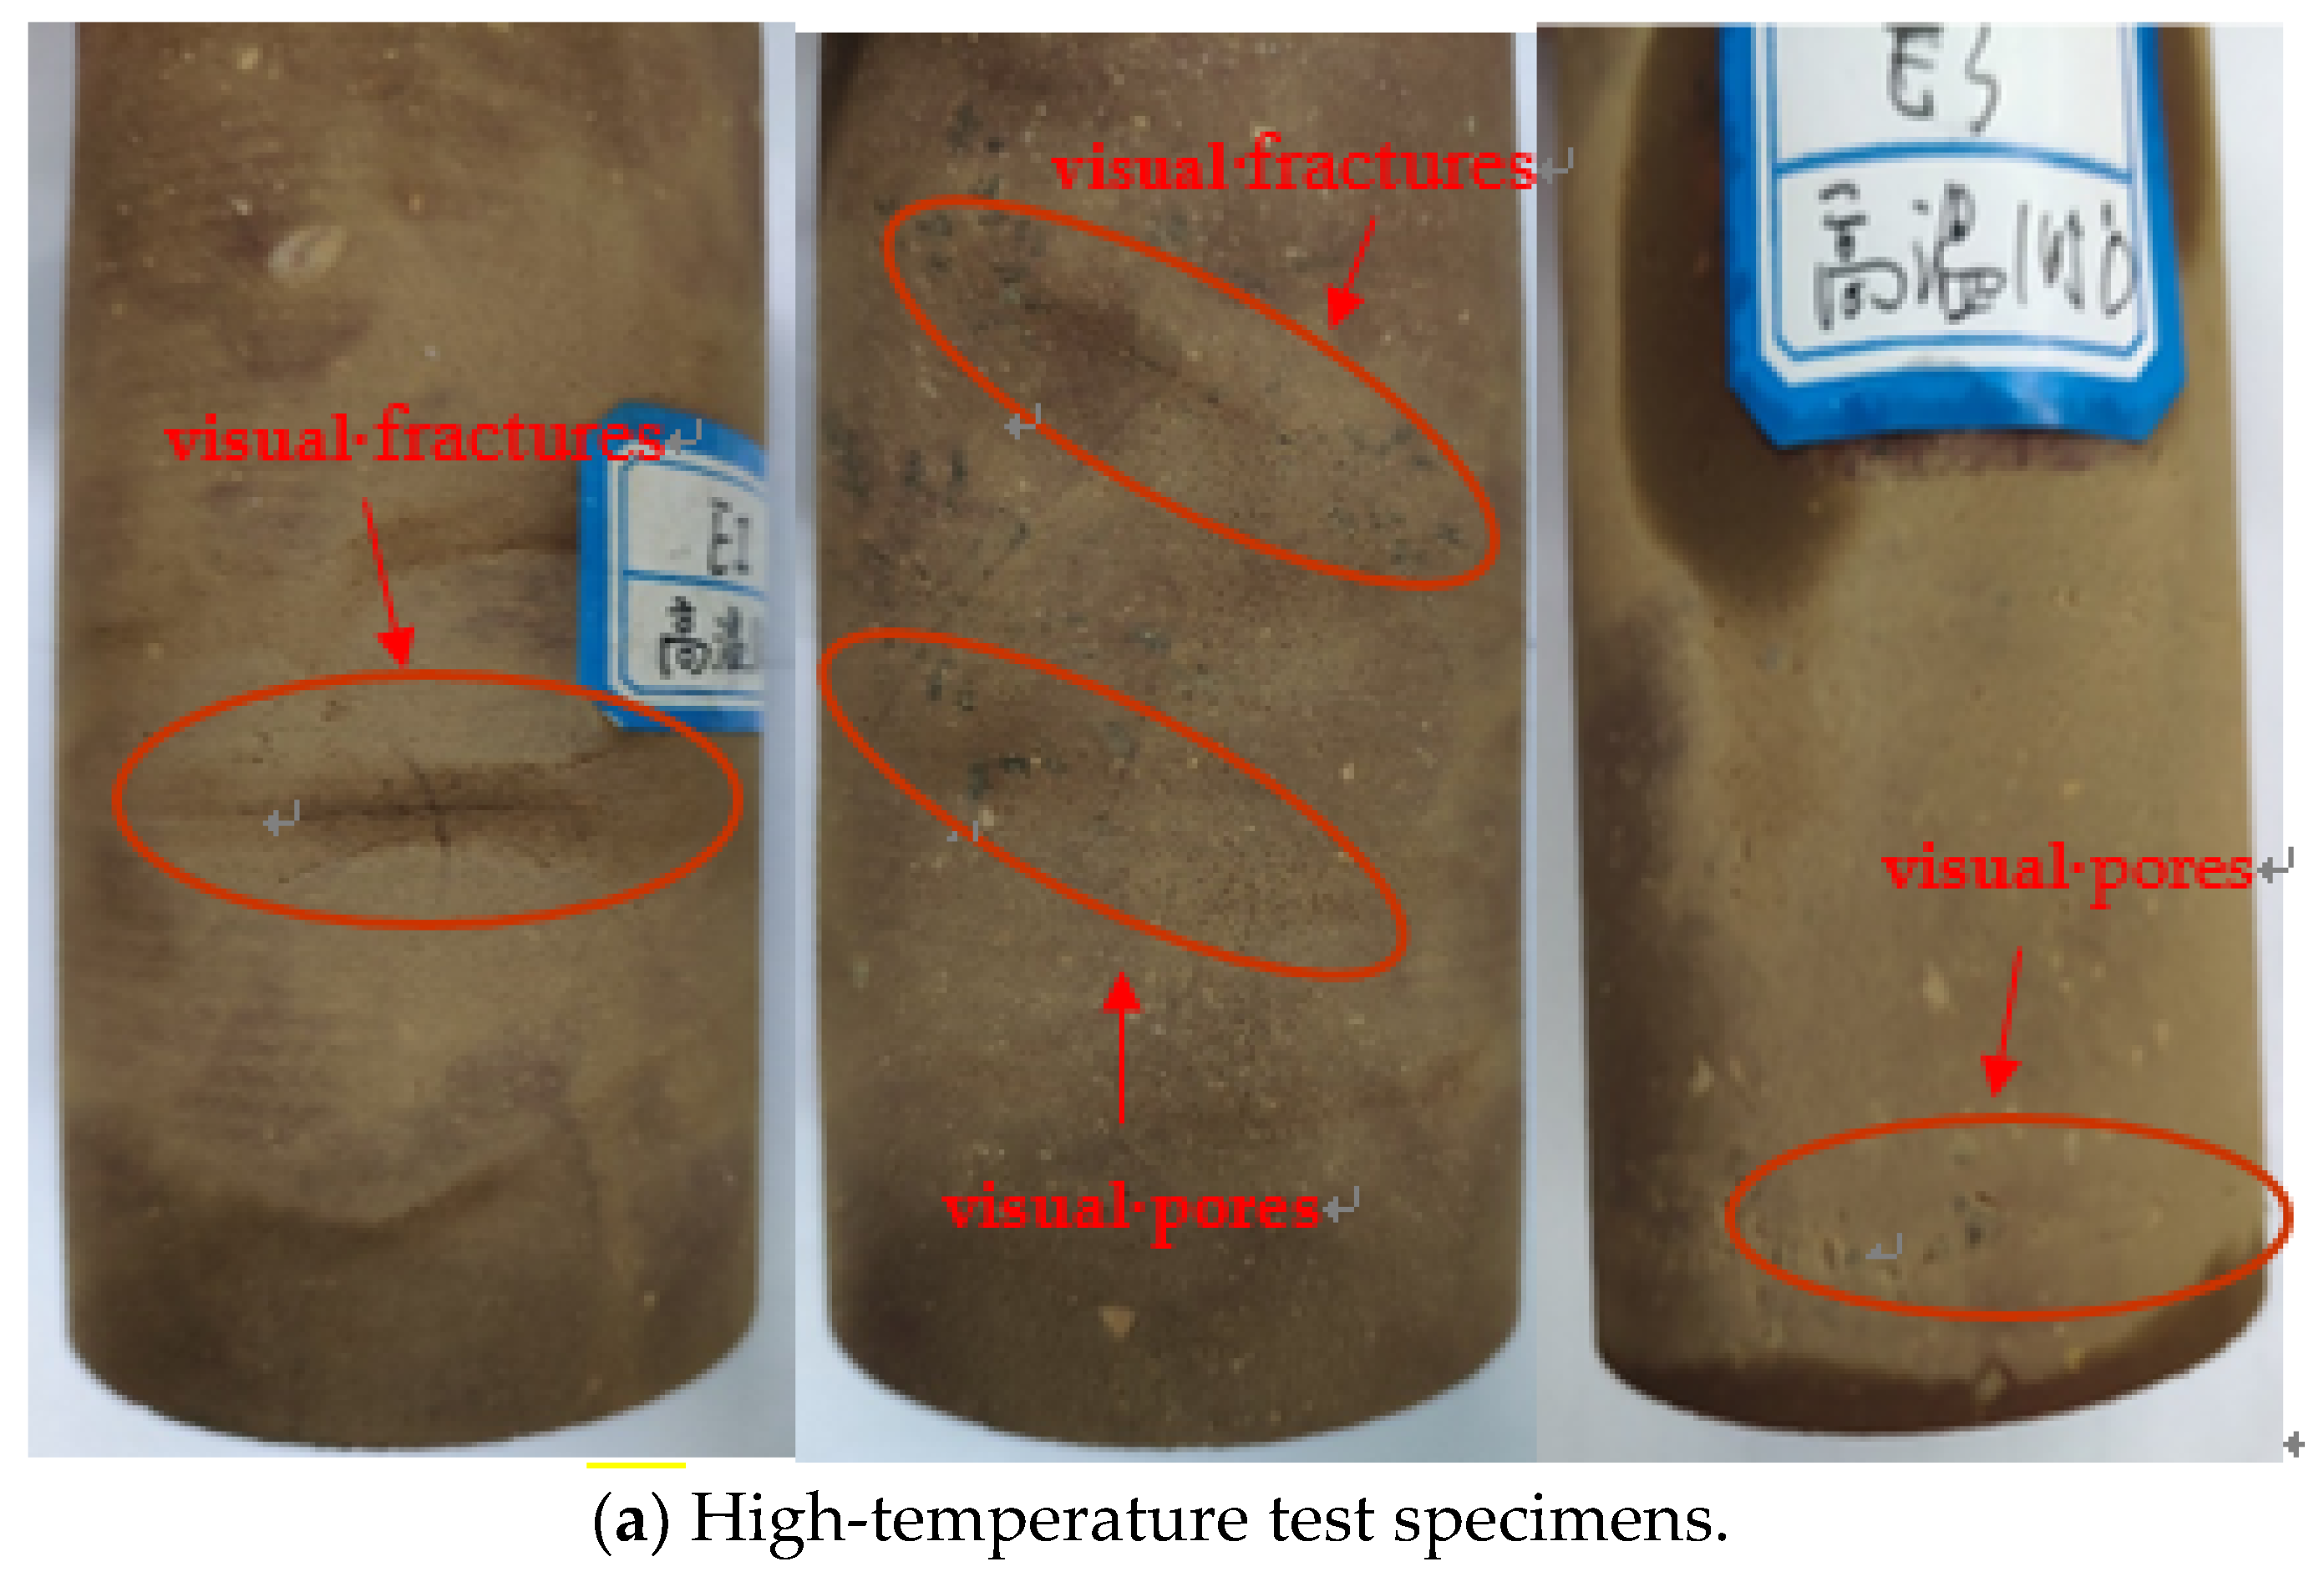
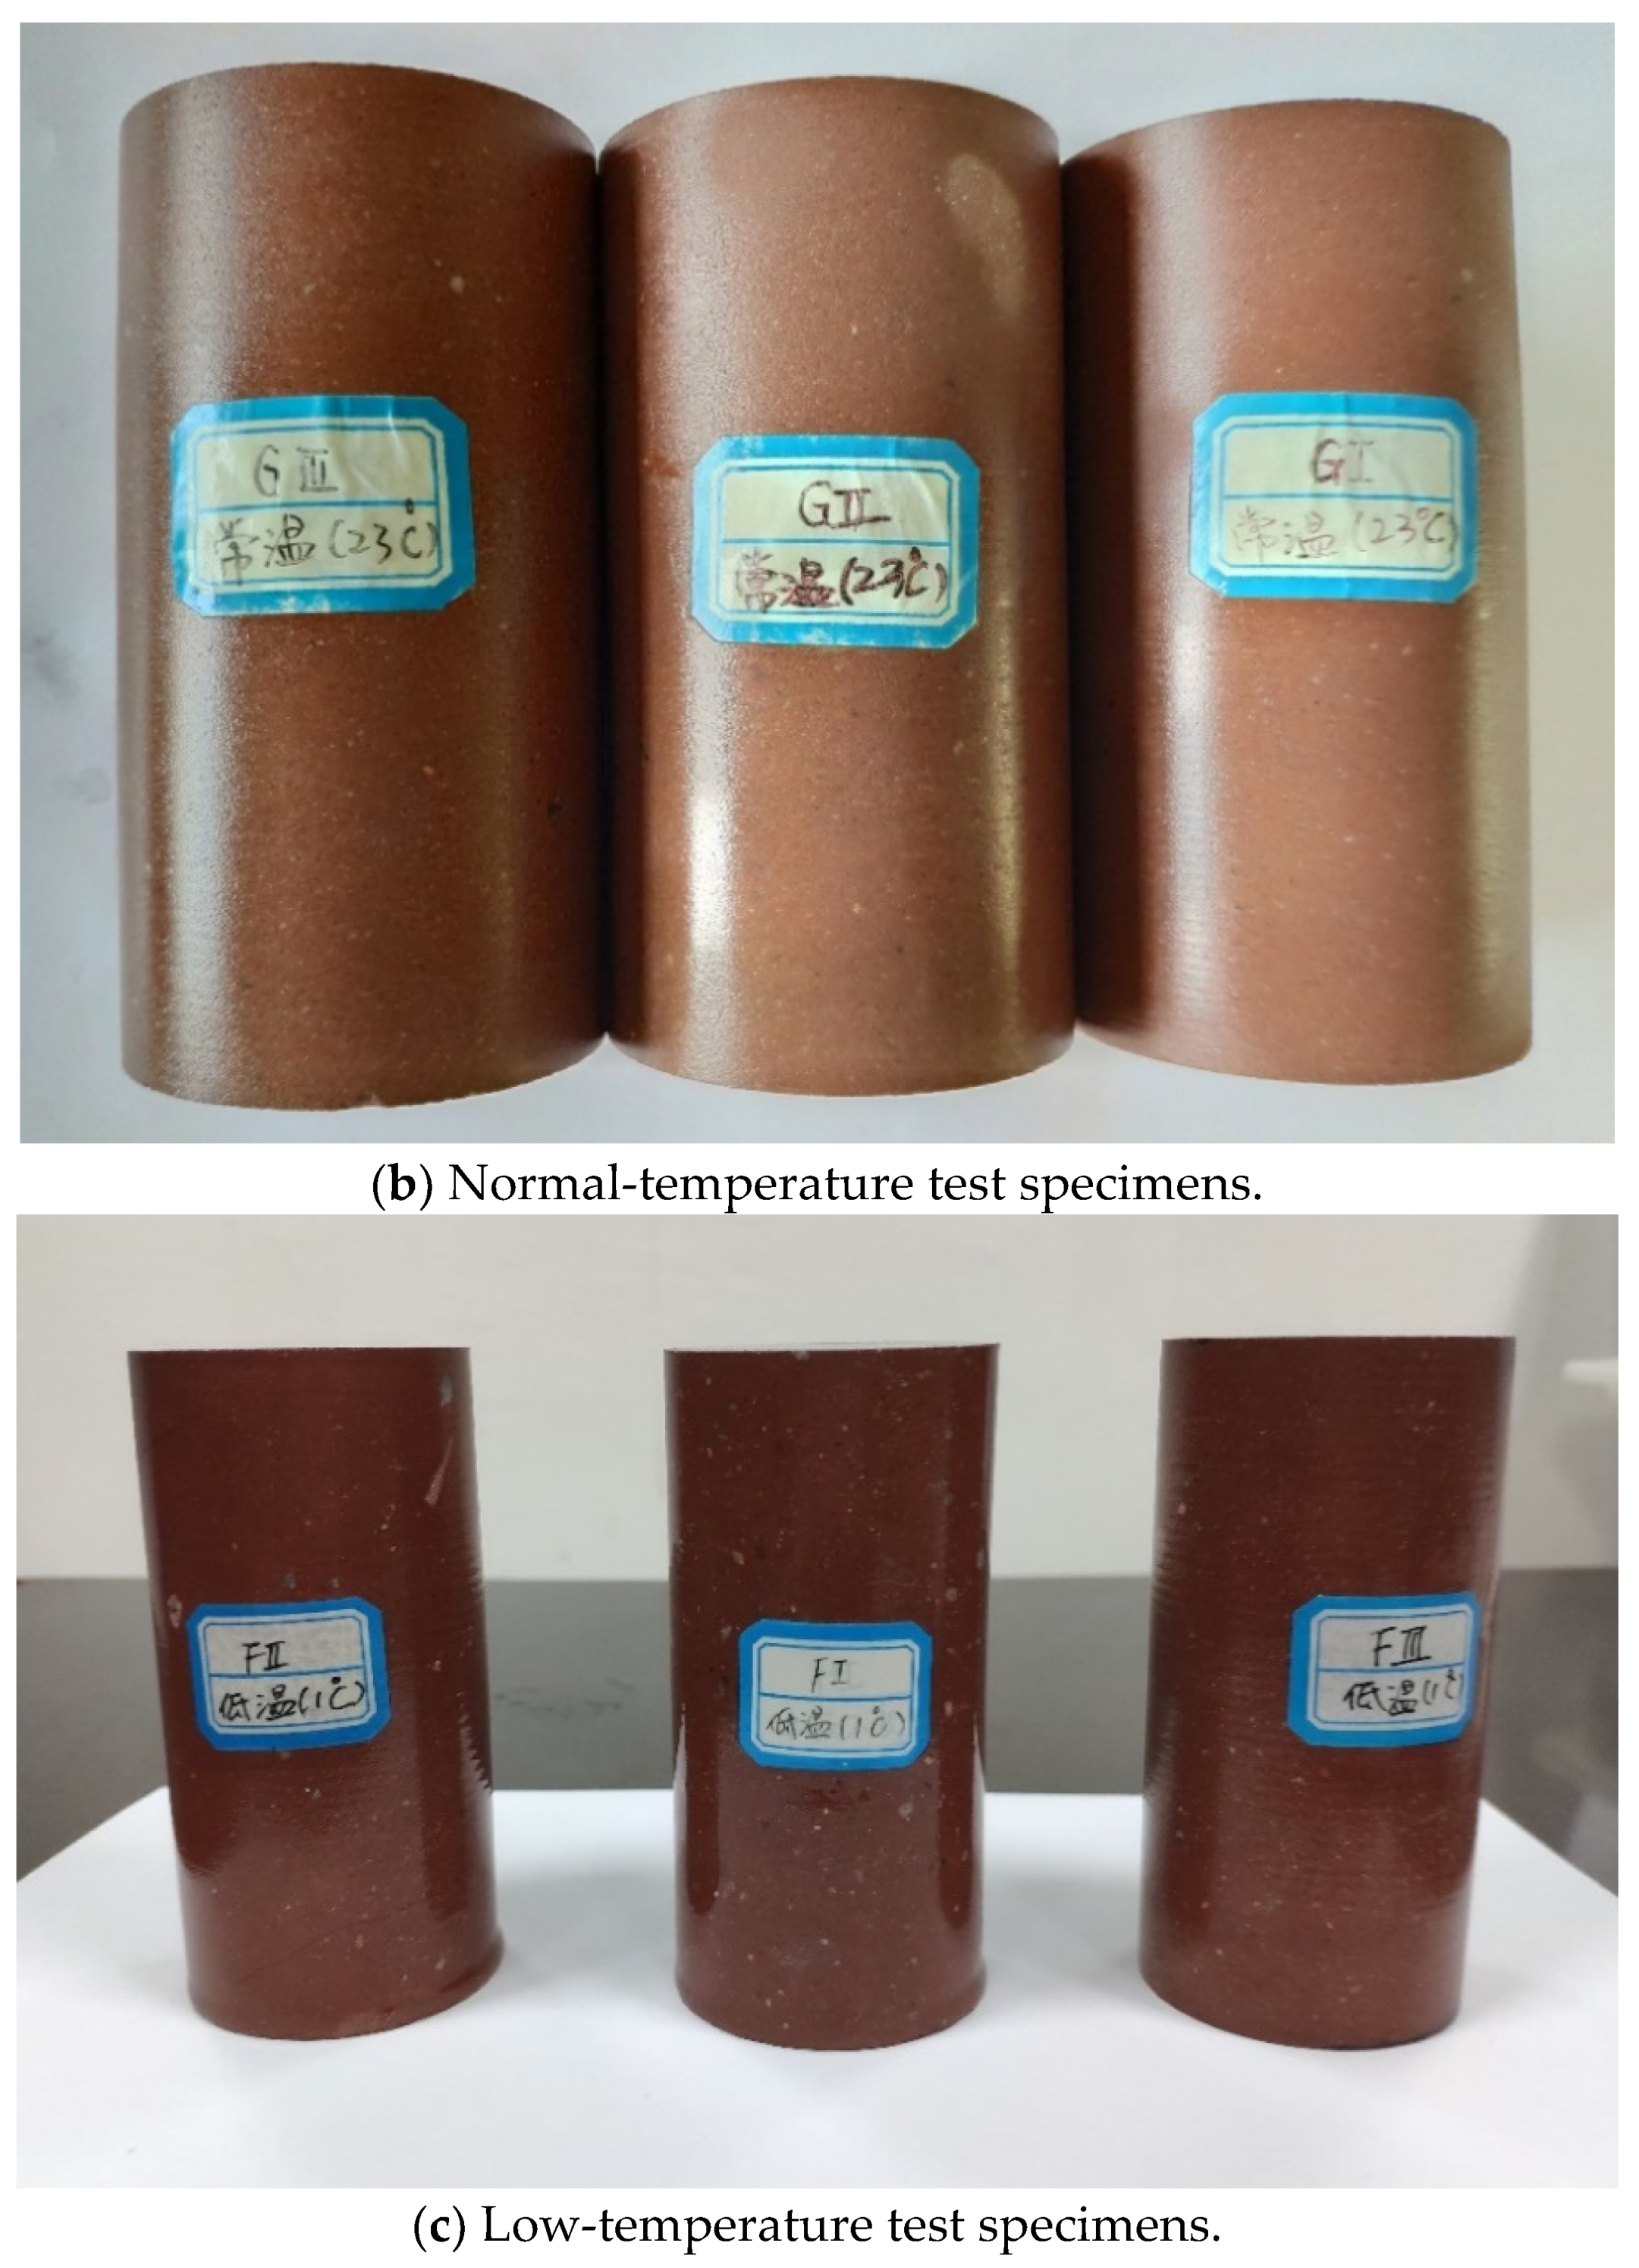
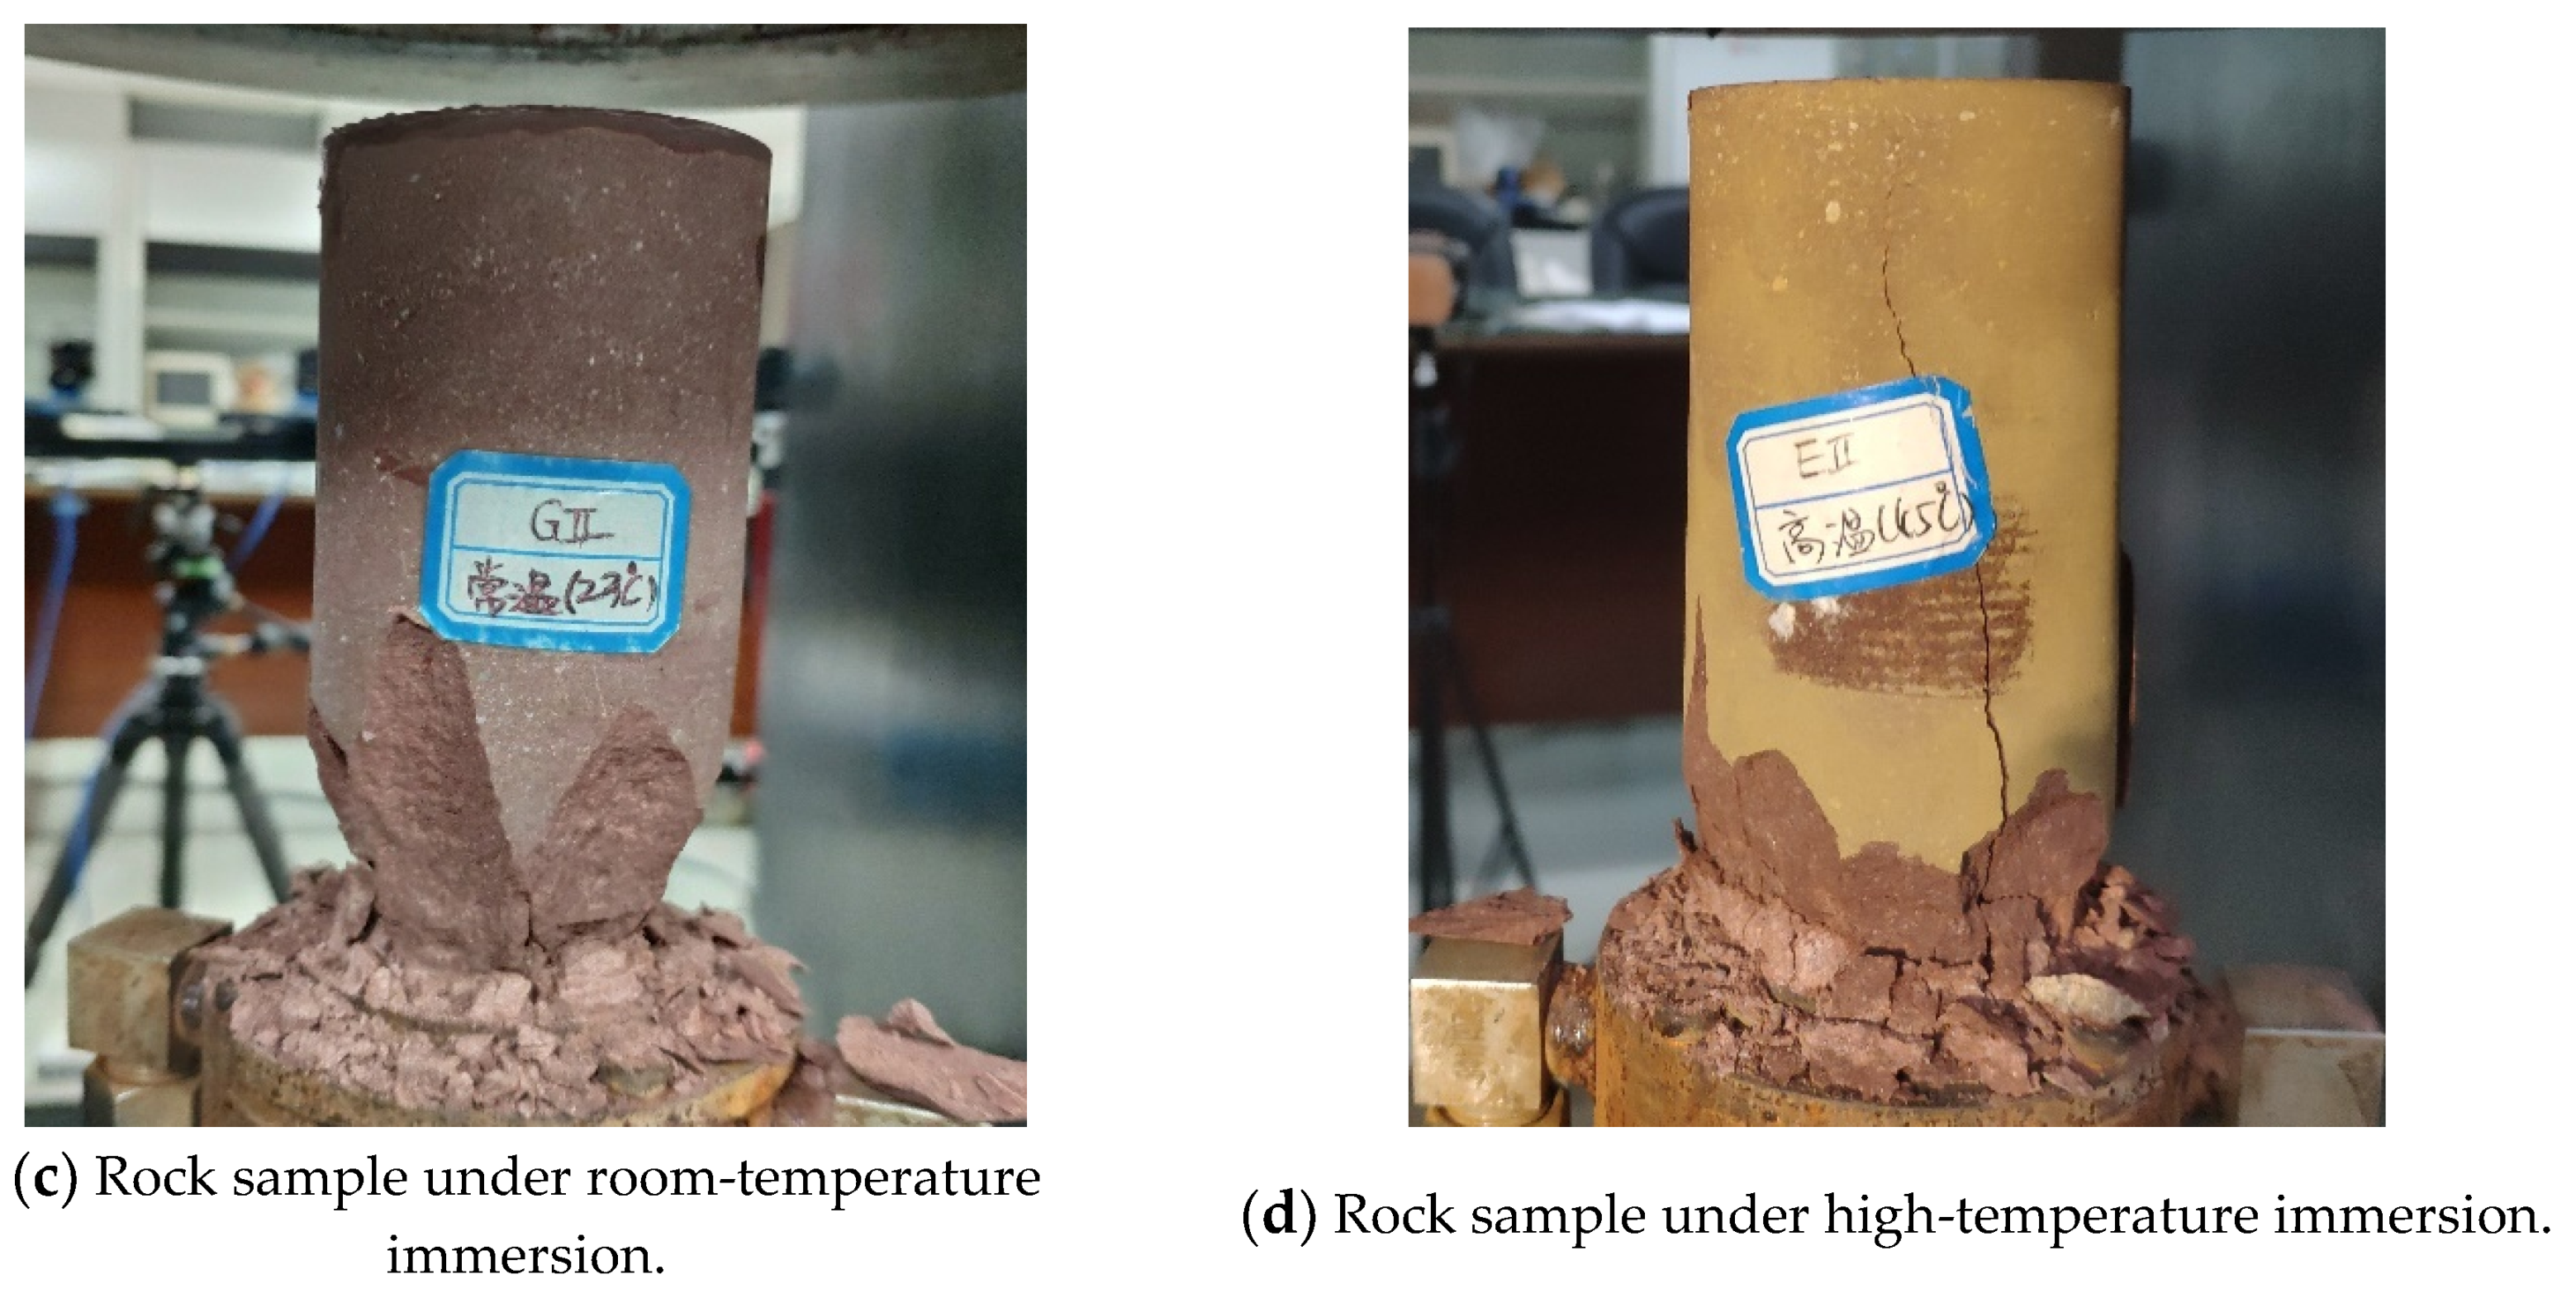
3.2.2. Contrast Analysis of the Visible Rock Fractures

The appearance of visible fractures in rock indicates that structural failure has taken place in the rock. Figure 9 shows the development of surface visible cracks of red-bed sandstone at three flow temperatures. It can be seen from the diagram that under the condition of the same saturation time, visual fractures and pores appear first in the high-temperature test sample compared to the low-temperature and high-temperature test samples, but no visual fractures or pores were found in the low-temperature test sample for about a month or so.
The author believes that high-temperature flow can promote the hydration and expansion of clay minerals in red-bed sandstone and the compression of throats by thermal expansion. Because of the difference in the thermal expansion coefficients of the different minerals in the rock and the anisotropy of thermal expansion itself, the high-temperature water flow can promote the hydration and expansion of the clay minerals in red-bed sandstone. This condition leads to an increase in the rock volume due to the differences in thermal expansion, which leads to the occurrences of stress concentration phenomena in rock and promotes the development of cracks in the rock.

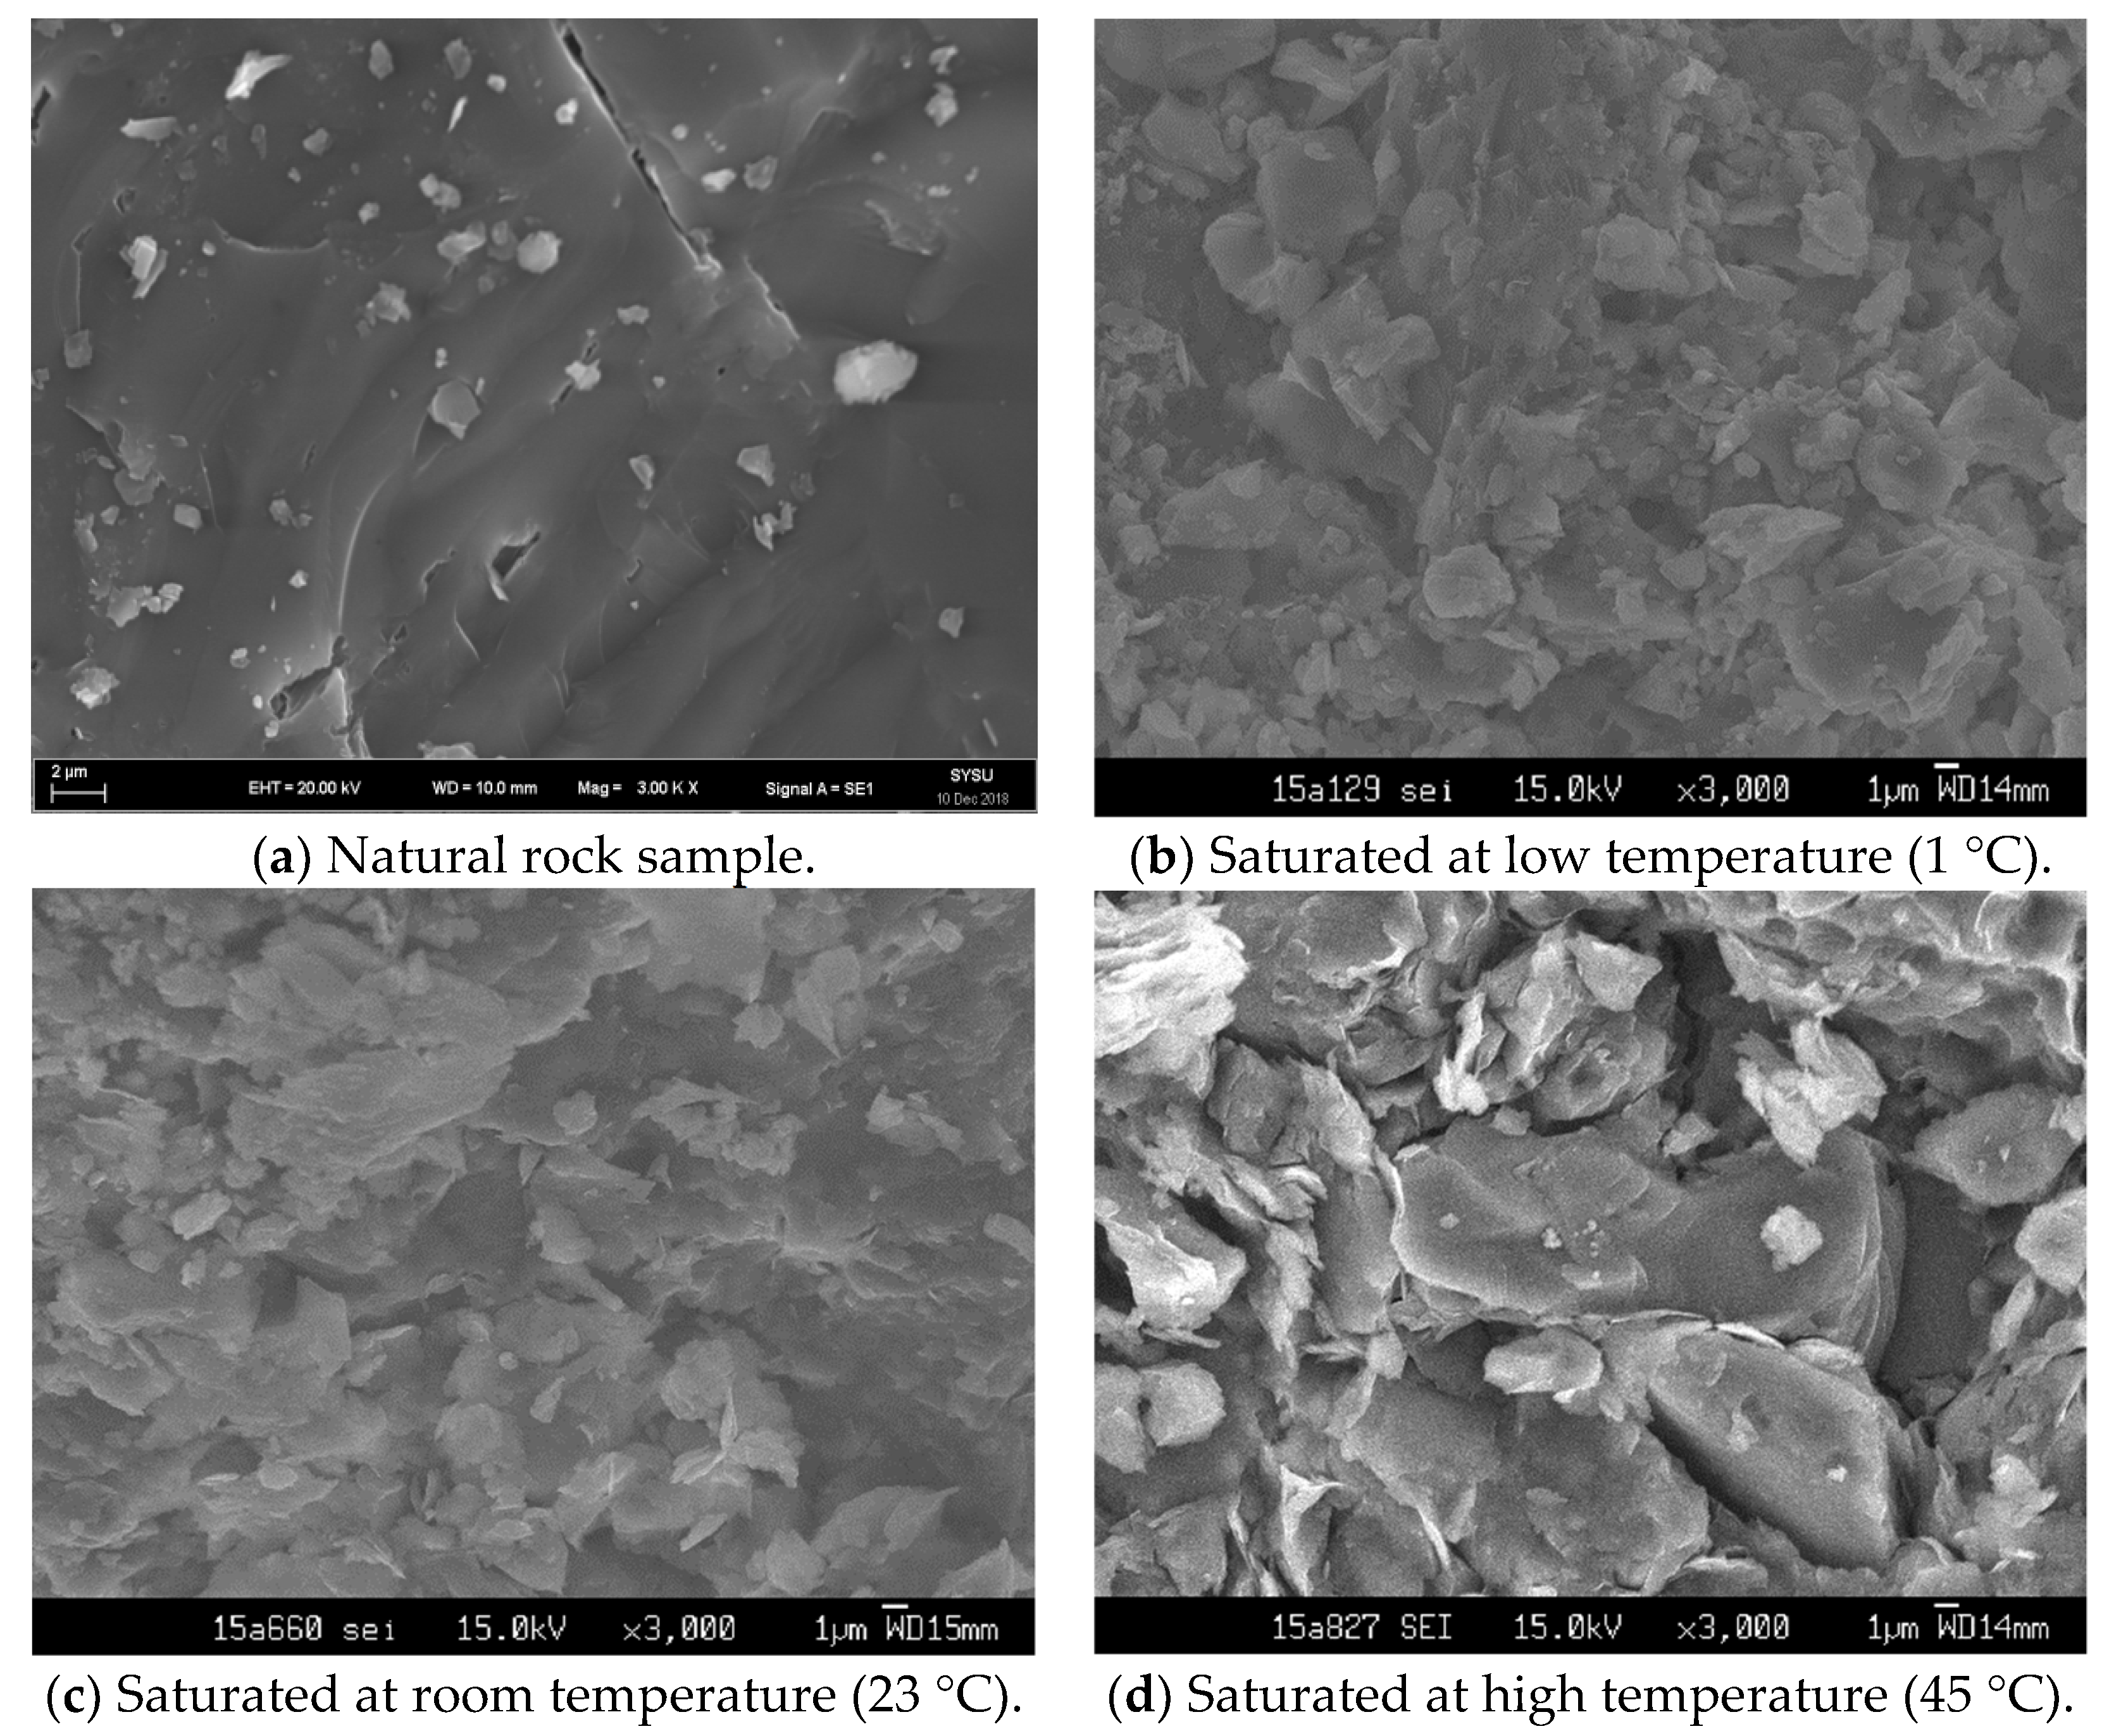
3.2.3. Qualitative Analysis of the Microscopic Rock Phenomena

As shown in Figure 10, four groups of clastic particles produced by uniaxial compression tests are scanned by SEM at a magnification of 3000 times (up to 300,000 times). The microstructural surfaces of natural rock samples are flat, and micropores are few. When the rock samples are soaked in low-temperature flow, petal structures appear and pores and micro-fissures increase, and the overall structure becomes porous and loose. The pore distribution of the rock sample after soaking in normal-temperature water tends to become homogenized, and the connection between particles tends to be loose, regardless of the sizes of the pores, and the shapes of the pores tend to be round compared to the original irregular polygon shapes. The connections between the particles of rock samples after high-temperature immersion are looser than those in the rock samples soaked in laminar flow, the arrangement is directional, and the porosity is higher. Compared with the variation degrees of the micro-structure of the four groups of rock samples, it can be found that with the increase in water flow temperature, the mesoscopic joints (scale: 10−8 m) of the rock samples and the development of pores are increasingly notable.

3.2.4. Rock Sample Porosity Calculation

The pore size, distribution, arrangement, and connectivity are important indicators of micro-structure changes. Therefore, the porosity n is used as a parameter for the quantitative analysis of the micro-structure in this study. Using SEM and computer image processing, fragments selected from similar parts of the natural rock samples and rock samples soaked in low-temperature, normal-temperature, and high-temperature water flows were observed and treated, and the porosity, n, was obtained by using the sandbox method of the fractal theory and a MATLAB porosity-solving program, as shown in Table 2.
As shown in Table 1, the porosities of the rock samples increase with increasing water flow temperature in a certain range. In conjunction with Figure 7, the higher the plane porosity is, the lower the collectivization degree of the rock particles is, the lower the compactness is, the stronger the connectivity between the pores is, the more loose the connection between the particles is, and the more loose and porous the structure is. With the increase in water flow temperature, the micro-structures of the rock samples transition from relatively compact, granular structures to loose, porous floc-like and petal-like structures, which shows the characteristics of expansion and deformation of soft rock under water flow conditions at different temperatures. The reason is that the permeability of red-bed sandstone increases with increasing water flow temperature, the stronger the acidity or alkalinity of the solution is, the faster the crack propagation is. When the pH value is neutral, corrosion is greatly alleviated, and the crack development becomes slow. Under the condition of circulating open channel flow, the pH value of the solution increases with the increase in the flow temperature, which further aggravates the formation of rock mass fissures [25].

3.3. Mechanical Laws of the Effects of the Different Temperatures in Turbulent Flow

3.3.1. Uniaxial Compressive Strength Test

Using the uniaxial compressive test of the A group of natural red-bed sandstone as a blank reference, uniaxial compression tests were carried out on the three groups of rock samples—B, C, and D—which were completely submerged at high temperature (45 °C), low temperature (1 °C), and medium temperature (23 °C), respectively, for the same time of water-rock interaction. A picture of the specimen after failure is shown in Figure 11, and the results of the uniaxial compressive strength tests of the three rock samples are compared, as shown in Table 3.

3.3.2. Test Result Analysis

The experimental results show that the uniaxial compressive strength of the rock sample immersed in the high-temperature water flow decreases most notably, which indicates that the high-temperature water flow promotes the softening failure of red-bed sandstone to a certain extent compared with the low-temperature water flow. The test results show that the rock sample immersed in the high-temperature water flow has the most notable decrease degree of the uniaxial compressive strength, and the decrease in mechanical strength is larger. It is not difficult to see that the mechanical properties of the saturated rock samples increase with the decrease in water flow temperature, and on the contrary, the mechanical properties of the saturated rock samples are weakened, which is reflected by the contrast diagram of the uniaxial compression of each group of rock samples immersed in water at different temperatures.
Because the whole test process is conducted under the condition of indoor dynamic water, and excludes the influences of other physical factors and combining the strength test results of red-bed sandstone at high temperature, medium temperature, and low temperature, the author believes that within a certain range, the water-rock physicochemical reaction can be promoted with the increase in water flow temperature. Compared with the normal-temperature flow, the internal structures of the rock samples immersed in the low-temperature water flow are less damaged, and the softening of red-bed sandstone is reduced.

4. Influence Mechanism

Under dynamic water conditions, the low-temperature water flow inhibits the reaction between H+ and the calcium and iron cementitious materials in red-bed sandstone, which are easily corroded by an aqueous solution, so the overall pH level of the circulating water solution is relatively lower than those of the normal-temperature and high-temperature water flows. Because the pH value of the aqueous solution also has an influence on crack growth, the stronger the acidity or alkalinity of the solution is, the greater the corrosion and the faster the crack growth; when the pH value is neutral, the corrosion effect will be greatly alleviated, and the crack development will become slow (such as calcium feldspar in acidic conditions into kaolinite, expand the pores of the rock) [25]. Under the condition of dynamic water circulation, the pH value of the low-temperature flow solution is close to neutral, which also alleviates the formation of rock mass cracks to a certain extent.
At the same time, the low-temperature flow inhibited the water-rock water reaction rate to a certain extent, which made the concentration of exchangeable ions in the circulating solution lower than that in the normal-temperature flow solution. The concentration of exchangeable ions in the solution is also an important factor affecting the degrees of ion exchange and adsorption. The lower the concentration of exchangeable ions is, the slower the exchange reaction is. With the increase in water flow temperature, the permeability and saturation rate of red-bed sandstone are also increased indirectly.
Overall, temperature influences the physical and chemical interactions of water-rock and then changes the internal structure of rock, thus affecting the softening and failure processes of red-bed sandstone. From a macro perspective, the rock sample immersed in the high-temperature water flow has the most notable decrease degree of the uniaxial compressive strength, and the decrease in mechanical strength is larger. It is not difficult to see that the mechanical properties of the saturated rock samples increase with the decrease in water flow temperature, and on the contrary, the mechanical properties of the saturated rock samples are weakened, which is reflected by the contrast diagram of the uniaxial compression of each group of rock samples immersed in water at different temperatures.

5. Conclusions

Under the condition of dynamic circulating flow in the range of 1–45 °C, the influences of different temperatures on the softening of red-bed sandstone in turbulent flow are studied in the laboratory. The results show that a low-temperature flow can inhibit the softening of red beds sandstone. With the increase in flow temperature, the higher the alkalinity of the circulating solution is, the faster the increase in the ion concentration, the higher the development degree of the corresponding micro-structure, and the greater the amplitude of the decrease in the mechanical strength. That is, temperature influences the physical and chemical interactions and then changes the internal structure of rock, thus affecting the softening and failure processes of red-bed sandstone. This research makes up for the deficiencies in the current quantitative analysis and mechanism explanation of rock softening caused by temperature under dynamic water conditions and provides a theoretical reference to explain the mechanism of a real red-bed slope catastrophe.

Author Contributions

Writing–original draft Z.L.; Data curation, X.H.; Software, G.C.; Supervision, C.Z.

Funding

The research is supported by the National Key Research and Development Project (Grant No. 2017YFC1501201), the National Natural Science Foundation of China (NSFC) (Grant No. 41472257, 41530638), the National Key Research and Development Project (Grant No. 2017YFC0804605), the Special Fund Key Project of Applied Science and Technology Research and Development in Guangdong (Grant No. 2015B090925016, No. 2016B010124007), the Special Support Programme for High Level Talents in Guangdong (Grant No. 2015TQ01Z344), the Science and technology planning project in Guangzhou (Grant No. 201803030005).

Acknowledgments

This work was supported by the National Key R&D Program of China (grant numbers 2017YFC1501201, 2017YFC0804605); the Major Program of National Natural Science Foundation of China (grant number 41530638); the Science and Technology Planning Project of Guangdong Province, China (grant numbers 2015B090925016, 2016B010124007); the Guangdong Province: Special Support Plan for High-Level Talents (grant number 2015TQ01Z344) and the Science and Technology Project of Guangzhou, China (grant number 201803030005).

Conflicts of Interest

The authors declare no conflict of interest.

References

  1. Miščević, P.; Vlastelica, G. Estimation of embankment settlement caused by deterioration of soft rock grains. Bull. Eng. Geol. Environ. 2019, 78, 1843–1853. [Google Scholar] [CrossRef]
  2. Vlastelica, G.; Miščević, P.; Pavić, N. Testing the shear strength of soft rock at different stages of laboratory simulated weathering. Građevinar 2016, 68, 955–966. [Google Scholar]
  3. Liu, Z.; He, X.; Fan, J.; Zhou, C. Study on the Softening Mechanism and Control of Red-Bed Soft Rock under Seawater Conditions. J. Mar. Sci. Eng. 2019, 7, 235. [Google Scholar] [CrossRef]
  4. Liu, Z.; He, X.F.; Zhou, C.Y. Influence Mechanism of Different Flow Patterns on the Softening of Red-Bed Soft Rock. J. Mar. Sci. Eng. 2019, 7, 155. [Google Scholar] [CrossRef]
  5. Voake, T.; Nermoen, A.; Korsnes, R.; Fabricius, I.L. Temperature cycling and its effect on mechanical behaviours of high-porosity chalks. J. Rock Mech. Geotech. Eng. 2018, 11, 749–759. [Google Scholar] [CrossRef]
  6. Veillard, C.M.; John, C.M.; Krevor, S.; Najorka, J. Rock-buffered recrystallization of Marion Plateau dolomites at low temperature evidenced by clumped isotope thermometry and X-ray diffraction analysis. Geochim. Cosmochim. Acta 2019, 252, 190–212. [Google Scholar] [CrossRef]
  7. Romero-Mujalli, G.; Hartmann, J.; Börker, J. Ecosystem controlled soil-rock pCO2 and carbonate weathering–Constraints by temperature and soil water content. Chem. Geol. 2018. [Google Scholar] [CrossRef]
  8. Wang, B.; Guo, X.; Li, F. Mechanical behavior of rock bolts under a high temperature environment. Int. J. Rock Mech. Min. Sci. 2018, 104, 126–130. [Google Scholar] [CrossRef]
  9. Su, G.S.; Chen, Z.Y.; Ju, J.W. Influence of temperature on the strainburst characteristics of granite under true triaxial loading conditions. Eng. Geol. 2017, 222, 38–52. [Google Scholar] [CrossRef]
  10. Guo, X.; Zou, G.; Wang, Y. Investigation of the temperature effect on rock permeability sensitivity. J. Pet. Sci. Eng. 2017, 156, 616–622. [Google Scholar] [CrossRef]
  11. Sun, Y.Z.; Xie, L.Z.; He, B. Effects of effective stress and temperature on permeability of sandstone from CO2-plume geothermal reservoir. J. Rock Mech. Geotech. Eng. 2016, 8, 819–827. [Google Scholar] [CrossRef]
  12. Tang, Y.; Xu, G.; Lian, J. Effect of temperature and humidity on the adhesion strength and damage mechanism of shotcrete-surrounded rock. Constr. Build. Mater. 2016, 124, 1109–1119. [Google Scholar] [CrossRef]
  13. Mehrgini, B.; Memarian, H.; Dusseault, M.B. Geomechanical characterization of a south Iran carbonate reservoir rock at ambient and reservoir temperatures. J. Nat. Gas Sci. Eng. 2016, 34, 269–279. [Google Scholar] [CrossRef]
  14. Zhang, W.; Sun, Q.; Hao, S. Experimental study on the variation of physical and mechanical properties of rock after high temperature treatment. Appl. Therm. Eng. 2016, 98, 1297–1304. [Google Scholar] [CrossRef]
  15. Li, W.J.; Zhu, C.; Yang, C.H. Experimental and DEM investigations of temperature effect on pure and interbedded rock salt. J. Nat. Gas Sci. Eng. 2018, 56, 29–41. [Google Scholar] [CrossRef]
  16. Minde, M.W.; Wang, W.X.; Madland, M.V. Temperature effects on rock engineering properties and rock-fluid chemistry in opal-CT-bearing chalk. J. Pet. Sci. Eng. 2018, 169, 454–470. [Google Scholar] [CrossRef]
  17. Motra, H.B.; Mager, J.; Ismail, A. Determining the influence of pressure and temperature on the elastic constants of anisotropic rock samples using ultrasonic wave techniques. J. Appl. Geophys. 2018, 159, 715–730. [Google Scholar] [CrossRef]
  18. Zhang, Z.X. Chapter 5—Effect of Temperature. In Rock Fracture and Blasting; Elsevier Inc.: Amsterdam, The Netherlands, 2016; pp. 111–133. [Google Scholar]
  19. Hemme, C.; van Berk, W. Change in cap rock porosity triggered by pressure and temperature dependent CO2–water-rock interactions in CO2 storage systems. Petroleum 2017, 3, 96–108. [Google Scholar] [CrossRef]
  20. Yavuz, H.; Demirdag, S.; Caran, S. Thermal effect on the physical properties of carbonate rocks. Int. J. Rock Mech. Min. Sci. 2010, 47, 94–103. [Google Scholar] [CrossRef]
  21. Liu, D.W.; Xiong, C.R. Experimental study on progressive disintegration characteristics of red sandstone. Chin. Foreign Highw. 2002, 6, 19–22. [Google Scholar]
  22. Ministry of Water Resources. Specifications for Rock Tests in Water Conservancy and Hydroelectric Engineering (SL264-2001); China WaterPower Press: Beijing, China, 2001.
  23. Song, L. Study on the Microcosmic Mechanism of Softening Red Rock with Water; Southwest Jiaotong University: Chengdu, China, 2014. [Google Scholar]
  24. Zhou, C.Y.; Deng, Y.M.; Tan, X.S.; Lin, C.X.; Wen, S.R. Study on the variation of chemical composition of water solution in soft rock during saturated process. J. Rock Mech. Eng. 2004, 22, 3813–3817. [Google Scholar]
  25. Marco, M.; Francesco, S.; Leonardo, P.; Andrea, C.; Jo, D.W. A hybrid model to evaluate subsurface chemical weathering and fracture karstification in quartz sandstone. J. Hydrol. 2019, 572, 745–760. [Google Scholar]
Figure 1. Structural schematic diagram of multifunctional open channel hydraulics test equipment. A1: Stable water head; A2: Pmma test flume; A3: Tail portal opening wheel; A4: Funnel; A5: Aqueduct; A6: Reservoir; A7: Discharge valve; A8: Electromagnetic flow metre; A9: Electronic valve; A10: Centrifugal pump. B1: Copper tube; B2: Temperature sensor; B3: Refrigeration instruments; B4: Circulating pump; B5: Heating instruments. C: Automatic water supply module. D: Control cabinet. E: Flow direction.
Jmse 07 00355 g001
Figure 2. Physical image of multifunctional open channel hydraulics test equipment.
Jmse 07 00355 g002
Figure 3. Sample chart: (a) Natural rock sample; (b) Saturated rock sample.
Jmse 07 00355 g003
Figure 4. State diagram of the low-temperature (1 °C) test under dynamic water conditions.
Jmse 07 00355 g004
Figure 5. Change diagram of the pH of the circulating aqueous solution in turbulent flow at different temperatures. Changes in the main anodic and cationic concentrations.
Jmse 07 00355 g005
Figure 6. Curve of the main cationic concentration in the circulating aqueous solution at different temperatures.
Jmse 07 00355 g006
Figure 7. Curves of the concentration variation in the main anions in the circulating aqueous solution at different temperatures.
Jmse 07 00355 g007
Figure 8. Variation curve of the average moisture content of red-bed sandstone at different temperatures.
Jmse 07 00355 g008
Figure 9. Comparison diagram of the surface visible cracks.
Jmse 07 00355 g009aJmse 07 00355 g009b
Figure 10. Change diagram of the micro-structures of the rock samples at different temperatures (3000×).
Jmse 07 00355 g010
Figure 11. Specimens after failure under uniaxial compression testing.
Jmse 07 00355 g011aJmse 07 00355 g011b
Table 1. Red-bed sandstone physical property index
Rock NameWater Content (%)Dry Density (g/cm3)Density (g/cm3)Specific GravityWater Absorption (%)Porosity (%)
Red-bed sandstone0.45–0.52.46–2.572.47–2.582.68–2.720.8–1.510–10.8
Table 2. Statistical table of the porosity change in red-bed sandstone in the different temperature flows.
NumberCategoryPorosity/n
1Dry0.58%
2Low temperature14.00%
3Medium temperature24.04%
4High temperature26.58%
Table 3. Rock sample compressive strength results.
NumberUniaxial Compressive Strength (MPa)
Condition Average ValueSoftening Coefficient
Dry40.8350.9450.9147.561
Low temperature28.5431.4330.8430.270.64
Medium temperature23.0927.4625.9825.510.54
High temperature16.0114.1115.5115.210.32

