Evaluation of the Viscous Drag for a Domed Cylindrical Moored Wave Energy Converter
Abstract
:1. Introduction and Background
2. Methodology
2.1. Introduction
- –
- = fluid density,
- –
- U = maximum velocity,
- –
- D = relevant characteristic dimension of the rigid structure,
- –
- = dynamic viscosity of the fluid.
- –
- = amplitude of the sinusoidal velocity,
- –
- T = time period of the sinusoidal velocity.
- –
- force due to the inertia; an effect of the irrotational (potential) assumption, i.e., ;
- –
- force due to the viscous drag; effect of the skin friction and flow separation, i.e.,
| = fluid density, | = relevant cross-sectional area, | ||
| V | = volume of the structure, | = drag coefficient, | |
| = inertia coefficient, | = fluid velocity, | ||
| = fluid acceleration, | U | = body velocity, | |
| = body acceleration. |
- (i).
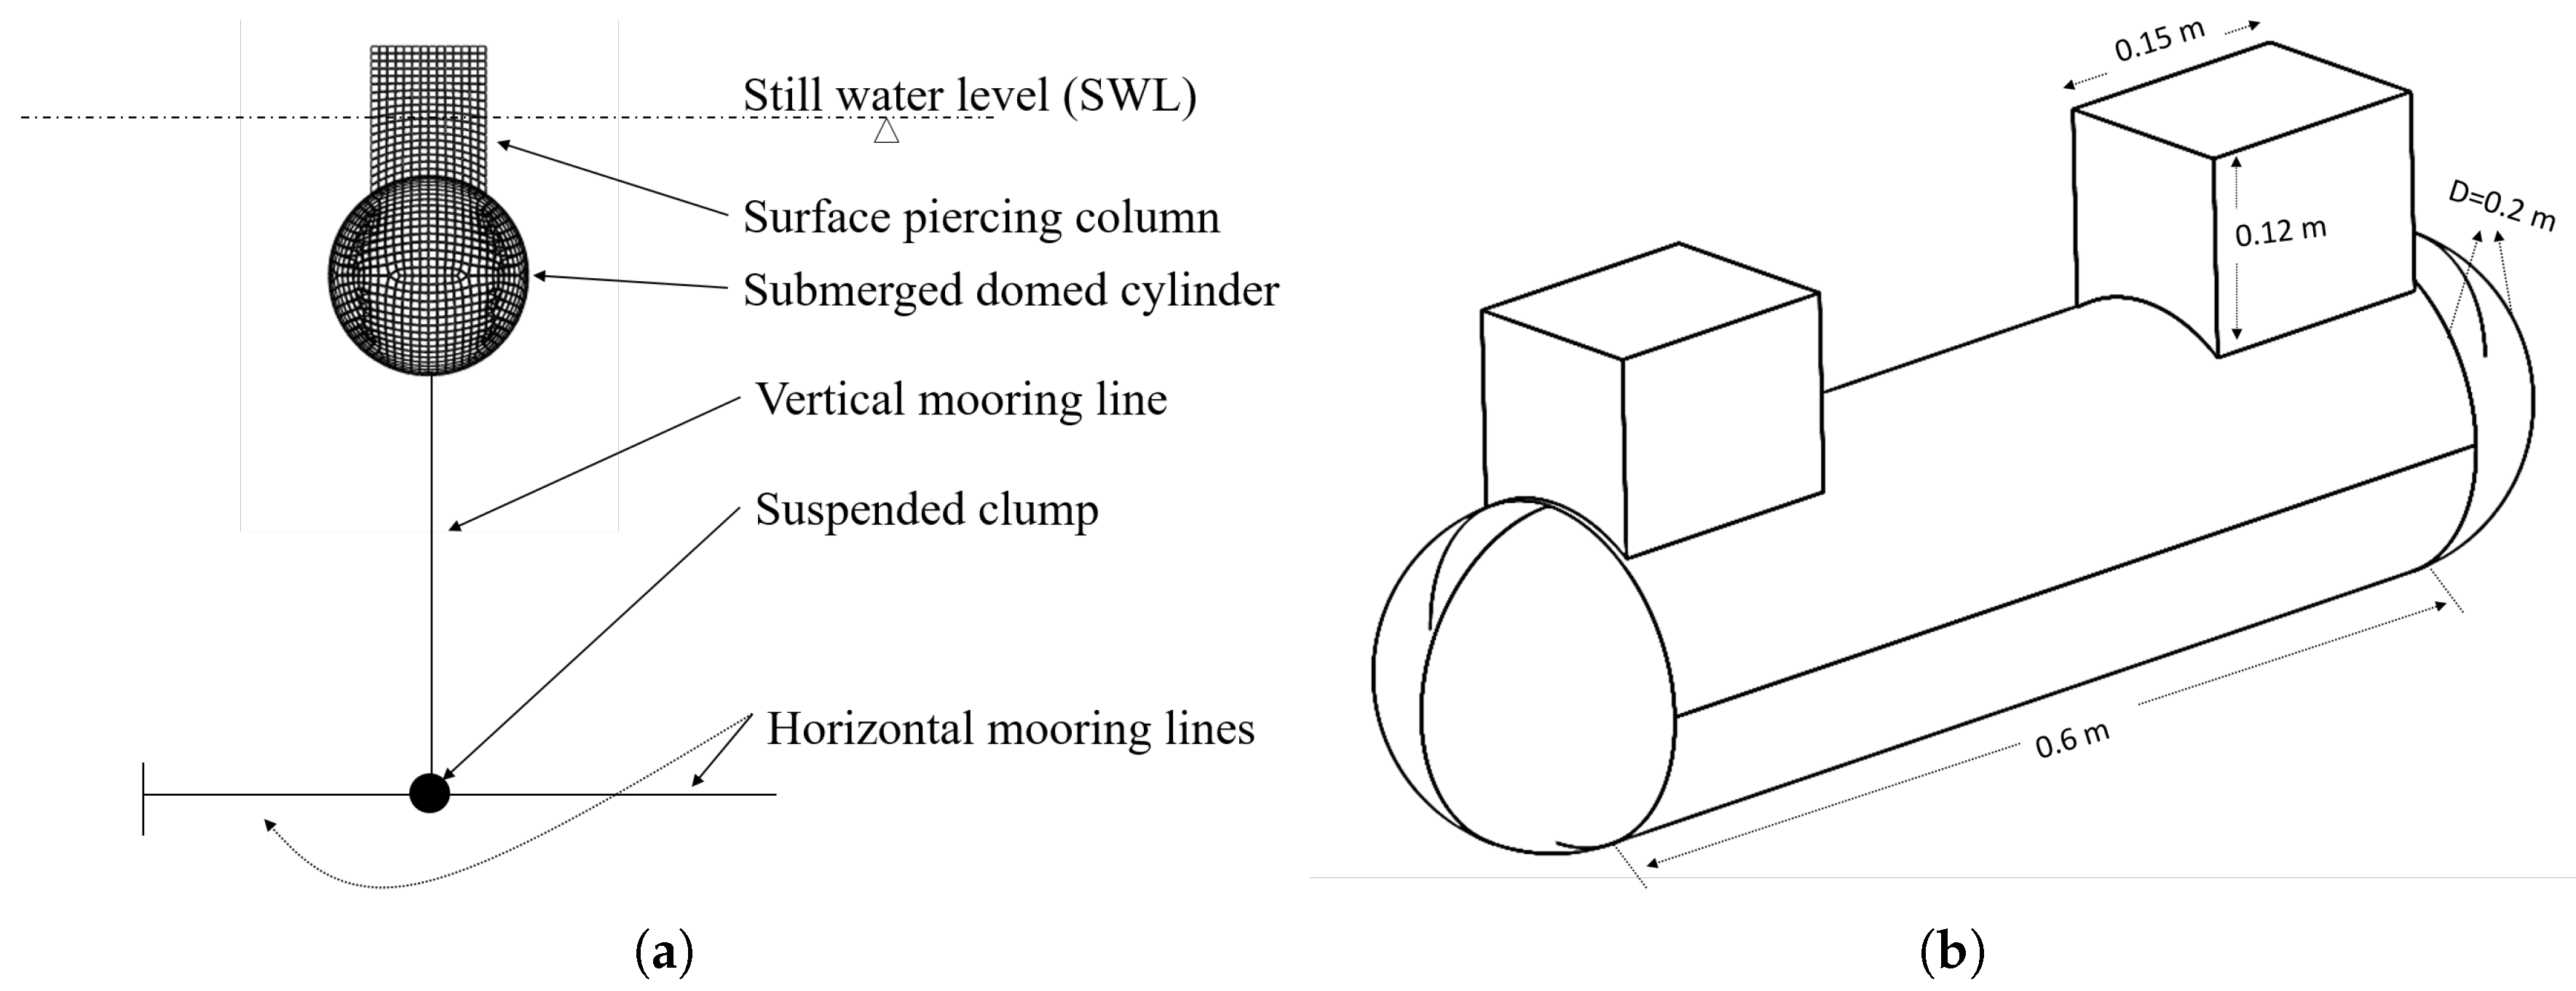
- a submerged horizontal cylindrical part which has domed ends;
- (ii).
- two rectangular columns attached at the top surface of the domed cylinder.
2.2. Frequency Domain Model And Results
| = angular frequency in [rad/s], | m | = mass of the structure, | |
| = frequency-dependent added mass, | = frequency-dependent wave damping, | ||
| C | = linear viscous damping (if any), | = hydrostatic stiffness, | |
| K | = additional stiffness (if any), | = frequency-dependent excitation force amplitude | |
| (complex variable). |
2.3. Time Domain Model
- –
- = added mass at infinite frequency,
- –
- = acceleration of structure,
- –
- = wave excitation force,
- –
- = non-linear viscous drag force.
- –
- = complex velocity-dependent variables,
- –
- = real part of the Prony coefficient,
- –
- = imaginary part of the Prony coefficient.
- –
- = wave amplitude of frequency wave,
- –
- = frequency-dependent wave excitation force (complex variable),
- –
- = phase variable used to generate random wave field’
- –
- = total number of wave frequencies.
2.4. Evaluation of the Drag Coefficient ()
3. Results
3.1. The Drag Coefficient ()
3.2. Time Domain Model Results And Analysis
- –
- = Spectral density of the response,
- –
- = Spectral density of the wave signal.
3.3. Discussion
4. Conclusions
Author Contributions
Funding
Acknowledgments
Conflicts of Interest
References
- Perez, T. Ship Motion Control: Course Keeping and Roll Stabilisation Using Rudder and Fins; Springer: Berlin/Heidelberg, Germany, 2005. [Google Scholar]
- Bhinder, M.A.; Babarit, A.; Gentaz, L.; Ferrant, P. Potential time domain model with viscous correction and CFD analysis of a generic surging floating wave energy converter. Int. J. Mar. Energy 2015, 10, 70–96. [Google Scholar] [CrossRef]
- Penalba, M.; Giorgi, G.; Ringwood, J. A Review of Non-Linear Approaches for Wave Energy Converter Modelling. In Proceedings of the 11th European Wave and Tidal Energy Conference, Nantes, France, 6–11 September 2015. [Google Scholar]
- Palm, J.; Eskilsson, C.; Paredes, G.M.; Bergdahl, L. Coupled mooring analysis for floating wave energy converters using CFD: Formulation and validation. Int. J. Mar. Energy 2016, 16, 83–99. [Google Scholar] [CrossRef]
- Thilleul, O.; Babarit, A.; Drouet, A.; Le Floch, S. Validation of CFD for the determination of damping coefficients for the use of Wave Energy Converters modelling. In Proceedings of the International Conference on Offshore Mechanics and Arctic Engineering-OMAE, Nantes, France, 9–14 June 2013; Volume 9. [Google Scholar] [CrossRef]
- Bhinder, M.A.; Babarit, A.; Gentaz, L.; Ferrant, P. Assessment of Viscous Damping via 3D-CFD Modelling of a Floating Wave Energy Device. In Proceedings of the 9th European Wave and Tidal Energy Conference EWTEC, Southampton, UK, 5–9 September 2011. [Google Scholar]
- Bhinder, M.A.; Babarit, A.; Gentaz, L.; Ferrant, P. Effect of viscous forces on the performance of a surging wave energy converter. In Proceedings of the Twenty-Second International Offshore and Polar Engineering Conference, Rhodes, Greece, 17–22 June 2012. [Google Scholar]
- Pistidda, A.; Ottens, H.; Zoontjes, R. Using CFD to assess low frequency damping. In Proceedings of the International Conference on Offshore Mechanics and Arctic Engineering-OMAE, Rio de Janeiro, Brazil, 1–6 July 2012; Volume 5, pp. 657–665. [Google Scholar]
- Jin, S.; Patton, R.J.; Guo, B. Viscosity effect on a point absorber wave energy converter hydrodynamics validated by simulation and experiment. Renew. Energy 2018, 129, 500–512. [Google Scholar] [CrossRef]
- Ananthakrishnan, P. Viscosity and nonlinearity effects on the forces and waves generated by a floating twin hull under heave oscillation. Appl. Ocean Res. 2015, 51, 138–152. [Google Scholar] [CrossRef]
- Nematbakhsh, A.; Michailides, C.; Gao, Z.; Moan, T. Comparison of Experimental Data of a Moored Multibody Wave Energy Device With a Hybrid CFD and BIEM Numerical Analysis Framework. In Proceedings of the 34th International Conference on Ocean, Offshore and Arctic Engineering, St. John’s, NF, Canada, 31 May–5 June 2015; Volume 9. [Google Scholar] [CrossRef]
- Palm, J.; Eskilsson, C.; Bergdahl, L.; Bensow, R.E. Assessment of Scale Effects, Viscous Forces and Induced Drag on a Point-Absorbing Wave Energy Converter by CFD Simulations. J. Mar. Sci. Eng. 2018, 6, 124. [Google Scholar] [CrossRef]
- Davis, A.F.; Fabien, B.C. Systematic identification of drag coefficients for a heaving wave follower. Ocean Eng. 2018, 168. [Google Scholar] [CrossRef]
- Zangeneh, R.; Thiagarajan, K.; Urbina, R.; Tian, Z. Viscous damping effects on heading stability of turret-moored ships. In Proceedings of the International Conference on Offshore Mechanics and Arctic Engineering-OMAE, San Francisco, CA, USA, 7–12 June 2014; Volume 8A. [Google Scholar] [CrossRef]
- Sumer, B.; Fredsøe, J. Hydrodynamics around Cylindrical Strucures; World Scientific Pub Co Inc.: Hackensack, NJ, USA, 2006; Volume 26. [Google Scholar]
- Faltinsen, O. Sea Loads on Ships and Offshore Structures; Cambridge University Press: Cambridge, UK, 1993; Volume 1. [Google Scholar]
- Morison, J.; O’Brien, M.; Johnson, J.; Schaaf, S. The force exerted by surface waves on piles. J. Pet. Trans. 1950, 189, 149–157. [Google Scholar] [CrossRef]
- Costello, R.; Padeletti, D.; Davidson, J.; Ringwood, J. Comparison of numerical simulations with experimental measurements for the response of a modified submerged horizontal cylinder moored in waves. In Proceedings of the ASME 2014 33rd International Conference on Ocean, Offshore and Arctic Engineering OMAE, San Francisco, CA, USA, 8–13 June 2014. [Google Scholar]
- Cummins, W. The Impulse Response Function and Ship Motions; Technical Report; DTIC Document; David Taylor Model Basin: Washington, DC, USA, 1962. [Google Scholar]
- Babarit, A.; Duclos, G.; Clément, A. Comparison of latching control strategies for a heaving wave energy device in random sea. Appl. Ocean Res. 2004, 26, 227–238. [Google Scholar] [CrossRef]
- Sheng, W.; Alcorn, R.; Lewis, A. A new method for radiation forces for floating platforms in waves. Ocean Eng. 2015, 105, 43–53. [Google Scholar] [CrossRef]
- Journee, J.; Massie, W. Offshore Hydromechanics; Delft University of Technology: Delft, The Netherlands, 2001. [Google Scholar]
- Bhinder, M.A. 3D Non-Linear Numerical Hydrodynamic Modelling of Floating Wave Energy Converters. Ph.D. Thesis, Ecole Centrale de Nantes, Nantes, France, 2013. [Google Scholar]


| Heave | |||||
| Period | Um | ||||
| 2.29595 | 0.16901025 | 2.25347 | 0.462519968 | 7.01 | 4.63 × 10 |
| 0.89581 | 0.01740397 | 0.23205 | 0.122070975 | 0.72 | 1.22 × 10 |
| Surge | |||||
| Period | Um | ||||
| 3.7 | 2.84164 | 0.21312 | 0.36303 | 8.84 | 5.50 × 10 |
| 0.90 | 0.66324 | 0.04974 | 0.34634 | 2.06 | 5.24 × 10 |
| Parameter | Symbol & Units | Value |
|---|---|---|
| Heave mode | ||
| Total stiffness | [N/m] | 369.5 |
| Estimated drag coefficient. | [-] | 0.5 |
| Mass | m [kg] | 8.9 |
| Mass of clump | [kg] | 19.75 |
| Surge mode | ||
| Total stiffness | [N/m] | 132 |
| Estimated drag coefficient. | [-] | 2.4 |
| Mass | m [kg] | 8.9 |
| Simulation—Time Domain Model | RMSE |
|---|---|
| From time series | |
| Surge (time 0 s–512 s) | 0.016 |
| Surge (time 256 s–512 s) | 0.017 |
| Heave(time 0 s–512 s) | 0.010 |
| Heave (time 256 s–512 s) | 0.012 |
| From spectral densities | |
| Surge (for time series of 256 s–512 s) | 2.3 × 10 |
| Heave (for time series of 256 s–512 s) | 3.9 × 10 |
| Response | Correlation Coefficient (r) |
|---|---|
| Surge | 0.92 |
| Heave | 0.91 |
© 2019 by the authors. Licensee MDPI, Basel, Switzerland. This article is an open access article distributed under the terms and conditions of the Creative Commons Attribution (CC BY) license (http://creativecommons.org/licenses/by/4.0/).
Share and Cite
Bhinder, M.A.; Murphy, J. Evaluation of the Viscous Drag for a Domed Cylindrical Moored Wave Energy Converter. J. Mar. Sci. Eng. 2019, 7, 120. https://doi.org/10.3390/jmse7040120
Bhinder MA, Murphy J. Evaluation of the Viscous Drag for a Domed Cylindrical Moored Wave Energy Converter. Journal of Marine Science and Engineering. 2019; 7(4):120. https://doi.org/10.3390/jmse7040120
Chicago/Turabian StyleBhinder, Majid A, and Jimmy Murphy. 2019. "Evaluation of the Viscous Drag for a Domed Cylindrical Moored Wave Energy Converter" Journal of Marine Science and Engineering 7, no. 4: 120. https://doi.org/10.3390/jmse7040120
APA StyleBhinder, M. A., & Murphy, J. (2019). Evaluation of the Viscous Drag for a Domed Cylindrical Moored Wave Energy Converter. Journal of Marine Science and Engineering, 7(4), 120. https://doi.org/10.3390/jmse7040120


