Key Performance Indicator Development for Ship-to-Shore Crane Performance Assessment in Container Terminal Operations
Abstract
1. Introduction
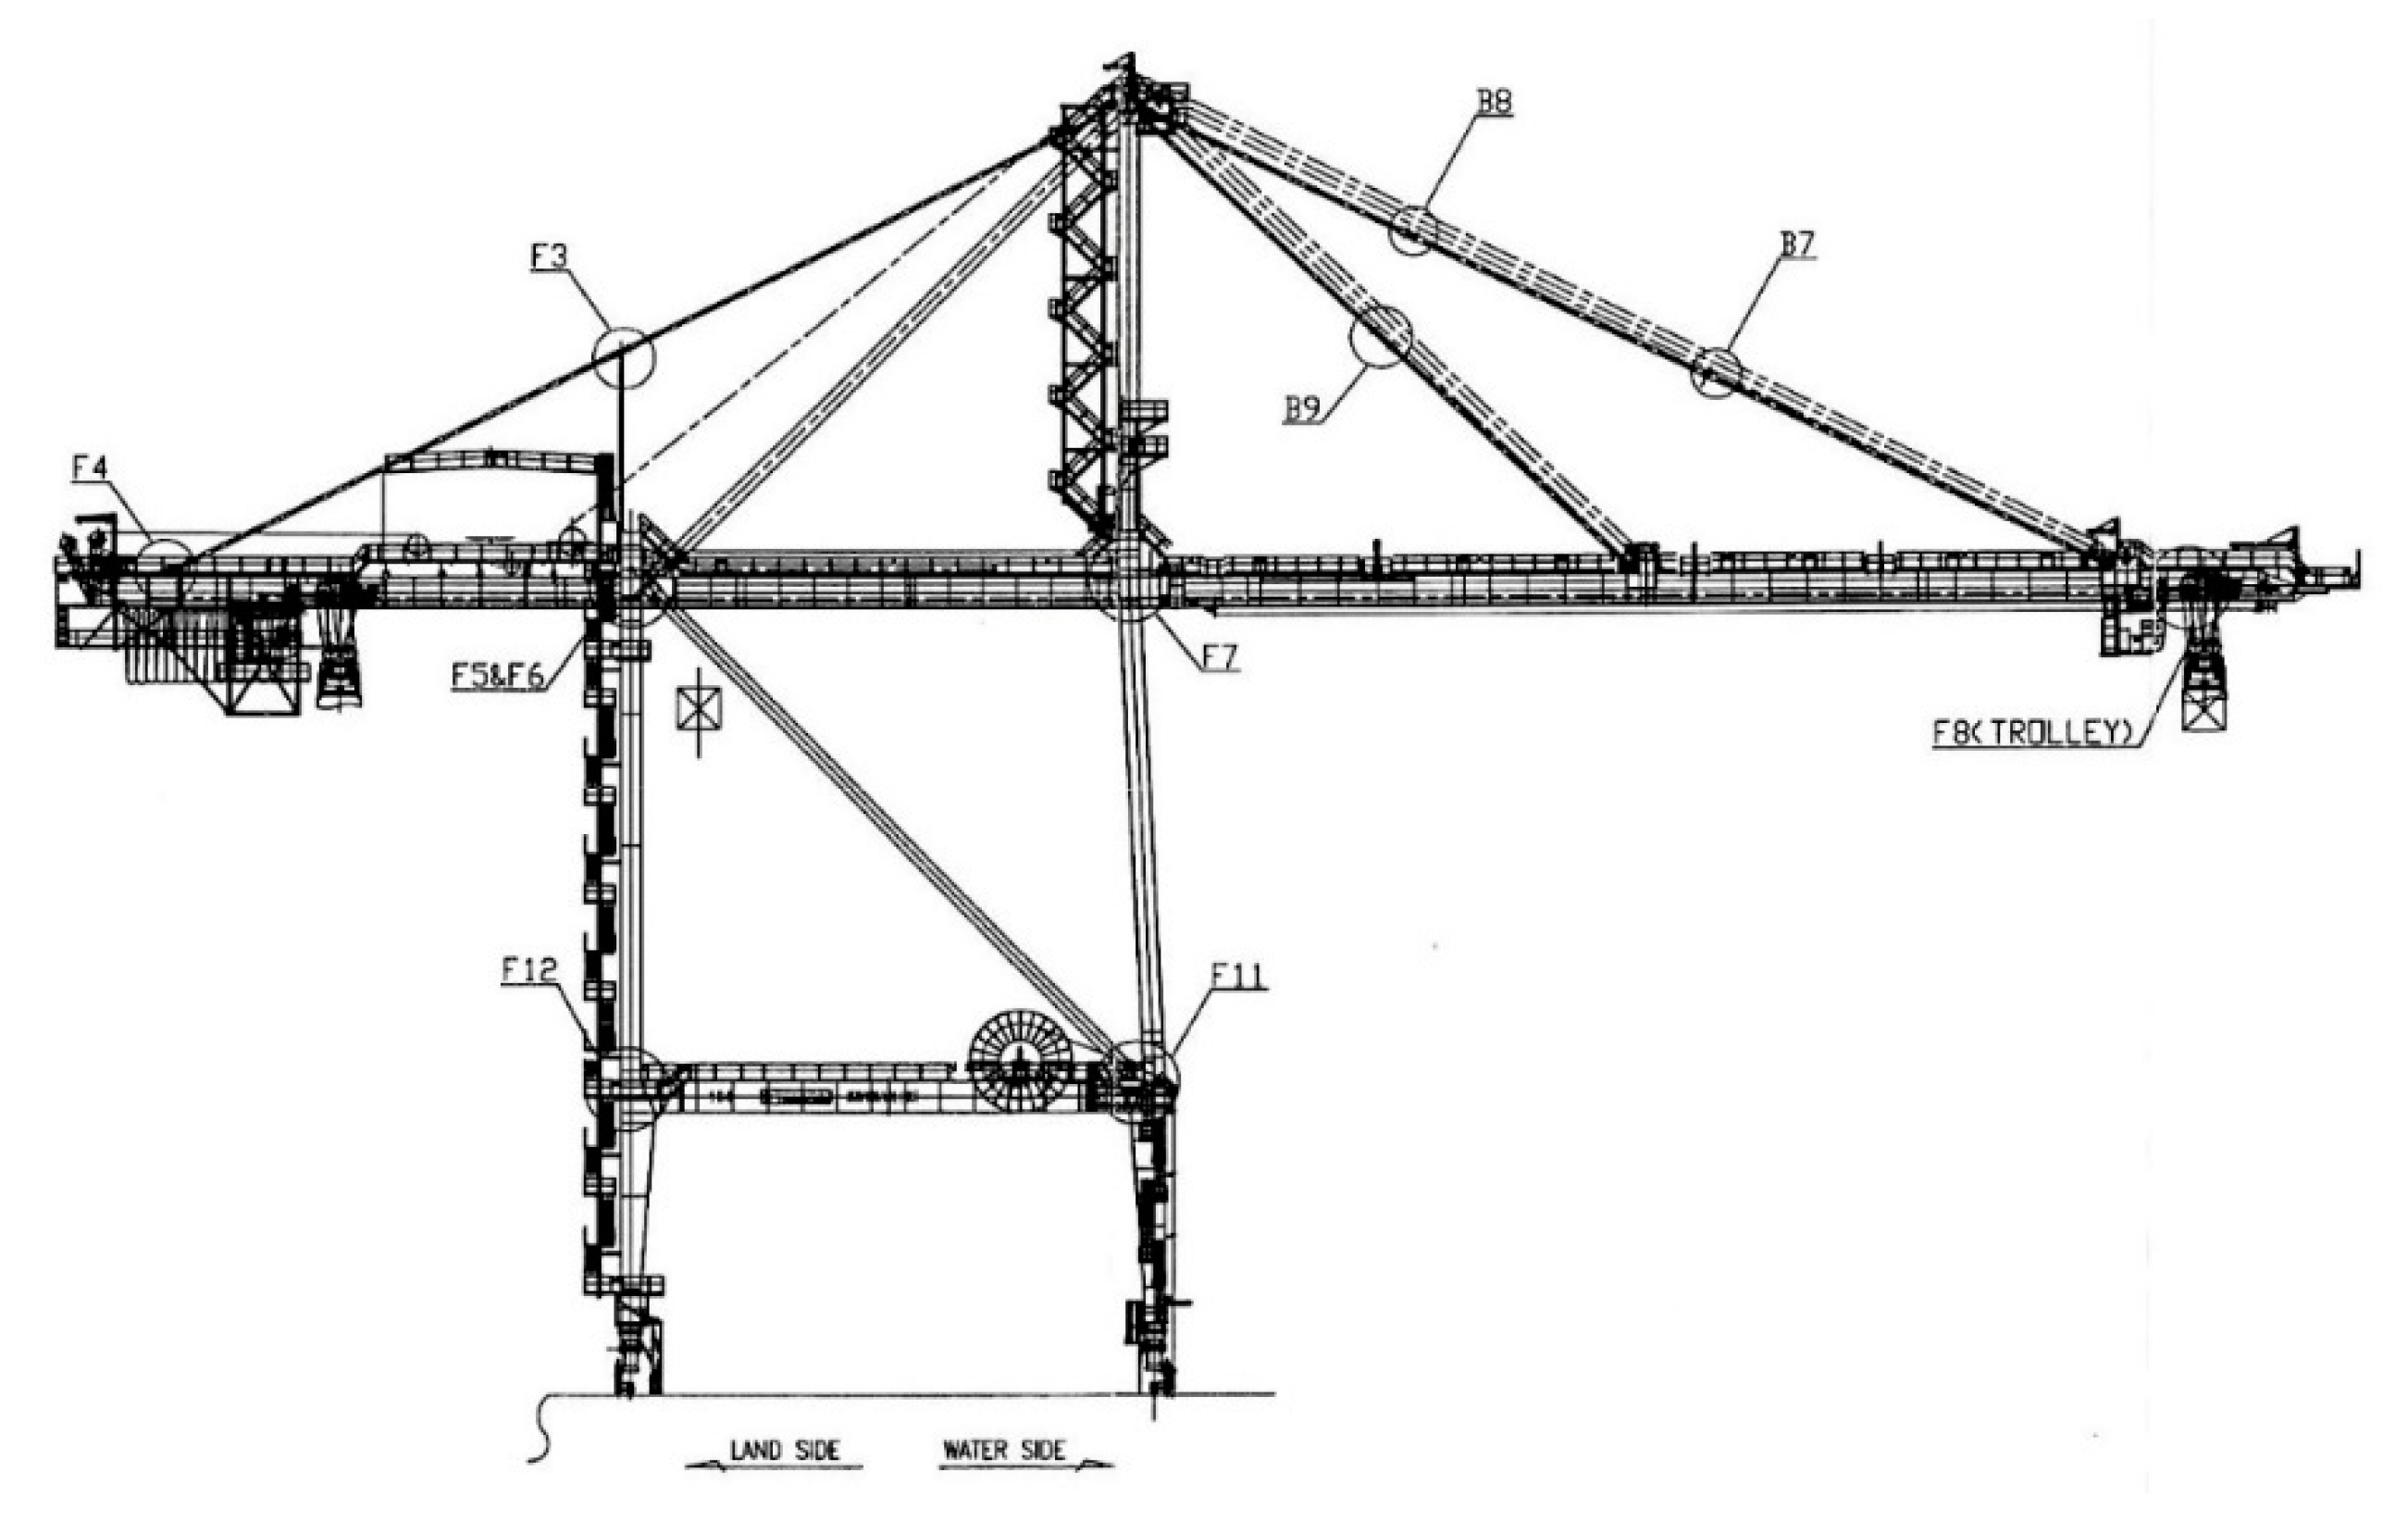
2. Introduction of Ship-to-Shore Crane and Performance Indicators
2.1. Ship-to-Shore Crane
2.2. Crane Performance Indicators
- (1)
- Tem: Total time for emergency maintenance
- (2)
- Tps: Total time for preventive maintenance
- (3)
- Fem: Frequency of emergency breakdown
- (4)
- TLC: Twist lock count (lock + hoisting-lowering + unlock)
- (5)
- Top: Total operating time of crane (gantry + boom hoist + main hoist + trolley-overlapping motion of main hoist & trolley)
- (6)
- Tno: Time of net operation (main hoist + trolley-overlapping main hoist/trolley)
- (7)
- Toc: Total occupied time (control source on time)
- (8)
- Tmc: Total machine time (24 h/day for 24 hour terminal operations)
- (9)
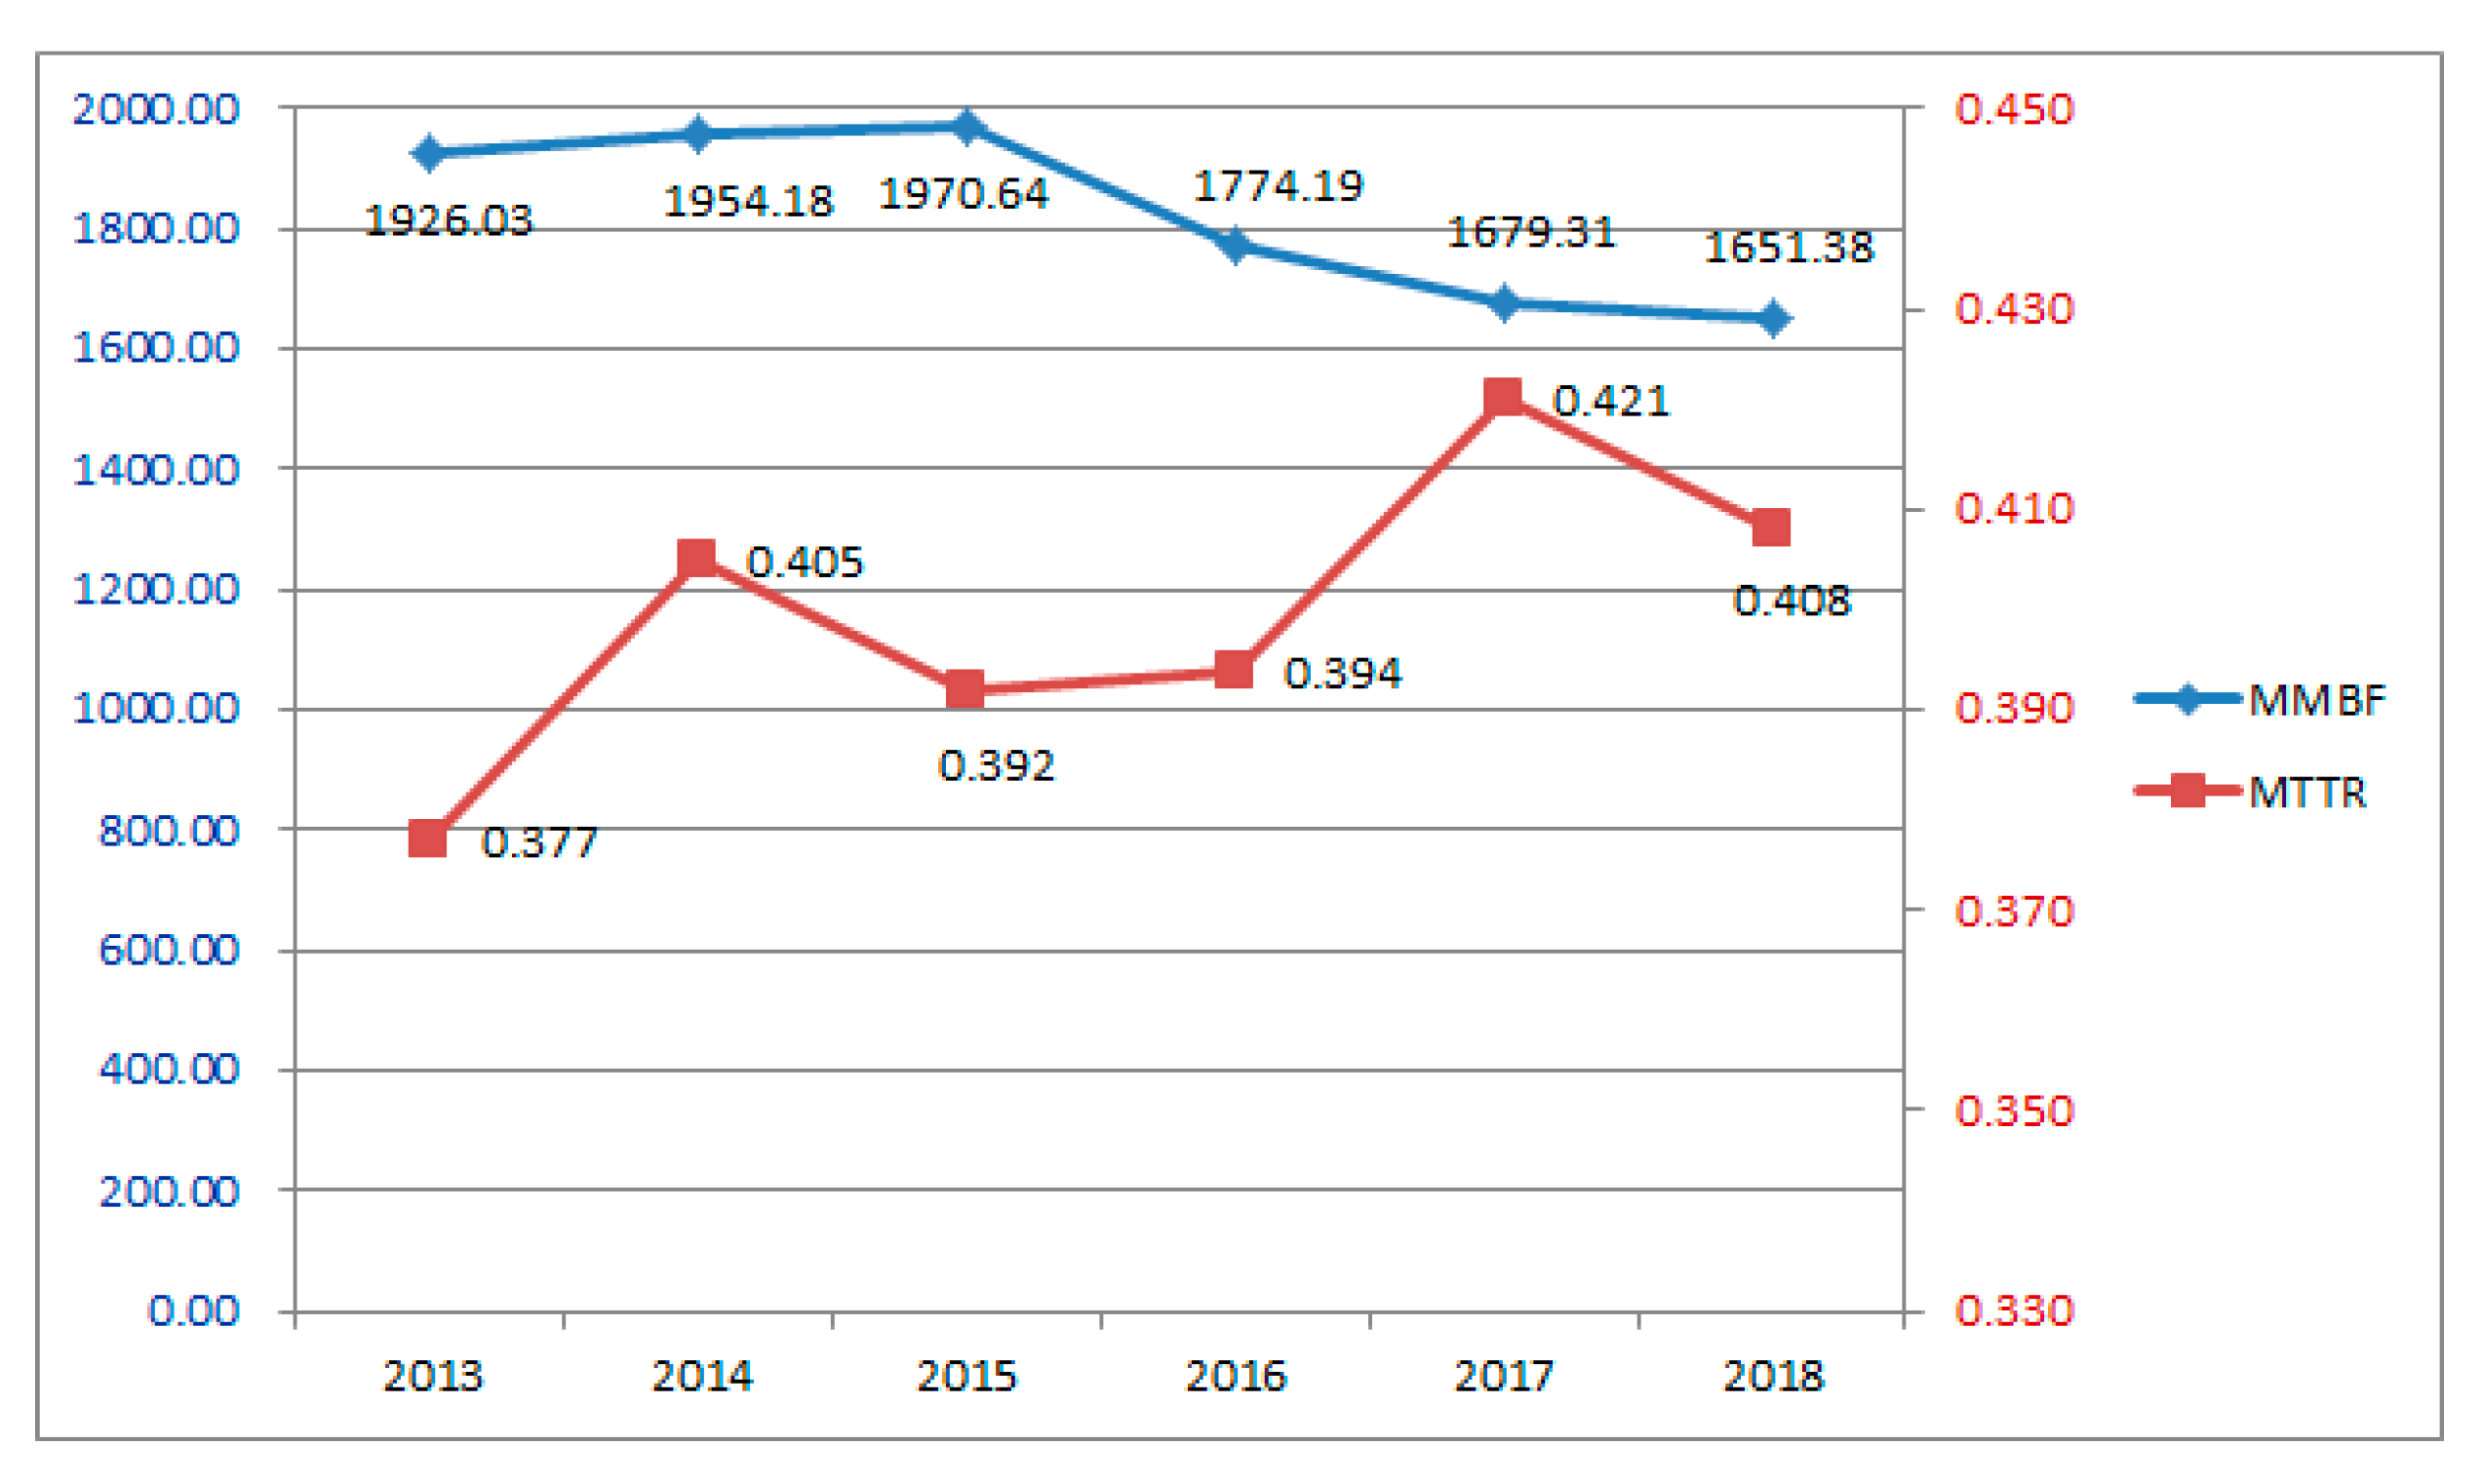
- MMBF: Mean movements between failure (calculation formula: TLC/Fem)
- (10)
- MTTR: Mean time to repair (calculation formula: Tem/Fem)
- (11)
- Utilization: operation time (calculation formula: (Top/ (Tmc - Tps - Tem)) × 100%)
- (12)
- Ai: Overall availability (calculation formula: ((Tmc - Tem - Tps)/Tmc) × 100%)
- (13)
- Ao: Availability per occupied time (calculation formula: ((Toc - Tem)/Toc) × 100%)
- (14)
- Breakdown percentage (calculation formula: 1 - Ao%)
- (15)
- PM: Preventive maintenance (calculation formula: (Tps/Tmc) × 100%)
- (16)
- EM: Emergency maintenance (calculation formula: (Tem/Tmc) × 100%)
- (17)
- TDT: Total downtime (calculation formula: 1 - Ai or (PM% + EM%))
- (18)
- Net cycle time: pure time to handle 1 VAN of a container (calculation formula: (Tno × 60)/TLC)
- (19)
- Theoretical handling capacity: theoretical container handling quantity for 1 hour (calculation formula: 60/net cycle time)
- (1)
- To realize the efficient and effective maintenance
- (2)
- To realize the maintenance with quality
- (3)
- To deliver the maintenance in the time allowed
- (4)
- To deliver maintenance cost and added value from manpower
- (5)
- To realize the maintenance its priority is safety
3. Key Performance Indicators and Man-Hours
3.1. Mean Movements between Failure (MMBF)
3.2. Mean Time to Repair (MTTR)
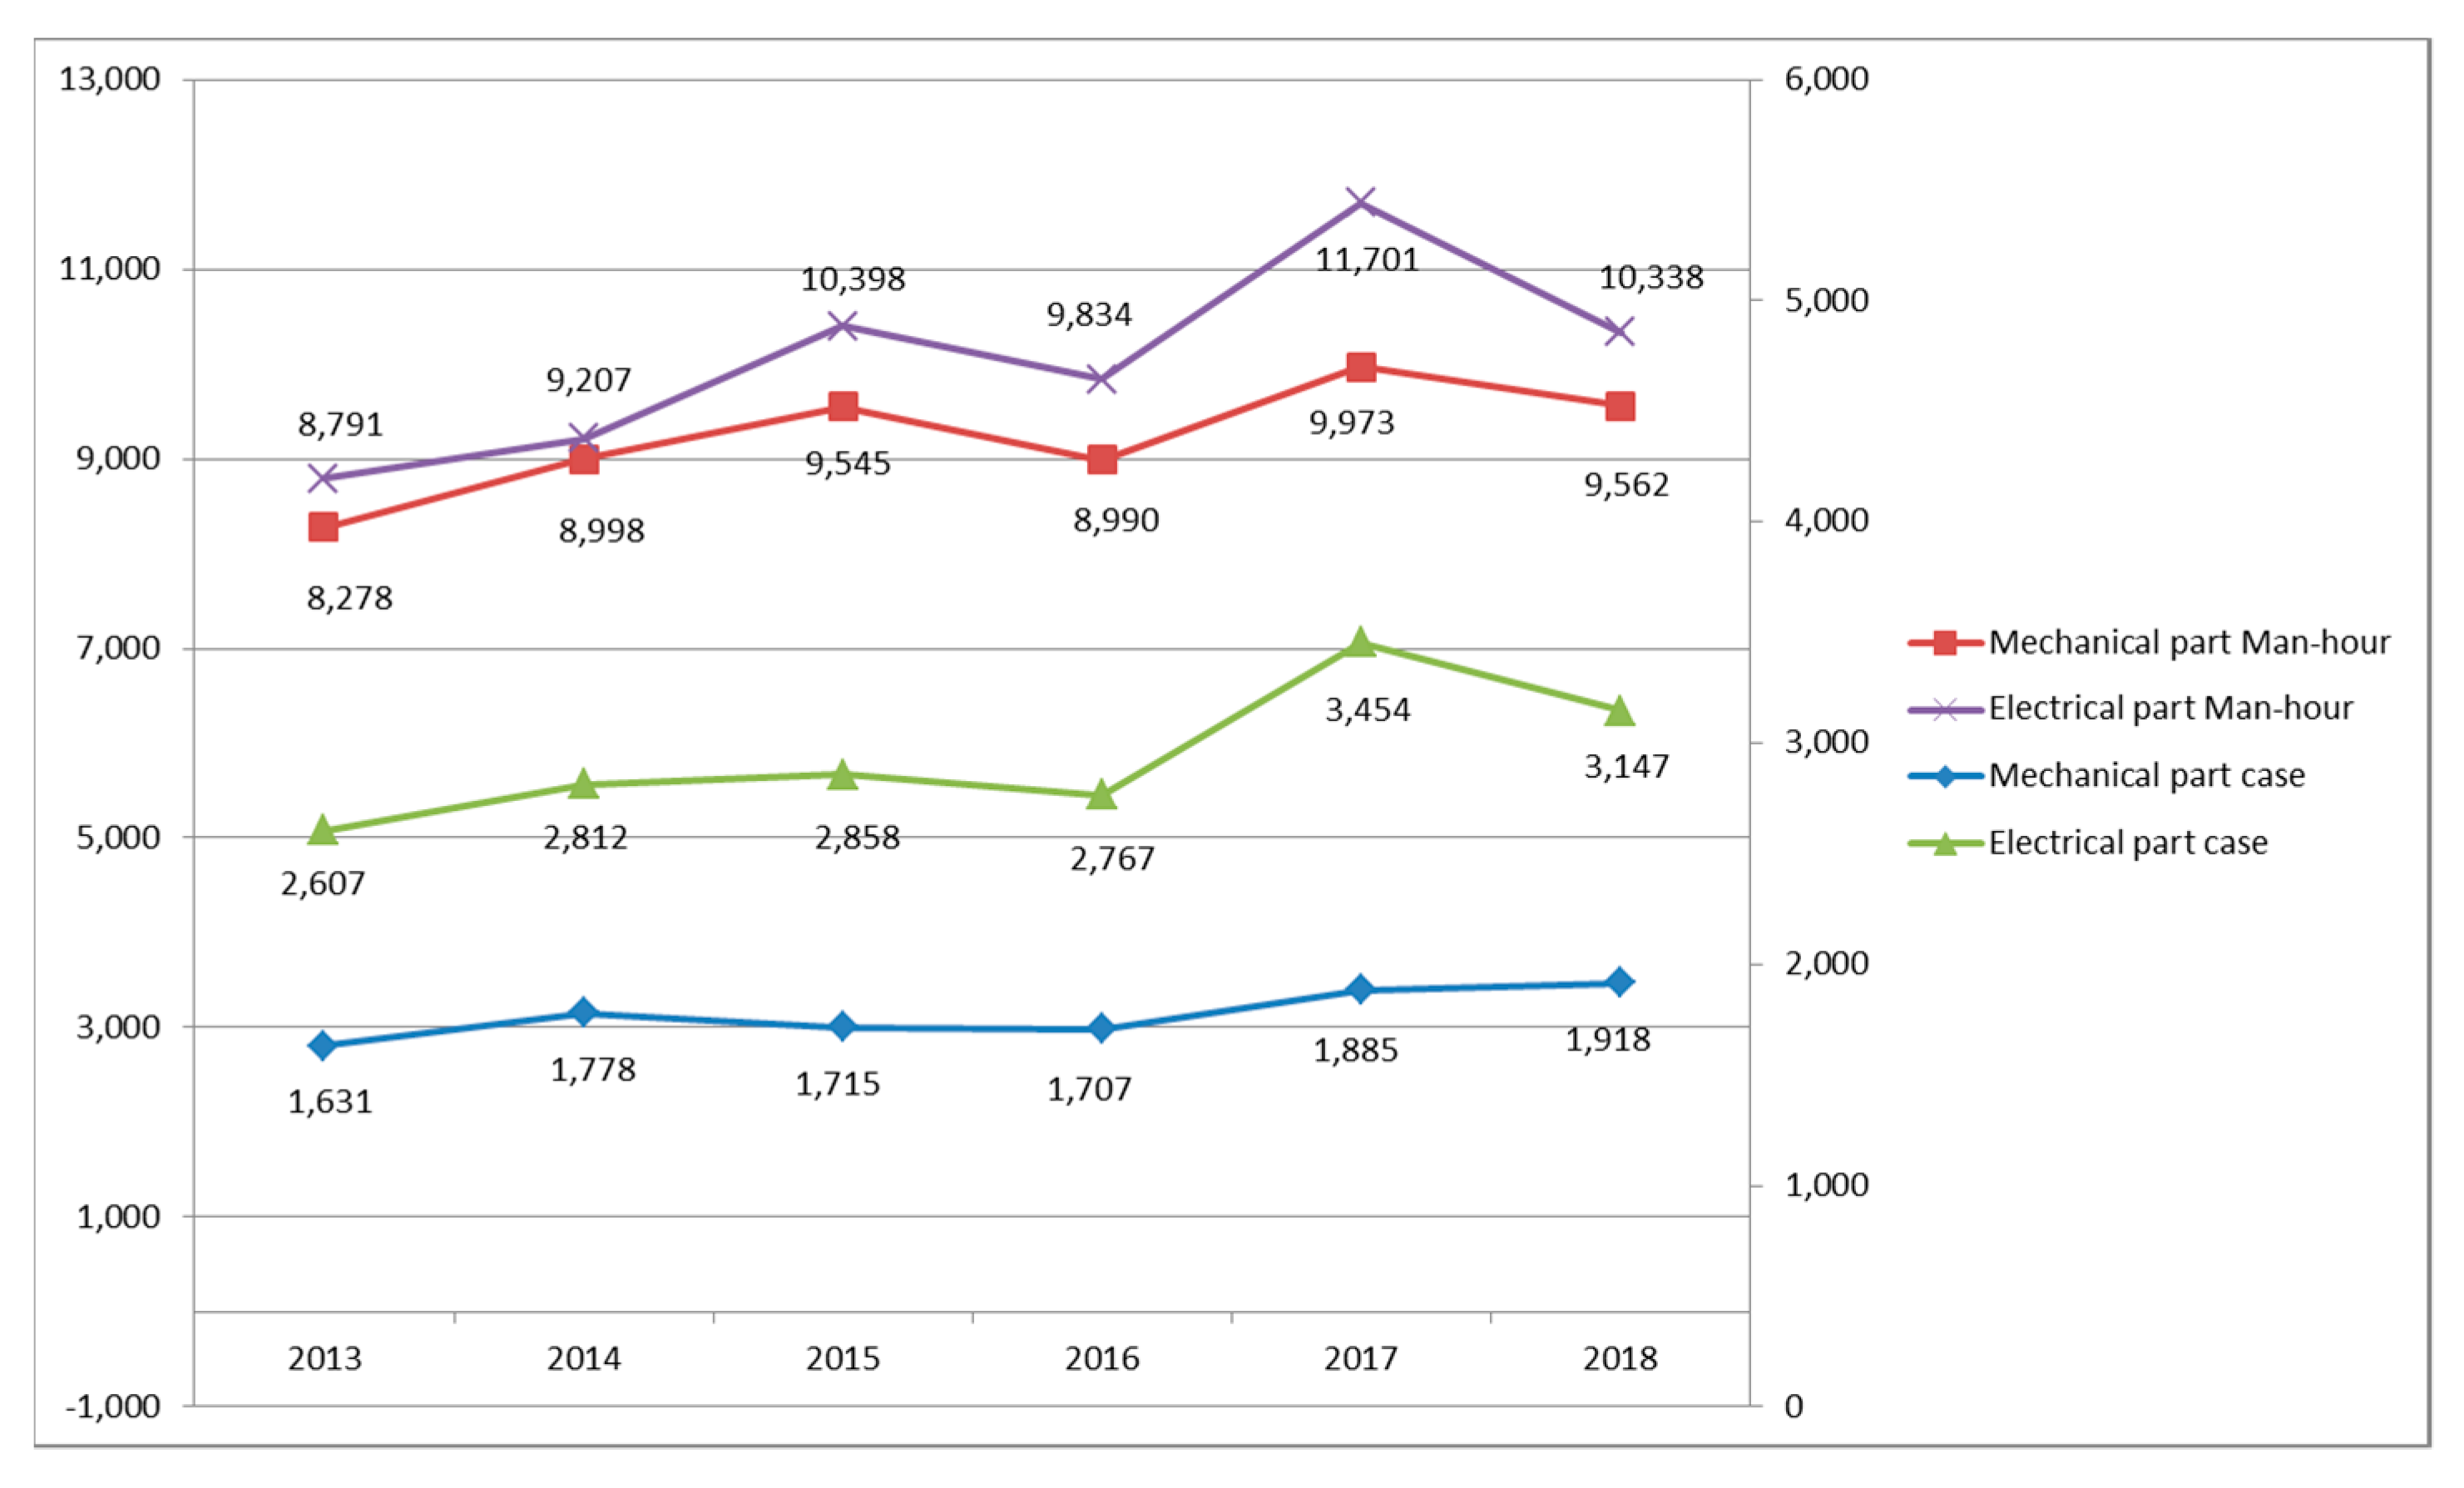
3.3. Man-Hour
4. Results and Discussion
4.1. MMBF and MTTR Assessment
4.2. Man-Hour and Maintenance Assessment
- (1)
- Crane group A: 4 units
- (2)
- Crane group B: 3 units
- (3)
- Crane group C: 1 unit
- (4)
- Crane group D: 3 units
- (5)
- Crane group E: 3 units
5. Conclusions
Author Contributions
Funding
Acknowledgments
Conflicts of Interest
References
- Park, N.G.; Suh, S.C. Tendency toward mega containerships and the constraints of container terminals. J. Mar. Sci. Eng. 2019, 7, 131. [Google Scholar] [CrossRef]
- Kang, D.; Kim, S. Conceptual model development of sustainability practices: The case of port operations for collaboration and governance. Sustainability 2017, 9, 2333. [Google Scholar] [CrossRef]
- Kim, S.; Chiang, B.G. The role of sustainability practices in international port operations: An analysis of moderation effect. J. Korea Trade 2017, 21. [Google Scholar] [CrossRef]
- Haoyuan, L.; Sun, Q. Simulation-based optimization on quay crane scheduling of container terminals. In Proceedings of the 29th Chinese Control and Decision Conference (CCDC), Chongqing, China, 28–30 May 2017. [Google Scholar]
- Ali, D.; Dulebenets, M.A.; Golias, M.M.; Sheikholeslami, A. A novel continuous berth scheduling model at multiple marine container terminals with tidal considerations. Marit. Bus. Rev. 2017, 2, 1421–1457. [Google Scholar]
- Abourraja, M.N.; Mohamed, O.; Mustapha, Y.S.; Mohamed, B.; Boudebous, D.; Fazziki, A.E.; Najib, M.; Bouain, A.; Rouky, N. A multi-agent-based simulation model for rail-rail transshipment: An engineering approach for gantry crane scheduling. IEEE Access 2017, 5, 13142–13156. [Google Scholar] [CrossRef]
- Azimi, P.; Reza, G.M. Simulation modeling for analysis and evaluation of the internal handling fleet system at Shahid Rajaee container port. Int. J. Ind. Manuf. Eng. 2011, 5, 1091–1102. [Google Scholar]
- Chen, W.K. Linear Networks and Systems; Belmont: Wadsworth, OH, USA, 1993. [Google Scholar]
- Schøyen, H.; Bjorbæk, C.T.; Steger-Jensen, K.; Bouhmala, N.; Burki, U. Measuring the contribution of logistics delivery Performance outcomes and deep sea Container liner Connectivity on Port Efficiency. Res. Transp. Bus. Manag. 2018, 28, 66–76. [Google Scholar] [CrossRef]
- Dong, F.S.; Zhang, Z.M.; Jia, X.L.; Huang, L.J.; Liu, S.N. The standard time calculation based on typical operation. Mach. Des. Manuf. 2006, 10, 1741–1776. [Google Scholar]
- Euchi, J.; Moussi, R.; Ndiaye, F.; Yassine, A. Ant colony optimization for solving the container stacking problem: Case of Le Havre (France) seaport terminal. Int. J. Appl. Logist. 2016, 6, 81–101. [Google Scholar] [CrossRef]
- Zheng, S.; Sha, J.; Wang, A. An improved storage-space selection model and algorithm for outbound shipping containers: Considering the synchronous operation of multiple gantry cranes in port terminals worldwide. J. Coast. Res. 2019, 35, 1120–1130. [Google Scholar] [CrossRef]


| Year | Crane Group | Mechanical Part Man-Hour | Electrical Part Man-Hour | Mechanical Part Case | Electrical Part Case |
|---|---|---|---|---|---|
| 2013 | A | 536 | 809 | 2438 | 2403 |
| B | 243 | 405 | 1848 | 1819 | |
| C | 48 | 39 | 100 | 86.21 | |
| D | 254 | 417 | 1305 | 1462 | |
| E | 501 | 843 | 2121 | 86 | |
| 2014 | A | 562 | 819 | 2,740 | 2216 |
| B | 298 | 494 | 1951 | 1978 | |
| C | 50 | 37 | 84 | 67.07 | |
| D | 309 | 483 | 1531 | 1585 | |
| E | 500 | 860 | 2257 | 67 | |
| 2015 | A | 605 | 888 | 3220 | 3050 |
| B | 238 | 523 | 2003 | 2344 | |
| C | 41 | 39 | 84 | 68.54 | |
| D | 255 | 463 | 1286 | 1410 | |
| E | 511 | 823 | 2433 | 69 | |
| 2016 | A | 596 | 836 | 2621 | 2769 |
| B | 265 | 532 | 1732 | 1783 | |
| C | 32 | 31 | 85 | 51.36 | |
| D | 246 | 443 | 1701 | 1772 | |
| E | 512 | 778 | 2440 | 51 | |
| 2017 | A | 668 | 1006 | 3190 | 3096 |
| B | 250 | 560 | 1554 | 2433 | |
| C | 35 | 44 | 80 | 82.56 | |
| D | 280 | 551 | 1755 | 2149 | |
| E | 577 | 1105 | 2806 | 83 | |
| 2018 | A | 622 | 975 | 2912 | 3010 |
| B | 260 | 563 | 1699 | 1895 | |
| C | 51 | 41 | 121 | 74.33 | |
| D | 301 | 489 | 1600 | 1627 | |
| E | 611 | 913 | 2677 | 74 | |
| Avg. | A | 598 | 889 | 2854 | 2757 |
| B | 259 | 513 | 1798 | 2042 | |
| C | 43 | 39 | 92 | 72 | |
| D | 274 | 474 | 1530 | 1668 | |
| E | 535 | 887 | 2456 | 72 |
| Yr. | TLC | Breakdown Frequency | Utilization | Ai% | Ao% | Breakdown Percentage% | |
| 2013 | 67,549 | 35 | 27.41 | 95.11 | 99.56 | 0.44 | |
| 2014 | 73,840 | 38 | 29.60 | 94.40 | 99.52 | 0.48 | |
| 2015 | 82,626 | 42 | 32.57 | 94.55 | 99.54 | 0.46 | |
| 2016 | 87,442 | 49 | 35.07 | 95.64 | 99.50 | 0.50 | |
| 2017 | 95,241 | 57 | 39.07 | 94.99 | 99.97 | 0.03 | |
| 2018 | 86,933 | 53 | 36.53 | 95.44 | 99.49 | 0.51 | |
| Avg. | 82,272 | 46 | 33.38 | 95.02 | 99.60 | 0.40 | |
| Yr. | PM% | EM% | Total Downtime% | Net Cycle Time | Theoretical Handling Capacity | MMBF | MTTR |
| 2013 | 4.71 | 0.18 | 4.89 | 1.50 | 40.11 | 1926.03 | 0.377 |
| 2014 | 5.39 | 0.21 | 5.60 | 1.46 | 41.04 | 1954.18 | 0.405 |
| 2015 | 5.22 | 0.23 | 5.45 | 1.44 | 41.54 | 1970.64 | 0.392 |
| 2016 | 4.09 | 0.27 | 4.36 | 1.49 | 40.27 | 1774.19 | 0.394 |
| 2017 | 4.68 | 0.33 | 5.01 | 1.52 | 39.58 | 1679.61 | 0.421 |
| 2018 | 4.27 | 0.30 | 4.56 | 1.56 | 38.46 | 1651.38 | 0.408 |
| Avg. | 4.73 | 0.25 | 4.98 | 1.50 | 40.17 | 1805.34 | 0.401 |
© 2019 by the authors. Licensee MDPI, Basel, Switzerland. This article is an open access article distributed under the terms and conditions of the Creative Commons Attribution (CC BY) license (http://creativecommons.org/licenses/by/4.0/).
Share and Cite
Jo, J.-H.; Kim, S. Key Performance Indicator Development for Ship-to-Shore Crane Performance Assessment in Container Terminal Operations. J. Mar. Sci. Eng. 2020, 8, 6. https://doi.org/10.3390/jmse8010006
Jo J-H, Kim S. Key Performance Indicator Development for Ship-to-Shore Crane Performance Assessment in Container Terminal Operations. Journal of Marine Science and Engineering. 2020; 8(1):6. https://doi.org/10.3390/jmse8010006
Chicago/Turabian StyleJo, Jung-Hyun, and Sihyun Kim. 2020. "Key Performance Indicator Development for Ship-to-Shore Crane Performance Assessment in Container Terminal Operations" Journal of Marine Science and Engineering 8, no. 1: 6. https://doi.org/10.3390/jmse8010006
APA StyleJo, J.-H., & Kim, S. (2020). Key Performance Indicator Development for Ship-to-Shore Crane Performance Assessment in Container Terminal Operations. Journal of Marine Science and Engineering, 8(1), 6. https://doi.org/10.3390/jmse8010006


