1. Introduction
Merchant vessels are commonly designed to operate independently in light ice conditions or with icebreaker assistance where the navigation takes place in a broken ice field behind an icebreaker. Icebreakers and icebreaking supply vessels on the other hand are designed to operate independently in ice conditions. Their operations include transits between locations along the shortest possible or the most convenient route, mainly straight ahead. However, maneuvers are required from icebreaking vessels while assisting merchant vessels and performing ice management and operations in the near vicinity of destinations. These maneuvers include turning in an intact ice field and breaking out from an ice channel.
Maneuvering operations expose the midship and stern to ice interaction that increases the frequency and magnitude of ice-induced loading in these areas of the vessel at the side opposite to the turning direction [
1]. For ships equipped with conventional shaft lines and rudders, the magnitude of increased loading has been shown to correlate with rudder forces [
2,
3]. Ships are commonly designed to operate ahead, i.e., the bow first. Thus, the bow is commonly designed to break ice with low frame angles favoring the bending failure of ice, whereas the frames at the midship and stern areas are often vertical or close to vertical. The vertical frames enhance breaking of ice through crushing that increases the load level on the hull in comparison to bending, and full-scale measurements have shown that the load magnitude at the stern area can match load levels at the bow [
4,
5]. The measured ice-induced loads have even exceeded the design load of ice class assigned to the vessel in the stern area [
4,
6].
A lot of effort has been afforded to determine the frequency of ice-induced loads for offshore structures as resonating frequency could cause severe damage to the structure (e.g., [
7]). However, the speed of the ship affects the frequency of ice-induced loads. It is reasoned that a resonating situation for a ship can be considered rare as the vessel speed and ice conditions vary constantly. Consequently, the frequency and duration of ice-induced loads on a ship hull have not attracted as much attention as on offshore structures. However, the duration, rise time, and decay time related to ice-loading magnitudes are important to understand the load dynamics. If a dynamic numerical simulation with ice-induced loads is to be performed, knowledge on the load duration is required. Furthermore, the duration and frequency of loading are important when extreme ice-induced loads are considered, as these have a direct impact on exposure that affects the predicted extreme loads. In addition, the duration and frequency have an effect on the number of stress cycles that impacts fatigue life.
Commonly, the duration of ice-induced loading is reported briefly, and the accuracy is not clear. Typically, durations in an area of one frame spacing at the bow region range from 0.1 to 0.6 s, but durations of 0.007 and 1.5 s have also been reported [
8,
9,
10,
11,
12,
13,
14,
15]. Hänninen et al. [
16] presented the distribution of ice-induced load duration on a frame at the bow, indicating the mode value of 2 s and durations ranging from 0.5 to 6 s. More thorough work on characterizing ice-induced loading events has been done by Lee et al. [
17] and Ahn et al. [
18]. They categorized ice-induced loading events based on the occurrence of intermediate load drops, and whether the possible load drop occurred before or after the peak load. They reported load durations between 0.1 and 14 s, with the mean being 1.2 s [
18]. The load rise time varied between 0.05 and 7.2 s and the highest loads occurred between durations of 0.3 and 0.8 s. Furthermore, separate laboratory tests have been carried out to study the intermediate load drops applied in the categorization presented in these papers [
19]. However, all these studies focused on the bow area of the vessel during ahead operations or ramming situations. The stern areas or maneuvers were not considered in these studies.
In order to gain insight into ice-induced loading at the stern area during different operations, dedicated maneuvering tests were conducted during the ice trial of the Polar Supply and Research Vessel (PSRV) S.A. Agulhas II in the Baltic Sea [
1,
20]. In these dedicated maneuvering tests, the ship controls and operations were predetermined, and the interference of the ship crew was minimized in order to reduce the possible effect from ship crew actions and experience. The maneuvering tests included breaking out from the channel, turning tests in an intact ice field, and straight-ahead operations for comparative purposes. This study focused on the characteristics of ice-induced loading events at different hull regions during the dedicated maneuvering tests. The load characteristics consisted of the peak load rise time, duration, and magnitude, and the trigger value load event duration and the highest load occurring during the event. The peak load and trigger value event are described in
Section 2.2. Furthermore, the frequency of loading during different operations was studied.
2. Data Analysis Methods
2.1. Ice-Induced Loading on Hull
At the onset of ship–ice interaction, the ice crushes against the hull as the ship penetrates into the ice sheet. As the penetration continues and the total contact area and loading increases, the downward force increases in hull areas with small frame angles (
Figure 1a). Ultimately, the ice fails through bending, and the broken ice piece is rotated and pushed aside or submerged, depending on the location at the hull. This process forms cusps in the ice field and is repeated when new contact is obtained. Thus, the ice-induced loading process is commonly described using a triangularly shaped loading history (
Figure 2). In the case of vertical frame angles, the ice flakes from the top and bottom surfaces of the ice sheet, while the crushing process continues in the contact area between surfaces (
Figure 1b). This can be observed as intermediate load drops in the force signal before a larger failure and load drop (e.g., Daley [
21]).
However, in many cases the contact point of the ice-induced load moves along the hull as the ice does not fail through bending or large fracturing, but the local crushing continues (
Figure 3). Generally, the load movement can appear at the parallel midship region in all ice conditions. In level ice, contact can be initiated at the midship by turning or other movements of the vessel in relation to the surrounding level ice. In this case, local crushing and compaction might occur, but the surrounding level ice is strong enough to withstand higher loads and does not break through larger failure modes. As the ice is strong enough to prevent the movement of the vessel sideways, the load preventing the movement occurs at the contact point and moves with the contact point along the hull. The load travelling distance at the waterline is expected to be reduced in level ice conditions at the bow as sailing ahead into level ice requires ice to be broken and displaced in order to advance forward.
Besides the load movement, the width of the contact area can also vary due to local crushing and failures (
Figure 3). Furthermore, intermediate failures occur, such as flaking, causing intermediate load drops. Thus, when a single frame is observed, it is not possible to confidently determine if the ice feature had a major failure on the observed frame or the ship–ice interaction point progressed onto the next frame along the hull. If several adjacent frames are instrumented, it is possible to observe how the load travels on the hull (
Figure 3). Furthermore, observing several adjacent frames enables an estimation as to whether a major failure occurred at the instrumented area. If the loading clearly decreases when moving from one frame to another, it can be assumed that a major failure occurred [
22].
In order to identify ice-induced loads from continuous measurement signals, two methods are applied—trigger values and Rayleigh separation. The trigger values are applied to determine the total duration of the ice-induced loading event, while Rayleigh separation is utilized to identify and separate load events into intermediate load events, referred to as peak load events, based on intermediate load drops, which are described in
Section 2.2.
2.2. Ice-Induced Load Duration and Rise Time
Ice-induced loading events are determined from the measured load signal utilizing two methods—the trigger value exceedance and Rayleigh separation. In the trigger value exceedance method, the load event starts and ends when the measured load crosses the preset load level. The events determined with this method shall be referred to as trigger load events in this paper. The maximum load value for a trigger load event is the highest measured load between the triggering points. This is demonstrated in
Figure 4a.
In this work, the triggering value was set to 5 kN. However, the trigger load events having a maximum load not exceeding 10 kN were disregarded. As demonstrated in
Figure 4a, the smaller load events before and after higher loading were not considered as ice-induced load events. Here, it was considered that setting the minimum accepted load equal to the trigger value would stress the number of short loads, as the load level repeatedly increased to 5 kN load level. Furthermore, the measurements showed that the highest load level in open-water condition was approximately 5 kN. Therefore, the threshold was set to 10 kN in order to be confident that all the loads identified from the signal were ice-induced loads. This was in line with the earlier analysis of the data [
25,
26].
As discussed in
Section 2.1 and demonstrated in
Figure 4, significant load level drops can occur without the load level decreasing below the threshold value. In this type of cases, it is considered that ice has experienced a significant failure, or the load has moved to the adjacent frame. Thus, the load event can be considered to consist of several separate peak load events. The peak load events can be separated utilizing the Rayleigh separation method. According to the method, two adjacent local maxima are compared to the minimum load level between the maxima. If the magnitude of the local minimum is below the level of smaller maximum multiplied by the separator value, the load event is separated into two peak load events at the location of the local minimum. The separator value was set to 0.5 in this study. There was no physical basis for setting the value to 0.5, but it was reasoned that a 50% decrease in the loading level constituted a significant load drop, and the value was in accordance with earlier studies [
25,
26].
Figure 4b presents an example of the Rayleigh separation, where blue circles indicate the separate peak loads. The load events determined with the Rayleigh separation will henceforth be referred to as peak load events.
In the case where the load event was separated with Rayleigh separation, as in
Figure 4b, the starting point of the first peak load event was set to the point where the load exceeded the threshold and the starting points of the following events were set to the local minimum load between the local maxima. The end point of the peak load event was set to the starting point of the following event or when the load level decreased below the threshold. The peak load duration was the time difference between the end and starting point of an event. The load rise time was defined as the time interval from the starting point of a peak load event to the time of the peak load maximum. Thus, load drops smaller than the definition by Rayleigh separation were included in the peak load rise time.
3. Description of Vessel and Instrumentation
Full-scale measurements were conducted on-board the PSRV S.A. Agulhas II, which was built by STX Finland at Rauma Shipyard and was delivered in April 2012. The main dimensions of PSRV S.A. Agulhas II are presented in
Table 1. She was built to the polar ice class PC5 and the hull was constructed in accordance with DNV ICE-10. The ship gains its power from a diesel electric propulsion system of four diesel generators each producing 3 MW. Two 4.5 MW electric motors provide power for two controllable pitch propellers [
20].
Three areas of the starboard side of the hull were instrumented with strain gauges when she was under construction in 2011/2012. The upper and lower parts of the frame were instrumented with V-shaped strain gauges, which measure the shear strains occurring in the frame. The instrumentation consists of two, three, and four adjacent frames at the bow, bow shoulder, and stern shoulder respectively (
Figure 5). In addition, the hull plating was instrumented with strain gauges in these areas. The ice-induced loads on the frames were determined from the load–strain relation utilizing influence coefficient matrices. The matrices were determined using finite element models of the structure that were validated with calibration pulls. The method and models are described in detail by Suominen et al. [
25]. In this study, the load–strain relation was determined by applying a point load on the midspan of the frame that was expected and realized at the waterline level during the Baltic Sea ice trial. Identifying the load–strain relation with more distributed loading would lead to smaller load–strain relation, i.e., higher load magnitudes would be assigned with smaller changes in the measured strain magnitudes.
It should be noted that the frames #111½, #112, and #112½ at the bow shoulder were connected to each other at the midspan of the frame structures with horizontal plates, which match the height of the frame. The load values recorded, especially on frame #112, sometimes indicated significant negative loads. This was expected to result from the load acting on the non-instrumented frames. As the frame #111½ was not instrumented, but connected to the instrumented frames, it was expected that the frame-to-frame interaction would be magnified, causing the measurement of negative values.
The navigational, machinery control, and ice-induced load data were collected with the central measurement unit, which is permanently installed onboard. The ice thickness was measured visually, with a stereo camera system and an electromagnetic (EM) device at the same time. Each of the thickness measurements utilized separate computers. The time synchronization of the computers was conducted with a wristwatch.
The navigational data (coordinates, speed over ground, course over ground, and heading) and machinery control data (motors’ power, propellers’ pitch, shafts’ rotation speed, and rudders’ angle) were measured with the ship’s own systems and sampled at a frequency of approximately 1 Hz and 0.5 Hz, respectively. Ice-induced loads were measured and sampled at a frequency of 600 Hz and 200 Hz, respectively.
The EM measurements utilized a Geonics EM-31 instrument. The EM measurement frequency was typically set to 20 Hz and later down-sampled in data processing to approximately 1–5 Hz depending on the moving speed of the vessel. The device was located approximately at the front perpendicular. The stereo camera system was placed at the location of bow shoulder strain gauge instrumentation (frame #112) to capture images during the voyage. The images collected with the stereo camera system were manually analyzed after the voyage. Here, the thickness was measured at points where the broken ice pieces had turned upwards revealing the cross-section to the downward-looking camera system. As the measurement points were dependent on upward-turned ice pieces, no predefined measuring frequency could be applied. The measurement methods of the stereo camera system and EM device are described by Kulovesi and Lehtiranta [
28] and Lensu et al. [
29], respectively.
The visual observations contained ice thickness, ridge sail height, and ridge density. The thickness was estimated with the help of a measurement yardstick, which was placed over the side of the ship. The observations were collected in 10-min time intervals. A more detailed description of the ice condition observations is given by Suominen et al. [
30]. In addition to the ice-thickness measurements, the bending and compressive strength of ice were measured during the ice trials between the tests. The methodology is reported in detail by Suominen et al. [
20].
It should be noted that the EM measures the total thickness of ice, including the loose pieces under the solid ice sheet. The stereo camera system measures the thickness of an ice layer, i.e., the thickness of the broken level ice, or the thickness of the turning loose ice pieces. Thus, the ice thicknesses measured with the two systems deviate significantly in some occasions, especially at the location of ridges (e.g.,
Figure 6). The visual observations, by methodology, range between the values obtained from the other two systems, as the level ice thickness is estimated from the turning ice pieces, while the size of ridges can be calculated based on the observed sail height [
31].
The controlled maneuvering tests were conducted in “Ice Mode”. In this mode, the machinery automation seeks to maintain the shaft rotation speed at 140 revolutions per minute. In the case of propeller–ice interaction, the automated control may decrease the pitch of the propeller, thus reducing the thrust, if the rotational speed of the propeller is about to be inhibited.
The data from the tests described in this paper are collected and provided in separate files with this paper as a
Supplementary Material. The content of the data files is described in
Appendix B.
4. Description of Conducted Tests and Measurements
4.1. Overview of Conducted Tests
Three types of tests were conducted: straight ahead in level ice, breaking out from the ice channel, and turning in level ice. The overview on the conducted tests are presented in
Table 2 and detailed descriptions of different tests are given in the following chapters. In total, 16 controlled tests were conducted. In some cases, the following test was conducted directly after another test. These tests were separated in the data analysis, e.g., L2_1 and L2_2, but not in
Table 2.
The test locations were chosen based on visual observations. Level ice conditions and small deformation levels were preferred in the selection of test locations. However, ice conditions vary naturally, and rafting below the surface and conditions further away are not possible to observe. Thus, it is not possible to fully avoid a variation in conditions in longer tests. The visual observations at the time of the tests are presented in
Table 3.
The measured bending strength of ice varied between 321 and 472 kPa and the average strength was approximately 404 kPa. The compressive strength varied between 0.65 and 1.98 MPa in the horizontal direction and between 1.41 and 2.79 MPa in the vertical direction, while the average compressive strengths were 1.28 and 2.02 MPa in the horizontal and vertical directions, respectively [
31].
4.2. Straight-Ahead Tests
In the ahead test, the rudders were kept in zero or close to zero position, i.e., no turning was initiated, and the thrust request was kept constant. However, changes in the heading and course over ground were possible due to the ship–ice interaction in different parts of the hull. It was also observed that small rudder angle (approximately two degrees) was applied at the end of test L2 to obtain the same heading as in the beginning of the test.
Figure 6 presents an example of the applied motor power and rudder angles, obtained speed and heading, and measured ice thickness during test L1. It should be noted that the heading indicates the heading with respect to the heading at the beginning of the test, not the actual heading.
The measured ice conditions are summarized in
Table 4, and the ship navigational and machine control data are summarized in
Table 5.
Table 4 indicates similar ice conditions between the tests, although the level ice was slightly thinner during test L2_1, while the maximum ice thickness was the smallest in L3. Visual observations indicated that the ship encountered a heavy ridge at the end of L2_2 that caused a decrease in speed. As shown in
Table 5, the rudder angles were kept close to zero, and the turning rate was negligible.
Figure 7 gives the measured load at the bow, bow shoulder, and stern shoulder.
Appendix A gives similar plots for tests L2_1, L2_2, and L3.
4.3. Maneuvering Tests
The maneuvering tests consisted of breaking out from the ice channel and turning tests in level ice sheet. The breaking out from the channel tests were conducted in newly broken channels by PSRV S.A. Agulhas II. In the test, the ship was first accelerated to a speed achieved in the channel with a certain motor power. The power was kept constant during the tests. After the ship had gained speed, the rudders were turned to a certain predetermined angle that was retained until the ship had broken out from the channel.
Figure 8 presents the applied motor power and rudder angles, obtained speed and heading, and measured ice thickness during tests BC5, T4_1, and T4_2, as an example of the breaking out from the channel test followed by two turning tests. The measured ice-induced loads during these tests are presented in
Figure 9. The other tests are presented in
Appendix A.
Turning tests were conducted in a similar manner in level ice sheets. The motor power and rudder angle were kept constant during the turn. The turning was continued until the heading had changed approximately 90 degrees. As in the straight-ahead tests, ice sheets with low deformation levels were preferred as the turning test locations, but it was not always possible to find such a field.
Figure 8 and
Figure 9 present examples of turning tests with the applied control and measured ice condition and ice-induced loads. Positive rudder angles indicate turning to starboard and negative values turning to port side.
As only the starboard side of the vessel was instrumented, the maneuvering tests were conducted on the port side and starboard to study the loads on different sides of the vessel with respect to turning direction. As turning to port side exposes the instrumented starboard side of the stern shoulder to ice interaction, more turning tests to port side were conducted. In the data analysis, only the parts where the rudder angle was at the target angle were utilized (dashed lines in
Figure 8 and
Figure 9). If a clear open-water section was encountered during a turning test, it was cut out from the data analysis (see
Figure 8 for test T4_2).
Table 6 and
Table 7 present the measured ice conditions, ship navigational data, and applied machinery control data for the maneuvering tests.
5. Data Analysis
In this section, the straight-ahead tests and maneuver tests are analyzed from the intervals indicated in
Section 4. The load events identified from the load signal with the triggering values and Rayleigh separation were referred to as trigger and peak load events, respectively (see
Section 2.2). The load events duration, load magnitude, and rise time, were identified as described in
Section 2.2.
The analysis showed that the number of peak and trigger load events was small at the bow shoulder area in tests BC1, BC3, and BC4. Similarly, only a few or no load events were measured at the stern shoulder area during the tests involving turning to starboard (tests T1_1, T4_2, and BC3). Due to the small number of load events, the statistical parameters calculated for these tests in this section had high uncertainty.
When the data were interpreted, it should be considered that the duration of maneuver tests varied significantly (
Table 2). As the exposure to higher loads increased as a function of the duration or travelled distance, it was not considered valid to compare the maximum values between the tests. Thus, quantiles were utilized in the data analysis and comparison of load levels, as the consideration of number of loads was embedded in the quantile analysis.
5.1. Peak Load Frequency
The frequency of the peak load events during a test was determined for each frame by first identifying the peak load events from the measurement signal. Then, the number of peak loads was divided by the duration of the test. In order to determine a representative frequency for different hull areas, the frequency was determined for each frame separately and then the mean frequency was calculated from the frames in that area. The mean frequencies for different hull areas during different tests are presented in
Figure 10 and
Table 8 with the mean speed and turning rate during the tests. Note that the tests were organized based on type and increasing ship speed.
The frequency of peak loads at the bow showed an increasing trend as a function of the speed in the straight-ahead test. A comparison of the straight-ahead tests with the turning tests in an intact level ice field indicated that the frequency slightly decreased or remained the same on the bow side opposite to the turning direction, while the frequency seemed to increase on the bow side toward the turning direction. Likewise, breaking out from the channel indicated a similar trend. However, only one test was done toward the starboard. In the case of a port-side turn, the calculated frequency highly depended on when the bow broke into the ice. As an example, the first ice interaction at the instrumented bow frames was observed approximately at the midpoint of the test in BC2, while the first contact was reached after a short duration in BC5.
The peak load frequency levels at the bow shoulder area were clearly smaller than that at the bow, but the frequencies at the bow shoulder showed similar trends to those at the bow. The frequency level decreased or remained the same when the vessel was turned to the opposite direction with respect to the instrumentation and increased when the instrumented ship side matched the turning direction. The breaking out of the channel tests showed only a few interactions in tests BC1, BC3, and BC5. Thus, no clear trend was determined. Similarly, no clear trend between the speed and the frequency of peak load events at the bow shoulder was observed.
At the stern shoulder area, the occurrence and frequency of ice-induced loads had a clear dependency on ship maneuvers. Some ice-induced loads were observed at the stern shoulder area in the straight-ahead operations due to ship motions caused by contact with the ice field. When the ship turned, the frequency of the loading increased significantly at the opposite side of the ship with respect to the turning direction, while, generally, no interaction on the hull was observed at the side of the ship toward the turning direction. The turning rates were relatively constant in similar test runs. However, this did not seem to have any effect on the frequency of the peak ice loading.
5.2. Peak Load Magnitude
For the ice-induced load magnitude analysis, the peak loads were identified and separated on each frame for each test. Due to the small number of peak loads in some tests, the peak loads measured on different frames in the same area were combined for each test, e.g., the measurements on frames #134½ and 134 were combined to represent the loading at the bow. This was considered to give a better statistical representation of the loads. Here, it was assumed that the minor differences in the frame angles and locations at the same hull area did not affect ice-induced loading. After the sets of peak loads for different hull areas for each test were identified, 25%, 50%, 75%, and 95% quantiles were determined (
Figure 11,
Table 9). Note that the tests were organized based on increasing maximum ice thickness measured with the stereo camera system in
Figure 11.
As shown in
Figure 11, the highest loads in the straight-ahead operations were measured in the bow shoulder area, as the 75% quantile loads were approximately at the same level as 95% quantile loads at the bow. The magnitude of the highest measured loads in these areas was similar (approximately 300 kN), but the bow had a large number of peak ice-induced loads of a small magnitude. Only some ice-induced loads occurred at the stern shoulder, but the magnitudes of these were relatively large, which increased the quantile levels.
Generally, the maneuvers did not seem to affect the load levels measured at the bow and bow shoulder, as the load levels of the quantiles remained at the same level. However, a significant impact on the load magnitudes was seen at the stern shoulder area. The load level at the side of the stern opposite to the turning direction increased clearly above the load levels at the bow or bow shoulder areas, while on the other side of the stern the load diminished.
Figure 11 shows increasing trend in ice-induced loading as a function of the measured maximum ice thickness in all hull regions.
5.3. Peak Load Rise Time and Duration and Trigger Load Duration
After the trigger load events and peak loads were identified from the measurement data, peak load rise time and durations, and the trigger load event durations were determined. The duration of all the peak loads were gathered from different tests for the bow, bow shoulder, and stern shoulder areas and the peak load magnitudes were plotted as a function of peak load duration (
Figure 12). Similar plots were presented for peak load rise time and trigger load event duration in
Figure 13 and
Figure 14. The mean, median, and maximum values for the peak load rise time and duration, and load event duration are presented in
Table 10.
The load times were the shortest at the bow (
Figure 12,
Figure 13 and
Figure 14,
Table 10). The mean peak load and trigger load event durations were 0.094 and 0.101 s, respectively, while the maximum durations at bow were around 1.0 and 1.2 s. The mean and median peak load rise time and duration at the bow shoulder and stern shoulder were approximately the same, indicating very similar load durations in these areas. The trigger load event durations in these areas were significantly higher than at the bow as the maximum values were 2.4 and 2.9 s for the bow shoulder and stern shoulder, respectively. However, it should be noted that the maximum peak load duration in these areas was approximately 1.1 s. This indicated that the longest triggering load events consisted of several peak load events, as illustrated in
Figure 4. The mean peak load rise time was quite accurately half of the mean peak load duration for each hull area (
Table 10). This indicated that the mean peak load event would have an equal rise and decaying time. This suggested that, on average, the ice did not fail on the instrumented frame, but the contact point traveled over the instrumented area and the failure occurred outside the instrumented area. This assumed that, in the case of a failure, the loading dropped rapidly.
The shortest loads occurred at the bow (
Figure 12,
Figure 13 and
Figure 14). No clear trend between the peak load magnitude and peak load rise time or duration, or trigger load event duration was observed at the bow, bow shoulder, or stern shoulder when separate loadings were observed. The durations of the highest peak loads were less than 0.2 s at the stern shoulder area.
However, the 95% quantiles showed a clear trend that the load magnitude increased as a function of peak load duration and rise time, and trigger load event duration in all hull areas (
Figure 12,
Figure 13 and
Figure 14). The quantiles were calculated for the same bin ranges, as presented in the histograms in
Figure 12a,
Figure 13a, and
Figure 14a. The 95% quantiles first increased in a linear fashion and then stabilized around a value when the amount of data in a bin decreased. As an example, the peak load magnitude as a function of peak load duration for the stern shoulder showed a linear trend up to a duration of 0.5 s, and then stabilized for longed durations (
Figure 12). As the number of data points was small in the bin ranges where the 95% quantiles stabilized, it cannot be concluded if this was due to a physical process or lack of data points.
As the 95% quantiles for the load magnitude as a function of peak load rise time increased linearly, the slope of the increase gave the loading rate for the 95% quantiles. The obtained loading rates, based on
Figure 13, were 600 kN/s, 1000 kN/s, and 1000 kN/s, for the bow, bow shoulder, and stern shoulder, respectively. It is noted that the frame angle at the bow favors bending failure of ice while the vertical frames at the bow shoulder and stern shoulder areas favor ice failure through crushing. Thus, it is possible that the difference in the loading rates is related to the failure mode of ice. However, it is not possible to draw solid conclusions from this data. Dedicated tests are required for this matter.
Figure 15 presents the 25%, 50%, 75%, and 95% quantiles of the peak load durations in each test for all the hull areas. The tests were organized based on increasing speed. The quantiles for the bow and bow shoulder showed decreasing trends for all the test types, which indicated that the load duration in these areas was affected by the speed of the vessel. Similar trends were not observed for the stern shoulder area.
Figure 15 suggests that turning does not affect the peak load duration at the bow or bow shoulder areas, but has a significant impact on the load duration at the stern shoulder.
6. Discussion
The applied threshold in ice-induced load identification had a significant impact on the number of identified loads as the number of loads decreased exponentially as a function of the load magnitude. However, as the system was designed to measure loads over 1 MN, the measurement accuracy at smaller load levels hindered the load identification from the signal due to noise. Thus, a threshold was applied in the load identification in order not to account for signal noise as ice-induced loads. Thus, the threshold was set to 10 kN as it was considered that this level would not contain noise or open-water-related loads. Although there was no solid basis to set the threshold to this level and the selection of a threshold was subjective, the impact on the results was considered negligible, as the same threshold was applied invariably. Thus, the threshold did not affect the comparison in this study, but should be accounted for if compared to other studies. Future work is needed to neglect the threshold or determine the physical basis for it.
In addition to the applied threshold, the determined frequency was affected by the applied load identification method (triggering value vs. Rayleigh separation) and the Rayleigh separation value, in a case this method was applied. Despite the effect, it was considered that these did not affect the results where the loading frequency was compared between different speeds and maneuvering operations as the same methods and limits were applied through the study. However, these should be accounted for when comparing with other studies. In general, a lower threshold and applying smaller Rayleigh separation values increased the frequency of ice-induced loads. Applying triggering values had a two-fold effect as smaller triggering values increased the number of small loads, whereas higher triggering values separated some loading events into a larger number of loading events. Future research on the applicable Rayleigh separator and triggering value is needed to unify the applied methods and to make the different studies more comparable. In the future studies, these should be linked to physical processes.
In the maneuvering tests, the frequency of the peak loads was determined over the duration the rudders were kept at the predetermined position. If the frequencies had been determined from the point of first contact, the determined frequencies would have been higher. However, this would have hindered the comparison of different hull areas as the duration of the test would have been different.
Due to the complex failure process, the loading on the hull varies significantly. Thus, it is difficult to give a clear, but not too simplified characterization. Lee et al. [
17] and Ahn et al. [
18] categorized the ice-induced load events based on the possible occurrence of the intermediate load drops before and after the peak load. However, especially at the midship and stern areas, where the structure does not penetrate straight ahead to ice, the loading may have constant phases and great drops before and after the peak loads that are related to the relative movement between the ice field and ship. Thus, these are not related to the failure processes. It is considered that criteria for the intermediate load drops and separation of load events should be set for the characterization, see e.g., Ahn et al. [
19]. When criteria for the ice-induced load events based on failure mode can be established, the load characterization and load event separation can be improved. This is left for the future studies.
7. Conclusions
The study focused on the analysis of ice-induced loads at different hull areas during controlled maneuvering tests on-board PSRV S.A. Agulhas II in the Baltic Sea during the ice trial. According to the analyses, maneuvers may have a minor impact on the frequency of the loading at the bow and bow shoulder area and a major impact on the frequency at the stern shoulder area. The measured frequencies at the bow and bow shoulder were 0.9–2.2 Hz and 0.1–0.6 Hz, respectively, in an intact ice field. At stern shoulder, the frequencies were 0.1 Hz in straight-ahead operations, but can increase up to 1.1 Hz in turnings. Similarly, maneuvers did not have a clear impact on the load magnitude at the bow and bow shoulder areas, but had a significant effect at stern shoulder. The ice thickness had an increasing impact on the load magnitudes in all hull regions.
The ice-induced load duration analysis showed that the mean duration of the peak loads was 0.09 s at the bow and 0.14 s at the bow shoulder and stern shoulder. Furthermore, the peak load duration did not exceed 1.2 s. When the trigger load event duration was observed, the durations increased to 0.10, 0.15, and 0.17 s for the bow, bow shoulder, and stern shoulder, respectively; the corresponding longest durations were 1.2, 2.4, and 2.9 s. The maneuvers did not seem to affect the durations of ice-induced loading on the bow and bow shoulder, but had a clear impact on the durations at the stern shoulder. Furthermore, increasing speed decreased the load duration at bow and bow shoulder. The calculated 95% quantiles indicated a clear increasing trend of load magnitudes as a function of load durations. The loading rates calculated from the 95% quantiles indicated a loading rate of 600 kN/s for the bow and 1000 kN/s for the bow shoulder and stern shoulder.
The load duration and frequency of loading are important parameters when the probability of different magnitude ice-induced loads is determined, as the duration and frequency affect the exposure that has a direct impact on the predicted extreme loads. However, the criteria for identification and characterization of separate ice-induced loads from the continuous measurements are not solidly based on physical interpretation, but have a direct impact on the obtained load durations and frequencies. Thus, future research on these are required.
As noted, the analyzed and presented measurement data are made available with the paper as
Supplementary Materials. This is considered valuable for other researchers for several topics on ice-induced loads, and the validation of their simulation models as ship performance can be estimated from the data.
Author Contributions
Conceptualization, M.S.; methodology, M.S., F.L. and L.L.; formal analysis, M.S. and J.L.; investigation, M.S., A.B. and J.L.; resources, M.S.; data curation, M.S., F.L. and J.L.; writing—original draft preparation, M.S.; writing—review and editing, F.L., L.L., P.K., A.B. and J.L.; visualization, M.S.; supervision, P.K.; project administration, M.S., P.K. and A.B.; funding acquisition, P.K. All authors have read and agreed to the published version of the manuscript.
Funding
This project received funding from the Lloyd’s Register Foundation, a charitable foundation, helping to protect life and property by supporting engineering-related education, public engagement, and the application of research (
www.lrfoundation.org.uk). The PSRV S.A. Agulhas II was instrumented within a project funded by Tekes (Finnish Funding Agency for Technology and Innovation), nowadays Business Finland. The authors would like to acknowledge Tekes for funding.
Acknowledgments
The authors would like to acknowledge Tekes project consortium partners for collaboration, namely, STX Finland (currently Rauma Marine Construction), the University of Oulu, Aker Arctic Technology, Rolls-Royce, Wärtsilä, DNV-GL, and the Department of Environmental Affairs of South Africa.
Conflicts of Interest
The authors declare no conflict of interest.
Appendix A
Figure A1.
Applied motor power, measured ice thickness with the electromagnetic device (EM) and stereo camera system (SC), and obtained speed during tests (a) L2_1 and L2_2, and (b) L3. Applied rudder angles with obtained heading during tests (c) L2_1 and L2_2, and (d) L3.
Figure A1.
Applied motor power, measured ice thickness with the electromagnetic device (EM) and stereo camera system (SC), and obtained speed during tests (a) L2_1 and L2_2, and (b) L3. Applied rudder angles with obtained heading during tests (c) L2_1 and L2_2, and (d) L3.
Figure A2.
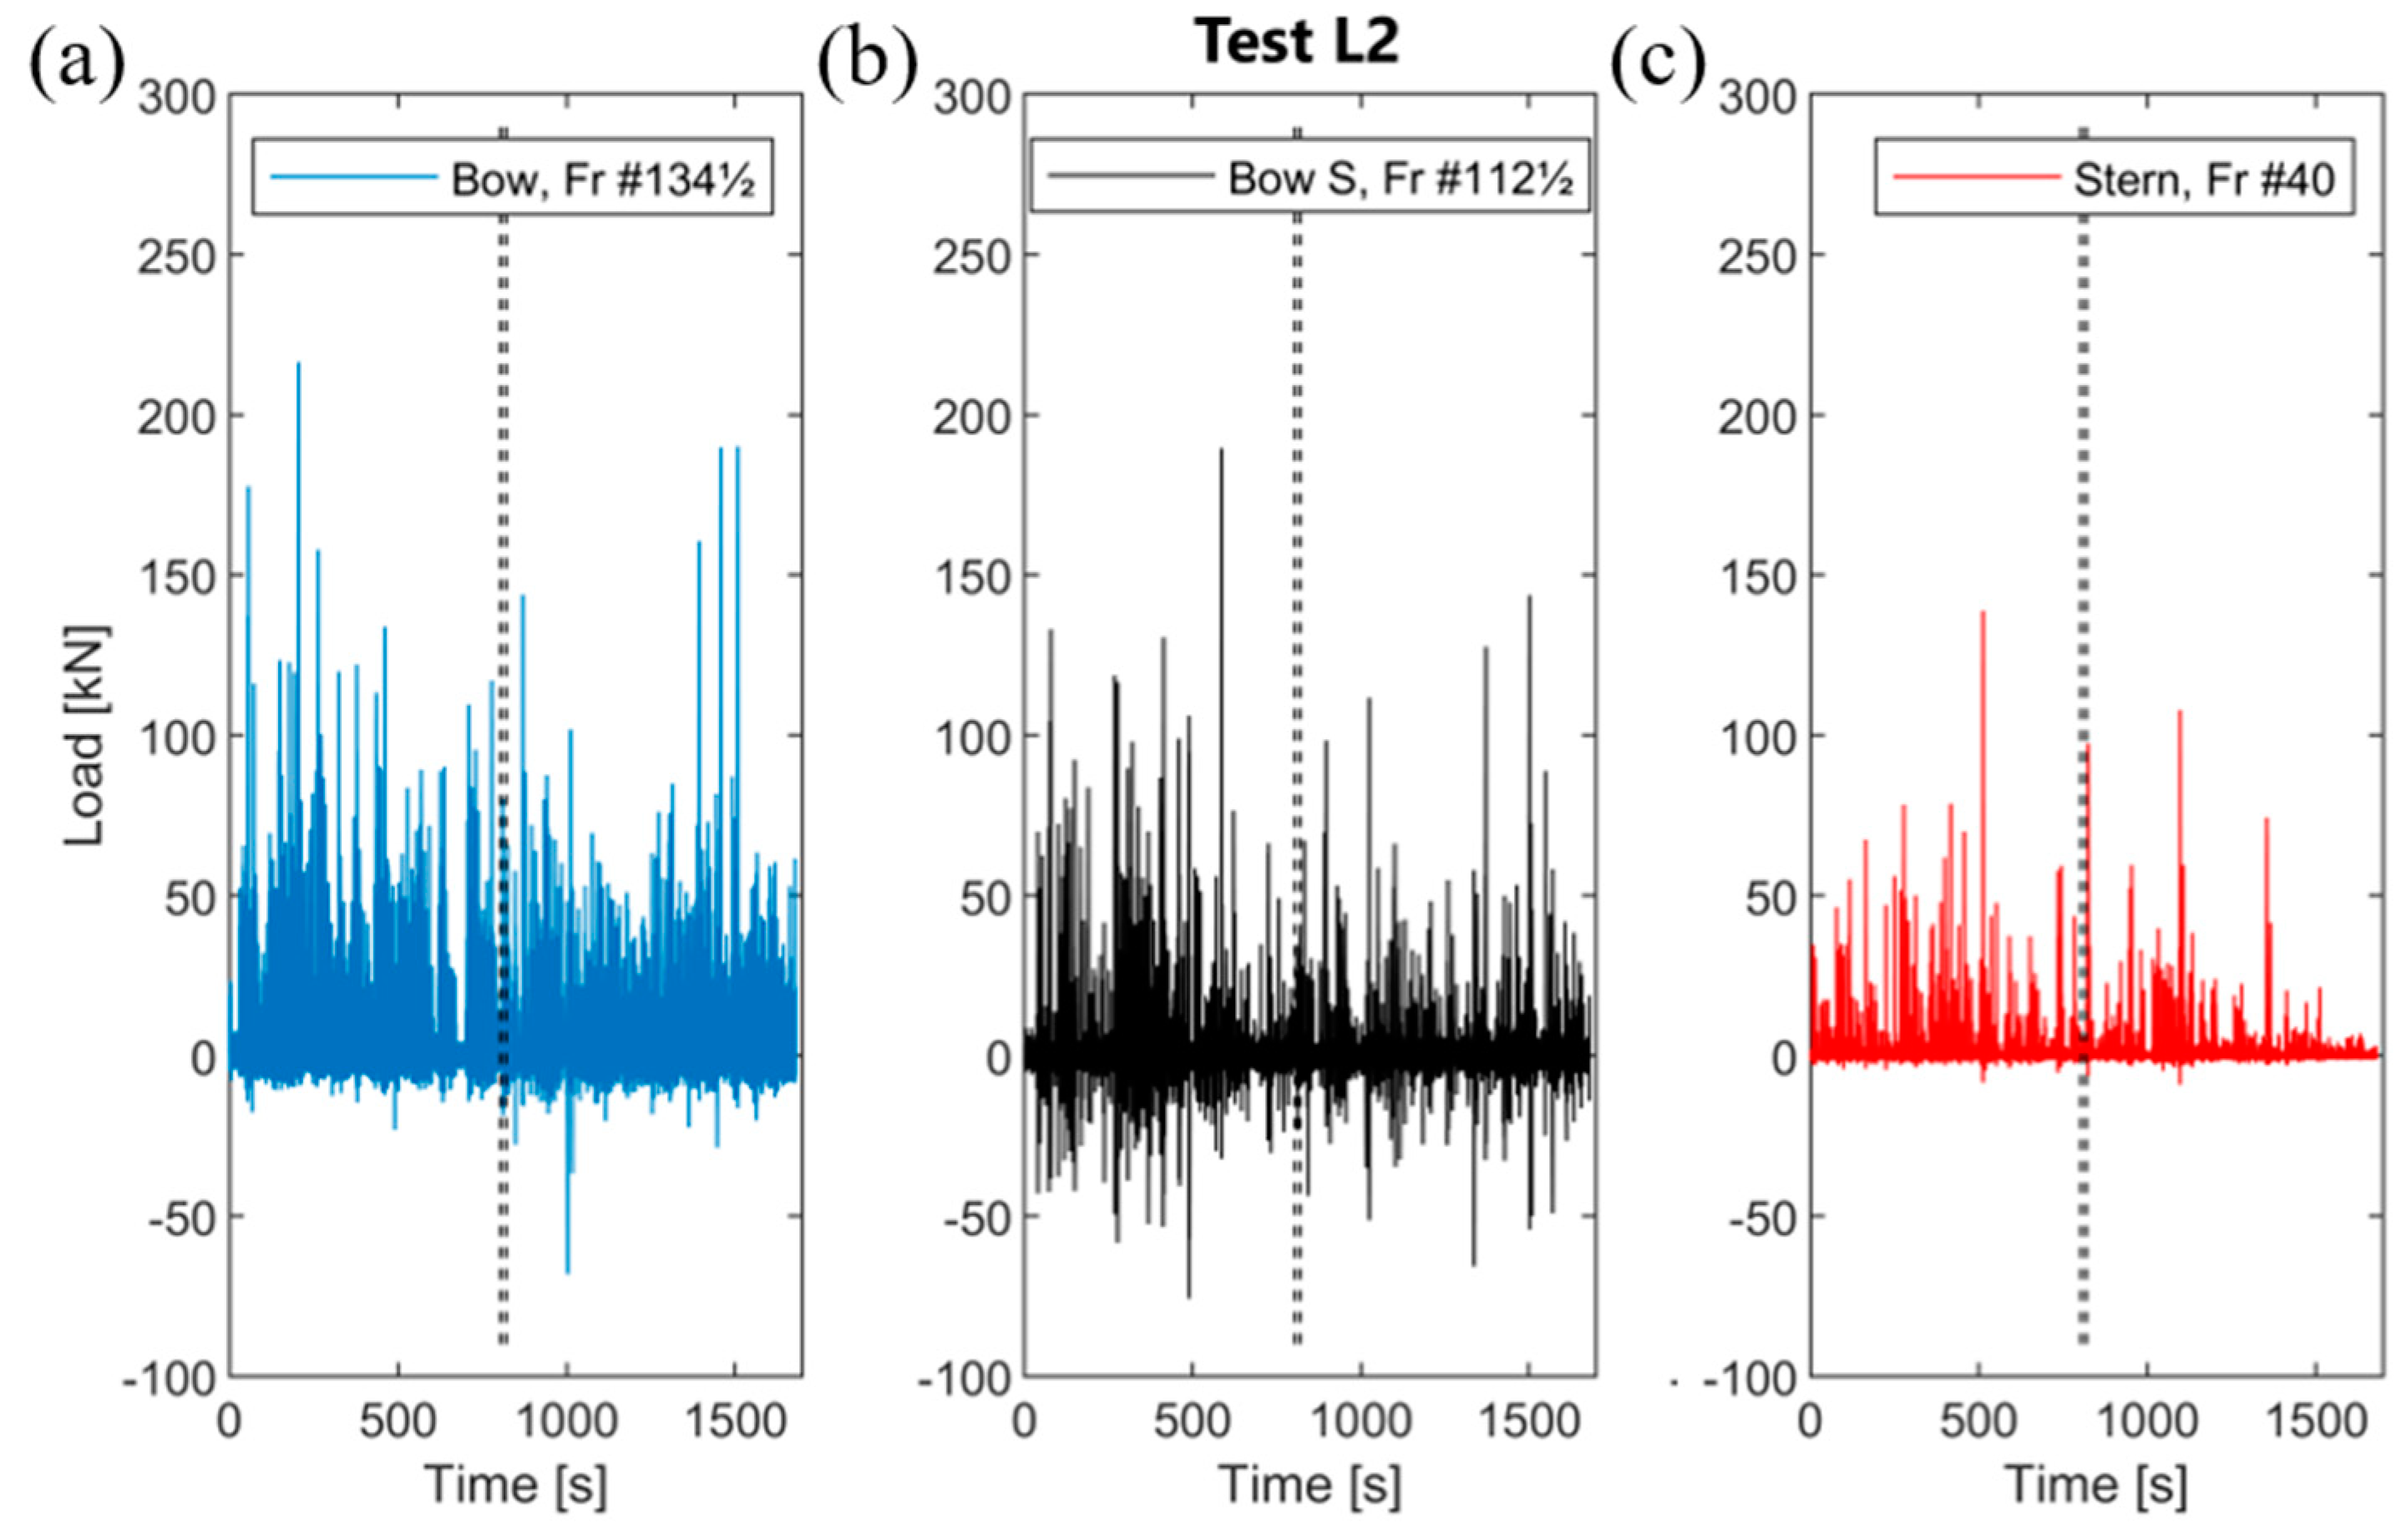
Measured ice-induced loads at (a) bow, (b) bow shoulder, and (c) stern shoulder during tests L2_1 and L2_2.
Figure A2.
Measured ice-induced loads at (a) bow, (b) bow shoulder, and (c) stern shoulder during tests L2_1 and L2_2.
Figure A3.
Measured ice-induced loads at (a) bow, (b) bow shoulder, and (c) stern shoulder during test L3.
Figure A3.
Measured ice-induced loads at (a) bow, (b) bow shoulder, and (c) stern shoulder during test L3.
Figure A4.
Applied motor power, measured ice thickness with the electromagnetic device (EM) and stereo camera system (SC), and obtained speed during tests (a) BC1, (b) BC2, and (c) BC3. Applied rudder angles with obtained heading during tests (d) BC1, (e) BC2, and (f) BC3.
Figure A4.
Applied motor power, measured ice thickness with the electromagnetic device (EM) and stereo camera system (SC), and obtained speed during tests (a) BC1, (b) BC2, and (c) BC3. Applied rudder angles with obtained heading during tests (d) BC1, (e) BC2, and (f) BC3.
Figure A5.
Measured ice-induced loads at (a) bow, (b) bow shoulder, and (c) stern shoulder during test BC1.
Figure A5.
Measured ice-induced loads at (a) bow, (b) bow shoulder, and (c) stern shoulder during test BC1.
Figure A6.
Measured ice-induced loads at (a) bow, (b) bow shoulder, and (c) stern shoulder during test BC2.
Figure A6.
Measured ice-induced loads at (a) bow, (b) bow shoulder, and (c) stern shoulder during test BC2.
Figure A7.
Measured ice-induced loads at (a) bow, (b) bow shoulder, and (c) stern shoulder during test BC3.
Figure A7.
Measured ice-induced loads at (a) bow, (b) bow shoulder, and (c) stern shoulder during test BC3.
Figure A8.
Applied motor power, measured ice thickness with the electromagnetic device (EM) and stereo camera system (SC), and obtained speed during tests (a) BC4 and T3, (b) T1_1 and T1_2, and (c) T2_1 and T2_2. Applied rudder angles with obtained heading during tests (d) BC4 and T3, (e) T1_1 and T1_2, and (f) T2_1 and T2_2.
Figure A9.
Measured ice-induced loads at (a) bow, (b) bow shoulder, and (c) stern shoulder during tests BC4 and T3.
Figure A9.
Measured ice-induced loads at (a) bow, (b) bow shoulder, and (c) stern shoulder during tests BC4 and T3.
Figure A10.
Measured ice-induced loads at (a) bow, (b) bow shoulder, and (c) stern shoulder during tests T1_1 and T1_2.
Figure A10.
Measured ice-induced loads at (a) bow, (b) bow shoulder, and (c) stern shoulder during tests T1_1 and T1_2.
Figure A11.
Measured ice-induced loads at (a) bow, (b) bow shoulder, and (c) stern shoulder during tests T2_1 and T2_2.
Figure A11.
Measured ice-induced loads at (a) bow, (b) bow shoulder, and (c) stern shoulder during tests T2_1 and T2_2.
Appendix B
The measurement data were collected in separate folders in accordance with
Table 2. Each of the folders was named based on the test presented in each row. As the measured parameters were sampled with different rates from different sources, the measurement data were saved in -ascii format in different files depending on the source of the measurements. As an example, the folder ‘T1′ contains files: ‘T1_hice_SC.txt’, ‘T1_hice_EM.txt’, ‘T1_Navigation.txt’, ‘T1_Machinery.txt’, and ‘T1_ Loads.txt’.
The name of a file indicates the content of the file. In each file, the first column gives the synchronized time that is zeroed to the beginning of the tests. As an example, time 0 s in test T1 equals 21.3. 10:46:00. The starting times of the tests are presented in
Table 2. The other columns of the measurement files are also given. It should be noted that test T1 is applied as an example here, but the content of the files in different tests is the same.
| T1_hice_SC.txt: | Column1—Time [s]; Column2—Ice thickness [m]; |
| T1_hice_EM.txt: | Column1—Time [s]; Column2—Ice thickness [m]; |
| T1_Navigation.txt: | Column1—Time [s]; Column2—Latitude [deg]; |
| | Column3—Longitude [deg]; Column4—Speed over ground [m/s]; |
| | Column5—Course over ground [deg]; Column6—Heading [deg]; |
| T1_Machinery.txt: | Column1—Time [s]; Column2—PS Motor power [kW]; |
| | Column3—SB Motor power [kW]; Column4—PS Rudder position [deg]; |
| | Column5—SB Rudder position [deg]; Column6—PS Propeller pitch [%]; |
| | Column7—SB Propeller pitch [%]; Column8—PS Shaft RPM [RPM]; |
| | Column9—SB Shaft RPM [RPM]; |
| T1_ Loads.txt: | Column1—Time [s]; Column2—Load on frame 134½ [kN]; |
| | Column3—Load on frame 134 [kN]; Column4—Load on frame 113 [kN]; |
| | Column5—Load on frame 112½ [kN]; Column6—Load on frame 112 [kN]; |
| | Column7—Load on frame 41 [kN]; Column8—Load on frame 40½ [kN]; |
| | Column9—Load on frame 40 [kN]; Column10—Load on frame 39½ [kN]; |
In addition to the measurement data, the approximated waterline of S.A. Agulhas II with the frame angles at the draught 7.55 m was provided in excel format. It should be noted that the frame angles were defined from the frame pictures presented in [
4] for the locations of instrumented areas. The hull angels for other locations were approximated based on the information on the instrumented area. The shape of the waterline was defined based on the general arrangement picture. Thus, the waterline and the frame angles were coarse approximations from the actual hull form.
References
- Bekker, A.; Suominen, M.; Peltokorpi, O.; Kulovesi, J.; Kujala, P.; Karhunen, J. Full Scale Measurements on a Polar Supply and Research Vessel During Maneuver Tests in an Ice Field in the Baltic Sea. In Proceedings of the 33rd International Conference on Ocean, Offshore and Arctic Engineering, OMAE33, San Francisco, CA, USA, 8–13 June 2014. [Google Scholar]
- Suominen, M.; Kujala, P.; Kotilainen, M. The Encountered Extreme Events and Predicted Maximum Ice Induced Loads on the Ship Hull in the Southern Ocean. In Proceedings of the 34th International Conference on Ocean, Offshore and Arctic Engineering, OMAE34, St. John’s, NL, Canada, 31 May–5 June 2015. [Google Scholar]
- Valtonen, V. Effect of rudder force on stern shoulder region ice-induced loads. In Proceedings of the Arctic Technology Conference, St. John’s, NL, Canada, 24–26 October 2016. [Google Scholar]
- Suominen, M.; Kujala, P.; von Bock und Polach, R.; Kiviranta, J. Measured Ice-induced loads and Design Ice-induced loads. Analysis and Design of Marine Structures. In Proceedings of the 4th International Conference on Marine Structures, MARSTRUCT 2013, Espoo, Finland, 25–27 March 2013. [Google Scholar]
- Bekker, A.; Suominen, M.; Kujala, P.; De Waal, R.J.O.; Soal, K.I. From data to insight for a polar supply and research vessel. Ship Technol. Res. 2019, 66, 57–73. [Google Scholar] [CrossRef]
- Iyerusalimskiy, A.; Choi, J.; Park, G.; Kim, Y.; Yu, H. The Interim Results of the Long-Term Ice-Induced Loads Monitoring on the Large Arctic Tanker. In Proceedings of the 21st International Conference on Port and Ocean Engineering under Arctic Conditions, POAC11, Montréal, QC, Canada, 10–14 July 2011. [Google Scholar]
- Abramian, A.; Vekulenko, S.; van Horssen, W. On a simple oscillator problem describing ice-induced vibrations of an offshore structure. Nonlinear Dyn. 2019, 98, 151–166. [Google Scholar] [CrossRef] [Green Version]
- Korri, P.; Varsta, P. On the Ice Trial of a 14500 DWT Tanker on the Gulf of Bothnia. In Proceedings of the 24th Norwegian Ship Technology Conference, Helsinki, Finland, 4–5 October 1979. [Google Scholar]
- Vuorio, J.; Riska, K.; Varsta, P. Long Term Measurements of Ice Pressure and Ice-Induced Stresses on the Icebreaker Sisu in Winter 1978; Report No 28; Winter Navigation Research Board: Helsinki, Finland, 1979; p. 50. [Google Scholar]
- Glen, I.; Blount, H. Measurement of ice impact pressures and loads onboard CCGS Louis S. St. Laurent. In Proceedings of the 3rd International Conference on Ocean, Offshore & Arctic Engineering, OMAE3, New Orleans, LA, USA, 1984.
- Kujala, P.; Vuorio, J. On the statistical nature of the ice-induced pressures measured on board I.B. Sisu. In Proceedings of the International Conference on Port and Ocean Engineering under Arctic Conditions, POAC 1985, Narssarssuaq, Greenland, 7–14 September 1985; pp. 823–837. [Google Scholar]
- Riska, K.; Rantala, H.; Joensuu, A. Full Scale Observations on Ship-Ice Contact Results from Tests Series Onboard IB Sampo, Winter 1989; Report M-97; Helsinki University of Technology, Laboratory of Naval Architecture and Marine Engineering: Espoo, Finland, 1990. [Google Scholar]
- St. John, J.; Sheinberg, R.; Ritch, R.; Minnick, P. Ice impact load measurements abroad the Oden during the International Arctic Ocean Expedition 1991. In Proceedings of the SNAME, 5th International Conference on Ships and Marine Structures in Cold Regions, Calgary, AB, Canada, 16–18 March 1994. [Google Scholar]
- Izumiyama, K.; Takimoto, T.; Uto, S. Length of Ice-induced load Patch on a Ship Bow in Level Ice. In 10th International Symposium on Practical Design of Ships and other Floating Structures, PRADS 2007; ABS: Houston, TX, USA, 2007. [Google Scholar]
- Gagnon, R. Analysis of data from bergy bit impacts using a novel hull-mounted external Impact Panel. Cold Reg. Sci. Technol. 2008, 52, 50–66. [Google Scholar] [CrossRef]
- Hänninen, S.; Lensu, M.; Riska, K. Analysis of the Ice Lad Measurements during USCGC Healy Ice Trials, Spring 2000; Report M-265; Helsinki University of Technology, Ship Laboratory: Espoo, Finland, 2001. [Google Scholar]
- Lee, J.-H.; Hwang, M.-R.; Kwon, S.; Kang, J.-G.; Park, H.-M.; Choi, K.; Lee, T.-K. Analysis of Local Ice-Induced Load Signals Measured on an Arctic Voyage in 2013. In Proceedings of the 23rd International Conference on Port and Ocean Engineering under Arctic Conditions, Trondheim, Norway, 14–18 June 2015. [Google Scholar]
- Ahn, S.-J.; An, W.-S.; Lee, T.-K.; Choi, K. An Analysis on Strain Gauge Signal Measured from Repetitive Ramming in Heavy Ice Condition. In Proceedings of the 24th International Conference on Port and Ocean Engineering under Arctic Conditions, Busan, Korea, 11–16 June 2017. [Google Scholar]
- Ahn, S.-J.; Lee, T.-K. An experimental study on occurrence of intermediate peaks in ice-induced load signals. Int. J. Nav. Archit. Ocean Eng. 2020, 12, 157–167. [Google Scholar] [CrossRef]
- Suominen, M.; Karhunen, J.; Bekker, A.; Kujala, P.; Elo, M.; Von Bock und Polach, R.; Endlund, H.; Saarinen, S. Full scale measurements on board PSRV S.A. Agulhas II in the Baltic Sea. In Proceedings of the 22nd International Conference on Port and Ocean Engineering under Arctic Conditions, POAC13, Espoo, Finland, 9–13 June 2013. [Google Scholar]
- Daley, C.G. Ice Edge Contact—A Brittle Failure Process Model; Acta Polytechnica Scandinavica, Mechanical Engineering Series No. 100; Finnish Academy of Technology: Helsinki, Finland, 1991. [Google Scholar]
- Kotilainen, M.; Suominen, M.; Kujala, P. Rotating ice cusps on ship’s bow shoulder: Full-scale study on the cusp sizes and corresponding peak loads in different ice and operational conditions. Ocean Eng. 2019, 189, 106280. [Google Scholar] [CrossRef]
- Kujala, P. On the Statistics of Ice-Induced Loads on Ship Hull, in the Baltic; Acta Polytechnica Scandinavica, Mechanical Engineering Series No. 116; Finnish Academy of Technology: Helsinki, Finland, 1994. [Google Scholar]
- Kotilainen, M.; Vanhatalo, J.; Suominen, M.; Kujala, P. Predicting ice-induced load amplitudes on ship bow conditional on ice thickness and ship speed in the Baltic Sea. Cold Reg. Sci. Technol. 2017, 135, 116–126. [Google Scholar] [CrossRef]
- Suominen, M.; Kujala, P.; Romanoff, J.; Remes, H. Influence of load length on short-term ice-induced load statistics in full-scale. Mar. Struct. 2017, 52, 153–172. [Google Scholar] [CrossRef]
- Suominen, M.; Kujala, P.; Romanoff, J.; Remes, H. The effect of the extension of the instrumentation on the measured ice-induced load on a ship hull. Ocean Eng. 2017, 144. [Google Scholar] [CrossRef]
- Suominen, M.; Kujala, P. The measured line load as a function of the load length in the Antarctic Waters. In Proceedings of the 23rd International Conference on Port and Ocean Engineering under Arctic Conditions, POAC15, Trondheim, Norway, 14–18 June 2015. [Google Scholar]
- Kulovesi, J.; Lehtiranta, J. Level ice thickness measurement using ship-based semi-automatic computer vision. In Proceedings of the 22nd IAHR International Symposium on Ice, Singapore, 11–15 August 2014. [Google Scholar]
- Lensu, M.; Kujala, P.; Kulovesi, J.; Lehtiranta, J.; Suominen, M. Measurements of Antarctic Sea Ice Thickness during the Ice Transit of S.A. Agulha II. In Proceedings of the 23rd International Conference on Port and Ocean Engineering under Arctic Conditions, POAC15, Trondheim, Norway, 14–18 June 2015. [Google Scholar]
- Suominen, M.; Kulovesi, J.; Lensu, M.; Lehtiranta, J.; Kujala, P. A Comparison of Shipborne Methods for Ice Thickness Determination. In Proceedings of the 22nd IAHR International Symposium on Ice, Singapore, 11–15 August 2014. [Google Scholar]
- Lensu, M. The Evolution of Ridged Ice Fields. Ph.D. Thesis, Report M-280. Laboratory of Naval Architecture and Marine Engineering, Helsinki University of Technology, Espoo, Finland, 2003. [Google Scholar]
Figure 1.
An idealization of the ice edge failure process in a case of (
a) small to large frame angles and (
b) vertical frames. Reproduced from [
23], with permission from Finnish Academy of Technology, 1994. β
n, h
c, and h
i denote the frame angle, contact height, and ice thickness, respectively.
Figure 2.
Ideal ice breaking process. Reproduced from [
24], with permission from Elsevier, 2017.
Figure 2.
Ideal ice breaking process. Reproduced from [
24], with permission from Elsevier, 2017.
Figure 3.
(
a) Wide and (
b) narrow ice-induced loads travelling from the foremost frame to the aftmost, from the frame #41 to the frame # 39½, when the ship moves forward. Reproduced from [
25], with permission from Elsevier, 2017.
Figure 3.
(
a) Wide and (
b) narrow ice-induced loads travelling from the foremost frame to the aftmost, from the frame #41 to the frame # 39½, when the ship moves forward. Reproduced from [
25], with permission from Elsevier, 2017.
Figure 4.
(a) Load event identified and separated with Rayleigh separation and (b) load identified with trigger value exceedance on the right.
Figure 4.
(a) Load event identified and separated with Rayleigh separation and (b) load identified with trigger value exceedance on the right.
Figure 5.
Instrumentation of S.A. Agulhas II. Reproduced from [
27], with permission from the Committee of the Port and Ocean Engineering under Arctic Conditions, 2015.
Figure 5.
Instrumentation of S.A. Agulhas II. Reproduced from [
27], with permission from the Committee of the Port and Ocean Engineering under Arctic Conditions, 2015.
Figure 6.
(a) Applied motor power, measured ice thickness with the electromagnetic device (EM) and stereo camera system (SC), and obtained speed, and (b) applied rudder angles with obtained heading during test L1.
Figure 6.
(a) Applied motor power, measured ice thickness with the electromagnetic device (EM) and stereo camera system (SC), and obtained speed, and (b) applied rudder angles with obtained heading during test L1.
Figure 7.
Measured ice-induced loads at (a) bow, (b) bow shoulder, and (c) stern shoulder during test L1.
Figure 7.
Measured ice-induced loads at (a) bow, (b) bow shoulder, and (c) stern shoulder during test L1.
Figure 8.
(a) Applied motor power, measured ice thickness with the electromagnetic device (EM) and stereo camera system (SC), and obtained speed, and (b) applied rudder angles with obtained heading during tests BC5, T4_1, and T4_2.
Figure 8.
(a) Applied motor power, measured ice thickness with the electromagnetic device (EM) and stereo camera system (SC), and obtained speed, and (b) applied rudder angles with obtained heading during tests BC5, T4_1, and T4_2.
Figure 9.
Measured ice-induced loads at (a) bow, (b) bow shoulder, and (c) stern shoulder during tests BC5, T4_1, and T4_2.
Figure 9.
Measured ice-induced loads at (a) bow, (b) bow shoulder, and (c) stern shoulder during tests BC5, T4_1, and T4_2.
Figure 10.
The frequency of measured peak loads, obtained speed, and turning rate in different tests. In the legend, Bow S, Stern, and Freq. refer to Bow Shoulder, Stern Shoulder, and Frequency, respectively.
Figure 10.
The frequency of measured peak loads, obtained speed, and turning rate in different tests. In the legend, Bow S, Stern, and Freq. refer to Bow Shoulder, Stern Shoulder, and Frequency, respectively.
Figure 11.
The 25%, 50%, 75%, and 95% quantiles of measured ice-induced load magnitudes at (a) bow, (b) bow shoulder, and (c) stern shoulder, with measured maximum ice thickness with the stereo camera system.
Figure 11.
The 25%, 50%, 75%, and 95% quantiles of measured ice-induced load magnitudes at (a) bow, (b) bow shoulder, and (c) stern shoulder, with measured maximum ice thickness with the stereo camera system.
Figure 12.
Duration of peak loads from all the tests at (a) all hull regions in histogram format, and individual loads with calculated 95% quantiles at (b) bow, (c) bow shoulder, and (d) stern shoulder.
Figure 12.
Duration of peak loads from all the tests at (a) all hull regions in histogram format, and individual loads with calculated 95% quantiles at (b) bow, (c) bow shoulder, and (d) stern shoulder.
Figure 13.
Peak load rise times from all the tests at (a) all hull regions in histogram format, and individual loads with calculated 95% quantiles at (b) bow, (c) bow shoulder, and (d) stern shoulder.
Figure 13.
Peak load rise times from all the tests at (a) all hull regions in histogram format, and individual loads with calculated 95% quantiles at (b) bow, (c) bow shoulder, and (d) stern shoulder.
Figure 14.
Duration of load events from all the tests at (a) all hull regions in histogram format, and individual loads with calculated 95% quantiles at (b) bow, (c) bow shoulder, and (d) stern shoulder.
Figure 14.
Duration of load events from all the tests at (a) all hull regions in histogram format, and individual loads with calculated 95% quantiles at (b) bow, (c) bow shoulder, and (d) stern shoulder.
Figure 15.
The 25%, 50%, 75%, and 95% quantiles of measured peak ice-induced load duration at (a) bow, (b) bow shoulder, and (c) stern shoulder.
Figure 15.
The 25%, 50%, 75%, and 95% quantiles of measured peak ice-induced load duration at (a) bow, (b) bow shoulder, and (c) stern shoulder.
Table 1.
The main dimensions of the ship.
Table 1.
The main dimensions of the ship.
| Length, between perpendiculars. | 121.8 m |
| Breadth, moulded. | 21.7 m |
| Draught, design | 7.65 m |
| Deadweight at design displacement | 13 687 t |
| Speed, service | 14.0 kn |
Table 2.
Conducted maneuvering and straight-ahead tests. SB and PS refer to starboard and port side, respectively.
Table 2.
Conducted maneuvering and straight-ahead tests. SB and PS refer to starboard and port side, respectively.
| Test ID | Run | Ice Condition | Start time UTC | End time UTC | Notes |
|---|
| L1 | Ahead | Level ice field | 21.3. 6:59:00 | 21.3. 7:05:00 | - |
| L2_1 and L2_2 | Ahead | Level ice field | 21.3. 10:13:00 | 21.3. 10:41:00 | Two motor power levels |
| L3 | Ahead | Level ice field | 21.3. 14:12:30 | 21.3. 14:22:30 | - |
| BC1 | Break out (PS) | Channel | 21.3. 9:32:40 | 21.3. 9:36:20 | - |
| BC2 | Break out (PS) | Channel | 21.3. 9:52:45 | 21.3. 9:54:30 | - |
| BC3 | Break out (SB) | Channel | 21.3. 11:17:00 | 21.3. 11:19:40 | - |
| T1_1 and T1_2 | Turning (SB + PS) | Level ice field | 21.3. 10:46:0 | 21.3. 10:57:30 | Turn to SB, turn to PS |
| T2_1 and T2_2 | Turning (PS + PS) | Level ice field | 21.3. 11:21:00 | 21.3. 11:31:00 | Turn to PS, turn to PS |
| BC4 + T3 | Break out (PS) + Turning (PS) | Channel + Level ice field | 22.3. 9:03:25 | 22.3. 9:11:20 | Break out to PS, turn to PS |
| BC5, T4_1, and T4_2 | Break out (PS) + Turning (PS) + Turning (SB) | Channel + Level ice field | 22.3. 9:31:00 | 22.3. 9:54:30 | Break out to PS, turn to PS, turn to SB |
Table 3.
Visual observations from the ice conditions during the tests. The time indicates the beginning of the period.
Table 3.
Visual observations from the ice conditions during the tests. The time indicates the beginning of the period.
| Date | Time (UTC) | Concentration % | Ice Level cm (in Tenths) | Ridge Sail Height m (in Tenths) | Ridge Density in Ship Length |
|---|
| Ice Field | Channel | <10 | 10–30 | 30–70 | <0.5 | 0.5–1.0 | 1.0–1.5 |
|---|
| | 21.3.2012 | | | | | | | | | |
| L1 | 6:50 | 90 | | | | 9 | | | | |
| 7:00 | 100 | | | | 10 | 10 | | | 2 |
| BC1 | 9:30 | 90 | 10 | | 1 | 9 | | 10 | | 3 |
| BC2 | 9:50 | 80 | 20 | | | 10 | 5 | 5 | | 1 |
| L2_1 & L2_2; T1_1 & T1_2 | 10:10 | 90 | 10 | 1 | | 9 | 10 | | | 3 |
| 10:20 | 90 | 10 | 1 | | 9 | 5 | 5 | | 3 |
| 10:30 | 100 | | | | 10 | 6 | 4 | | 4 |
| 10:40 | 80 | 20 | | | 10 | 9 | 1 | | 1 |
| 10:50 | 70 | 30 | | 5 | 5 | 10 | | | 1 |
| BC3 | 11:10 | 100 | | | | 10 | 8 | 2 | | 3 |
| T2_1 & T2_2 | 11:20 | 90 | 10 | | 1 | 9 | 3 | 6 | 1 | 3 |
| 11:30 | 90 | 10 | | | 10 | 2 | 8 | | 3 |
| | 22.3.2012 | | | | | | | | | |
| BC4 & T3 | 9:00 | 50 | 50 | | 2 | 8 | 10 | | | 1 |
| 9:10 | 100 | | | 2 | 8 | 10 | | | 3 |
| BC5 & T4_1 & T4_2 | 9:30 | 90 | 10 | | | 10 | 10 | | | 5 |
| 9:40 | 100 | | | 4 | 6 | 10 | | | 3 |
| 9:50 | 90 | 10 | | 4 | 6 | 9 | 1 | | 2 |
Table 4.
Measured ice conditions during the straight-ahead tests.
Table 4.
Measured ice conditions during the straight-ahead tests.
| Test ID | Ice Thickness [m] |
|---|
| Stereo Camera | Electromagnetic Device |
|---|
| Mean | Standard Deviation | Maximum | Mean | Standard Deviation | Maximum |
|---|
| L1 | 0.33 | 0.09 | 0.56 | 0.99 | 0.56 | 3.42 |
| L2_1 | 0.29 | 0.09 | 0.55 | 0.74 | 0.46 | 2.86 |
| L2_2 | 0.27 | 0.08 | 0.52 | 0.90 | 0.56 | 3.33 |
| L3 | 0.33 | 0.10 | 0.80 | 0.89 | 0.15 | 1.59 |
Table 5.
Ship navigation and machine control data during straight-ahead tests.
Table 5.
Ship navigation and machine control data during straight-ahead tests.
| Test ID | Speed | Turning Rate | Engine Power | Rudder Angle | Propeller Pitch |
|---|
| PS | SB | PS | SB | PS | SB |
|---|
| [m/s] | [deg/s] | [kW] | [kW] | [deg] | [deg] | [%] | [%] |
|---|
| L1 | 4.8 | 0.00 | 2804 | 2804 | 0 | 0 | 65 | 65 |
| L2_1 | 4.5 | −0.01 | 2189 | 2226 | –1 | 0 | 58 | 57 |
| L2_2 | 6.2 | 0.01 | 3723 | 3746 | 1 | 1 | 80 | 81 |
| L3 | 2.9 | −0.01 | 1420 | 1451 | 0 | 0 | 39 | 39 |
Table 6.
Measured ice conditions during the maneuver tests.
Table 6.
Measured ice conditions during the maneuver tests.
| Test ID | Ice Thickness [m] |
|---|
| Stereo Camera | Electromagnetic Device |
|---|
| Mean | Standard Deviation | Maximum | Mean | Standard Deviation | Maximum |
|---|
| BC1 | 0.26 | 0.07 | 0.45 | 0.46 | 0.21 | 1.11 |
| BC2 | 0.23 | 0.03 | 0.29 | 0.30 | 0.11 | 0.78 |
| BC3 | 0.22 | 0.09 | 0.45 | 0.89 | 0.48 | 2.32 |
| BC4 | 0.27 | 0.08 | 0.41 | 0.61 | 0.23 | 1.11 |
| BC5 | 0.33 | 0.09 | 0.53 | 1.02 | 0.50 | 2.91 |
| T1_1 | 0.25 | 0.08 | 0.55 | 0.73 | 0.21 | 1.77 |
| T1_2 | 0.25 | 0.05 | 0.39 | 0.72 | 0.34 | 2.5 |
| T2_1 | 0.29 | 0.07 | 0.49 | 0.70 | 0.33 | 2.09 |
| T2_2 | 0.34 | 0.12 | 0.65 | 1.60 | 0.68 | 3.94 |
| T3 | 0.28 | 0.09 | 0.59 | 0.64 | 0.28 | 1.78 |
| T4_1 | 0.31 | 0.09 | 0.71 | 0.83 | 0.51 | 2.99 |
| T4_2 | 0.29 | 0.06 | 0.45 | 0.64 | 0.38 | 2.65 |
Table 7.
Ship navigation and machine control data during the maneuver tests.
Table 7.
Ship navigation and machine control data during the maneuver tests.
| Test ID | Speed | Turning Rate | Engine Power | Rudder Angle | Propeller Pitch |
|---|
| PS | SB | PS | SB | PS | SB |
|---|
| [m/s] | [deg/s] | [kW] | [kW] | [deg] | [deg] | [%] | [%] |
|---|
| BC1 | 4.1 | −0.61 | 1966 | 1708 | −36 | −35 | 49 | 48 |
| BC2 | 3.2 | −0.80 | 3783 | 3798 | −30 | −30 | 75 | 76 |
| BC3 | 5.0 | 0.82 | 1743 | 2361 | 29 | 30 | 57 | 57 |
| BC4 | 5.4 | −0.58 | 2726 | 2510 | −29 | −29 | 65 | 65 |
| BC5 | 5.2 | −0.43 | 4464 | 4280 | −30 | −29 | 81 | 81 |
| T1_1 | 4.3 | 0.24 | 2132 | 2330 | 28 | 29 | 57 | 57 |
| T1_2 | 4.3 | −0.64 | 2446 | 2171 | −28 | −28 | 57 | 57 |
| T2_1 | 4.2 | −0.48 | 2367 | 2229 | −29 | −29 | 57 | 57 |
| T2_2 | 3.0 | −0.27 | 2726 | 2759 | −30 | −30 | 57 | 57 |
| T3 | 4.1 | −0.73 | 3755 | 3546 | −38 | −38 | 72 | 73 |
| T4_1 | 4.3 | −0.28 | 4300 | 4294 | −42 | −43 | 80 | 81 |
| T4_2 | 4.7 | 0.32 | 4354 | 4461 | 43 | 43 | 80 | 81 |
Table 8.
The frequency of measured peak loads in Hertz in different tests.
Table 8.
The frequency of measured peak loads in Hertz in different tests.
| | L3 | L2_1 | L1 | L2_2 | T2_2 | T3 | T2_1 | T1_2 | T4_1 | BC2 | BC1 | BC5 | BC4 | T1_1 | T4_2 | BC3 |
|---|
| Bow | 1.4 | 1.6 | 1.9 | 2.1 | 0.9 | 1.2 | 1.3 | 1.4 | 1.6 | 0.5 | 0.5 | 1.5 | 0.9 | 2.2 | 1.9 | 1.5 |
| Bow Shoulder | 0.3 | 0.3 | 0.2 | 0.2 | 0.1 | 0.2 | 0.1 | 0.1 | 0.2 | 0.2 | 0.1 | 0.1 | 0.0 | 0.4 | 0.6 | 0.0 |
| Stern Shoulder | 0.1 | 0.2 | 0.1 | 0.1 | 0.7 | 0.7 | 0.7 | 0.6 | 1.1 | 0.4 | 0.3 | 1.1 | 0.5 | 0.0 | 0.0 | 0.0 |
Table 9.
The 25%, 50%, 75%, and 95% quantiles of measured ice-induced load magnitudes at bow, bow shoulder, and stern shoulder.
Table 9.
The 25%, 50%, 75%, and 95% quantiles of measured ice-induced load magnitudes at bow, bow shoulder, and stern shoulder.
| | Quantile | L2_2 | L2_1 | L1 | L3 | T1_2 | T2_1 | T3 | T2_2 | T4_1 | BC2 | BC4 | BC1 | BC5 | T4_2 | T1_1 | BC3 |
|---|
| Bow | 25% | 12.3 | 12.9 | 13.6 | 13.5 | 12.3 | 12.9 | 12.5 | 13.4 | 13.1 | 11.7 | 13.7 | 11.6 | 13.6 | 12.8 | 13.0 | 12.1 |
| 50% | 16.1 | 17.6 | 19.2 | 19.3 | 16.1 | 16.7 | 16.5 | 20.0 | 18.3 | 14.4 | 16.8 | 15.7 | 19.3 | 17.0 | 17.6 | 16.6 |
| 75% | 23.6 | 26.6 | 31.5 | 33.0 | 22.7 | 24.7 | 25.4 | 33.7 | 28.9 | 18.8 | 25.8 | 19.9 | 37.2 | 25.4 | 26.4 | 27.5 |
| 95% | 43.2 | 54.9 | 60.0 | 74.5 | 43.5 | 53.8 | 56.3 | 67.7 | 61.6 | 27.6 | 59.7 | 40.3 | 64.0 | 47.3 | 55.9 | 51.1 |
| Bow Shoulder | 25% | 12.7 | 14.5 | 14.6 | 14.5 | 12.8 | 13.1 | 13.6 | 13.4 | 12.9 | 13.0 | 10.5 | 10.6 | 15.4 | 13.9 | 12.4 | 14.4 |
| 50% | 18.8 | 24.7 | 27.0 | 28.2 | 16.5 | 21.4 | 17.9 | 18.0 | 18.3 | 17.1 | 10.5 | 15.5 | 23.9 | 23.6 | 19.4 | 22.8 |
| 75% | 30.3 | 46.8 | 51.6 | 55.0 | 25.2 | 37.5 | 27.0 | 30.5 | 28.8 | 22.3 | 10.5 | 43.5 | 34.6 | 43.4 | 35.8 | 60.7 |
| 95% | 66.8 | 109.1 | 99.1 | 129.9 | 42.0 | 85.9 | 66.1 | 72.8 | 49.5 | 42.7 | 10.5 | 99.2 | 45.6 | 105.7 | 74.0 | 139.6 |
| Stern Shoulder | 25% | 12.3 | 12.6 | 12.4 | 12.3 | 13.9 | 13.9 | 14.6 | 14.4 | 15.8 | 12.6 | 11.7 | 12.6 | 13.3 | 0.0 | 11.5 | 0.0 |
| 50% | 16.1 | 16.8 | 19.5 | 16.5 | 25.7 | 21.6 | 24.6 | 22.4 | 32.2 | 20.0 | 14.7 | 18.7 | 19.0 | 0.0 | 12.3 | 0.0 |
| 75% | 24.1 | 24.1 | 35.8 | 25.8 | 48.9 | 50.7 | 59.7 | 39.6 | 77.4 | 44.8 | 20.3 | 39.3 | 39.7 | 0.0 | 13.3 | 0.0 |
| 95% | 55.6 | 52.2 | 80.9 | 75.2 | 80.5 | 130.0 | 141.8 | 114.8 | 161.2 | 98.7 | 47.6 | 164.4 | 158.6 | 0.0 | 13.6 | 0.0 |
Table 10.
Statistical figures for the rise time and duration of peak loads and duration of load events.
Table 10.
Statistical figures for the rise time and duration of peak loads and duration of load events.
| | Number of Loads | Rise Time [s] | Peak Load Duration [s] | Load Event Duration [s] |
|---|
| | Peak Loads | Load Events | Mean | Median | Max | Mean | Median | Max | Mean | Median | Max |
|---|
| Bow | 16922 | 15731 | 0.045 | 0.035 | 0.516 | 0.094 | 0.075 | 1.001 | 0.101 | 0.080 | 1.157 |
| Bow Shoulder | 4249 | 3831 | 0.066 | 0.050 | 0.686 | 0.135 | 0.105 | 1.166 | 0.150 | 0.105 | 2.403 |
| Stern Shoulder | 8246 | 6722 | 0.067 | 0.050 | 0.631 | 0.137 | 0.105 | 1.021 | 0.168 | 0.095 | 2.939 |
© 2020 by the authors. Licensee MDPI, Basel, Switzerland. This article is an open access article distributed under the terms and conditions of the Creative Commons Attribution (CC BY) license (http://creativecommons.org/licenses/by/4.0/).

 ,
, 


