Article

Coral Reef Community Changes in Karimunjawa National Park, Indonesia: Assessing the Efficacy of Management in the Face of Local and Global Stressors

by
Emma V Kennedy
1,2,*,
Julie Vercelloni
1,3,
Benjamin P Neal
1,4,
Ambariyanto
5,
Dominic E.P. Bryant
1,6,
Anjani Ganase
1,6,
Patrick Gartrell
1,
Kristen Brown
1,6,7,
Catherine J.S. Kim
1,6,
Mu’alimah Hudatwi
5,
Abdul Hadi
5,
Agus Prabowo
8,
Puji Prihatinningsih
8,
Sutris Haryanta
8,
Kathryn Markey
1,2,
Susannah Green
1,
Peter Dalton
1,
Sebastian Lopez-Marcano
1,9,
Alberto Rodriguez-Ramirez
1,7,
Manuel Gonzalez-Rivero
1,10 and
Ove Hoegh-Guldberg
1,2,6
add Show full author list remove Hide full author list
1
Global Change Institute, University of Queensland, St Lucia Campus, Brisbane, QLD 4072, Australia
2
Remote Sensing Research Centre, School of Earth and Environmental Sciences, St Lucia Campus, Brisbane, QLD 4072, Australia
3
Queensland University of Technology, ARC Centre of Excellence for Mathematical and Statistical Frontiers and School of Mathematical Sciences, Science and Engineering Faculty, Brisbane, QLD 4000, Australia
4
Environmental Studies Program, Colby College, 4026 Mayflower Hill, Waterville, ME 04901, USA
5
Faculty of Fisheries and Marine Science, Diponegoro University, Semarang, Central Java 50275, Indonesia
6
ARC Centre of Excellence for Coral Reef Studies, University of Queensland, St Lucia Campus, Brisbane, QLD 4072, Australia
7
School of Biological Sciences, University of Queensland, St Lucia Campus, Brisbane, QLD 4072, Australia
8
Karimunjawa National Park Office (Balai Taman Nasional Karimunjawa), Semerang, Central Java 59455, Indonesia
9
Australian Rivers Institute, Coast and Estuaries, School of Environment and Science, Griffith University, Gold Coast, QLD 4222, Australia
10
Australian Institute of Marine Science, Cape Cleveland, QLD 4810, Australia
*
Author to whom correspondence should be addressed.
J. Mar. Sci. Eng. 2020, 8(10), 760; https://doi.org/10.3390/jmse8100760
Submission received: 28 August 2020 / Revised: 22 September 2020 / Accepted: 23 September 2020 / Published: 28 September 2020
(This article belongs to the Special Issue Coral Reef Communities: Diversity, Roles, and Conservation)

Abstract

:
Karimunjawa National Park is one of Indonesia’s oldest established marine parks. Coral reefs across the park are being impacted by fishing, tourism and declining water quality (local stressors), as well as climate change (global pressures). In this study, we apply a multivariate statistical model to detailed benthic ecological datasets collected across Karimunjawa’s coral reefs, to explore drivers of community change at the park level. Eighteen sites were surveyed in 2014 and 2018, before and after the 2016 global mass coral bleaching event. Analyses revealed that average coral cover declined slightly from 29.2 ± 0.12% (Standard Deviation, SD) to 26.3 ± 0.10% SD, with bleaching driving declines in most corals. Management zone was unrelated to coral decline, but shifts from massive morphologies toward more complex foliose and branching corals were apparent across all zones, reflecting a park-wide reduction in damaging fishing practises. A doubling of sponges and associated declines in massive corals could not be related to bleaching, suggesting another driver, likely declining water quality associated with tourism and mariculture. Further investigation of this potentially emerging threat is needed. Monitoring and management of water quality across Karimunjawa may be critical to improving resilience of reef communities to future coral bleaching.

1. Introduction

Tropical coral communities are degrading globally and at a rapid pace, undermining the functioning of the coral reef ecosystems that they underpin, and the people that depend on healthy reefs for food and jobs [1]. Indonesia, custodians to 17% of the world’s coral reefs [2], has the highest human dependence on reefs out of any country [3,4]. Reef degradation is a particularly urgent problem since reefs here support 28% of the world’s reef fishers (1.65 million people); protect the home of 12.1 million people, and generate more tourism revenue (US$2 billion annually) than any other country. Today, just 5% of Indonesia’s reefs remain in excellent condition, 25% in good condition, 37% in moderate condition and 32% are badly degraded [5].
Coral declines are driven by multitudinous threats. Poor water quality, disease, coastal development, invasive species and overfishing and destructive fishing practices are among those that can impact reefs locally, but in the past 30 years climate change—particularly ocean warming—has become the primary driver of coral losses both in Indonesia [6] and globally [7,8]. Between 2014 and 2017, an underwater heatwave triggered the third global mass coral bleaching event, with severe and widespread consequences for reefs around the planet [9]. Globally, protecting reefs from climate change requires societal shifts away practises that emit greenhouse gases [10,11], but locally, reef managers have opportunities to alleviate local stressors by limiting harmful activities or establishing protected areas. Improving reef health may buy time, or improve resilience to climate stressors [12,13] (but also see [14]). Assessing efficacy of these types of local management action in the face of multiple local and global stressors requires regular monitoring of reef condition, as well as an understanding of reef communities responses to different drivers of decline. Without being able to disentangle the effects of different stressors, management actions cannot adequately be reviewed and adjusted to improve outcomes. Yet the taxonomic complexity of coral reef communities, different responses to multiple drivers of decline, and the different scales of monitoring and management, present a challenge to achieving this understanding.

1.1. Karimunjawa National Park

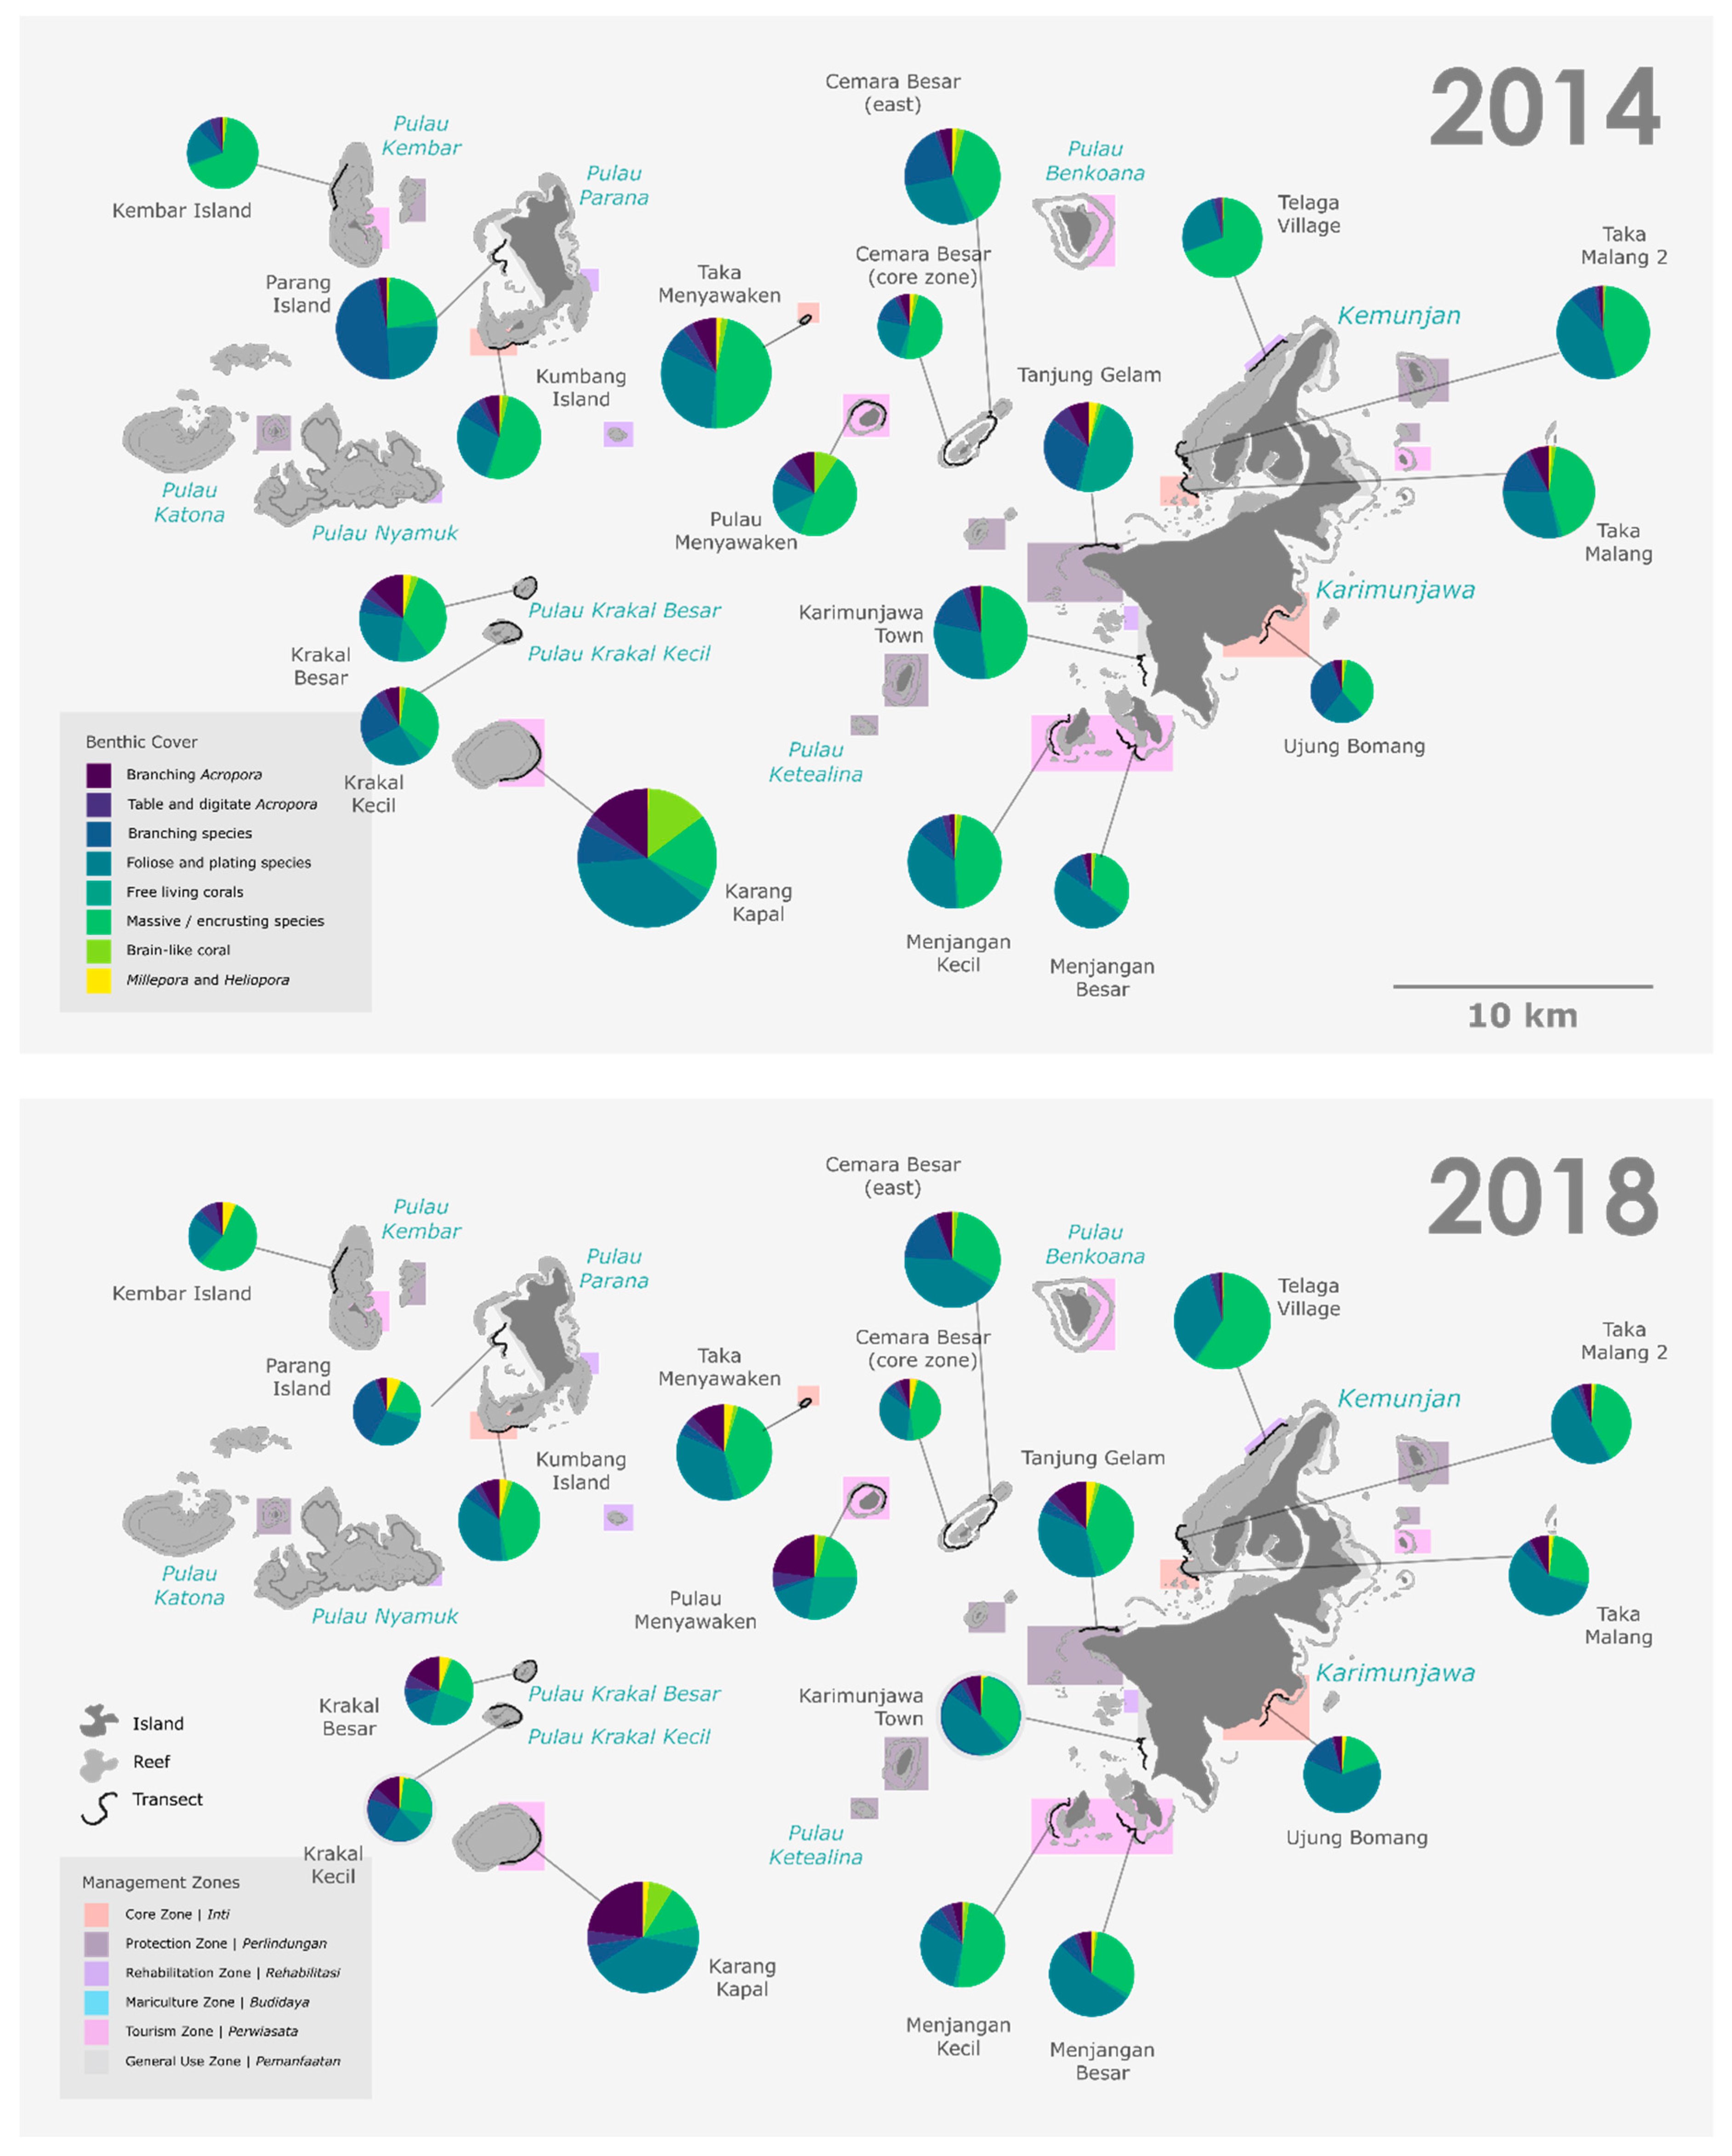
Karimunjawa National Park represents one of the world’s oldest marine parks [15,16]. Located 120 km north of Semarang in central Java, Indonesia, the park spans an archipelago of 27 coral reef-fringed islands [17] (Figure 1). The park currently incorporates 1101 km2 of marine habitat, 13 km2 of tropical lowland forest and 3 km2 of mangrove forest, and remains one of the largest marine protected areas in Indonesia today [13,18]. This includes 132 km2 of coral reefs, including fringing reefs which extend 100 m to 1000 m off rocky slopes of the larger islands of Kemunjan and Kariminjawa, platform reefs such as Menjangan Besar and Menjangan Kecil developed on sand-topped banks, and coral cays [19]. Reefs in the park generally have wide gently sloping reef flats, with steeply sloping (30°) upper fore reef zones where coral abundance is highest, and often a steeper lower fore reef that drops beyond 10 m [20]. These reefs are part of the Coral Triangle, a biogeographic area known to be the global hotspot of marine diversity, and the park hosts a rich diversity of species. Ninety-nine species of coral have been recorded from 51 genera, including protected Antiphates spp. black coral species and 242 species of fish [21]. As well as Karimunjawa’s reefs being of biological significance, the park is of vital importance to the region, supporting a local population of 9000 people, including a local fishery and a growing tourism industry [22].

1.2. Threats and Management

Karimunjawa National Park recently ranked in the top third of threatened marine parks in Indonesia, with its reefs scoring highly due to local pressures (a “high vulnerability” anthropogenic threat score, ranking 39/167), in addition to a high likelihood of being exposed to climate change related heat stress compared other areas across the Coral Triangle (“medium vulnerability” climate pressure score ranking 49/167) [16]. These combined local and climate threats are also what make the area a top conservation priority: management action to protect reefs, as well as benefitting fish spawning aggregations and sea turtles, is important to improve resilience to predicted climate stress [13].
Karimunjawa National Park is often used as a case study for collaborative management [18]. Multiple organisations, including the governmental Karimunjawa National Park Authority (Balai Taman Nasional Karimunjawa), local (e.g., Taka, UCCU underwater coastal clean up group, Yayasan 27 Pulo, HPI, Segoro and LSM Karimun) and international non-governmental organisations (e.g., Wildlife Conservation Society (WCS)), and research organisation University Diponegoro (UNDIP) recently worked with community members towards a park rezoning plan, and community members are actively involved in ongoing surveillance, monitoring and management implementation [18].
Since its establishment in 1985, management of Karimunjawa National Park has evolved in response to changing threats and feedback from scientific monitoring, as well as changing local and national government policy, and input from the community of 9000 people that live and work in the archipelago [18,23]. Management reviews have led to the park being rezoned twice. The first four zones, established in 1989 based on fishing pressure, were upgraded with the consultation of local stakeholders to an eight zone system in 2005, leading to improved compliance [18,24]. The current six zones were established in 2012 in response to monitoring data (Table 1) [25]. Local threats are also evolving, as tourism and mariculture gradually replace reliance on fishing.
Since the 2012 rezoning, the park is divided into six management zones: three designated no-take areas (Zona Inti, or Core Zones), seven limited-access Protected Zones, seven Tourism Zones, three Rehabilitation Zones (designed to allow recovery of degraded reefs) and four Mariculture Zones (set aside for seaweed farming and fish culture) (Table 1, Figure 1). The remaining park areas are designated as Traditional Fisheries Utilization area (Zona Permanfaatan, or General Use Zone) where fishing activity remains unregulated.

1.2.1. Local Pressures: Fishing, Aquaculture and Tourism

Fishing

Fishing pressure on Karimunjawa’s reefs has traditionally been intense [15,23]. Seventy-percent of the community are involved in artisanal fishing [24], but the relative proximity of the island group to Java Island, home to more than 60% of the population of Indonesia, also poses a challenge for reef managers [21]. The archipelago continues to be the most important artisanal fishing area in Java Sea region [26] for peri-reefal pelagic fish (70% of the local catch) and reef fish (30%) [21,22]. While the population of Karimunjawa has been stable for over a decade [22], fishing pressure has changed across the park over time [23]. Harmful fishing practices, including cyanide fishing, the use of explosives and poisons, use of rocks for anchors by the fishing community [27] and muro-ami were once widespread and practised indiscriminately (except in Core Zones [18]). These practises are now less common since protective laws came into effect after much of the reef was damaged [25]. Muro-ami was outlawed since June 2011 in Karimunjawa, and more widely across Indonesia in 2015 [28], although some illegal fishing was still occurring in the northwest sector of the park at the time of the study. Reductions in harmful fishing activities have led to an increase in fish biomass, including herbivorous fish (important in maintaining reef health) across the park [23].

Aquaculture

Karimunjawa’s islands have no permanent rivers, human population growth and coastal development are low [29], and the islands are far enough away from the Central Javan mainland to be beyond the influence of run-off. As a result, local reef systems have been traditionally relatively unaffected by pollution [21,30]. However, aquaculture is seeing faster growth than capture fisheries in Indonesia [31], and in Karimunjawa seaweed, grouper and scallop mariculture have increased in recent years [32]. In 2009 seaweed mariculture production totalled 1151 kg, and the 2012 rezoning resulted in a 42% increase in designated Mariculture Zone areas in the park [18]. If not adequately managed, increases in mariculture can have consequences for water quality [18,32].

Tourism

Tourism has been actively promoted in Karimunjawa as a strategy to stimulate economic diversification and broaden employment opportunities [29], despite a lack of infrastructure and concerns about impacts on reefs [18]. A ferry from Semarang to Karimunjawa, established in 2003 to support domestic and regional tourism [33], has led to swells in visitor numbers during the tourism season. As a result, the park has experienced an exponential increase in tourism, from 450 visitors in 1998, to >9900 in 2008 to >118,000 in 2016 [34]. Tourism has been accompanied by increased demand for seafood products and shifts in occupations to tour operators, souvenir vendors and boat rentals. Tourism impacts on Karimunjawa’s reefs include damage from people walking on the reef, coastal development, an increase in the volume of garbage, and declines in water quality.

1.2.2. Global Pressures: Climate Change

Karimunjawa’s seawater is predicted to warm faster than other areas regionally, meaning its reefs are more likely to experience coral bleaching compared to other reefs in the Coral Triangle [13,16,35]. All three global coral bleaching events impacted corals in the park: the 1997–1998 global coral bleaching led to coral mortality rates of 50–60%, and mass bleaching was also reported in 2010. Mean monthly ocean temperatures in Karimunjawa range from 28.3 °C in August to 29.8 °C in April (based on long term average from 2007 to 2020 [20,36]). Between 2015 and 2016 sustained warmer-than-usual conditions were reported in the park with temperatures rising from October 2015 through April 2016 where they peaked around 30.5 °C [37]. Eighty-eight percent of corals surveyed across 19 sites at the time responded negatively to elevated sea temperatures: 49% of corals surveyed during the event showed some paling, 27% were fully bleached and 12% had died [37].

1.3. The Challenge: Using Monitoring Data to Understand the Effects of Local vs. Global Stressors on Complex Coral Reef Communities

Disentangling the effects of local and global stressors on reef communities by analysing benthic monitoring data can be challenging. Lack of adequate sampling data and appropriate analytic approaches undermine our ability to determine whether observed shifts in the benthic composition are statistically significant, ecologically meaningful, and whether they are driven by local pressures or wider scale environmental changes.
Firstly, ecological monitoring data are not always sufficient in coverage or detail to confidently draw conclusions [38]. Reefs host complex benthic communities of diverse algae and invertebrate taxa, and in-water assessments relying on SCUBA can be time-consuming and require expertise for identification. This often results in trade-offs in sampling effort, where inferences about reef condition are drawn from limited sampling points representing large areas (e.g., line intercept methods), or from sampling large areas but in a limited level of detail (e.g., manta tows) [39].
Secondly, ecological monitoring data are not always straightforward to interpret. The abundance of reef-building hard corals as a proportion of benthic cover, or “coral cover”, when viewed from above in planar perspective, is widely adopted as a proxy for reef condition. Coral cover is a metric that captures the component of the community responsible for habitat creation, reef framework construction, sand generation and many of the other ecosystem services that make coral reefs so valuable, and importantly can be compared between studies and across space and time. Corals however, comprise taxonomically diverse communities, growing in three dimensions, which interact in a myriad of ways, both with each other and with other components of the benthos (e.g., algae), as well as in response to the external environment: meaning the metric, and the taxonomic level at which its applied, can mask important information [40]. Establishing the drivers and meaning of observed coral cover changes can be further confounded by multiple drivers of coral loss, which may operate over divergent scales from local (point source pollution) to global (climate-driven bleaching). Moreover, these scales often differ to the scales at which monitoring (transect scale) and management (reef/region scale) occur [41]. Appropriate approaches to understanding multivariate ecological abundance data are needed, to analyse abundance data collected simultaneously across many taxonomic groups [42].
In this paper, we address both these challenges, (1) by using emerging technologies to gather large amounts of fine scale benthic cover data across Karimunjawa’s coral reefs, and (2) by employing Bayesian statistical modelling to detect meaningful changes in benthic community composition.

1.4. Aims

The study aimed to (1) identify benthic community changes and (2) attribute these to local and global drivers of stress, in order to assess management efficacy and provide guidance and feedback on coral reef condition. This was achieved firstly by assessing variability in benthic community composition, both (a) spatially across the park, looking for variability across different management zones, and (b) temporally between 2014 and 2018, to examine changes with time. Secondly, on detection of any meaningful variability, we asked how changes relate to local factors (such as management efficacy, e.g., zonation) and global factors (such as climate change, i.e., the 2016 coral bleaching event).
Underwater camera-scooters allowed significantly larger areas of reef to be assessed compared to standard survey assessments, generating a dataset more appropriate for understanding largescale variability across the park (regional variability) in the context of local and global change [43]. The technology also allowed us to return to the exact same location, to get an accurate representation of change at a very fine level (meter scale), in order to better understand reef-level variability. Deep learning approaches to gathering data allowed us to extract a greater level of taxonomic detail usually available from rapid surveys.
Meanwhile, the analytical approaches employed to explore the dataset allowed us to assess how multiple components of the benthic community were responding and how that related to zonation, bleaching stress and time, and detect subtle effects that would be missed by standard analytical approaches for exploring reef data.

2. Materials and Methods

Karimunjawa was chosen as a study site because of its size, age and importance [18], and to compliment the efforts of the Indonesian Coral Reef Rehabilitation and Management Program (COREMAP) in order to deepen the coverage national reef resources [26,44]. Research was conducted in the dry season (May to October), when the prevailing eastward flow of surface current present during the northwest monsoon is in reverse, and salinity is higher (35 PSU compared to 31 PSU during monsoon) [20]. All data presented here, including photo quadrats, are freely available to download at [45].

2.1. Ecological Surveys

Ecological surveys were conducted at 18 reef sites across Karimunjawa National Park between 8th and 18th October 2014, and repeated between 26 May to 5th June 2018, under SIMAKSI Permit numbers B-3181/IPK.2/KS/X/2014 and 2486/FRP/E5/Dit.KI/V/2018, respectively (Figure 1, Table A1). Sites were selected to capture a representative range of reefs across the park different management zones: six General Use zones, five Core Zones (Zona Inti), five Tourism Zones (Zona Pemanfaatan Perwiasata), two Rehabilitation Zones (Zona Rehabilitasi), an Aquaculture Zone (Zona Budidaya) and a Protection Zone (Zona Perlingdungan) [24]. Several sites also coincided with Balai Taman Nasional Karimunjawa and Wildlife Conservation Society long term monitoring plots across the park, for validation. All surveys were conducted on SCUBA using a custom-built diver operated underwater propulsion vehicle, which had an integrated camera system consisting of three synchronised Canon 5D-MKII cameras [43]. High-resolution (21 mp) images of the benthos were taken every two meters along a 700 m linear transect, following the upper fore reef slope contour at a depth of ~7–9 m. These shallow slopes were targeted as the area of the most living coral growth [20]. Images were geo-referenced using a surface GPS unit tethered to the diver. Depth and altitude of the camera relative to the surface and the reef benthos were logged at half-second intervals using an altimeter (Echologger AA400, from EofE Ultrasonics Co, Korea) allowing for the selection of imagery within a particular depth and altitude range (7–9 m depth and 0.5–2 m altitude) needed to maintain consistency and address variable environmental conditions.

2.2. Photo Quadrat Processing

Images were analysed using a deep learning framework to extract important biological information about the composition of reef [46,47]. In 2014, 23,135 raw images were initially collected from the area, with a further 19,085 in 2018. Images were flattened, cropped to a standardised 1 m2 photo quadrat and colour-corrected prior to automated analysis [43,46]. A subset of 752 randomly sampled images were manually annotated at 100-point locations per image using CoralNet (http://coralnet.ucsd.edu/), where the substrate beneath each point was identified and assigned to one of 53 benthic substrate categories (see Appendix A, Table A2 for category labels and descriptions). Categories were derived from existing benthic classifications [48,49], modified to capture broad functional role but also limited by how reliably features could be identified from images by human annotators [47]. These manual annotations were used as training datasets to train a deep learning algorithm for automated image classification. The deep learning framework was then used to automatically analyse each image based on the training dataset of 752 human-annotated images [47].
The deep learning framework employed a number of convoluted filters that examine attributes of texture and colour to identify the parameters that best describe each of the benthic categories, based on the manual annotation dataset. Based on these filters, a weighted neural network architecture is built and optimised through numerous iterations that predict and assign a label to each point in an image in a few microseconds (< 0.2 s/50 points). A standard point sampling protocol of 50 randomly selected points per image was used to estimate coverage on targeted benthic categories. Automated estimations of cover had low errors (between 2% and 6% difference in abundance estimates to a human annotator, well within the range of reported inter-observer variability) and a comparable power in detecting temporal trends (for more details see Gonzalez et al. [47]). Classification using the trained neural networks took about 36 h per 50,000 images (200 × the speed and 1% of the cost of a manual analysis), and was completed for all sites by September 2018. All data are public access and freely available to download [45].

2.3. Bleaching Data

Degree Heating Weeks (DHW) were used to estimate heat stress impacts leading to mass coral bleaching across the park, following NOAA Coral Reef Watch (CRW) methods. In this study, DHW was derived from the Coral Bleaching HotSpot product that provides an instantaneous estimate of total heat stress over a 12-week window at a spatial resolution of 5 km [50,51]. Bleaching had been recorded throughout the Karimunjawa National Park in April 2016 [37]. Values of DHW from 1 January 2016 to 31 December 2016 were extracted from the NOAA CRW database and maximum DHW selected [52].

2.4. Statistical Analyses

Data analysis on abundance (percent cover) of benthic groups within the Karimunjawa National Park were performed using the R software (R Core Team 2016), following a methodology developed by Vercelloni et al. [53]. Benthic groups were aggregated into Hard coral, Soft coral, Algae, Sponge and Sediment by summing different sub-groups to produce group relative abundances (Appendix A, Table A2). Hard coral included six broad eco-morphological groups of hermatypic scleractininan corals (Table A2 for full list), as well as the non-scleractinian hydrocoral Millepora and blue octocoral Heliopora (‘NON_HERM’ in the public access database); Soft coral grouped all Alcyonacea, including the leathery soft corals of the Alcyoniidae family (e.g, Sarcophyton and Lobophytum); gorgonian sea fans, plumes and whips belonging to the Holaxonia and Scleraxonia sub-orders (‘GORG’), and other soft coral groups like Xeniidae; Neptheidae; Tubipora; Briareum (‘OTH-SF’); Algae included all fleshy and encrusting macroalgae (>1 cm in height) along with cyanobacteria (‘MACRO’), crustose coralline species (‘CCA’) and turf algae growing over rocky reef matrix or rubble (epilithic algal matrix or ‘EAM’); Sponges include four different types of sponges (barrel forms, branching and rope, encrusting forms and fan-like sponges), and Sediment included all loose non-living substrate, such as rubble, sand and sediment.
Quadrats were grouped into 100 m sub-transects, a) in order to exclude any data where transect line deviated, so that the exact same section of reef (to within 5 m, the GPS error range) could be directly compared between years, and b) so that data analysis took place at an appropriate ecological scale [53]. Sub-transects were generated using hierarchical clustering based on Euclidean distance between geo-located quadrats within transects [53]. We retained sub-transects composed of a minimum of three images per surveyed year and repeated in 2014 and 2018. A total of 672 sub-transects matched these two selection criteria, leading to a set of data ranging from 12 to 52 sub-transects across the reef sites.
A multivariate statistical model was developed to estimate changes in benthic groups across the Karimumjawa National Park, using count data extracted from photo-quadrats (equivalent to traditional benthic community coverage “percent cover” metric). Abundance was characterised by count data of the sub-transect i (with i = 1,…,672) and benthic group j (with j = 1,…4 corresponding to 1 = hard coral, 2 = soft coral, 3 = algae, 4 = sponge and 5 = sediment) and time t (with t = 1,2), and modelling using a negative binomial distribution. A joint modelling approach was used to estimate the influences of management zoning, (Zone), bleaching (DHW) and sampling year (Year) on the full set of observations of benthic groups [42,54]. The joint modelling approach used latent variables to induce correlation across benthic groups and allows to tease apart the influences of Zone, DHW and Year from missing information in the estimation of co-occurrence patterns. Missing information can be attributed to missing environmental explanatory variables and biotic interactions that were not accounted for. The R package Boral was used to implement the model in a Bayesian framework [54]. The full model equations and diagnostics for model result and validation are presented in Supplementary Materials.

3. Results

Over three hectares of coral reef were photographed and analysed across 32 km of Karimunjawa National Park, before and after the 2016 bleaching event (32,171 m2 of detailed benthic data: 16,244 photo quadrats in 2014 and 15,947 in 2018).

3.1. Spatial Variability in Benthic Composition

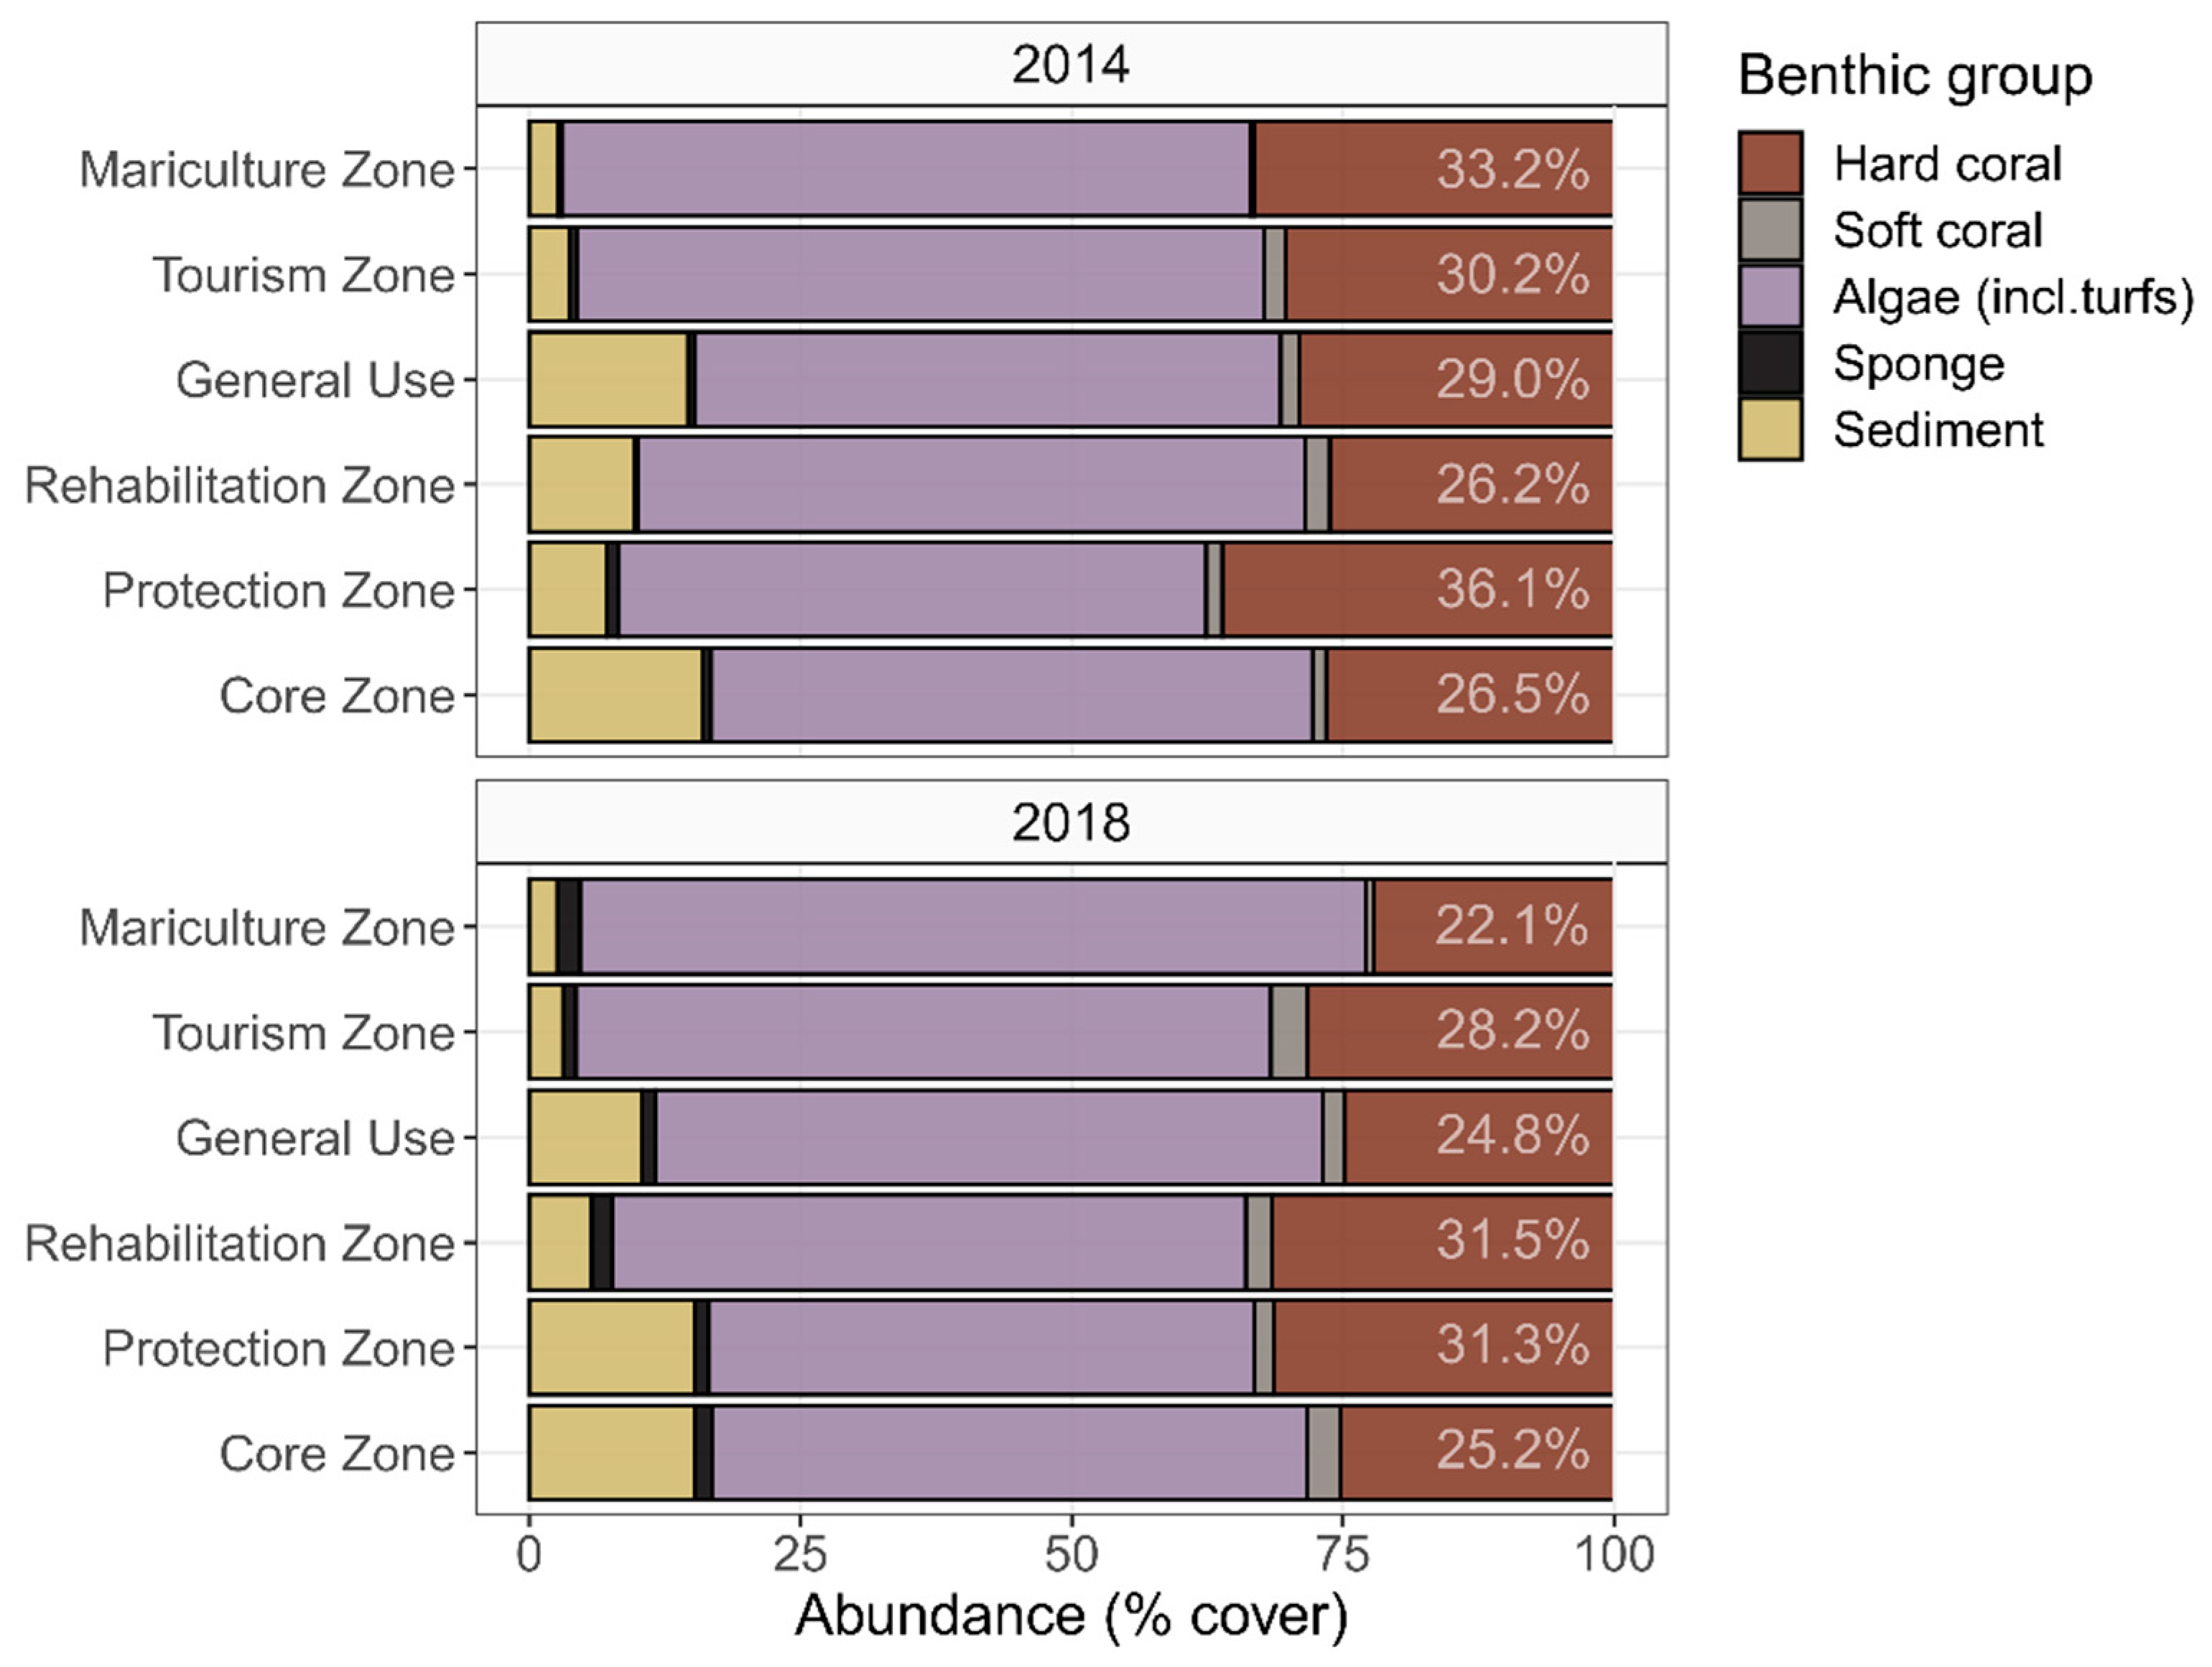
Hard coral percent cover across the 18 reef sites surveyed appeared uniform at 29.6% ± 0.06% (Standard Deviation, SD) in 2014, ranging from 20.7% at Ujung Bomang to 45.4% at Karang Kapal (Figure 1). Coral communities were typically dominated by foliose and massive coral species, which made up ~60% of the coral community at most sites (Appendix A, Figure A1). Algae was the dominant benthic group at every site surveyed, accounting for at least half of the benthos in every area (57.7 ± 0.09% across the park in 2014; 59.9 ± 0.09% in 2018, Figure 1 and Figure 2). Algae was predominantly comprised of “epilithic algal matrix’: rocky substrate covered in turf algae or biofilm (‘EAM’ category in the database, for full definitions see Table A2), which was responsible for 95–99% of the Algae category at every site. Macroalgae (‘MACRO’, 0.91 ± 0.10%) comprised less than 1% of the benthic cover. The most common macroalga seen was Padina spp, and Halimeda was also responsible for a large proportion of macroalgae, along with Caulerpa, Dictyota and cyanobacterial mats. Crustose Coralline Algae (‘CCA’, 0.13 ± 0.15%), when grouped with Macroalgae made up just over 1% of the Algae total cover. The remainder of the cover at most sites was typically loose sandy substrate (Sediment), which made up about 10% of the benthos (10.4 ± 0.08%). Both Soft coral and Sponges remained low abundance across the Park with less than 3% cover (Figure 2). There were no obvious differences in benthic group abundance across Zone, based on percent cover (Figure 2).
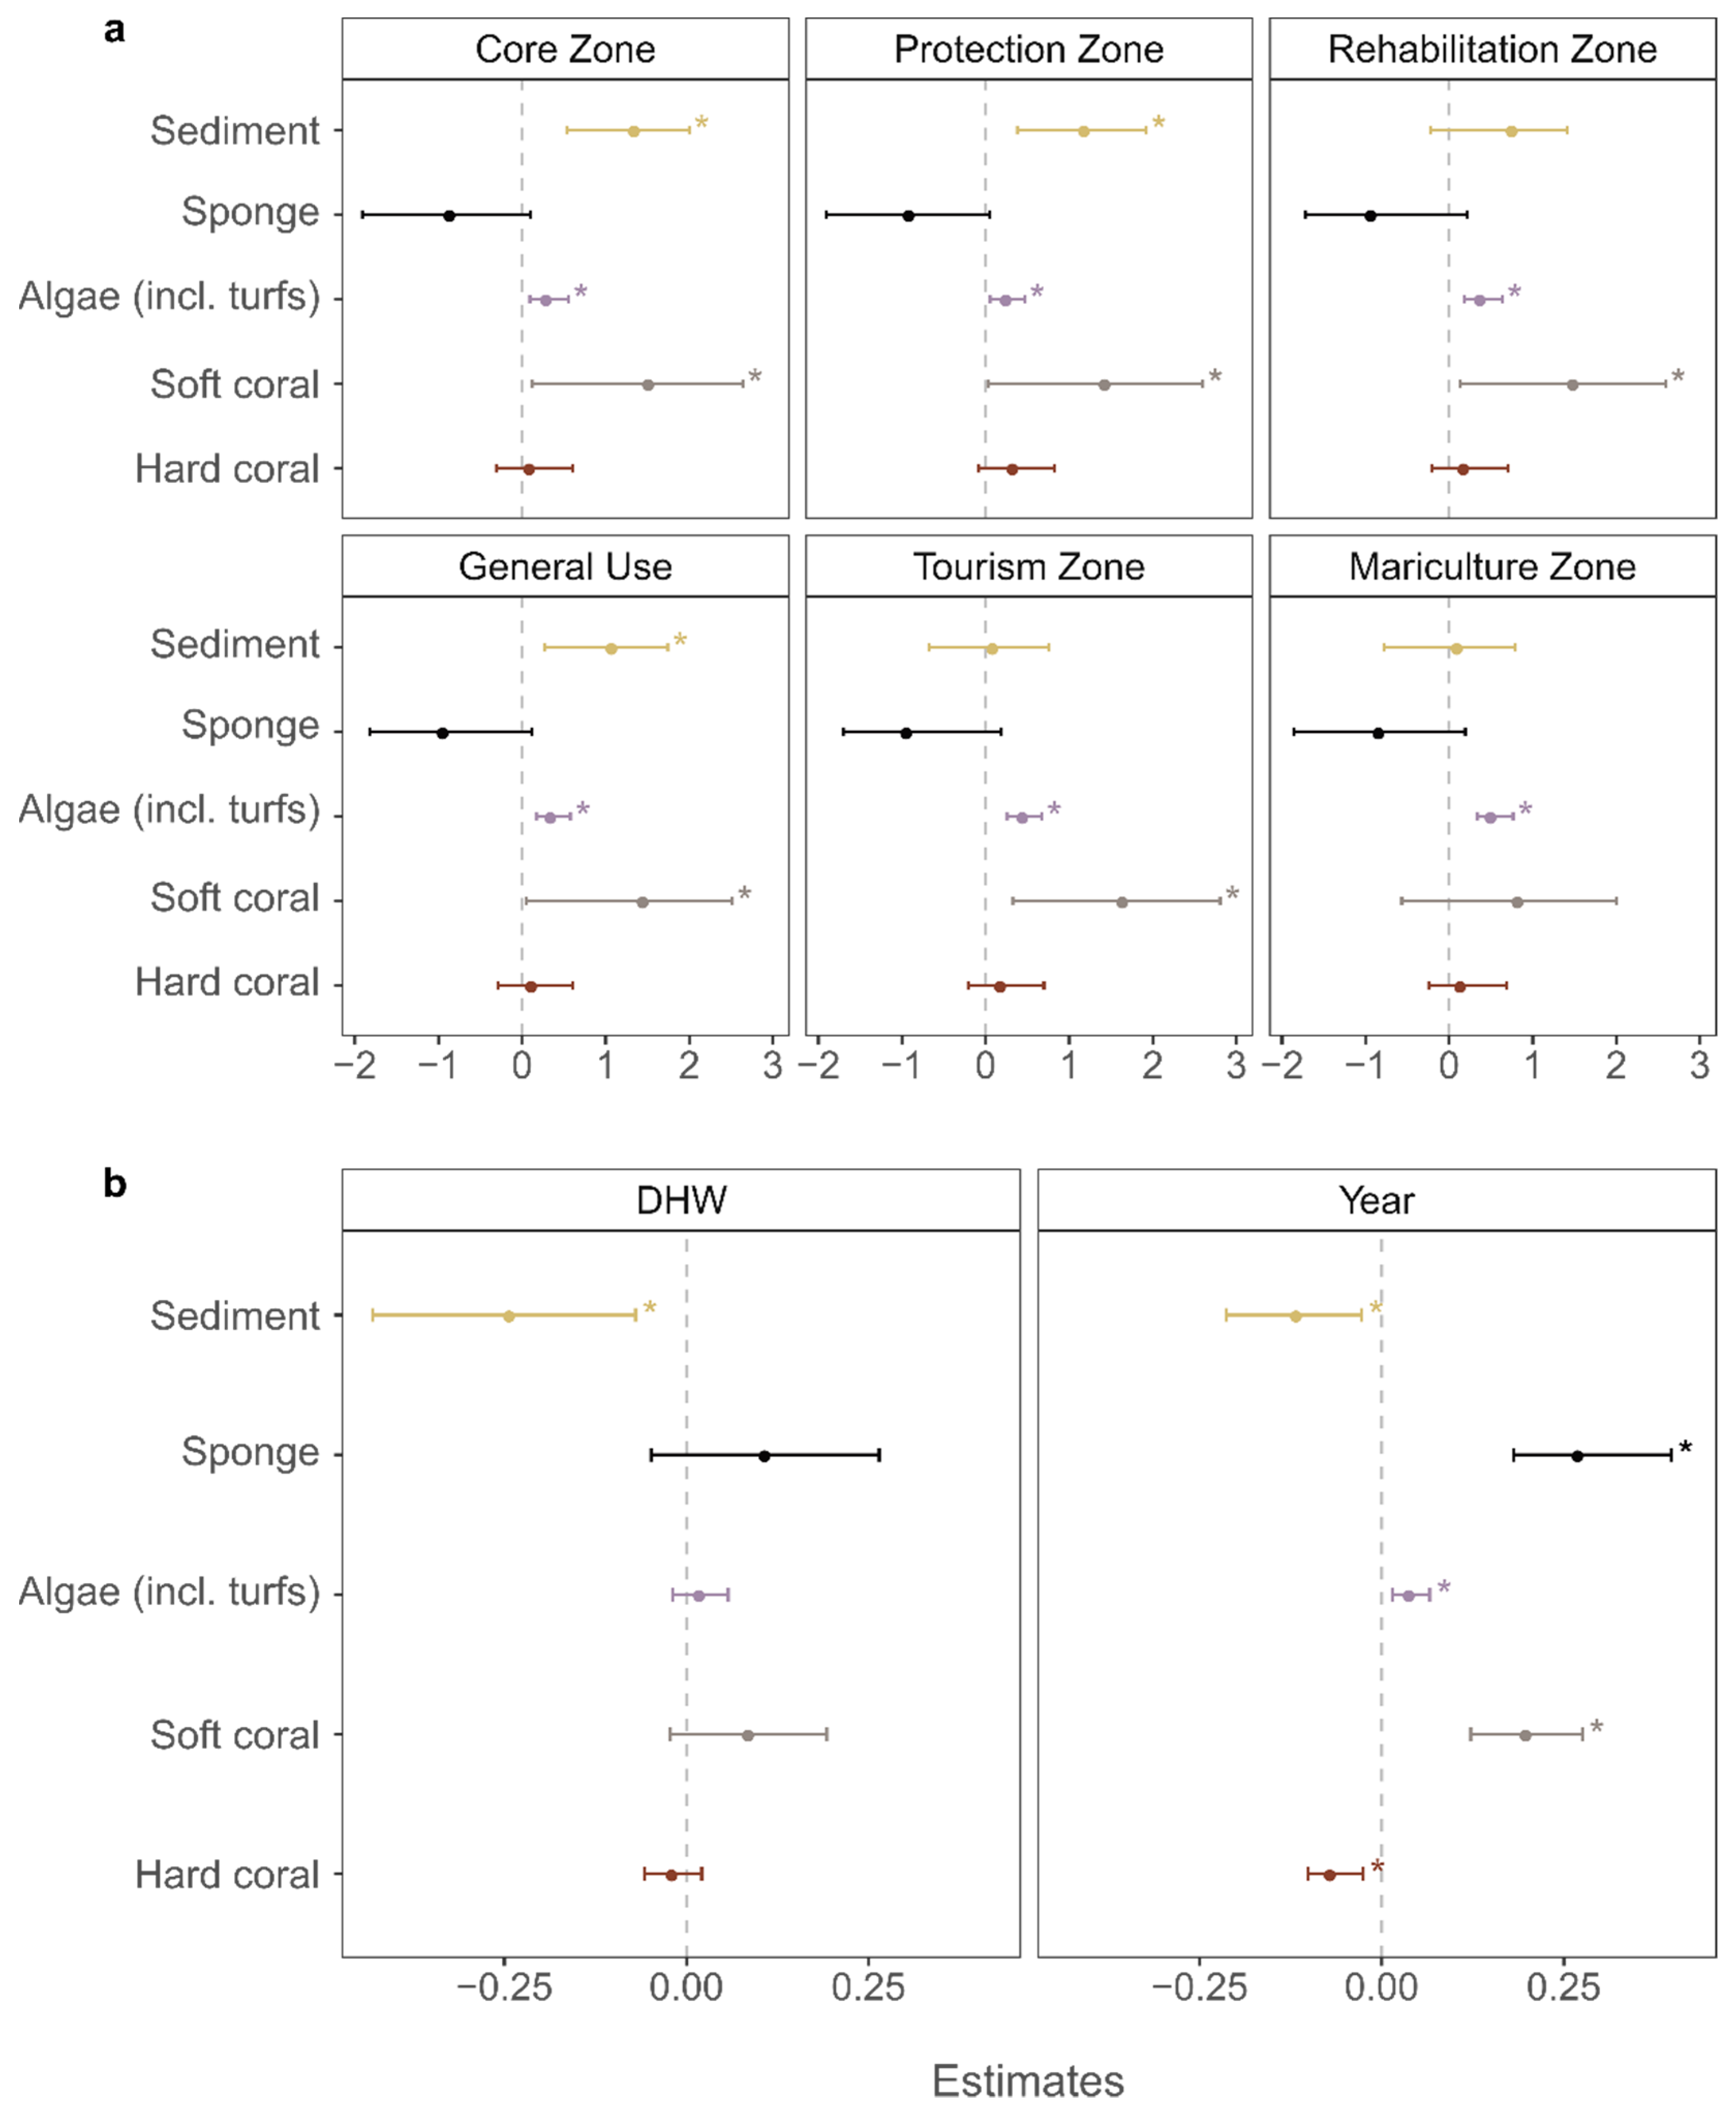
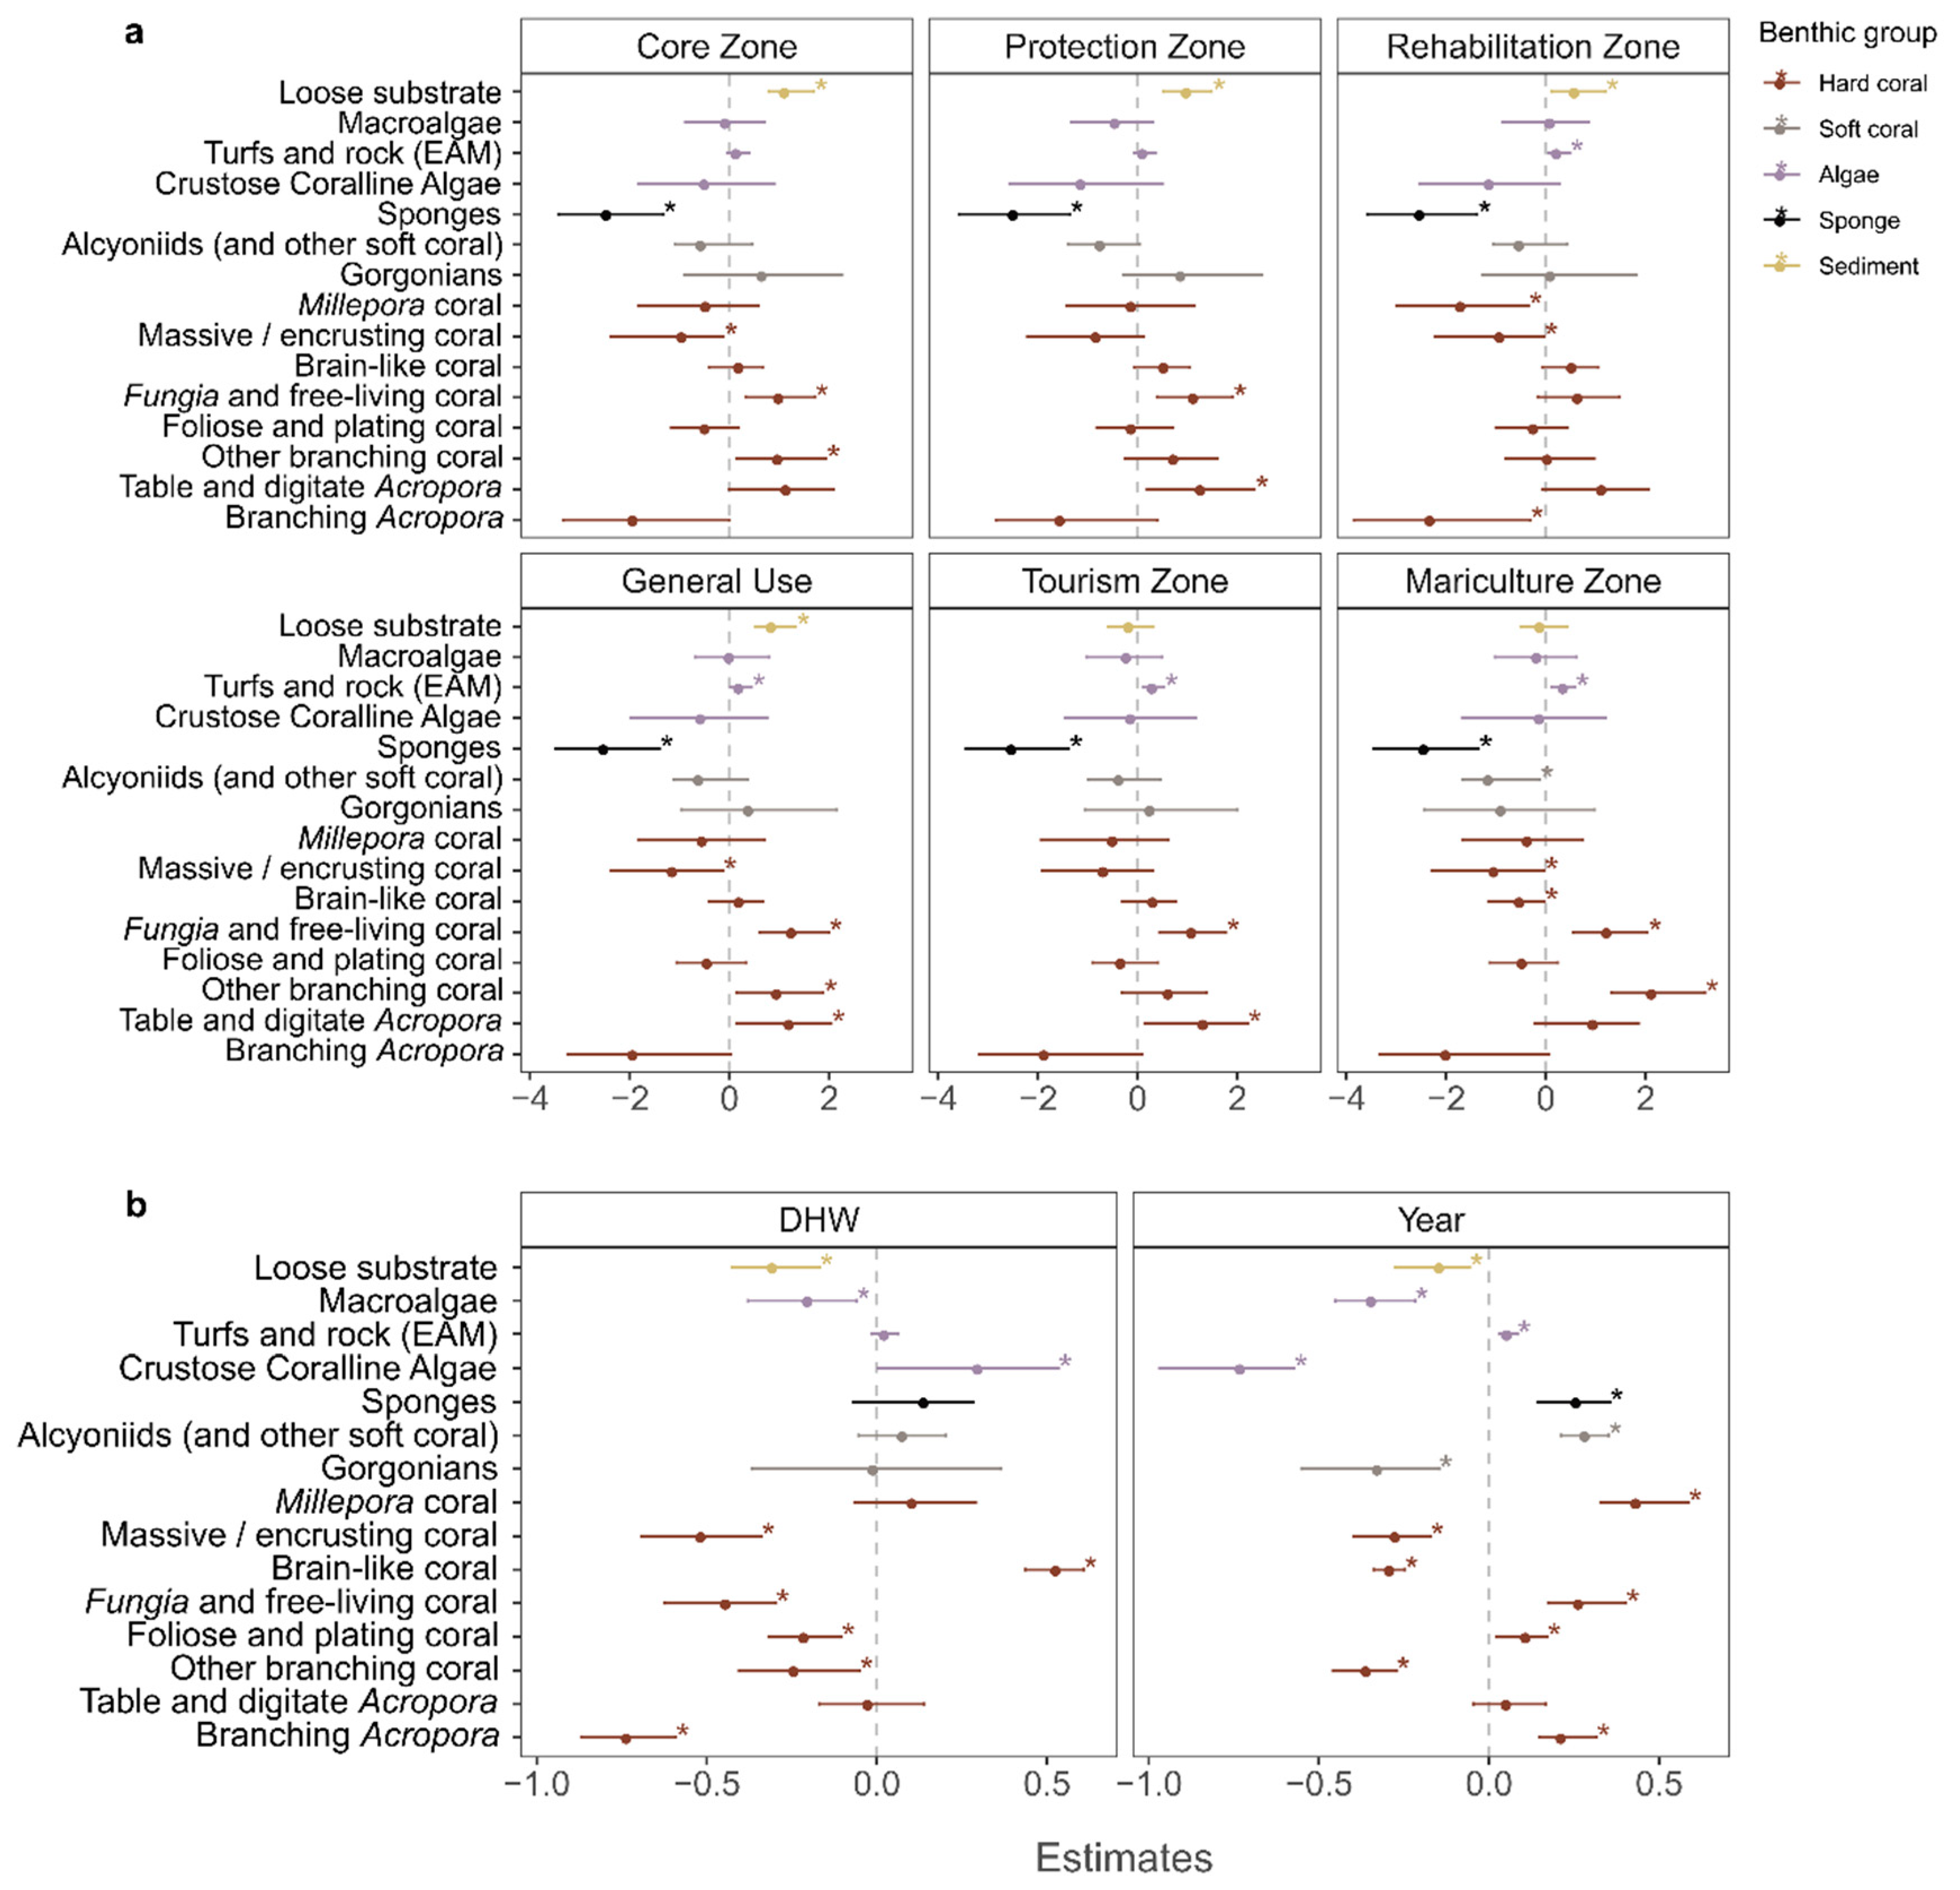
Initial inspection of percent cover data suggest little observable difference in benthic community composition between management zones across the park (Figure 1), in either year (Figure 2, see also Figure A1). The statistical model confirmed this (Figure 3a). There was little detectable difference between zones, with Soft coral, Sponge and Hard coral all systematically present in all six management zones. Model uncertainty (width of the 95% credible intervals) was higher for some benthic groups especially for Soft coral and Sponge and lower for Algae, but was considerably higher than for other factors tested (i.e., Year and DHW: note difference between Figure 3 panel a and b x-axis). Uncertainty usually occurs either where the absolute abundance was low (e.g., in the case of Sponges), or where values were similar across different treatments (e.g., Hard Coral). This further confirms that management Zones were not particularly good at explaining variability (Figure 3b).

3.2. Temporal Variability in Benthic Composition

Hard coral abundance appeared fairly stable across Karimunjawa National Park between 2014 and 2018, with mean percent cover declining slightly from 29.2 ± 012% (SD) in 2014 to 26.3 ± 0.10% (SD) in 2018 (Figure 2). Algae also appeared relatively constant through time (57.7 ± 0.14% in 2014, 60.5 ± 0.14% in 2018). Initial inspection of percent cover of Sediment (10.8 ± 0.15% to 9.3 ± 0.12%), Soft Coral and Sponge also suggested these groups appeared stable between the surveys (Figure 2, Table A2).
The joint modelling approach allowed us to explore statistical variability at the park scale, based on fine scale comparisons of 2014 and 2018 data. Model outputs revealed that the observed 2.9% relative decline in Hard coral actually represented a significant (i.e., 95% credible intervals did not include zero) shift in benthos by −6.8% (−10.1%; −2.5%, 95% CI), (Figure 3b, Year). Sponges showed the most dramatic change, with an 27.2% increase between 2014 and 2018 (18.1%; 39.7%, 95% CI). Soft coral increased by 20.0% [12.2%; 27.5%, 95% CI] and Algae to a lesser extent by 4.0% [1.4%; 6.6%, 95% CI]. There were also significant decreases in Sediment 11.5% [2.7%; 21.4%, 95% CI] generally across the park (Figure 3b, Year). In summary despite initial apparent temporal stability, all benthic components measured saw significant park-wide shifts in abundance between 2014 and 2018 (Figure 3b, Year).

3.3. Global Pressures: Effect of Ocean Warming

Thermal stress between 2014 and 2018 was used as a proxy to explore impacts of the global coral bleaching event on Karimunjawa’s coral reef benthic communities. Sea surface temperatures recorded in the area between 2014 and 2018 were between 27.05 and 31.10 °C, with average of 29.22 ± 0.71 °C (NOAA). Although the park experienced several warmer than usual periods, only one event occurred where DHW was high enough to trigger mass bleaching. Kembar Island and Telaga Village sites experienced greatest DHW, while the southern half of the park, including Central Karimunjawa Park Islands (Karang Kapal, Krakal Kecil and Krakal Besar) and southern sites on Karimunjawa Island (Menjangan Kecil MDC, Menjangan Besar MDC, Karimunjawa Town and to a lesser extent Ujung Bomang) received lower DHW scores (<2 DHW). Model outputs revealed that DHW alone were unable to explain the minor park-wide declines in Hard coral: while the model related DHW to slight Hard coral declines (detecting a 1.7% decrease between 2014 and 2018), the associated 95% credible intervals include zero indicating no significant effect [−5.7; 2.1%], Figure 3b, DHW). The 2016 bleaching stress could not explain increases in Sponge, Algae or Soft Coral either (Figure 3b, DHW).
Inspection of model outputs at the sub-level revealed that within Hard Coral only two of the seven coral sub-groups were not negatively affected by bleaching (Figure 4b, DHW). Branching Acropora species (‘ACR_BRA’ in the database, see Table A2) were the most negatively impacted (−0.73 [−0.86; −0.59, 95% CI]), followed by brain-like massive, submassive and encrusting species (‘MSEM’, −0.51 [−0.69; −0.34, 95% CI]), and free-living mushroom corals (‘FREE’, −0.44 [−0.62; −0.29, 95% CI]). Other branching non-Acroporid species (‘BRA_nACR’, −0.24 [−0.40; −0.05, 95% CI]), and the most abundant group, foliose corals (‘FLP’, −0.21 [−0.32; −0.10, 95% CI]) were all negatively impacted. Millepora (‘NON_HERM’) and tabulate Acroporid corals (‘ACR_TCD’) were not significantly affected. DHW were also associated with positive and significant effects on massive corals (MSE, mainly massive Porites (0.53 [0.44; 0.61, 95% CI]) and crustose coralline algae (0.30 [0.002; 0.53, 95% CI]), (Figure 3b, DHW).

3.4. Local Stressors: Effect of Management Zone

Management zones were used as a proxy to examine the impacts of local pressures on Karimunjawa’s coral reefs. The Rehabilitation zone was the only zone to see an increase in Hard coral cover between 2014 and 2018, with a 20.2% relative increase in coral from 26.2 ± 0.06% (SD) to 31.5 ± 0.07% (SD) %. All other zones mirrored the general pattern of slight decline, with Mariculture zones seeing the greatest declines −33.3% in Hard Coral. The greatest detectable changes occurred for the group of Sponges in the Rehabilitation and Mariculture zones with relative increase of 551.5% and 471.6%, respectively (Figure 2). Soft coral and Sponges also increased in the Core Zone between 2014 and 2018 by 146.3% and 101.4%, respectively. In the Protection Zone, the Sediment group increased the most, estimated to be 112.6%. The highest relative decreases are for unconsolidated substrates in the Rehabilitation and General Use zone (40.1% and 34.1%, respectively) and Hard coral in the Mariculture Zone (33.2%).
Although Hard coral appeared to decline slightly across zones and between years, closer examination of sub-benthic groups revealed increases in some coral taxa (Figure 4, Year). Branching Acroporids (‘ACR_BRA’) and foliose corals (‘FLP’) substantially increased in abundance by 21.6% [14.7%; 31.6%, 95% CI] and 11.1% [2.1%; 17.2%, 95% CI], respectively. Free-living mushroom corals (‘FREE’) and Millepora (‘NON_HERM’) also increased by 26.7% [17.3%; 40.3%, 95% CI] and 43.6% [32.8%; 58.7%, 95% CI]. Meanwhile, massive corals (MSE and MSEM, defined in Table A2) had declined by around 30%, along with branching non-acroporids (−35.7% [−45.9%; −27.2%, 95% CI]. All sub-groups of corals had significantly altered in abundance (with the exception of tabulate Acropora ACR_TCD, which had increased but not significantly): these large increases in branching and foliose and declines in massive species masked changes in total percent cover of Hard coral (Figure 4, Year).

3.5. Community Co-Occurrence Patterns

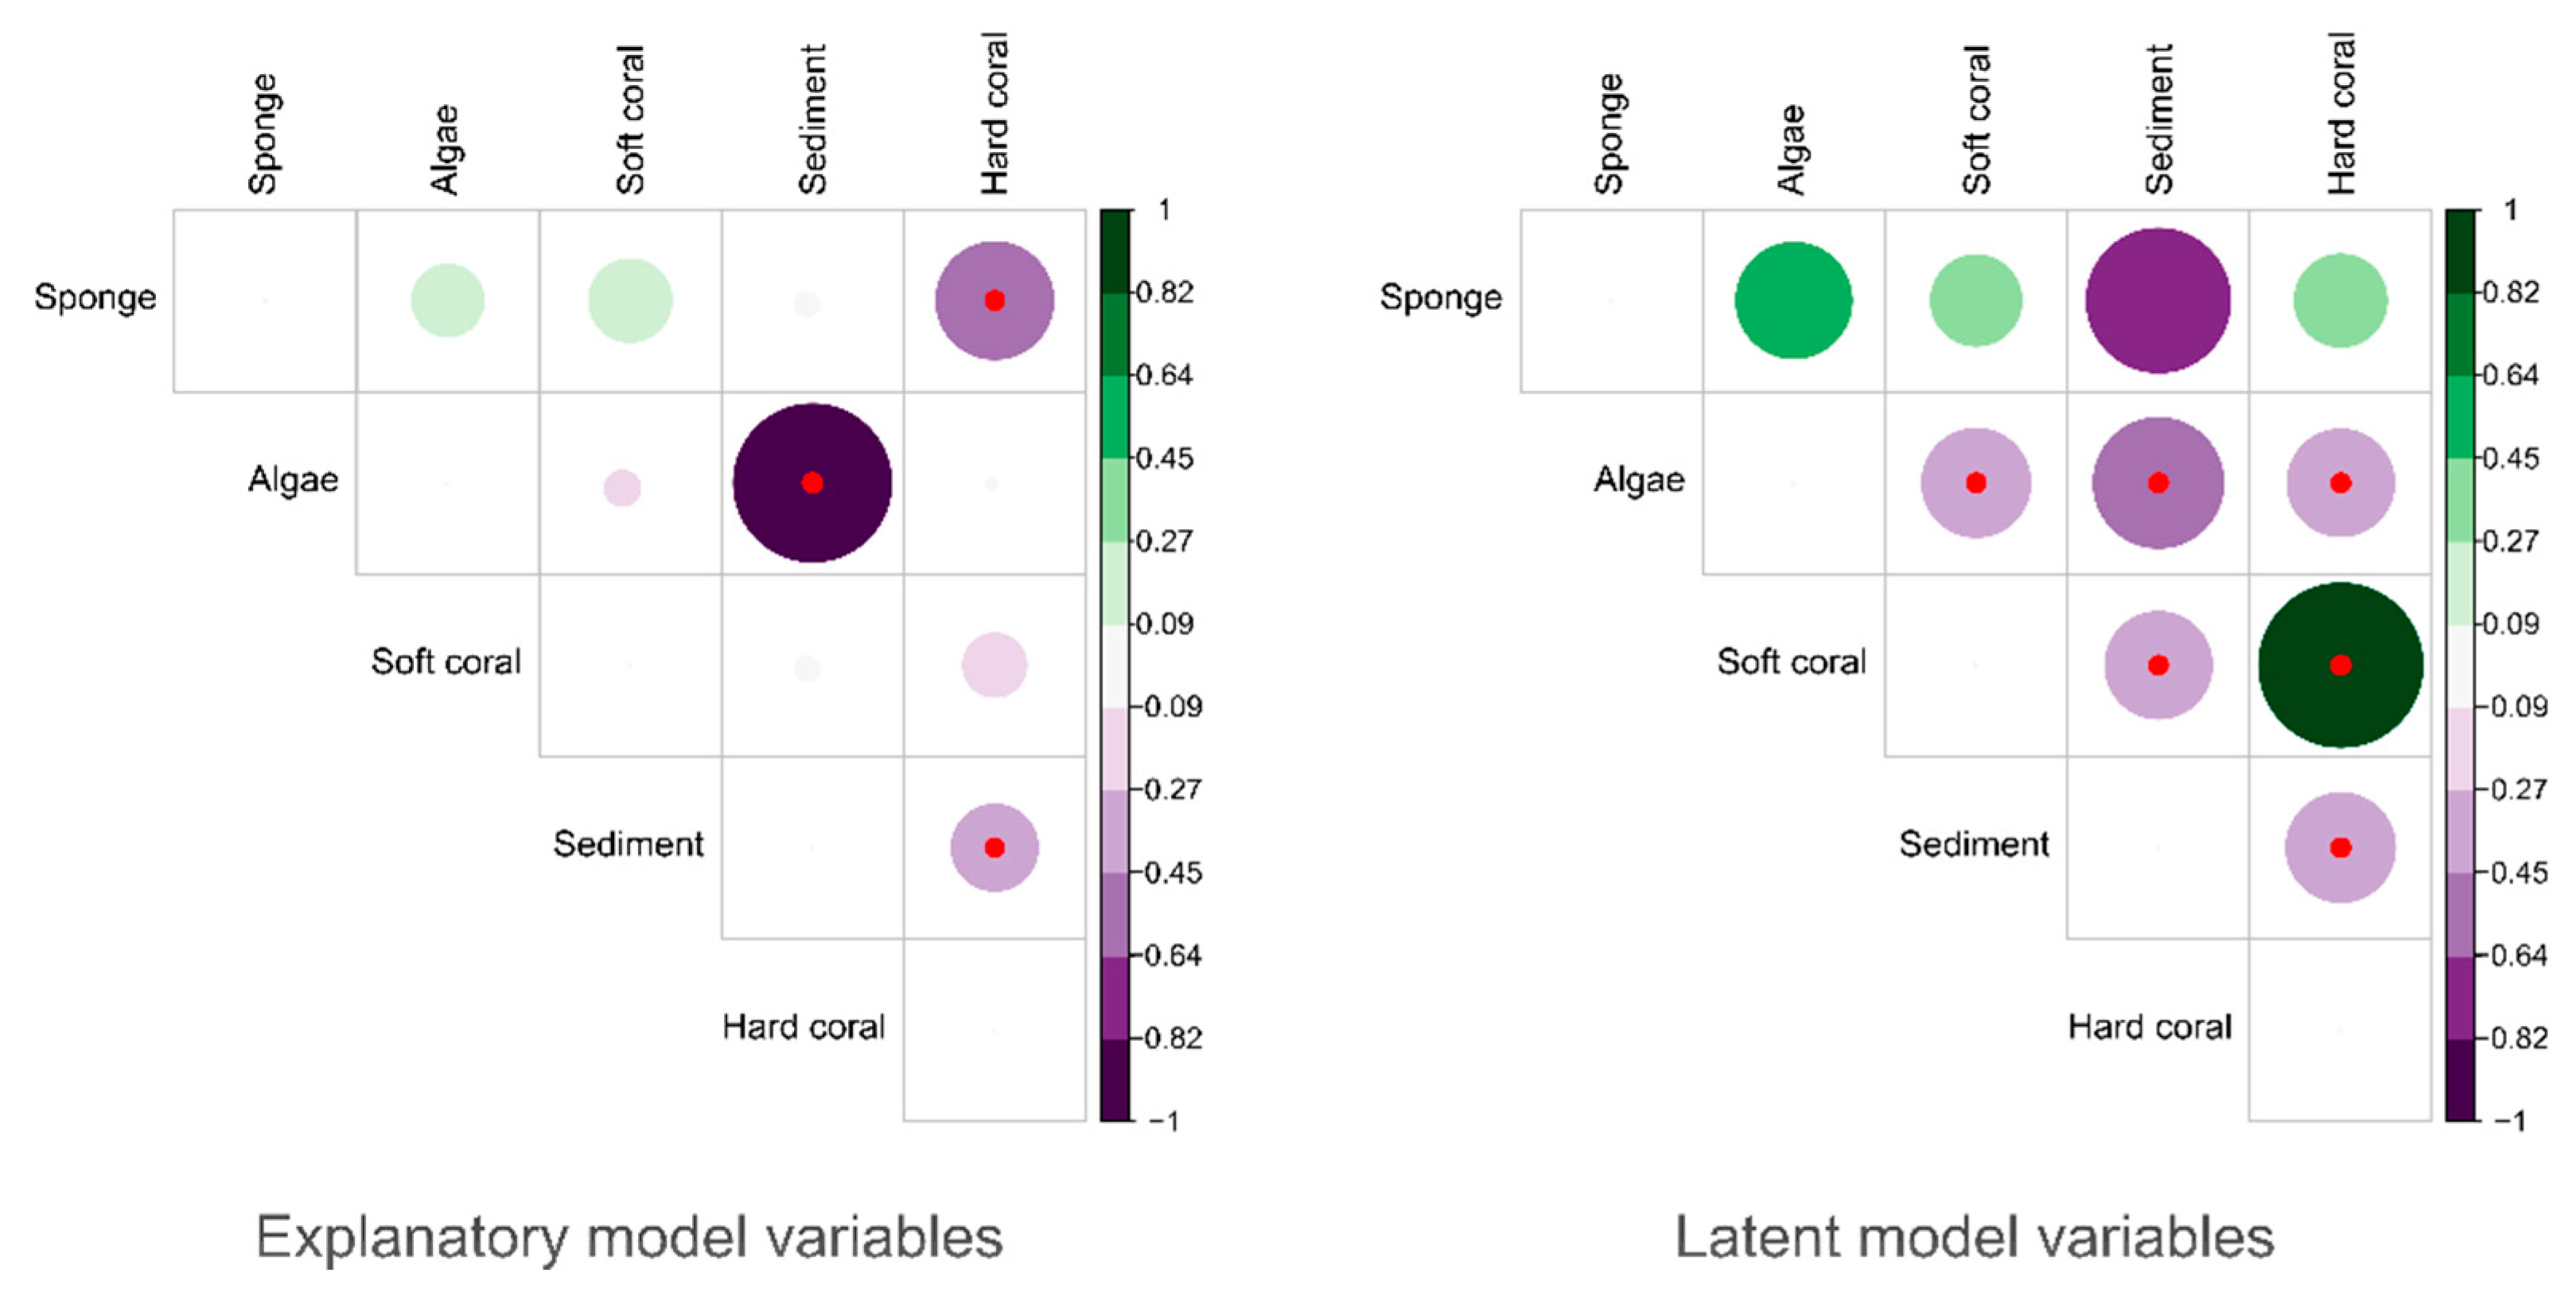
Significant interactions were estimated within the two distinct parts of the multivariate model (Figure 5): both the explanatory part of the model including the effects of Zone, DHW and Year (Figure 5, left panel), and the latent variables that could not be explained by the predictors (Figure 5, right panel). Co-occurrence patterns identified included strong negative interactions between Hard coral and Sponges, and Algae-Sediment estimated at −0.51 and −0.92, respectively. A negative co-occurrence was also found for Hard coral-Sediment estimated at −0.44. These Sediment interactions were also captured and strengthened in the co-occurrence patterns associated to the missing information part of the model (Figure 5, right panel). Additional negative interactions are estimated including Sediment-Soft coral (−0.42). Algae were also negatively associated with Soft coral and Hard coral in the latent model (−0.43 and −0.42, respectively). Soft coral and Hard coral were strongly positively associated (0.99).

4. Discussion

A combination of camera-scooter survey technology and automated image classification enabled collection of larger amounts of consistent fine-detail benthic cover data across Karimunjawa’s coral reefs than previously possible, while Bayesian statistical approaches allowed the large multivariate dataset generated to be explored in detail at the regional scale. Results highlighted changes in benthic community composition across the park between 2014 and 2018, including a slight decline in Hard coral that masked much larger shifts in coral community from massive to more complex and fragile foliose and branching corals, and a significant increase in sponges and soft corals, all of which occurred across the park. At first glance, most of these patterns appeared to be ubiquitous and unrelated to management zone, but negative correlation identified between Sponge and Hard coral suggest that Zones (the explanatory variable) with more sponges had much fewer corals, and vice-versa (Figure 5). Total Hard coral cover remained relatively high, and the 3% loss observed did not appear to be related to the 2016 bleaching event (Figure 3b, DHW), although minor but detectable effects were observed on most coral groups tested, but particularly branching Acropora (Figure 4b, DHW).

4.1. Spatial Variability: Status of Karimunjawa’s Coral Reef Benthic Composition across the Park

Surveys indicated that Karimunjawa’s benthic reef communities were compositionally similar across the Park (in both years), with little variability in the relative ratios of Hard coral (around ~30%) to Algae (~60%) and Sediment (~10%) and remaining Sponge and Soft coral (Figure 2). This level of coral cover is generally high compared to reported regional means of <25% cover [6]. Apparent homogeneity across reefs may be due to underlying biogeography: the park covers a relatively small area, and early ecological surveys of the park suggested reef communities were less variable than in other places across South East Asia [21].
Coral communities were dominated by massive Porites (‘MSE’, typically 44.0 ± 15.1% (SD) of the Hard coral abundance), and foliose and plate coral types (FLP typically 27.4 ± 10.1%) (Appendix A, Figure A1), with most coral types not varying spatially within or between zones (Figure 4a). Interestingly, the model detected that branching Acroporids (‘ACR_BRA’, including branching and bottle brush Acropora spp.), typically a more minor part of the community in 2014 (5.2% of coral abundance), were more widespread and consistently pervasive, while the dominant massive Porites (‘MSEM’) showed more spatial variability—or more patchily distributed (Figure 4a).
Different survey methodologies may explain why our finding of ~27% Hard coral cover in 2014 was lower than observations of ~38–60% reported in 2009 [55] and 62% (range 34–97%) reported in 2015 [56]. Traditional 50 m survey line intercepts often target locations dominated by corals, while the 750 m+ transects conducted as part of this study would have transited more diverse habitats, including sand filled gullies and rubble patches avoided by standard 50 m transects [57]. This also explains negative correlations identified between Algae-Sediment, and Hard coral-Sediment that were related to zone (Figure 5): some transects transited more areas of sand, where Algae and Hard coral which need hard substrate to attach to, cannot grow. Despite reported differences in the absolute values for percent cover Hard coral, our 2014 data agreed with the trends and conclusions of both reports. The 2015 Balai Tamen dataset was consistent in showing that Protection Zones had slightly higher Hard coral cover (70%) compared to Core Zone (62%) and General Use (50%) zone, although this difference in our data did not appear to be maintained through to 2018 as Protection Zones eventually lost coral cover (Figure 2, Figure A1). Meanwhile, the 2009 dataset also agreed with general maintenance of Hard coral across all zones and Algae cover co-varying with Hard coral reported from 2005–2009 [55]. Our percent coral cover values were in line with broader regional assessments [6].

Testing Spatial Variability: Effect of Management Zone

There was no significant spatial difference in benthic community composition between management zones, and no major difference between General Use zones and other, more regulated zones (Figure 4a and Figure 5a): a finding that echoes the work of several other studies that set out to examine efficacy of zoning in Karimunjawa. For example, benthic assemblages monitored between 2005 and 2009 [55] and again in 2006 and 2013 [23], did not show any relation to management zone. Previously, this finding has been attributed to a lack of local compliance with zoning, meaning no strong difference in pressures between zones [55,58]. Studies that examined fish biomass similarly found little effect of zoning between 2004 and 2007 (herbivorous fish continued to decline, although Core Zones had a positive effect on general biomass, and Protection Zones were shown to be less effective) [25] and again in 2006–2013 (herbivorous fish increased in all zones) [23]. Some studies suggested a slight positive impact of the Core Zones [24,59], which are longer established and have better compliance, but much of these conclusions were around fish diversity and biomass. Core Zone did not appear to influence benthic community composition in this study. The only indication that zone was having a significant effect spatially was the negative correlation between Hard coral-Sponge detected in the known part of the multivariate model. This finding suggests that management Zone may somehow be influencing benthic community composition by driving Hard corals down where Sponges are increasing (or vice versa). Additional surveys would be needed to confirm this signal.

4.2. Temporal Variation: Trends in Karimunjawa’s Coral Reef Benthic Composition between 2014 and 2018

Karimunjawa’s Hard coral and Algae abundances were fairly stable between 2014 and 2018, with Hard coral cover declining slightly but significantly across the park (2014: 29.6 ± 0.06%, 2018: 26.7 ± 0.04% (SD)). Rehabilitation zone was the only zone that saw 20.3% relative increase, rather than a drop, in Hard coral (Figure 2). This zone had the lowest mean coral cover in 2014 (26.2 ± 0.06% SD) of any zone, and the highest mean cover of any zone by 2018 (31.5 ± 0.07%SD), suggesting that management may have been having a desired effect in these areas that were targeted for protection because of historic damage. Mariculture zones saw the greatest Hard coral relative losses of 33.3%, followed by General Use Zones 14.5% relative decrease in Hard coral (Figure 2). Other studies have also reported stable [23] or slightly negative [24,37] trends in coral cover in Karimunjawa (although various studies have also shown slight increases in coral cover across the park since cessation of unsustainable fishing practices [55]).
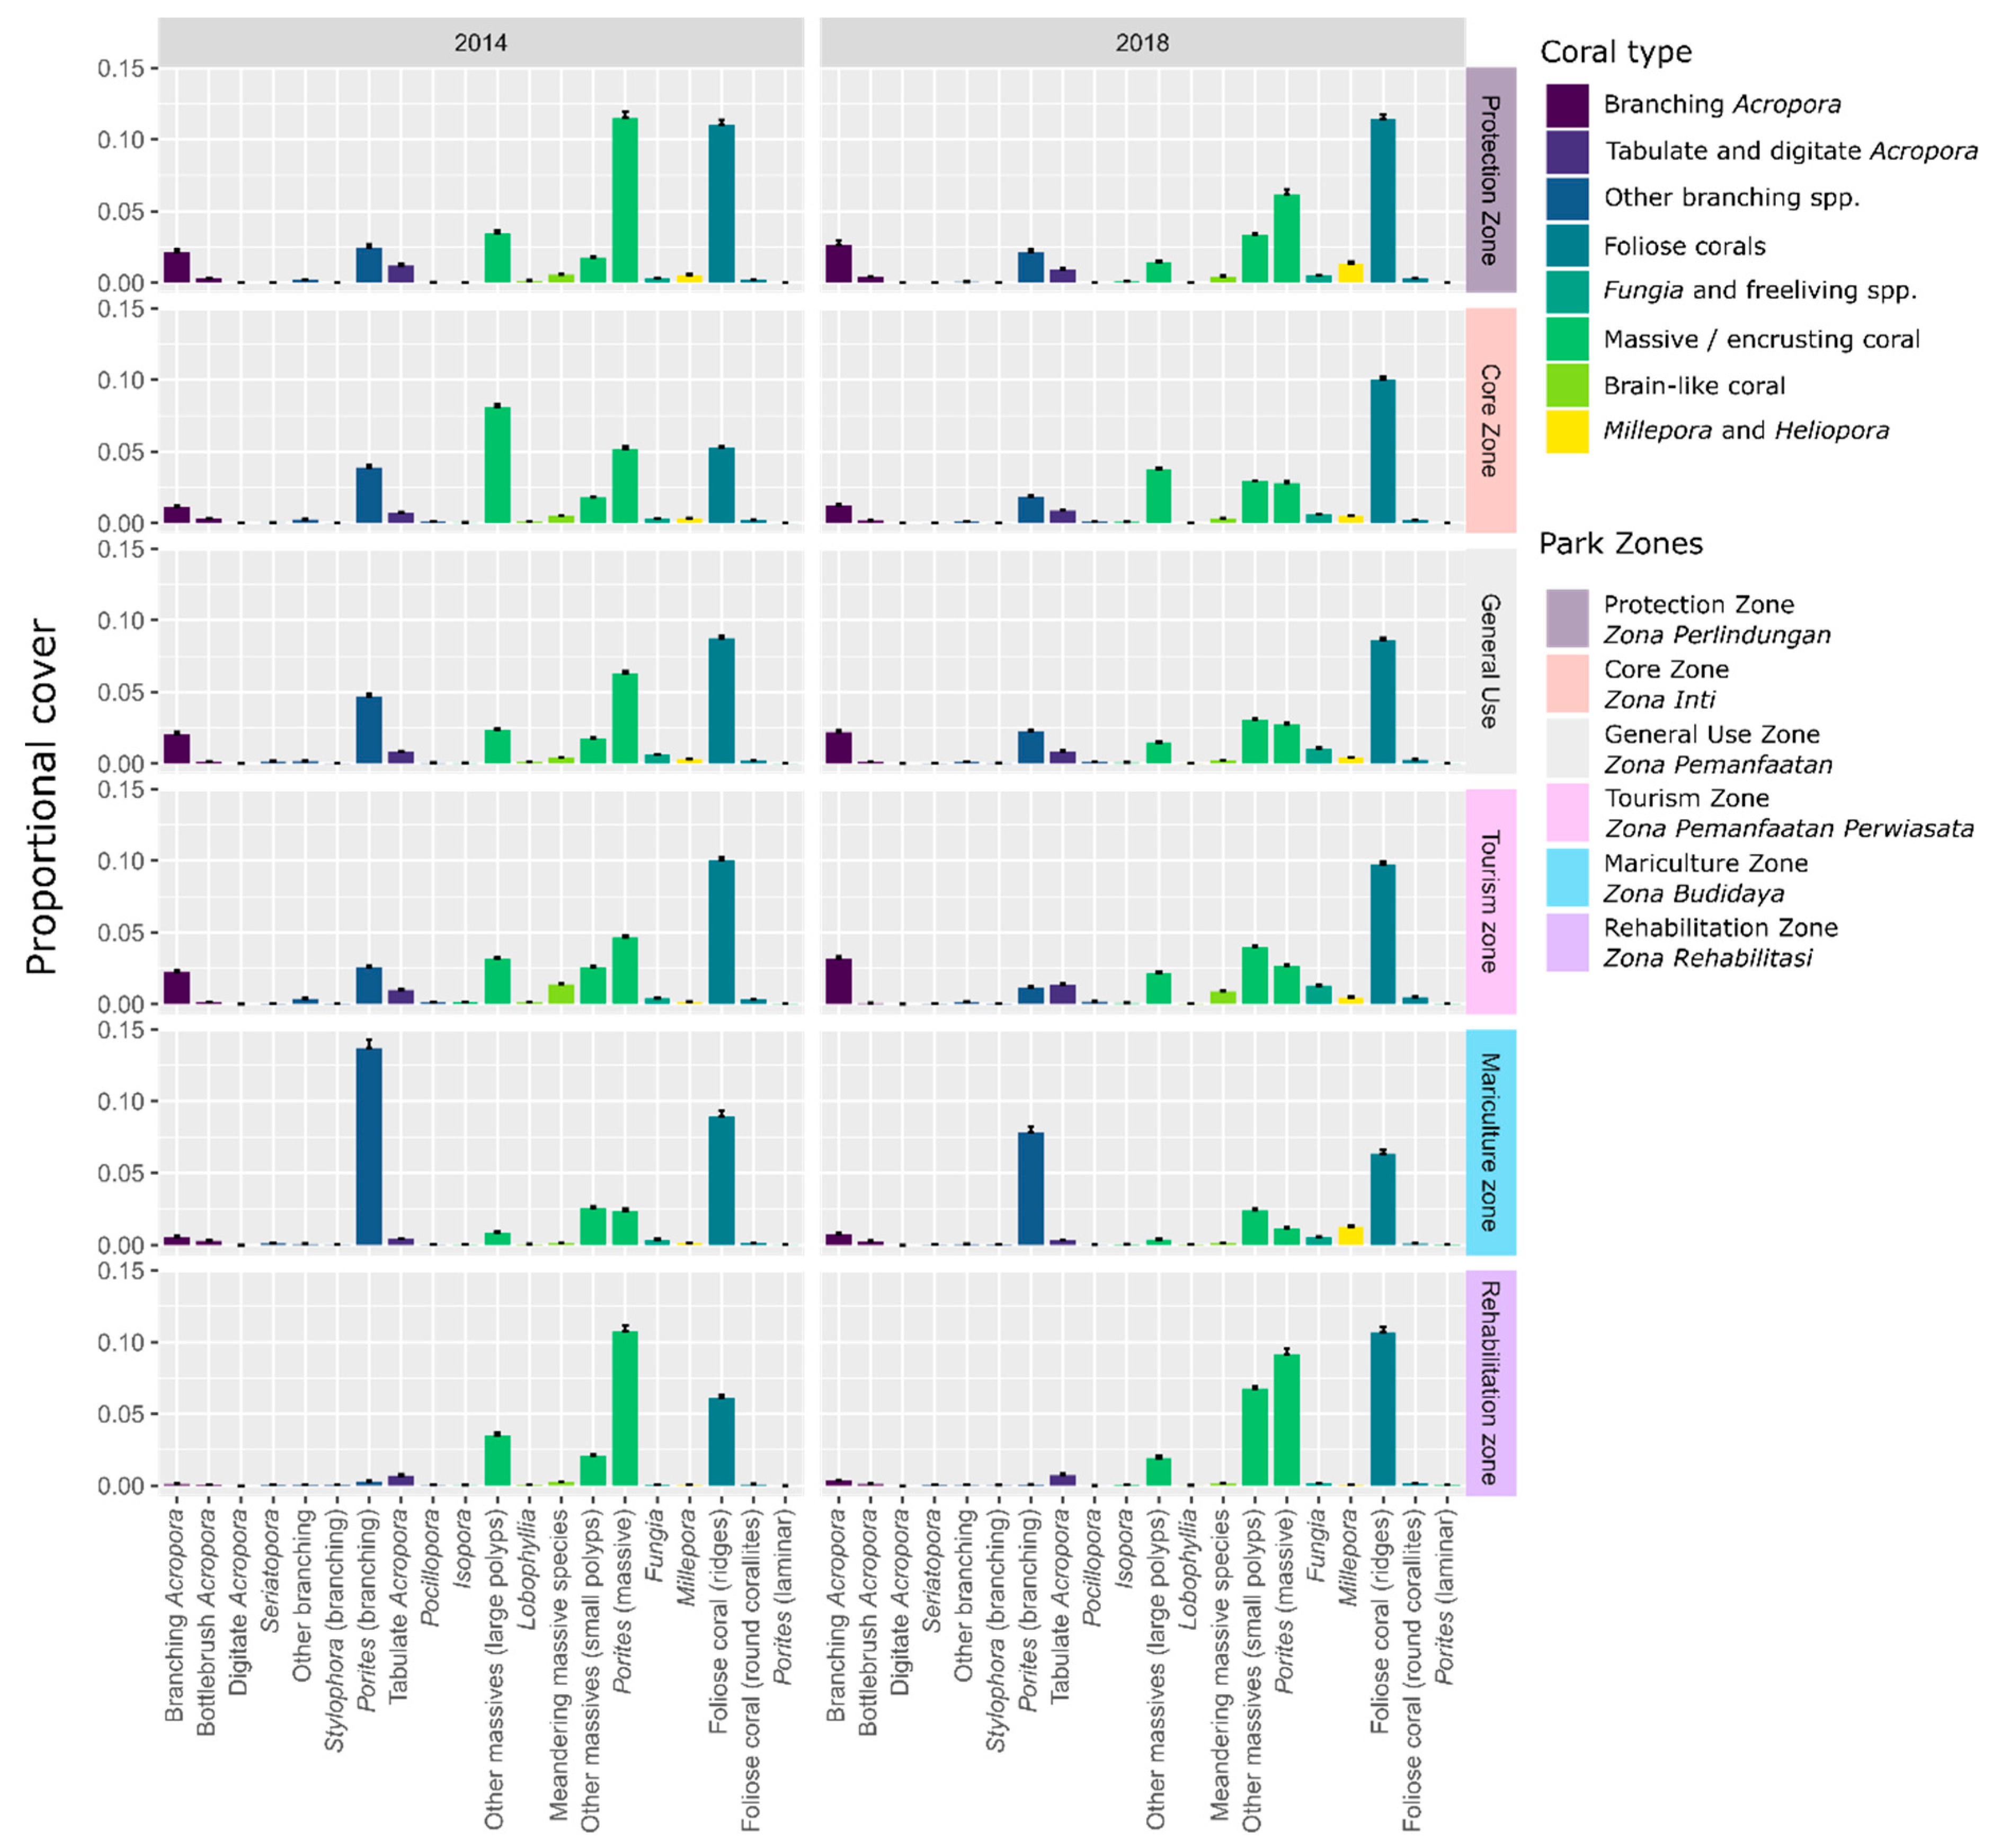
Further examination of benthic sub-groups revealed that apparent small but significant declines in Hard coral were masking much larger shifts in benthic community assemblage between 2014 and 2018 (Figure A2). Acropora corals (both branching Acropora ACR_BRA, increased by 21.6%, and tabulate and plate Acropora ACR_TCD species up 5.5%) and foliose corals (FLP) also increased by 11%, with the model detecting a significant shift in abundance between 2014 and 2018 in ACR_BRA and FLP (Figure 4: Year). For example, branching Acropora typically made up 5.2 ± 0.37% of the community in 2014, and 8.4 ± 0.65% in 2018, and plate Acropora was 13% of the community in 2018 (previously 2%). At the same time, massive corals (MSE and MSEM) saw significant declines in abundance (Figure 4: Year). In 2018, massive and encrusting species typically made up 20% of the coral cover, compared to 40% in 2014. This strong shift in community composition from massive to more complex foliose, branching and tabulate is in agreement with reported increases in percent cover of complex corals (branching, digitate, tabulate and foliose corals) regardless of management regime [23,55].
Return of more fragile corals may be a response to cessation of destructive fishing, particularly the use of muro-ami nets that peaked 2003–2005 and a move towards handlines, bubu and spears instead [55]. Muro-ami practices would be damaging to corals, particularly fragile branching species, and had largely ceased by November 2011: unlike compliance with zones, gear restrictions were adhered to across Karimunjawa [55]. Other indicators of reef health, such as herbivorous fish abundance were also found to have responded positively to fishing controls [23], and may have played a role. A lag in recruitment and growth would have meant smallish Acropora and other branching species would perhaps be 6–8 years old by the time of the 2018 survey, and linear expansion of colony branches could drive greater percent cover values detected.
Another observation was a large and significant increase in fast growing non-scleractinian hard corals—specifically Millepora—between years: this occurred particularly in the north-west sector of the park (85.3% relative increases across the park, but particularly at Kembar, Parang and Kumbang Islands, Figure A1), sites where illegal fishing was still occurring in 2014 and blast fishing damage was still observable in 2014 surveys. The increase in these fast weedy growing species might indicate successional recovery of these damaged sites.
Only one group of complex corals—the branching non-Acroporid corals (BRA_nACR)—conversely saw a decline during the study (−35.7% decline). This was also the only non-massive coral sub-group that saw a decline (Figure 4: Year). Massive (MSEM) and branching (BRA_nACR) coral declines were also mirrored in the analysis of the effect of DHW (Figure 4: DHW). This finding is a likely result of reported susceptibility of many of the members of these subgroups (e.g., Pocillopora, branching Porites and Stylophora) to bleaching, and the high mortality reported at the time in these species [37].

4.3. Impact of Global Climate Change

Karimunjawa’s coral reefs are at higher risk of ocean warming due to their location, and were affected by bleaching in 1998, 2000, 2010 and 2016 [7]. This, along with other factors, has led to Karimunjawa being identified as a priority area for conservation [13]. Satellite data suggested that thermal anomalies were greater in the northern part of the park compared to the southern, although the range of recorded maximum DHW values in 2016 was relatively narrow (1.46–2.73). Examining benthic community composition in the context of spatial trends in DHW during the 2016 heatwave, revealed Hard coral cover was not significantly impacted by the 2016 bleaching (Figure 3: DHW). However, inspection of coral sub-groups revealed all corals, with the exception of Millepora (NON_HERM) and bleaching-resistant massive Porites (MSE) were negatively impacted by DHW (Figure 4: DHW). Branching Acropora corals were the worst affected (Figure 4: DHW). This finding is in good agreement with surveys conducted in the park during April 2016, which found just 12% of surveyed corals were not visibly affected by bleaching, and reported Acropora to be the worst impacted species (99% observed corals bleached, 26% mortality). Pocillopora (10% mortality), Isopora (5.5%), Montipora (5.4%) and Stylophora (3.7%) also appeared sensitive to bleaching. Fewer than 30% of Gardinerosis and Pachyseris colonies bleached [37]. These bleaching observations are in good agreement with the changes in benthic cover seen our data two years on, which similarly detected branching Acropora (ACR_BRA) as the most impacted sub-group, but most coral groups being affected to some extent.
Forty long term monitoring sites are also maintained by Balai Taman Nasional park rangers and the Wildlife Conservation Society, who reported declines in coral cover between 2013 and 2016 that they attributed to 2015/2016 bleaching event, as well as impacts of tourism [37]. However, most of the changes detected in this study could not be explained by DHW: neither increased in Soft coral, Sponge or Algae, or declines in Hard coral could be adequately explained by DHW (Figure 3: DHW). Furthermore, long-term monitoring sites reported as bleaching badly at the time, (e.g., Menjangan Besar, Taka Malang and Pulau Menyawakan [37]) did not appear to lose significant coral cover in the long term (Menjangan Besar + 14% increase in Hard coral, from 24.5 to 27.9%; Taka Malang −12% decrease; Pulau Menyawakan +25% increase; see Appendix A, Table A1). Sites that lost around a fifth of their coral cover in this study included Parang Island (−33.3%, a heavily impacted mariculture zone), Taka Menyawaken (−24.2%, that experienced a ship grounding), Karang Kapal (−20.0%) which had the lowest DHW values, Krakal Kecil (−19.7%) and Karimunjawa Town (−18.5%), a heavily populated site vulnerable to land-based runoff.

4.4. Impact of Local Stressors

Interestingly, patterns of community change detected in our study were different compared to patterns of change driven by warming (Figure 4: Year vs. DHW), suggesting that although bleaching impacted communities, the 2016 bleaching event was not the main driver of benthic community change in Karimunjawa (seen in Figure 3: Year). For example, MSE (massive and encrusting Hard coral, mainly Porites) continued to decline across the park, but was the only coral group not negatively impacted by the bleaching. Conversely, Acropora were sensitive to bleaching and were damaged where heat stress was higher, but in spite of bleaching impacts, across the park the main trend was a doubling in abundance. Co-occurrence patterns identified other negative interactions, between Sponge and Hard coral abundance attributed to the explanatory variables.

4.4.1. Changes in Fishing Pressure

Community involvement and participation has been a focus of the park management since the early 2000s with the knowledge that this can improve outcomes [18]. The lack of detectable impact on coral communities across the park between zones does not necessarily reflect a failure of management, since park-wide regulation changes to stop destructive muro-ami is driving positive and widespread recovery of branching coral species across Karimunjawa. Branching corals can increase reef structural complexity—a feature associated with resilience and other benefits including improved habitat to support animals [60] and better coastal protection [61].
Other studies report this same management action resulted in a doubling of herbivore biomass between 2006 and 2013 [23], again irrespective of zone and in spite of scarids remaining an important target fish [33]. Herbivory is another indicator of reef resilience: changes in herbivore biomass are known to improve coral recruitment, and are also linked to declines in macroalgal abundance. Macroalgae were a benthic sub-group that also showed detectable declines in abundance during the survey period (Figure 4: Year), perhaps reflecting a secondary positive impact of managing fisheries on Karinmunjawa’s reef health.

4.4.2. Declining Water Quality?

Sponge was the group that saw the biggest consistent increase across Karimunjawa, almost doubling (1.8×) across the park (Figure 2). There are established links between water quality, reef health and sponge abundance in Indonesia [30], and benthic community changes that could not be explained by DHW, namely increases in sponge abundance and declines in massive corals, must be attributable to a driver not included in the model, possibly declining water quality. While mid-1990s studies on water quality in Karimunjawa report good water quality (e.g., low chlorophyll a, suspended particulate matter (SPM) and resuspension values) [30], growth of tourism and mariculture locally may be changing this. Recent water quality testing revealed a poor water quality across Karimunjawa, with seawater concentrations of nitrate (0.04–0.06 mg L−1) and phosphate (0.01–0.03 mg L−1) that exceeded levels permitted by the Indonesian Environment Ministry (0.008 and 0.015 mg L−1, respectively) reported at all sites tested [32]. In our study, three sites saw more than a quadrupling of Sponge abundance. Telaga Village, a Rehabilitation Zone still used for seaweed cultivation, and close to a settlement (Kemunjan Village, home to 31% of Karimunjawa’s population), experienced a 7-fold increase in sponges and also the largest associated decrease in coral. Parang Island, an intensively used Mariculture Zone and also home to Parang Village with a population of 920 people (10% of the population), experienced the second biggest change in Sponge abundance: a fivefold increase from 0.37% to 2.13%. Menjangan Besar, a Tourism Zone close to Karimunjawa Town, home to over half of Karimunjawa’s population (4900 people) experienced a quadrupling of sponges, and has grouper cultivation. However, all zones and most sites saw significant shifts in Sponge abundance, and only remote Krakal Besar, Core Zone Taka Menyawaken and Menjangan Kecil (all away from human habitation and mariculture) sponge increases were not statistically significant. Further consultation with the Balai Tamen Nasional confirmed that patterns of major sponge increases were consistent with increasing mariculture and development activity in the park. However, not all sponge increases could be easily explained: Krakal Kecil and Ujung Bomang both saw tripling of sponges: Krakal Kecil, a private resort has some limited development (three eco-cottages) on its tiny (300 m) island, but Ujung Bomang was far from residential areas. The pervasiveness of these sponge increases across all sites are in agreement with the findings of the water quality study, that was unable to establish a definitive link between proximity to aquaculture and elevated nitrate and phosphate levels, instead finding declines in water quality at all sites [32].
The encrusting sponge Terpios hoshinota, invasive to Western Pacific, has seen recent outbreaks in Indonesian coral reefs since it first appeared in 2012, and was seen during our 2018 surveys [62]. Terpios is associated with poor water quality and thrives in polluted and stressed reefs. It can rapidly overgrow corals [63] and has been responsible for significant coral mortality in other areas [64]. Appearance of Terpios may have contributed to increases in Sponge abundance, and strongly associated declines in Hard coral.
Coral disease, also associated with water quality, was recently found in 24% of corals surveyed around Karimunjawa Island, with significantly more disease at sites closer to mariculture and human habitation [32]. Disease (or competition) may be the mechanism behind the negative co-occurrence patterns between Sponge and Hard coral across the park. This relationship that was found to be stronger than the co-occurrence between Hard coral and Algae (Figure 4), and may help explain declines in massive Porites (MSE) which we found to be less affected by the 2016 bleaching (Figure 4: DHW) but are reported to be particularly vulnerable to disease in this region [65].
Finally, water quality can affect other aspects of reef biology, for example driving more rapid linear extension in Acropora branches [30]. It may be that declining water quality in Karimunjawa may also have contributed to apparent increase in branching Acropora. It has long been suggested that pollution in the Coral Triangle is a major driving force on community composition (more significant than underlying biogeography [21]), and exposure to this new threat is likely to see drive rapid changes in benthic community.
Although the absolute percent cover of Sponge is low, detection of this subtle but ubiquitous increase in sponge abundance across all management zones in Karimunjawa (Figure 3a) represented the most significant community shift seen across in the park between 2014 and 2018 (Figure 3b). Analyses employed to explore this complex multivariate dataset allowed us to detect these potentially important shifts that traditional inspection of percent cover values may have missed, providing managers with an early indication of a potential emerging threat to the reefs locally. In future, investment in tracking water quality across the park, and an emphasis on monitoring of sponges—and not just coral and algae—may prove valuable in tracking reef health and improving management outcomes in Karimunjawa National Park.

5. Conclusions

Reef communities are complex, and detailed community composition data collected by monitoring programs can be difficult to decipher, particularly when collected across large geographic areas facing multiple local and global stressors. Technology is allowing us to collect more detailed data across ever larger areas, but without appropriate analytical techniques, meaningful changes may be missed and improved capabilities around data collection may not translate into effective real world actions [66].
In this study, models developed specifically to analyse fine-scale multivariate ecological datasets across broad geographies detected small but significant increases in sponges across Karimunjawa National Park, which may be an early indicator of declining water quality across the park. Analyses also revealed community shifts in coral assemblage, from massive towards more complex foliose and branching communities, likely reflecting recovery of more fragile coral species as a result of restrictions to fishing gear, and losses of massive corals to disease. Finally, the model detected a signature of the 2016 coral bleaching at the sub-group level, which significantly affected branching species where thermal stress was high, although was not strong enough to drive any significant declines in coral across the park. Our dataset shows that subtle differences can be missed if simplistic comparisons of coral cover are used to draw conclusions about benthic community variability across space and time.
Karimunjawa’s coral reefs are important from a socio-economic standpoint, as well as a biological one, forming the core livelihood for many of the population of 9000 islanders. In the past, management has proved responsive to new threats and data. Local management actions taken, specifically the banning of harmful muro-ami fishing, has likely led to stabilisation of coral community and recovery of three dimensional complexity right across the park—and particularly in Rehabilitation Zones—a very positive outcome reflective of collaborative community management. As pollution and water quality become an ever more serious threat to reef health in Indonesia [1], Karimunjawa’s managers need to be aware of emerging new threats—in the form of tourism and mariculture—that appear to already be influencing benthic communities across the park. Both tourism and mariculture need to be managed carefully to maintain water quality, in order to give Karimunjwa’s coral reefs the best possible chance of resisting and recovering from continued ocean warming.

Supplementary Materials

The following are available online at https://www.mdpi.com/2077-1312/8/10/760/s1.

Author Contributions

Conceptualisation, E.V.K., J.V., M.G.-R. and O.-H.G.; methodology, M.G.-R., B.P.N., E.V.K., J.V.; software, M.G.-R., A.R.-R., S.L.-M.; validation, E.V.K., A., S.H., P.P., A.P.; formal analysis, J.V. and E.V.K.; investigation, E.V.K., B.P.N., D.E.P.B., A.G., P.G., K.B., C.J.S.K., M.H., A.H., S.G., K.M., P.D.; data curation, M.G.-R., A.R.-R., S.L.-M., J.V.; writing—original draft preparation, E.K.; writing—review and editing, E.V.K., J.V.; visualisation, E.V.K. and J.V.; project administration, E.V.K.; funding acquisition, O.H.-G. All authors have read and agreed to the published version of the manuscript.

Funding

This work was funded by the Paul G. Allen Family Foundation, VULCAN INC grant number #12312 ‘Coral Triangle Project Title: Assessing the impact of the 2015-16 global mass bleaching event and seeking resilient coral reefs’ awarded to O.HG. Fieldwork was conducted under SIMAKSI Permit No’s B-3181/IPK.2/KS/X/2014 and 2486/FRP/E5/Dit.KI/V/2018.

Acknowledgments

We would like to thank Suharsono, RCO-LIPI Oceanographic Research Center, Jamaluddin Jompa, Hasanuddin University and Zainal Arifin, Director, LIPI Oceangraphic Research Center, for initial guidance with site selection and in-country support. Thanks also to staff at the UQ Indonesian Offices in Jakarta, to Kura Kura Resort for hosting our field team, and the residents of Karimunjawa Town for their hospitality and interest in our research. We are grateful to everyone at the Balai Taman Nasional Karimunjawa for the tireless job they continue do to protect the park. Particularly we would like to thank Head of Section of Management Region II Sutris Haryanta, Conservation Officer Puji Prihatinningsih M.App.Sc and Director Agus Prabowo S.H., M.Sc. for support during fieldwork. Finally we are grateful to two anonymous reviewers, and editor Vianney Denis for helping improve and refine the manuscript.

Conflicts of Interest

The authors declare no conflict of interest. The funders had no role in the design of the study; in the collection, analyses, or interpretation of data; in the writing of the manuscript, or in the decision to publish the results.

Appendix A

Figure A1. Percent cover of coral type by site, in 2014 (top panel) and 2018 (bottom panel). Pie size reflects total Hard coral abundance (range 20.7 to 45.4%), and pie segments represent different coral subgroups (subgroups listed in Table A2). Foliose and plate-like corals dominated most sites, with branching Acropora replacing massive and encrusting species by 2018.
Jmse 08 00760 g0a1
Figure A2. Variation in coral community composition across the zones of Karimunjawa Park in 2014 and 2018. Mariculture Zone has different community composition, and this site also experienced the greatest loss in coral cover.
Jmse 08 00760 g0a2
Table A1. Location (lat, long) of each of the 18 survey sites in Karimunjawa National Park, along with percent cover of each of the major benthic groups (Table A2) averaged across all photo quadrats in 2014 and 2018.
Site Information20142018
SiteZoneTransect StartTransect EndQuadratsHard CoralSoft CoralAlgaeSpongeSedimentQuadratsHard CoralSoft CoralAlgaeSpongeSediment
Tanjung GelamProtection Zone−5.83641, 110.4099−5.83579, 110.41998720.360.010.540.010.0710220.310.020.500.010.15
Taka MalangCore Zone−5.82016, 110.4453−5.81611, 110.44088480.300.010.490.010.198080.260.020.480.020.23
Taka Malang 2General Use−5.81281, 110.4429−5.80416, 110.44118870.300.000.510.010.1810570.260.020.630.010.07
Cemara Besar EastGeneral Use−5.80417, 110.379−5.79646, 110.38119080.310.020.470.010.209870.310.020.500.010.16
Cemara Besar MDC SiteCore Zone−5.80364, 110.3699−5.81044, 110.374510060.210.010.710.010.069210.200.030.680.030.06
Taka MenyawakanCore Zone−5.7657, 110.327−5.76774, 110.32568610.400.020.550.010.028480.300.080.590.010.02
Menjangan Kecil MDCTourism Zone−5.88842, 110.4063−5.89342, 110.40059290.310.010.660.010.0110400.280.030.670.010.01
Menjangan Besar MDCTourism Zone−5.89317, 110.4212−5.90024, 110.42710550.240.010.660.000.097480.280.040.600.010.07
Karimunjawa TownGeneral Use−5.87799, 110.429−5.86981, 110.42839160.310.010.490.010.198660.250.020.530.010.19
Kumbang IslandCore Zone−5.77328, 110.2406−5.77505, 110.22878920.270.010.510.010.206680.270.020.550.010.16
Kembar IslandTourism Zone−5.73295, 110.1812−5.72017, 110.184910970.230.020.720.010.027680.220.040.700.020.01
Parang IslandMariculture Zone−5.75195, 110.2333−5.74226, 110.23379140.330.000.630.000.039660.220.010.720.020.03
Ujung BomangCore Zone−5.85618, 110.4712−5.86506, 110.46519020.210.010.490.000.2910120.250.020.450.010.27
Telaga VillageRehabilitation Zone−5.78234, 110.4616−5.77334, 110.472210270.260.020.620.000.107520.320.020.580.020.06
Pulau MenyawakanTourism Zone−5.79194, 110.3451−5.79273, 110.3481860.270.030.690.000.018070.280.030.660.010.02
Karang KapalTourism Zone−5.89661, 110.2433−5.90763, 110.23219860.450.040.480.000.037080.360.020.580.010.02
Krakal KecilGeneral Use−5.86028, 110.229−5.86547, 110.23359270.260.020.610.000.119200.210.010.700.010.06
Krakal BesarGeneral Use−5.84614, 110.2393−5.84823, 110.23710110.280.030.580.010.0910490.230.030.660.020.07
Mean 0.300.020.580.010.10 0.270.030.600.010.09
StDev 0.060.010.080.000.08 0.040.020.090.010.08
Table A2. Descriptors for the Benthic Groups (5) and sub-groups (15) used in the analysis, along with Table 53 benthic categories to which benthos was initially classified from photo quadrats (full dataset downloadable from Gonzalez et al. 2019 [45]). ‘Benthic Group’ and ‘Benthic sub-group’ identifiers in blue are the keys matching labels in the downloadable dataset. Other categories detected in the full dataset (e.g., Crown of Thorn seastars, crinoids, zoanthids, sea cucumbers, hydroids, tunicates and bryozoans) were removed from the dataset prior to analysis.
Benthic GroupBenthic Sub-GroupShort DescriptorFull DescriptorIncluding Pooled Sub-Groups Available in the Full Downloadable Dataset
Hard coralACR_BRABranching AcroporaBranching coral species from the Family Acroporidae, including bottlebrush (BRA_BOT_Ac) and branching (BRA_ARB_Ac) morphologies
Hard coralACR_TCDTable and digitate AcroporaOther morphologies from the Family Acroporidae, including corymbose, tabular, plate (BRA_TAB-Ac) and digitate (BRA_DIG_Ac) morphologies.
Hard coralBRA_nACROther branching coralNon-Acroporid branching species. This category pools Pocillopora (BRA_VER_Po), Stylophora (BRA_RND_St), Anacropora and Echninopora (BRA_OTH), branching Porites (BRA_SMO_Po) and fine branching species such as Seriatopora (BRA_FIN_Se)
Hard coralMSEMassive to encrusting coralMassive, submassive and encrusting (“MASE”) coral species with rounded corallites, including those with small to almost invisible corallites, such as Pavona, Psammocora, Coscinaraea, Gardineroseris (MASE_SML_O) or larger rounded corallites such as Diploastrea; Dipsastraea; Favites; Astrea; Galaxea; Goniopora; Astreopora (MASE_LRG_O), Isopora (MASE_LRG_I) and Porites with submassive/massive morphologies (MASE_SMO_P)
Hard coralMSEMBrain-like coralBrain corals: massive, submassive and encrusting (“MASE”) coral species with corallites forming meandering ridges or valleys, such as Platygyra, Leptoria and Goniastrea (MASE_MEA_O) and Lobophyllia (MASE_MEA_L)
Hard coralFREEFree-living coralFree living species, typically Fungia (NON_FREE)
Hard coralFLPFoliose coralHard corals with foliose morphologies, including those with visible relief structures (TFP_RND_A1) and those with visible rounded corallites (TFP_RND_A2)
Hard coralNON_HERMNon-scleractinian coralNon-scleractinian hermatypic corals, mainly the hydrocoral Millepora (NON_MIL) and blue coral Helipora (NON_HEL)
Soft Coral *GORGGorgoniansGorgonian corals including families of sea fan, plumes and whips belonging to the sub-ordersHolaxonia and Scleraxonia (GORG)
Soft Coral *OTH-SFAlyciionids and other soft coralLeathery soft corals from the Family Alycyoniidae, such as Lobophytum and Sarcophyton (SINV_SFC_A) and other non-Alcyoniid species, e.g., Xeniidae; Neptheidae; Tubipora; Briareum (SINV_SFC_E).
SpongeSPONGSpongesSponges, including branching and rope forms (SINV_SPO_E), fan-shaped sponges (SINV_SPO_F), massive to encrusting forms (SINV_SPOM) and hollow cups, barrels and tubs (SINV_SPO_V).
AlgaeMACROMacroalgaeMacroalgae, includes all algae > 1 cm in height, including globular algae such as caulerpa (MACR_GLOB), filamentous forms (MACR_Fil_A), sheeting forms like Ulva (MACR_Fol_S), leathery macrophytes (MACR_LTH_O), foliose forms (either branched, MACR_Fol_B, feathery MACR_Fol_P, fan shaped MACR_Fol_F or other MACR_Fol_O), calcifying algae Halimeda (MACR_Cal_H) and other calcifying species (MACR_Cal_O), and Padina (MACR_Cal_P). This group also includes cyanobacteria found smothering dead coral (CYANO_DHC), rubble (CAL_CCA_RB) and rock (CAL_CCA_Sub) as well as any other algae not fitting into these categories (ALGAE_OTH).
AlgaeEAMEpilithic algal matrixTurfs and biofilms covering dead hard coral (EAM_DHC), rubble (EAM_RB), rock or other substrate (EAM_Sub).
AlgaeCCACrustose coralline algaeCrustose coralline algae, including forms encrusting dead hard coral (CAL_CCA_DC) found on substrate (CAL_CCA_RB) and rubble (CAL_CCA_RB).
SedimentNON_COLONIZABLELoose substrateLoose non-living substrate, including rubble (LSUB_RUB), sand (LSUB_SAND) and sediment (LSUB_SEDI).
* including Gorgonians.

References

  1. Baum, G.; Januar, H.I.; Ferse, S.C.A.; Kunzmann, A. Local and regional impacts of pollution on coral reefs along the Thousand Islands north of the megacity Jakarta, Indonesia. PLoS ONE 2015, 10, e0138271. [Google Scholar] [CrossRef] [PubMed] [Green Version]
  2. Spalding, M.; Ravilious, C.; Green, E. World Atlas of Coral Reefs; University of California Press: Berkeley, CA, USA, 2001; p. 436. [Google Scholar]
  3. Pendleton, L.; Comte, A.; Langdon, C.; Ekstrom, J.A.; Cooley, S.R.; Suatoni, L.; Beck, M.W.; Brander, L.M.; Burke, L.; Cinner, J.E.; et al. Coral reefs and people in a high-CO2 world: Where can science make a difference to people? PLoS ONE 2016, 11, e0164699. [Google Scholar] [CrossRef] [PubMed]
  4. Burke, L.; Reytar, K.; Spalding, M.; Perry, A. Reefs at Risk Revisited; World Resources Institute: Washington, DC, USA, 2011; ISBN 978-1-56973-762-0. [Google Scholar]
  5. Pranato, I.B. Indonesia-Coral Reef Rehabilitation and Management Program-Coral Triangle Initiative (COREMAP-CTI); Wolrd Bank Group: Washington, DC, USA, 2015. [Google Scholar]
  6. Bruno, J.F.; Selig, E.R. Regional decline of coral cover in the Indo-Pacific: Timing, extent, and subregional comparisons. PLoS ONE 2007, 2, e711. [Google Scholar] [CrossRef] [PubMed] [Green Version]
  7. Hughes, T.P.; Anderson, K.D.; Connolly, S.R.; Heron, S.F.; Kerry, J.T.; Lough, J.M.; Baird, A.H.; Baum, J.K.; Berumen, M.L.; Bridge, T.C.; et al. Spatial and temporal patterns of mass bleaching of corals in the Anthropocene. Science 2018, 359, 80–83. [Google Scholar] [CrossRef] [PubMed] [Green Version]
  8. Hoegh-Guldberg, O.; Mumby, P.J.; Hooten, A.J.; Steneck, R.S.; Greenfield, P.; Gomez, E.; Harvell, C.D.; Sale, P.F.; Edwards, A.J.; Caldeira, K.; et al. Coral reefs under rapid climate change and ocean acidification. Science 2007, 318, 1737–1742. [Google Scholar] [CrossRef] [Green Version]
  9. Eakin, C.M.; Sweatman, H.P.A.; Brainard, R.E. The 2014–2017 global-scale coral bleaching event: Insights and impacts. Coral Reefs 2019, 38, 539–545. [Google Scholar] [CrossRef] [Green Version]
  10. Hoegh-Guldberg, O.; Jacob, D.; Taylor, M. Chapter 3: Impacts of 1.5 °C global warming on natural and human systems. In Special Report on Global Warming of 1.5 °C; Intergovermental Panel on Climate Change: Incheon, Korea, 2018. [Google Scholar]
  11. Hoegh-Guldberg, O.; Kennedy, E.V.; Beyer, H.L.; McClennen, C.; Possingham, H.P. Securing a long-term future for coral reefs. Trends Ecol. Evolut. 2018, 33, 936–944. [Google Scholar] [CrossRef] [Green Version]
  12. Kennedy, E.V.; Perry, C.T.; Halloran, P.R.; Iglesias-Prieto, R.; Schönberg, C.H.L.; Wisshak, M.; Form, A.U.; Carricart-Ganivet, J.P.; Fine, M.; Eakin, C.M.; et al. Avoiding coral reef functional collapse requires local and global action. Curr. Biol. 2013, 23, 912–918. [Google Scholar] [CrossRef] [Green Version]
  13. Beger, M.; McGowan, J.; Treml, E.A.; Green, A.L.; White, A.T.; Wolff, N.H.; Klein, C.J.; Mumby, P.J.; Possingham, H.P. Integrating regional conservation priorities for multiple objectives into national policy. Nat. Commun. 2015, 6, 8208. [Google Scholar] [CrossRef] [Green Version]
  14. Bruno, J.F.; Côté, I.M.; Toth, L.T. Climate change, coral loss, and the curious case of the parrotfish paradigm: Why don’t marine protected areas improve reef resilience? Ann. Rev. Mar. Sci. 2019, 11, 307–334. [Google Scholar] [CrossRef] [Green Version]
  15. Campbell, S.J. Rebuilding Management Effectiveness in Karimunjawa National Park, Indonesia; NOAA Final Report; NOAA: Silver Spring, MD, USA, 2006. [Google Scholar]
  16. Asaad, I.; Lundquist, C.J.; Erdmann, M.V.; Van Hooidonk, R.; Costello, M.J. Designating spatial priorities for marine biodiversity conservation in the Coral Triangle. Front. Mar. Sci. 2018, 5. [Google Scholar] [CrossRef]
  17. UNEP-WCMC. Global Distribution of Warm-Water Coral Reefs, Compiled from Multiple Sources; UNEP World Conservation Monitoring Centre: Cambridge, UK, 2010. [Google Scholar]
  18. Campbell, S.J.; Kartawijaya, T.; Yulianto, I.; Prasetia, R.; Clifton, J. Co-management approaches and incentives improve management effectiveness in the Karimunjawa National Park, Indonesia. Mar. Pol. 2013, 41, 72–79. [Google Scholar] [CrossRef]
  19. Allen Coral Atlas. Imagery, Maps and Monitoring of the Worlds Tropical Coral Reefs; Zenodo Repository. Available online: www.allencoralatlas.org (accessed on 20 September 2020).
  20. Solihuddin, T.; Utami, D.A.; Salim, H.L.; Prihantono, J. Sedimentary environment of a modern carbonate platform of Karimunjawa islands, Central Java. Indones. J. Geosci. 2019, 6, 57–72. [Google Scholar] [CrossRef] [Green Version]
  21. Edinger, E.N.; Kolasa, J.; Risk, M.J. Biogeographic variation in coral species diversity on coral reefs in three regions of Indonesia. Divers. Distrib. 2000, 6, 113–127. [Google Scholar] [CrossRef]
  22. Hafsaridewi, R.; Sulistiono, F.A.; Sutrisno, D.; Koeshendrajana, S. Resource management in the Karimunjawa Islands, Central Java of Indonesia, through DPSIR approach. Adv. Environ. Sci. 2018, 10, 7–22. [Google Scholar]
  23. Bejarano, S.; Pardede, S.; Campbell, S.J.; Hoey, A.S.; Ferse, S.C.A. Herbivorous fish rise as a destructive fishing practice falls in an Indonesian marine national park. Ecol. Appl. 2019, 29, e01981. [Google Scholar] [CrossRef] [Green Version]
  24. Yuliana, E.; Fahrudin, A.; Boer, M.; Kamal, M.M.; Pardede, S.T. The effectiveness of the zoning system in the management of reef fisheries in the marine protected area of Karimunjawa National Park, Indonesia. AACl Bioflux 2016, 9, 483–497. [Google Scholar]
  25. Ardiwijaya, R.; Baird, A.; Kartawijaya, T.; Campbell, S. Changes in Reef Fish Biomass in Karimunjawa National Park: A Test of the Effectiveness of Government Gazetted Marine Parks in Indonesia. In Proceedings of the International Coral Reef Symposium, Fort Lauderdale, FL, USA, 7–9 July 2008. [Google Scholar]
  26. Taruc, S.A.K. Resilience Studies of an Indonesian Coral Reef: Ecological and Social Assessments In Karimunjawa National Park; University of Queensland: Brisbane, Australia, 2011. [Google Scholar]
  27. Maynard, J.; Anthony, K.; Afatta, S.; Anggraini, L.; Haryanti, D.; Ambariyanto, A. Rock anchoring in Karimun Jawa, Indonesia: Ecological impacts and management implications. Pac. Conserv. Biol. 2008, 14, 242–243. [Google Scholar] [CrossRef] [Green Version]
  28. Marnane, M.J.; Ardiwijaya, R.L.; Wibowo, J.; Pardede, S.; Mukminin, A.; Herdiana, Y. Study on Muroami Fishing Activity in Karimunjawa Islands; Wildlife Conservation Society-Marine Program Report: Bogor, Indonesia, 2004. [Google Scholar]
  29. Purwanti, F. Tourism and conservation management options for Karimunjawa Marine National Park (Case study and reviews). J. Coast. Develop. 2001, 4, 99–104. [Google Scholar]
  30. Holmes, K.E.; Edinger, E.N.; Hariyadi, S.; Limmon, G.V.; Risk, M.J. Bioerosion of live massive corals and branching coral rubble on Indonesian coral reefs. Mar. Pollut. Bull. 2000, 40, 606–617. [Google Scholar] [CrossRef]
  31. Purwaningsih, R. Fishery Supporting Industry Planning for Karimunjawa Jepara Sea Farming. In Proceedings of the International Conference of Management Science, Yogyakarta, Indonesia, 10 March 2016. [Google Scholar]
  32. Sabdono, A.; Radjasa, O.K.; Trianto, A.; Sarjito, S.; Munasik, M.; Wijayanti, D.P. Preliminary study of the effect of nutrient enrichment, released by marine floating cages, on the coral disease outbreak in Karimunjawa, Indonesia. Reg. Stud. Mar. Sci. 2019, 30, 100704. [Google Scholar] [CrossRef] [Green Version]
  33. Maynard, J.A.; Anthony, K.R.N.; Afatta, S.; Dahl-Tacconi, N.; Hoegh-Guldberg, O.V.E. Making a model meaningful to coral reef managers in a developing nation: A case study of overfishing and rock anchoring in Indonesia. Conserv. Biol. 2010, 24, 1316–1326. [Google Scholar] [CrossRef]
  34. Baskara, K.A.; Hendarto, M.; Susilowati, I. Economic valuation of marine protected area of Karimunjawa, Jepara, Indonesia. AACL Bioflux 2017, 10, 1554–1568. [Google Scholar]
  35. Beyer, H.L.; Kennedy, E.V.; Beger, M.; Chen, C.A.; Cinner, J.E.; Darling, E.S.; Eakin, C.M.; Gates, R.D.; Heron, S.F.; Knowlton, N.; et al. Risk-sensitive planning for conserving coral reefs under rapid climate change. Conserv. Lett. 2018, 11, e12587. [Google Scholar] [CrossRef]
  36. Sea Temperature Info. Karimunjawa Sea Water Temperature, World Sea Water Temperatures. Available online: https://seatemperature.info/karimunjawa-water-temperature.html (accessed on 20 September 2020).
  37. Pardede, S.; Tarigan, S.A.R.; Setiawan, F.; Muttaqin, E.; Muttaqin, A.; Muhidin, D. Laporan Teknis: Monitoring ekosistem terumbu karang Taman Nasional Karimunjawa 2016; Wildlife Conservation Society-Marine Program Report: Bogor, Indonesia, 2016. [Google Scholar]
  38. Peterson, E.E.; Santos-Fernández, E.; Chen, C.; Clifford, S.; Vercelloni, J.; Pearse, A.; Brown, R.; Christensen, B.; James, A.; Anthony, K.; et al. Monitoring through many eyes: Integrating disparate datasets to improve monitoring of the Great Barrier Reef. Environ. Modell. Softw. 2020, 124, 104557. [Google Scholar] [CrossRef] [Green Version]
  39. Perkins, N.R.; Foster, S.D.; Hill, N.A.; Barrett, N.S. Image subsampling and point scoring approaches for large-scale marine benthic monitoring programs. Estuar. Coast. Shelf Sci. 2016, 176, 36–46. [Google Scholar] [CrossRef]
  40. Darling, E.S.; McClanahan, T.R.; Côté, I.M. Life histories predict coral community disassembly under multiple stressors. Glob. Chang. Biol. 2013, 19, 1930–1940. [Google Scholar] [CrossRef]
  41. Bellwood, D.R.; Pratchett, M.S.; Morrison, T.H.; Gurney, G.G.; Hughes, T.P.; Álvarez-Romero, J.G.; Day, J.C.; Grantham, R.; Grech, A.; Hoey, A.S.; et al. Coral reef conservation in the Anthropocene: Confronting spatial mismatches and prioritizing functions. Biol. Conserv. 2019, 236, 604–615. [Google Scholar] [CrossRef]
  42. Warton, D.I.; Blanchet, F.G.; O’Hara, R.B.; Ovaskainen, O.; Taskinen, S.; Walker, S.C.; Hui, F.K.C. So many variables: Joint modeling in community ecology. Trends Ecol. Evolut. 2015, 30, 766–779. [Google Scholar] [CrossRef]
  43. González-Rivero, M.; Bongaerts, P.; Beijbom, O.; Pizarro, O.; Friedman, A.; Rodriguez-Ramirez, A.; Upcroft, B.; Laffoley, D.; Kline, D.; Bailhache, C.; et al. The Catlin Seaview Survey–kilometre-scale seascape assessment, and monitoring of coral reef ecosystems. Aquat. Conserv. Mar. Freshwater Ecosyst. 2014, 24, 184–198. [Google Scholar] [CrossRef]
  44. Cadman, C.A. Indonesia-Coral Reef Rehabilitation and Management Program-Coral Triangle Initiative (COREMAP-CTI); P127813-Implementation Status Results Report Sequence 06; Asian Development Bank: Mandaluyong, Philippines, 2013. [Google Scholar]
  45. González-Rivero, M.; Rodriguez-Ramirez, A.; Beijbom, O.; Dalton, P.; Kennedy, E.V.; Neal, B.P.; Vercelloni, J.; Bongaerts, P.; Ganase, A.; Bryant, D.E.P.; et al. Seaview Survey Photo-quadrat and Image Classification Dataset; University of Queensland Research Data Collection: Brisbane, Australia, 2019. [Google Scholar] [CrossRef]
  46. González-Rivero, M.; Beijbom, O.; Rodriguez-Ramirez, A.; Holtrop, T.; González-Marrero, Y.; Ganase, A.; Roelfsema, C.; Phinn, S.; Hoegh-Guldberg, O. Scaling up ecological measurements of coral reefs using semi-automated field image collection and analysis. Remote Sens. 2016, 8, 30. [Google Scholar] [CrossRef] [Green Version]
  47. González-Rivero, M.; Beijbom, O.; Rodriguez-Ramirez, A.; Bryant, D.E.P.; Ganase, A.; Gonzalez-Marrero, Y.; Herrera-Reveles, A.; Kennedy, E.V.; Kim, C.J.S.; Lopez-Marcano, S.; et al. Monitoring of coral reefs using Artificial Intelligence: A feasible and cost-effective approach. Remote Sens. 2020, 12, 489. [Google Scholar] [CrossRef] [Green Version]
  48. Althaus, F.; Hill, N.; Ferrari, R.; Edwards, L.; Przeslawski, R.; Schönberg, C.H.L.; Stuart-Smith, R.; Barrett, N.; Edgar, G.; Colquhoun, J.; et al. A Standardised Vocabulary for Identifying Benthic Biota and Substrata from Underwater Imagery: The CATAMI classification scheme. PLoS ONE 2015, 10, e0141039. [Google Scholar] [CrossRef]
  49. Wallace, C.C. Staghorn Corals of the World: A Revision of the Coral Genus Acropora (Scleractinia; Astrocoeniina; Acroporidae) Worldwide, with Emphasis on Morphology, Phylogeny and Biogeography; Carden, C.W., Ed.; CSIRO Publishing: Clayton, Australia, 1999. [Google Scholar]
  50. Heron, S.F.; Maynard, J.A.; van Hooidonk, R.; Eakin, C.M. Warming trends and bleaching stress of the world’s coral reefs 1985–2012. Sci. Rep. 2016, 6, 38402. [Google Scholar] [CrossRef] [Green Version]
  51. Liu, G.; Eakin, C.M.; Chen, M.; Kumar, A.; De La Cour, J.L.; Heron, S.F.; Geiger, E.F.; Skirving, W.J.; Tirak, K.V.; Strong, A.E. Predicting heat stress to inform reef management: NOAA Coral Reef Watch’s 4-month coral bleaching outlook. Front. Mar. Sci. 2018, 5. [Google Scholar] [CrossRef]
  52. NOAA Coral Reef Watch. NOAA Coral Reef Watch Daily Global 5-km Satellite Virtual Station Time Series Data; NOAA Coral Reef Watch: College Park, MD, USA, 2013. Available online: http://coralreefwatch.noaa.gov (accessed on 15 October 2018.).
  53. Vercelloni, J.; Liquet, B.; Kennedy, E.V.; González-Rivero, M.; Caley, M.J.; Peterson, E.E.; Puotinen, M.; Hoegh-Guldberg, O.; Mengersen, K. Forecasting intensifying disturbance effects on coral reefs. Glob. Chang. Biol. 2020, 26. [Google Scholar] [CrossRef]
  54. Hui, F.K.C. Boral-Bayesian ordination and regression analysis of multivariate abundance data in R. Methods Ecol. Evolut. 2016, 7, 744–750. [Google Scholar] [CrossRef] [Green Version]
  55. Campbell, S.J.; Hoey, A.S.; Maynard, J.; Kartawijaya, T.; Cinner, J.; Graham, N.A.J.; Baird, A.H. Weak compliance undermines the success of no-take zones in a large government-controlled marine protected area. PLoS ONE 2012, 7, e50074. [Google Scholar] [CrossRef] [Green Version]
  56. Supriyanto, R.A.; Martani, I.B. Laporan Pelaksanaan Kegiatan: Monitoring Terumbu Karang dan Ikan Balai Taman Nasional Karimunjawa Tahun 2015; Direktorat Jenderal Perlindungan Hutan dan Konservasi Alam: Semarang, Indonesia, 2015. [Google Scholar]
  57. Bryant, D.E.P.; Rodriguez-Ramirez, A.; Phinn, S.; González-Rivero, M.; Brown, K.T.; Neal, B.P.; Hoegh-Guldberg, O.; Dove, S. Comparison of two photographic methodologies for collecting and analyzing the condition of coral reef ecosystems. Ecosphere 2017, 8, e01971. [Google Scholar] [CrossRef] [Green Version]
  58. Priyanto, F. The Impact of National Park Zoning against Livelihood Strategy of Compressor’s Fisherman. (Case in Village of Karimunjawa, Jepara Regency, Central Java). Ph.D. Thesis, University of Western Australia, Crawley, Australia, 2011. [Google Scholar]
  59. Karimunjawa, B.T.N. Penataan Zonasi Taman Nasional Karimunjawa Kabupaten Jepara Provnsi jawa Tengah; Direktorat Jenderal Perlindungan Hutan dan Konservasi Alam: Semarang, Indonesia, 2004. [Google Scholar]
  60. Rogers, A.; Blanchard, J.L.; Mumby, P.J. Vulnerability of coral reef fisheries to a loss of structural complexity. Curr. Biol. 2014, 24, 1000–1005. [Google Scholar] [CrossRef] [Green Version]
  61. Harris, D.L.; Rovere, A.; Casella, E.; Power, H.; Canavesio, R.; Collin, A.; Pomeroy, A.; Webster, J.M.; Parravicini, V. Coral reef structural complexity provides important coastal protection from waves under rising sea levels. Sci. Adv. 2018, 4, eaao4350. [Google Scholar] [CrossRef] [PubMed] [Green Version]
  62. Madduppa, H.; Schupp, P.J.; Faisal, M.R.; Sastria, M.Y.; Thoms, C. Persistent outbreaks of the “black disease” sponge Terpios hoshinota in Indonesian coral reefs. Mar. Biodivers. 2017, 47, 149–151. [Google Scholar] [CrossRef]
  63. Rutzler, K.; Musik, K. Terpios hoshinota, a new cyanobacteriosponge threatening Pacific reefs. Sci. Mar. 1993, 4, 395–403. [Google Scholar]
  64. Shi, Q.; Liu, G.H.; Yan, H.Q.; Zhang, H.L. Black Disease (Terpios hoshinota): A Probable Cause for the Rapid Coral Mortality at the Northern Reef of Yongxing Island in the South China Sea. AMBIO 2012, 41, 446–455. [Google Scholar] [CrossRef] [PubMed] [Green Version]
  65. Raymundo, L.J.; Rosell, K.B.; Reboton, C.T.; Kaczmarsky, L. Coral diseases on Philippine reefs: Genus Porites is a dominant host. Dis. Aquat. Organ. 2005, 64, 181–191. [Google Scholar] [CrossRef] [Green Version]
  66. Madin, E.M.P.; Darling, E.S.; Hardt, M.J. Emerging technologies and coral reef conservation: Opportunities, challenges, and moving forward. Front. Mar. Sci. 2019, 6. [Google Scholar] [CrossRef] [Green Version]
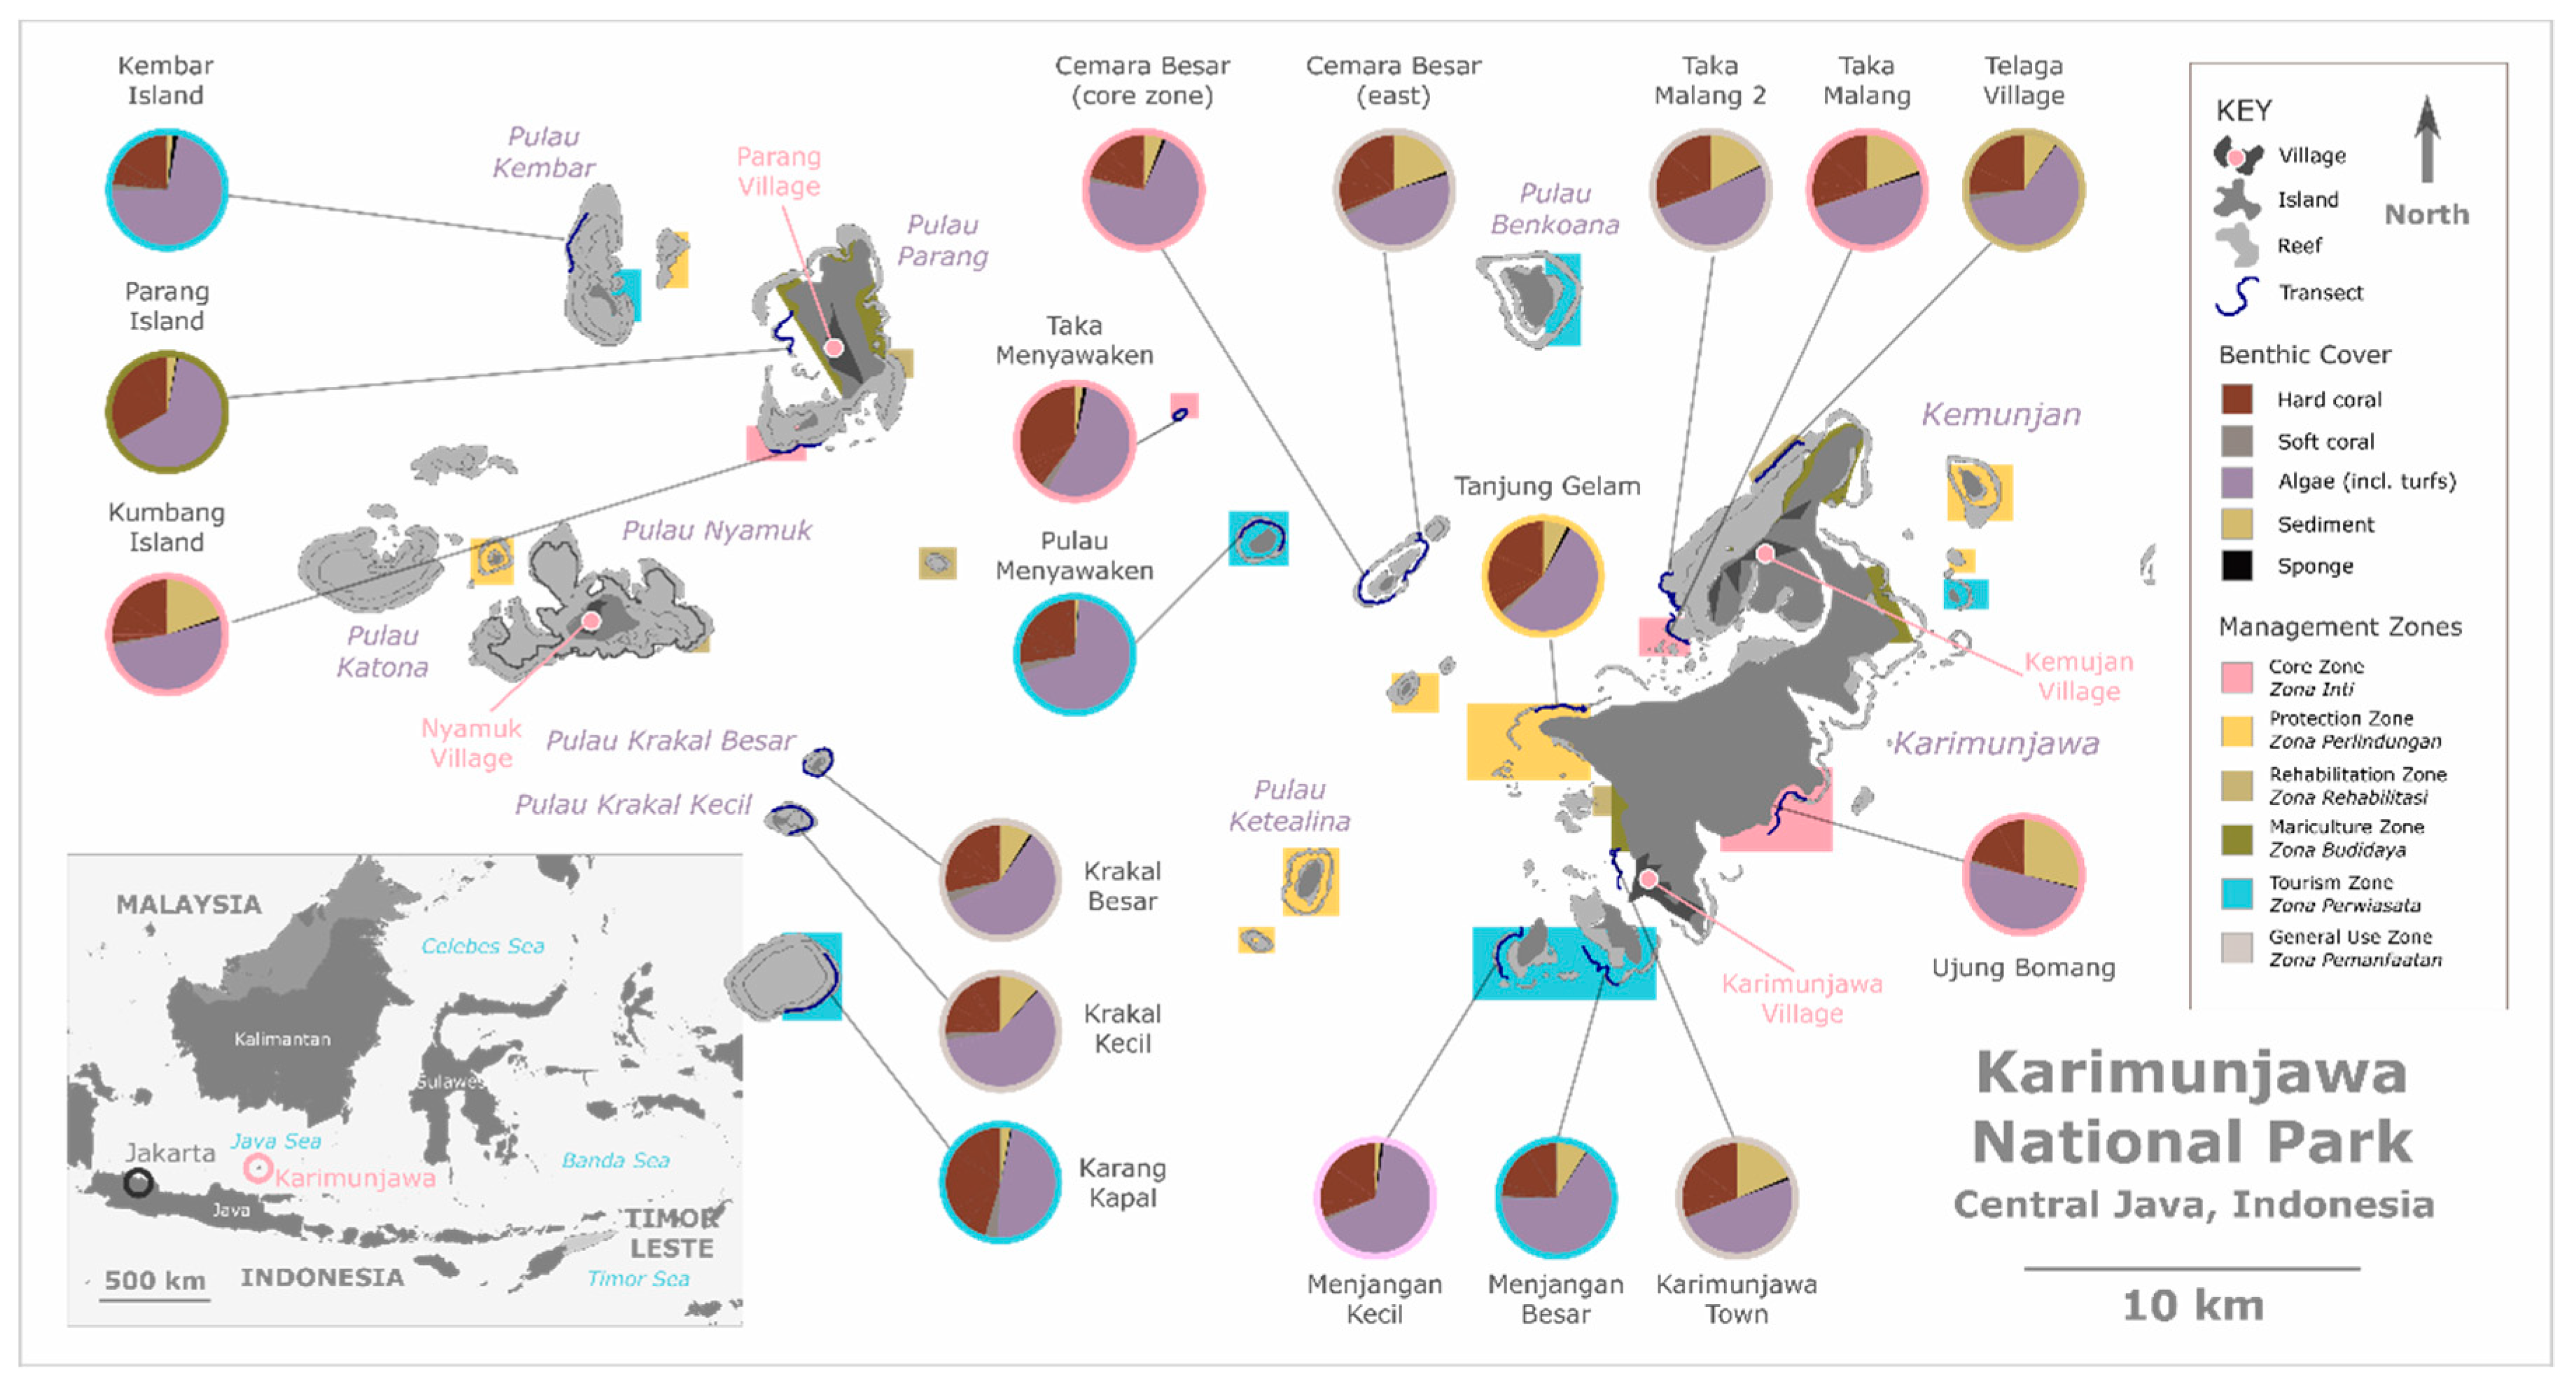
Figure 1. Map of Karimunjawa National Park extent showing islands (dark grey); coral reefs (pale grey); the four major population centres of Karimunjawa Village, Kemunjan Village, Parang Village and Nyamuck Village (pink dots); marine management zones (coloured areas; non-coloured area represent General Use areas); location of the 18 shallow reef surveys (dark blue transect lines), and mean benthic community composition recorded at each site in 2014 (pie charts, border indicates management zone). Sites did not vary significantly in terms of community composition. All sites were dominated by Algae (mainly turfs). Hard coral cover (mean 29.6 ± 0.06%) ranged from 20.7% at Ujung Bomang to 45.4% at Karang Kapal.
Jmse 08 00760 g001
Figure 2. Relative cover of the five benthic categories per management zone (six Zones tested) and sampling year (2014 vs 2018). Hard coral, Soft coral and Algae categories aggregate several benthic communities while Sediment and Sponge are mainly composed of loose substrates and sponges, respectively (Appendix A, Table A2 for descriptors and access to the dataset). Percent cover values of Hard coral, a commonly used reef health metric, are provided on the plot.
Jmse 08 00760 g002
Figure 3. Effect size of local and global pressures on benthic groups. Local pressures are estimated through management zones (a) and changes between 2014 and 2018 (Year, b), while global pressures include Degree Heating Weeks (DHW). Error bars indicate the 95% credible intervals estimated from the posterior distributions of model parameters. Stars indicate significant effects when 95% credible intervals did not include zero.
Jmse 08 00760 g003
Figure 4. Effect size of local and global pressures on benthic sub-groups (see Appendix A, Table A2 for definitions). Local pressures are estimated through management Zones (a) and changes between 2014 and 2018 (b, Year), while global pressures include Degree Heating Weeks (b, DHW). Error bars indicate the 95% credible intervals estimated from the posterior distributions of model parameters. Stars indicate significant effects when 95% credible intervals did not include zero.
Jmse 08 00760 g004
Figure 5. Co-occurrence patterns associated to the explanatory model variables (management Zone, DHW and Year, left panel) and to the unknown information part of the model (latent variables, right panel). Colours and sizes of circles indicate the directions (positive or negative) and strength of interactions, respectively. The red dots highlight significant co-occurrences (whose 95% credible intervals did not contain zero).
Jmse 08 00760 g005
Table 1. Regulations governing activities in Karimunjawa National Park, across the six marine zones (adapted from Campbell et al. 2013 [18]). ‘Traditional Use’ is use by local residents for rituals and for artisanal subsistence fishing (with restrictions on fishing gear and bans on destructive fishing).
Core ZoneProtection ZoneTourism ZoneMariculture ZoneRehabilitation ZoneGeneral Use Zone
Area (km2)4.52627.313.10.71003
Fishing××P×
ResearchppPppp
EducationppP
Boat transit× *
Anchoring× *
Tourism××
Restoration ××
Traditional useppP
× = activity forbidden, ✓ = activity permitted, p = permits required, * = except in emergency situation.