Article

The Contribution of Small Phytoplankton Communities to the Total Dissolved Inorganic Nitrogen Assimilation Rates in the East/Japan Sea: An Experimental Evaluation

1
Department of Oceanography, Pusan National University, Geumjeong-gu, Busan 609-735, Korea
2
Chair of Aquatic Systems Biology, School of Life Science Systems, Technical University of Munich, 853554 Freising, Germany
3
Oceanic Climate and Ecology Research Division, National Institute of Fisheries Science, Busan 46083, Korea
4
South Sea Fisheries Research Institute, National Institute of Fisheries Science, Yeosu-si 59780, Korea
5
Department de Biologie and Quebec-Ocean, Université, Laval, QC G1V 0A6, Canada
6
Graduate School of Fisheries Sciences, Hokkaido University, Hakodate, Hokkaido 041-8611, Japan
7
Marine Environmental Impact Assessment Center, National Institute of Fisheries Science, Busan 46083, Korea
*
Author to whom correspondence should be addressed.
J. Mar. Sci. Eng. 2020, 8(11), 854; https://doi.org/10.3390/jmse8110854
Submission received: 17 September 2020 / Revised: 22 October 2020 / Accepted: 23 October 2020 / Published: 29 October 2020
(This article belongs to the Section Chemical Oceanography)

Abstract

:
As a part of Korean-Russian joint expeditions in the East/Japan Sea during 2012 and 2015, a set of total and small (<2 μm) phytoplankton NO3 and NH4+ uptake rate estimations were carried out. The study aimed to assess the spatio-temporal variations in dissolved inorganic nitrogen (DIN) assimilation by the total and small phytoplankton. The results show that the total NO3 uptake rates during 2012 varied between 0.001 and 0.150 μmol NL−1h−1 (mean ± SD = 0.034 ± 0.033) and that the total NH4+ uptake rates ranged between 0.002 and 0.707 μmol NL−1h−1 (mean ± SD = 0.200 ± 0.158). The total uptake rates during 2015 were ranged from 0.003 to 0.530 (mean ± S.D. = 0.117 ± 0.120 μmol NL−1h−1) for NO3 and from 0.008 to 1.17 (mean ± S.D. = 0.199 ± 0.266 NL−1h−1) for NH4+. The small phytoplankton NO3 and NH4+ uptake rates during 2015 ranged between 0.001 and 0.164 (mean ± S.D. = 0.033 ± 0.036) μmol NL−1h−1 and 0.010–0.304 (mean ± S.D. = 0.101 ± 0.073) μmol NL−1h−1, respectively. Small phytoplankton’s contribution to the total depth-integrated NO3 and NH4+ uptake rates ranged from 10.24 to 59.36% and from 30.21 to 68.55%, respectively. The significant negative relationship observed between the depth-integrated total NO3 and NH4+ uptake rates and small phytoplankton contributions indicates a possible decline in the DIN assimilation rates under small phytoplankton dominance. The results from the present study highlight the possibility of a reduction in the total DIN assimilation process in the East/Japan Sea when small phytoplankton dominate under strong thermal stratification due to sea surface warming. The present study’s findings agree with the model projections, which suggested a decline in primary production in the global warming scenario.

1. Introduction

The East/Japan Sea is a small, semi-enclosed marginal sea of the Pacific Ocean with boundaries shared by Korea, Japan, and Russia; however, there is no direct water mass exchange with Pacific Ocean waters [1,2,3]. The biological and physico-chemical processes in the East/Japan Sea are mainly controlled by the inward and outward flows of straits from neighboring seas. The northern part of the East/Japan Sea remains cold throughout the year due to the cold Liman current, whereas the southern part is warm due to the Tsushima warm current [1,2,3]. Subsequently, the East/Japan Sea is highly dynamic with frequent eddies, subpolar fronts, and coastal upwellings [4,5,6]. Thus, there are many hotspots in the East/Japan Sea that are critical areas of high primary production and subsequent high fish abundance [5,6,7,8,9,10].
Previous studies suggest that the East/Japan Sea possesses higher primary production (246.8 g C m−2 y−1) rate than the open waters in various global oceans (55 g C m−2 y−1 to 102 g C m−2 y−1) [10]. The higher primary production is likely because the East/Japan Sea receives or possesses sufficient nutrients in the euphotic water column through various physico-chemical processes. A significant set of spatio-temporal assessments of nutrient concentrations and physical processes has already been conducted in the East/Japan Sea. The influence of physicochemical properties on primary production in the East/Japan Sea has also been widely investigated in the recent past [5,6,7,8,9,10]. However, the assimilation of inorganic nutrients such as NO3- and NH4+ and the factors influencing nitrogen cycling in the East/Japan Sea is understudied. The uptake efficiency of inorganic nutrients by phytoplankton is one of the significant parts of sustainable primary production. Like primary production, inorganic nutrient uptake is also highly dependent on various factors, such as water temperature, salinity, nutrient availability, and chlorophyll a (Chl-a) concentration [11]. Apart from these parameters, DIN uptake is highly dependent on the types of phytoplankton species and their abundances [12].
Recent observational and modeling studies from various global oceans suggest that warming oceanic environments can alter phytoplankton size distribution [11,12,13,14,15,16,17]. These studies indicate that there will be an increase in small phytoplankton abundance and a considerable decrease in large phytoplankton population abundance. In addition to the rise in small phytoplankton abundance, small phytoplankton contributions toward total C and DIN uptakes were also reported to be enhanced [11,12,13,14,15,16,17].
The East/Japan Sea exhibits highly variable physico-chemical conditions introduced due to seasonal and climatological factors [10,17,18,19,20,21]. A significant number of investigations in the East/Japan Sea observed a remarkable change in small phytoplankton communities’ biological characteristics at both local and broad scales due to environmental changes [10,22,23,24]. However, only a few studies have reported DIN uptake by small phytoplankton, particularly small phytoplankton’s contribution in the East/Japan Sea [24]. It is reported that the sea surface temperature (SST) in the East/Japan Sea has drastically increased over several decades [18,19]. The increase in SST has resulted in alterations in the seasonal peak in abundance and community structure of phytoplankton and, subsequently, higher trophic levels in various global oceans (11–16). To understand the seasonal and spatial distributions of primary production, a set of carbon uptake measurements of total and small phytoplankton were conducted during 2012 and 2015 by our parallel study [24]. They reported that the phytoplankton contributions toward the total primary production were significantly lower than those toward the total biomass. Our study presents the DIN uptake rates by total and small phytoplankton during 2012 and 2015. The main objective was to estimate small and large phytoplankton contributions to the total DIN uptake rates. The present study also addresses the temporal and spatial distributions of the DIN uptake rates by phytoplankton in the East/Japan Sea, mainly in the Russian territory, an understudied region concerning DIN assimilation by small and large phytoplankton.

2. Materials and Methods

2.1. Study Area and Sampling

The NO3 and NH4+ uptake rate measurements were conducted in the East/Japan Sea at 10 (Stations M1, M4, M5, M11, M14, M17, 134-4, 134-6, 134-9, and 136-5) and 9 (Stations M6, M10, M12, M15, 134-2A, 134-5, 143, 149A, and 153A) stations on 13–29 October 2012 and 11 April–2 May 2015, respectively (Figure 1). The Korean-Russian joint cruises onboard R/V Akademik Oparin and R/V Akademik M. A Lavertiev assisted in the 2012 and 2015 expeditions, respectively. The water samples (10 L) for the various environmental parameters were collected from six light levels (100%, 50%, 30%, 12%, 5%, and 1%) using Niskin bottles attached to the CTD/rosette sampler. Nutrients (NO3 and NH4+) and Chl-a samples were collected from 6 light depths (100%, 50%, 30%, 12%, 5%, and 1% photosynthetically active radiation (PAR)). The underwater PAR sensor was not available during the present study; hence, the light depths were determined based on the euphotic depth derived from the Secchi disk depth. The formula (euphotic depth = 2.81 × Secchi depth) to determine euphotic depth was obtained from [25], where euphotic depth is the depth at which the light percentage decreases to a level of 1% of its surface level. Secchi disc depths were measured at all the productivity-measured stations during the cruise periods using a 30 cm black and white Secchi disk. Before sampling waters, the Secchi disc was lowered by attaching to a rope marked with 0.5 m intervals to disappear from view.
Samples (0.5 L) for total Chl-a were prepared by filtering them through 25 mm diameter Whatman GF/F (nominal pore size = 0.7 μm) filters using a low vacuum pressure at less than 5 inHg. For small phytoplankton, the Chl-a concentration samples were prepared by subsequent filtration of water samples (1.0 L) through 20- and 2-μm Nucleopore filters (47 mm) and 0.7-μm Whatman GF/F filters (47 mm) [26,27]. Furthermore, the samples were wrapped in aluminum foil and kept frozen until analysis. The measurement of Chl-a concentrations was conducted at Pusan National University (home laboratory), Busan, South Korea, within one month after sampling. Before the measurements, the samples were extracted in 90% acetone, kept at 5 °C for 24 h. After the extraction, the samples were centrifugated at 3500 rpm. The absorbance of the clear supernatant was measured using a Turner Designs model 10-AU fluorometer calibrated with commercially purified Chl-a preparations. The method for chlorophyll-a calculation followed that of [28].

2.2. Nutrient Measurements

The water samples for nutrient concentrations were collected from the light depths corresponding to the DIN uptake sampling depths using Niskin samplers attached to the CTD device. After collection, the water samples (0.1 L) were filtered through Whatman GF/F filters at a low vacuum pressure less than 5 inHg. The filtrate was stored in airtight bottles at a temperature of −80 °C until the NO3 and NH4+ concentrations analysis. The frozen samples were thawed before analysis and analyzed at the National Institute of Fisheries Science, Korea, using an Auto analyzer (Quattro, Bran+Luebbe, Norderstedt, Germany) within two months after sampling.

2.3. DIN Uptake Rate Measurements

The DIN uptake estimations were conducted using the 13C-15N dual isotope tracer technique. Furthermore, the water samples from each light depth were transferred to polycarbonate incubation bottles (approximately 1.1 L) through a 200 μm net to remove zooplankton to avoid grazing during incubation. The sample bottles were covered with light filtering screens (LEE Filters; [24,29]) corresponding to each light depth. Furthermore, the samples for NO3 and NH4+ uptake were supplied with 98+% enriched NO3 (K15NO3) and NH4+ (15NH4Cl) substrates, respectively, in addition to NaH13CO3 [30,31,32,33], and were subjected to deck incubation for 4 hrs in large polycarbonate incubators with running surface seawater under natural light conditions. However, incubation times were longer, as long as 6 hrs, under cloudy weather conditions than under natural light conditions.
For total phytoplankton DIN uptake, 300 mL of each post-incubation sample was filtered onto pre-combusted (450 °C) GF/F filters (25 mm diameter and 0.7 μm pore size). For the small phytoplankton DIN uptake rates, the incubated samples underwent two sets of filtrations. Initially, 600 mL of each incubated sample was passed through 2 μm pore size Nucleopore filters. The filtrate was further filtered through 0.7 μm GF/F filters (25 mm diameter) to collect small phytoplankton. Both sample filters were immediately stored at −80 °C for preservation until mass spectrometric analysis at the stable isotope laboratory of the University of Alaska, Fairbanks, AL, USA. The experiments for small phytoplankton uptake rates were also conducted in parallel during 2012 and 2015; however, most of the data were not presentable for the 2012 sampling due to measurement-related issues. Hence, the small phytoplankton uptake rate data during 2015 are only discussed here. The calculations of DIN uptake rates were performed based on the equations given in Dugdale and Wilkerson [30]:
Uptake rate (μmol N l−1 h−1) = P * Δ Ip/(T * (I0Sa + IrSt)/(Sa + St) − I0)
where P represents the amount of particulate organic nitrogen in the post-incubation sample, and Δ Ip represents the increase in 15N atom% in the particulate N during incubation. Sa and St are ambient nutrients and added tracer concentrations, respectively. Ir and I0 are 15N atom% of added tracer and natural 15N atom%, and T is the incubation time in hours. This equation assumes no formation of nutrients during incubation, and, therefore, values obtained here are representatives of potential DIN uptake rates.
The measurements were performed two biological replicates, whereas technical replicates were performed only for the standards. Since the particulate organic content in the samples was very low, we could not keep the samples for technical replicates. The isotopic compositions were calculated with reference to the international standards Pee Dee Belemnite (PDB) and air standards for carbon and nitrogen measurements, respectively. However, there were IAEA lab standards measured at regular intervals during the sample measurements. Uncertainties in the δ13C and δ15N isotope measurements are 0.1 and 0.3 ‰, respectively. The statistical analysis for the present study used linear regression analysis and Student’s t-test to evaluate the significance of relationships between various parameters.

3. Results and Discussion

The results from the present study explain spatial and temporal variations in concentrations of NO3, NH4+, Chl-a, and DIN uptake rates in the East/Japan Sea during fall in 2012 and early spring in 2015. The temperature distribution in the euphotic zone during 2012 varied between 16.1 and 24.9 °C. The SST during 2012 varied between 16.8 and 24.9 °C, which indicates that vertical mixing existed throughout the euphotic zone (Table 1). During the 2015 sampling, the water column temperatures were lower than those of 2012, and SST varied between 2.58 and 13.6 °C; however, the temperature-depth profile indicated significant vertical mixing (Table 1).
The distribution of Chl-a concentrations in the various plankton size ranges obtained during the present study was previously reported in our parallel research work [24]. Lee et al. [24] noted that the total Chl-a concentrations ranged from 0.07 to 1.36 mg m−3 (mean ± SD = 0.49 ± 0.29 mg m−3) during the 2012 sampling effort. The Chl-a concentrations observed during the 2015 sampling effort (0.19–5.65 mg m−3; mean ± SD = 2.28 ± 1.47 mg m−3) were significantly higher than those of 2012 (data not shown in this paper) [24]. The Chl-a values did not show any remarkable spatial distribution during the 2012 sampling. In contrast, stations M15, 134-2A, 143, 149A, and 153-A showed higher Chl-a than at rest stations during the 2015 sampling. During both the sampling periods, the Chl-a concentrations were distributed evenly throughout the euphotic zone, and no signs of subsurface stratifications or subsurface chlorophyll maximum layers were observed. Nevertheless, there was considerable variability in the Chl-a concentrations during the 2015 sampling. Lee et al. [24] also reported, based on the Chl-a size distribution pattern, that small phytoplankton was more dominant in the northern region than in the southern part during the cruise in 2012 (mean ± SD = 49.7% ± 16.5%). However, during the 2015 sampling, large phytoplankton was observed to be prominent (47.7–72.5%) at the Russian coast (M15, 134-2A, 143, and 149A). Lee et al. [24] also found that the small phytoplankton contributions to primary productivity based on the Chl-a concentrations were similar to the previous results observed in the East/Japan Sea during summer [34]. There were no significant correlations between primary productivity and Chl-a concentration observed by Lee et al. [24]. The results from the present study also could not find any significant relationship between the DIN assimilation rates and the Chl-a concentrations during either sampling period in the East/Japan Sea (figure not shown).
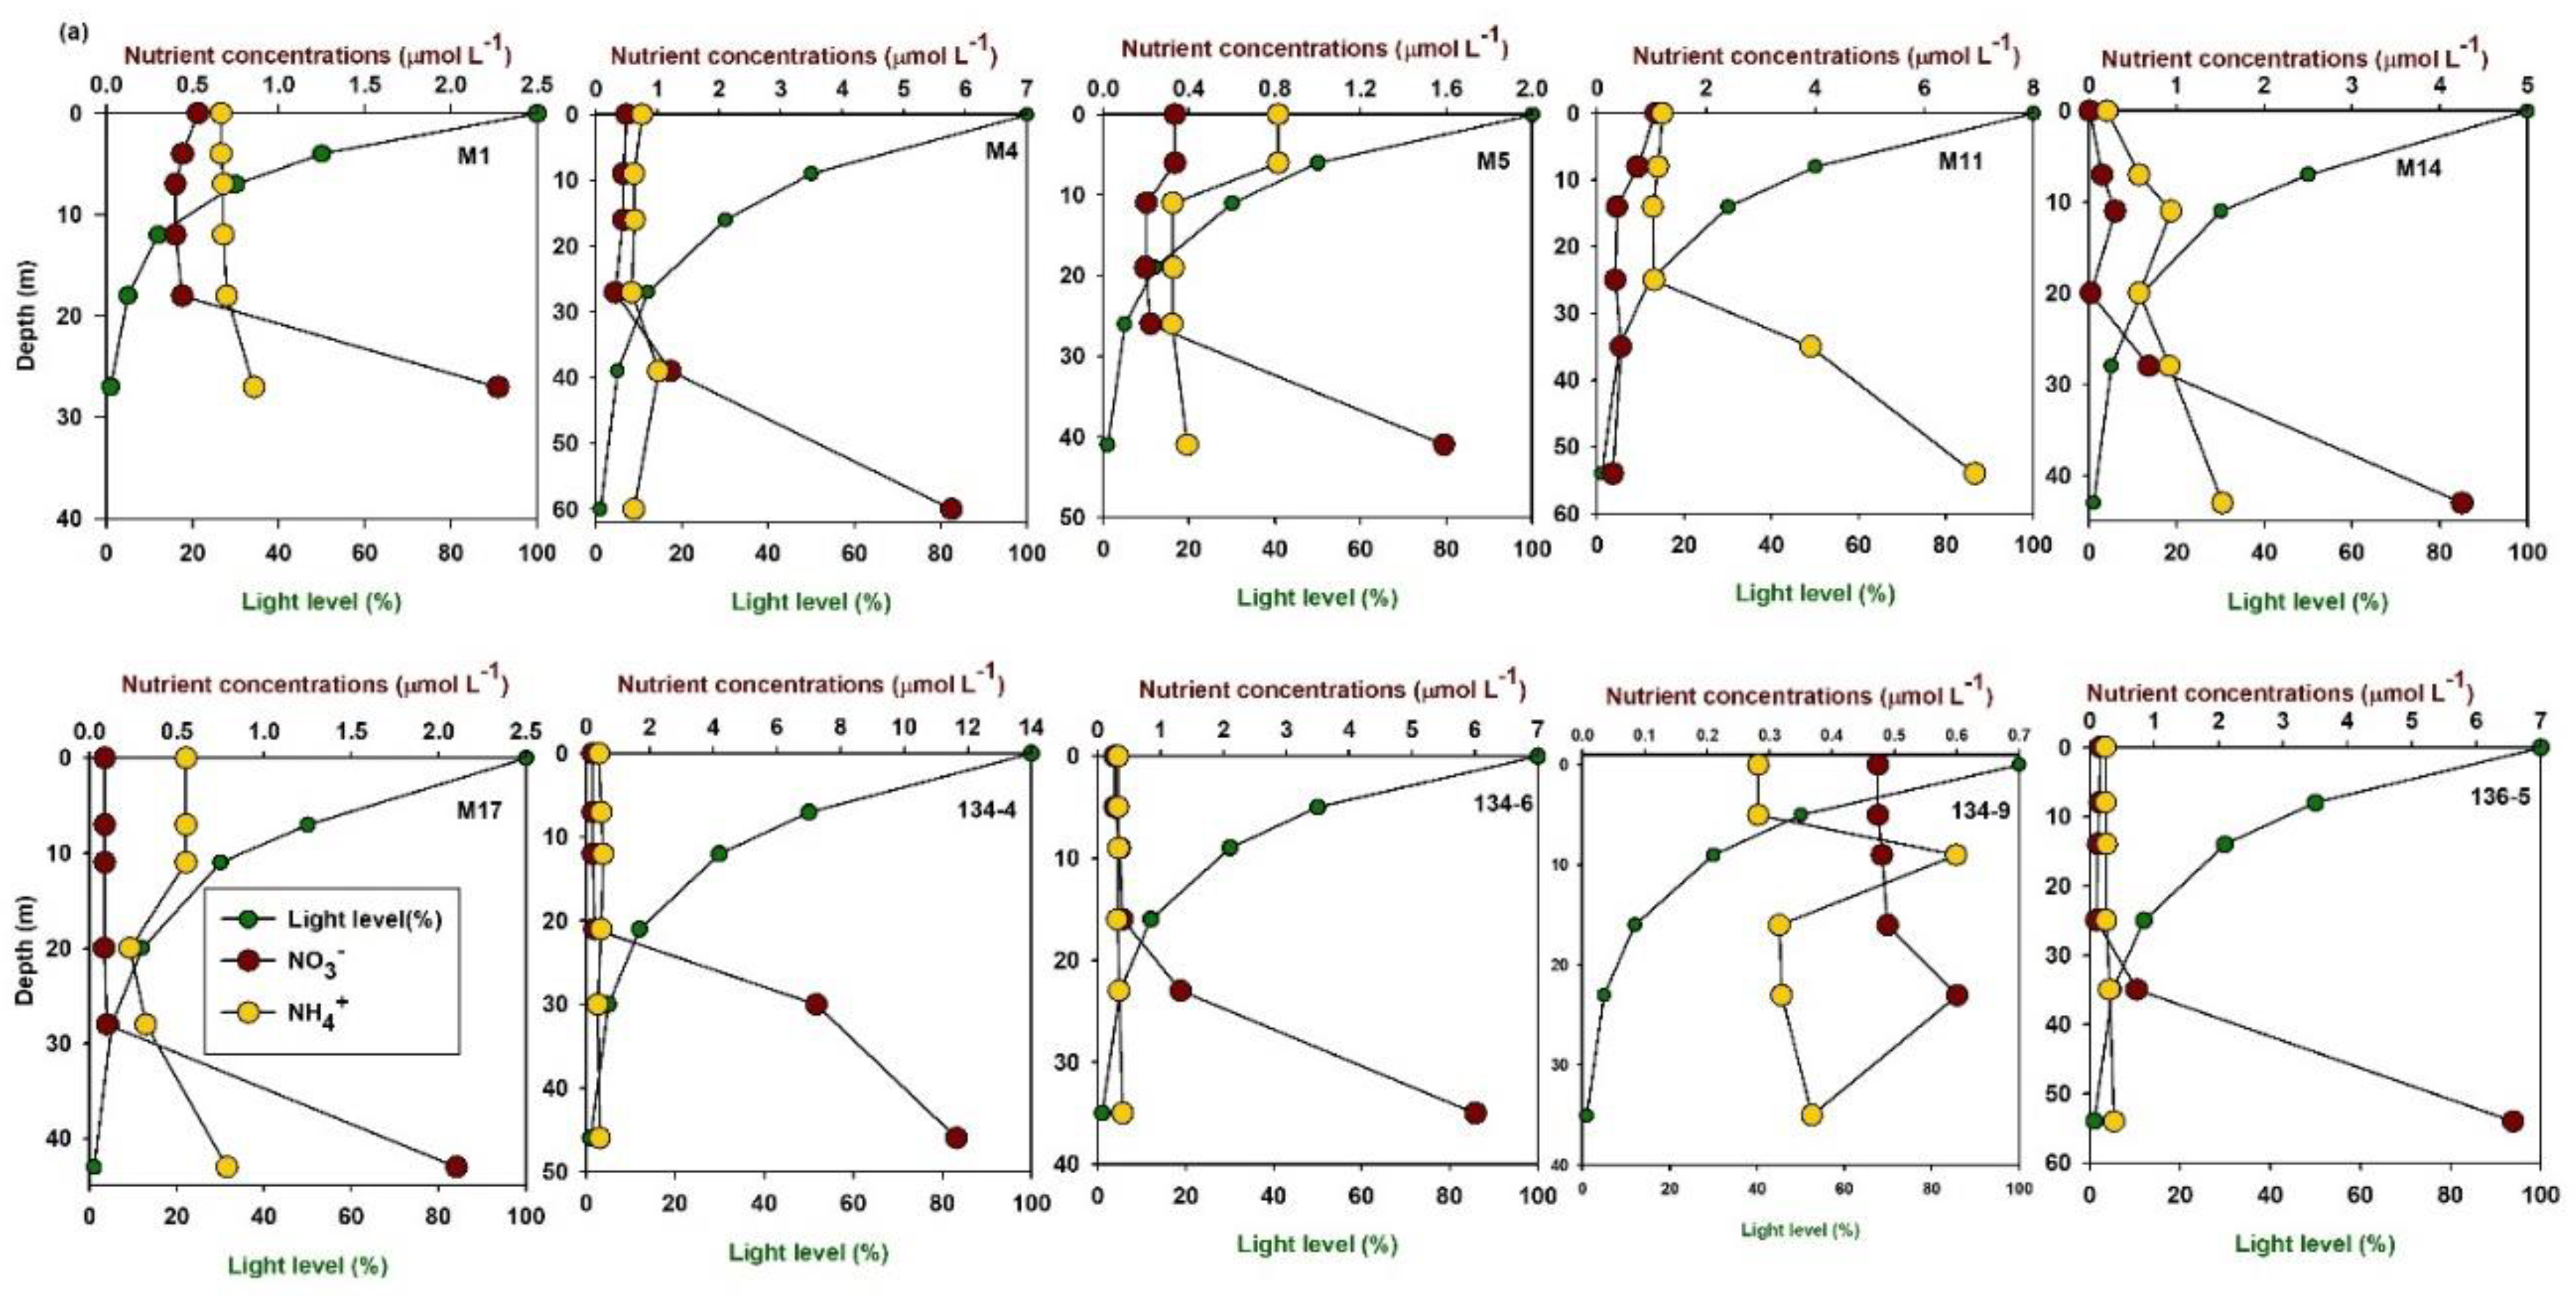
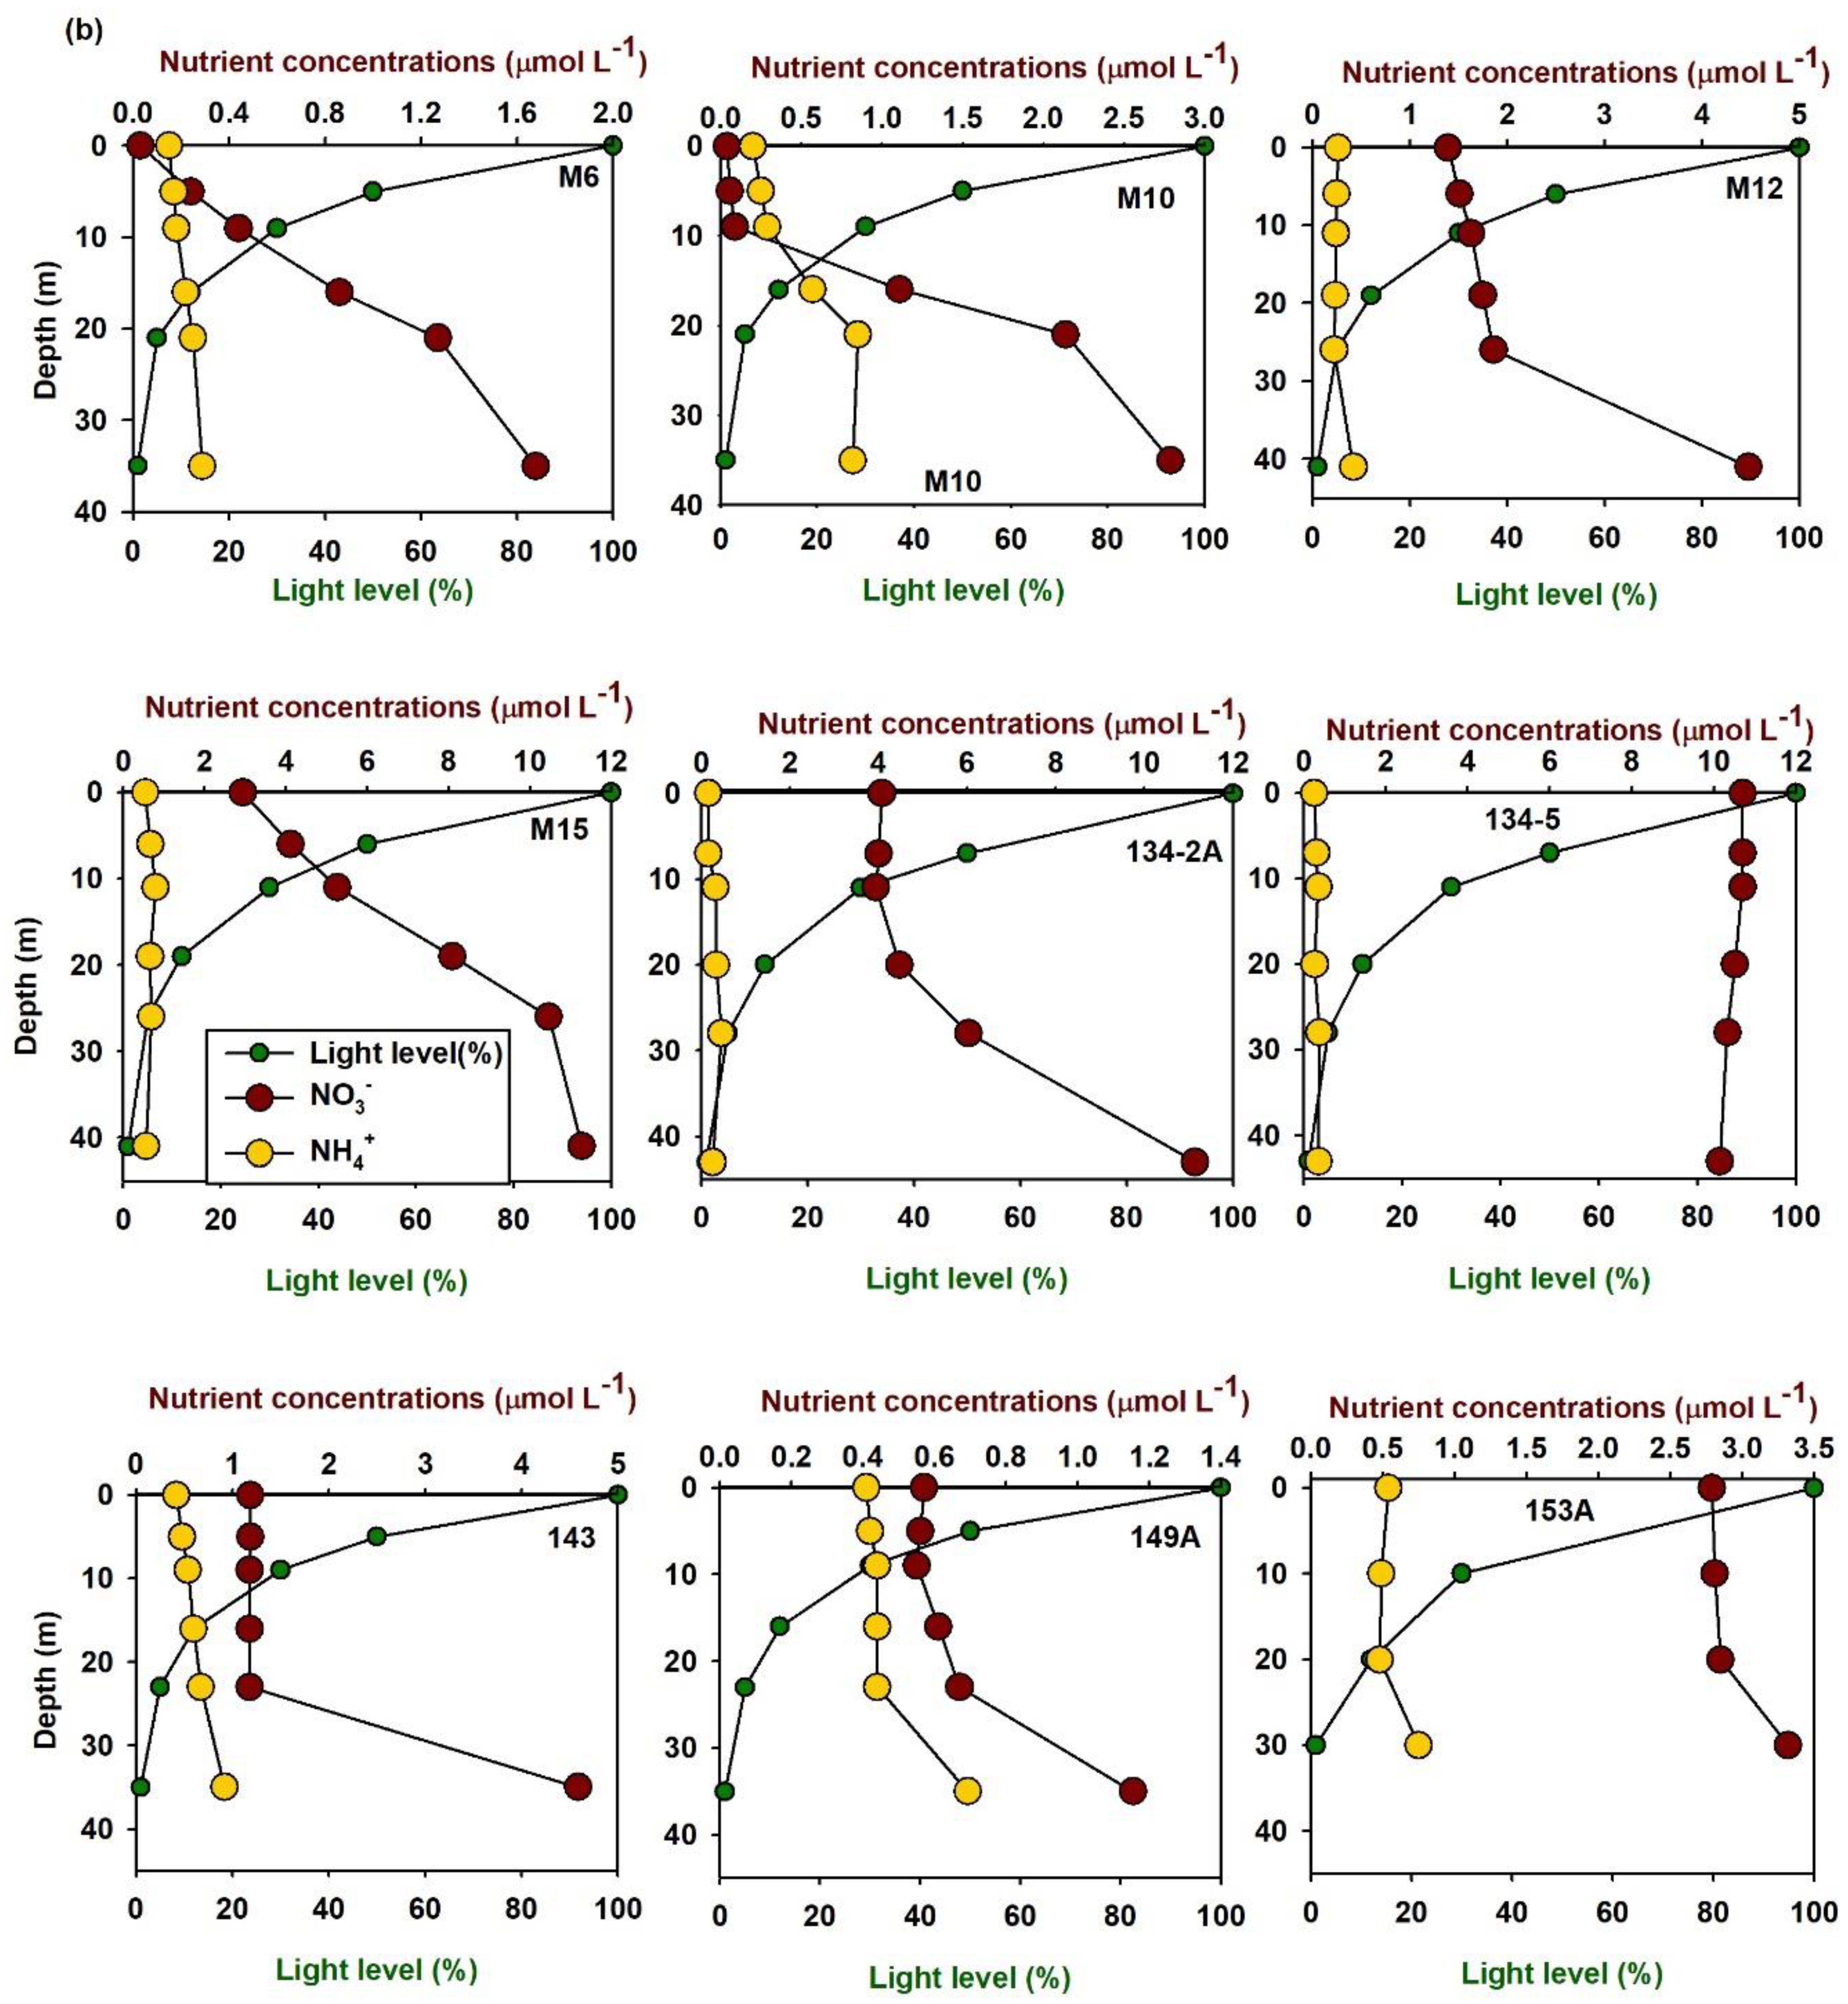
Nutrient availability is one of the critical factors that can influence potential DIN uptake [35]. Since no large rivers enter the East/Japan Sea, the significant sources of nutrients are upwelling and ocean currents [4,5,6]. The NO3 concentrations during 2012 varied between 0.004 and 11.65 μM, and, during 2015, they varied between 0.03 and 11.27 μM. Except for station 134-5, all other stations were seen with an elevated NO3 concentration at the bottom of the euphotic zone. Interestingly, station 134-5 showed the highest nutrient concentration among the rest of the stations. The elevated and uniformly distributed NO3 concentration at this station indicates the presence of upwelling (Figure 2b). Stations 143 and 153A also possessed uniform NO3 concentration till 5% light levels from the surface, which indicate the well-mixed water column. Another possible reason for low surface and elevated deep water column nutrient concentrations is the higher consumption of nutrients at surface layers than the dark bottom waters.
In general, the distribution pattern of the NO3 concentrations during both sampling periods showed a wide range compared to that of the NH4+ concentrations. During the 2012 sampling, station M11 showed a significantly high NH4+ concentration at the surface; however, the maximum NH4+ concentration was observed at station 134-4 at the 5% and 1% light levels (Figure 2a). NH4+ concentrations in the euphotic zone showed relatively high values during 2012, of which the stations, station 134-5, showed the highest value throughout the euphotic zone (Figure 2b).
Overall, the NH4+ concentrations during the 2012 sampling were higher than those during the 2015 sampling. There was no considerable difference in the NH4+ concentrations throughout the euphotic zone; however, stations (M1, M11, M14, and M17) exhibited considerably higher values near the bottom of the euphotic zone than the surface values during the 2012 sampling. The elevated NH4+ concentrations at the bottom of the euphotic zone were also seen during the 2015 sampling (stations; M6, M10, M12, 143, 149A, and 153A) (Figure 2b).

3.1. Spatiotemporal Distribution of DIN Uptake Rates

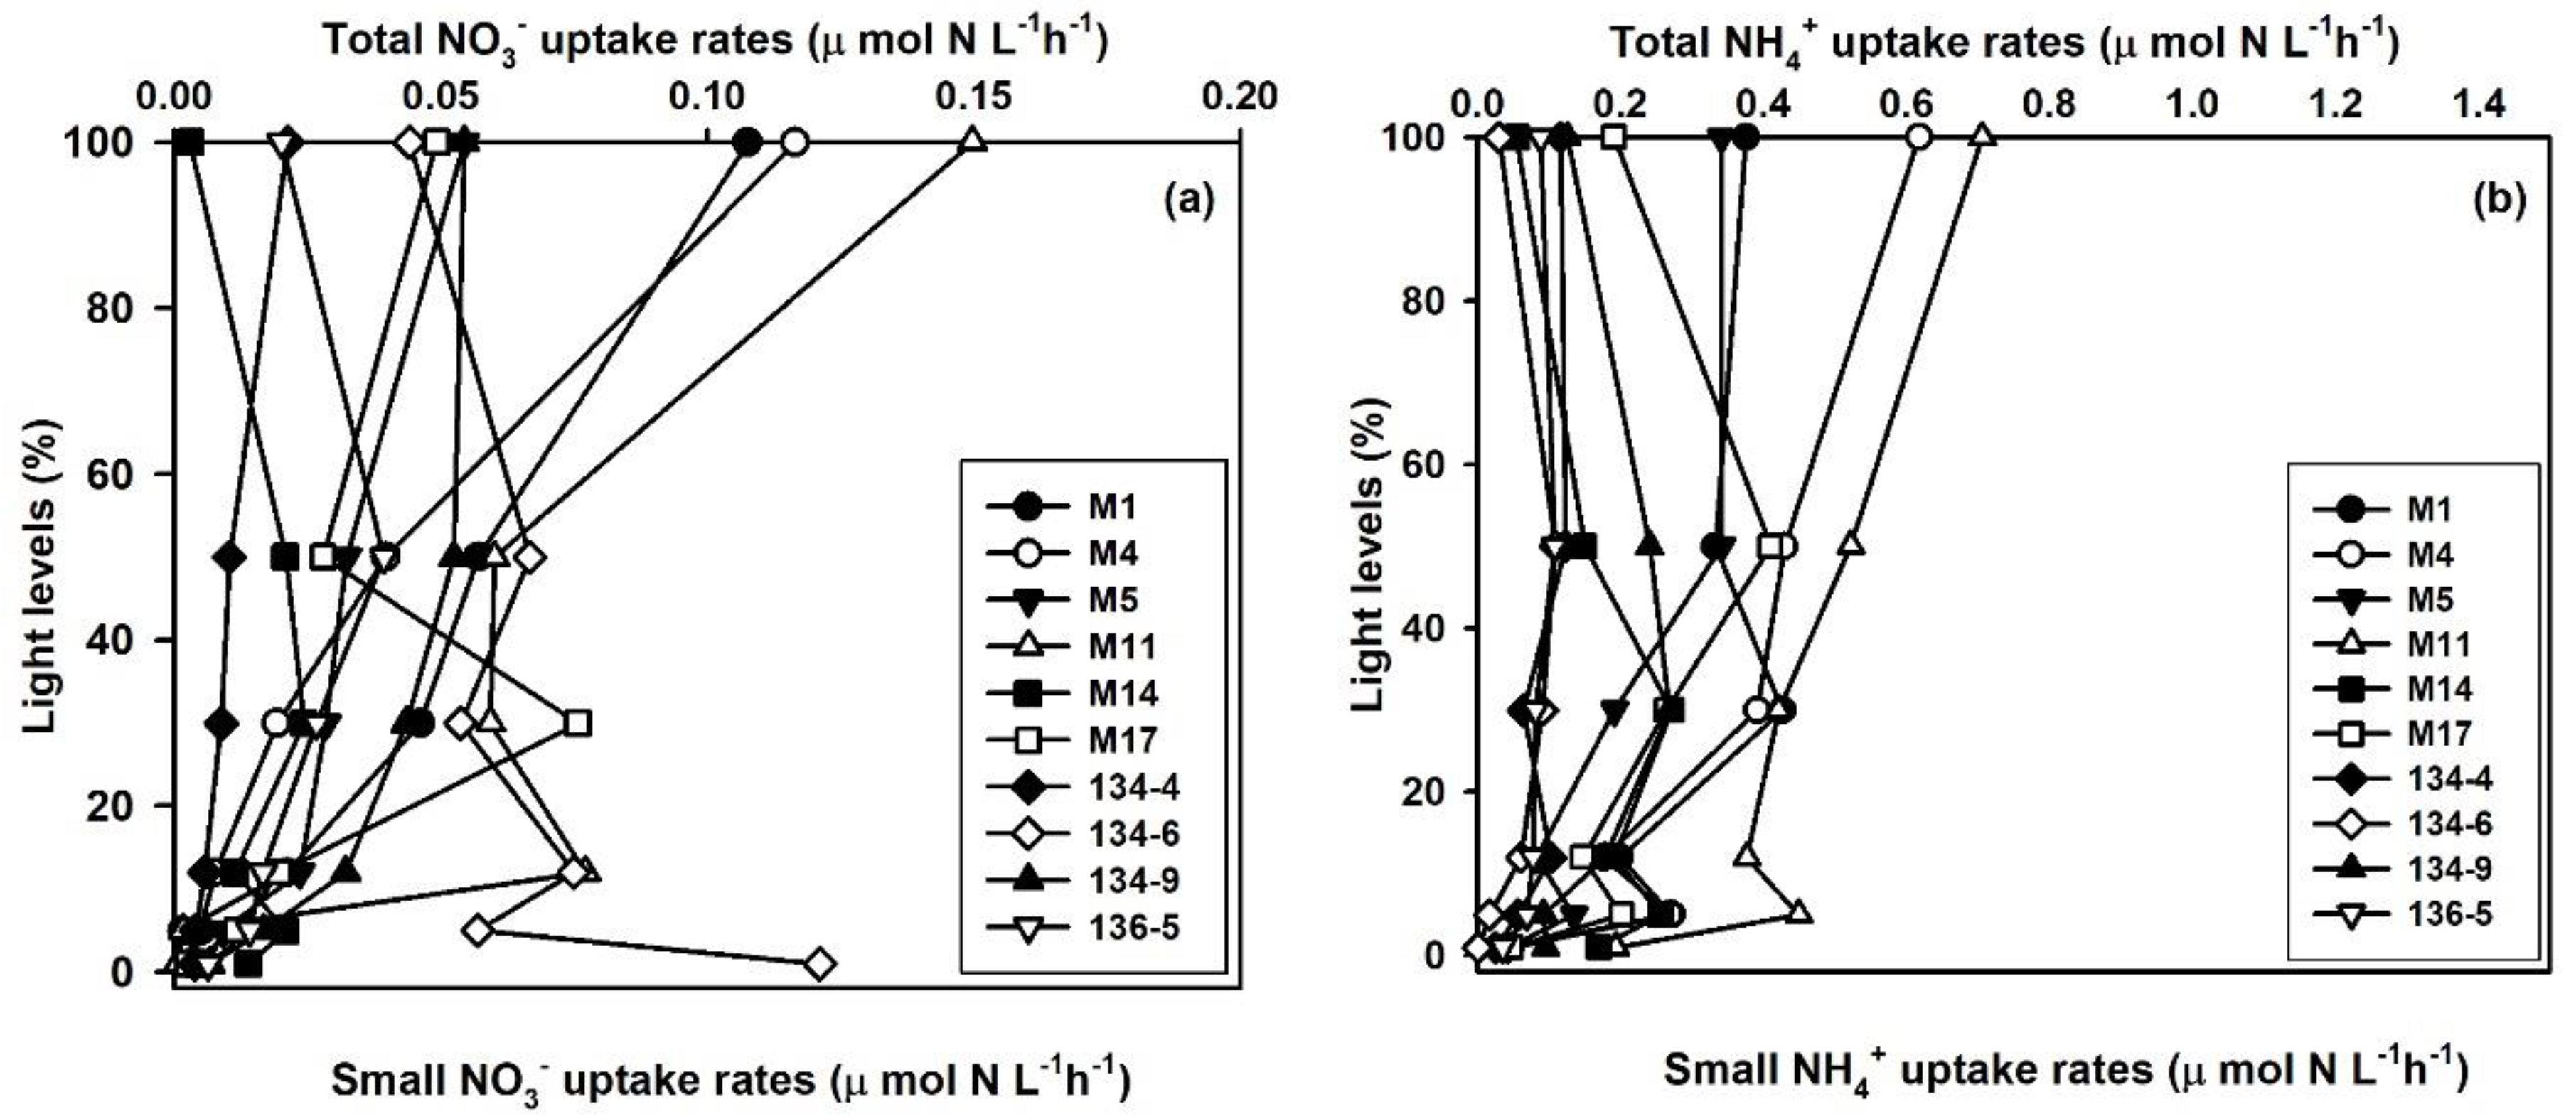
Figure 3 and Figure 4 show the depth profiles of the total NO3 and NH4+ uptake rates estimated from the East/Japan Sea during 2012 and 2015. The results show that the total NO3 uptake rates during 2012 varied between 0.001 and 0.150 μmol Nl−1h−1 (mean ± S.D. = 0.034 ± 0.033) and that the total NH4+ uptake rates ranged between 0.002 and 0.707 μmol Nl−1h−1 (mean ± S.D. = 0.200 ± 0.158) (Figure 3a).
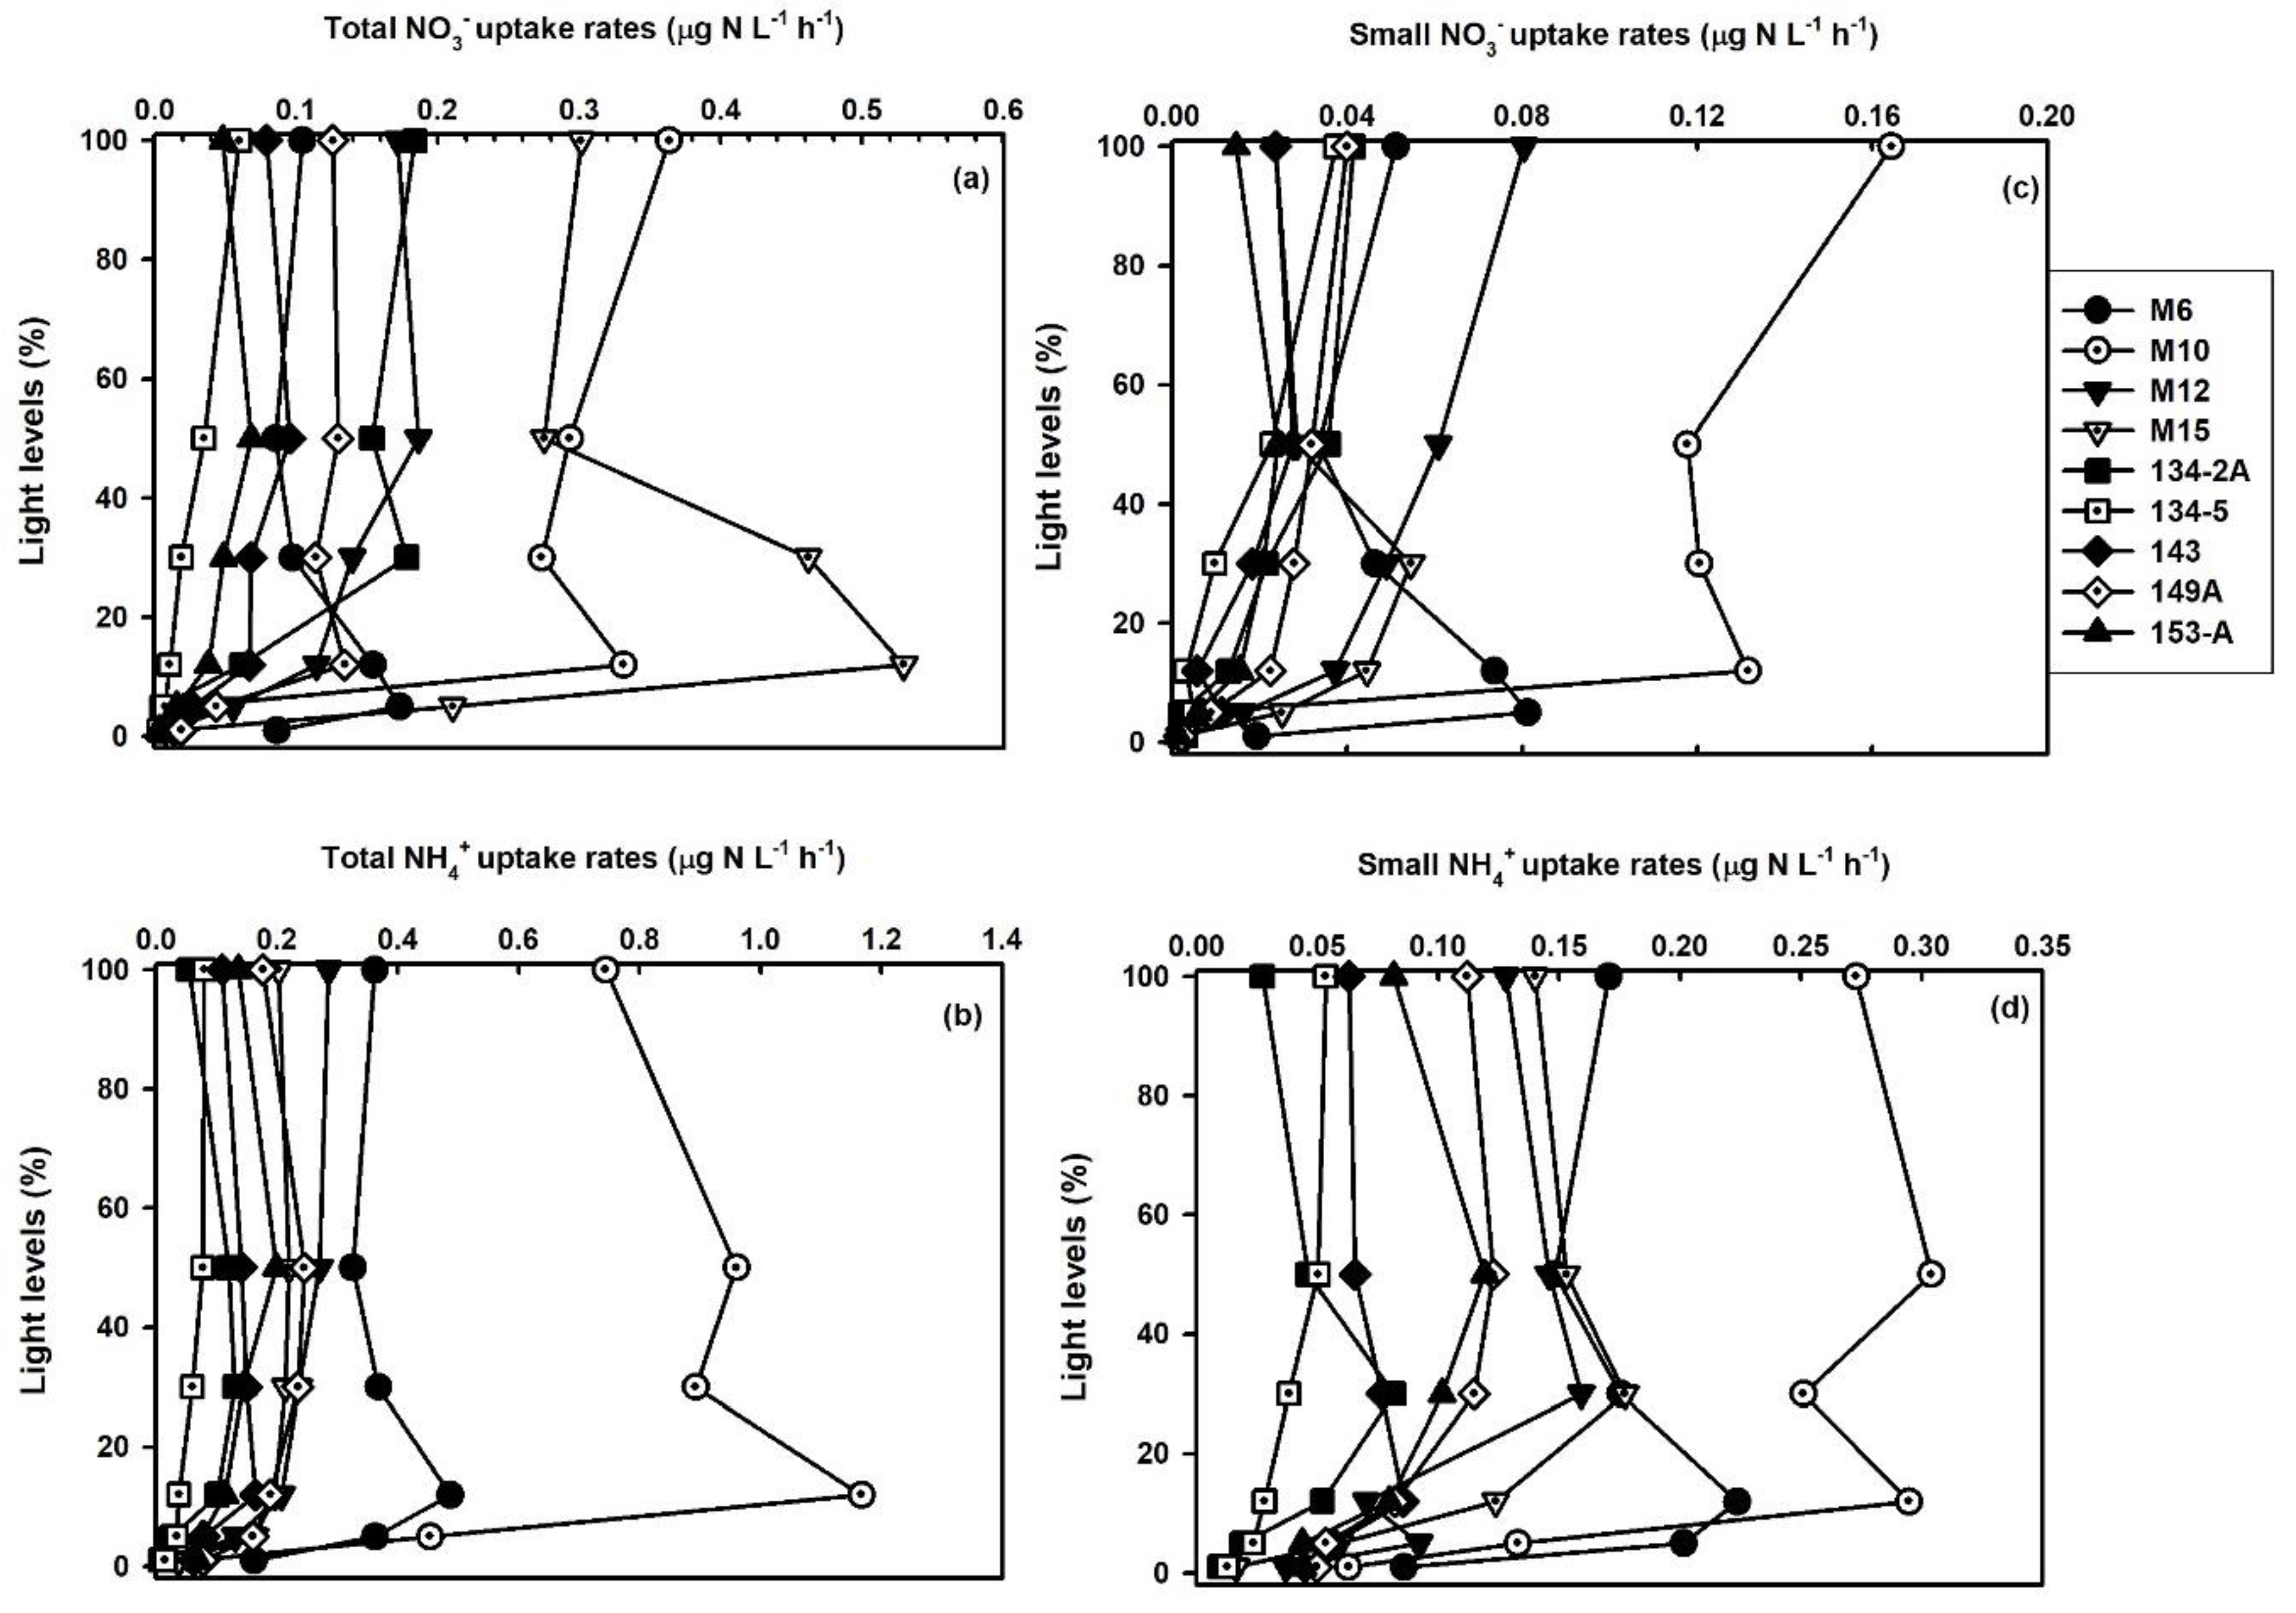
Compared to the other stations, stations M1, M4, and M11 showed relatively higher surface NO3 uptake rates, whereas surface NH4+ uptakes were higher at M4 and M11. The total NO3 uptake rates during 2015 (0.003–0.53; mean ± SD = 0.12 ± 0.12 μmol Nl−1h−1) were relatively higher than those during 2012, with relatively high values at stations M10 and M12 (Figure 4). However, total NH4+ uptake rates (0.008–1.17; mean± S.D. = 0.22 ± 0.24 μmol Nl−1h−1) did not show considerable variation between the 2012 and 2015 ranges except for station M10 (Figure 3b and Figure 4b). The small NO3 and NH4+ uptake rates during 2015 ranged between 0.001 and 0.164 (mean ± S.D. = 0.033 ± 0.036) μmol Nl−1h−1 and 0.010 and 0.304 (mean ± S.D. = 0.101 ± 0.073) μmol NL−1h−1, respectively.
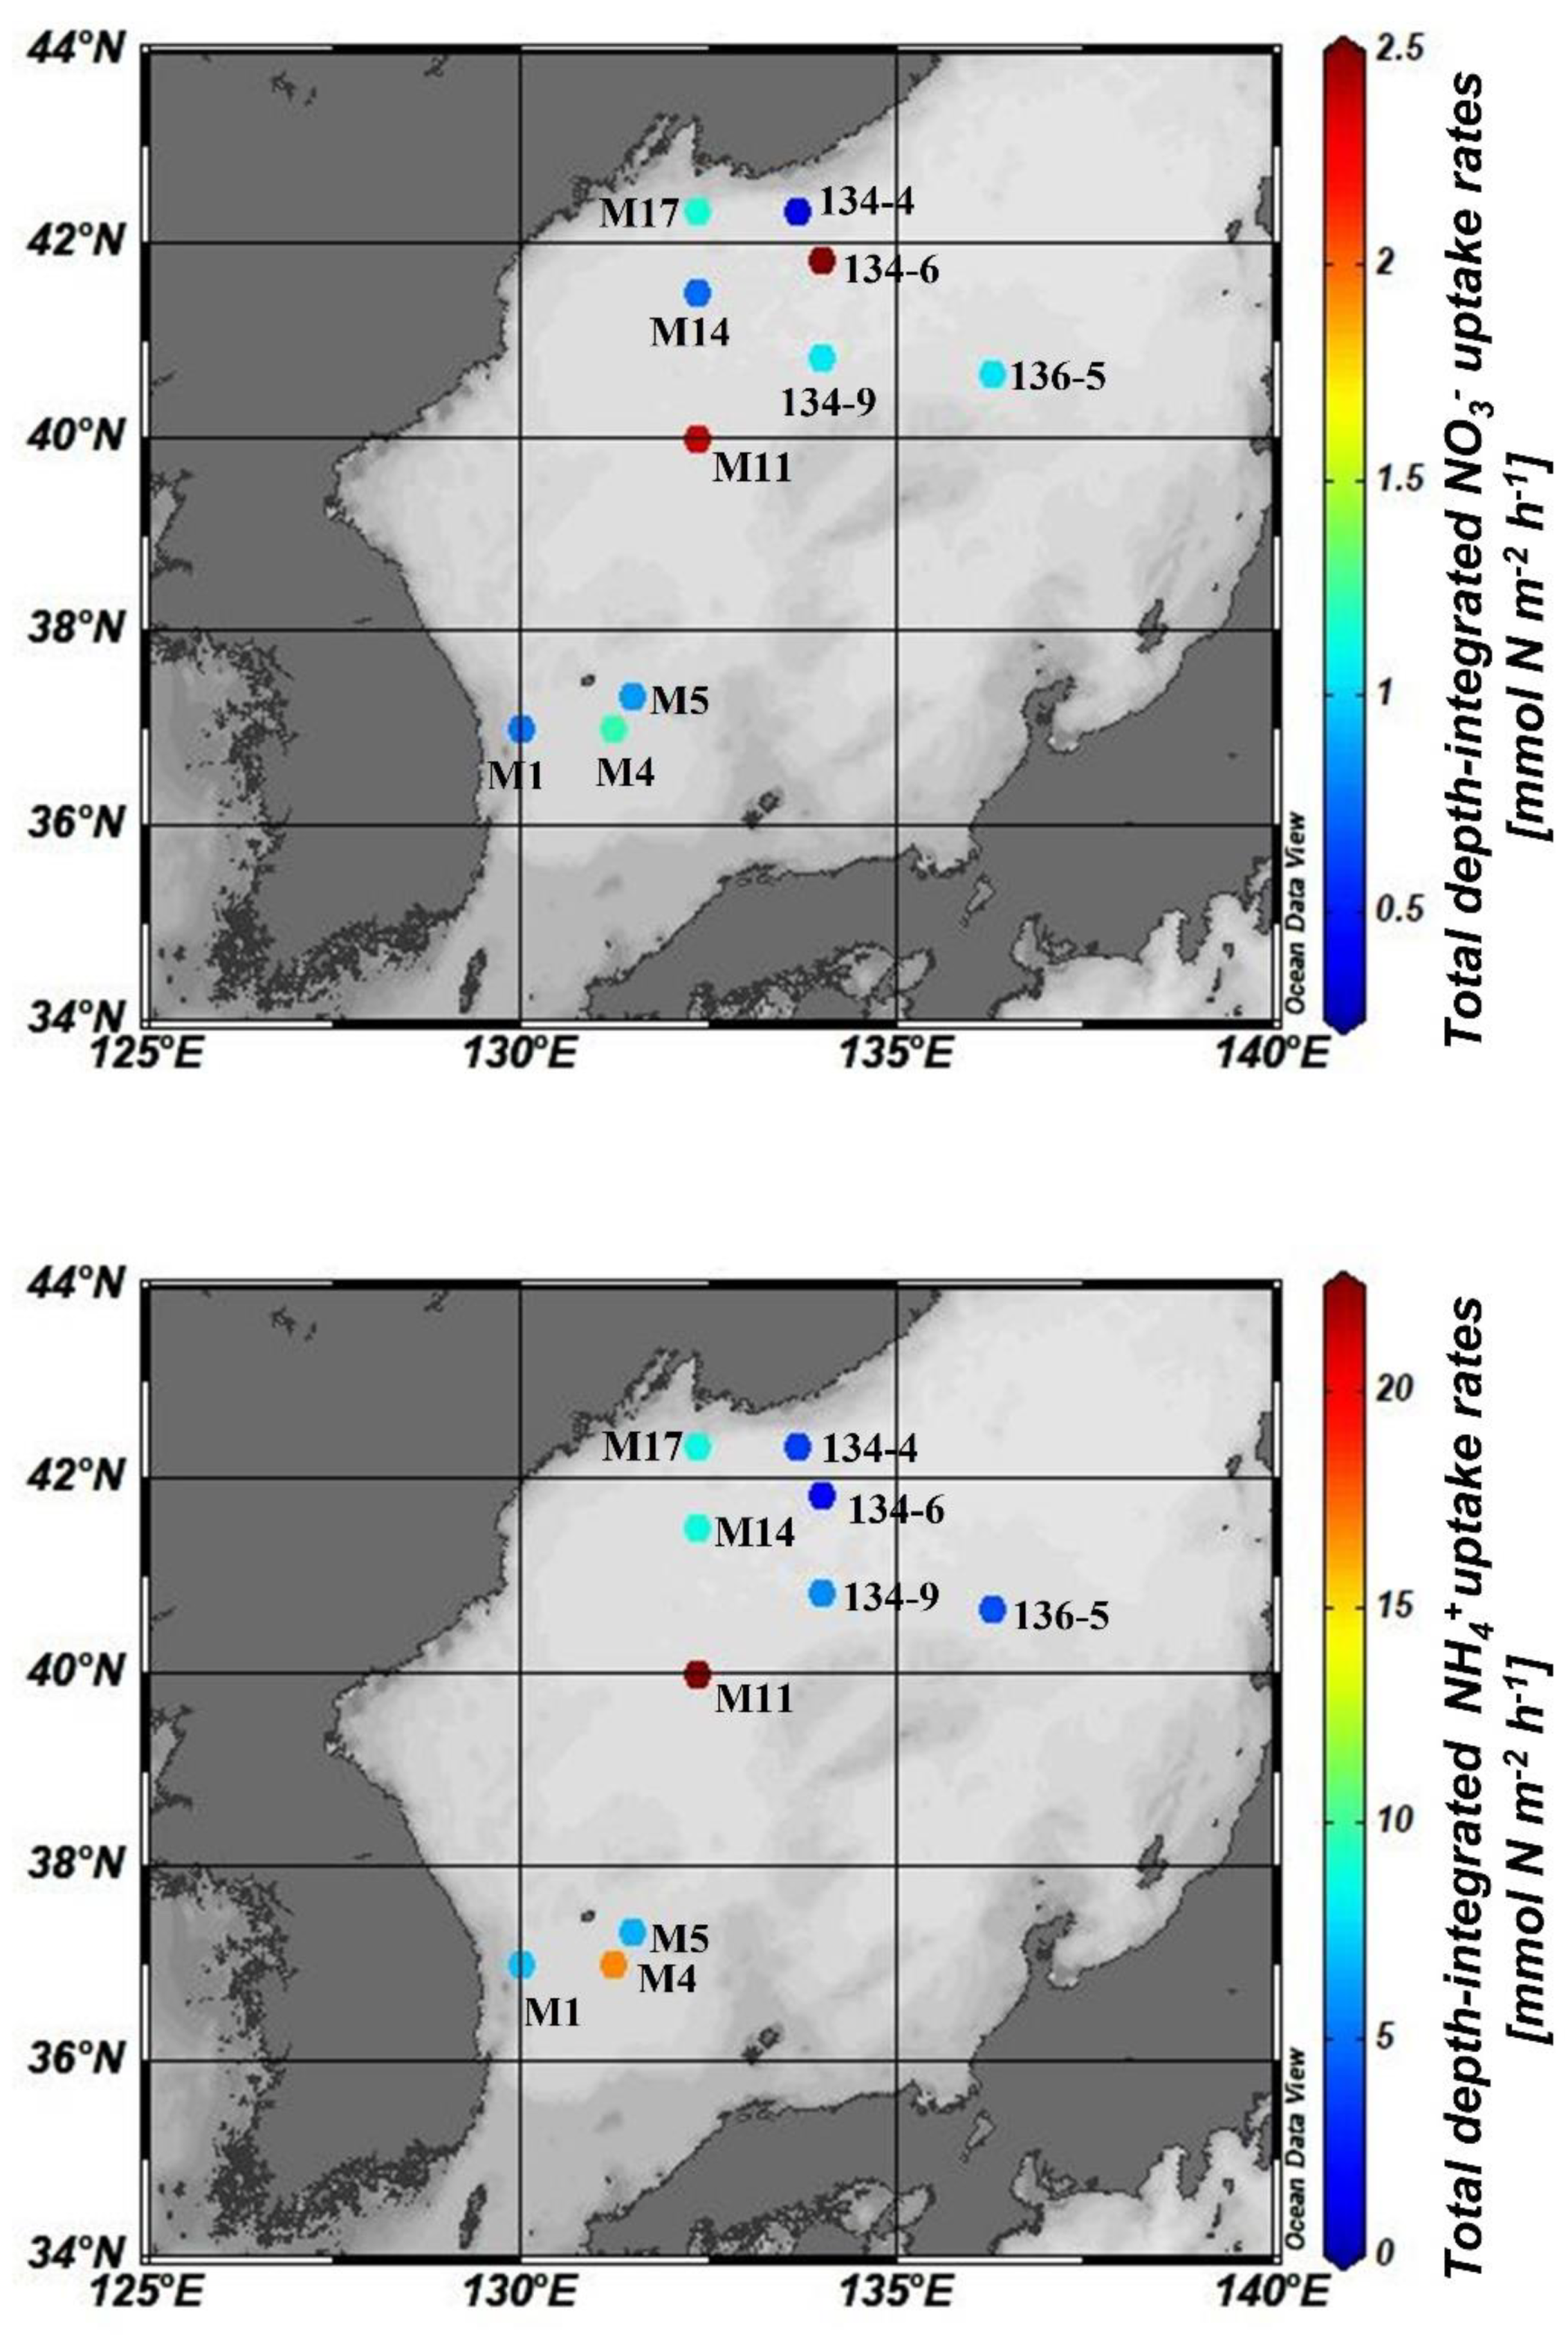
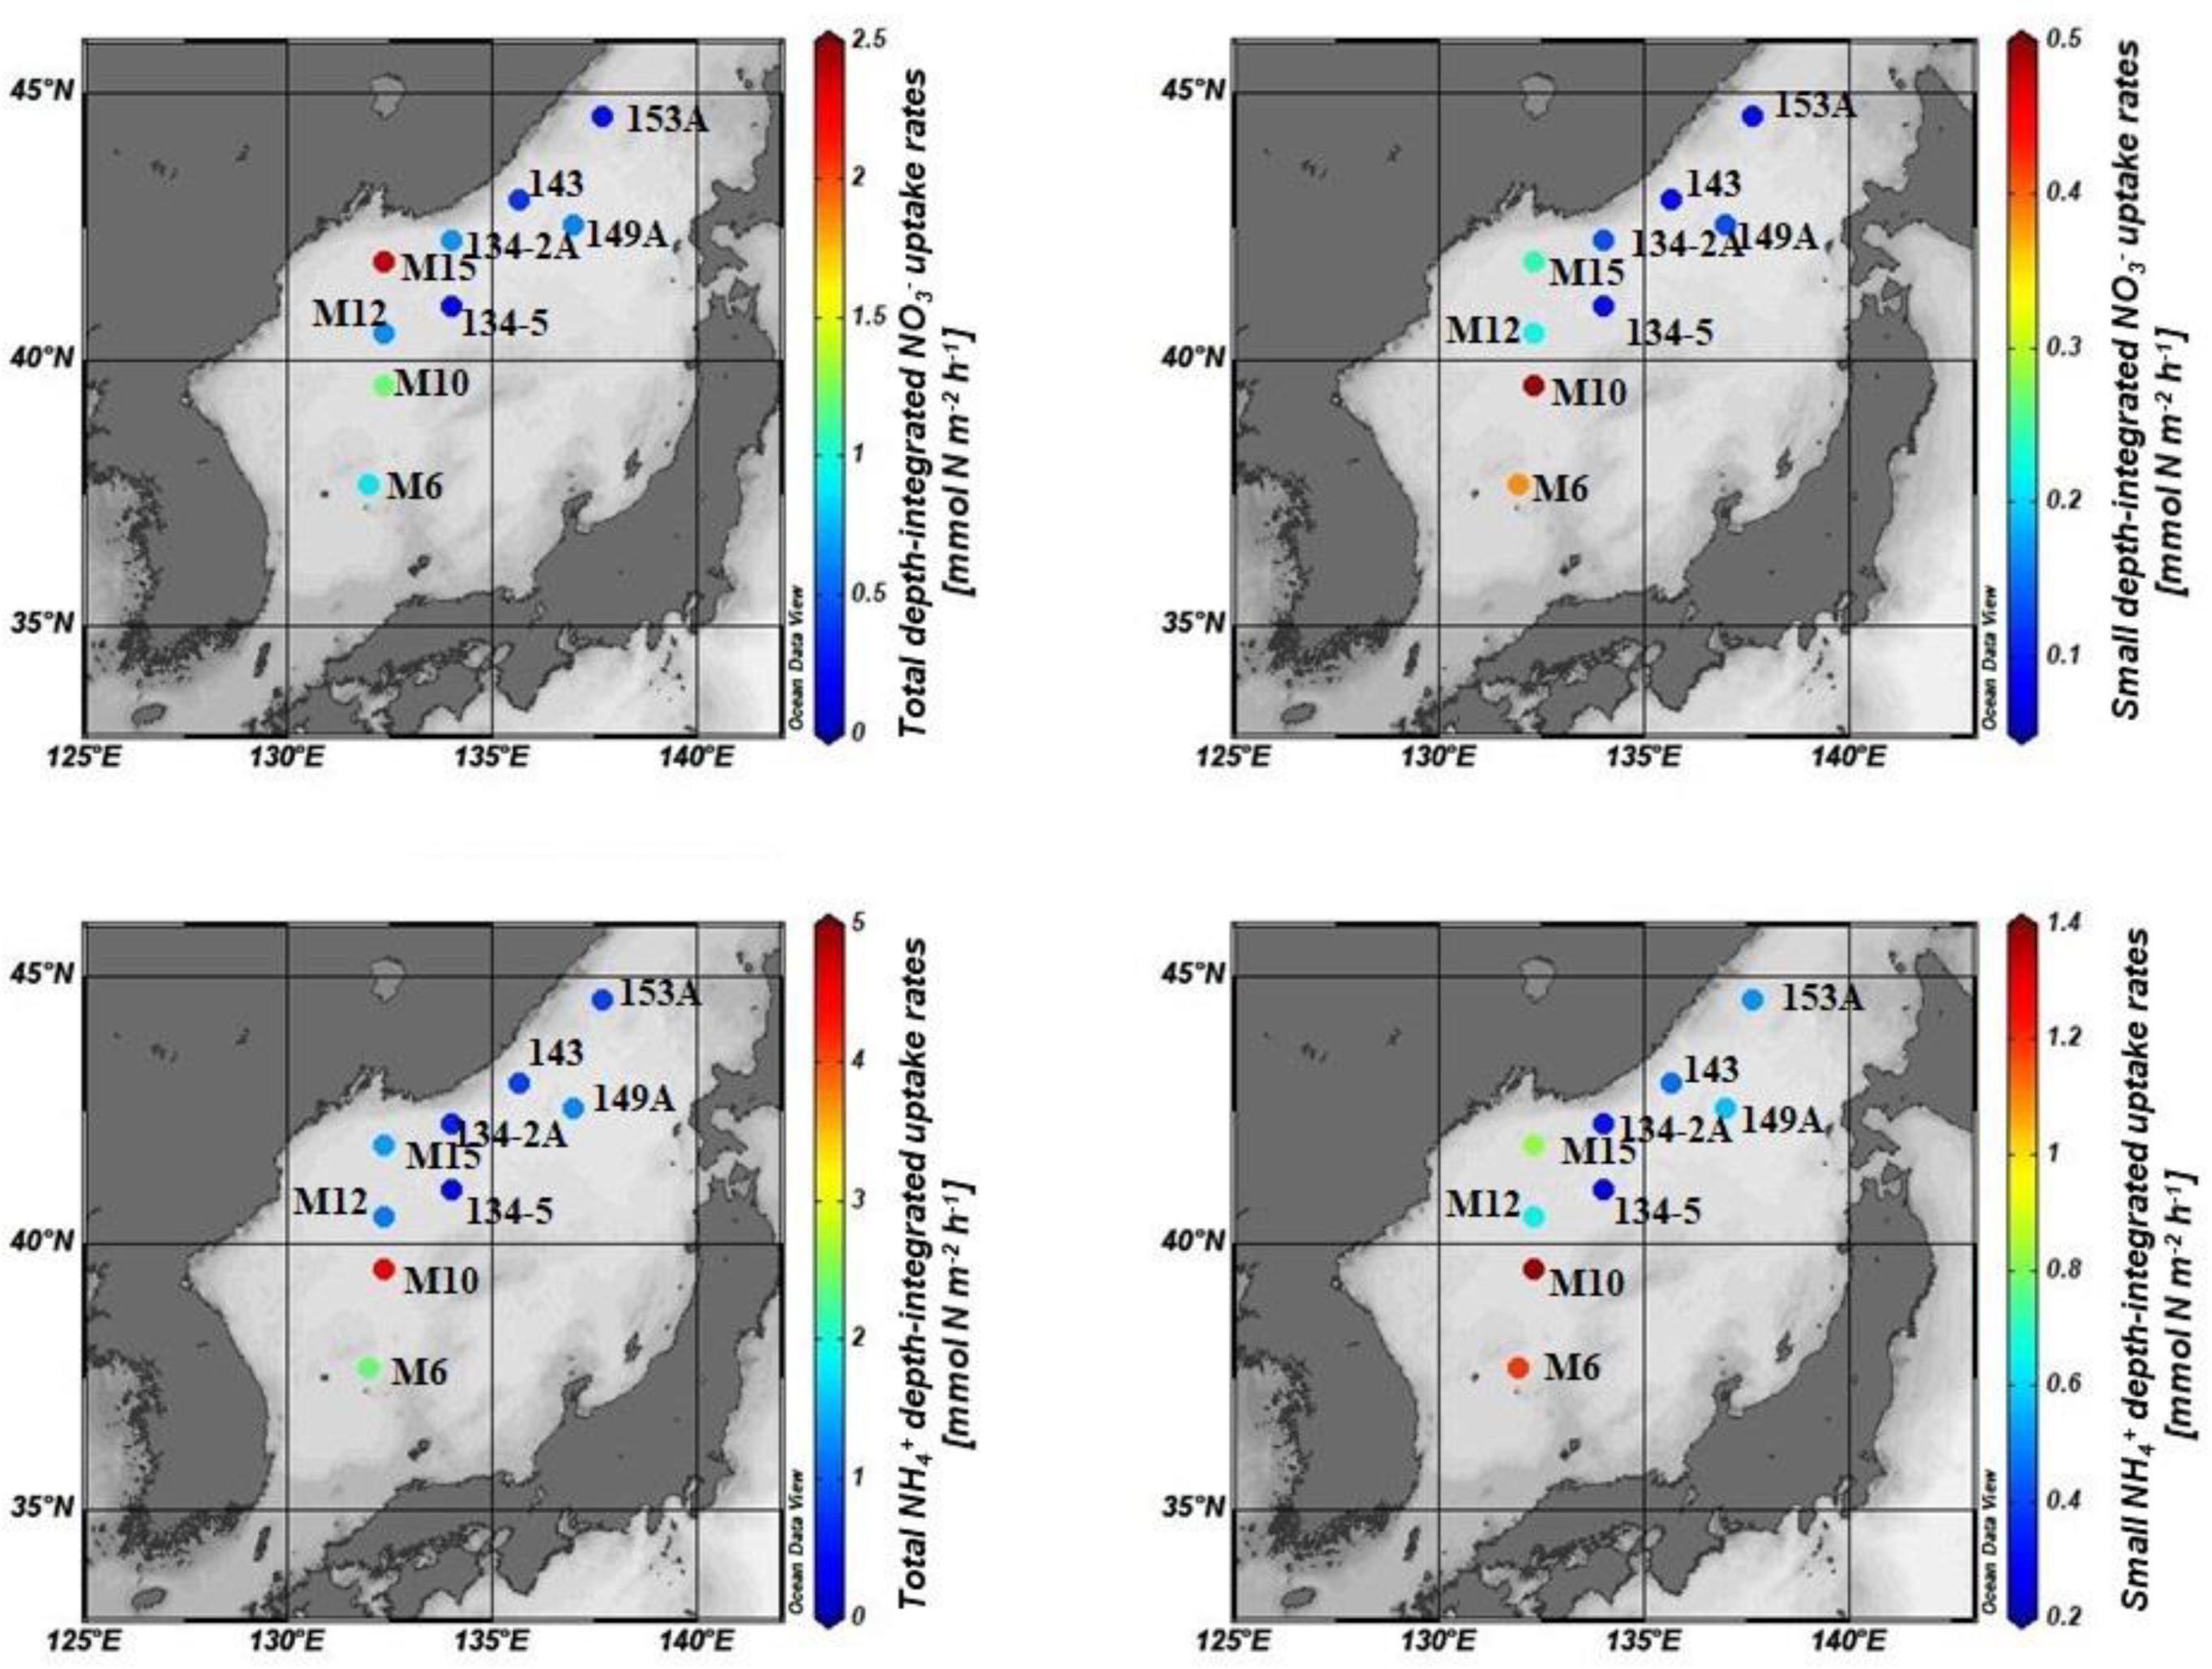
Figure 5 and Figure 6 show the spatial distribution of total depth-integrated NO3 and NH4+ uptake rates during 2012 and 2015 (total and small). The total depth-integrated uptake rates during 2012 (NO3; 0.33–2.50, NH4+; 1.68–22.4 mmol N m−2h−1) and 2015 (NO3; 0.15–2.36, NH4+; 0.39–4.57 mmol N m−2h−1; Table 2) samplings are given in Table 2. The mean±S.D. of the depth-integrated total NO3 and NH4+ uptake rates were calculated to be 1.19 ± 0.699 and 8.45 ± 6.38 mmol N m−2h−1 during 2012 and 0.783 ± 0.675 and 1.47 ± 1.30 mmol N m−2h−1, respectively, during 2015.

3.2. Factors Influencing DIN Uptake Rates in the East/Japan Sea

Various factors potentially regulate DIN assimilation in marine environments, such as temperature, nutrient availability, and chlorophyll concentrations. The East/Japan Sea is a highly dynamic water body influenced by various water masses and is pivotal for eddies and upwellings [2]. Hence, it is essential to identify the various factors governing the DIN assimilation process in this ecologically crucial marine body. Our study results suggest that the depth-integrated total NO3 uptake rates during 2012 were relatively higher than those during 2015, except for station M15. Similarly, depth-integrated NH4+ uptake rates during 2015 showed relatively lower values than those during 2012 (Figure 6). One possible explanation for this could be the higher water column temperature during the autumn in the 2012 sampling period than during the spring in 2015 sampling periods due to the differences in the seasons (Table 1). However, most of the NO3 uptake rates obtained from the individual light depth analysis during 2012 were relatively lower than those during 2015. Additionally, the individual NO3 and NH4+ uptake rates from each light depth did not significantly correlate with temperature based on the t-test (Figure not shown). Thus, the possibility of temperature as a critical control for DIN uptake rates in the East/Japan Sea during the present study period cannot be projected.
Apart from temperature, nutrient availability is also a critical factor that can control primary production and DIN uptake rates. Since various current systems and localized upwellings govern the East/Japan Sea, a deep understanding of nutrient dynamics is a must to identify the factors controlling DIN assimilation rates. Park et al. [3] reported that the frontal zone between the warm Tsushima current and the nutrient-rich cold polar current often serves as a hub for enhanced primary production. Consequently, this zone can reflect the DIN assimilation rates; hence, our present study also reported high depth-integrated NO3 and NH4+ uptake rates (2012: Stations; M15 and M10 and 2015: Stations; M11 and 134-6; Figure 5 and Figure 6).
Despite having lower nutrient concentrations (Figure 2), the surface waters showed higher NO3 and NH4+ uptake rates than deep waters. The NO3 uptake rates had higher surface values than those in the deeper waters except for stations 134-6 (Figure 3a). The insignificant linear correlations between the nutrient concentrations and their respective substrate uptake rates (figure not shown) suggest that the higher depth-integrated NO3 and NH4+ uptake rates during the 2012 sampling than during the 2015 sampling cannot be explained by nutrient influence. It suggests that the DIN assimilation rates in the East/Japan Sea during our sampling periods were primarily dependent on light conditions rather than nutrient availability. Our parallel study also reported similar results, where they reported that high primary production rates were mainly found at the surface layers [24].
Another possible reason for the higher depth-integrated NO3 and NH4+ values in the previous study than the current study could be the depth of the euphotic zone selected for sampling. The euphotic depths observed were different at almost all stations, ranging from 27 to 60 m and 30 to 43 m during 2012 and 2015, respectively. There was no significant correlation observed between euphotic depths and depth-integrated NO3 and NH4+ uptake rates during our present study based on the t-test. For example, stations M11 (2.37 mmol N m−2h−1) and 134-6 (2.50 mmol N m−2h−1) during 2012 were observed with higher depth-integrated NO3 uptake rates; their euphotic depths were 54 and 35 m, respectively. However, the station with the deeper euphotic depth (M4; 60 m) than the rest was observed with a significantly lower NO3 uptake rate. Similarly, the station (134-2A) with the deeper euphotic depth than the rest during the 2015 sampling also showed a lower depth-integrated NO3 uptake rate (0.65 mmol N m−2h−1) (Table 2). Overall, depth-integrated NH4+ uptake rates also did not show any significant relationship with euphotic depth. Hence, the variation in the euphotic depths is not a critical factor in determining the NO3 and NH4+ uptake pattern in the present study area.

3.3. Turnover Times of Nutrients

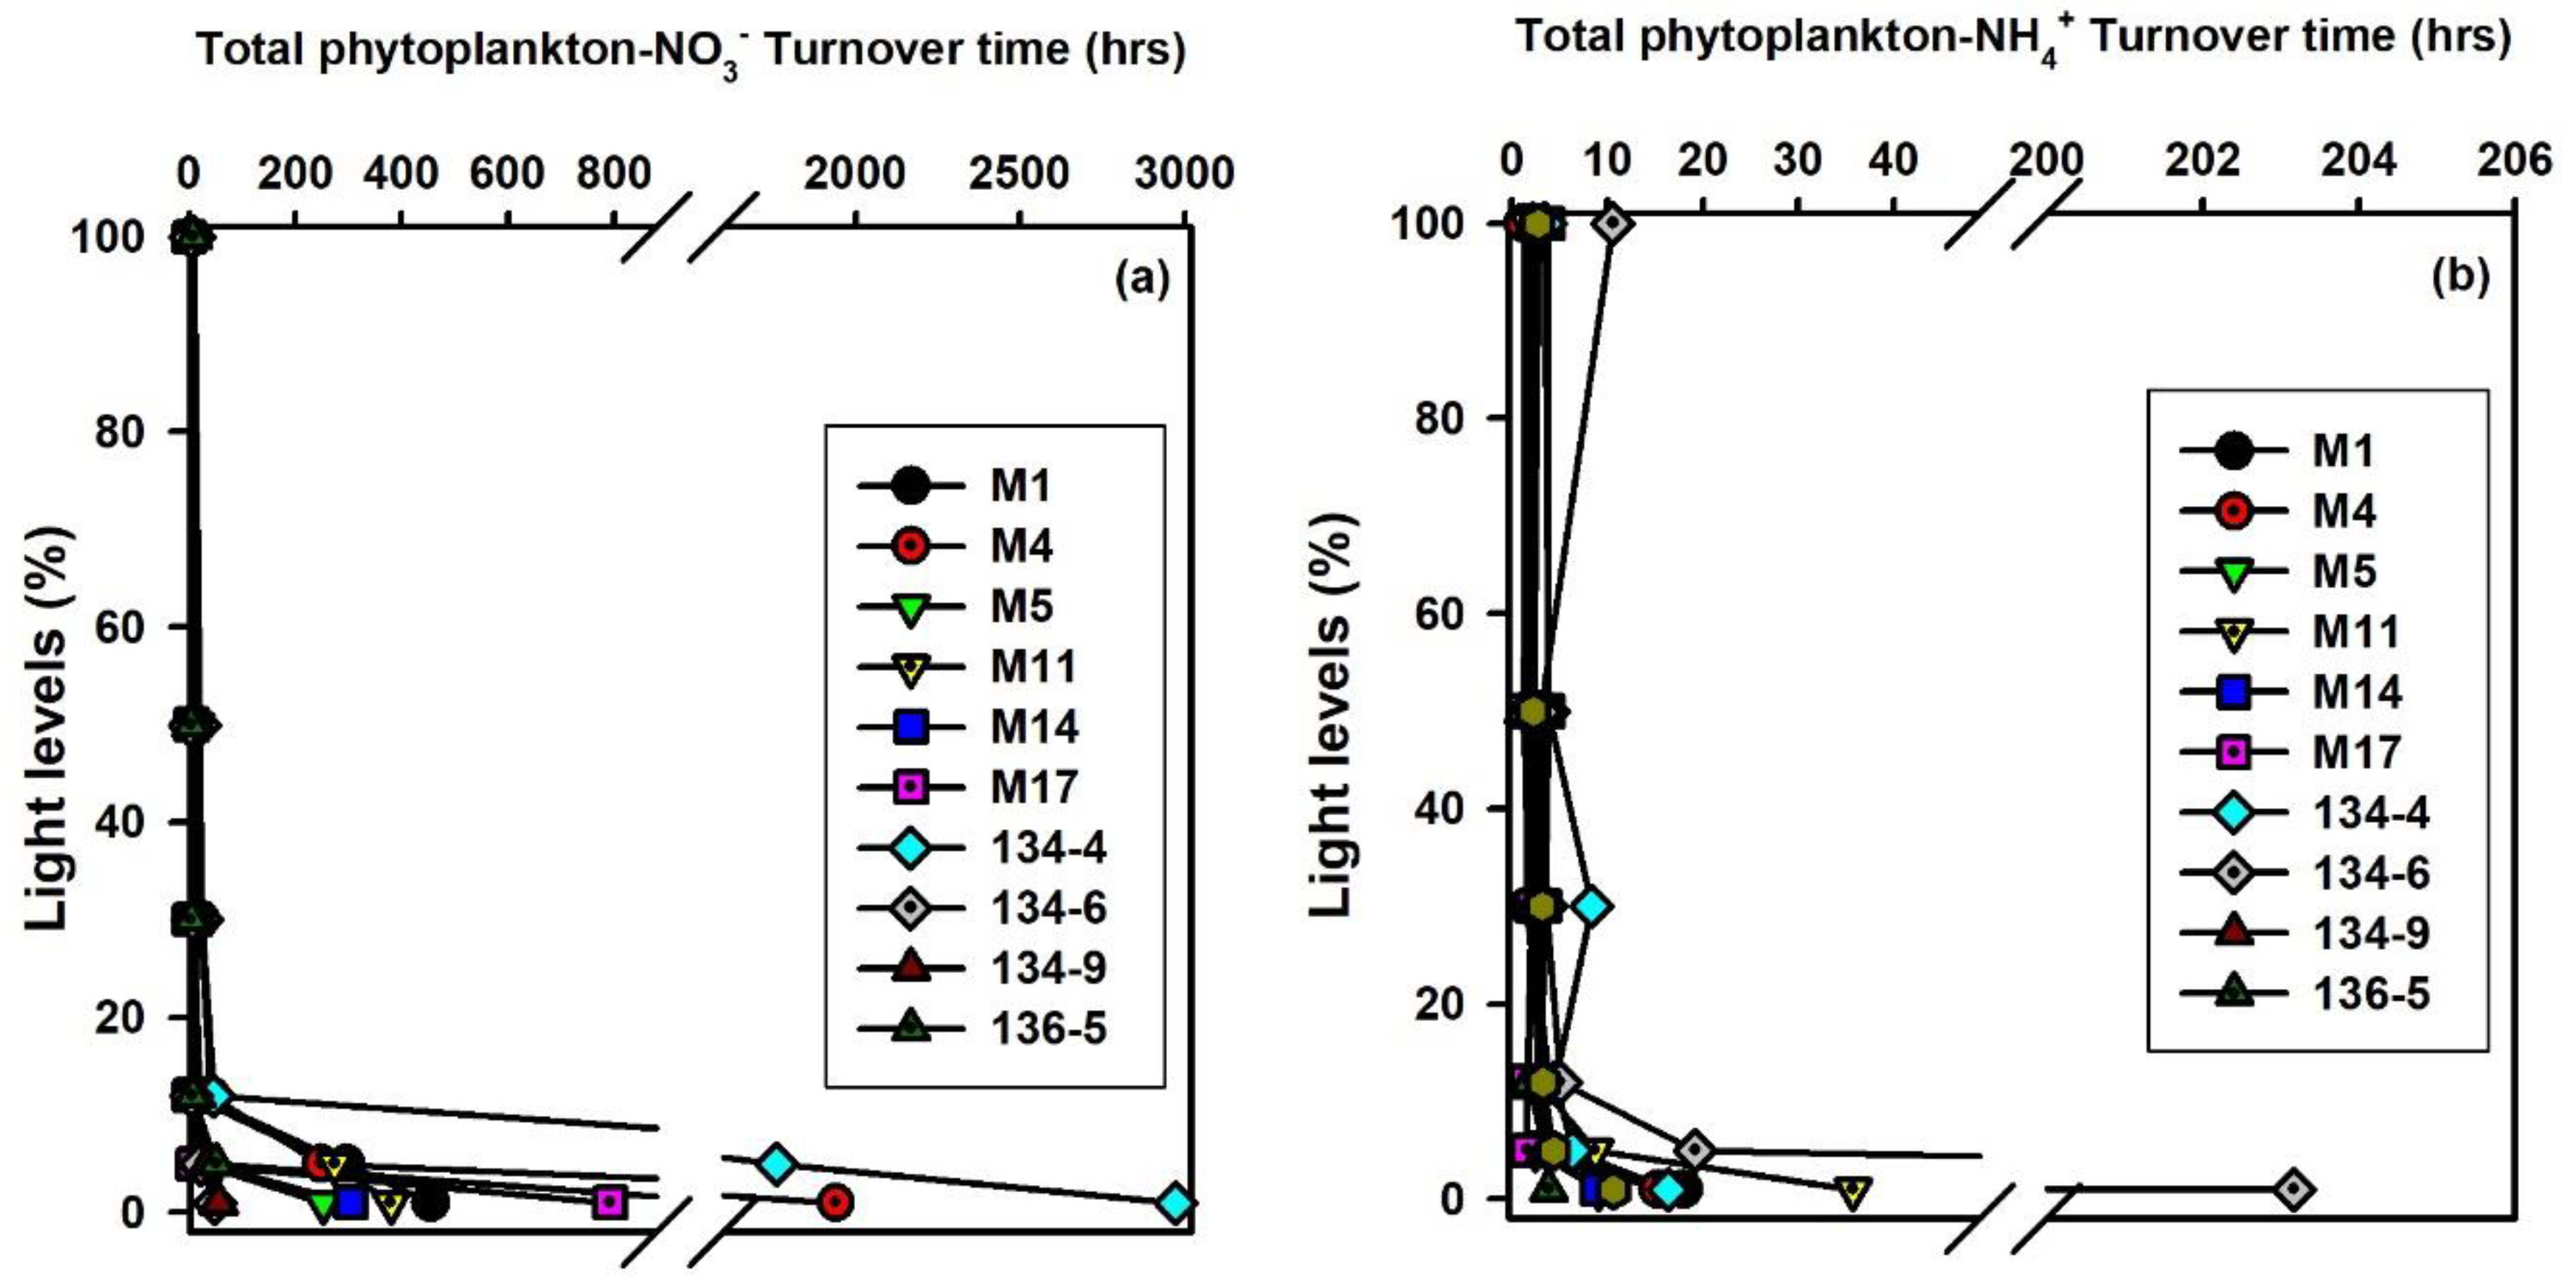
The turnover time for any nutrient substrate is a significant tool to understand how fast a substrate is consumed during its assimilation when there is no external inflow or outflow of that substrate. Technically, the turnover time estimation is performed by dividing the substrate concentrations with the corresponding uptake rates. Figure 7 and Figure 8 show the NO3 and NH4+ turnover times during the 2012 and 2015 sampling periods. The turnover times for NO3 and NH4+ substrates during the 2012 sampling, when the total phytoplankton communities are the consumers, show that the consumption of available nutrients in the euphotic zone is very fast till 12% light levels. However, the turnover times for NO3 were distinctively longer (400–3000 h) than NH4+ at depths close to euphotic depth. The low nutrient availability under sufficient light conditions can be the possible reason for the fast nutrient consumption at the surface waters compared to deeper waters with high nutrient concentrations and low light availability. The poor light availability can potentially suppress NO3 uptake, whereas NH4+ uptake can still be performed, which leads to faster turnover for NH4+ at the deep waters than that of NO3.
Similarly, 2015 sampling also appeared with a faster NH4+ turnover time faster than that of NO3 both at the water column and bottom of the euphotic zone. The differences in turnover times can be due to the relative preference for NH4+ over NO3 by the phytoplankton. However, the higher supply of the NO3 substrate in the deep waters than the NH4+ substrate can also be one reason for longer turnover times for NO3 at the deep waters. The results from a set of experiments in a tropical eutrophic estuary in India showed rapid turnover times (3–232 h for NH4+ and 7–2419 h for NO3) by the total phytoplankton communities for the DIN substrates despite high nutrient concentrations [34]. On the other note, the turnover times in the Arctic Ocean were found to be long despite the low nutrient concentrations [34]. It is also reported that the inhibition of phytoplankton communities for NO3 uptake under sufficient NH4+ concentrations is a widely known phenomenon as they prefer the lighter NH4+ over the heavier NO3 substrate [34,35,36]. Figure 8b,d show the NO3 and NH4+ turnover times during 2015 for small phytoplankton communities. Except for the stations 134-2A and 134-5, the small and total phytoplankton turnover times were observed to have a similar range. These two stations showed significantly long turnover times throughout the euphotic zone. The higher NO3 concentrations and lower NO3 uptake rates by the small phytoplankton communities in the stations 134-2A and 134-5 compared to other stations might be the possible reason. However, such a difference was not observed in the case of NH4+ turnover times.

3.4. Contribution of Small Phytoplankton to Total Nitrogen Uptake

Experimental and theoretical investigations on small phytoplankton communities have reported that the small phytoplankton possesses higher nutrient uptake rates per unit of biomass and lower half-saturation constants than large phytoplankton due to their higher surface area to volume ratios [37,38,39]. Therefore, the lower minimum cellular metabolic requirement assists small phytoplankton to survive in nutrient-poor environments [40,41]. Several investigations were conducted globally on this topic, and they reported that the small phytoplankton contribution to the total annual carbon and DIN assimilations generally varied between 20 and 65% [22,23,24,42,43]. The MODIS-derived data in the Ulleung Basin in the East/Japan Sea from 2003 to 2012 showed that the annual contribution of small phytoplankton communities varies between 19.6% and 28.4%, with an average of 23.6% (SD = ±8.1%) [23], which suggests that the large phytoplankton communities are the major contributors to primary production in the Ulleung Basin.
Basin-wide studies suggest that small phytoplankton contributions mainly control primary production in the Japan Basin and Yamato Basin at 85% and 82%, respectively. In contrast, the Ulleung Basin has a smaller phytoplankton contribution (35%) [34]. Lee et al. [24] (our parallel study) also reported a similar range of small phytoplankton contributions to the total primary production in the Ulleung Basin during 2015. Lee et al. [24] also reported that the contributions of small phytoplankton (<2 μm) to the total carbon uptake rates have significant spatial and temporal variations. They found remarkable differences in small phytoplankton contributions during 2012 (60.6%) and 2015 (34.1%) samplings. Unfortunately, the data for small phytoplankton uptake is unreliable due to lack of enough material for the stable isotope measurements; the contributions to the total NO3 and NH4+ uptake rates during 2015 were only taken for the present discussion (Table 2).
The contributions of small phytoplankton to the total NO3 and NH4+ uptake rates during 2015 were 32.6 and 54.2%, respectively, which indicate that small phytoplankton is not the dominant contributor to the total NO3 assimilation in the East/Japan Sea. The sampling period during 2015 was before the spring bloom, which is reported to be dominated by large cell diatoms [9,24]. Interestingly, small phytoplankton cells significantly contributed to the NH4+ uptake rates in comparison to large phytoplankton cells. Previous studies have reported a clear preference for NO3 by large phytoplankton cells [29,44,45,46,47], where small cells depend primarily on regenerated nitrogen, such as NH4+, e.g., [36,45,46,47]. However, large cell phytoplankton is highly dependent on the threshold availability of the NO3 substrate [48,49], where large cell dominance was observed when NO3 concentrations were above 3.5 μM. A similar dependency of large cell phytoplankton on NO3 availability was reported by Tamigneaux et al. [50] in nearshore Baie des Chaleurs, Canada. Interestingly, Wilkerson et al. [51] observed much higher threshold NO3 concentrations (10–12 μM) than those above, where the percent contributions by the large cells to PON and Chl-a were always more than 50% [52]. In contrast, the present study showed that the station with the highest NO3 concentrations (134-5; close to 10 μM) and lowest NH4+ concentrations showed high contributions (59% and 69%) of small phytoplankton to the total NO3 and NH4+ uptake rates, respectively.
Notably, the high NO3 concentrations in oligotrophic waters primarily depend on upwelling that brings NO3 rich bottom waters to the surface. A few studies were conducted to investigate the alteration in phytoplankton species composition in response to upwelled cold water in the southwestern East/Japan Sea [52]. Kim et al. [52] also reported that the phytoplankton abundance and the proportion of large phytoplankton were higher when there was upwelling-induced nutrient-rich cold water than when there was strong vertical stratification. In general, these studies point toward the influence of nutrient-rich upwelled bottom water on the abundance and composition of phytoplankton communities in the East/Japan Sea. However, a few investigations are available on the C and DIN uptake rates by small and large phytoplankton and their response to vertical mixing due to upwelling in the East/Japan Sea [24]. The present study did not estimate the contribution of bacteria to the total DIN uptake rates; therefore, the role of bacteria in DIN assimilation and dissolved organic nitrogen as a nitrogen source could not be assessed.

3.5. Impact of Small Phytoplankton on the Total DIN Assimilation Rates

Observational and model studies on the impact of increasing small phytoplankton uptake suggest that primary productivity will decrease if small phytoplankton becomes the predominant species [24,53,54,55,56]. Since our study did not include species identification and abundance, the discussion on species diversity is limited in this regard. However, a few studies recorded the species identification and abundance from the East/Japan Sea, although the study regions are slightly different from the present study [34,56]. The reported studies suggest that the overall dominant groups could be diatoms with some large spatial variations in our study area during spring, summer, and fall seasons [57]. Prymenesiophytes were the second dominant group during spring and fall seasons, and cyanobacterial abundance was very low over seasons [57].
Several studies reported that, when large phytoplankton communities dominate, the primary productivity obtained will be higher than when small phytoplankton dominate [58,59,60,61]. Similarly, Lee et al. [24] found a significant negative relationship between total primary productivity and the small phytoplankton contribution in the East/Japan Sea. However, few studies have evaluated the influence of small phytoplankton contributions on total DIN uptake rates. Previously, Wilkerson et al. [51] also suggested that, in comparison to the dominance of small cells (<5 μm), the dominance of large phytoplankton cells > 5 μm can potentially lead to higher C and DIN assimilation rates. The present study also observed a significant negative relationship (R2 = 0.77, t-test; p <0.01) of total NH4+ uptake rates with the increasing small phytoplankton contribution. The total NO3 uptake rates also showed a negative correlation of R2 = 0.30 with a p-value <0.05 (t-test) with the contribution of small phytoplankton (Figure 9). The possible reason for the relatively high significance level in the correlation between the small phytoplankton contribution and the total NH4+ than that with NO3 uptake rates during the present study could have been due to the dominance of NH4+ uptake since NH4+ is the most preferred substrate [30].
Although the small phytoplankton communities prefer NH4+ as the significant substrate, the high contributions of small phytoplankton to the total NH4+ uptake rates did not appear to be a supporting element in sustaining the high total NH4+ uptake rates in the East/Japan Sea during the present study. The results suggest that, if the small phytoplankton species are the dominant species in the future due to global warming, then the East/Japan Sea may have decreased NH4+ assimilation rate compared to the present time. The possibility of a decrease in NO3 uptake under a small phytoplankton-dominant environment in the East/Japan Sea cannot be neglected. The main consumers of the NO3 substrate are large cell phytoplankton such as diatoms. Specifically, the water column stratification introduced by global warming can lead to small cell phytoplankton dominance. The abundance and uptake of large cell phytoplankton may reduce as the availability of NO3 reduce in the absence of upwelling under thermal stratification [10,15,62]. Additionally, small cell phytoplankton preferentially assimilates regenerated nutrient forms such as NH4+, whose availability is not primarily dependent on upwelling. Therefore, total DIN assimilation can be widely impacted by its rates, processes, and fluxes under ongoing warming conditions in the East/Japan Sea.
In general, studies on the abundance, size, and assimilation rates of phytoplankton communities under in situ and simulated conditions suggest that global warming phenomena can potentially reduce DIN assimilation rates [10,62]. These studies also suggest that the uptake efficiency of small cell phytoplankton is relatively lower than that of large cell phytoplankton. Hence, there will be a decrease in total primary production and DIN assimilation rates in the global oceans if a condition of small phytoplankton dominance occurs [11]. Since the functioning of the marine food web is entirely dependent on the capability of phytoplankton communities to assimilate carbon and DIN, any alteration that affects their efficiency would significantly redefine the food distribution in the entire ecosystem. Therefore, it is highly essential to record factors influencing phytoplankton size, abundance, and assimilation rates in global oceans.

4. Conclusions

The present study estimated the DIN uptake rates by total and small phytoplankton (<2 μm) in the East/Japan Sea as a part of the Korea–Russia joint expeditions during 2012 and 2015. The study used the dual isotopic tracer technique to estimate the DIN uptake rates. The primary objectives were to understand the spatiotemporal variations in the DIN assimilation rates by total and small phytoplankton and their contribution to the total DIN uptake rates. The study also aimed to understand the various environmental factors that play vital roles in governing nitrogen dynamics in the East/Japan Sea. There were no significant correlations between environmental parameters and the DIN uptake rates observed during the present study; however, the higher DIN uptake rates in the surface layers than in the bottom waters suggest the potential influence of light conditions. The results show that 10.24 to 59.36% and 30.21 to 68.55% of the total NO3 and NH4+ uptake rates are contributed by small phytoplankton. The results from the present study found that there is a negative correlation between the depth-integrated NH4+ uptake rates and the small phytoplankton contribution, which suggests the adverse effect of increasing the small phytoplankton population as a result of global warming on the nitrogen assimilation process. In general, the results from the present study provide significant information on the potential for reduced DIN assimilation conditions in the East/Japan Sea if the small phytoplankton abundance increases as a result of global warming. Since the East/Japan Sea is an economically and ecologically important ecosystem, it is highly relevant to have a set of monitoring experiments on its potential to assimilate carbon and nitrogen under varying environmental conditions.

Author Contributions

Conceptualization, P.S.B. and S.H.L.; data curation, P.S.B., J.H.L. (Jae Hyung Lee) and K.K.; formal analysis, P.S.B., J.J.K., H.K.J., H.J., J.H.L. (Jae Hyung Lee), J.H.L. (Jang Han Lee), J.W.P. and K.K.; investigation, H.K.J., H.J., J.H.L. (Jae Hyung Lee), J.H.L. (Jang Han Lee), J.W.P. and K.K.; methodology, H.K.J., H.J., J.H.L. (Jae Hyung Lee), J.H.L. (Jang Han Lee), J.W.P., K.K. and S.H.L.; validation, J.H.L. (Jae Hyung Lee), H.C.K.; visualization, P.S.B.; writing—original draft, P.S.B. and S.H.L.; writing—preview & editing, P.S.B., H.C.K. and S.H.L. All authors have read and agreed to the published version of the manuscript.

Funding

This research was funded by the Ministry of Oceans and Fisheries, Korea (project: Long-term change in structure and function in marine ecosystems of Korea; 20140507) and the National Institute of Fisheries Science (NIFS; R2020048).

Acknowledgments

The authors thank the cruise crew members and other scientific staff for their support during sampling and lab work. The authors also would like to thank the anonymous reviewers. We also thank the Ministry of Oceans and Fisheries, Korea (project: Long-term change in structure and function in marine ecosystems of Korea; 20140507) and the National Institute of Fisheries Science (NIFS; R2020048) for the financial support for the present study.

Conflicts of Interest

The authors declare no conflict of interest.

References

  1. Kawai, H. Transition of current images in the Japan Sea. In Tsushima Warm Current—Ocean Structures and Fishery; The Japanese Society of Fisheries Science: Tokyo, Japan, 1974; pp. 7–26. [Google Scholar]
  2. Sorokin, Y.I. The heterotrophic phase of plankton succession in the Japan Sea. Mar. Biol. 1977, 41, 107–117. [Google Scholar] [CrossRef]
  3. Park, K.-A.; Ullman, D.S.; Kim, K.; Chung, J.Y.; Kim, K.-R. Spatial and temporal variability of satellite-observed Subpolar Front in the East/Japan Sea. Deep. Sea Res. Part I Oceanogr. Res. Pap. 2007, 54, 453–470. [Google Scholar] [CrossRef]
  4. Kang, Y.S.; Kim, J.Y.; Kim, H.G.; Park, J.H. Long term changes in zooplankton and its relationship with squid, Todarodes pacificus, catch in the East/Japan Sea. Fish. Oceanogr. 2002, 11, 337–346. [Google Scholar] [CrossRef]
  5. Kim, D.; Yang, E.J.; Kim, K.H.; Shin, C.-W.; Park, J.; Yoo, S.; Hyun, J.-H. Impact of an anticyclonic eddy on the summer nutrient and chlorophyll a distribution in the Ulleung Basin, East Sea (Japan Sea). ICES J. Mar. Sci. 2011, 69, 23–29. [Google Scholar] [CrossRef] [Green Version]
  6. Lim, J.-H.; Son, S.; Park, J.-W.; Kwak, J.H.; Kang, C.-K.; Son, Y.B.; Kwon, J.-N.; Lee, S.H. Enhanced biological activity by an anticyclonic warm eddy during early spring in the East Sea (Japan Sea) detected by the geostationary ocean color satellite. Ocean Sci. J. 2012, 47, 377–385. [Google Scholar] [CrossRef]
  7. Hyun, J.-H.; Kim, D.; Shin, C.-W.; Noh, J.-H.; Yang, E.-J.; Mok, J.-S.; Kim, S.-H.; Kim, H.-C.; Yoo, S. Enhanced phytoplankton and bacterioplankton production coupled to coastal upwelling and an anticyclonic eddy in the Ulleung basin, East Sea. Aquat. Microb. Ecol. 2008, 54, 45–54. [Google Scholar] [CrossRef]
  8. Yoo, S.; Park, J. Why is the southwest the most productive region of the East Sea/Sea of Japan? J. Mar. Syst. 2009, 78, 301–315. [Google Scholar] [CrossRef]
  9. Kwak, J.H.; Lee, S.H.; Park, H.J.; Choy, E.J.; Jeong, H.D.; Kim, K.R.; Kang, C.-K. Monthly measured primary and new productivities in the Ulleung Basin as a biological “hot spot” in the East/Japan Sea. Biogeosciences 2013, 10, 4405–4417. [Google Scholar] [CrossRef] [Green Version]
  10. Joo, H.; Park, J.W.; Son, S.; Noh, J.-H.; Jeong, J.-Y.; Kwak, J.H.; Saux-Picart, S.; Choi, J.H.; Kang, C.-K.; Lee, S.H. Long-term annual primary production in the Ulleung Basin as a biological hot spot in the East/Japan Sea. J. Geophys. Res. Ocean. 2014, 119, 3002–3011. [Google Scholar] [CrossRef] [Green Version]
  11. Thomas, M.K.; Kremer, C.T.; Klausmeier, C.A.; Litchman, E. A Global Pattern of Thermal Adaptation in Marine Phytoplankton. Science 2012, 338, 1085–1088. [Google Scholar] [CrossRef] [Green Version]
  12. Bhavya, P.S.; Lee, J.H.; Lee, H.W.; Kang, J.J.; Lee, J.H.; Lee, D.; An, S.H.; Stockwell, D.A.; Whitledge, T.E.; Lee, S.H. First in situ estimations of small phytoplankton carbon and nitrogen uptake rates in the Kara, Laptev, and East Siberian seas. Biogeosciences 2018, 15, 5503–5517. [Google Scholar] [CrossRef] [Green Version]
  13. Chiba, S.; Saino, T. Variation in mesozooplankton community structure in the East/Japan Sea (1991–1999) with possible influence of the ENSO scale climatic variability. Prog. Oceanogr. 2003, 57, 317–339. [Google Scholar] [CrossRef]
  14. Zhang, C.I.; Lee, J.B.; Young, I.S.; Yoon, S.C.; Kim, S. Variations in the abundance of fisheries resources and ecosystem structure in the East/Japan Sea. Prog. Oceanogr. 2004, 61, 245–265. [Google Scholar] [CrossRef]
  15. Chiba, S.; Batten, S.; Sasaoka, K.; Sasai, Y.; Sugisaki, H. Influence of the Pacific Decadal Oscillation on phytoplankton phenology and community structure in the western North Pacific. Geophys. Res. Lett. 2012, 39, L15603. [Google Scholar] [CrossRef]
  16. Li, W.K.W.; McLaughlin, F.A.; Lovejoy, C.; Carmack, E.C. The smallest algae thrive as the Arctic Ocean freshens. Science 2009, 326, 539. [Google Scholar] [CrossRef] [Green Version]
  17. Yun, M.S.; Whitledge, T.E.; Stockwell, D.; Son, S.H.; Lee, J.H.; Park, J.W.; Lee, D.B.; Park, J.; Lee, S.H. Primary production in the Chukchi Sea with potential effects of freshwater content. Biogeosciences 2016, 13, 737–749. [Google Scholar] [CrossRef] [Green Version]
  18. Kim, K.-R.; Kim, K.; Kang, D.-J.; Park, S.Y.; Park, M.-K.; Kim, Y.-G.; Min, H.S.; Min, D. The East Sea (Japan Sea) in Change: A Story of Dissolved Oxygen. Mar. Technol. Soc. J. 1999, 33, 15–22. [Google Scholar] [CrossRef]
  19. Kim, K.; Kim, K.-R.; Min, D.-H.; Volkov, Y.; Yoon, J.-H.; Takematsu, M. Warming and structural changes in the East (Japan) Sea: A clue to future changes in global oceans? Geophys. Res. Lett. 2001, 28, 3293–3296. [Google Scholar] [CrossRef]
  20. Kang, D.J.; Park, S.; Kim, Y.G.; Kim, K.; Kim, K.-R. A moving-boundary box model (MBBM) for oceans in change: An application to the East/Japan Sea. Geophys. Res. Lett. 2003, 30, 1299. [Google Scholar] [CrossRef]
  21. Chiba, S.; Aita, M.N.; Tadokoro, K.; Saino, T.; Sugisaki, H.; Nakata, K. From climate regime shifts to lower-trophic level phenology: Synthesis of recent progress in retrospective studies of the western North Pacific. Prog. Oceanogr. 2008, 77, 112–126. [Google Scholar] [CrossRef]
  22. Lee, S.H.; Son, S.; Dahms, H.-U.; Park, J.W.; Lim, J.-H.; Noh, J.-H.; Kwon, J.-I.; Joo, H.T.; Jeong, J.Y.; Kang, C.-K. Decadal changes of phytoplankton chlorophyll-a in the East Sea/Sea of Japan. Oceanology 2014, 54, 771–779. [Google Scholar] [CrossRef]
  23. Joo, H.T.; Sun, S.; Park, J.W.; Kang, J.J.; Jeong, J.-Y.; Lee, C.I.; Kang, C.K.; Lee, S.H. Long-term pattern of primary productivity in the East/Japan Sea based on ocean color data derived from MODIS-aqua. Remote Sens. 2016, 8, 25. [Google Scholar] [CrossRef] [Green Version]
  24. Lee, S.H.; Joo, H.; Lee, J.H.; Lee, J.H.; Kang, J.J.; Lee, H.W.; Lee, D.; Kang, C.-K. Seasonal carbon uptake rates of phytoplankton in the northern East/Japan Sea. Deep Sea Res. Part II Top. Stud. Oceanogr. 2017, 143, 45–53. [Google Scholar] [CrossRef]
  25. French, R.H.; Cooper, J.J.; Vigg, S. Secchi Disc Relationships. J. Am. Water Resour. Assoc. 1982, 18, 121–123. [Google Scholar] [CrossRef]
  26. Lee, S.H.; Whitledge, T.E. Primary and new production in the deep Canada Basin during summer. Polar Biol. 2002, 28, 190–197. [Google Scholar] [CrossRef]
  27. Lee, S.H.; Whitledge, T.E.; Kang, S.H. Recent carbon and nitrogen uptake rates of phytoplankton in Bering Strait and the Chukchi Sea. Cont. Shelf Res. 2007, 27, 2231–2249. [Google Scholar] [CrossRef]
  28. Parsons, T.R.; Maita, Y.; Lalli, C.M. A Manual of Chemical and Biological Methods for Seawater Analysis; Pergamon Press: New York, NY, USA, 1984. [Google Scholar]
  29. Garneau, M.E.; Gosselin, M.; Klein, B.; Tremblay, J.E.; Fouilland, E. New and regenerated production during a late summer bloom in an Arctic polynya. Mar. Ecol. Prog. Ser. 2007, 345, 13–26. [Google Scholar] [CrossRef]
  30. Dugdale, R.C.; Goering, J.J. Uptake of new and regenerated forms of nitrogen in primary productivity. Limnol. Oceanogr. 1967, 12, 196–206. [Google Scholar] [CrossRef] [Green Version]
  31. Hama, T.; Miyazaki, T.; Ogawa, Y.; Iwakuma, T.; Takahashi, M.; Otsuki, A.; Ichimura, S. Measurement of phytosynthetic production of a marine phytoplankton population using a stable 13C isotope. Mar. Biol. 1983, 73, 31–36. [Google Scholar] [CrossRef]
  32. Gandhi, N.; Ramesh, R.; Laskar, A.; Sheshshayee, M.; Shetye, S.S.; Anilkumar, N.; Patil, S.M.; Mohan, R. Zonal variability in primary production and nitrogen uptake rates in the southwestern Indian Ocean and the Southern Ocean. Deep Sea Res. Part I Oceanogr. Res. Pap. 2012, 67, 32–43. [Google Scholar] [CrossRef]
  33. Dugdale, R.C.; Wilkerson, F.P. The use of 15 N to measure nitrogen uptake in eutrophic oceans; experimental considerations. Limnol. Oceanogr. 1986, 31, 673–689. [Google Scholar] [CrossRef]
  34. Kwak, J.H.; Lee, S.H.; Hwan, J.; Suh, Y.S.; Park, H.J.; Chang, K.I.; Kim, K.R.; Kang, C.K. Summer primary productivity and phytoplankton community composition driven by different hydrographic structures in the East/ Japan Sea and the Western Subarctic Pacific. J. Geophy. Res. Ocean. 2014, 119, 4505–4519. [Google Scholar] [CrossRef]
  35. Bhavya, P.S.; Kumar, S.; Gupta, G.V.M.; Sudheesh, V.; Sudharma, K.V.; Varrier, D.S.; Dhanya, K.R.; Saravanane, N. Nitrogen Uptake Dynamics in a Tropical Eutrophic Estuary (Cochin, India) and Adjacent Coastal Waters. Chesap. Sci. 2015, 39, 54–67. [Google Scholar] [CrossRef]
  36. Glibert, P.M.; Biggs, D.C.; McCarthy, J.J. Utilization of ammonium and nitrate during austral summer in the Scotia Sea. Deep Sea Res. Part A Oceanogr. Res. Pap. 1982, 29, 837–850. [Google Scholar] [CrossRef]
  37. Eppley, R.W.; Thomas, W.H. Comparison of half-saturation constants for growth and nitrate uptake of marine phytoplankton. J. Phycol. 1969, 5, 375–379. [Google Scholar] [CrossRef]
  38. Aksnes, D.L.; Egge, J.K. A theoretical model for nutrient uptake in phytoplankton. Mar. Ecol. Prog. Ser. 1991, 70, 65–72. [Google Scholar] [CrossRef]
  39. Hein, M.; Folager Pedersen, M.; Sand-Jensen, K. Size-dependent nitrogen uptake in micro and macroalgae. Mar. Ecol. Prog. Ser. 1995, 118, 247–253. [Google Scholar] [CrossRef] [Green Version]
  40. Shuter, B.G. Size dependence of phophorus and nitrogen subsistence quotas in unicellular microrganisms. Limnol. Oceanogr. 1978, 23, 1248–1255. [Google Scholar] [CrossRef]
  41. Grover, J.P. Resource competition in a variable environment: Phytoplankton growing according to the variable-internal-stores model. Am. Nat. 1991, 138, 811–835. [Google Scholar] [CrossRef]
  42. Agawin, N.S.R.; Duarte, C.M.; Agustí, S. Nutrient and temperature control of the contribution of picoplankton to phytoplankton biomass and production. Limnol. Oceanogr. 2000, 45, 591–600. [Google Scholar] [CrossRef]
  43. Hodal, H.; Kristiansen, S. The importance of small-celled phytoplankton in spring blooms at the marginal ice zone in the northern Barents Sea. Deep Sea Res. Part II Top. Stud. Oceanogr. 2008, 55, 2176–2185. [Google Scholar] [CrossRef] [Green Version]
  44. Malone, T.C. Size-Fractionated Primary Productivity of Marine Phytoplankton. In Primary Productivity in the Sea; Springer: Boston, MA, USA, 1980; pp. 301–319. [Google Scholar]
  45. Nalewajko, C.; Garside, C. Methodological problems in the simultaneous assessment of photosynthesis and nutrient uptake in phytoplankton as functions of light intensity and cell size. Limnol. Oceanogr. 1983, 28, 591–597. [Google Scholar] [CrossRef]
  46. Probyn, T.A. Nitrogen uptake by size-fractionated phytoplankton populations in the southern Benguela upwelling system. Mar. Ecol. Prog. Ser. Oldendorf. 1985, 22, 249–258. [Google Scholar] [CrossRef]
  47. Koike, I.; Holm-Hansen, O.; Biggs, D.C. Inorganic nitrogen metabolism by Antarctic phytoplankton with special reference to ammonium cycling. Mar. Ecol. Prog. Ser. 1986, 30, 105–116. [Google Scholar] [CrossRef]
  48. Dauchez, S.; Legendre, L.; Fortier, L.; Levasseur, M. Nitrate uptake by size-fractionated phytoplankton on the Scotian Shelf (Northwest Atlantic): Spatial and temporal variability. J. Plank. Res. 1996, 18, 577–595. [Google Scholar] [CrossRef]
  49. Dauchez, S.; Legendre, L.; Fortier, L.; Levasseur, M. New production and production of large phytoplankton (>5 um) on the Scotian Shelf (NW Atlantic). Mar. Ecol. Prog. Ser. 1996, 135, 215–222. [Google Scholar] [CrossRef]
  50. Tamigneaux, E.; Vazquez, E.; Mingelbier, M.; Klein, B.; Legendre, L. Environmental control of phytoplankton assemblages in nearshore marine waters, with special emphasis on phototrophic ultraplankton. J. Plankton Res. 1995, 17, 1421–1448. [Google Scholar] [CrossRef]
  51. Wilkerson, F.; Dugdale, R.; Kudela, R.; Chavez, F.P. Biomass and productivity in Monterey Bay, California: Contribution of the large phytoplankton. Deep Sea Res. Part II Top. Stud. Oceanogr. 2000, 47, 1003–1022. [Google Scholar] [CrossRef]
  52. Kim, B.K.; Joo, H.; Song, H.J.; Yang, E.J.; Lee, S.H.; Hahm, D.; Rhee, T.S.; Lee, S.H. Large seasonal variation in phytoplankton production in the Amundsen Sea. Polar Biol. 2015, 38, 319–331. [Google Scholar] [CrossRef]
  53. Lee, S.H.; Yun, M.S.; Kim, B.K.; Joo, H.T.; Kang, S.H.; Kang, C.-K.; Whitledge, T.E. Contribution of small phytoplankton to total primary production in the Chukchi Sea. Cont. Shelf Res. 2013, 68, 43–50. [Google Scholar] [CrossRef]
  54. Siegel, D.A.; Buesseler, K.O.; Doney, S.C.; Sailley, S.F.; Behrenfeld, M.J.; Boyd, P.W. Global assessment of ocean carbon export by combining satellite observations and food-web models. Glob. Biogeochem. Cycles 2014, 28, 181–196. [Google Scholar] [CrossRef]
  55. Lim, Y.J.; Kim, T.-W.; Lee, S.H.; Lee, D.; Park, J.; Kim, B.K.; Kim, K.; Jang, H.K.; Bhavya, P.; Lee, S.H. Seasonal Variations in the Small Phytoplankton Contribution to the Total Primary Production in the Amundsen Sea, Antarctica. J. Geophys. Res. Ocean. 2019, 124, 8324–8341. [Google Scholar] [CrossRef]
  56. Kwak, J.H.; Han, E.; Lee, S.H.; Park, H.J.; Kim, K.R.; Kang, C.K. A consistent structure of phytoplankton communities across the warm–cold regions of the water mass on a meridional transect in the East/Japan Sea. Deep Sea Res. Part II Top. Stud. Oceanogr. 2017, 143, 36–44. [Google Scholar] [CrossRef]
  57. Goldman, J.C. Potential role of large oceanic diatoms in new primary production. Deep Sea Res. Part I Oceanogr. Res. Pap. 1993, 40, 159–168. [Google Scholar] [CrossRef]
  58. Michaels, A.F.; Silver, M.W. Primary production, sinking fluxes, and the microbial food web. Deep Sea Res. Part A Oceanogr. Res. Pap. 1988, 35, 473–490. [Google Scholar] [CrossRef]
  59. Uitz, J.; Claustre, H.; Gentili, B.; Stramski, D. Phytoplankton class-specific primary production in the world’s oceans: Seasonal and interannual variability from satellite observations. Glob. Biogeochem. Cycles 2010, 24. [Google Scholar] [CrossRef]
  60. Winder, M.; Sommer, U. Phytoplankton response to a changing climate. Hydrobiologia 2012, 698, 5–16. [Google Scholar] [CrossRef]
  61. Moran, X.A.G.; Lopez-Urrutia, A.; Calvo-Diaz, A.; Li, W.K.W. Increasing importance of small phytoplankton in a warmer ocean. Glob. Chang. Biol. 2010, 16, 1137–1144. [Google Scholar] [CrossRef]
  62. Gregg, W.W.; Conkright, M.E.; Ginoux, P.; O’Reilly, J.E.; Casey, N.W. Ocean primary production and climate: Global decadal changes. Geophys. Res. Lett. 2003, 15, 1809. [Google Scholar] [CrossRef] [Green Version]
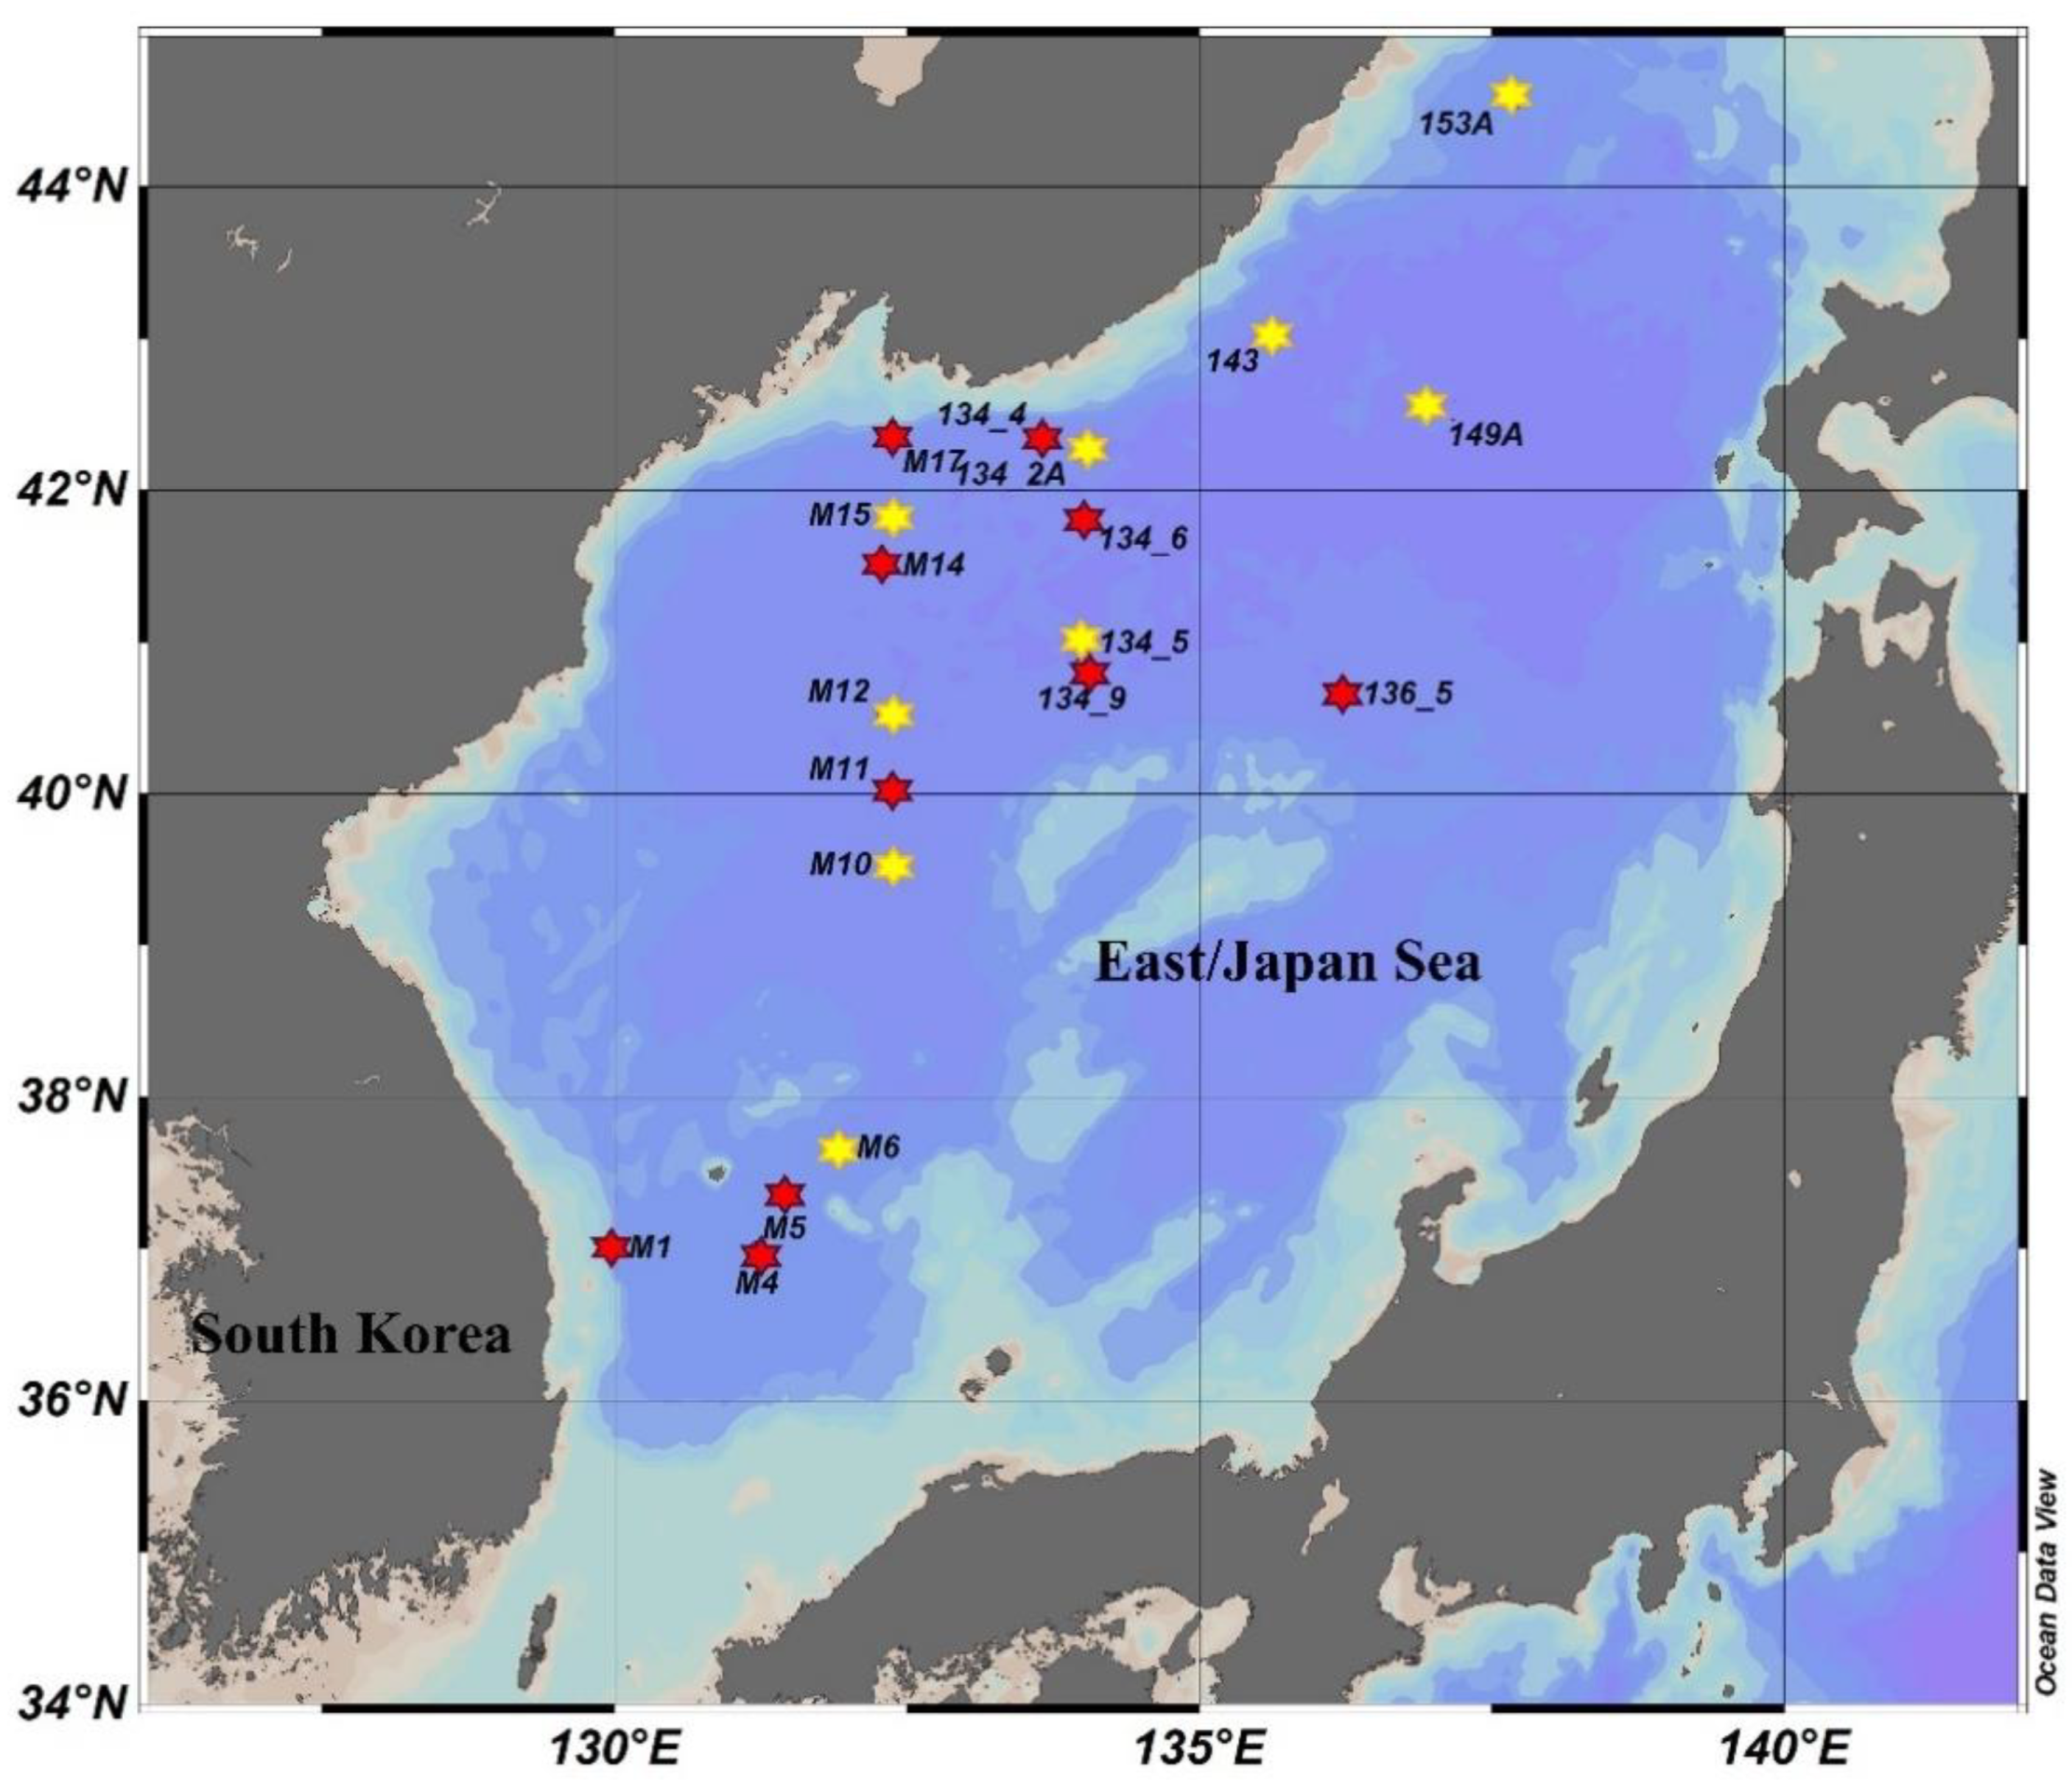
Figure 1. Sampling locations in the East/Japan Sea. The red stars indicate the sampling locations during 2012, and the yellow stars indicate the stations during the 2015 sampling.
Jmse 08 00854 g001
Figure 2. The depth profiles of the nutrient concentrations in the East/Japan Sea and the corresponding light levels for each station during 2012 (a) and 2015 (b). The station numbers are given on corresponding plots.
Jmse 08 00854 g002aJmse 08 00854 g002b
Figure 3. Depth profiles of total (a) NO3 and (b) NH4+ uptake rates in the East/Japan Sea during 2012.
Jmse 08 00854 g003
Figure 4. Depth profiles of total and small NO3 and NH4+ uptake rates in the East/Japan Sea during 2015. (a,b) denote the total phytoplankton NO3 and NH4+ uptake rates, respectively, and the (c) and (d) denote the small phytoplankton NO3 and NH4+ uptake rates, respectively.
Jmse 08 00854 g004
Figure 5. Depth integrated total NO3 and NH4+ uptake rates in the East/Japan Sea during 2012.
Jmse 08 00854 g005
Figure 6. The depth-integrated total and small phytoplankton NO3 and NH4+ uptake rates in the East/Japan Sea during 2015.
Jmse 08 00854 g006
Figure 7. Depth profiles of (a) NO3 and (b) NH4+ turnover time by total phytoplankton in the East/Japan Sea during 2012.
Jmse 08 00854 g007
Figure 8. Depth profiles of turnover times of NO3 and NH4+ substrates by total and small phytoplankton in the East/Japan Sea during 2015. (a,b) denote the NO3 turnover times by total and small phytoplankton, respectively, and (c,d) denote the NH4+ turnover times by total and small phytoplankton, respectively.
Jmse 08 00854 g008
Figure 9. Relationships between small phytoplankton contributions to NO3/NH4+ uptake rates and total NO3/NH4+ uptake rates in the northeastern East/Japan Sea during 2015. The green and magenta dots indicate depth-integrated total NO3 and NH4+ uptake rates, respectively. The significance levels for the correlations are obtained from the t-test.
Jmse 08 00854 g009
Table 1. Temperature data from the sampling stations during the fall in 2012 and early spring in 2015 sampling in the East/Japan Sea.
YearLight Level (%)Temperature (°C)
M1M4M5M11M14M17134-4134-6134-9136-5
10024.924.924.222.218.119.218.416.821.520.1
5024.9 24.2 17.4 19.416.320.820.1
20123023.325.222.921.517.518.718.716.120.619.7
1223.2 23.4 17.4 18.316.221.119.9
523.3 23.5 17.1 18.116.520.819.9
123.124.723.821.417.318.618.116.521.119.8
Light Level (%)Temperature (°C)
M6M10M12M15134-2A134-5143149A153-A
1002.583.59 3.18 4.33 5.97 5.07 7.77 12.113.6
502.533.54 3.17 4.34 6.02 5.07 7.69 11.713.6
2015302.553.54 3.03 4.34 5.84 5.07 7.44 11.013.0
122.483.47 2.92 4.34 5.73 5.06 7.00 10.512.1
52.293.14 2.45 4.30 5.72 5.06 6.46 9.58 11.0
11.932.52 2.04 4.03 5.70 4.92 4.57 9.28 10.1
Table 2. The depth-integrated total and small phytoplankton uptake rates were obtained during the present study, where uptake rates were given in mmol N m−2 h−1.
YearStn. NameLatitude (°E)Longitude (°N)EuphoticTotal NO3Small NO3Contribution Total NH4+Small NH4+Contribution
Depth Uptake RateUptake Rate(%)Uptake RateUptake Rate(%)
2012M137.002129.999270.750--6.978--
M436.990131.232601.214--16.66--
M537.349131.459410.850--6.587--
M1140.001132.333542.365--22.38--
M1441.501132.337430.726--8.645--
M1742.340132.335431.142--8.578--
134-442.335133.667460.333--3.457--
134-641.831134.003352.498--1.676--
134-940.838133.997351.036--5.586--
136-540.653136.264541.023--3.957--
2015M637.661131.944350.8730.37743.182.3811.18449.72
M1039.524132.339351.1970.49541.324.5701.38130.21
M1240.513132.331330.6330.22034.711.1460.64155.93
M1541.832132.334412.3630.24210.241.3510.82360.94
134-2A42.255134.011430.6530.12719.390.5860.32355.20
134-540.990134.005430.1450.08659.360.3850.26468.55
14343.000135.657350.3620.08924.610.8030.45656.82
149A42.518136.989350.5990.13121.861.2320.57046.25
153A44.567137.673300.2270.08738.490.7920.50864.13
Publisher’s Note: MDPI stays neutral with regard to jurisdictional claims in published maps and institutional affiliations.