Article

The Effect of the Second-Order Wave Loads on Drift Motion of a Semi-Submersible Floating Offshore Wind Turbine

Department of Floating Offshore Wind Energy Generation System, University of Ulsan, Ulsan 44610, Korea
*
Author to whom correspondence should be addressed.
J. Mar. Sci. Eng. 2020, 8(11), 859; https://doi.org/10.3390/jmse8110859
Submission received: 16 September 2020 / Revised: 22 October 2020 / Accepted: 28 October 2020 / Published: 30 October 2020
(This article belongs to the Special Issue Analysis and Design of Offshore Wind Turbine Support Structures)

Abstract

:
Floating offshore wind turbines (FOWTs) have been installed in Europe and Japan with relatively modern technology. The installation of floating wind farms in deep water is recommended because the wind speed is stronger and more stable. The design of the FOWT must ensure it is able to withstand complex environmental conditions including wind, wave, current, and performance of the wind turbine. It needs simulation tools with fully integrated hydrodynamic-servo-elastic modeling capabilities for the floating offshore wind turbines. Most of the numerical simulation approaches consider only first-order hydrodynamic loads; however, the second-order hydrodynamic loads have an effect on a floating platform which is moored by a catenary mooring system. At the difference-frequencies of the incident wave components, the drift motion of a FOWT system is able to have large oscillation around its natural frequency. This paper presents the effects of second-order wave loads to the drift motion of a semi-submersible type. This work also aimed to validate the hydrodynamic model of Ulsan University (UOU) in-house codes through numerical simulations and model tests. The NREL FAST code was used for the fully coupled simulation, and in-house codes of UOU generates hydrodynamic coefficients as the input for the FAST code. The model test was performed in the water tank of UOU.

1. Introduction

Offshore wind power has grown rapidly in recent decades. The trend of offshore wind power is inevitable in the future. The characteristics of offshore wind resources are higher wind speeds and lower turbulence, as well as lower wind shear than onshore. The higher wind speed allows for offshore wind turbine capacity factors to be higher on average, and the lower turbulence and shear reduce wind-induced blade loads [1]. In addition, visual and noise impacts are reduced due to the large distance from residences. Most of the areas with strong offshore winds are distributed in areas with water depths of more than 50 m, so floating wind turbines are a viable option. Nowadays, the technology of floating offshore wind turbines (FOWTs) has become more mature through research and deploying pilot FOWT projects and demonstration wind farms. Floating offshore wind turbine platforms can be provided using three concepts, which are spar, semi-submersible, and tension leg platform (TLP). Several types of semi-submersible concepts were developed, such as WindFloat [2], OO-star model [3], OC4 semi-submersible model [4], GustoMSC Tri-Floater [5], and other semi-submersible models [6,7]. The TLP concept is designed with high tension of its anchoring system; therefore, the TLP’s anchoring system is complex [8,9,10]. The spar concept is usually designed with a slender cylinder; in order to balance the system, the center of gravity of the whole system must be lower than the center of buoyancy of the platform, so the ballast material of concrete is often used at the bottom [11,12,13,14,15].
In order to develop FOWTs, designers need a fully coupled numerical simulation tool that can combine stochastic wave, wind, and wind turbine performance. The tool also needs to include higher order hydrodynamic loads caused by incident irregular waves. The well-known simulation tools are NREL FAST [16], SIMA (SIMO/RIFLEX/AERODYN) [17], HAWC2 [18], Bladed [19], and Orcaflex [20]. Kim et al. investigated the second-order wave effects of the global performance of a semi-submersible 5 MW wind turbine by coupling FAST with CHARM3D [21], and the results were compared with a model test to validate the simulation modeling. Coulling et al. used FAST and WAMIT to validate a semi-submersible FOWT model [22]. The study confirmed that the second-order wave loads have a strong effect on drift motion for parked/idling wind turbine scenarios. Zhang et al. investigated the effects of second-order hydrodynamics on three semi-submersible FOWTs by using the commercial software ANSYS-AQWA [23]; however, aerodynamic loads from operational wind turbine conditions was neglected.
The NREL FAST is able to integrate the fully coupled nonlinear aerodynamic–hydrodynamic-servo-elastic simulation of the FOWT systems in the time domain. The hydrodynamic coefficients of the FOWT are computed by Ulsan University (UOU) in-house code and integrated with FAST to provide hydrodynamic loads of the floating platform. UOU in-house codes are based on potential flow theory to calculate the added mass, radiational wave damping, and the linear and second-order wave loads of floating platforms.
This paper presents the effects of second-order wave loads on the drift motion of the OC4 semi-submersible FOWT [4] and also validates the hydrodynamic model of UOU in-house codes. The investigation was conducted by numerical simulation and model tests for the FOWT.

2. Model Description

The OC4 semi-submersible FOWT supports a NREL 5 MW reference offshore wind turbine [24] in 200 m water depth. The semi-submersible platform includes a main column and three offset columns. The main column is located at the center of the platform and supports the tower. Offset columns include upper columns and base columns. These columns are connected to each other by pontoons and braces. The FOWT system is moored by a catenary mooring system including three catenary mooring lines. Three mooring lines arrange uniformly around the platform with one mooring line facing the downwind direction. Figure 1 shows an overview of the OC4 semi-submersible FOWT system. Dynamic response analysis for the system was based on numerical simulation and a scaled model test.

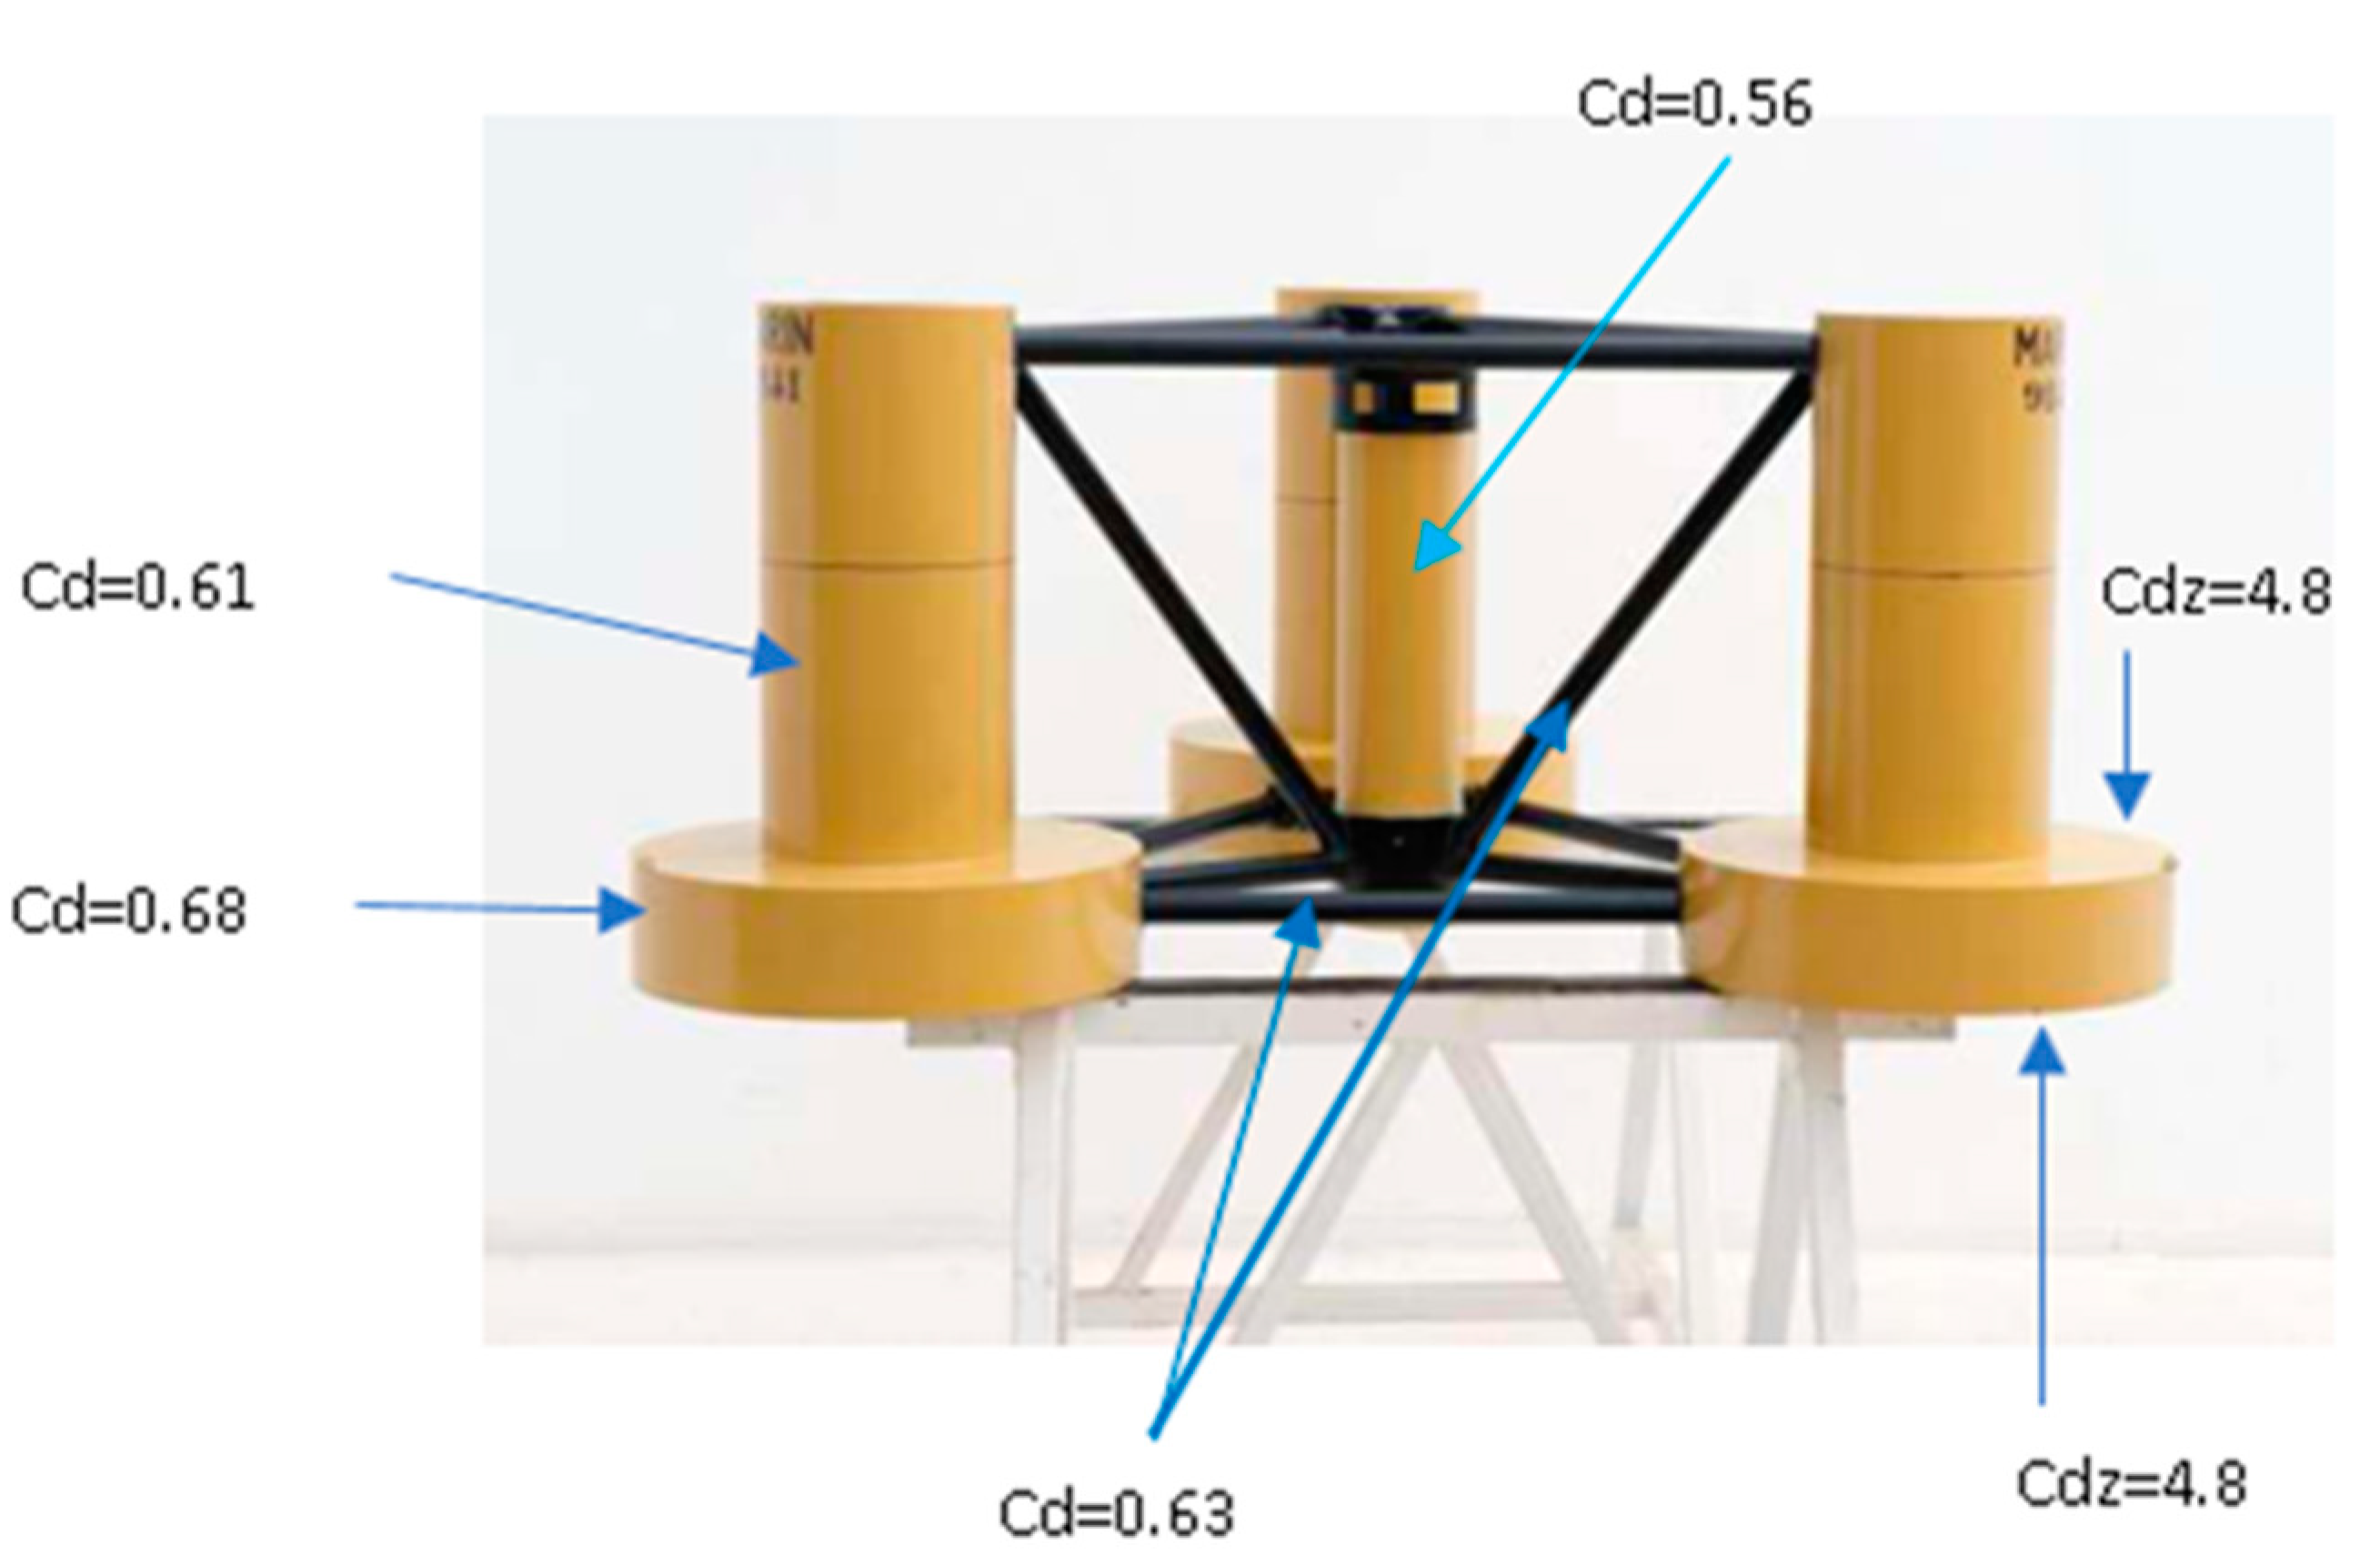
2.1. Model Test Model

The scaled model test of the OC4 semi-submersible model was carried out at the UOU’s water tank, as can be seen in Figure 2. The water tank has a water depth of 2.5 m, is 30 m in length, and is 20 m in width. In a floating offshore wind turbine model test, the dominant forces are in hydrodynamic loads, including viscous force, gravity, inertia, and aerodynamic wind force. Froude number is the ratio between inertia and gravity, and Reynolds number is the ratio between inertia and viscous forces. It is impossible to satisfy equally both the Froude number and Reynolds number between the model and its full-scale structure in a basin model test. In fact, the most influential load comes from waves; therefore, Froude scaling was chosen for the floating offshore wind turbine model tests. For matching the scaled thrust force of the NREL 5 MW wind turbine, the wind speed was increased. To find appropriate wind speeds, a fixed wind turbine test was performed in various wind speeds to measure the thrust forces. Table 1 shows the properties of the OC4 semi-submersible in a model scale of 1:80 and in full scale. An inclining test was performed in order to check the scaled-down platform mass and inertia properties, and the measured properties are listed in Table 2. Properties of the mooring system are shown in Table 3. A wind generator was made of 18 fans to create the uniform speed wind, and the rotation of the rotor was driven by a motor. The wave-maker could produce regular waves and irregular waves.
Eight VICON cameras were used to record four passive markers, which were mounted on the tower of the model; the motions of the FOWT model at the still water line (SWL) were computed based on the motion of those markers. The wave elevation was recorded by a wave probe at the same distance from the wave maker to the static position of the FOWT system.

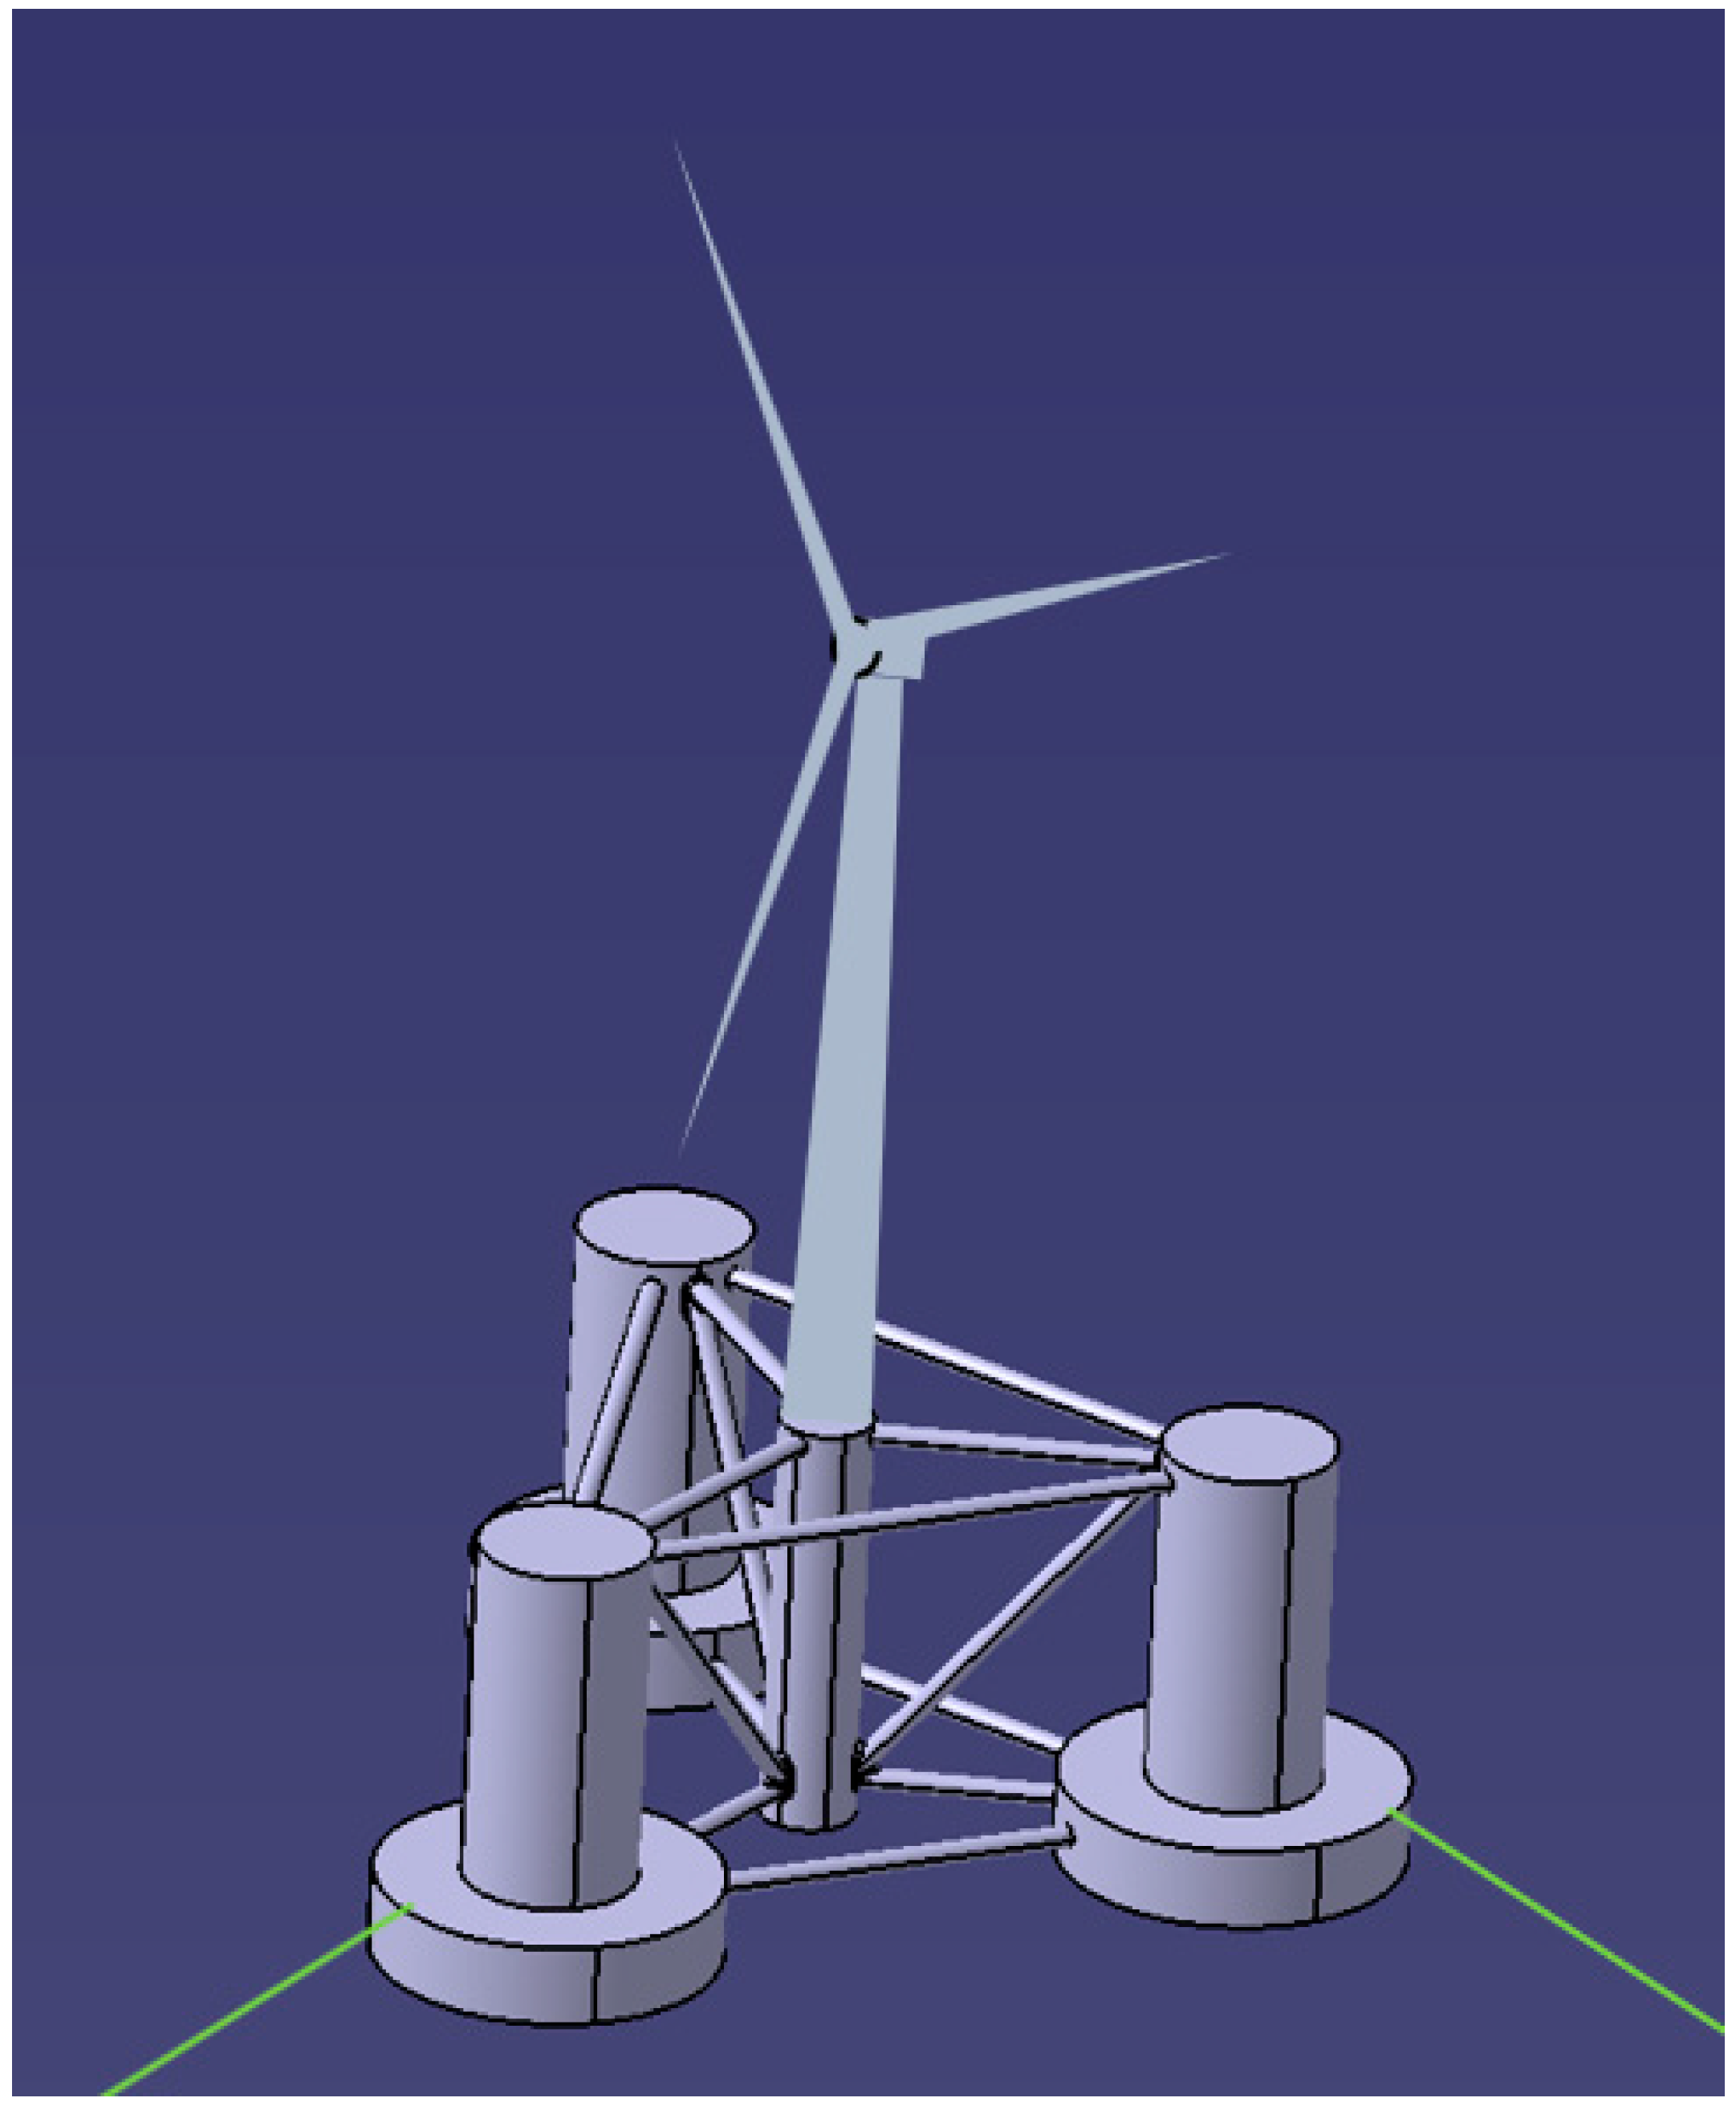
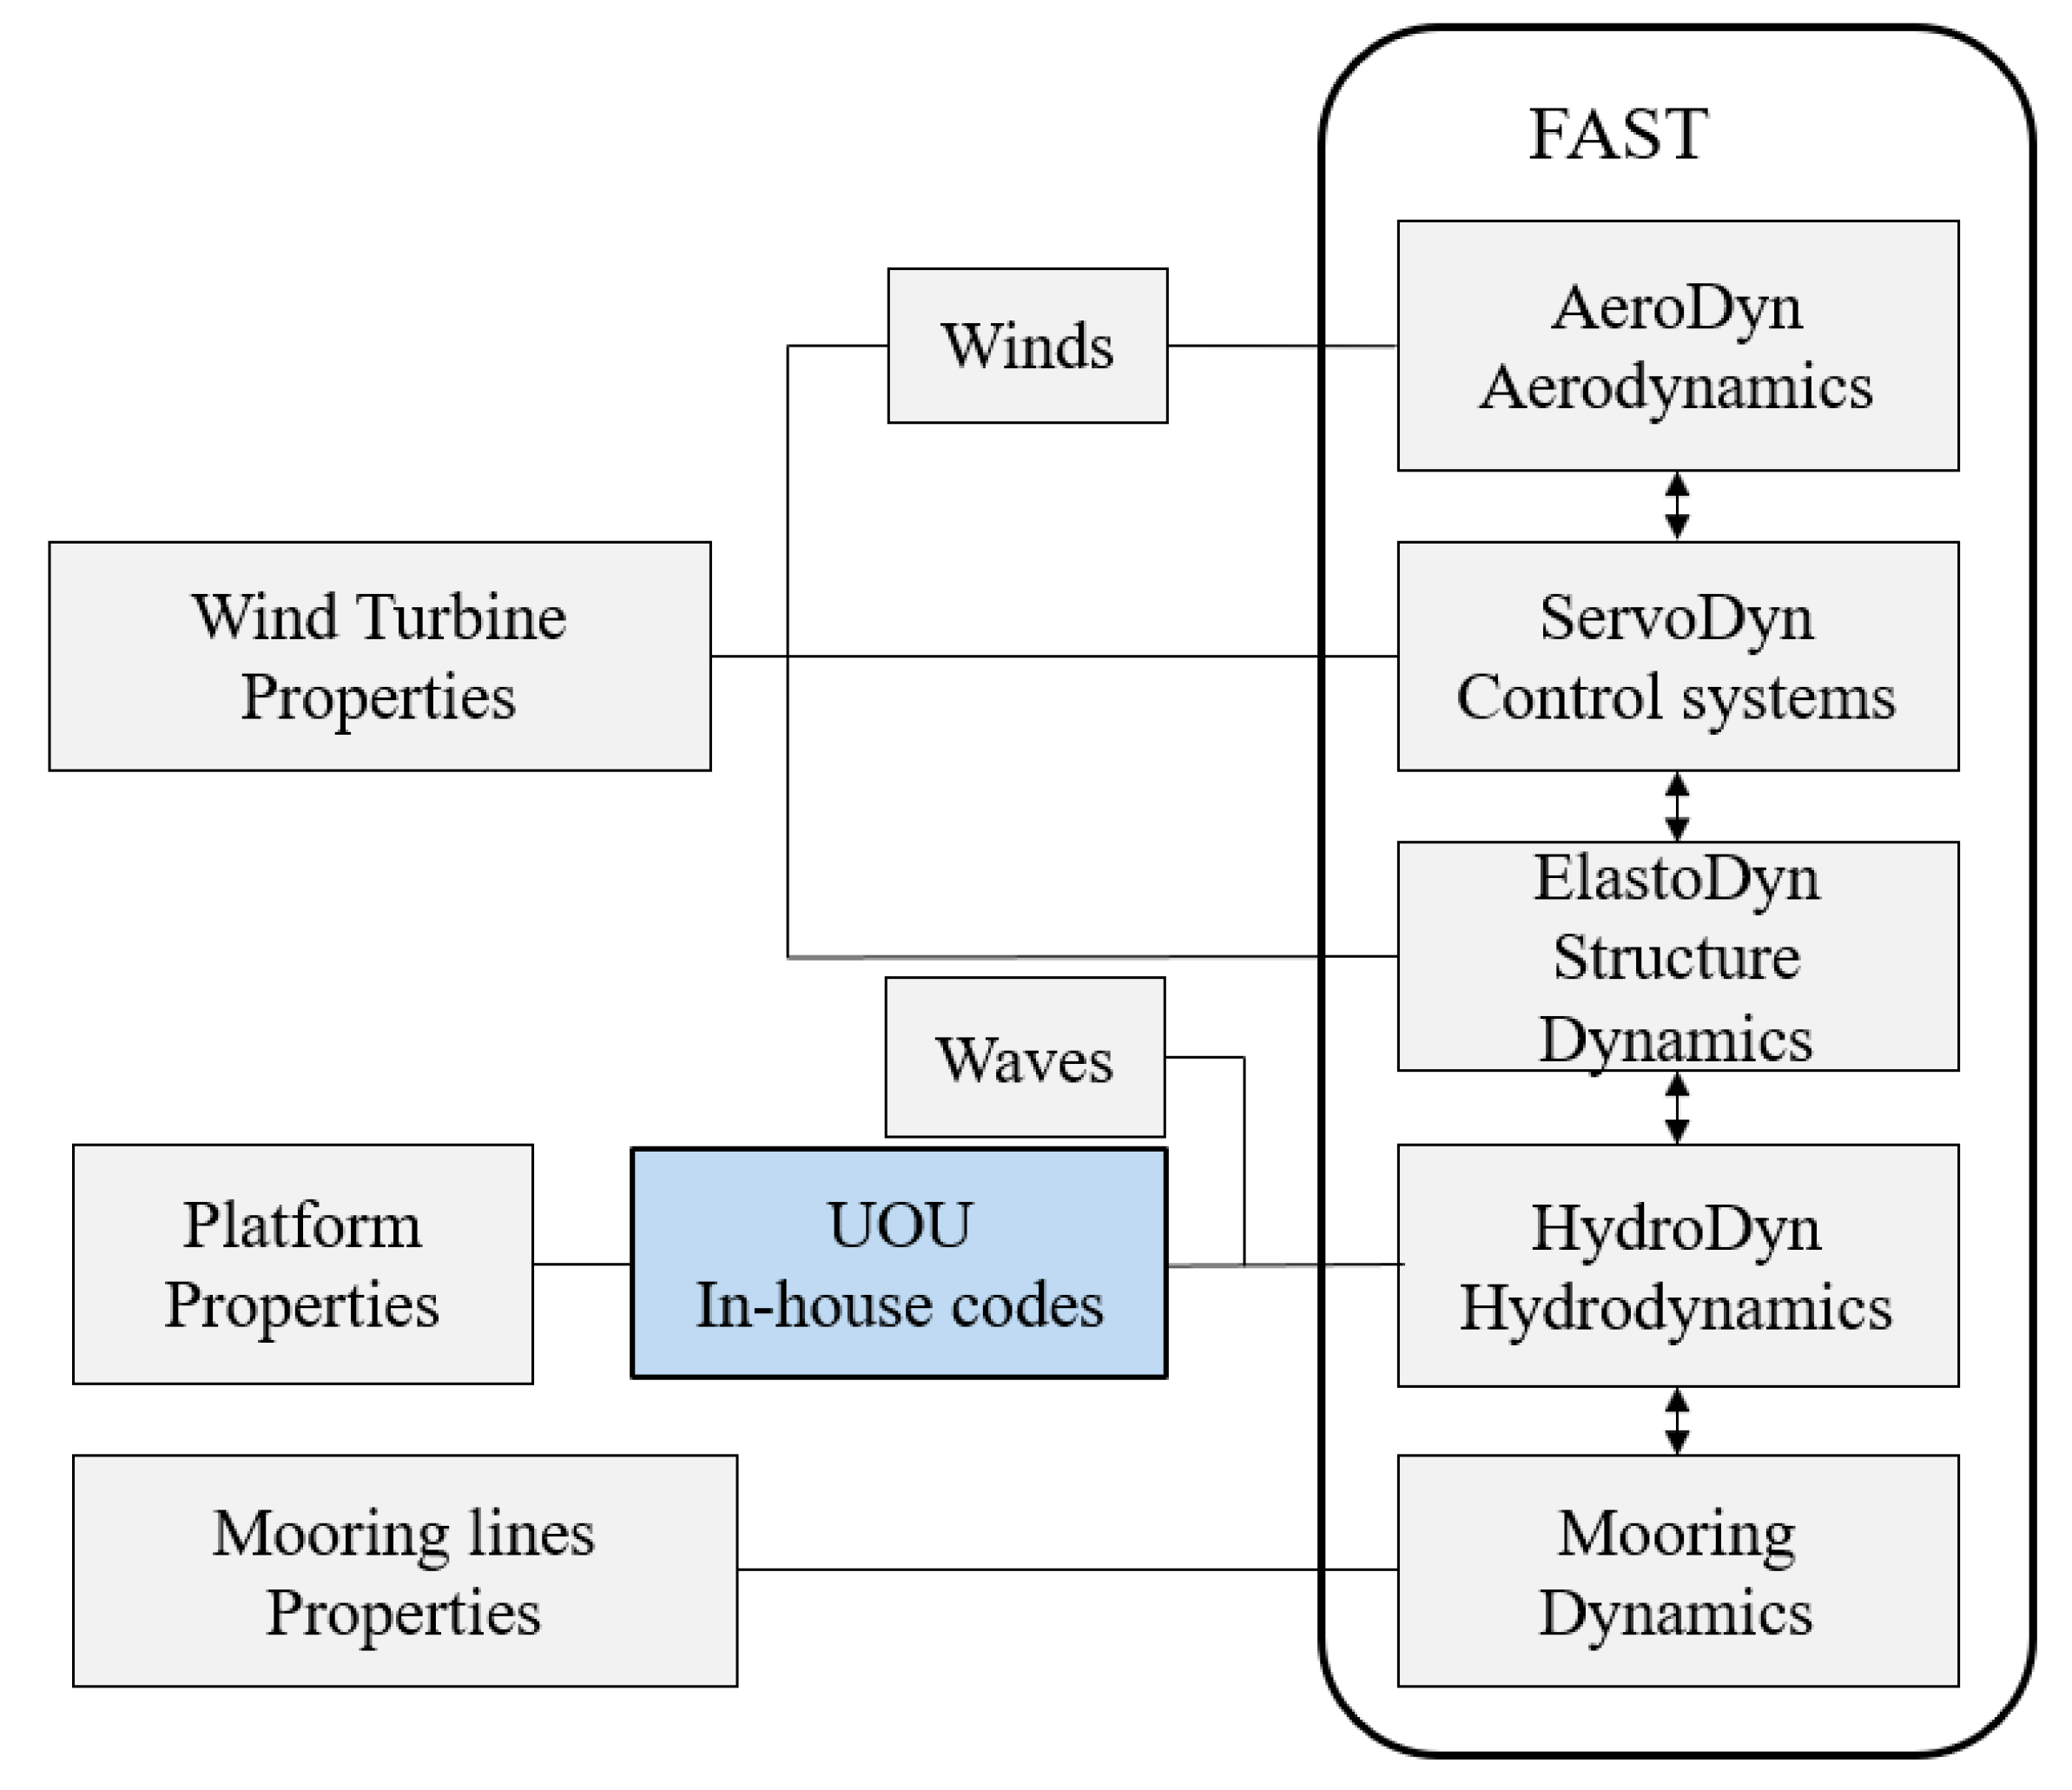
2.2. Numerical Simulation Model

The NREL FAST code computes the dynamic responses, loads, and wind turbine performances of the semi-submersible 5 MW wind-turbine system in the time domain [25]. The structure of the numerical simulation model is outlined in Figure 3. There were five modules to be called for modelling the whole FOWT system. Those were the AeroDyn module for calculating aerodynamic loads of the rotor, the ServoDyn module for controlling the wind turbine, the ElastoDyn module for modelling the elastic structure of the blades and the tower, the HydroDyn module for calculating the hydrodynamic loads acting on the floating platform, and the mooring dynamic module for modelling the dynamic mooring system. The hydrodynamic loads were computed by summarizing forces from the wave radiation added mass and damping, the first-order wave loads, the second-order hydrodynamic quadratic transfer function (QTF), and the additional viscous force based on the viscous drag term of Morison’s equation. Those hydrodynamic coefficients were computed by UOU in-house codes and input to the HydroDyn module, including added mass and damping and first-order and second-order wave exciting forces. The hydro-static restoring coefficients of the floating platform were also computed, but since the gravitational restoring terms were accounted for internally in FAST [25], the hydro-static coefficients were not included in the input data. For calculating the viscous drag force, information of the platform, such as the diameter of the platform members and their drag coefficients, was required.
The UOU in-house codes, including diffraction solvers, radiation solvers, and second-order quadratic transfer function solver, were used for generating the hydrodynamic wave-exciting force matrices Xi (ω), added-mass matrixes Aij (ω) and radiation damping matrices Bij (ω), and the quadratic transfer function matrixes Xmkmk), respectively. Diffraction and radiation solvers use a 3-dimension panel method to solve the linearized hydrodynamic diffraction and radiation problems for the interaction of the surface wave and a platform in the frequency domain.
The second-order wave force can be obtained by integrating the hydrodynamic pressure calculated from the linear potential and nonlinear potential; however, the nonlinear potential is so tedious that it is almost formidable in engineering application and therefore has still been under investigation. In the QTF solver of the UOU in-house code, the second-order wave loads were calculated based on the linear potential and the first-order motion of the platform by using the pressure integration method in frequency–domain. Based on Pinkster [26], the second-order wave forces FWave (2) and moments MWave(2) are given in Equations (1) and (2).
F W a v e ( 2 ) = W L 1 2 ρ g ζ r ( 1 ) 2 n d l S 0 [ 1 2 ρ ϕ ( 1 ) ϕ ( 1 ) ρ ( x ( 1 ) ϕ ( 1 ) t ) ] n d s + α ( 1 ) × ( m x ¨ 0 ( 1 ) )
M W a v e ( 2 ) = W L 1 2 ρ g ζ r ( 1 ) 2 ( x × n ) d l S 0 [ 1 2 ρ ϕ ( 1 ) ϕ ( 1 ) ρ ( x ( 1 ) ϕ ( 1 ) t ) ] ( x × n ) d s + α ( 1 ) × ( I α ¨ ( 1 ) )
where ρ is fluid density, g is the acceleration of gravity, S0 is the wetted surface of the body, n is the unit normal vector of S, defined to point into the fluid domain, ϕ is velocity potential, subscript (1) denotes the first-order quantity, WL is the waterline, ζr(1) is the relative wave elevation, m and I are the mass and inertial of the FOWT system, respectively, and x(1) and α(1) are the first-order translation and rotation, respectively, of 6 degrees of freedom (DOFs) of the platform in the global coordinate system.
The form of Equations (1) and (2) is similar. The first term represents the fluid pressure acting on the extra wetted surface due to the relative free surface elevation. The second and the third terms account for the velocity squared term in the Bernoulli’s equation and the first order displacement effect in the pressure field, respectively. The fourth term accounts for the rotation of the total first order force or moment of the system. The quadratic transfer function X (ωm, ωk) of the difference-frequency wave excitation can be deduced from the amplitudes of the second order wave forces and moments of Equations (1) and (2). The QTF can be found as the form of Equation (3). They correspond to the incident waves with unit amplitudes and frequencies ωm and ωk and can be divided into four terms, as in Equations (4)–(7).
X ( ω m , ω k ) = P ( ω m , ω k ) + i Q ( ω m , ω k )
where P, and Q are the real and imaginary part of the QTF, respectively.
The first term due to the first order relative wave elevation is
X m k = 1 4 ρ g W L ζ r m ( 1 ) * ζ r k ( 1 ) n d l
where * symbol represents complex conjugate. The second term due to the quadratic of the first order velocity is
X m k = 1 4 ρ S ϕ m ( 1 ) * ϕ k ( 1 ) n d s
The third term due to the product of the first order motion and the first order pressure gradient is
X m k = 1 4 ρ S ( i ω k x m ( 1 ) * ϕ m ( 1 ) i ω m x k ( 1 ) ϕ m ( 1 ) * ) n d s
The fourth term due to the product of inertia and the first order rotation motion is
X m k = 1 4 ( ω k 2 α m ( 1 ) * × M x m ( 1 ) + ω m 2 α k ( 1 ) * × M x k ( 1 ) * )
where M is the mass matrix of 6 DOFs of a FOWT system.
The surge QTF is the summation of the four terms above and is shown in Figure 4.

3. Results

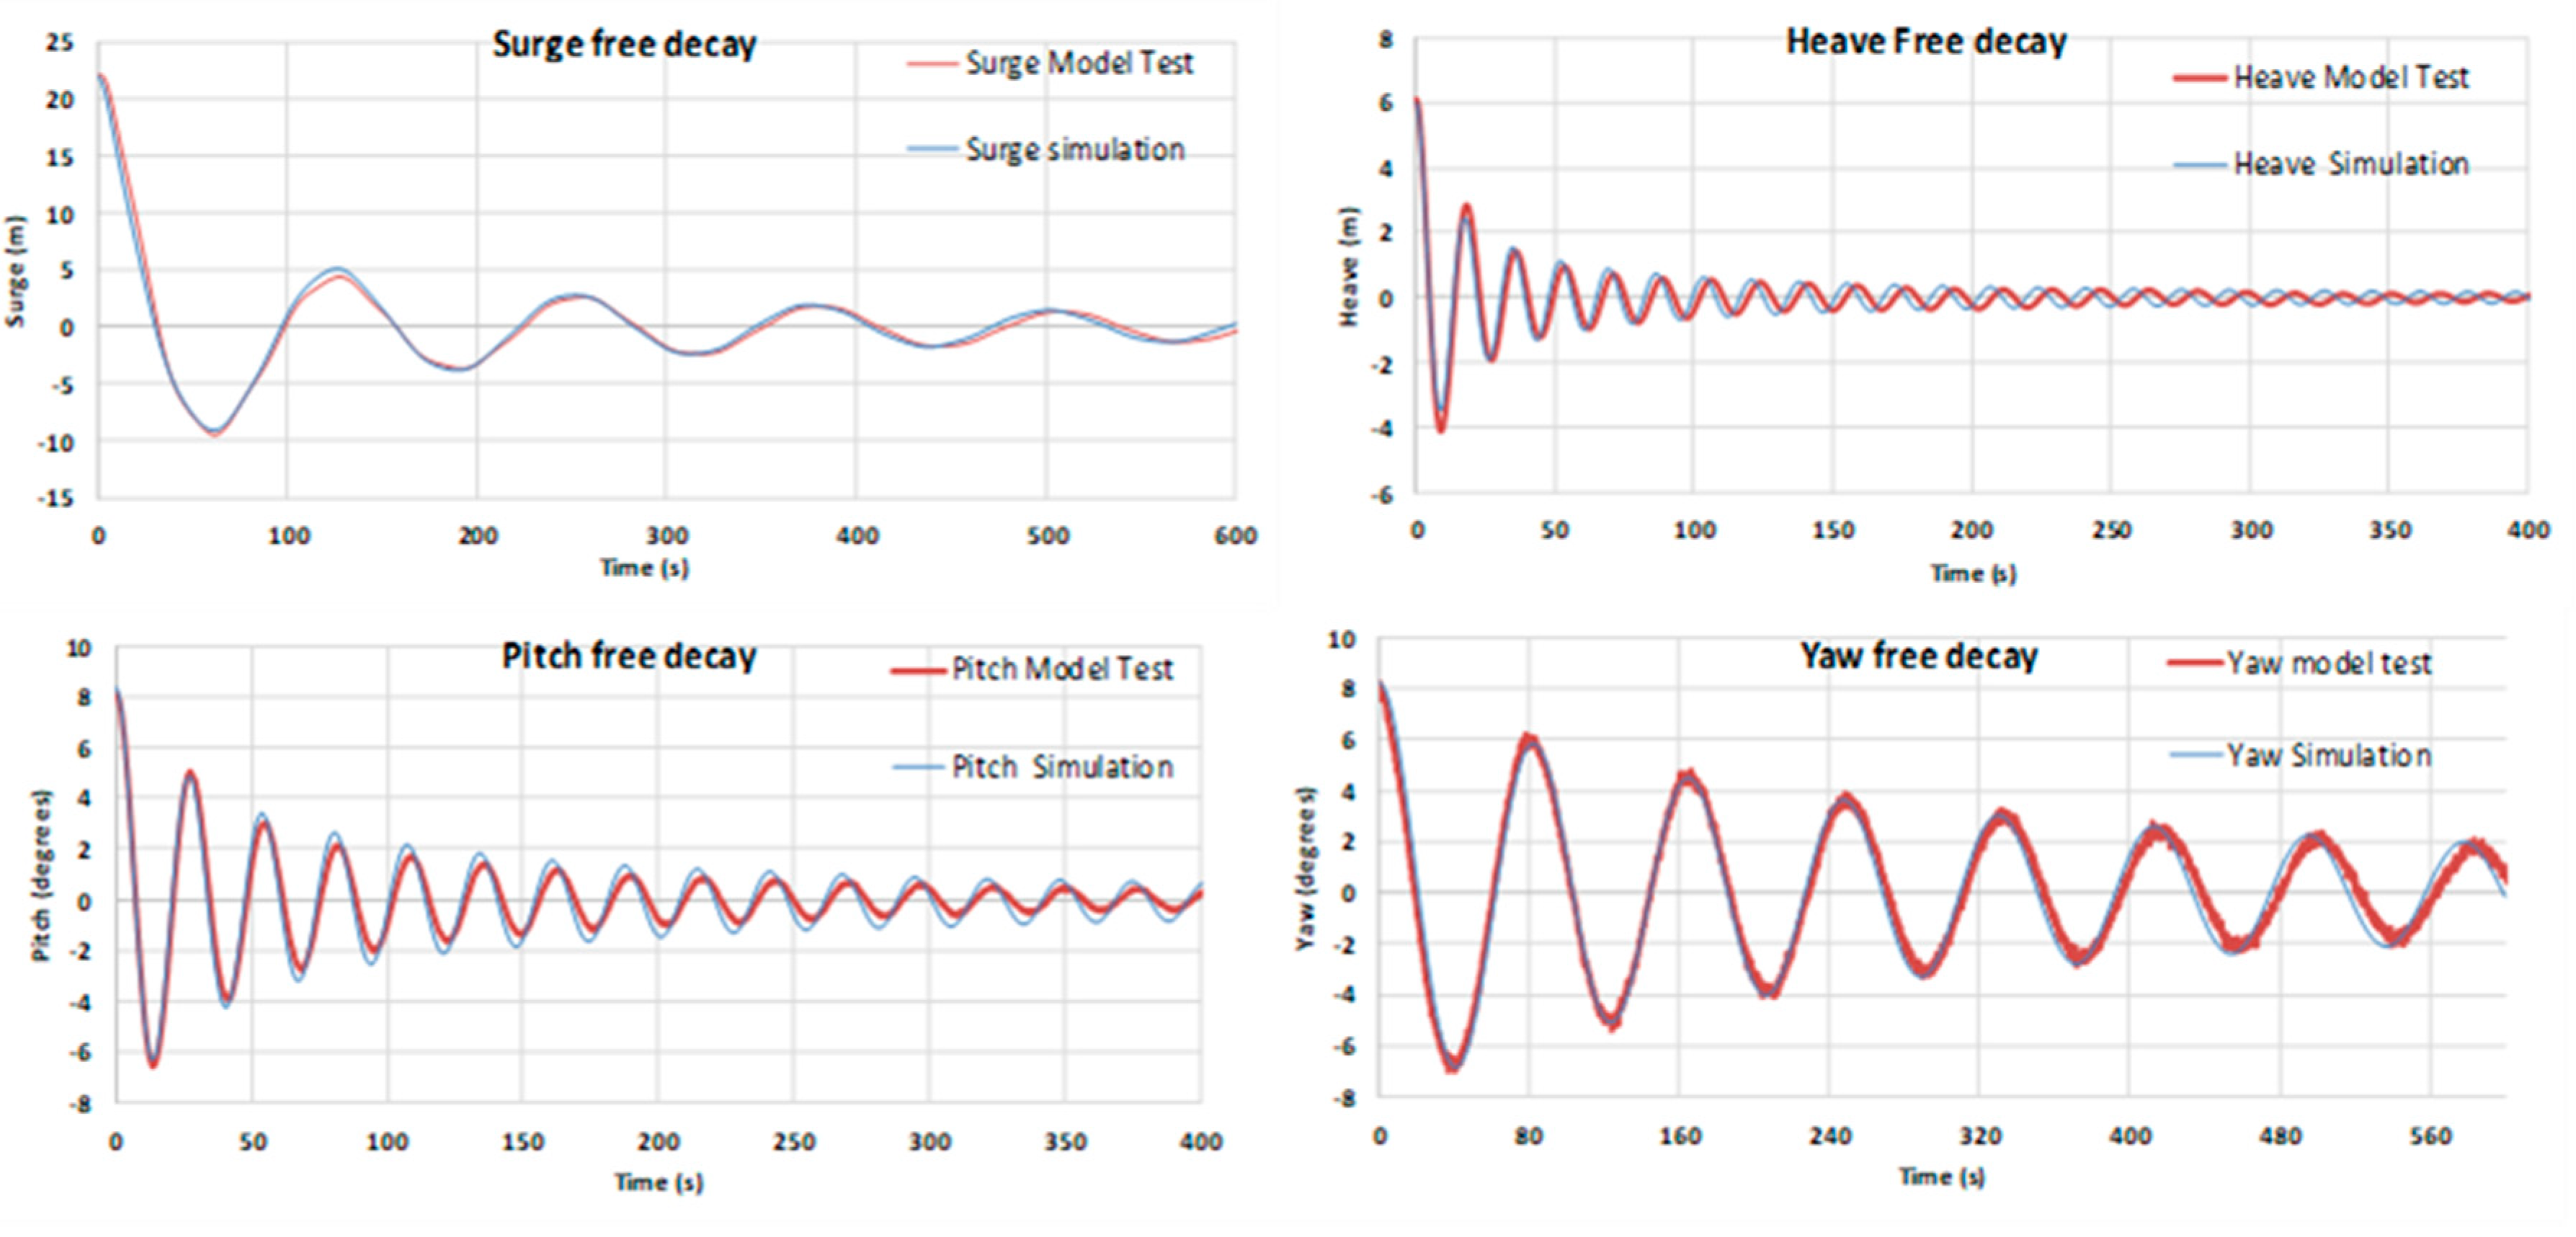
3.1. Free Decay Test

Free decay tests were performed to validate the numerical simulation model by comparing it to the results obtained from the model tests. In the numerical simulation, drag coefficients of the platform were tuned, as presented in Figure 5, and the comparisons between the model test and simulation are shown in Figure 6. By applying different drag coefficients for each component of the platform, damping forces obtained from the simulation were reasonable; thus, the free decay test results in surge, heave, pitch, and yaw of the simulation were in good agreement with those of the model tests.

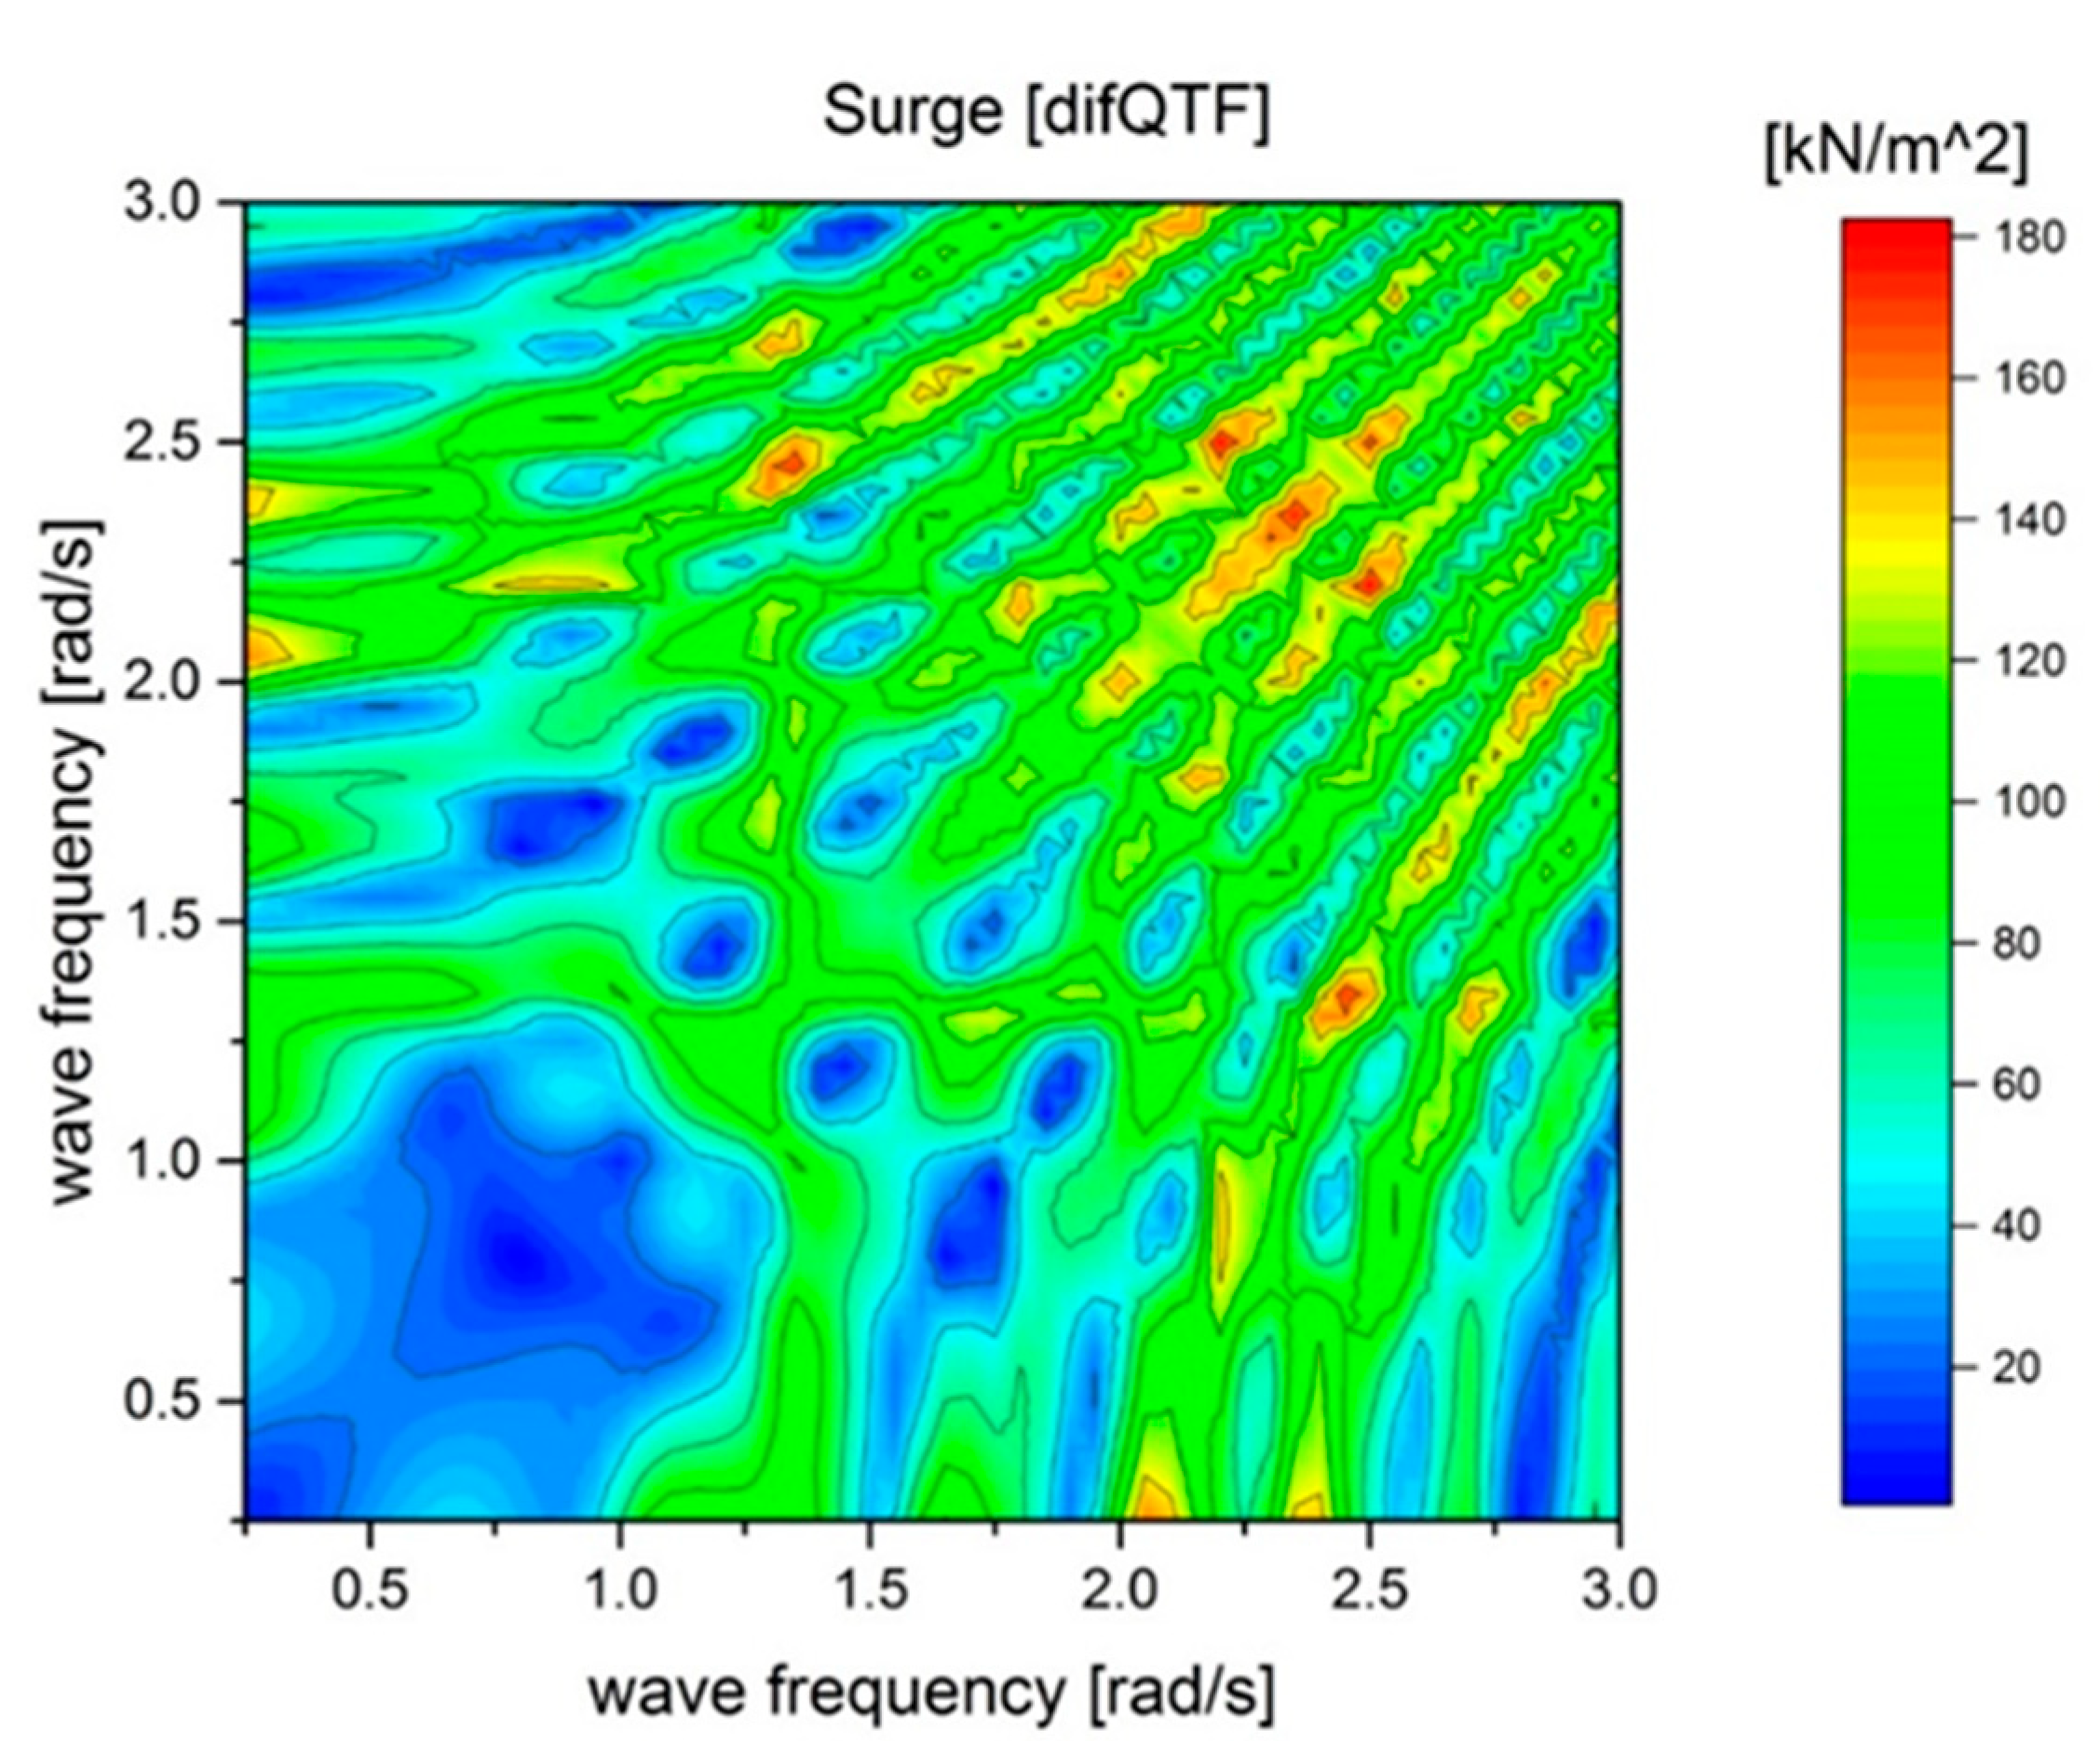
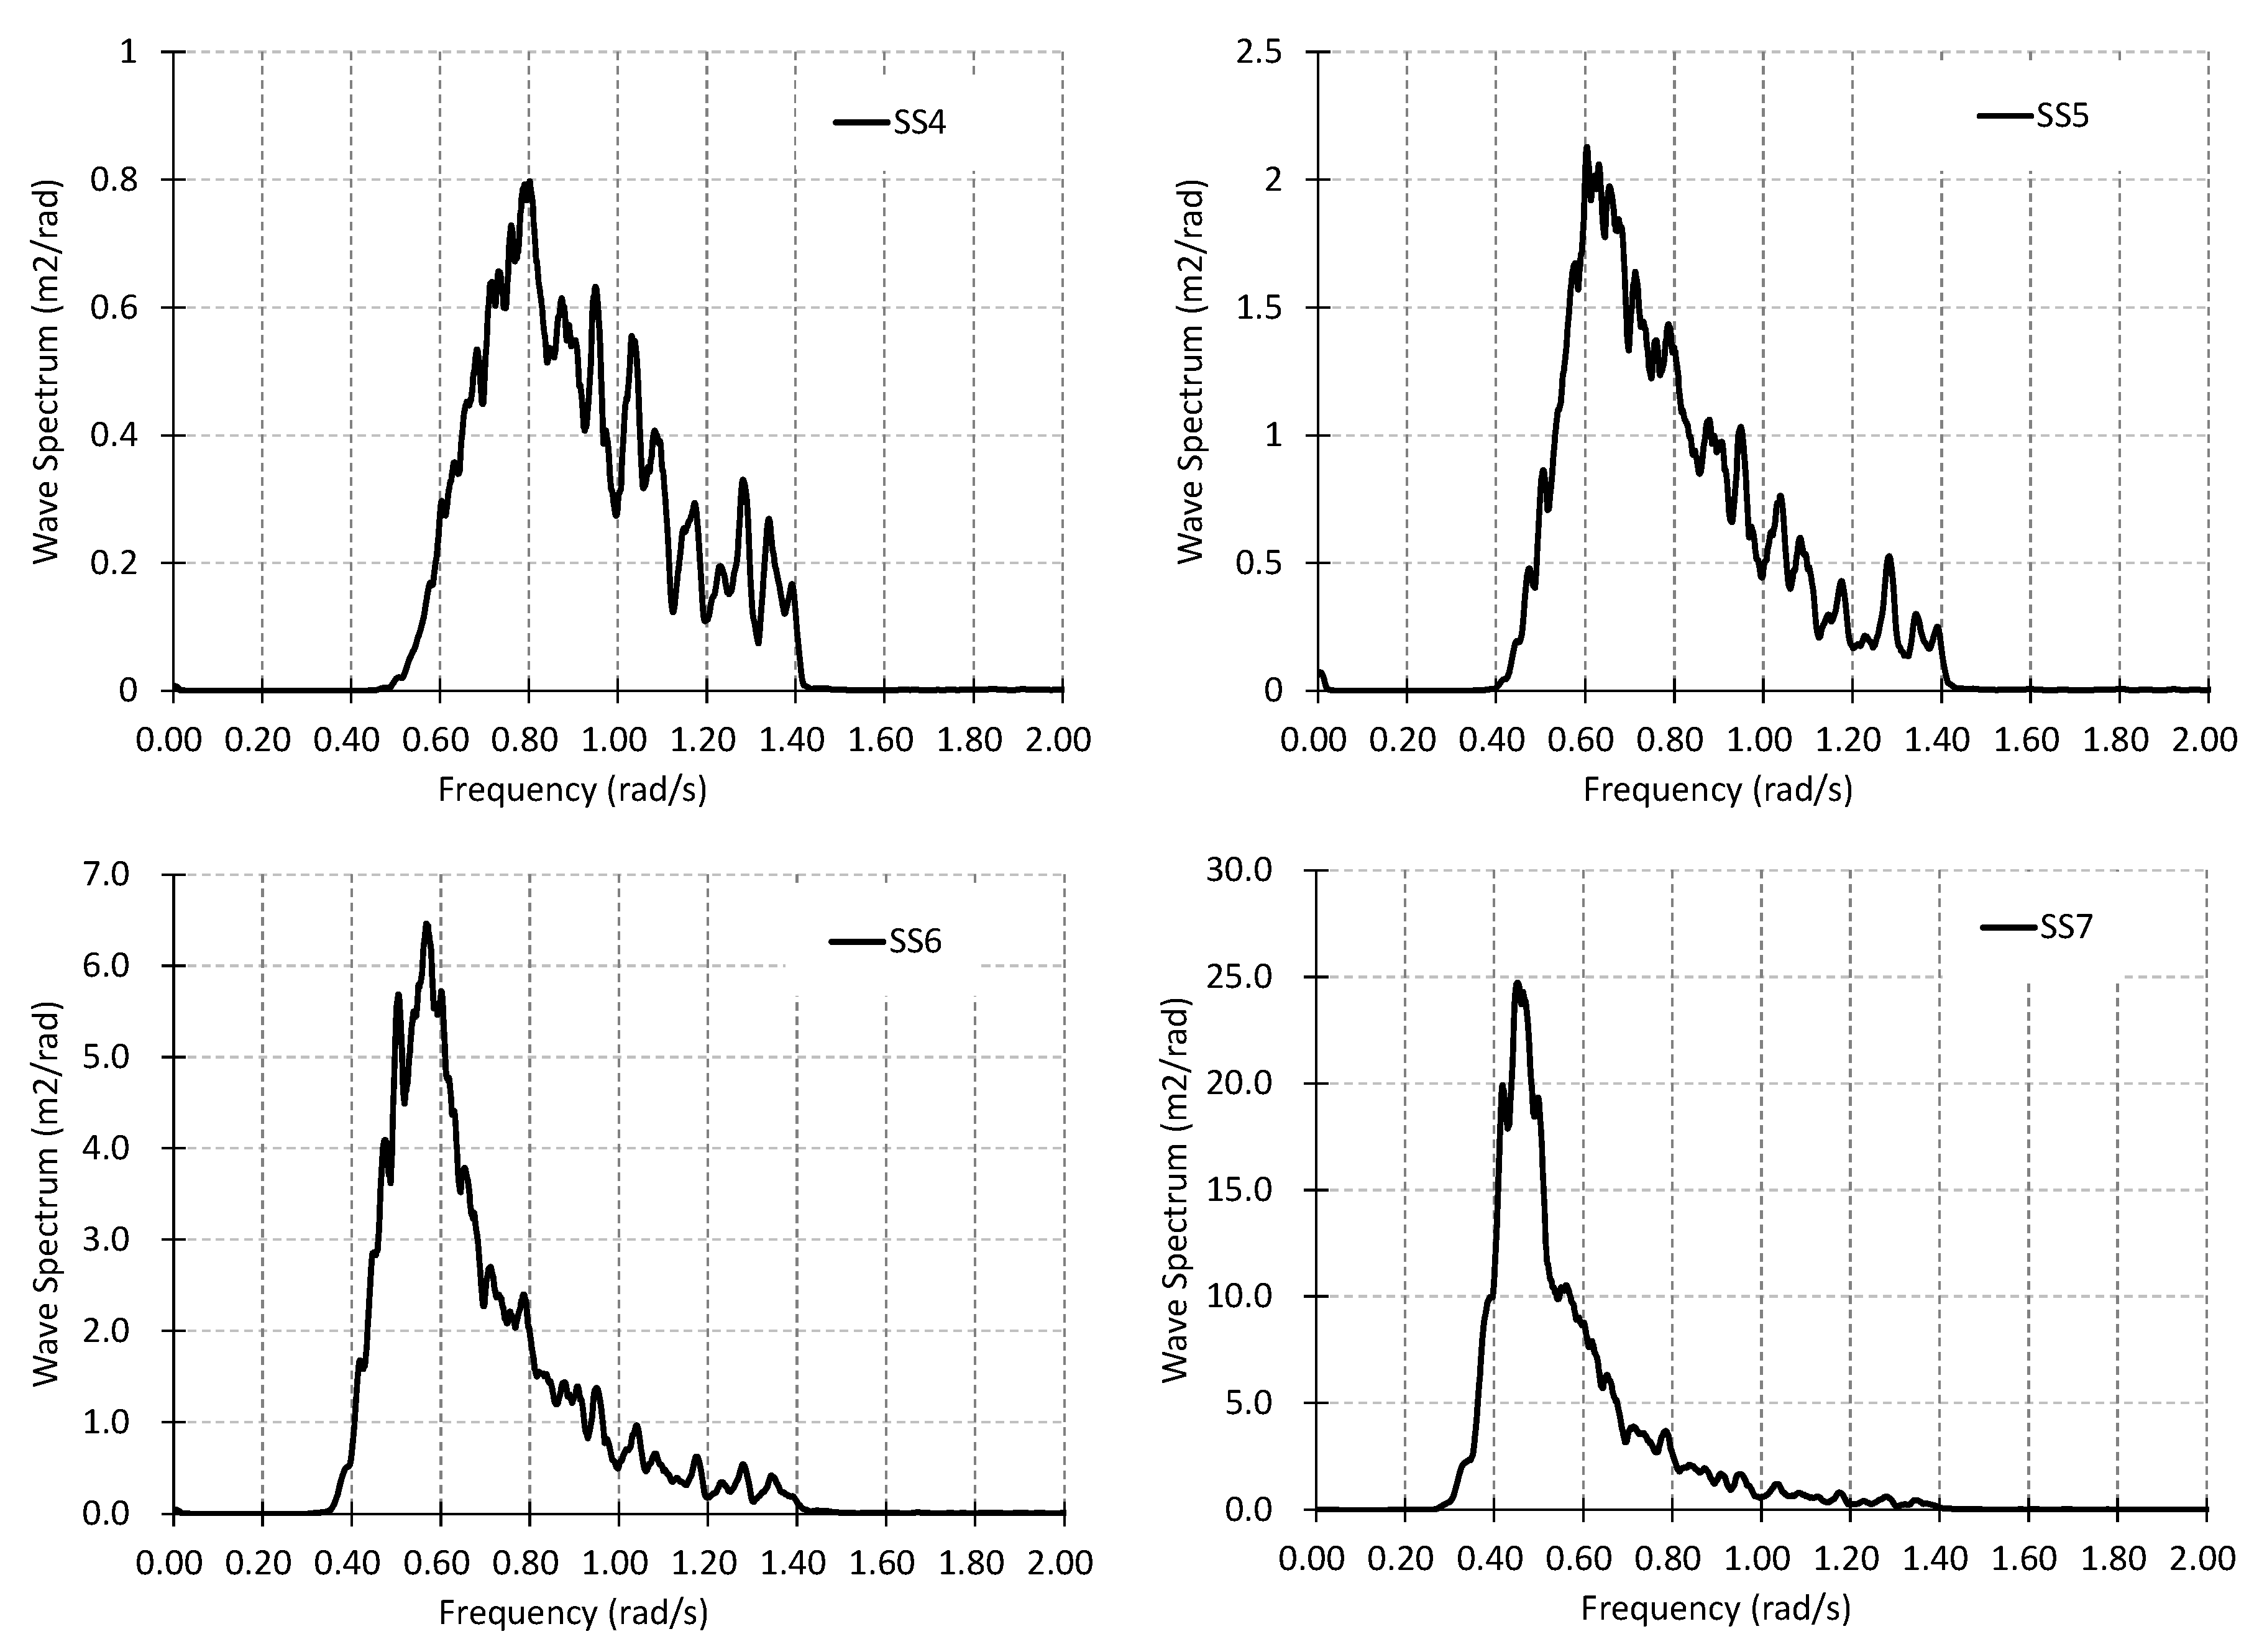
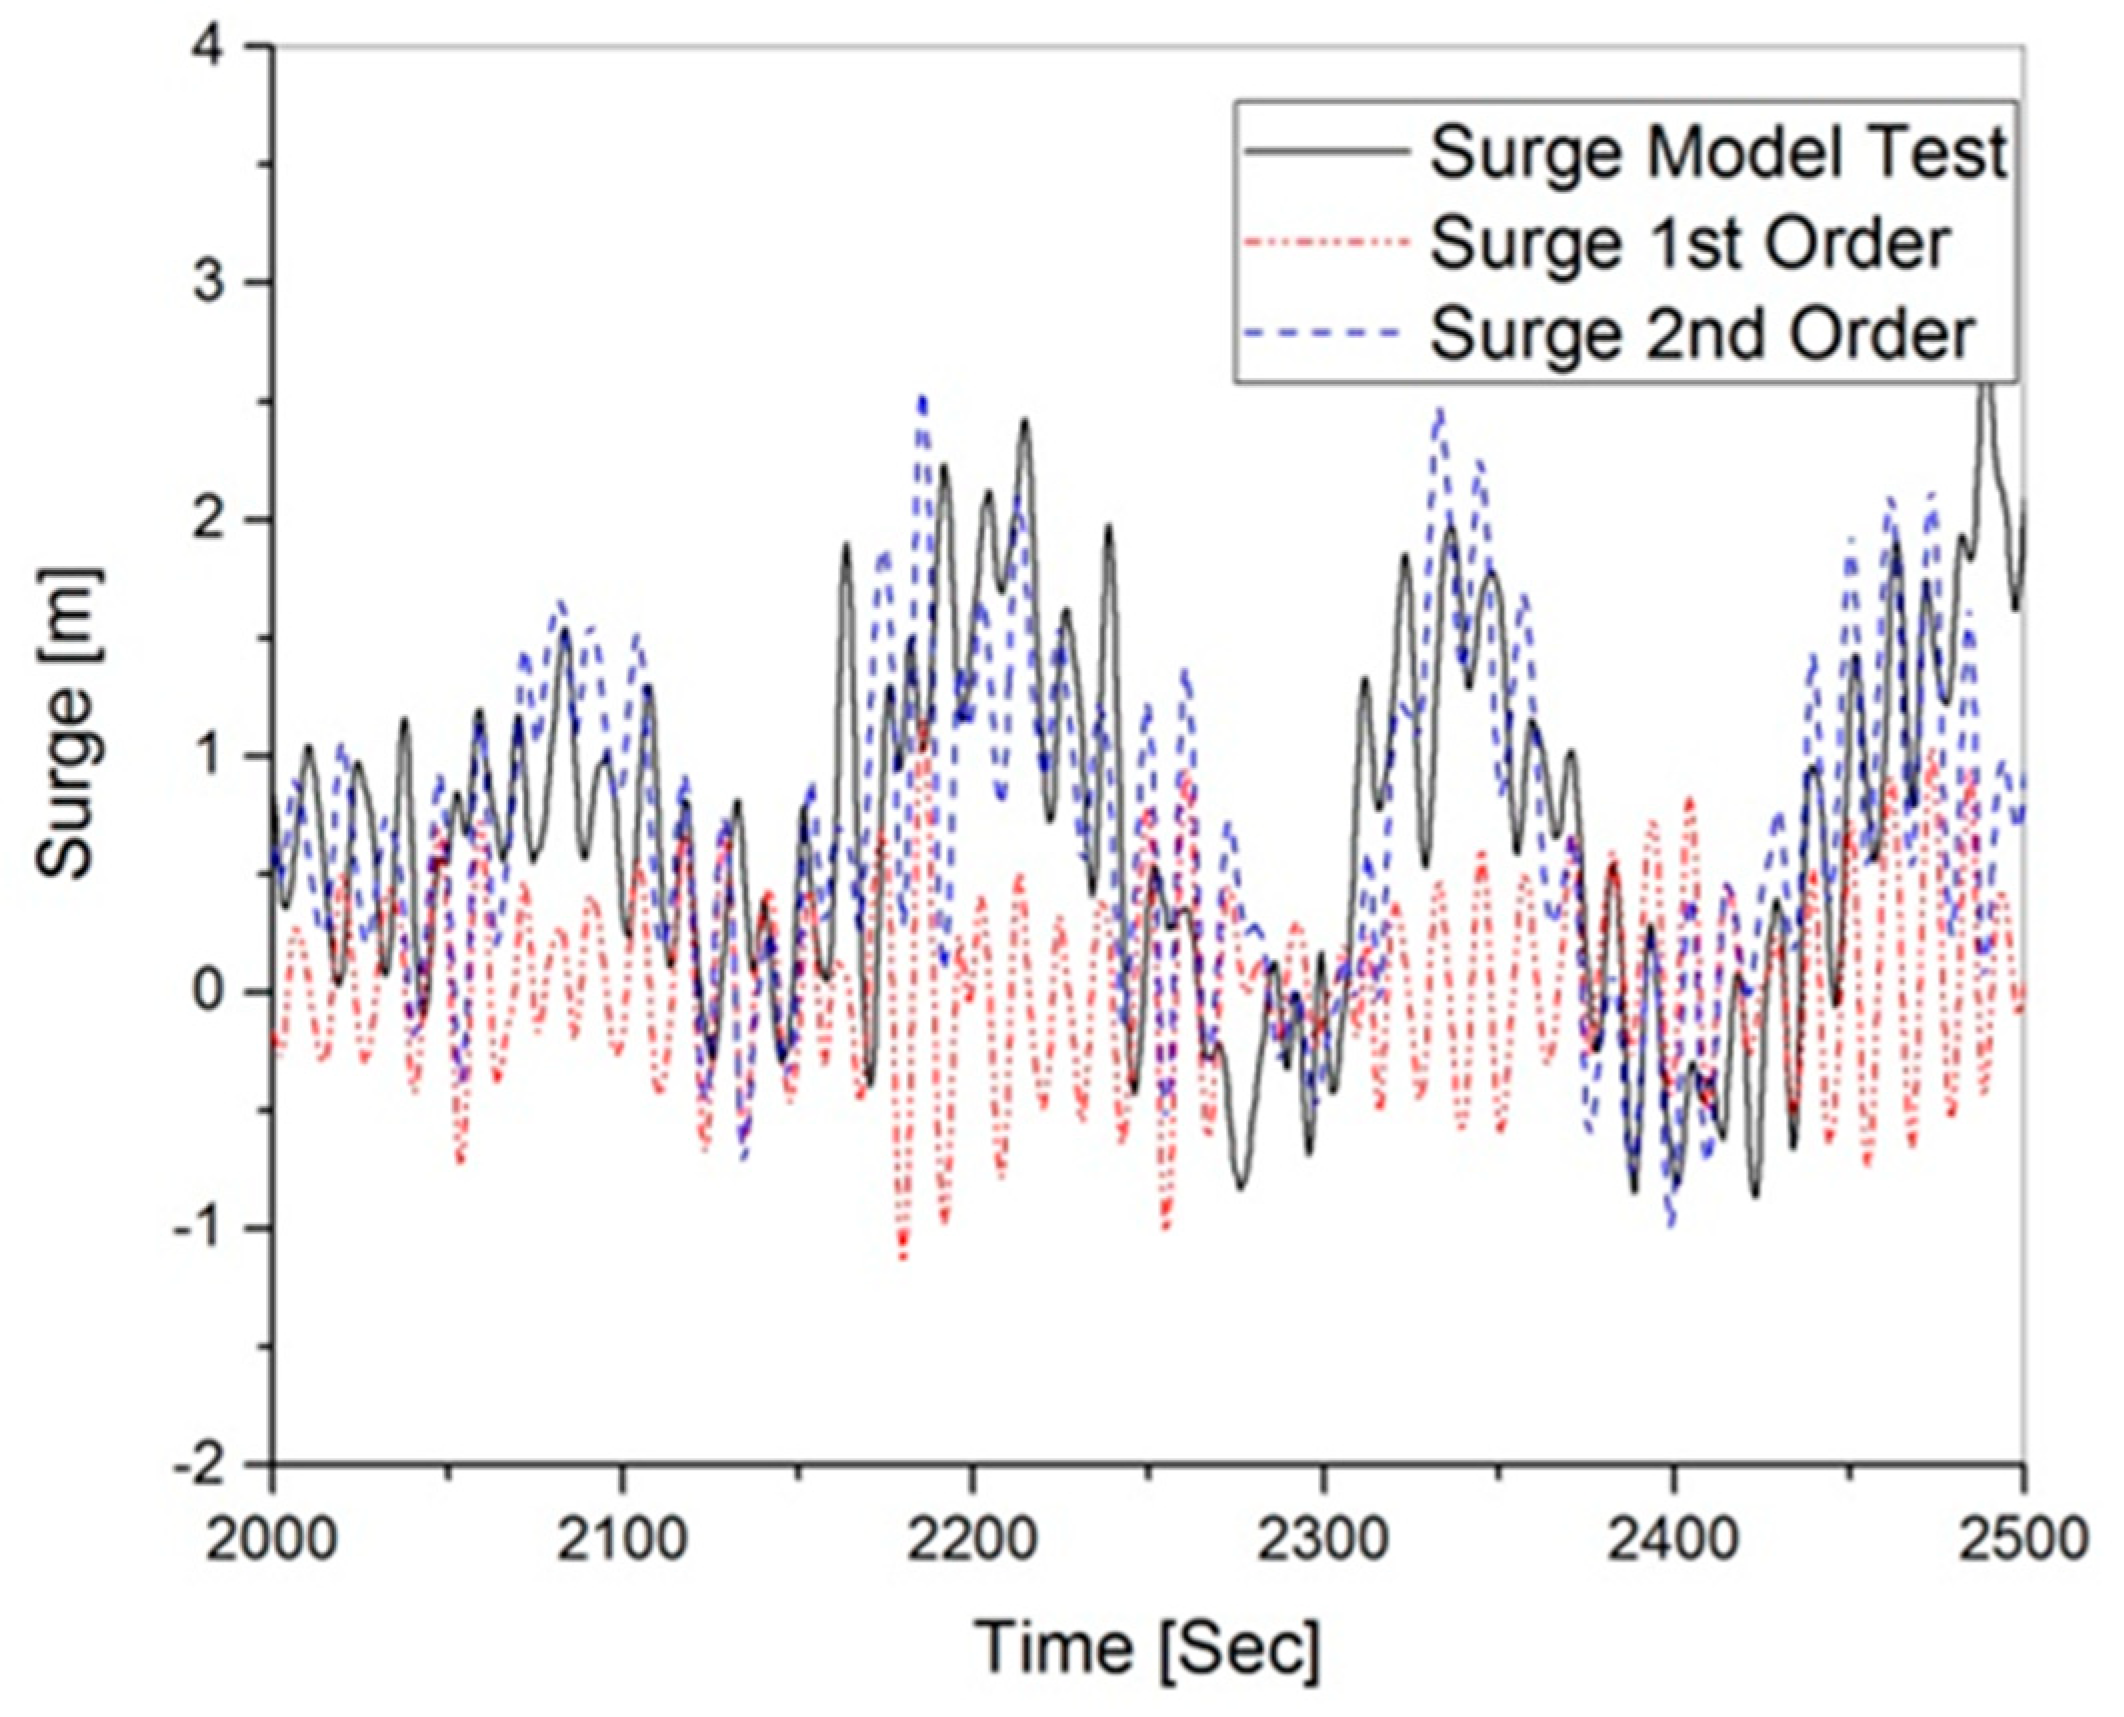
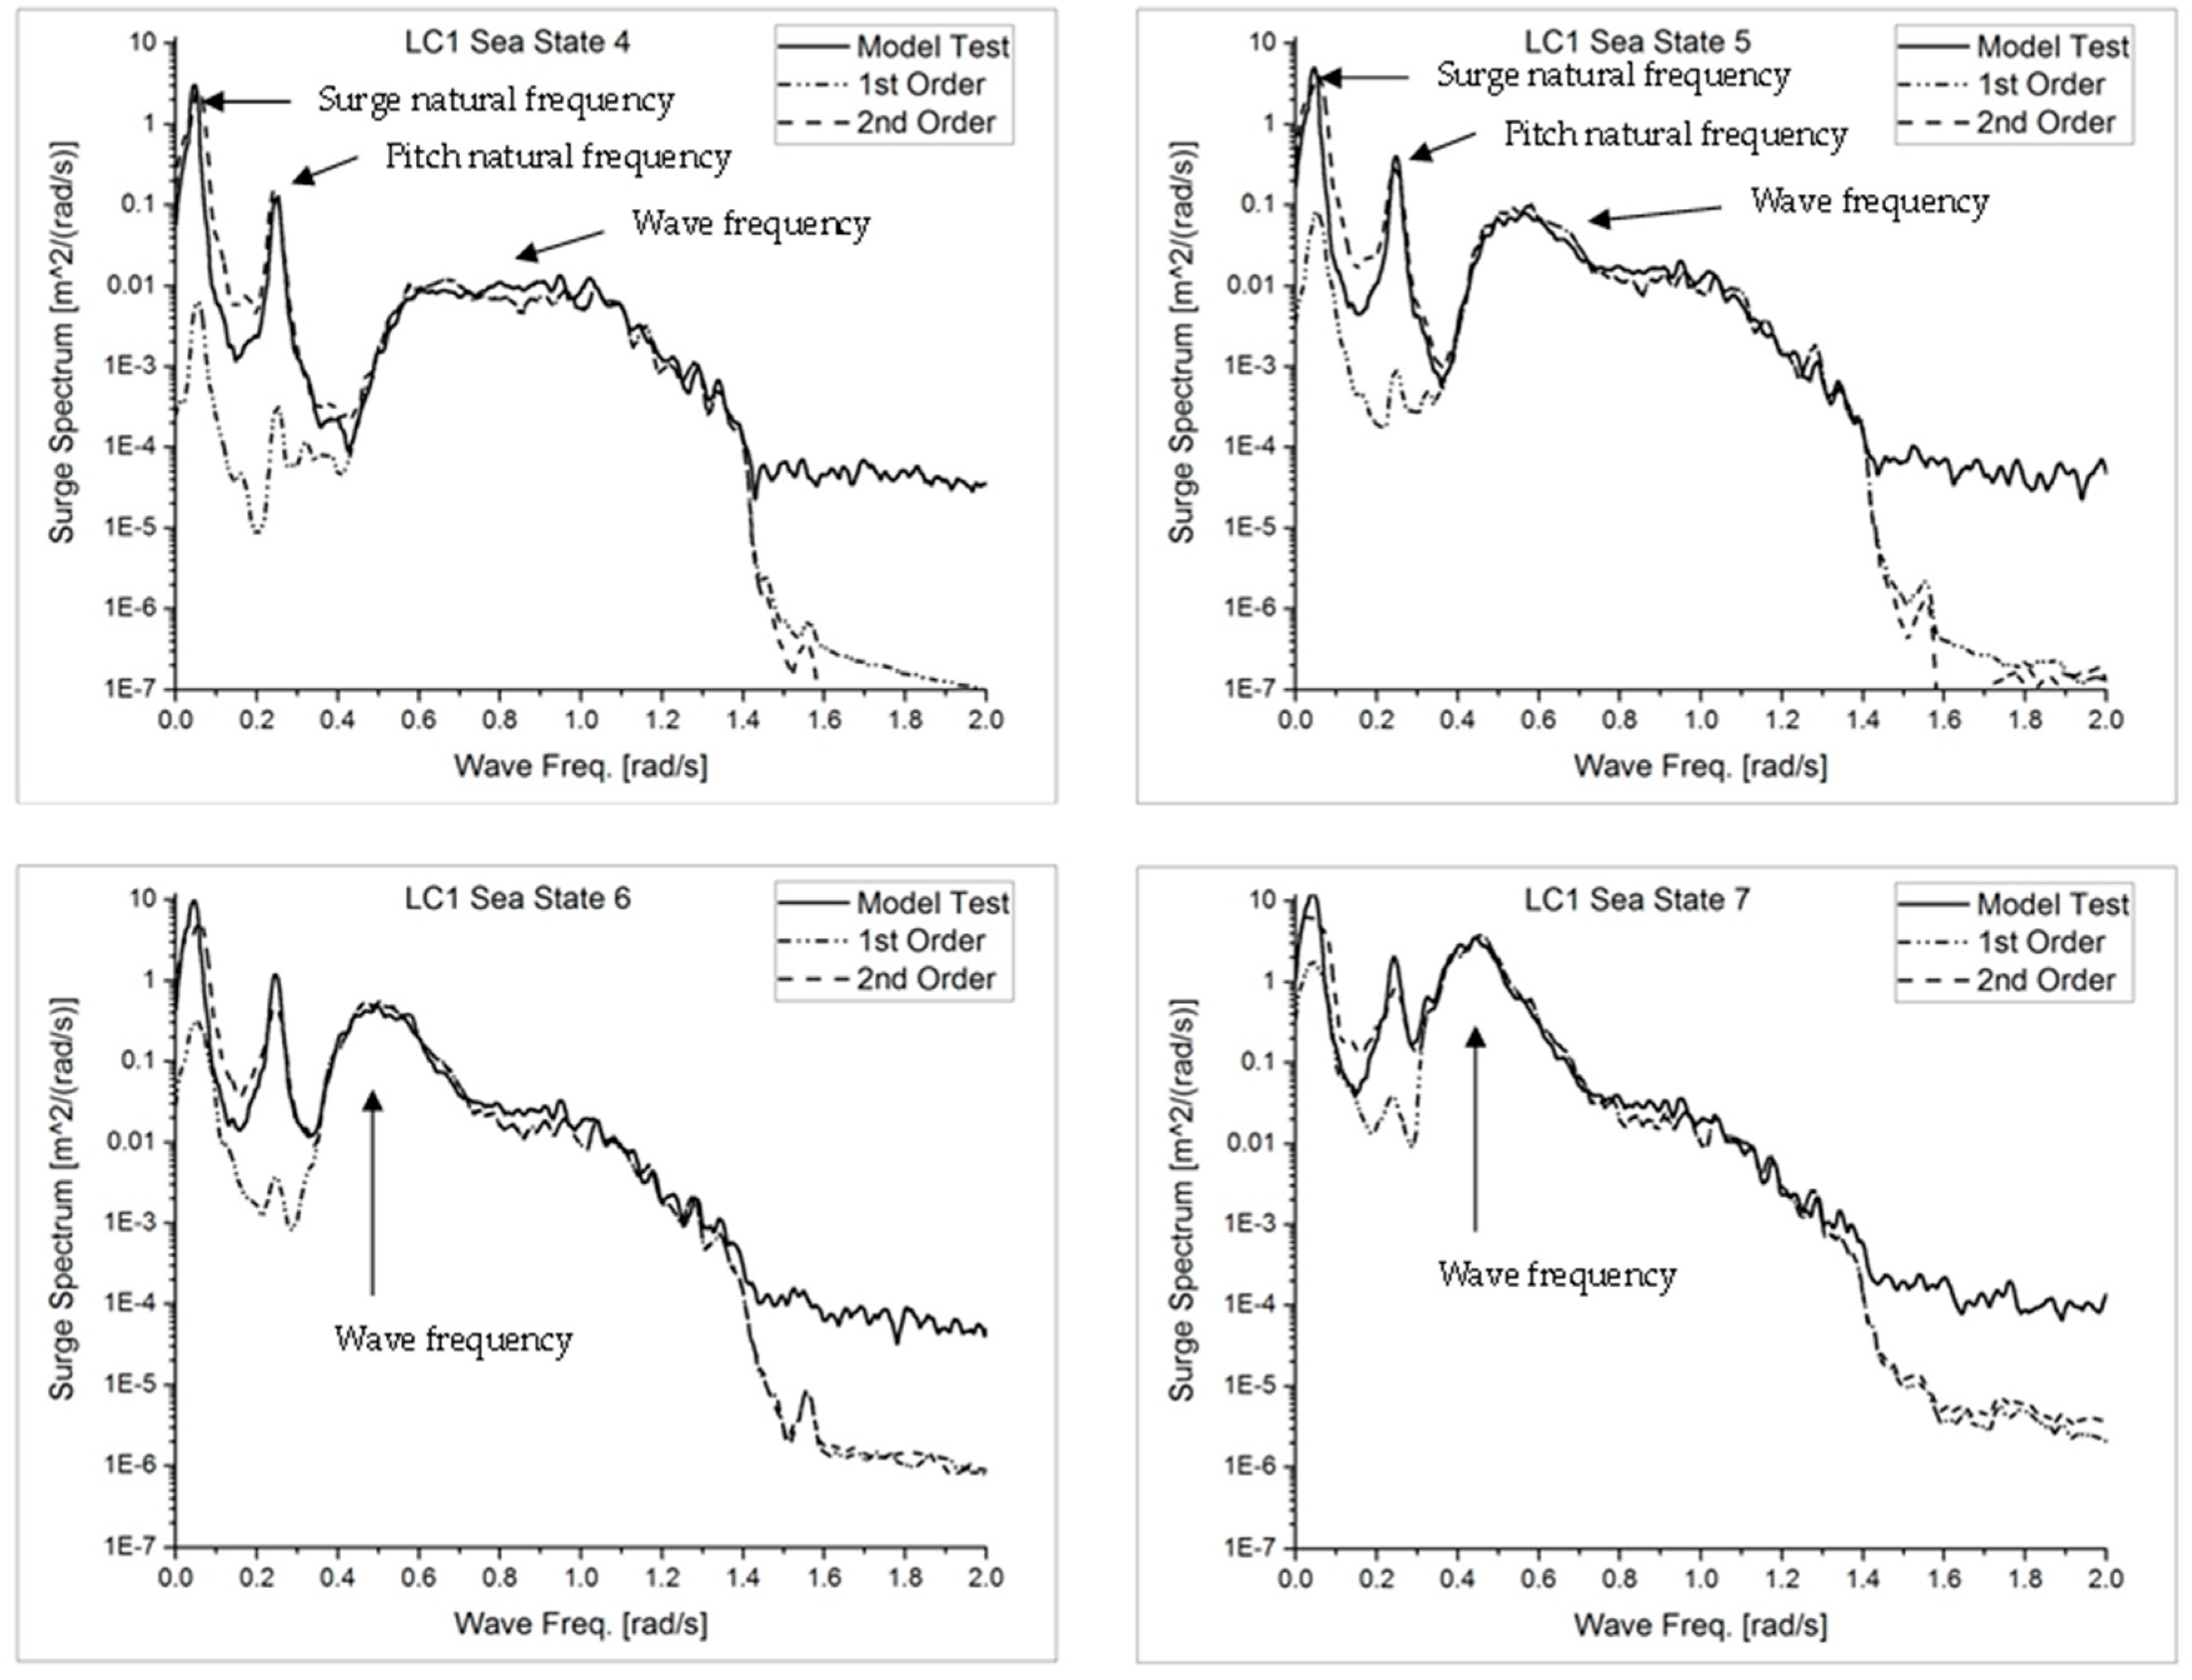
3.2. Drift Motion in Irregular Waves

To obtain the drift motion of the semi-submersible FOWT system, the tests were conducted for two load cases (LC), namely LC1 and LC2. In LC1, there were only irregular waves, and the wind turbine was fixed with no wind. LC2 combined irregular waves and an operational wind turbine in the rated rotor speed and at tuned wind speed for matching the rated thrust force. By applying the Froude scale for environmental conditions, the floating offshore wind turbine model test could be performed in wind and wave wind-wave tanks. However, a Froude-scaled wind turbine could not achieve the correct wind force. Only rated thrust force was considered in LC2; therefore, a fixed base model test was performed to determine the wind speed for matching the rated thrust force of the model tests. It had to be done before carrying out model tests of the FOWT. The fixed base model was installed in the same position as the floating offshore wind turbine model location in the water tank. The distance from the free surface to the center of the hub of the fixed base model was kept the same as one of the FOWT model tests. At the top of the tower, a dynamometer was equipped to measure thrust forces. Figure 7 shows that to obtain the rated thrust force for the model tests, the wind speed needed to increase from 1.275 m/s (as 11.4 m/s at full scale) to 2.4 m/s. Irregular waves were made by the wave maker based on the JONSWAP spectrum. Wave elevation was recorded by a wave probe at the same distance with the FOWT model to the wave maker. Figure 8 presents the model test irregular wave spectrums at full scale. Details of environmental conditions are given in Table 4. In all tests, waves and wind heading angles were set at zero degrees, so drift motion was represented by surge motion.
In model tests, irregular waves were generated in 600 s, which equals 5367 s on a full scale. At the same time with generated waves, 6 DOFs of platform motions were captured. The all recorded model test data was scaled up to full scale for analysis. After removing 1000 s in the beginning, the next 3600 s of waves and motions were used for analysis. Figure 9 shows an example of the surge response in time-series for only an irregular wave case. In the figure, the label “1st Order” represents the result of only the first-order hydrodynamic simulation, and “2nd Order” represents the results of the first-order and the second-order hydrodynamic simulation. As can be seen, the global surge response, which was predicted by including the second-order hydrodynamic, was a good match with the model test data, and both were different from the surge response obtained by the only first-order hydrodynamic, significantly.
Comparisons of the surge frequency–domain responses are presented in Figure 10 and Figure 11 for the model test data and two different FAST simulations. Two FAST simulations included the simulation with only first-order wave loads and the simulation including first-order and second-order wave loads. Those are the results from four sea states in LC1—only irregular waves, and in LC2—irregular waves with the rated thrust force of the 5 MW wind turbine. In all sea states of LC1 and LC2, surge response spectrums were large at the surge natural frequency. Comparing the test data to the simulation results, it is clear to see that the FAST model that used only the first-order wave force was underestimated at the low-frequency response of the system, and the FAST model including the second-order wave load improved the simulation significantly. The drift motion at the surge natural frequency was due to the resonance response of the FOWT system under the excitation of the second-order wave loads and the thrust force of the wind turbine. Comparing the surge response spectrum between the cases without rated thrust force (LC1) and with rated thrust force (LC2) for each sea state, the peak values were almost similar. This shows that the second-order wave loads were dominant compared to the surge response at the surge natural frequency. The resonance responses were significantly dependent on the applied damping force of the system. In the FAST model, the drag coefficients were assumed to be constant for all sea states; in fact, the drag coefficients may have changed with different sea states, because the drag coefficient was estimated based on the Reynold’s number [27].

4. Conclusions

In this paper, the semi-submersible floating platform that supports a 5 MW offshore wind turbine was modelled by numerical simulations and scaled model tests. The numerical simulation model was built by NREL FAST code. The hydrodynamic model of the semi-submersible floating platform was generated by UOU in-house codes as input data to the FAST code. The model test was carried out at the water tank of UOU with a scaled ratio of 1:80.
The platform surge responses were obtained from model tests and numerical simulations under four irregular waves with and without wind turbine operational conditions in LC1 and LC2, respectively. The surge responses from numerical simulation including the effect of second-order wave loads show good agreement with model test results. The second-order wave loads are dominant to the surge response at the surge natural frequency. In the FAST model, the damping coefficients are assumed to be constant for all sea states; in fact, the damping coefficient may change with different sea states.
The second-order difference-frequency hydrodynamic coefficients generated by UOU in-house codes can be input to FAST code for predicting the drift motion of the semi-submersible FOWT.

Author Contributions

Conceptualization, supervision, H.S.; methodology, software, investigation, writing—original draft, writing—review & editing, T.-D.P. Both authors have read and agreed to the published version of the manuscript.

Funding

This work was supported by the Korea Institute of Energy Technology Evaluation and Planning (KETEP), the Ministry of Trade, Industry, and Energy (MOTIE) of the Republic of Korea (No. 20184030202280), and the Korea Electric Power Corporation (No. R18XA03)

Acknowledgments

The authors thank the anonymous reviewers and all the editors in the process of manuscript revision.

Conflicts of Interest

The authors declare no conflict of interest.

References

  1. Musial, W.; Butterfield, S.; Ram, B. Energy From Offshore Wind. In Proceedings of the Offshore Technology Conference, Houston, TX, USA, 1–4 May 2006. [Google Scholar]
  2. Roddier, D.; Cermelli, C.; Aubault, A.; Weinstein, A. WindFloat: A floating foundation for offshore wind turbines. J. Renew. Sustain. Energy 2010, 2, 33104. [Google Scholar] [CrossRef]
  3. Kvittem, M.I.; Berthelsen, P.A.; Eliassen, L.; Thys, M. Calibration of Hydrodynamic Coefficients for a Semi-Submersible 10 MW Wind Turbine. In Proceedings of the ASME 2018 37th International Conference on Ocean, Offshore and Arctic Engineering, Madrid, Spain, 17–22 June 2018. [Google Scholar]
  4. Robertson, A.; Jonkman, J.; Masciola, M. Definition of the Semisubmersible Floating System for Phase II of OC4; National Renewable Energy Laboratory-NREL: Golden, CO, USA, 2014. [Google Scholar]
  5. Huijs, F.; de Bruijn, R.; Savenije, F. Concept Design Verification of a Semi-submersible Floating Wind Turbine Using Coupled Simulations. Energy Procedia 2014, 53, 2–12. [Google Scholar] [CrossRef] [Green Version]
  6. Liu, Y.; Li, S.; Yi, Q.; Chen, D. Developments in semi-submersible floating foundations supporting wind turbines: A comprehensive review. Renew. Sustain. Energy Rev. 2016, 60, 433–449. [Google Scholar] [CrossRef]
  7. Pham, T.D.; Shin, H. Validation of a 750kW semi-submersible floating offshore wind turbine numerical model with model test data, part I: Model-I. Int. J. Nav. Archit. Ocean Eng. 2019, 11, 980–992. [Google Scholar] [CrossRef]
  8. Bachynski, E.E.; Moan, T. Design considerations for tension leg platform wind turbines. Mar. Struct. 2012, 29, 89–114. [Google Scholar] [CrossRef]
  9. Oguz, E.; Clelland, D.; Day, A.H.; Incecik, A.; López, J.A.; Sánchez, G.; Almeria, G.G. Experimental and numerical analysis of a TLP floating offshore wind turbine. Ocean Eng. 2018, 147, 591–605. [Google Scholar] [CrossRef] [Green Version]
  10. Kausche, M.; Adam, F.; Dahlhaus, F.; Großmann, J. Floating offshore wind—Economic and ecological challenges of a TLP solution. Renew. Energy 2018, 126, 270–280. [Google Scholar] [CrossRef]
  11. Jonkman, J. Definition of the Floating System for Phase IV of OC3; Contract.1,31 2010; National Renewable Energy Lab.: Golden, CO, USA, 2010. [Google Scholar]
  12. Bredmose, H.; Lemmer, F.; Borg, M.; Pegalajar-Jurado, A.; Mikkelsen, R.F.; Larsen, T.S.; Fjelstrup, T.; Yu, W.; Lomholt, A.K.; Boehm, L.; et al. The Triple Spar campaign: Model tests of a 10MW floating wind turbine with waves, wind and pitch control. Energy Procedia 2017, 137, 58–76. [Google Scholar] [CrossRef] [Green Version]
  13. Utsunomiya, T.; Matsukuma, H.; Minoura, S.; Ko, K.; Hamamura, H.; Kobayashi, O.; Sato, I.; Nomoto, Y.; Yasui, K. On Sea Experiment of a Hybrid SPAR for Floating Offshore Wind Turbine Using 1/10 Scale Model. In Proceedings of the ASME 29th International Conference on Ocean, Offshore and Arctic Engineering, Shanghai, China, 6–11 June 2010; pp. 529–536. [Google Scholar]
  14. Shin, H.; Dam, P.T.; Jung, K.J.; Song, J.; Rim, C.; Chung, T. Model test of new floating offshore wind turbine platforms. Int. J. Nav. Archit. Ocean Eng. 2013, 5, 199–209. [Google Scholar] [CrossRef] [Green Version]
  15. Shin, H.; Lee, W.; Jung, K.; Kim, J. Model test and simulation of modified spar type floating offshore wind turbine with three catenary mooring lines. J. Renew. Sustain. Energy 2014, 6, 042009. [Google Scholar] [CrossRef]
  16. Jonkman, B.; Jonkman, J. FAST v8. Available online: https://nwtc.nrel.gov/FAST8 (accessed on 27 July 2016).
  17. Sintef Ocean Website. Available online: https://www.sintef.no/projectweb/nowitech/innovation/simo-riflex-trl7/ (accessed on 29 October 2020).
  18. HAWC2 Website. Available online: http://www.hawc2.dk/hawc2-info (accessed on 29 October 2020).
  19. DNV.GL. Available online: https://www.dnvgl.com/services/wind-turbine-design-software-bladed-3775 (accessed on 29 October 2020).
  20. Orcaflex Website. Available online: https://www.orcina.com/orcaflex/ (accessed on 29 October 2020).
  21. Kim, H.C.; Kim, M.H. Global performances of a semi-submersible 5MW wind-turbine including second-order wave-diffraction effects. Ocean Syst. Eng. 2015, 5, 139–160. [Google Scholar] [CrossRef]
  22. Couling, A.J.; Goupee, A.J.; Robertson, A.N.; Jonkman, J.M. Importance of Second-Order Difference-Frequency Wave-Diffraction Forces in the Validation of a Fast Semi-Submersible Floating Wind Turbine Model. In International Conference on Offshore Mechanics and Arctic Engineering; American Society of Mechanical Engineers: Nantes, France, 2013. [Google Scholar]
  23. Zhang, L.; Shi, W.; Karimirad, M.; Michailides, C.; Jiang, Z. Second-order hydrodynamic effects on the response of three semisubmersible floating offshore wind turbines. Ocean Eng. 2020, 207, 107371. [Google Scholar] [CrossRef]
  24. Jonkman, J.; Butterfield, S.; Musial, W.; Scott, G. Definition of a 5-MW Reference Wind Turbine for Offshore System Development; National Renewable Energy Laboratory-NREL: Golden, CO, USA, 2009. [Google Scholar]
  25. Jonkman, J.M. Dynamics Modeling and Loads Analysis of an Offshore Floating Wind Turbine; NREL/TP-500-41958; National Renewable Energy Lab.: Golden, CO, USA, 2007. [Google Scholar]
  26. Pinkster, J.A. Low Frequency Second Order Wave Exciting Forces on Floating Structures. Ph.D. Thesis, Delft University of Technology, Wageningen, The Netherlands, 1980. [Google Scholar]
  27. Catalano, P.; Wang, M.; Iaccarino, G.; Moin, P. Numerical simulation of the flow around a circular cylinder at high Reynolds numbers. Int. J. Heat Fluid Flow 2003, 24, 463–469. [Google Scholar] [CrossRef]
Figure 1. OC4 semi-submersible floating offshore wind turbine (FOWT) system.
Jmse 08 00859 g001
Figure 2. Model tests of the 5 MW semi-submersible platform model in the water tank of Ulsan University (UOU).
Jmse 08 00859 g002
Figure 3. FAST-UOU structure.
Jmse 08 00859 g003
Figure 4. Amplitude of difference-frequency QTF for surge.
Jmse 08 00859 g004
Figure 5. Drag coefficients of OC4 semi-submersible components, where Cd is the drag coefficient in the horizontal direction, and Cdz is the drag coefficient in the vertical direction.
Jmse 08 00859 g005
Figure 6. Free decay test comparison between model test and simulation for surge, heave, pitch, and yaw.
Jmse 08 00859 g006
Figure 7. Comparison of the tower top thrust forces between fixed base model test and simulation (results are presented at a model scale ratio).
Jmse 08 00859 g007
Figure 8. Four irregular wave spectrums generated by the wave maker for model tests (results are presented at a full scale ratio).
Jmse 08 00859 g008
Figure 9. Time history comparison of the platform surge motion under only an irregular wave from test data and two different FAST simulations.
Jmse 08 00859 g009
Figure 10. Surge spectrums of four sea states in LC1 (only irregular waves).
Jmse 08 00859 g010
Figure 11. Surge spectrums of four sea states in LC2 (irregular waves, operational wind turbine with rated thrust force).
Jmse 08 00859 g011
Table 1. OC4 semi-submersible properties.
DescriptionUnitModel Scale (1:80)Full Scale
Water Depthm2.5200
Turbine CapacityMW5
Rotor Masskg0.215110,000
Hub Masskg0.11156,780
Blade Masskg0.03517,740
Nacelle Masskg0.469240,000
Tower Heightm0.9777.6
Tower Masskg0.488249,718
Tower Top Diameterm0.0483.87
Tower Base Diameterm0.0816.5
Platform Lengthm0.432
Base Column Diameterm0.324
Upper Column Diameterm0.1512
Main Column Diameterm0.0816.5
Platform Masskg26.31413,473,000
Table 2. Comparison between measuring and target properties of the platform scaled model.
DescriptionUnitFull ScaleTarget (1:80)MeasuredDifference
Platform Masskg13,473 × 10326.3125.78−2.031%
Roll Inertiakg∙m26.827 × 1092.0832.01−3.505%
Pitch Inertiakg∙m26.827 × 1092.0832.01−3.505%
Distance between Platform Bottom to Center of Gravitym6.540.0820.0831.529%
Table 3. Mooring line properties.
DescriptionUnitFull ScaleModel Scale 1:80
Number of Mooring Lines33
Depth to Fairleads below SWLm140.175
Un-stretched Mooring Line Lengthm835.5010.444
Mooring Line Diameterm0.0770.001
Equivalent Mass Densitykg/m113.350.0177
Equivalent Weight in WaterN/m108.630.017
Equivalent Extensional StiffnessN753.6 × 1061472
Angle Between Adjacent Mooring LinesDegree120120
Depth to Fairlead below SWLm140.175
Depth to Anchors below SWLm2002.5
Radius from Platform Center-line to Fairleadsm40.870.511
Radius from Platform Center-line to Anchorsm837.6010.470
Table 4. Environmental conditions and wind turbine operational status of LC1 and LC2.
Load CasesSea State (SS)Full ScaleModel Scale (1:80)
Irregular Wave (JONSWAP)Wind SpeedRotor SpeedIrregular Wave (JONSWAP)Wind SpeedRotor Speed
Hs(m)Tp(s)(m/s)(rpm)Hs(m)Tp(s)(m/s)(rpm)
LC1SS42.448.1000.0310.9060Fixed
SS53.669.7000.0461.0840Fixed
SS65.4911.3000.0691.2630Fixed
SS79.1413.6000.1141.5210Fixed
LC2SS42.448.111.412.10.0310.9062.4108.2
SS53.669.711.412.10.0461.0842.4108.2
SS65.4911.311.412.10.0691.2632.4108.2
SS79.1413.611.412.10.1141.5212.4108.2
Publisher’s Note: MDPI stays neutral with regard to jurisdictional claims in published maps and institutional affiliations.

