Article

Lagoon Biogeochemical Processing is Reflected in Spatial Patterns of Sediment Stable Isotopic Ratios

by
Elizabeth Burke Watson
1,
Alejandro Hinojosa-Corona
2,
Johannes R. Krause
1,*,
Juan Carlos Herguera
2,
Julianna McDonnell
3,
Karen Raquel Villegas Manríquez
2,
Michelle E. Gannon
1 and
Andrew B. Gray
3
1
Department of Biodiversity, Earth and Environmental Sciences, Drexel University, Philadelphia, PA 19104, USA
2
Departamento de Geología, Centro de Investigación Científica y de Educación Superior de Ensenada, 22860 Ensenada, BC, Mexico
3
Department of Environmental Sciences, University of California, Riverside, CA 92521, USA
*
Author to whom correspondence should be addressed.
J. Mar. Sci. Eng. 2020, 8(11), 874; https://doi.org/10.3390/jmse8110874
Submission received: 18 September 2020 / Revised: 29 October 2020 / Accepted: 30 October 2020 / Published: 3 November 2020

Abstract

:
The spatial analysis of biota, particulate organic matter, and sediments for stable isotopes of carbon (δ13C), nitrogen (δ15N), and sulfur (δ34S) have proved useful for identifying patterns in productivity, nutrient pollution, and relationships between biological and physiochemical variables at the local and global scales. Yet such approaches are rarely applied to studies of lagoon or estuarine metabolism. Focusing on Bahía San Quintín, a heterotrophic seagrass-dominated lagoon on the Pacific coast of Baja California, México, we report on spatial patterns in surficial sediment CNS stable isotopic ratios as tracers of lagoon biogeochemical function. Stable nitrogen isotopes highlighted potential spatial variability in the balance between denitrification and nitrogen-fixation within the lagoon and identified an association between elevated δ15N levels and oyster culture, suggesting that oyster presence may be enhancing N2 production. Spatial patterns in δ34S covaried with sediment particle size, underlining the importance of sediment texture in determining the depth of sub-oxic-anoxic redox zones. Sediment carbon stable isotope ratios highlighted the lack of incorporation of seagrass carbon into seagrass meadow sediments, thus emphasizing the importance of phytoplankton or microphytobenthos for carbon accumulation in seagrass meadows. This report highlights the value of sediment isotopic values in corroborating spatial patterns in estuarine metabolism or macronutrient processing identified from chamber or flux-based studies. Stable isotope mapping can provide a useful addition to assessment of estuarine metabolism, or act as a stand-alone tool for generating hypotheses, identifying the influence of spatial gradients, and/or suggesting prime locations for investigation of microbial abundance or function.

1. Introduction

In recent years, the analysis of biota, particulate organic matter, and sediments for stable isotopes of carbon (C), nitrogen (N), and sulfur (S) has emerged as a common and powerful approach for assessing estuarine, nearshore, and open-ocean ecosystems [1,2]. In nearshore environments, δ15N variation has been linked to marine vs. terrestrial N sources, upwelling, N-fixation, denitrification, and wastewater pollution [3,4]. Variation in δ34S has been shown to reflect salinity, sulfate reduction, and benthic organic matter sources, and δ13C variation has been linked to rates and patterns of primary production, depth, and aqueous CO2 signatures [3,5]. However, despite the demonstrated ability of landscape and regional-scale stable isotope analysis to uniquely reveal spatial gradients in ocean productivity [6], nutrient pollution plumes [7], and nutrient recycling [8], studies have only rarely applied this approach to coastal estuaries and lagoons [9]. Here, we focus on the ability of spatial patterns in CNS sediment isotope ratios (δ15N, δ34S, δ13C) to provide insight into patterns of macronutrient processing across a lagoonal landscape, including potential effects of seagrass presence and oyster aquaculture on biogeochemical cycling.
Rates of N cycling are often elevated in coastal marine habitats due to high organic matter inputs coupled with anaerobic respiration processes that use nitrate as a terminal electron acceptor [10]. Until recently, it was believed that denitrification, or the bacterially-mediated reduction of nitrate to N2 gas, dominated coastal N-processing [11]. Denitrification, which can return anthropogenically-derived reactive N to non-reactive N2 gas and therefore buffer the open ocean from the impacts of human-derived N pollution [12], has been particularly well-studied in the context of its role as an ecosystem service of societal value [13]. In addition, denitrification in the three ocean pelagic oxygen minimum zones is thought to be responsible for a large percentage of the total oceanic loss of N, and has therefore been a focus of investigation into global marine biogeochemical cycles [14]. However, with the widespread usage of isotopic tracer techniques [15], other pathways of N cycling have emerged as common constituents of the oceanic N cycle, including N-fixation [16]. Although N−fixation, or the microbially-mediated conversion of N2 gas to reactive N (NH4+), has traditionally been regarded as a minor coastal N source [17,18], recent studies have highlighted its importance [19,20]. N-fixation has been found particularly in oligotrophic coastal marine environments [21], tropical and sub-tropical waters inhabited by diazotrophic photoautotrophic cyanobacteria [22], and in association with seagrasses, whose exudates provide a labile C source to support N-fixation by heterotrophic bacteria [23]. Although the balance of denitrification vs. N-fixation in most coastal lagoons remains unresolved, stable N isotopes can be useful for discriminating N-fixation (which introduces bioavailable N at isotopic values ≈ 0‰), and denitrification which consumes lighter N at a faster rate, leaving the NO3 pool substantially enriched in 15N [5].
Sulfate is the most important electron acceptor for the anaerobic oxidation of organic matter in coastal sediments [24], due to the abundant pools of sulfate in seawater compared with other potential terminal electron acceptors [25]. Sulfate reduction is thus a key process in sub-oxic and anoxic marine environments. Sulfides are produced from sulfates and tend to accumulate dissolved in porewater, as gaseous sulfide, or precipitate with iron to form iron sulfide minerals (e.g., pyrite). The global average value for δ34S in seawater is +20.7‰ [26], but sulfate is fractionated during cycles of sulfate reduction and disproportionation, resulting in sulfide increasingly depleted in 34S [27]. Consequently, sedimentary sulfide has a δ34S signature of −15 to −25‰, which is preserved without fractionation when assimilated by plants [28]. Sulfur stable isotopes thus act as a tracer for anaerobic decomposition, in addition to benthic organic matter sources in coastal food webs.
Stable C isotopes in marine sediments or particulate organic matter often act as productivity tracers because of the partial CO2 limitation that occurs in highly productive aquatic environments. Photosynthesis discriminates against heavier C isotopes, but this photosynthetic fractionation is lower during periods of high growth rates and low aqueous CO2 concentrations [29]. However, in highly productive nearshore environments, including in seagrass meadows, light availability often acts as a primary control on production such that C stable isotopes vary along depth gradients [3,30]. In addition to depth and productivity, δ13C in estuarine sediments can also reflect organic matter sources (e.g., seagrass, phytoplankton, algal, terrestrial) due to divergence in photosynthetic pathways that are associated with different discrimination factors and C sources (CO2 vs. HCO3) [31].
This combination of naturally abundant stable isotopic tracers is especially relevant to understanding patterns of macronutrient cycling in seagrass-dominated coastal lagoons. Seagrasses rank among the most productive marine primary producers, and as ecosystem engineers that modify currents, trap sediments, and constrain benthic microbial communities, seagrass meadows modulate the mineralization and regeneration of organic matter [32]. Although net effects differ by species, seagrasses are known to modify biogeochemical conditions by exuding labile C which stimulates microbial processes and sulfate reduction, in addition to exuding oxygen, which promotes root zone oxidation [33]. In highly productive seagrass meadows, diel cycles in water column dissolved inorganic carbon (DIC), O2, and pH may occur, and seagrass beds may also act as both a source and a sink for C depending on the bed age and season [32]. Seagrass C and S stable isotopic ratios tend to be distinct from other marine primary producers because they readily assimilate bicarbonate [34] and experience sulfide intrusion [35], which result in heavier C and lighter S stable isotopic compositions, respectively. Although previous work has used this distinct isotopic profile to trace seagrass-derived organic matter in coastal sediments and food webs [36] and assess seagrass health relative to nutrient pollution and sulfide intrusion [35,37], few studies have focused on understanding how seagrass presence modifies patterns of sulfate reduction, N fixation, or denitrification at the landscape scale [38].
Another factor thought to shape coastal nutrient cycling is the establishment of shellfish aquaculture. As an important and growing industry [39], cultured shellfish may contribute to altered macronutrient cycles in coastal lagoons through depletion of phytoplankton, creation of biogeochemical hotspots in association with bio-wastes, and nutrient bioextraction associated with shellfish harvests and denitrification [13,40]. Although shellfish aquaculture of non-native species is often considered a disturbance from the perspective of sustainable management of Pacific coast estuaries [41], the reintroduction of native oysters and mussels is thought to support improved water quality in Atlantic estuaries [42]. Oyster restoration has also been associated with other beneficial services such as improved water clarity, habitat provision for fisheries, and wave attenuation [43,44]. Although previous studies of long-line shellfish aquaculture at low stocking densities have generally noted only minor habitat impacts [45], effects of aquaculture on lagoon nutrient cycling may extend further than culture racks. Therefore, impacts of shellfish aquaculture may be assessed through estuary-wide, spatially distributed sampling.
Here, we report on spatial patterns in surficial sediment stable isotope ratios (δ15N, δ34S, δ13C) in Bahía San Quintín (BSQ), an inverse lagoon on the Pacific Coast of Mexico, as tracers of lagoon biogeochemical function. The absence of terrestrial inputs due to highly episodic riverflows (once per decade) and intense groundwater overdraft that has reversed the flow of shallow groundwater [46] makes BSQ an ideal location to study oceanic-driven nutrient processing. Stable N isotopes were used to identify sedimentary signatures indicative of oceanic N (δ15N = 8–10; [47]), vs. contributions from denitrification or N-fixation, which would be reflected as enriched or depleted δ15N signatures, respectively [48]. S (δ34S) stable isotopes were used as tracers of sulfate reduction, which occurs in concert with anaerobic sediment respiration. Because BSQ is net heterotrophic [49], and anoxic respiration has been estimated to account for slightly less than half of the respiration of BSQ [50], sulfate reduction is likely an important tracer of benthic metabolism. Finally, C isotopes (δ13C) were evaluated relative to organic matter sources, aqueous CO2 sources, and spatial patterns of productivity and respiration. We used these stable isotopic tracers to focus on the following objectives: (1) to identify potential spatial patterns in N-fixation, denitrification, and S reduction, and relate these patterns to known spatial gradients in productivity, depth, and benthic sediment characteristics, and (2) to identify how seagrass cover and oyster culture are associated with patterns of altered biogeochemical function, with the ultimate goal of advancing the use of sediment isoscape data to inform studies of lagoon biogeochemical dynamics.

2. Materials and Methods

Research was conducted at BSQ (Figure 1A), a hypersaline lagoon located on the northwestern coast of Baja California (30.4152° N, −115.9541° W). The lagoon has an area of 42 km2, is covered by extensive seagrass beds, and experiences semi-diurnal mixed tides that range from 1.0 m (neap) to 2.5 m (spring). The structure of the lagoon is defined by the San Quintín volcanic field, which includes eight volcanic complexes and two isolated volcanos (Mt. Mazo and Isla San Martín), which date to Pleistocene and Holocene in age [51]. The lava fields formed as subaqueous volcanos which emerged as islands, and then acted as traps for sand transported by longshore drift [52]. The western boundary of the lagoon is a large tombolo separating two volcanic cones [53], while the sand spit that forms the southern limit of the lagoon has been built by wave refraction and northerly drift in the lee of the outer spit and cones [54].
Rainfall at BSQ averages 143 mm y−1; yearly evaporation averages 1436 mm y−1 [55]; and the lagoon experiences surface water inflow on average every 10 y, and groundwater inflow on average every 4 y [46]. Thus, the lagoon is persistently hypersaline throughout the year, with salinity levels increasing from the oceanic inlet towards the heads [49]. Tidal exchange occurs through a single mouth that divides into two arms: the eastern arm is known as Brazo de San Quintín, and the western arm is known as Bahía Falsa (BF). The depth of the lagoon is less than 2 m, except in channels where depths range from 5 to 8 m [56]. Cultivation of the pacific oyster, Crassostera gigas, was introduced to BF in the 1970s, because BF has higher phytoplankton concentrations [49], and up to 5000 tons are produced there annually [57]. Coastal upwelling associated with the California Current System is considered the main source of nutrients to BSQ, and upwelling tends to be most intense in the spring-summer period when northwesterly winds are strongest.
Surface sediment grabs were collected from BSQ in November 2016 using a Van Veen sediment grab sampler (69 samples), and in July 2018 using a petite Ponar grab sampler (15 samples), and processed for bulk stable isotopic ratios, organic and inorganic C content, N content, particle size distribution, loss on ignition, and bulk density. Benthic cover of seagrass was recorded using a submerged camera (FDR X3000, Sony, Tokyo, JP) or videography system (SeaDrop, 550 Seaviewer, Tampa, FLA). Distribution of seagrass was digitized using maximum likelihood supervised classification of 4-band Planet imagery (2 July 2017) taken at low tide using ENVI 5.4 (Harris Geospatial, Broomfield, CO, USA, 2016), and distribution of oyster racks was manually digitized using low-tide NIR drone imagery (eBee senseFly, 0.07 m resolution, collected 29 November 2016). A cost–distance function was used to estimate the product of the least accumulative cost–distance function calculated as a raster in ArcGIS 10.5, using the product of the distance to the mouth and friction categories based on depth.
Due to instrument availability, stable isotope data was provided by three different isotope ratio mass spectrometers (IRMSs), including a CHNOS Elemental Analyzer interfaced to an IsoPrime100 IRMS at UC Berkeley, an Elementar Pyrocube interfaced with an Elementar IsoPrime100 IRMS at the Academy of Natural Sciences of Drexel University, and a COSTECH Elemental Analyzer coupled to a Thermo DeltaV Advantage IRMS at the Laboratorio de Isótopos Estables (LIE) at CICESE. Stable isotope values are expressed relative to the isotopic ratio of a standard following Formula (1):
δaX = (aRXaRStd)/aRStd · 1000‰
where aRX represents the ratio of the less common to the more common isotope in the sample and aRStd represents the ratio of the less common to the more common isotope in the standard reference material (air, Vienna Pee Dee Belemnite, and Vienna Canyon Diablo Troilite for δ15N, δ13C, and δ34S, respectively). Mean sample differences for replicates were 0.8‰ for δ13C, 0.84‰ for δ15N, and 0.48‰ for δ34S. For samples run on different instruments, the mean sample difference for replicates was 1.09‰. Samples analyzed for C isotopes were acidified to remove inorganic C and samples analyzed for N isotopes were not pre-treated. Samples processed for S isotopes were triple-rinsed using deionized water [58] to remove sulfate, which could have removed oxidized iron monosulfides from the sample. Thus, the reported δ34S values reflect sulfur of organic matter and pyrite only. Potential sources of organic matter to the lagoon sediments, including Zostera marina, Ulva spp., Crassostrea gigas feces and pseudofeces, and marsh macrophytes, were also collected and processed for stable isotopes (Table 1).
Particle size distribution was measured on sediment samples pre-treated with 30% H2O2 to remove organic material [59] then introduced into a Beckman Coulter LS-13-320 system recording particle size distributions from 0.04–2000 µm with 117 bins, and run in triplicate. Average particle size distributions were post-processed with Gradistat.v8 software [60], including bin aggregation to texture classes, and statistical description. Sediment textures were defined per [61]. Particle size (diameter, d) values were converted to phi (φ) units using Formula (2):
φ = −log2 d
The full logarithmic method of moments was used to calculate particle size mean, sorting, skewness, and kurtosis. Sediment samples were processed for bulk density and loss on ignition by drying a known volume of sediment to constant weight and combusting for 4 h at a temperature of 550 °C [62].
Sediment stable isotope ratios and associated sediment data (e.g., elemental ratios, grain size distribution) were visualized through creation of contour maps using ordinary kriging, utilizing a circular semivariogram model and assuming isotropic conditions. For data analysis, depth and residence time were estimated for each sample point using previous hydrographic surveys and model outputs [63,64]. Statistically significant hot and cold spots in the stable isotope data were identified using Anselin Local Moran’s I statistic, and differences in isotopic composition were identified between the two arms of the lagoon using the Mann–Whitney–Wilcoxon test. Regression analysis (Mann–Kendall) was used to identify significant spatial trends in sediment isotope data based on latitude and the product of the least accumulative cost–distance function. Isotopic signatures were compared graphically and statistically for magnitude and variance (using Mann–Whitney–Wilcoxon and Fliger–Killeen tests, respectively) for: (1) sediment samples removed from seagrass beds vs. from bare sediments, (2) sediments collected from within or adjacent to seagrass meadows (<100 m) vs. locations distant from sea grass meadows, and (3) sediment samples taken within (<100 m) areas of oyster culture vs. more distant. Stable isotope ratios were modeled using a backward stepwise approach as a function of sediment characteristics and grain size metrics using principal least squares (PLS) regression to account for the high collinearity among predictors. Collinearity of predictors was visualized through creation of a non-parametric co-variance matrix, ordered using the first principal component. Geospatial analyses were completed using ArcGIS ver. 10.5, Redlands, CA, and statistical tests were conducted in R 3.6.1 [65] using packages pls [66], plsVarSel [67], Hmisc [68], corrplot [69], and Kendall [70].

3. Results

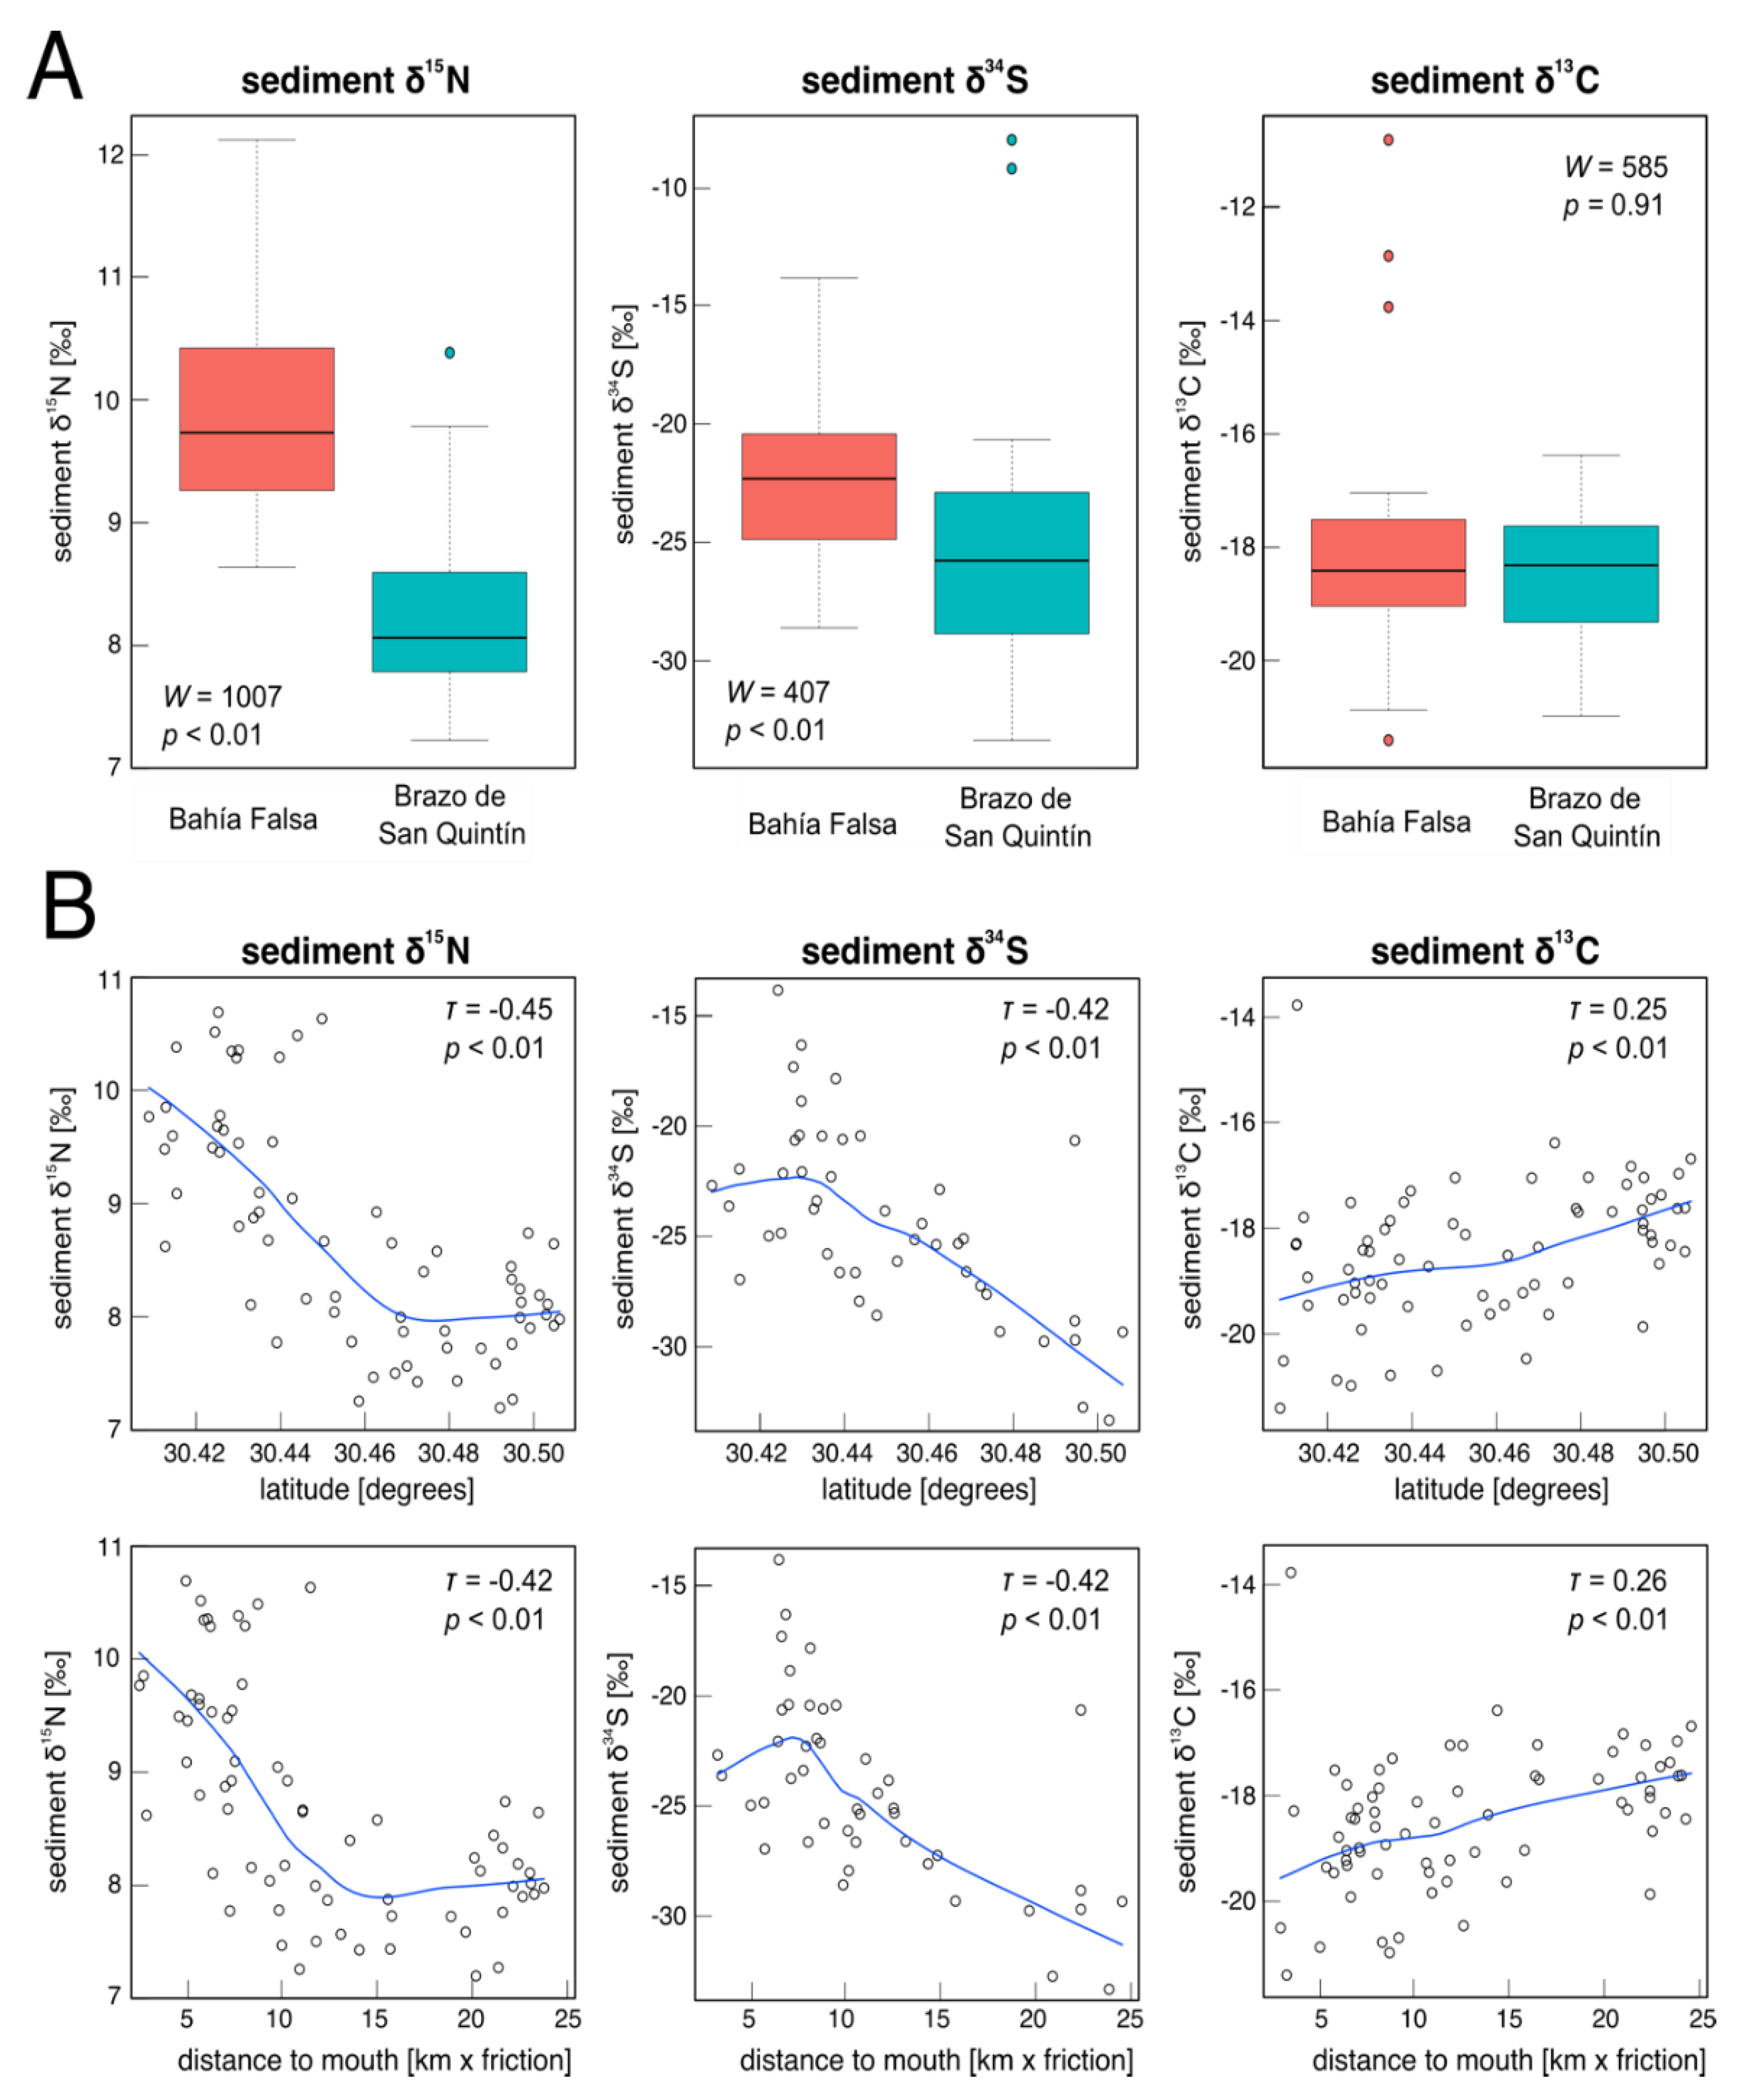
Here we report bulk stable isotope ratios (N, S, C) of surface sediments to identify spatial patterns of lagoon benthic metabolism. Sediment δ15N values ranged from 7.2 to 12.1‰, and strong spatial gradients were observed in sediment δ15N values. The Anselin Local Moran’s I identified significant hot spots on the eastern side of BF, and cold spots in upper BSQ (Figure 1B). δ15N values were found to be greater in BF than Brazo de San Quintín (W = 1007, p < 0.01) (Figure 2A), decreased with latitude (τ = −0.45, p < 0.01), and with distance from the ocean (τ = −0.42, p < 0.01) (Figure 2B).
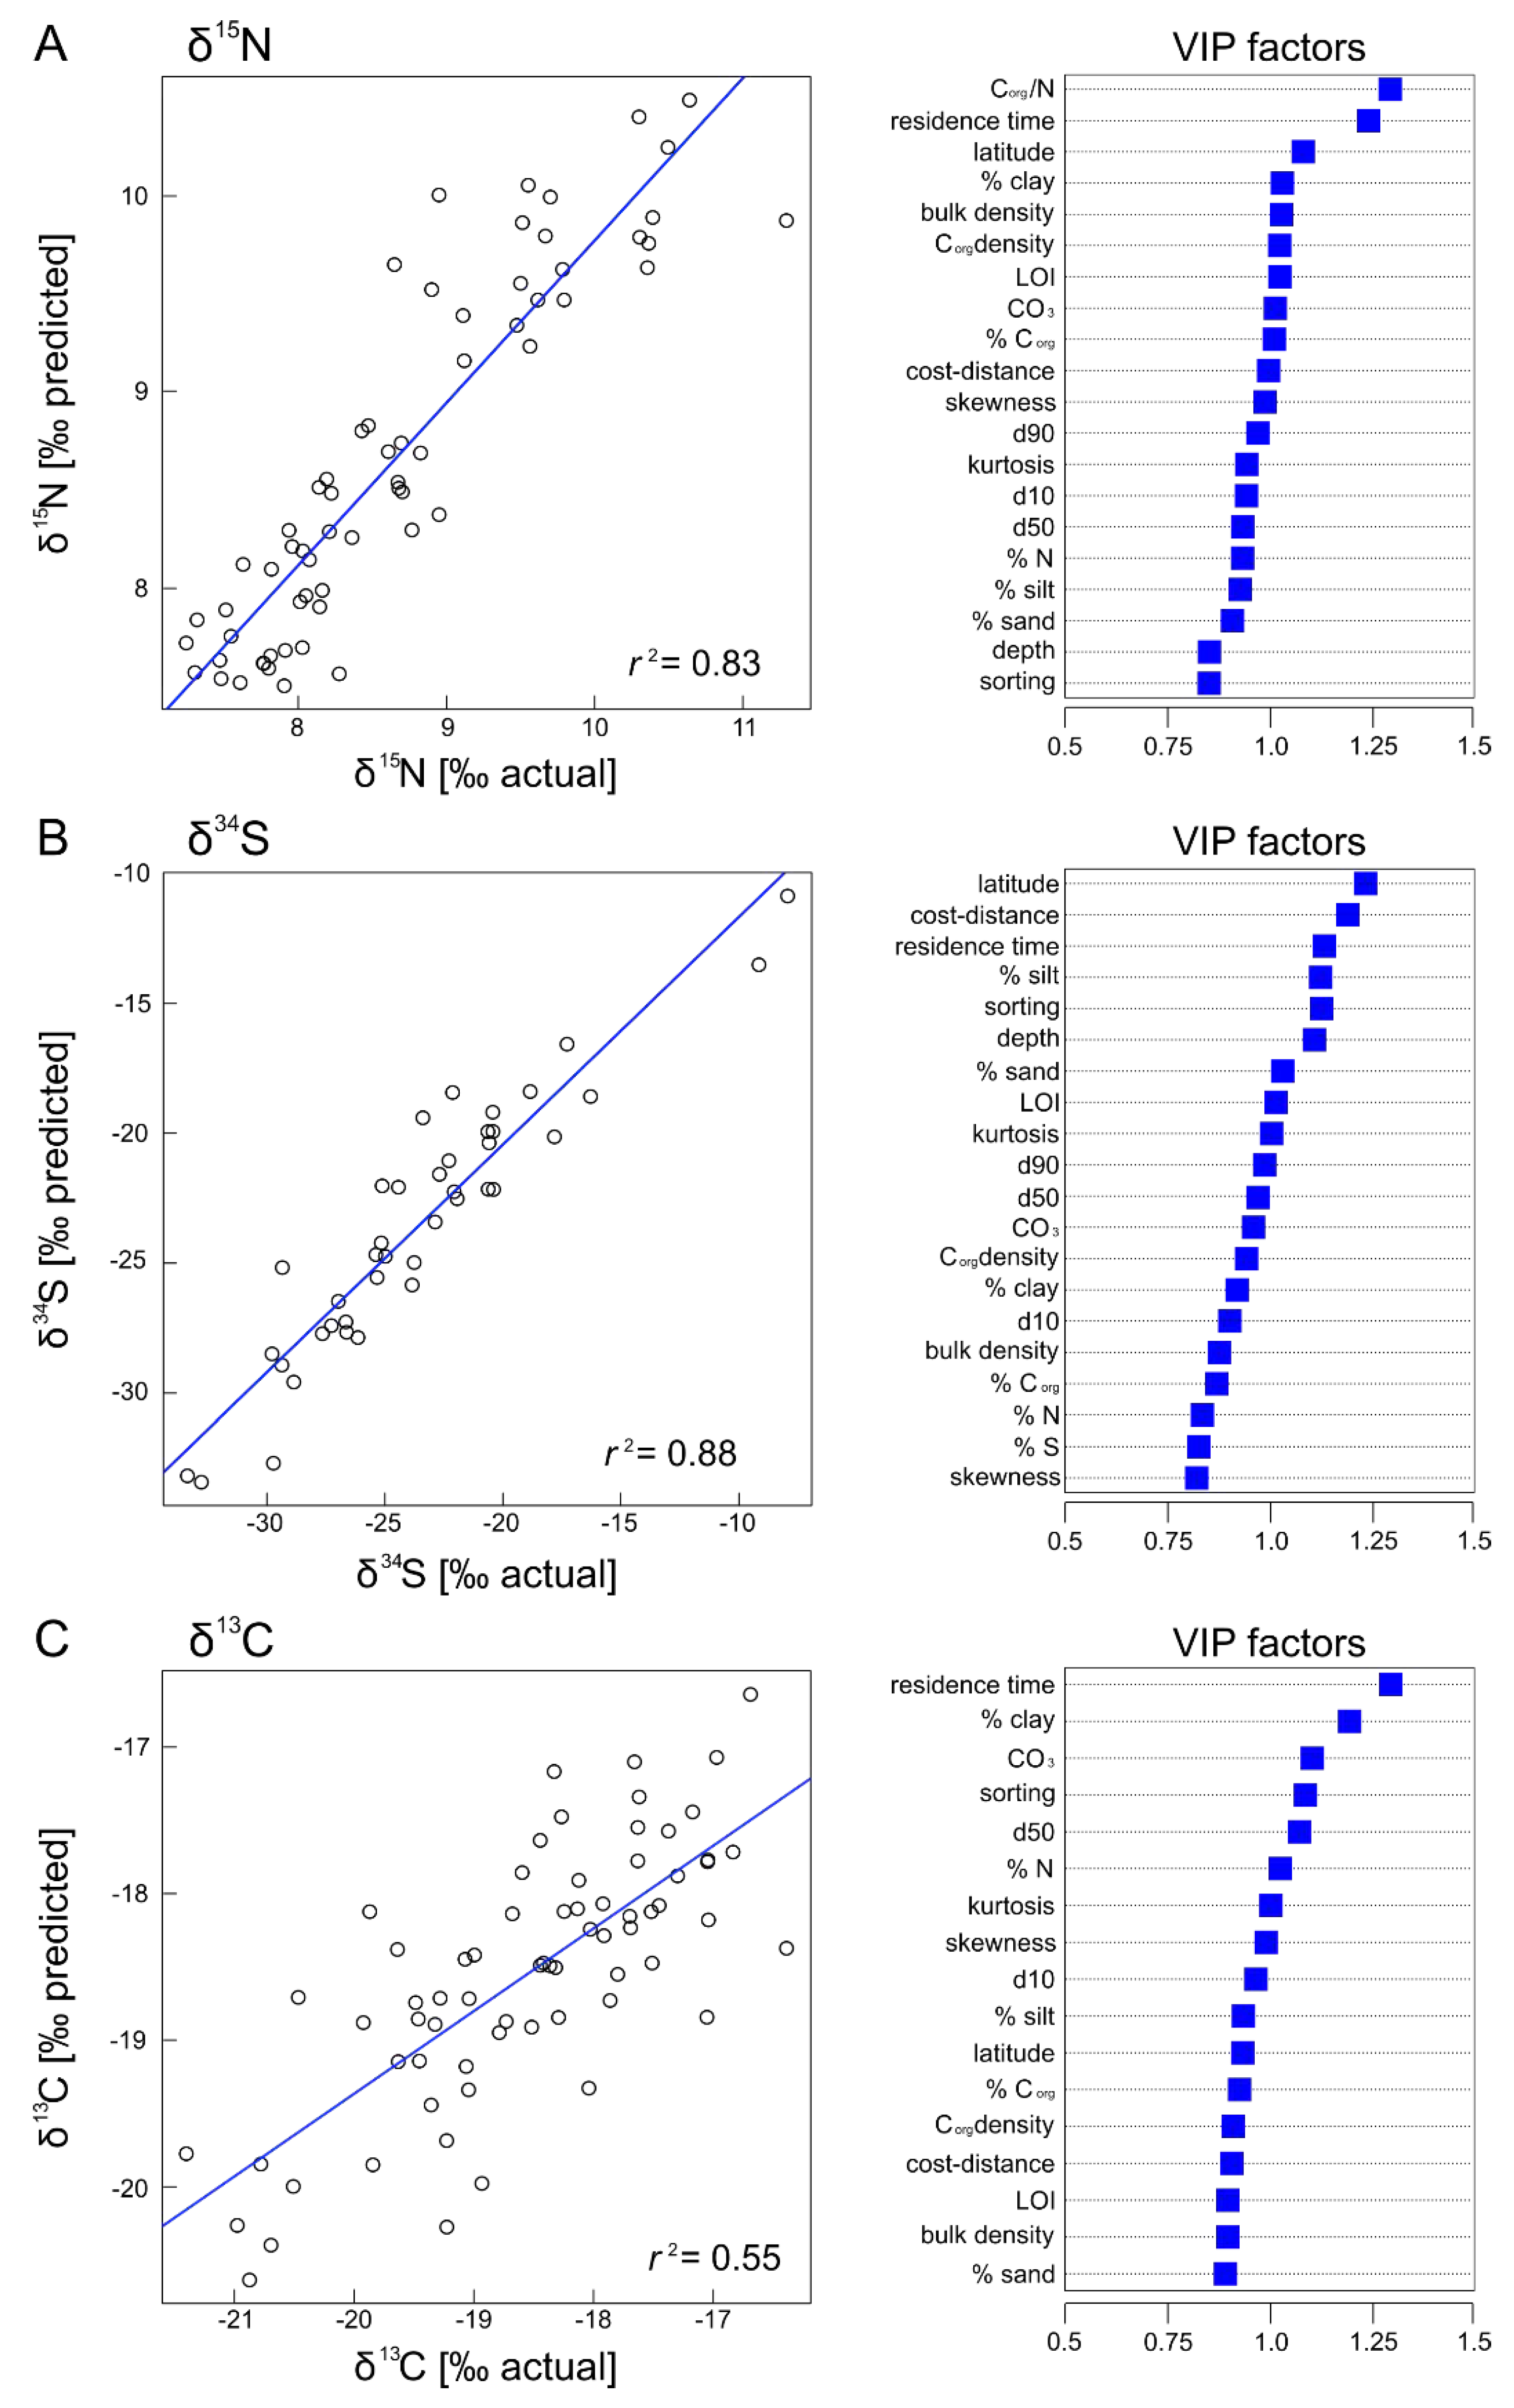
Sediment δ15N values were modeled successfully as a function of sedimentary and environmental variables (Figure 3A). Dropping non-significant variables (variable importance for project (VIP) factors <0.8) and choosing a number of factors (8) that minimized RMSE using leave-one-out cross-validation, the predictor variables accounted for 83% of the variability in N stable isotope values. Factors that were highly influential on the regression included Corg/N ratio, residence time, and latitude, whereas sediment S levels were excluded from the regression due to low VIP.
Sediment δ34S values ranged from −33.4 to −12.1‰ and were displayed strong spatial gradients. The Anselin Local Moran’s I identified significant hot spots on the eastern side of BF and in the Arroyo San Simon Delta, and cold spots towards the head of Brazo de San Quintín (Figure 1C). δ34S values were found to be greater in BF than Brazo de San Quintín (W = 407, p < 0.01), decreased with latitude (τ = −0.42, p < 0.01), and with distance from the ocean (τ = −0.42, p < 0.01) (Figure 2). Sediment δ34S values were modeled successfully as a function of sedimentary and environmental variables (Figure 3B). Dropping non-significant variables (VIP factors <0.8) and choosing a number of factors (11) that minimized RMSE using leave-one-out cross-validation, the predictor variables accounted for 88% of the variability in S stable isotope values. Factors that were highly influential on the regression included those that scaled with distance from the ocean, including residence time, latitude, and the cost–distance function. The Corg/N ratio was excluded from the regression due to low VIP.
Sediment δ13C values ranged from −10.8 to −21.4‰, and modest spatial gradients were observed in sediment δ13C values. The Anselin Local Moran’s I identified significant cold spots in the Arroyo San Simon Delta (Figure 1D). There was no significant difference in δ13C between the two arms of BSQ (W = 585, p = 0.91), although δ13C increased with latitude (τ = 0.25, p < 0.01), and with distance from the ocean (τ = 0.26, p < 0.01) (Figure 2). Sediment δ13C values were modeled successfully as a function of sedimentary and environmental variables, although the amount of variance explained was substantially lower for δ13C than for δ15N and δ34S (Figure 3C). Dropping non-significant variables (VIP factors < 0.8) and choosing a number of factors (5) that minimized RMSE using leave-one-out cross-validation, the predictor variables accounted for 55% of the variability in C stable isotope values. Factors that were highly influential on the regression included residence time, % clay, sediment carbonate, and sediment sorting. The Corg/N ratio, depth, d90, and %S were excluded from the regression due to low VIP factors.
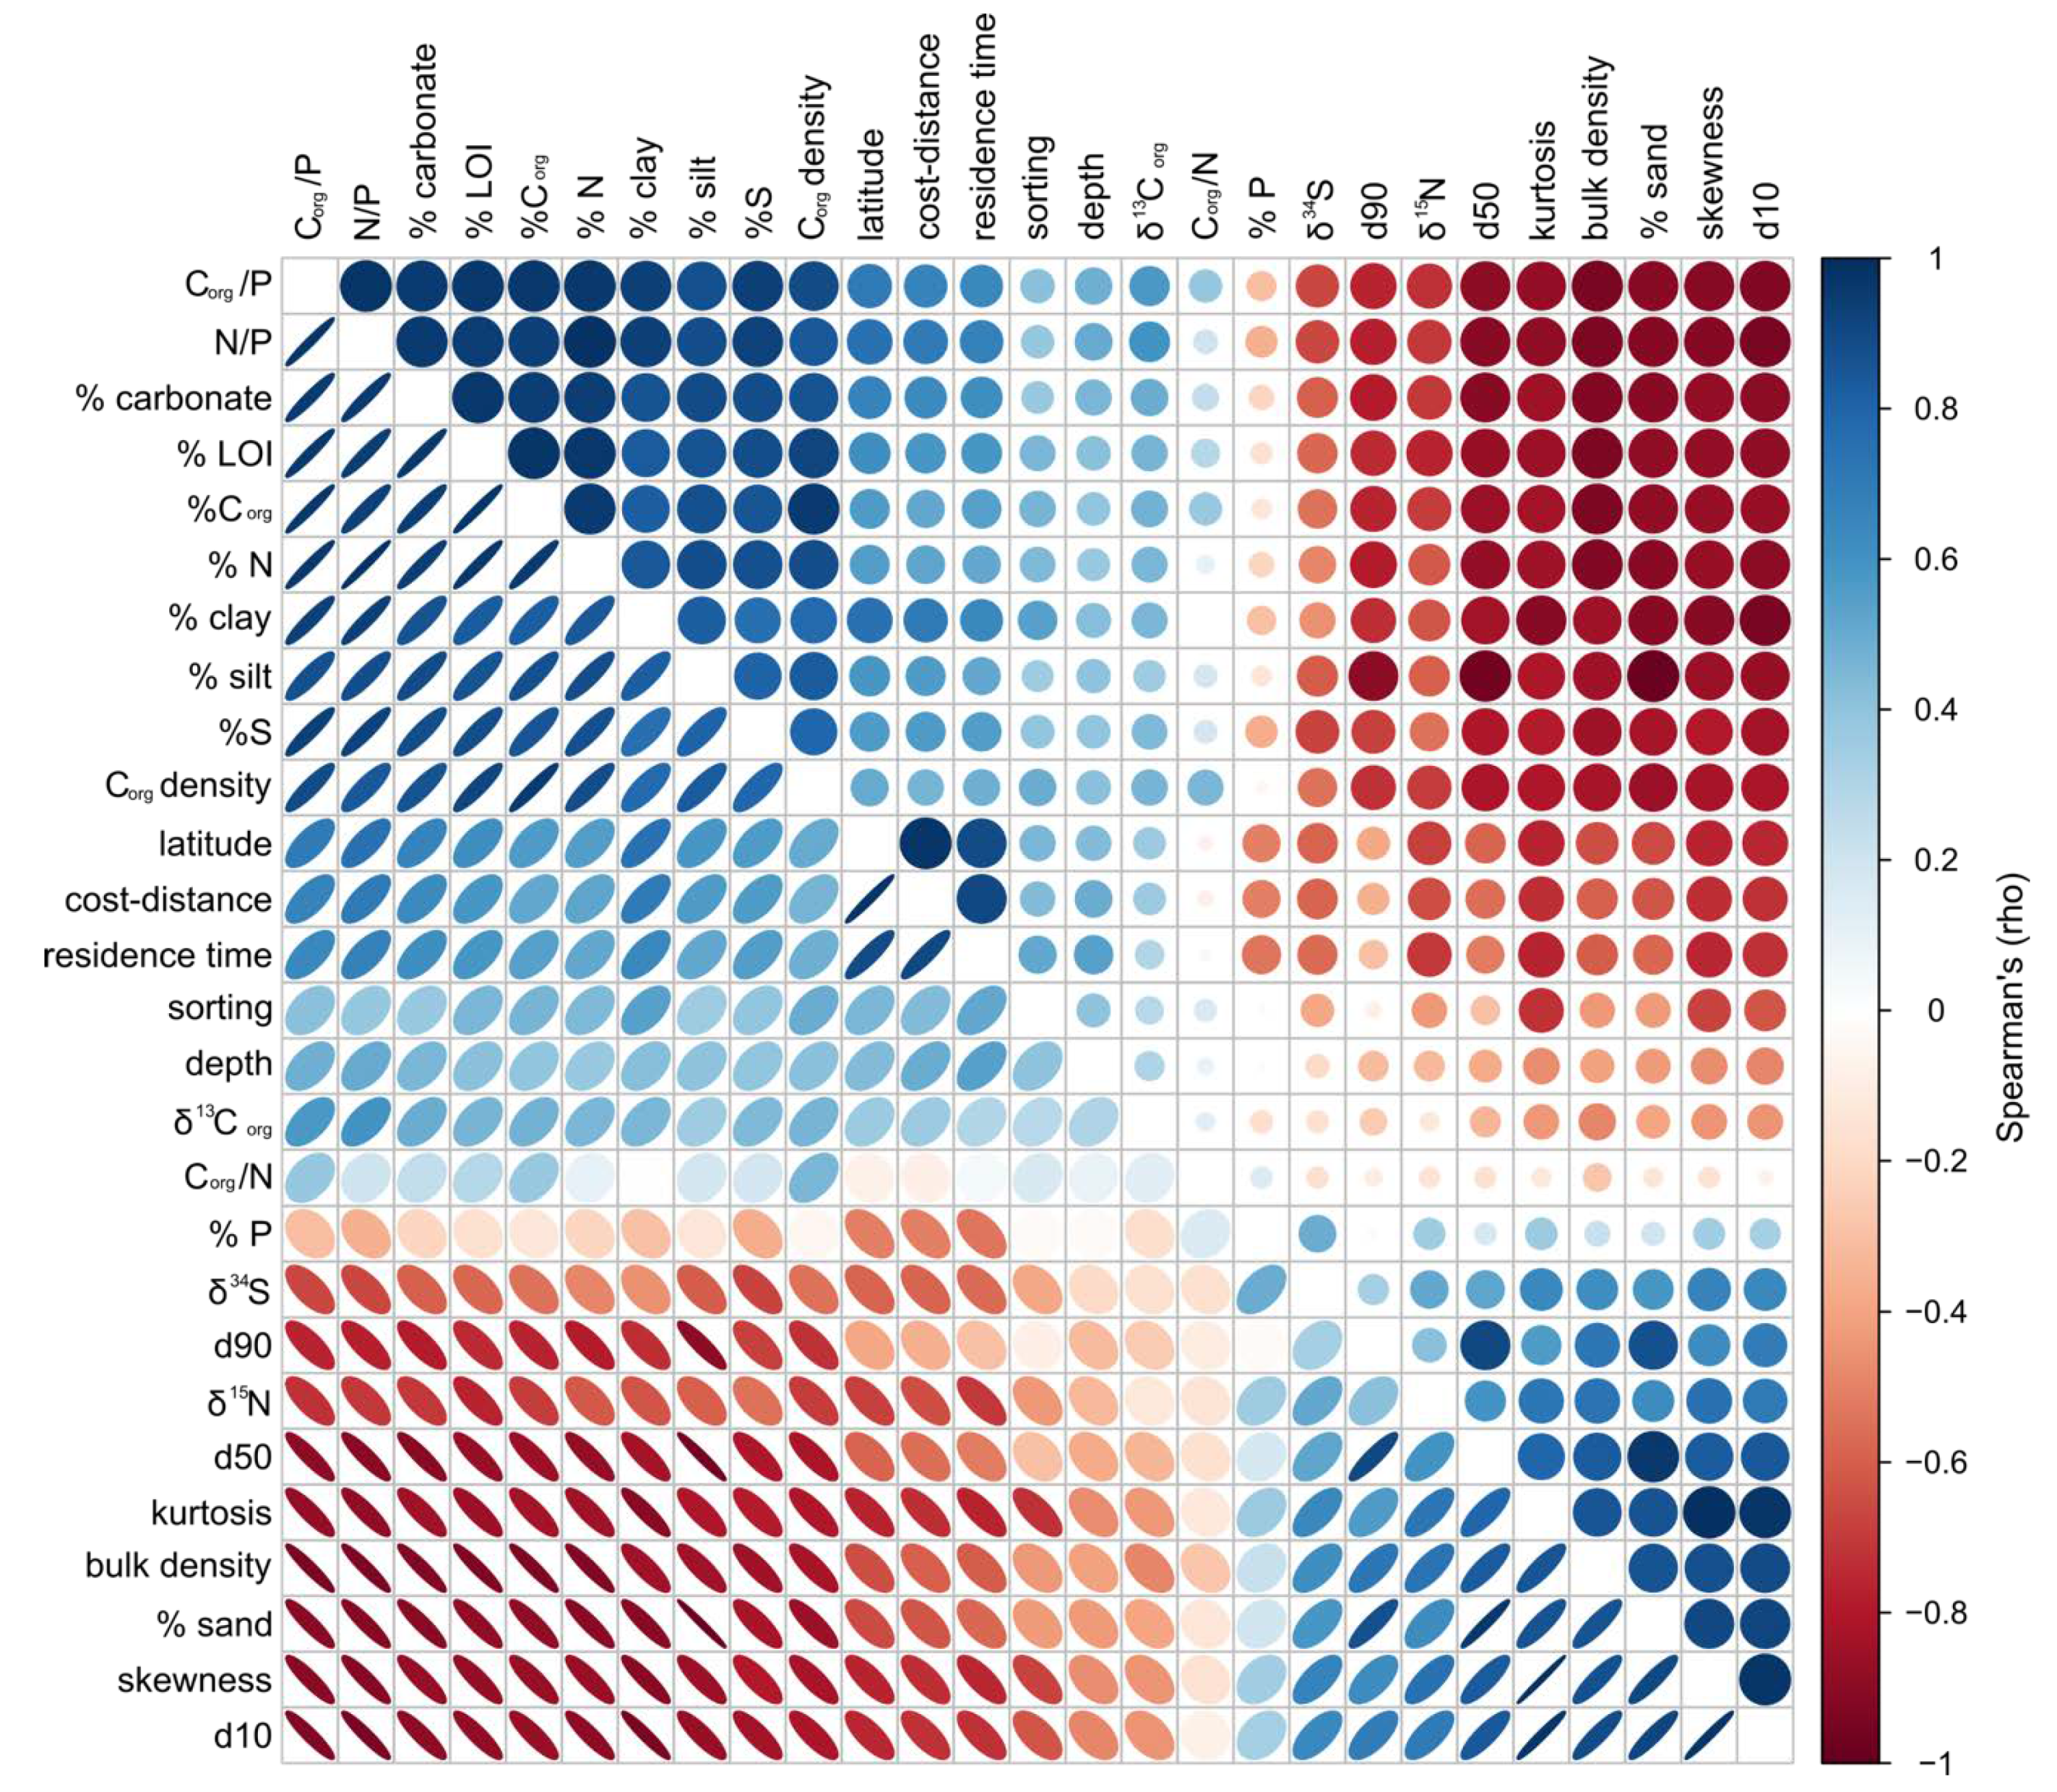
Although models that included environmental variables and sediment characteristics were highly predictive of isotopic ratios, it was difficult to identify key drivers—vs. correlates—due to the high level of collinearity among predictor variables (Figure 4). There are essentially two classes of factors in which most variables were strongly positively or strongly negatively correlated. Only two variables—sediment C/N ratio and sediment %P—had modest correlations with most other variables (Figure 4). As revealed by interpolation maps for the sediment variables measured (Figures S1 and S2), C/N ratio and sediment P followed different patterns of spatial dependence. For instance, sediment P displayed two minima, at the mid-portions of BSQ and BF, but was low in both the mouth and head locations. The sediment Corg/N ratio followed a similar pattern with high values in mid-BSQ, and lower values near the mouth and head.
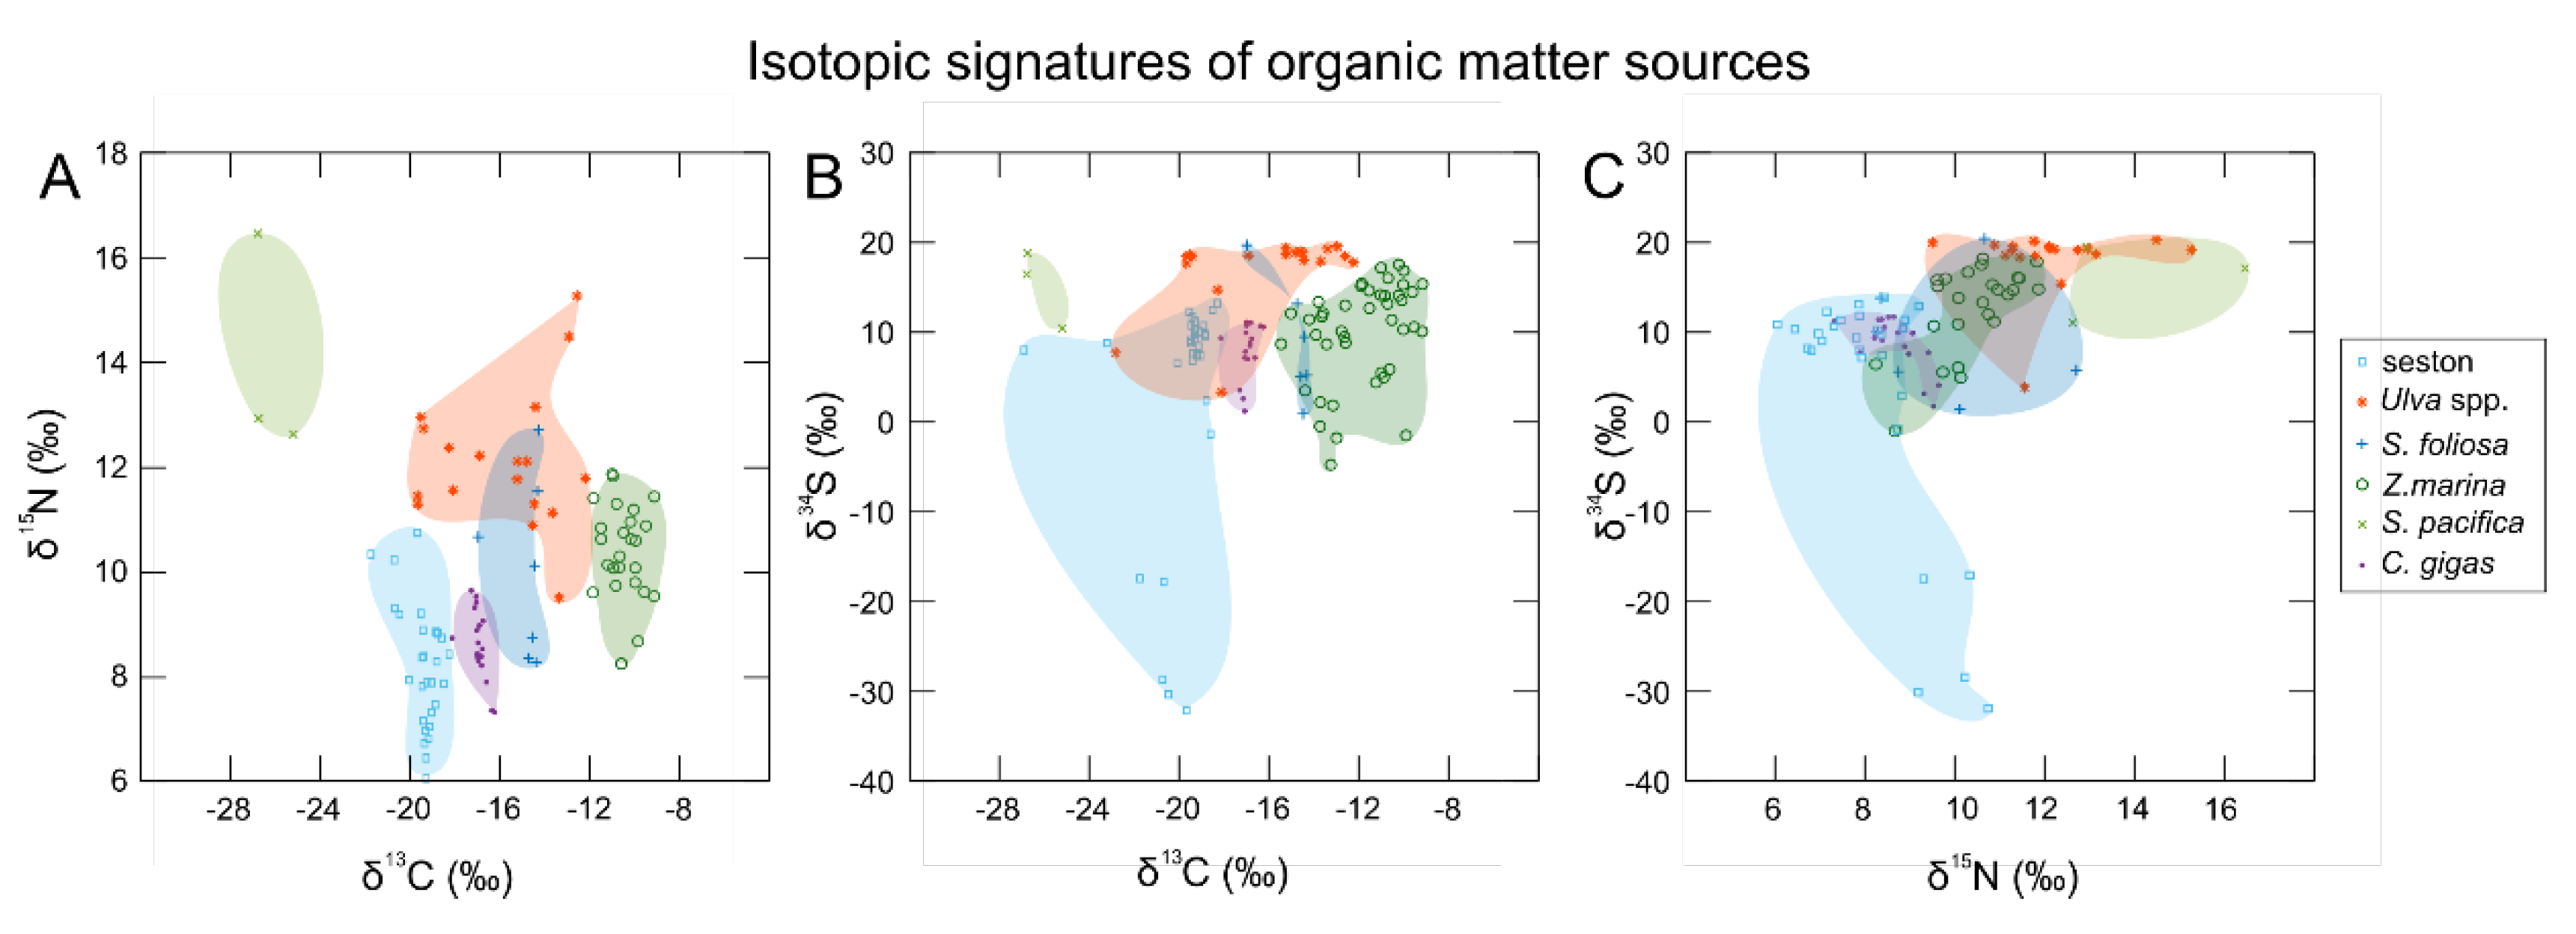
Potential organic matter sources to BSQ sediments (seston, Ulva spp., S. foliosa, Z. marina, S. pacifica, and C. gigas feces/pseudofeces) had relatively distinct CNS isotopic signatures (Figure 5). Zostera marina had the highest δ13C signatures (−10.5‰), followed by S. foliosa and Ulva (−14.3‰, −15.2‰, respectively), C. gigas (−16.9‰), seston (−19.4‰), and S. pacifica (−26.3‰) (a C3 terrestrial plant). S. pacifica had the highest δ15N signatures (14.0‰), followed by Ulva (12.1‰), Z. marina (10.4‰), S. foliosa (10.0‰), C. gigas (8.8‰), and seston (8.2‰). Differences in δ34S between species were modest. Seston included a few samples with highly reduced signatures, and Z. marina and C. gigas feces had somewhat more negative signatures than the other species. Sediment δ34S values were significantly lower than organic matter sources, making them a poor tracer of organic matter source.
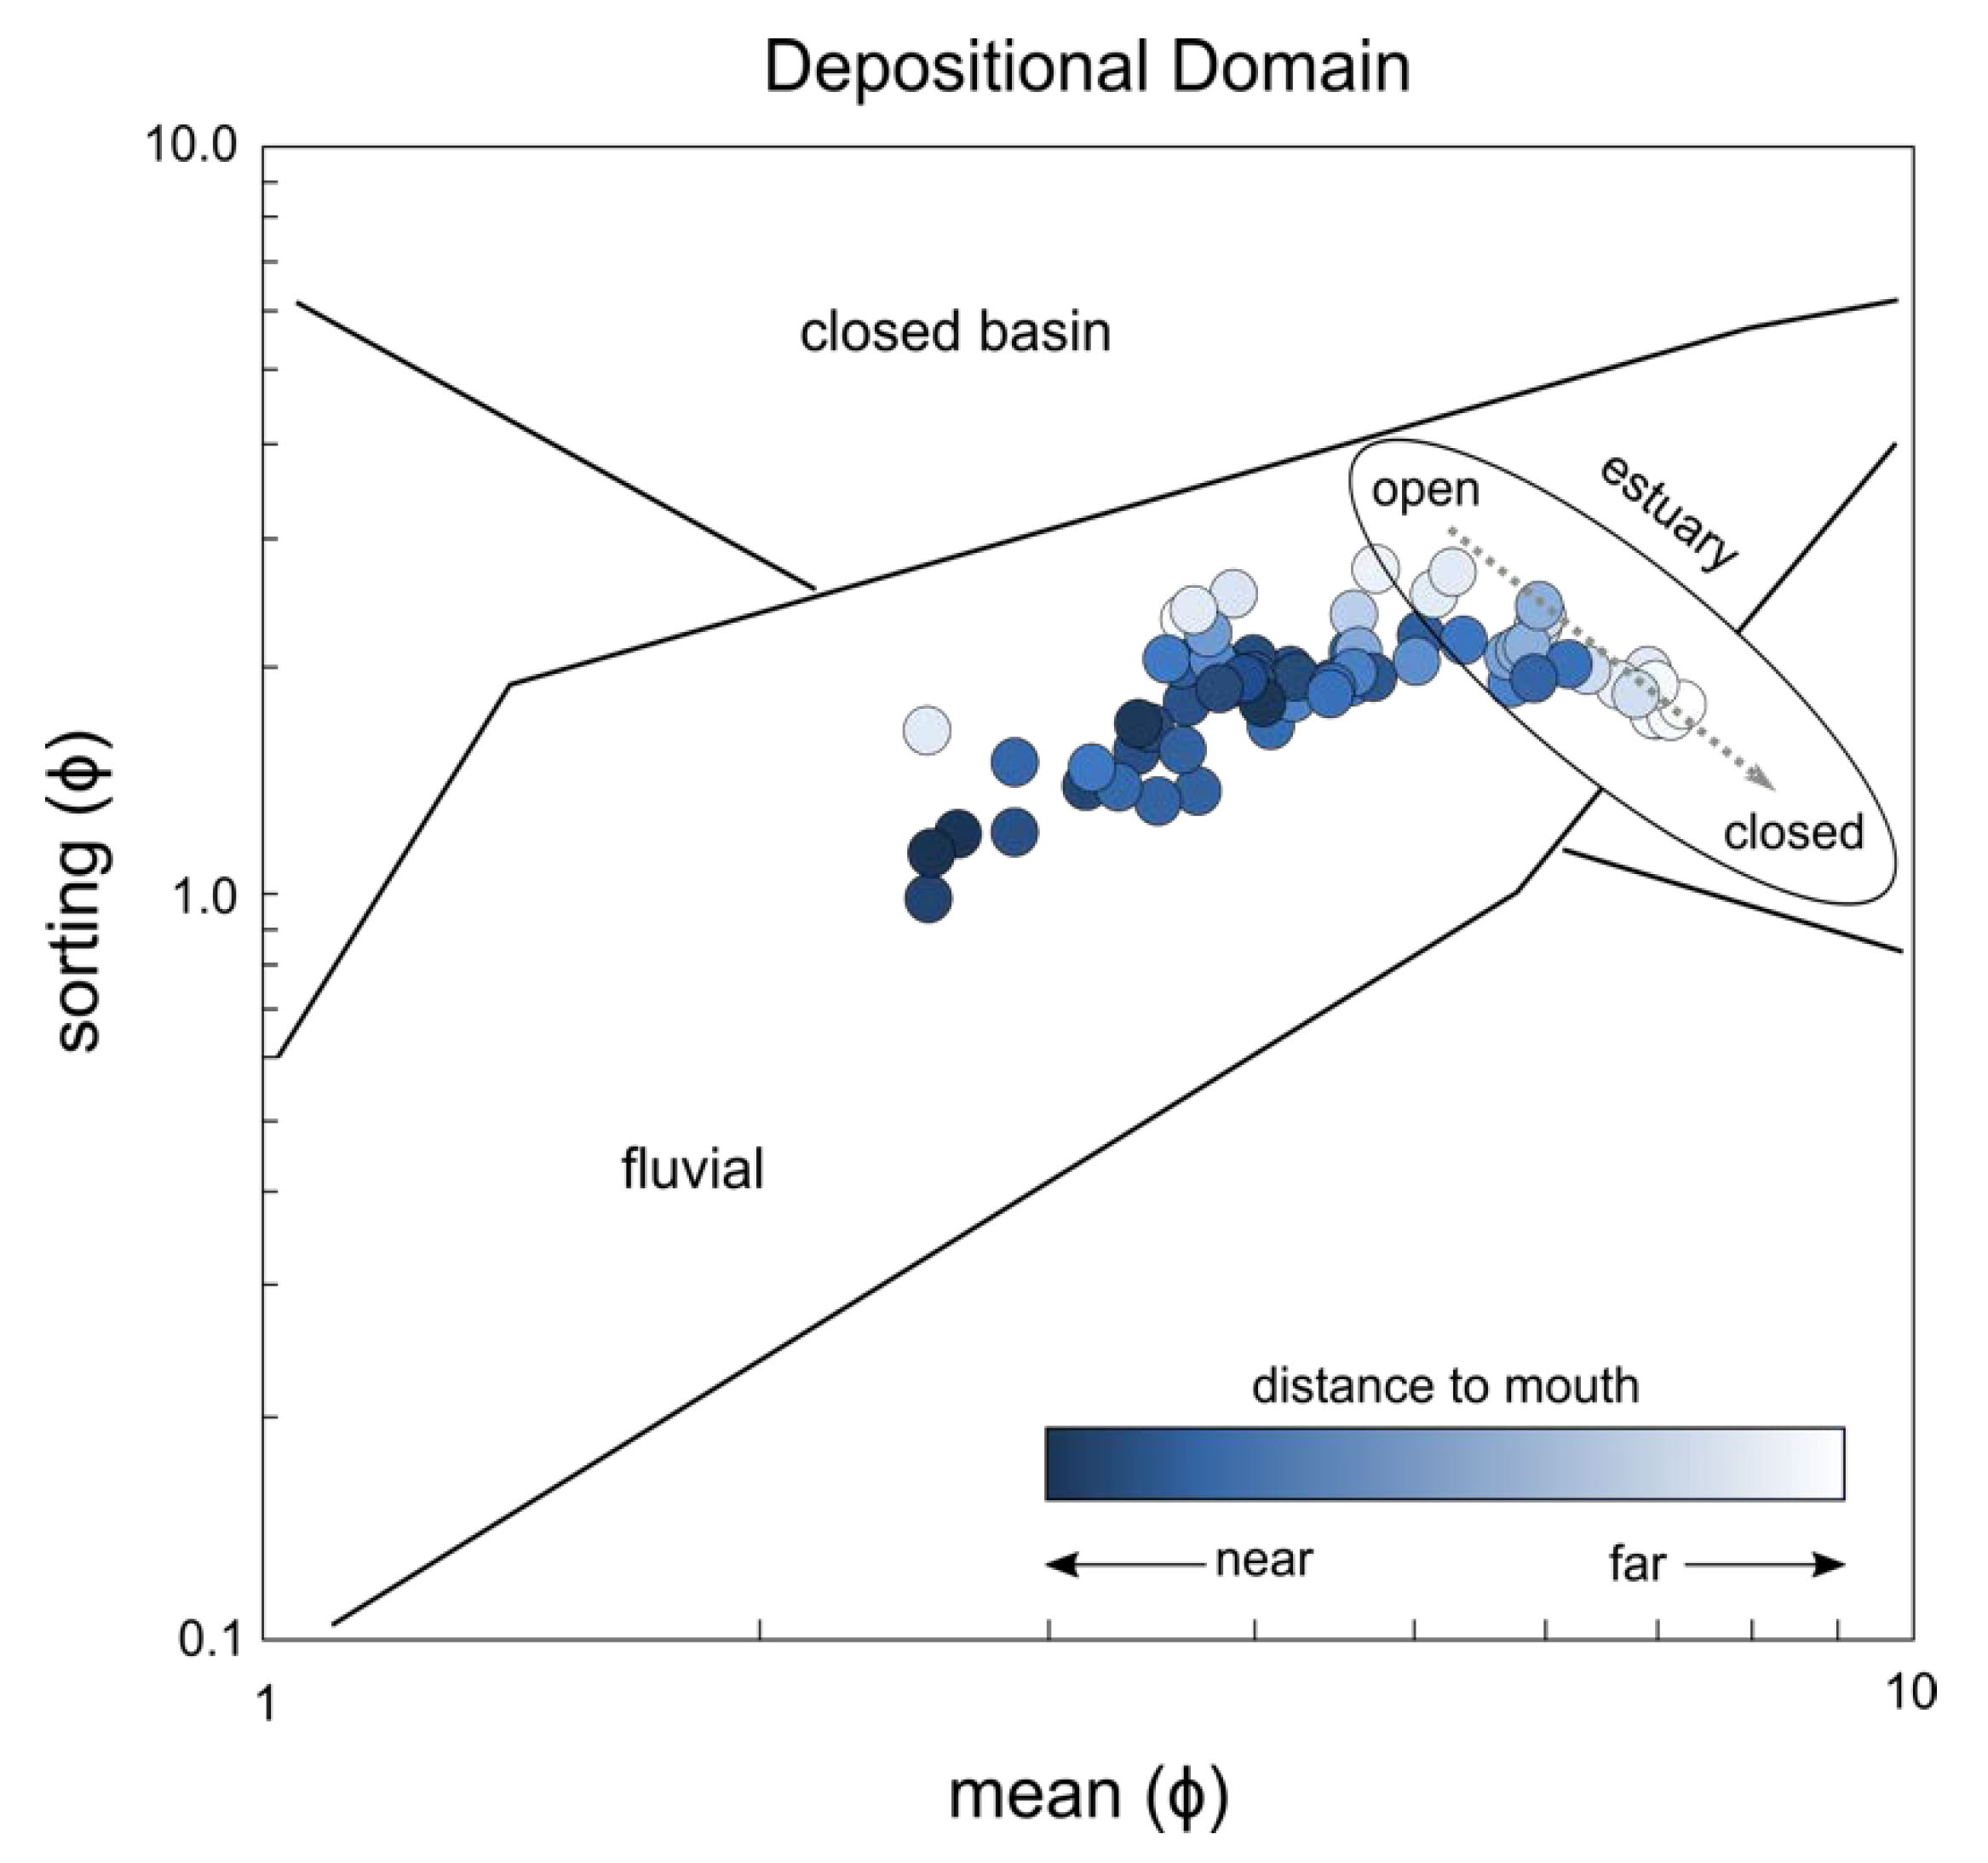
Sediment particle size distribution varied from medium silt to fine sand, consistent with a median grain size that ranged from 8 to 190 μm. In general, the coarsest sediment was found near the mouth of the lagoon and in the sub-aqueous portion of the Arroyo San Simon Delta, whereas the finest sediment was found near the heads of BF and Brazo de San Quintín (Figure S1). Sediments collected near the mouth of the lagoon were moderately well sorted, and fine skewed, grading to very poorly sorted, with symmetrical distributions, near the lagoon heads (Figure S1). Kurtosis—which refers to the peakedness of sediment distribution curves—was leptokurtic (more peaked) near the mouth of the lagoon, and platykurtic (less peaked) near the lagoon heads (Figure S1). Plotting sediment mean grain size against sorting revealed that sediments were generally finer with distance from the lagoon mouth, and that sediments further from the mouth were typically more poorly sorted relative to their size than sediments found closer to the mouth of the lagoon (Figure 6). In addition, some sediment samples collected upstream of the tidal restriction indicated deposition under closed basin conditions (Figure 6).
Supervised classification of seagrass cover indicated that 36% of the lagoon was covered by seagrass in July 2017 (1325 ha), whereas digitization of oyster racks suggested a minimum of 135,000 m of oyster culture racks in the lagoon. Seagrass classification accuracy was 96% based on assessment of 60 polygons. Assessment of sediments collected from plots covered by seagrass (patchy or continuous) suggests that there were no significant differences in δ15N or δ13C signature (W = 612, p = 0.83; W = 484, p = 0.09) or variance (χ2 = 0.04, p = 0.84; χ2 = 0.09, p = 0.76) in relation to seagrass cover (Figure 7A). There were also no significant differences in δ34S signature between plots having or lacking seagrass cover (W = 299, p = 0.48), but there was a trend towards lower δ34S values where seagrass was present, and δ34S variance was lower in plots with seagrass present (χ2 = 4.55, p = 0.03). Comparing plots near seagrass meadows (<20 m) vs. far from seagrass meadows (>20 m), we found lower δ15N ratios in plots in or adjacent to seagrass beds (W = 427, p = 0.04), but no difference in stable isotope ratios for δ34S or δ13C (W = 187, p = 0.08; W = 660, p = 0.74). There was no difference in variance between plots distant from and adjacent to seagrass beds for δ15N (χ2 = 1.06, p = 0.15) or δ13C (χ2 = 0.09, p = 0.76), but a lower variance was found for δ34S for plots adjacent to seagrass beds (χ2 = 5.0, p = 0.02).
Comparison of stable isotope values suggested no significant differences in δ34S or δ13C in areas adjacent to oyster culture (W = 148, p = 0.13; W = 340, p = 0.40) (Figure 7C). δ15N values were greater in areas adjacent to oyster culture (W = 105, p = 0.01), and a significant trend was found (Kendall rank correlation) (τ = −0.43, p < 0.01), such that δ15N declined with distance from oyster culture. There was no significant difference in variance in δ15N, δ34S, or δ13C between areas near and distant from oyster culture (χ2 = 0.03, p = 0.85; χ2 < 0.01, p = 0.98; χ2 = 0.69, p = 0.41) (Figure 7C).

4. Discussion

BSQ serves as a model for understanding the impact of upwelling on Pacific coastal lagoons in the absence of high anthropogenic impacts. We first interpret our results in light of what is known about spatial patterns of productivity, respiration, and nutrient processing in BSQ. We then address the implications of our results for understanding the impacts of seagrass cover and oyster culture on lagoon biogeochemical processing more generally. We conclude by suggesting directions for future research.
BSQ is strongly affected by upwelling of nutrient and pCO2-enriched waters, which are also high in 15N (8–10‰) because of proximity to one of the world’s major centers of open-ocean denitrification [47]. Upwelling of nutrient-rich water drives spatial patterns in productivity within the lagoon. As measured by chlorophyll concentrations, productivity is high near the mouth, but declines with distance up BF and Brazo de San Quintín [73]. Dissolved inorganic N (DIN) follows no consistent pattern within the lagoon [74] but may similarly decline with distance from the mouth during upwelling episodes [75]. The lagoon is net heterotrophic, and deeper areas of the estuary are more heterotrophic than seagrass meadows, marshes, and tidal flats, where respiration and production are approximately equal [50]. Based on stoichiometry between O2 consumption and DIC production in benthic chambers, approximately half of net respiration has been estimated to occur in association with anaerobic metabolism [74]. DIN deficits suggest the lagoon is net denitrifying [49], and spatial patterns in DIN fluxes and macrophyte isotope ratios have suggested the mouth of the estuary sees high denitrification, whereas the arms of the lagoon have a more even balance between N-fixation and denitrification [8,49,76]. Recent analysis of N-fixation has suggested that heterotrophic non-sulfate reducing bacteria had the largest impact on N-fixation at BSQ [77].
Our work found strong spatial patterns in δ15N in BSQ, with higher levels in BF, and δ15N ratios that declined with distance from the mouth (Figure 1B). If in this estuary, sediment δ15N can be considered a rough indicator of the balance between denitrification, which enriches the 15N pool through loss of 14N to the atmosphere, and N-fixation, which introduces light N isotopic signatures (0‰) [78], our results indicate N-fixation is more common in the upper arms of the lagoon, whereas denitrification is more common near the mouth where oceanic imports of nitrate occur. This is consistent with past research into macrophyte isotopic ratios and spatial patterns of N-fixation at BSQ [8,77]. However, our study also identified higher values for sedimentary δ15N in BF in comparison with BSQ, which has not been previously reported [8]. The higher sediment 15N levels in BF may indicate trophic enrichment via oyster biodeposits, or alternatively, enhanced denitrification. Enhanced denitrification may be occurring due to oyster biodeposits or organic matter that act as labile organic matter sources to fuel heterotrophic denitrification [79].
Sediment S isotopic signatures (−33.4 to −12.1‰) did not reflect the S signatures of organic matter sources (−4.3 to +20.1‰, excluding seston), suggesting that sedimentary isotopic ratios are indicative of processing. Although previous studies have not measured sulfate reduction in BSQ, the net heterotrophic status of the estuary [49], in combination with high estimates (50%) of anaerobic metabolism [50], suggest that sulfate reduction is common. Fractionation with sulfate reduction can range up to 42‰ [80], imparting a highly negative signature to reduced S compounds (e.g., pyrite). If sediment δ34S can be considered a rough indicator of sulfate reduction [81], spatial patterns in isotopic signatures suggest less sulfate reduction is occurring in BF, and sulfate reduction is more common in the upper arms of the lagoon. Based on spatial patterns in sediment texture (Figure S1), which grade from sand near the mouth of the lagoon to silts in its upper arms, higher levels of sulfate reduction might be expected in the upper bays due to lower oxygen permeability. Additionally, higher carbon densities of sediments in the upper bays (Figure S2) may indicate higher availability of organic matter for sulfate reducers, leading to increased sulfate reduction as reflected in more negative δ34S. The “hot spot” of higher δ34S values in areas of intense aquaculture may be due to high nitrate abundances that favor denitrification over sulfate reduction as a mode of anaerobic metabolism. Furthermore, the low δ15N values coupled with low δ34S values in upper BSQ suggest that N-fixation and sulfate reduction may be occurring as a coupled process [18], although recent work in the lower part of the lagoon found that N-fixation was linked to non-sulfate reducing bacteria [77].
Stable isotopes are often used to trace seagrass organic matter in food webs, due to the distinct combination of unusually heavy C isotopic signatures (indicative of bicarbonate assimilation) [82] combined with light S isotope signatures indicative of their rooting in reduced environments [83]. Despite the dominance of seagrass in this estuary (36% of areal extent), stable C isotopes in sediments in BSQ (mean = −18.3‰) were much more similar to presumed phytoplankton values (−20‰, [84] and measured seston samples, mean = −19.7‰) rather than those of Zostera marina (mean = −11.2‰). In addition to organic matter source, stable C isotopes are also known to reflect interlinking processes of productivity, depth, or C source (bicarbonate vs. CO2) in coastal marine settings [3]. Under high productivity, partial CO2 limitation results in lower discrimination against 13C and higher δ13C signatures [85]. In the coastal ocean, light is often production-limiting for phytoplankton, such that shallower areas have less negative δ13C values more typically associated with high production, and deeper areas have lighter δ13C signatures. Finally, there are strong gradients in pCO2 in BSQ, and isotopic signatures of δ13C and HCO3- are distinct [86]. Because we see lighter C isotopic signatures in areas of high productivity (Figure 1D) (rather than the opposite) and see no significant relationship between δ13C and depth (Figure 4), we can rule out these factors as providing important controls on spatial patterns in δ13C. We also see no consistent relationship between macrophyte δ13C values and distance to the lagoon mouth (τ = −0.06, p = 0.57), which we might expect if spatial gradients in pCO2 or HCO3- played a large role in determining sediment δ13C values.
In addition to the specifics of macronutrient cycling in BSQ, this work has broader implications for understanding the role of seagrass presence and oyster culture in coastal lagoons. Seagrasses have often been associated with enhanced levels of sediment N fixation [87], because both their exudates and the organic matter trapped by seagrass meadows serve as fuel for heterotrophic diazotrophs [84,88]. Although seagrass has been associated with N-fixation in BSQ previously [77], our study did not identify associations between seagrass cover with the depressed values of δ15N that would result from enhanced N fixation at either the plot or landscape scale (Figure 7). Seagrasses may also enhance sulfate reduction through exudates [89] or decrease sulfate reduction through root zone oxidation [90]. Although we found no evidence for lower δ34S values in sediments collected in or nearby seagrass, the range of sediment S isotopic values was consistently reduced in seagrass covered compared to in bare sediment (Figure 7A). Finally, while the seagrasses we measured tended to have C and S isotopic signatures that were distinctive based on high δ13C and low δ34S, the S isotopic signatures were altered by processing and not preserved in sediments (Figure 1C), rending these values not useful for tracing seagrass organic matter in seagrass meadows.
Another factor thought to shape coastal nutrient cycling is the establishment of shellfish aquaculture. In this study, we found consistently higher δ15N values near areas of oyster culture. Previous research has found strong relationships between oyster culture and denitrification [91], and shell material alone has been observed to enhance denitrification [92]. Gene-based analysis of the microbiome of Crassostrea virginica found denitrifying bacteria in the oyster tissue and shell, further supporting oyster reefs as hotspots for denitrification [93]. No significant difference was found in S isotopes from oyster culture areas in comparison with non-culture areas (Figure 1C). This pattern suggests that oyster culture may not be enhancing sulfate reduction, which has been noted previously in association with Crassostrea gigas culture [94], and can be a matter of concern in terms of estuarine water quality [95].

5. Conclusions

This study has demonstrated the role that spatial analysis of sediment stable isotope data can play in identifying potential patterns in lagoon metabolism related to N and S processing, and the dispersion of organic matter. Coastal ocean isoscape mapping has proved useful in identifying spatial patterns in productivity, DIC dynamics, and nutrient pollution [6,7,8]. However, as a tool it is not well exploited in comparison with more standard approaches, such as water quality analysis, or even nutrient processing measures, which are substantially more limited in terms of the time window they reflect. This research suggests that stable isotope mapping can provide meaningful insight into the assessment of estuarine metabolism, or can act as a stand-alone tool for generating hypotheses, identifying the influence of spatial gradients, or suggesting prime locations for investigation of microbial abundance or function.

Supplementary Materials

The following are available online at https://www.mdpi.com/2077-1312/8/11/874/s1, Figure S1: title, Table S1: title, Video S1: title. Supplementary Materials: The following are available online at https://www.mdpi.com/2077-1312/8/11/874/s1, Figure S1: Interpolation maps for sediment particle size distribution; Figure S2: Interpolation maps for sediment macronutrient concentration.

Author Contributions

Conceptualization, E.B.W., A.H.-C. and A.B.G.; field sampling E.B.W., J.R.K., A.B.G., A.H.-C., and J.M.; sedimentary analyses J.M., J.R.K., M.E.G., and J.C.H.; mapping, A.H.-C., K.R.V.M., E.B.W.; writing—original draft preparation, E.B.W.; writing—review and editing, E.B.W., J.M., J.R.K., J.M., K.R.V.M.; project administration, A.H.-C., J.C.H.; funding acquisition, A.H.-C., A.B.G., and J.C.H. All authors have read and agreed to the published version of the manuscript.

Funding

This research was supported by UC Mexus-CONACYT collaborative grant [CN-16-147]. E. Watson was supported by a Fulbright-Garcia Robles Scholar Award, A. Gray was supported in part by the USDA National Institute of Food and Agriculture, Hatch program, [CA-R-ENS-5120-H], J. McDonnell was supported in part by UCR graduate research fellowships, and J.R. Krause was supported by the William L. McLean III Fellowship.

Acknowledgments

We thank Stefania Mambelli for sample analysis at the UCB Center for Stable Isotope Biogeochemistry. We thank David Velinsky for access to the IRMS at the Environmental Biogeochemistry Lab of the Academy of Natural Sciences of Drexel University.

Conflicts of Interest

The authors declare no conflict of interest. The funders had no role in the design of the study; in the collection, analyses, or interpretation of data; in the writing of the manuscript, or in the decision to publish the results.

References

  1. Mancinelli, G.; Vizzini, S. Assessing anthropogenic pressures on coastal marine ecosystems using stable CNS isotopes: State of the art, knowledge gaps, and community-scale perspectives. Estuar. Coast. Shelf Sci. 2015, 156, 195–204. [Google Scholar] [CrossRef]
  2. Oczkowski, A.; Kreakie, B.; McKinney, R.A.; Prezioso, J. Patterns in stable isotope values of N and carbon in particulate matter from the Northwest Atlantic continental shelf, from the Gulf of Maine to Cape Hatteras. Front. Mar. Sci. 2016, 3, 252. [Google Scholar] [CrossRef]
  3. Radabaugh, K.R.; Hollander, D.J.; Peebles, E.B. Seasonal δ13C and δ15N isoscapes of fish populations along a continental shelf trophic gradient. Cont. Shelf Res. 2013, 68, 112–122. [Google Scholar] [CrossRef]
  4. Vokhshoori, N.L.; McCarthy, M.D. Compound-specific δ15N amino acid measurements in littoral mussels in the California upwelling ecosystem: A new approach to generating baseline δ15N isoscapes for coastal ecosystems. PLoS ONE 2014, 9, e98087. [Google Scholar] [CrossRef] [PubMed]
  5. Glibert, P.M.; Middelburg, J.J.; McClelland, J.W.; Jake Vander Zanden, M. Stable isotope tracers: Enriching our perspectives and questions on sources, fates, rates, and pathways of major elements in aquatic systems. Limnol. Oceanogr. 2019, 64, 950–981. [Google Scholar] [CrossRef] [Green Version]
  6. Graham, B.S.; Koch, P.L.; Newsome, S.D.; McMahon, K.W.; Aurioles, D. Using isoscapes to trace the movements and foraging behavior of top predators in oceanic ecosystems. In Isoscapes; West, J.B., Bowen, G.J., Dawson, T.E., Tu, K.T., Eds.; Springer: Dordrecht, The Netherlands, 2010; pp. 299–318. [Google Scholar]
  7. Costanzo, S.D.; Udy, J.; Longstaff, B.; Jones, A. Using N stable isotope ratios (δ15N) of macroalgae to determine the effectiveness of sewage upgrades: Changes in the extent of sewage plumes over four years in Moreton Bay, Australia. Mar. Pollut. Bull. 2005, 51, 212–217. [Google Scholar] [CrossRef]
  8. Carriquiry, J.D.; Jorgensen, P.; Villaescusa, J.A.; Ibarra-Obando, S.E. Isotopic and elemental composition of marine macrophytes as biotracers of nutrient recycling within a coastal lagoon in Baja California, Mexico. Estuar. Coast 2016, 39, 451–461. [Google Scholar] [CrossRef]
  9. Pruell, R.J.; Taplin, B.K. Carbon and N isotope ratios of juvenile winter flounder as indicators of inputs to estuarine systems. Mar. Pollut. Bull. 2015, 101, 624–631. [Google Scholar] [CrossRef]
  10. Cornwell, J.C.; Kemp, W.M.; Kana, T.M. Denitrification in coastal ecosystems: Methods, environmental controls, and ecosystem level controls, a review. Aquat. Ecol. 1999, 33, 41–54. [Google Scholar] [CrossRef]
  11. Giblin, A.E.; Tobias, C.R.; Song, B.; Weston, N.; Banta, G.T.; Rivera-Monroy, V.H. The importance of dissimilatory nitrate reduction to ammonium (DNRA) in the N cycle of coastal ecosystems. Oceanography 2013, 26, 124–131. [Google Scholar] [CrossRef] [Green Version]
  12. Marchant, H.K.; Lavik, G.; Holtappels, M.; Kuypers, M.M. The fate of nitrate in intertidal permeable sediments. PLoS ONE 2014, 9, e104517. [Google Scholar] [CrossRef] [PubMed]
  13. Piehler, M.F.; Smyth, A.R. Habitat-specific distinctions in estuarine denitrification affect both ecosystem function and services. Ecosphere 2011, 2, 1–17. [Google Scholar] [CrossRef]
  14. Codispoti, L.A.; Brandes, J.A.; Christensen, J.P.; Devol, A.H.; Naqvi, S.W.A.; Paerl, H.W.; Yoshinari, T. The oceanic fixed N and nitrous oxide budgets: Moving targets as we enter the anthropocene? Sci. Mar. 2001, 65, 85–105. [Google Scholar] [CrossRef]
  15. An, S.; Gardner, W.S.; Kana, T. Simultaneous measurement of denitrification and N fixation using isotope pairing with membrane inlet mass spectrometry analysis. Appl. Environ. Microbiol. 2001, 67, 1171–1178. [Google Scholar] [CrossRef] [Green Version]
  16. Newell, R.I.; Cornwell, J.C.; Owens, M.S. Influence of simulated bivalve biodeposition and microphytobenthos on sediment N dynamics: A laboratory study. Limnol. Oceanogr. 2002, 47, 1367–1379. [Google Scholar] [CrossRef]
  17. Howarth, R.W. Nutrient limitation of net primary production in marine ecosystems. Annu. Rev. Ecol. Syst. 1988, 19, 89–110. [Google Scholar] [CrossRef]
  18. Fulweiler, R.W.; Brown, S.M.; Nixon, S.W.; Jenkins, B.D. Evidence and a conceptual model for the cooccurrence of N fixation and denitrification in heterotrophic marine sediments. Mar. Ecol. Prog. Ser. 2013, 482, 57–68. [Google Scholar] [CrossRef] [Green Version]
  19. Bentzon-Tilia, M.; Traving, S.J.; Mantikci, M.; Knudsen-Leerbeck, H.; Hansen, J.L.; Markager, S.; Riemann, L. Significant N 2 fixation by heterotrophs, photoheterotrophs and heterocystous cyanobacteria in two temperate estuaries. ISME J. 2015, 9, 273. [Google Scholar] [CrossRef] [Green Version]
  20. Oczkowski, A.J.; Santos, E.A.; Martin, R.M.; Gray, A.B.; Hanson, A.R.; Watson, E.B.; Huertas, E.; Wigand, C. Unexpected nitrogen sources in a tropical urban estuary. J. Geophys. Res. Biogeosci. 2020, 125. [Google Scholar] [CrossRef]
  21. Fulweiler, R.W.; Nixon, S.W.; Buckley, B.A.; Granger, S.L. Reversal of the net dinitrogen gas flux in coastal marine sediments. Nature 2007, 448, 180–182. [Google Scholar] [CrossRef]
  22. Moisander, P.H.; Beinart, R.A.; Hewson, I.; White, A.E.; Johnson, K.S.; Carlson, C.A.; Montoya, J.P.; Zehr, J.P. Unicellular cyanobacterial distributions broaden the oceanic N2 fixation domain. Science 2010, 327, 1512–1514. [Google Scholar] [CrossRef]
  23. Russell, D.G.; Warry, F.Y.; Cook, P.L. The balance between N fixation and denitrification on vegetated and non-vegetated intertidal sediments. Limnol. Oceanogr. 2016, 61, 2058–2075. [Google Scholar] [CrossRef]
  24. Jørgensen, B.B. Mineralization of organic matter in the sea bed—The role of sulphate reduction. Nature 1982, 296, 643–645. [Google Scholar] [CrossRef]
  25. Canfield, D.E.; Jørgensen, B.B.; Fossing, H.; Glud, R.; Gundersen, J.; Ramsing, N.B.; Thamdrup, B.; Hansen, J.W.; Nielsen, L.P.; Hall, P.O.J. Pathways of organic carbon oxidation in three continental margin sediments. Mar. Geol. 1993, 113, 27–40. [Google Scholar] [CrossRef]
  26. Böttcher, M.; Brumsack, H.-J.; Dürselen, C.-D. The isotopic composition of modern seawater sulfate: I. Coastal waters with special regard to the North Sea. J. Mar. Syst. 2007, 67, 73–82. [Google Scholar] [CrossRef]
  27. Canfield, D.E.; Thamdrup, B. The production of 34s-depleted sulfide during bacterial disproportionation of elemental sulfur. Science 1994, 266, 1973–1975. [Google Scholar] [CrossRef]
  28. Winner, W.E.; Smith, C.L.; Koch, G.W.; Mooney, H.A.; Bewley, J.D.; Krouse, H.R. Rates of emission of H2S from plants and patterns of stable S isotope fractionation. Nature 1981, 289, 672–673. [Google Scholar] [CrossRef]
  29. Hofmann, M.; Wolf-Gladrow, D.A.; Takahashi, T.; Sutherland, S.C.; Six, K.D.; Maier Reimer, E. Stable carbon isotope distribution of particulate organic matter in the ocean: A model study. Mar. Chem. 2000, 72, 131–150. [Google Scholar] [CrossRef]
  30. Hu, X.; Burdige, D.J.; Zimmerman, R.C. δ13C is a signature of light availability and photosynthesis in seagrass. Limnol. Oceanogr. 2012, 57, 441–448. [Google Scholar] [CrossRef] [Green Version]
  31. Simenstad, C.A.; Wissmar, R.C. d13C evidence of the origins and fates of organic carbon in estuarine and nearshore food webs. Mar. Ecol. Prog. Ser. 1985, 22, 141–152. [Google Scholar] [CrossRef]
  32. Marbà, N.; Holmer, M.; Gacia, E.; Barron, C. Seagrass Beds and Coastal Biogeochemistry. In Seagrasses: Biology, Ecology and Conservation; Larkum, A.W.D., Ed.; Springer: Dordrecht, The Netherlands, 2007; pp. 135–157. [Google Scholar]
  33. Holmer, M. Productivity and biogeochemical cycling in seagrass ecosystems. In Coastal Wetlands, 2nd ed.; Perillo, M.E., Wolanski, E., Cahoon, D.R., Hopkinson, C.S., Eds.; Elsevier: Amsterdam, The Netherlands, 2019; pp. 443–477. [Google Scholar]
  34. Beer, S.; Rehnberg, J. The acquisition of inorganic carbon by the seagrass Zostera marina. Aquat. Bot. 1997, 56, 277–283. [Google Scholar] [CrossRef]
  35. Frederiksen, M.S.; Holmer, M.; Borum, J.; Kennedy, H. Temporal and spatial variation of sulfide invasion in eelgrass (Zostera marina) as reflected by its S isotopic composition. Limnol. Oceanogr. 2006, 51, 2308–2318. [Google Scholar] [CrossRef]
  36. Kharlamenko, V.I.; Kiyashko, S.I.; Imbs, A.B.; Vyshkvartzev, D.I. Identification of food sources of invertebrates from the seagrass Zostera marina community using carbon and S stable isotope ratio and fatty acid analyses. Mar. Ecol. Prog. Ser. 2001, 220, 103–117. [Google Scholar] [CrossRef] [Green Version]
  37. Schubert, P.R.; Karez, R.; Reusch, T.B.; Dierking, J. Isotopic signatures of eelgrass (Zostera marina L.) as bioindicator of anthropogenic nutrient input in the western Baltic Sea. Mar. Pollut. Bull. 2013, 72, 64–70. [Google Scholar] [CrossRef]
  38. Holmer, M.; Hasler-Sheetal, H. Sulfide intrusion in seagrasses assessed by stable S isotopes—A synthesis of current results. Front. Mar. Sci. 2014, 1, 64. [Google Scholar] [CrossRef] [Green Version]
  39. Ottinger, M.; Clauss, K.; Kuenzer, C. Aquaculture: Relevance, distribution, impacts and spatial assessments—A review. Ocean Coast. Manag. 2016, 119, 244–266. [Google Scholar] [CrossRef]
  40. Tallis, H.M.; Ruesink, J.L.; Dumbauld, B.; Hacker, S.; Wisehart, L.M. Oysters and aquaculture practices affect eelgrass density and productivity in a Pacific Northwest estuary. J. Shellfish Res. 2009, 28, 251–261. [Google Scholar] [CrossRef]
  41. Simenstad, C.A.; Fresh, K.L. Influence of intertidal aquaculture on benthic communities in Pacific Northwest estuaries: Scales of disturbance. Estuaries 1995, 18, 43–70. [Google Scholar] [CrossRef]
  42. Kellogg, M.L.; Smyth, A.R.; Luckenbach, M.W.; Carmichael, R.H.; Brown, B.L.; Cornwell, J.C.; Piehler, M.F.; Owens, M.S.; Dalrymple, D.J.; Higgins, C.B. Use of oysters to mitigate eutrophication in coastal waters. Estuar. Coast. Shelf Sci. 2014, 151, 156–168. [Google Scholar] [CrossRef]
  43. Nelson, K.A.; Leonard, L.A.; Posey, M.H.; Alphin, T.D.; Mallin, M.A. Using transplanted oyster (Crassostrea virginica) beds to improve water quality in small tidal creeks: A pilot study. J. Exp. Mar. Biol. Ecol. 2004, 298, 347–368. [Google Scholar] [CrossRef]
  44. La Peyre, M.K.; Humphries, A.T.; Casas, S.M.; La Peyre, J.F. Temporal variation in development of ecosystem services from oyster reef restoration. Ecol. Eng. 2014, 63, 34–44. [Google Scholar] [CrossRef]
  45. Crawford, C.M.; Macleod, C.K.; Mitchell, I.M. Effects of shellfish farming on the benthic environment. Aquaculture 2003, 224, 117–140. [Google Scholar] [CrossRef] [Green Version]
  46. Aguirre-Muñoz, A.; Buddemeier, R.W.; Camacho-Ibar, V.; Carriquiry, J.D.; Ibarra-Obando, S.E.; Massey, B.W.; Smith, S.V.; Wulff, F. Sustainability of coastal resource use in San Quintin, Mexico. AMBIO 2001, 30, 142–150. [Google Scholar] [CrossRef]
  47. Sigman, D.M.; Robinson, R.; Knapp, A.N.; Van Geen, A.; McCorkle, D.C.; Brandes, J.A.; Thunell, R.C. Distinguishing between water column and sedimentary denitrification in the Santa Barbara Basin using the stable isotopes of nitrate. Geochem. Geophys. Geosyst. 2003, 4, 1040. [Google Scholar] [CrossRef] [Green Version]
  48. Kessler, A.J.; Bristow, L.A.; Cardenas, M.B.; Glud, R.N.; Thamdrup, B.; Cook, P.L. The isotope effect of denitrification in permeable sediments. Geochim. Cosmochim. Acta 2014, 133, 156–167. [Google Scholar] [CrossRef]
  49. Camacho-Ibar, V.F.; Carriquiry, J.D.; Smith, S.V. Non-conservative P and N fluxes and net ecosystem production in San Quintin Bay, Mexico. Estuaries 2003, 26, 1220–1237. [Google Scholar] [CrossRef]
  50. Ibarra-Obando, S.E.; Smith, S.V.; Poumian-Tapia, M.; Camacho-Ibar, V.; Carriquiry, J.D.; Montes-Hugo, M. Benthic metabolism in San Quintin Bay, Baja California, Mexico. Mar. Ecol. Prog. Ser. 2004, 283, 99–112. [Google Scholar] [CrossRef] [Green Version]
  51. Medina, F.; Suarez, F.; Espindola, J.M. Historic and Holocene volcanic centers in NW Mexico. Bull. Volcanol. 1989, 51, 91–93. [Google Scholar] [CrossRef]
  52. Luhr, J.F.; Aranda-Gómez, J.J.; Housh, T.B. San Quintin volcanic field, Baja California Norte, Mexico: Geology, petrology, and geochemistry. J. Geophys. Res. Solid Earth 1995, 100, 10353–10380. [Google Scholar] [CrossRef]
  53. Navarro, E.; Daesslé, L.W.; Camacho-Ibar, V.F.; Ortiz-Hernández, M.C.; Gutiérrez-Galindo, E.A. La geoquímica de Fe, Ti y Al como indicadora de la sedimentación volcanoclástica en la laguna costera de San Quintín, Baja California, México. Cienc. Mar. 2006, 32, 205–217. [Google Scholar] [CrossRef]
  54. Gorsline, D.S.; Stewart, R.A. Benthic marine exploration of Bahia de San Quintin, Baja, California, 1960–1961: Marine and Quaternary geology. Pac. Nat. 1962, 3, 282–319. [Google Scholar]
  55. SMN (Servicio Meterorlógico Nacional) 2019. Normales Climatologías. ESTACION: 00002032 LAS ESCOBAS. 17 September 2019. Available online: https://smn.conagua.gob.mx/tools/RESOURCES/Normales5110/NORMAL02032.TXT (accessed on 18 September 2020).
  56. Barnard, J.L. Benthic marine exploration of Bahia de San Quintin, Baja California, 1960–1961. Pac. Nat. 1962, 3, 250–274. [Google Scholar]
  57. García-Esquivel, Z.; González-Gómez, M.A.; Ley-Lou, F.; Mejía-Trejo, A. Oyster culture potential in the west arm of San Quintín Bay: Current biomass and preliminary estimate of the carrying capacity. Cienc. Mar. 2004, 30, 61–74. [Google Scholar] [CrossRef] [Green Version]
  58. Peterson, B.J.; Howarth, R.W. S, carbon, and N isotopes used to trace organic matter flow in the salt-marsh estuaries of Sapelo Island, Georgia 1. Limnol. Oceanogr. 1987, 32, 1195–1213. [Google Scholar] [CrossRef]
  59. Gray, A.B.; Pasternack, G.B.; Watson, E.B. Hydrogen peroxide treatment effects on the particle size distribution of alluvial and marsh sediments. Holocene 2010, 20, 293–301. [Google Scholar] [CrossRef] [Green Version]
  60. Blott, S.J.; Pye, K. Gradistat: A grain size distribution and statistics package for the analysis of unconsolidated sediments. Earth Surf. Process. Landf. 2001, 26, 1237–1248. [Google Scholar] [CrossRef]
  61. Friedman, G.M.; Sanders, J.E. Principles of Sedimentology; Wiley: New York, NY, USA, 1978. [Google Scholar]
  62. Heiri, O.; Lotter, A.F.; Lemcke, G. Loss on ignition as a method for estimating organic and carbonate content in sediments: Reproducibility and comparability of results. J. Paleolimnol. 2001, 25, 101–110. [Google Scholar] [CrossRef]
  63. Angulo-Larios, N. Hidrodinámica de la Bahía de San Quintín, B.C. Master’s Thesis, Facultad de Ciencias Marinas (FCM), Universidad Autónoma de Baja California (UABC), Ensenada, MX, USA, 2006. [Google Scholar]
  64. Canu, D.M.; Aveytua-Alcázar, L.; Camacho-Ibar, V.F.; Querin, S.; Solidoro, C. Hydrodynamic properties of San Quintin Bay, Baja California: Merging models and observations. Mar. Pollut. Bull. 2016, 108, 203–214. [Google Scholar] [CrossRef] [PubMed]
  65. R Core Team. R: A Language and Environment for Statistical Computing; R Foundation for Statistical Computing: Vienna, Austria, 2019. [Google Scholar]
  66. Mevik, B.H.; Wehrens, R.; Liland, K.; Hiemstra, P.; Wehrens, R. PLS: Partial Least Squares and Principal Component Regression, R package version 2.7-2; 2019. Available online: https://cran.r-project.org/web/packages/pls/index.html (accessed on 18 September 2020).
  67. Liland, H.V.; Mehmood, T.; Sæbø, S. plsVarSel: Variable Selection in Partial Least Squares, R Package Version 0.9.4; 2017. Available online: https://mran.microsoft.com/snapshot/2018-04-07/web/packages/plsVarSel/index.html (accessed on 18 September 2020).
  68. Harrell, F.E.; Dupont, C. Package Hmisc: Harrell Miscellaneous, Package Version 4.2-0; 2019. Available online: https://cran.r-project.org/web/packages/Hmisc/index.html (accessed on 18 September 2020).
  69. Wei, T.; Simko, V.; Levy, M.; Xie, Y.; Jin, Y.; Zemla, J. Corrplot: Visualization of a Correlation Matrix, R. Package Version 0.84; 2017. Available online: https://cran.r-project.org/web/packages/corrplot/index.html (accessed on 18 September 2020).
  70. McLeod, A.I. Kendall: Kendall Rank Correlation and Mann-Kendall Trend Test, R Package Version 2.2; 2015. Available online: https://cran.r-project.org/web/packages/pls/kendall.html (accessed on 18 September 2020).
  71. Tanner, W.F. (Ed.) William F. Tanner on Environmental Clastic Granulometry; Florida Geological Survey: Tallahassee, FL, USA, 1995. [Google Scholar]
  72. Lario, J.; Spencer, C.; Plater, A.J.; Zazo, C.; Goy, J.L.; Dabrio, C.J. Particle size characterisation of Holocene back-barrier sequences from North Atlantic coasts (SW Spain and SE England). Geomorphology 2002, 42, 25–42. [Google Scholar] [CrossRef] [Green Version]
  73. Lara-Lara, J.R.; Alvarez-Borrego, S. Ciclo anual de clorofilas y produccion organica primaria en Bahia de San Quintiri, B.C. Cienc. Mar. 1975, 2, 77–97. [Google Scholar] [CrossRef] [Green Version]
  74. Ibarra-Obando, S.E.; Camacho-Ibar, V.F.; Carriquiry, J.D.; Smith, S.V. Upwelling and lagoonal ecosystems of the dry Pacific coast of Baja California. In Coastal Marine Ecosystems of Latin America; Seelinger, U., Kjerfve, B., Eds.; Springer: Heidelberg, Germany, 2001; pp. 315–330. [Google Scholar]
  75. Hernández-Ayón, J.M.; Camacho-Ibar, V.F.; Mejía-Trejo, A.; Cabello-Pasini, A. Variabilidad del CO2 total durante eventos de surgencia en Bahía San Quintín, Baja California, México. In Carbono en Ecosistemas Acuáticos de México; Secretaría de Medio Ambiente y Recursos Naturales, Instituto Nacional de Ecología, Centro de Investigaciones Científicas y de Educación de Ensenada: Ciudad de México, México, 2007; pp. 187–200. [Google Scholar]
  76. Sandoval-Gil, J.M.; Camacho-Ibar, V.F.; del Carmen Ávila-López, M.; Hernández-López, J.; Zertuche-González, J.A.; Cabello-Pasini, A. Dissolved inorganic nitrogen uptake kinetics and δ15N of Zostera marina L. (eelgrass) in a coastal lagoon with oyster aquaculture and upwelling influence. J. Exp. Mar. Biol. Ecol. 2015, 472, 1–13. [Google Scholar] [CrossRef]
  77. Hernández-López, J.; Camacho-Ibar, V.F.; Macías-Tapia, A.; McGlathery, K.J.; Daesslé, L.W.; Sandoval-Gil, J.M. Benthic N fixation in Zostera marina meadows in an upwelling-influenced coastal lagoon. Cienc. Mar. 2017, 43, 35–53. [Google Scholar] [CrossRef] [Green Version]
  78. Montoya, J.P.; Carpenter, E.J.; Capone, D.G. N fixation and N isotope abundances in zooplankton of the oligotrophic North Atlantic. Limnol. Oceanogr. 2002, 47, 1617–1628. [Google Scholar] [CrossRef] [Green Version]
  79. Newell, S.E.; McCarthy, M.J.; Gardner, W.S.; Fulweiler, R.W. Sediment N fixation: A call for re-evaluating coastal N budgets. Estuaries Coast. 2016, 39, 1626–1638. [Google Scholar] [CrossRef]
  80. Detmers, J.; Brüchert, V.; Habicht, K.S.; Kuever, J. Diversity of S isotope fractionations by sulfate-reducing prokaryotes. Appl. Environ. Microbiol. 2001, 67, 888–894. [Google Scholar] [CrossRef] [Green Version]
  81. Strauss, H. The isotopic composition of sedimentary S through time. Palaeogeogr. Palaeoclimatol. Palaeoecol. 1997, 132, 97–118. [Google Scholar] [CrossRef]
  82. Invers, O.; Zimmerman, R.C.; Alberte, R.S.; Perez, M.; Romero, J. Inorganic carbon sources for seagrass photosynthesis: An experimental evaluation of bicarbonate use in species inhabiting temperate waters. J. Exp. Mar. Biol. Ecol. 2001, 265, 203–217. [Google Scholar] [CrossRef]
  83. Pedersen, O.; Binzer, T.; Borum, J. Sulphide intrusion in eelgrass (Zostera marina L.). Plant Cell Environ. 2004, 27, 595–602. [Google Scholar] [CrossRef]
  84. Kennedy, H.; Beggins, J.; Duarte, C.M.; Fourqurean, J.W.; Holmer, M.; Marbà, N.; Middelburg, J.J. Seagrass sediments as a global carbon sink: Isotopic constraints. Glob. Biogeochem. Cycles 2010, 24, GB4026. [Google Scholar] [CrossRef] [Green Version]
  85. Oczkowski, A.; Markham, E.; Hanson, A.; Wigand, C. Carbon stable isotopes as indicators of coastal eutrophication. Ecol. Appl. 2014, 24, 457–466. [Google Scholar] [CrossRef]
  86. Ribas-Ribas, M.; Hernández-Ayón, J.M.; Camacho-Ibar, V.F.; Cabello-Pasini, A.; Mejia-Trejo, A.; Durazo, R.; Galindo-Bect, S.; Souza, A.J.; Forja, J.M.; Siqueiros-Valencia, A. Effects of upwelling, tides and biological processes on the inorganic carbon system of a coastal lagoon in Baja California. Estuarine. Coast. Shelf Sci. 2011, 95, 367–376. [Google Scholar] [CrossRef]
  87. Welsh, D.T. N fixation in seagrass meadows: Regulation, plant–bacteria interactions and significance to primary productivity. Ecol. Lett. 2000, 3, 58–71. [Google Scholar] [CrossRef]
  88. Moriarty, D.J.W.; Iverson, R.L.; Pollard, P.C. Exudation of organic carbon by the seagrass Halodule wrightii Aschers. And its effect on bacterial growth in the sediment. J. Exp. Mar. Biol. Ecol. 1986, 96, 115–126. [Google Scholar] [CrossRef]
  89. Holmer, M.; Andersen, F.Ø.; Nielsen, S.L.; Boschker, H.T. The importance of mineralization based on sulfate reduction for nutrient regeneration in tropical seagrass sediments. Aquat. Bot. 2001, 71, 1–17. [Google Scholar] [CrossRef]
  90. Hemminga, M.A. The root/rhizome system of seagrasses: An asset and a burden. J. Sea Res. 1998, 39, 183–196. [Google Scholar] [CrossRef]
  91. Humphries, A.T.; Ayvazian, S.G.; Carey, J.C.; Hancock, B.T.; Grabbert, S.; Cobb, D.; Strobel, C.J.; Fulweiler, R.W. Directly measured denitrification reveals oyster aquaculture and restored oyster reefs remove N at comparable high rates. Front. Mar. Sci. 2016, 3, 74. [Google Scholar] [CrossRef] [Green Version]
  92. Caffrey, J.M.; Hollibaugh, J.T.; Mortazavi, B. Living oysters and their shells as sites of nitrification and denitrification. Mar. Pollut. Bull. 2016, 112, 86–90. [Google Scholar] [CrossRef] [PubMed]
  93. Arfken, A.; Song, B.; Bowman, J.S.; Piehler, M. Denitrification potential of the eastern oyster microbiome using a 16S rRNA gene based metabolic inference approach. PLoS ONE 2017, 12, e0185071. [Google Scholar] [CrossRef]
  94. Hyun, J.H.; Kim, S.H.; Mok, J.S.; Lee, J.S.; An, S.U.; Lee, W.C.; Jung, R.H. Impacts of long-line aquaculture of Pacific oysters (Crassostrea gigas) on sulfate reduction and diffusive nutrient flux in the coastal sediments of Jinhae–Tongyeong, Korea. Mar. Pollut. Bull. 2013, 74, 187–198. [Google Scholar] [CrossRef]
  95. Kang, X.; Liu, S.; Ning, X. Reduced inorganic S in sediments of the mariculture region of Sanggou Bay, China. Aquacult. Environ. Interac. 2016, 8, 233–246. [Google Scholar] [CrossRef] [Green Version]
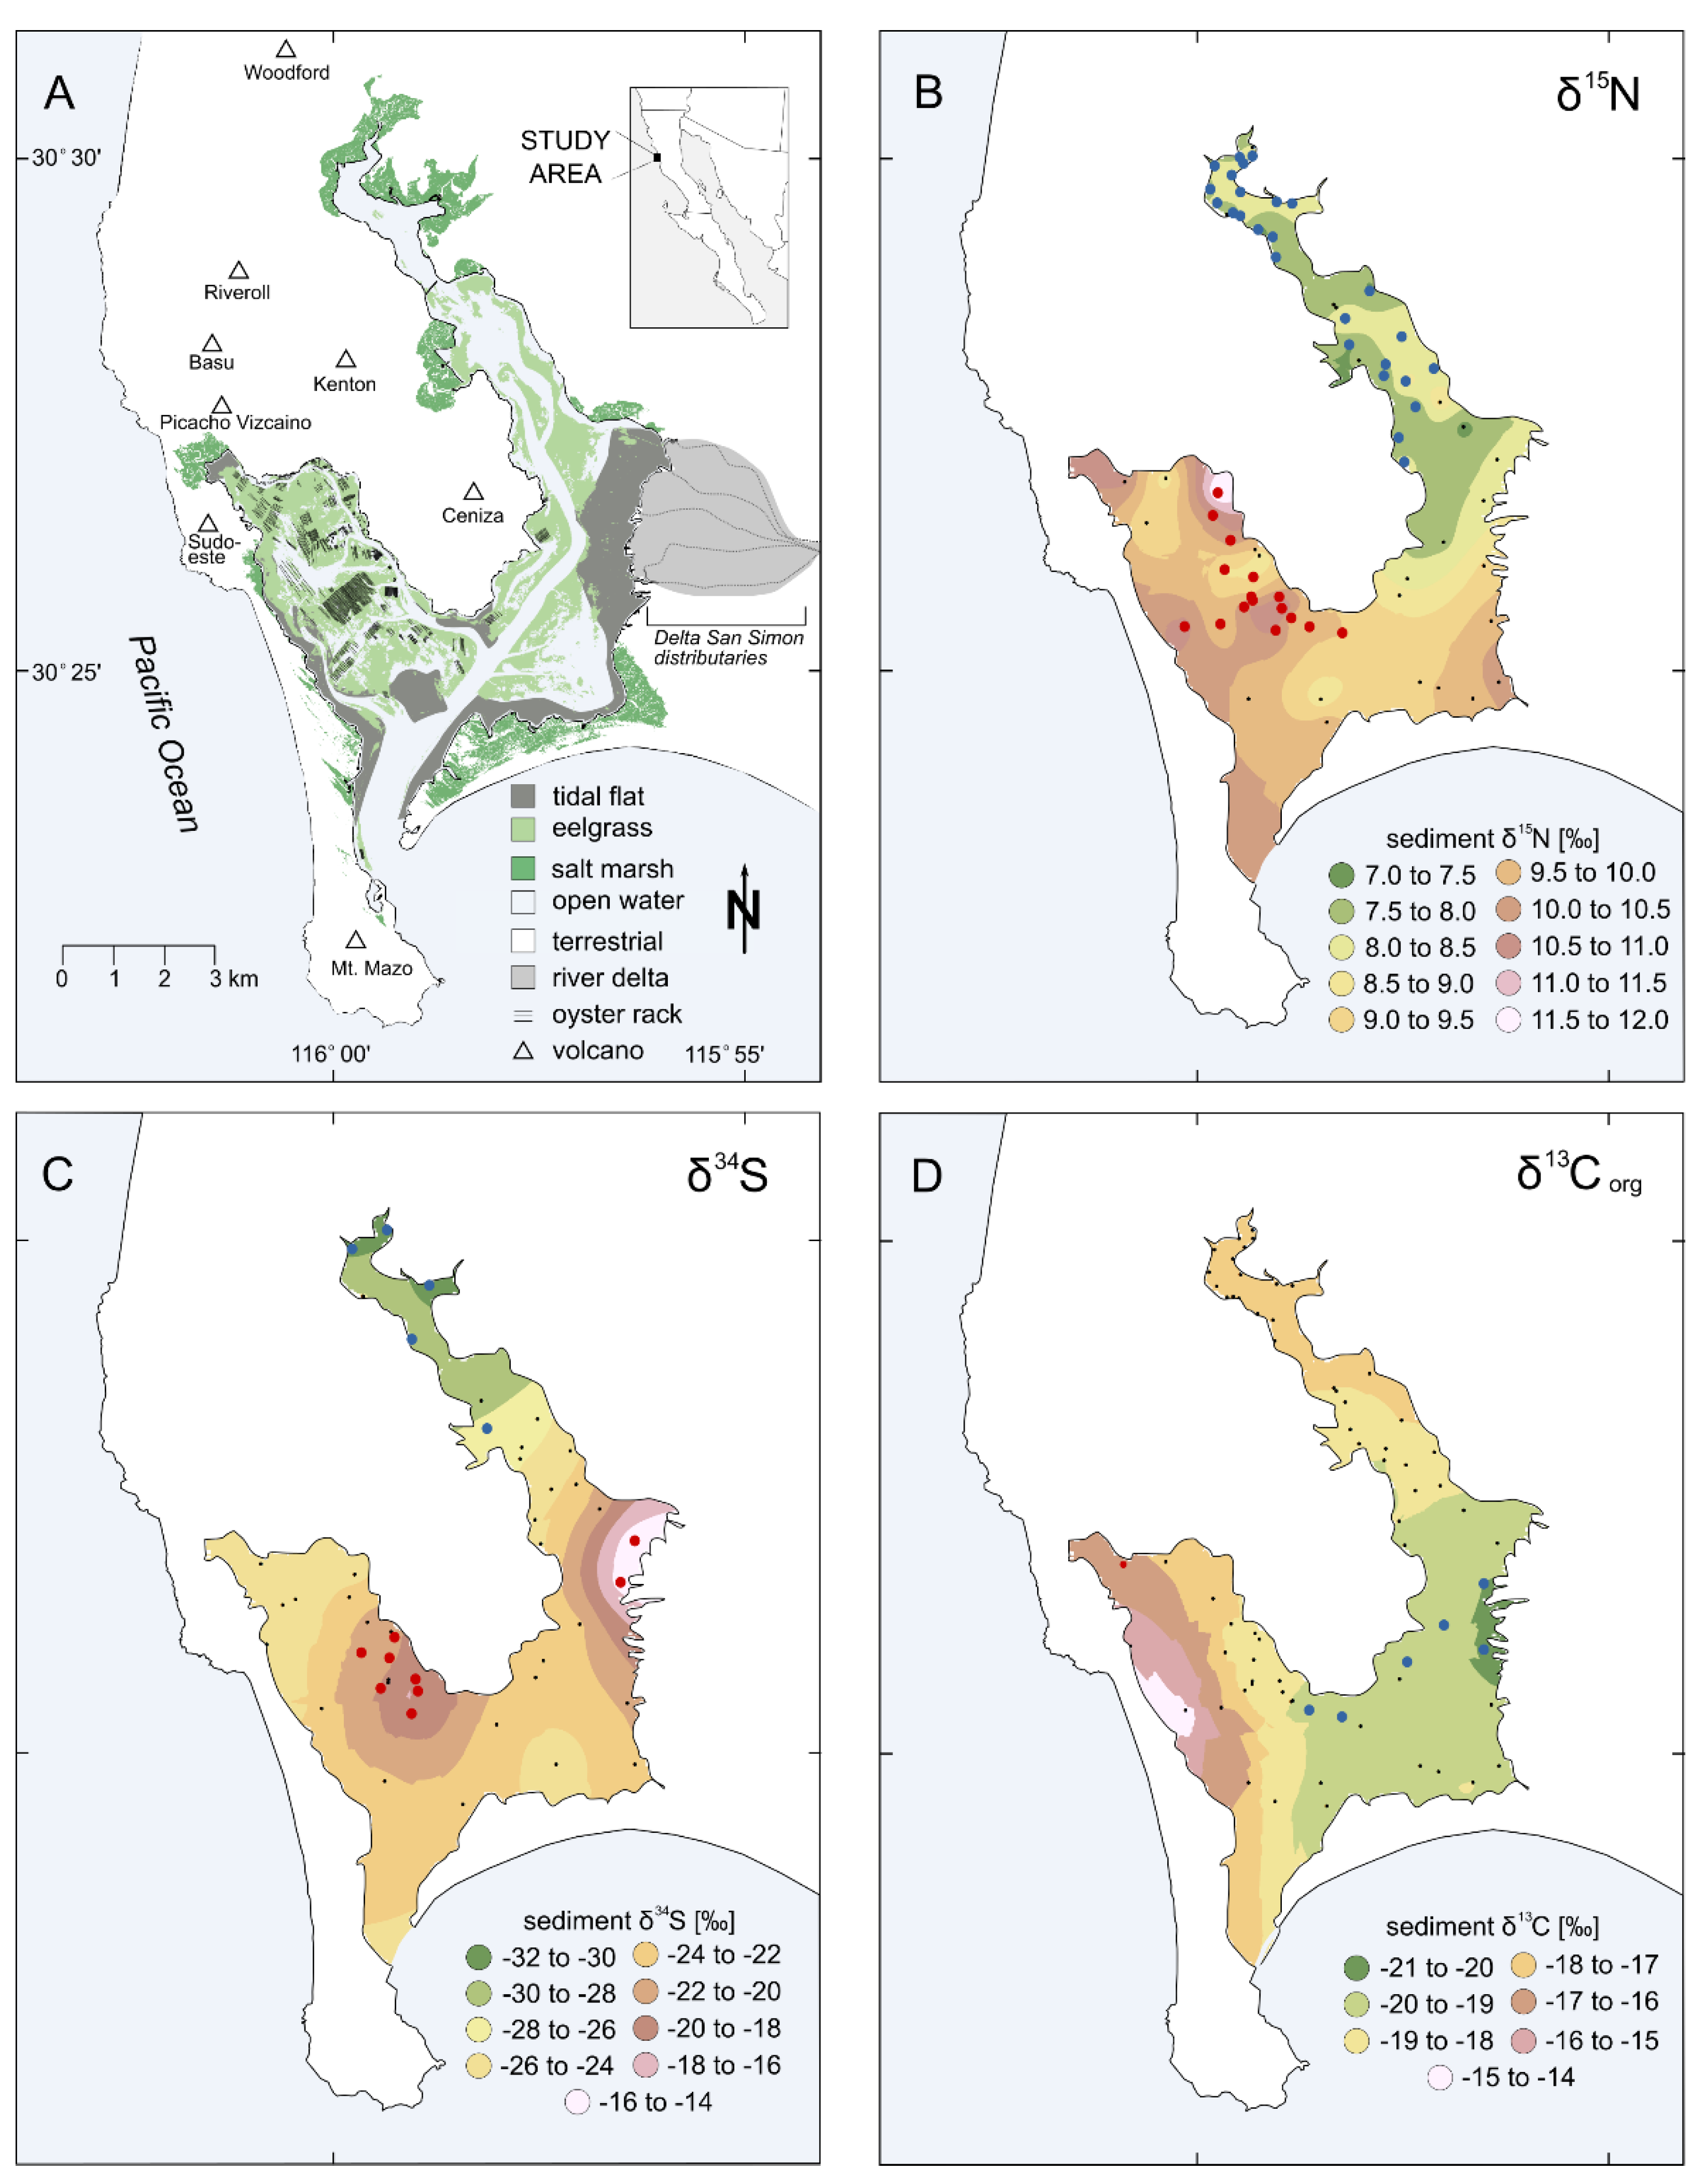
Figure 1. Location map of Bahía San Quintín (BSQ) showing the two arms of the bay: the eastern arm is known as Brazo de San Quintín, and the western arm is known as Bahía Falsa (A). The other panels depict spatial patterns in bulk sediment δ13Corg (B), δ15N (C), and δ34S (D). Statistically significant hot and cold spots are demarcated with red and blue markers, respectively.
Jmse 08 00874 g001
Figure 2. Spatial patterns in sediment isotope ratios: (A) variation in sediment isotope ratios between the two arms of the lagoon (Bahía Falsa and Brazo de San Quintín), (B) variation in isotopic ratios with distance from the lagoon mouth, measured as latitude and the product of a cost–distance function. Locally estimated scatterplot smoothing (LOESS) curves summarize spatial relationships. Statistics represent the results of a Mann–Whitney–Wilcoxon test and Kendall trend analysis, non-parametric tests for distributions and regression, respectively.
Jmse 08 00874 g002
Figure 3. Stable isotope principal least squares (PLS) model results, showing percent variance explained, and significant explanatory variables for δ15N (A), δ34S (B), and δ13C (C). Variable importance for project (VIP) factors are indicated for the variables’ importance in the model.
Jmse 08 00874 g003
Figure 4. Correlation matrix of sediment characteristics and environmental gradients.
Jmse 08 00874 g004
Figure 5. Biplots of stable isotope ratios δ15N and δ13C (A), δ34S and δ13C (B), and δ34S and δ15N (C) in organic matter sources collected from BSQ (Table 1), including seston, Ulva species, Spartina foliosa, Zostera marina, Salicornia pacifica, and Crassostrea gigas.
Jmse 08 00874 g005
Figure 6. Depositional domain analysis results for lagoon sediments. Sorting and mean values were estimated using the method of moments. Depositional domains based on [71,72].
Jmse 08 00874 g006
Figure 7. Distribution of sediment bulk stable isotope ratios for samples with and without eelgrass cover (A), for samples near (<20 m) and distant from (>20 m) seagrass meadow (B), and for samples near (<100 m) and distant from (>100 m+) oyster culture (C). Statistics represent the results of a Mann–Whitney–Wilcoxon test for magnitude (W) and the Fligner–Kileen test for homogeneity of variance (χ2).
Jmse 08 00874 g007
Table 1. Organic matter sources to lagoon sediments analyzed for stable isotopes from BSQ.
MaterialCollection DateNumber of Samples
Zostera marina9 July 201818
Zostera marina29 November 201626
Seston25 August 201714
Seston10 July 201810
Ulva spp.1 December 201617
Crassostrea gigas23 August 201718
Spartina foliosa29 November 20166
Salicornia pacifica29 November 20163
feces/pseudofeces.
Publisher’s Note: MDPI stays neutral with regard to jurisdictional claims in published maps and institutional affiliations.