Article

On the Separation Period Discriminating Gravity and Infragravity Waves off Gyeongpo Beach, Korea

1
Maritime ICT R&D Center, Korea Institute of Ocean Science and Technology, 385 Haeyang-ro, Yeongdo-gu, Busan 49111, Korea
2
Coastal Development and Ocean Energy Research Center, Korea Institute of Ocean Science and Technology, 385 Haeyang-ro, Yeongdo-gu, Busan 49111, Korea
*
Author to whom correspondence should be addressed.
J. Mar. Sci. Eng. 2020, 8(3), 167; https://doi.org/10.3390/jmse8030167
Submission received: 11 February 2020 / Revised: 23 February 2020 / Accepted: 25 February 2020 / Published: 3 March 2020
(This article belongs to the Special Issue Advances in Nearshore Hydrodynamics Research)

Abstract

:
Although there have been a number of studies investigating fundamental characteristics of infragravity waves in coastal zones, a proper method of deciding period ranges that are associated with gravity or infragravity waves remains uncertain. In this study, we proposed an empirical method of separating spectral energies of gravity and infragravity waves by analyzing the wave observation data acquired off Gyeongpo beach on the Korean east coast. The fundamental principle of the suggested method is to represent the separation period discriminating gravity and infragravity waves as a function of the significant wave period, rather than a fixed value that was conventionally applied in previous studies. As a consequence of using the new method, the relationships between heights and periods of gravity and infragravity waves were more clearly identified.

1. Introduction

According to the distribution of the energy spectra of ocean surface waves that is classified by the wave period [1], most of the wave energy, except for tsunamis and tides, comprises gravity waves and infragravity waves. As shown in Figure 1, periods of the ocean surface waves typically range from one second to five minutes. Gravity waves are generated by wind blowing over the ocean surface whereas infragravity waves are formed by energy transfer from the short wind waves. Both gravity and infragravity waves are restored by gravity [2]. Gravity waves normally have a period of 1–3 to 20–30 s, whereas the period of infragravity waves typically ranges from 20–30 s to 200–300 s.
The height of infragravity waves is only a few centimeters in deep water, but it can be close to that of gravity waves at a coast where extreme wave events occur. Infragravity waves usually have less energy than gravity waves, but they may play significant roles in certain phenomena occurring in coastal zones. For this reason, infragravity waves have been studied by many researchers with regard to nearshore hydrodynamics [3,4], sediment transport [5], and development of seiche in a harbor [6]. In Korea, the effects of infragravity waves are known to be less apparent as in some countries that have coasts directly facing oceans. On the east coast of Korea, however, the influence of infragravity waves is not negligible [7,8,9] especially when severe storm waves are prevailing.
Infragravity waves are known to be generated by subharmonic interaction in wave groups [10,11]. Underneath high waves of the group waves, the trough of the infragravity waves is induced. Meanwhile, the crest of the infragravity waves is created below low waves of the groups. The form of infragravity waves is bounded by the group waves during propagation until shallow water. Near to a surf zone, where short waves start to break, infragravity waves become un-bounded and propagate ashore as free waves. Longuet-Higgins and Stewart described such a propagation mechanism of infragravity waves with a concept of the gradient of the radiation stress [10,11]. As infragravity waves propagate into shallow water, infragravity waves lag behind the group due to phase differences between the group and the bound wave. This phase shift enables energy transfers from gravity waves to infragravity waves [12,13].
Loss of infragravity wave energy was once expected to be dominated by bottom friction, but its effect is found to be very small on sandy beaches [13,14]. The infragravity wave energy is dissipated either by breaking of the infragravity wave itself or the transfer of energy back to a higher frequency band corresponding to gravity waves [13,15]. As the energy transfer process produces higher infragravity harmonics, the wave shape gradually becomes asymmetric and then the steeper shape of waves finally makes them break [16]. Some of infragravity waves are reflected or freed as a form of standing waves, edge waves, and leaky waves, and thus they may exist on a coast as a complex form [17,18,19].
Evaluation of infragravity waves from field-observation data is normally carried out by calculating moments of energy over the period band corresponding to infragravity waves. If the period range associated with infragravity waves is determined, quantities of infragravity waves can be estimated from the spectral energy of the corresponding range. Hence, the magnitude of infragravity waves strongly depends on the selected range of the period. In this context, it is very important to properly define the period range of infragravity waves that fully reflects characteristics of infragravity waves in a certain region, which leads to accurate estimation of the quantities of infragravity waves.
The period range of infragravity waves was presented from 30 s to 5 min in [1], and in following studies the lower limit has been typically set between 20–30 s and the upper limit between 200–300 s [4,5,6,7]. This period range has been somewhat flexibly determined considering local wave characteristics and morphological conditions. Among the two limits, in particular, the lower limit is termed as the separation period because it separates the period range of gravity and infragravity waves. In the previous researches, the separation period of 20 or 25 s was typically used if a wave field was dominated by swell [4,20]. On the other hand, the separation period of 20 s was commonly used when wind waves are dominant [15,21].
Considering this, it is quite natural that the magnitude of infragravity waves can be different depending on the choice of the separation period [8,22,23,24]. In fact, the heights and periods of infragravity waves observed at Sokcho beach on the Korean east coast were apparently different depending on the use of different separation periods of 20, 25 and 30 s. In contrast, the upper limit, or higher cutoff period of infragravity waves, had little decisive influence on the magnitude of infragravity waves [25].
Therefore, it is necessary to select the separation frequency based on a reliable method that takes account of the characteristics of infragravity waves. In this study, the separation period was selected by searching a proper period of discriminating energy of gravity and infragravity waves in the observed wave spectrum. In most of the wave spectrum, energy peaks of gravity and infragravity waves appear and the trough between the two peaks can be identified, especially when a wave field is dominated by relatively high and long waves. Then, it would be possible to present a proper method to accurately distinguish gravity and infragravity wave spectra, by which a suitable separation period can be suggested.
In practice, however, the shape of wave spectra at a certain location may vary significantly depending on wave characteristics. As a result, it is not always straightforward to discern the cutoff point that discriminates gravity and infragravity waves. Considering this, we classified wave spectra according to the significant wave period, for the wave data continuously observed over eight years off the coast of Gyeongpo beach in Gangwon province of Korea. The overall shapes of such classified spectra were similar to one another, so it was possible to suggest an appropriate method of adaptively separating spectral energies of gravity and infragravity waves.

2. Materials and Methods

2.1. Long-Term Wave Monitoring Data off Gyeongpo Beach

Gyeongpo beach is a plane parallel beach that is widely open towards the East Sea of Korea (see Figure 2). The sea bed slope in front of the beach is relatively gentle at approximately 1/50 and constant to the offshore, which is a typical feature of the Korean east coast. A pressure-type wave gauge (WTG), equipped with a Paroscientific Digiquartz® broadband pressure sensor [26], was deployed at 800 m offshore (37°47 12850.8 43N and 128°55′43.2′′E) where water depth is about 14 m. The pressure sensor has been used in a number of oceanographic studies [27,28,29], providing high-precision measurements of water levels over wide frequency ranges. Typical accuracy of the Digiquartz® sensor is 0.01% of full scale or better. A long-term wave monitoring campaign was continuously carried out for a total of eight years from May 2005 to April 2013 without missing data for more than five days.
Sea-level displacement can be obtained by applying the transfer function from the wave pressure that is measured at the sampling rate of 0.5 s. In this study, a wave spectrum was obtained every 90 minutes from the sea-level displacement signal of 8192 data points (or 4096 s), after removing a possible trend of the signal by use of the linear function. For estimating the power spectral density of the de-trended signal, pwelch function in Matlab’s Signal Processing Toolbox was used with a Hanning window without overlap. No digital filters for eliminating tidal-period variations were used.
Then, calculating the moment of a single wave spectrum gives a significant wave height and a mean wave period as follows:
H s = 4 m 0   ,
T z = m 0 / m 2   ,
where 0th moment m 0 and 2nd moment m 2 can be obtained by the following equation:
m n = f 1 f 2 f n · S ( f ) d f   ,
where S ( f ) is the spectral density function of the surface displacement, and f 1 and f 2 are the lower and upper cutoff frequencies, respectively. With regard to the gravity waves, the upper cutoff frequency corresponds to a separation from the ultra-gravity wave, whereas the lower cutoff frequency from the infragravity waves. As mentioned in the above ([4,17,18,19]), a typical value of the upper cutoff frequency is 1/3 s, while the lower cutoff frequency is determined in between 1/20 and 1/30 s. The wave period corresponding to the lower cutoff frequency that distinguishes the gravity wave from the infragravity wave is defined as the separation period in this study.
Meanwhile, the significant wave period ( T 1 / 3 ) can be obtained as follows:
T 1 / 3 = 1 N / 3 i = 1 N / 3 T H i   ,
where H i is the individual wave heights that are obtained by the zero-upcrossing method and then re-arranged in descending order from the largest ( H 1 ) to the smallest ( H N ), and T H i is the period of the wave height of H i . Thus, the significant wave period in Equation (4) means the average period of the upper N/3 waves in terms of the magnitude of H i . According to a recent study that analyzed wave characteristics on the East Sea, the significant wave period can be successively related to the wave spectral parameters such as peak period, mean period, or peakedness parameter [30].

2.2. Methods of Wave Analysis

In this study, the overall shape of the wave spectrum was intensively analyzed to identify the wave period that separates gravity waves and infragravity waves. For this analysis, every single wave spectrum was categorized according to the significant wave period ( T 1 / 3 ), based on the assumption that the threshold wave period would have a proportional relationship with the significant wave period. In this respect, each wave spectrum was classified according to T 1 / 3 at an interval of one second for the range of 5 s < T 1 / 3 ≤ 12 s. As illustrated in Table 1, a wave spectrum whose significant wave period is either smaller than 5 s or greater than 12 s was categorized into a single group, respectively. Hence, a total of nine classes were considered in terms of the magnitude of T 1 / 3 . It is noteworthy that the number of spectra with 5 s < T 1 / 3 ≤ 7 s occupies 61.5 % of the total data, but the spectral energy within this range corresponds to only 11.2 % of the total energy. On the other hand, the number of spectra with 7 s < T 1 / 3 ≤ 12 s occupies 35.5% of the total data, but possesses up to 84.6% of the total energy. In the table, the values of representative T 1 / 3 are obtained by taking an average of the significant wave period T 1 / 3 of all the data belonging to each class.

3. Results and Discussion

3.1. Separation Period of Infragravity Waves

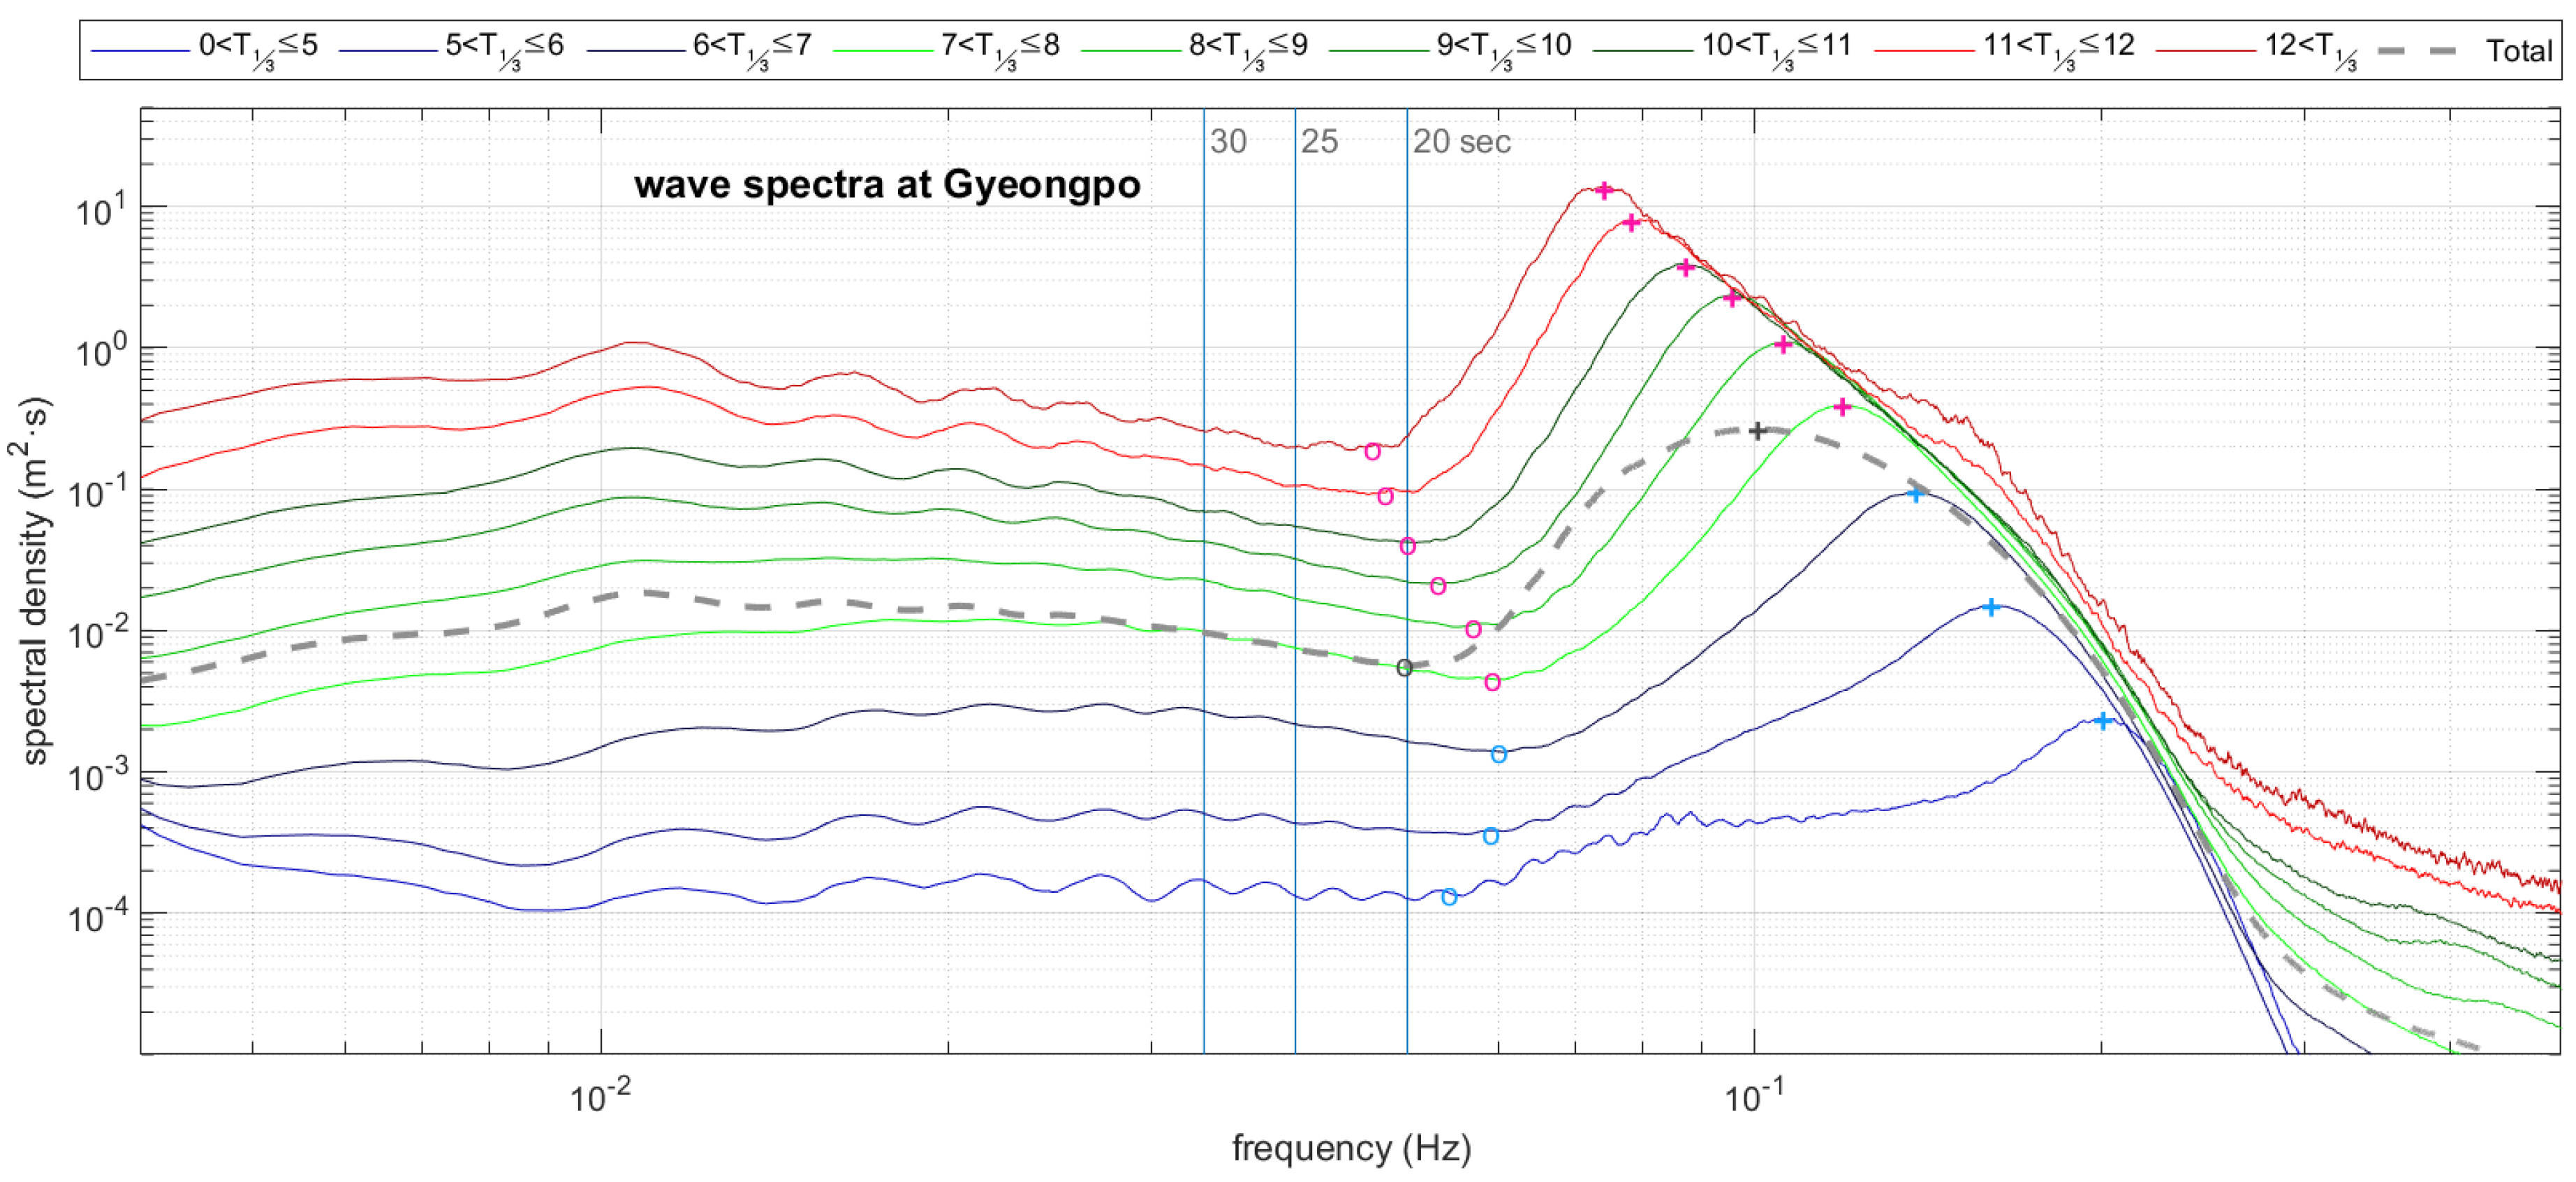
Figure 3 shows the mean wave spectra of each of the nine classes, which are smoothed by moving average with a span length of 10. For instance, the deep blue line represents the wave spectrum that is obtained by taking an average of the 14,136 wave spectra whose significant wave period is in the range of 5 < T 1 / 3 ≤ 6. In the figure, the dotted gray line denotes the mean spectrum obtained from all the data (i.e., 46,500 wave spectra). The vertical lines at 20, 25, and 30 s on the graph show typical values that are adopted in the previous studies to separate infragravity and gravity waves. Indeed, those values are situated in between the peak of the gravity waves on the right hand side, which are marked with the “+” symbol, and the peak of the infragravity waves on the left hand side. Meanwhile, the actual minimum points of the nine mean wave spectra were marked with the “o” symbol.
In Figure 3, it is very clear that the separation frequency denoted with the symbol “o” varies depending on the magnitude of the significant wave period. In particular, for the top six spectra corresponding to T 1 / 3 > 7 s the separation frequency ( f s e p ) slightly increases with the value of T 1 / 3 . In contrast, the separation frequency decreases with T 1 / 3 for the remaining three spectra corresponding to T 1 / 3 ≤ 7 s. Meanwhile, the peak frequency of the gravity waves ( f p ) , denoted with the symbol “+”, shows a monotonously increasing trend with the increase of T 1 / 3 . The separation period ( T s e p ), which is an inverse of f s e p , and the peak period ( T p ) , which is an inverse of f p , are tabulated in Table 1.
As shown in Figure 3, the separation frequency of the mean spectrum of the entire data, displayed with the dotted gray line, is found to be 20 s. This implies that this value is the most suitable, among the values of 20, 25, and 30 s, to separate infragravity and gravity waves at Gyeongpo beach. Hence, if the separation frequency of either 25 or 30 s is applied, the magnitude of an infragravity wave would be underestimated.
In the figure, small wavy undulations are observed in all the curves over the frequency ranges corresponding to infragravity waves. According to previous studies on wave observation at other locations on the Korean east coast [22,23,24], such undulations either have different patterns depending on the locations or are not even observed at some locations. For this reason, these undulations are presumed to be caused by regional effects such as reflections from the coast, which explains why the undulations are very similar for all curves.
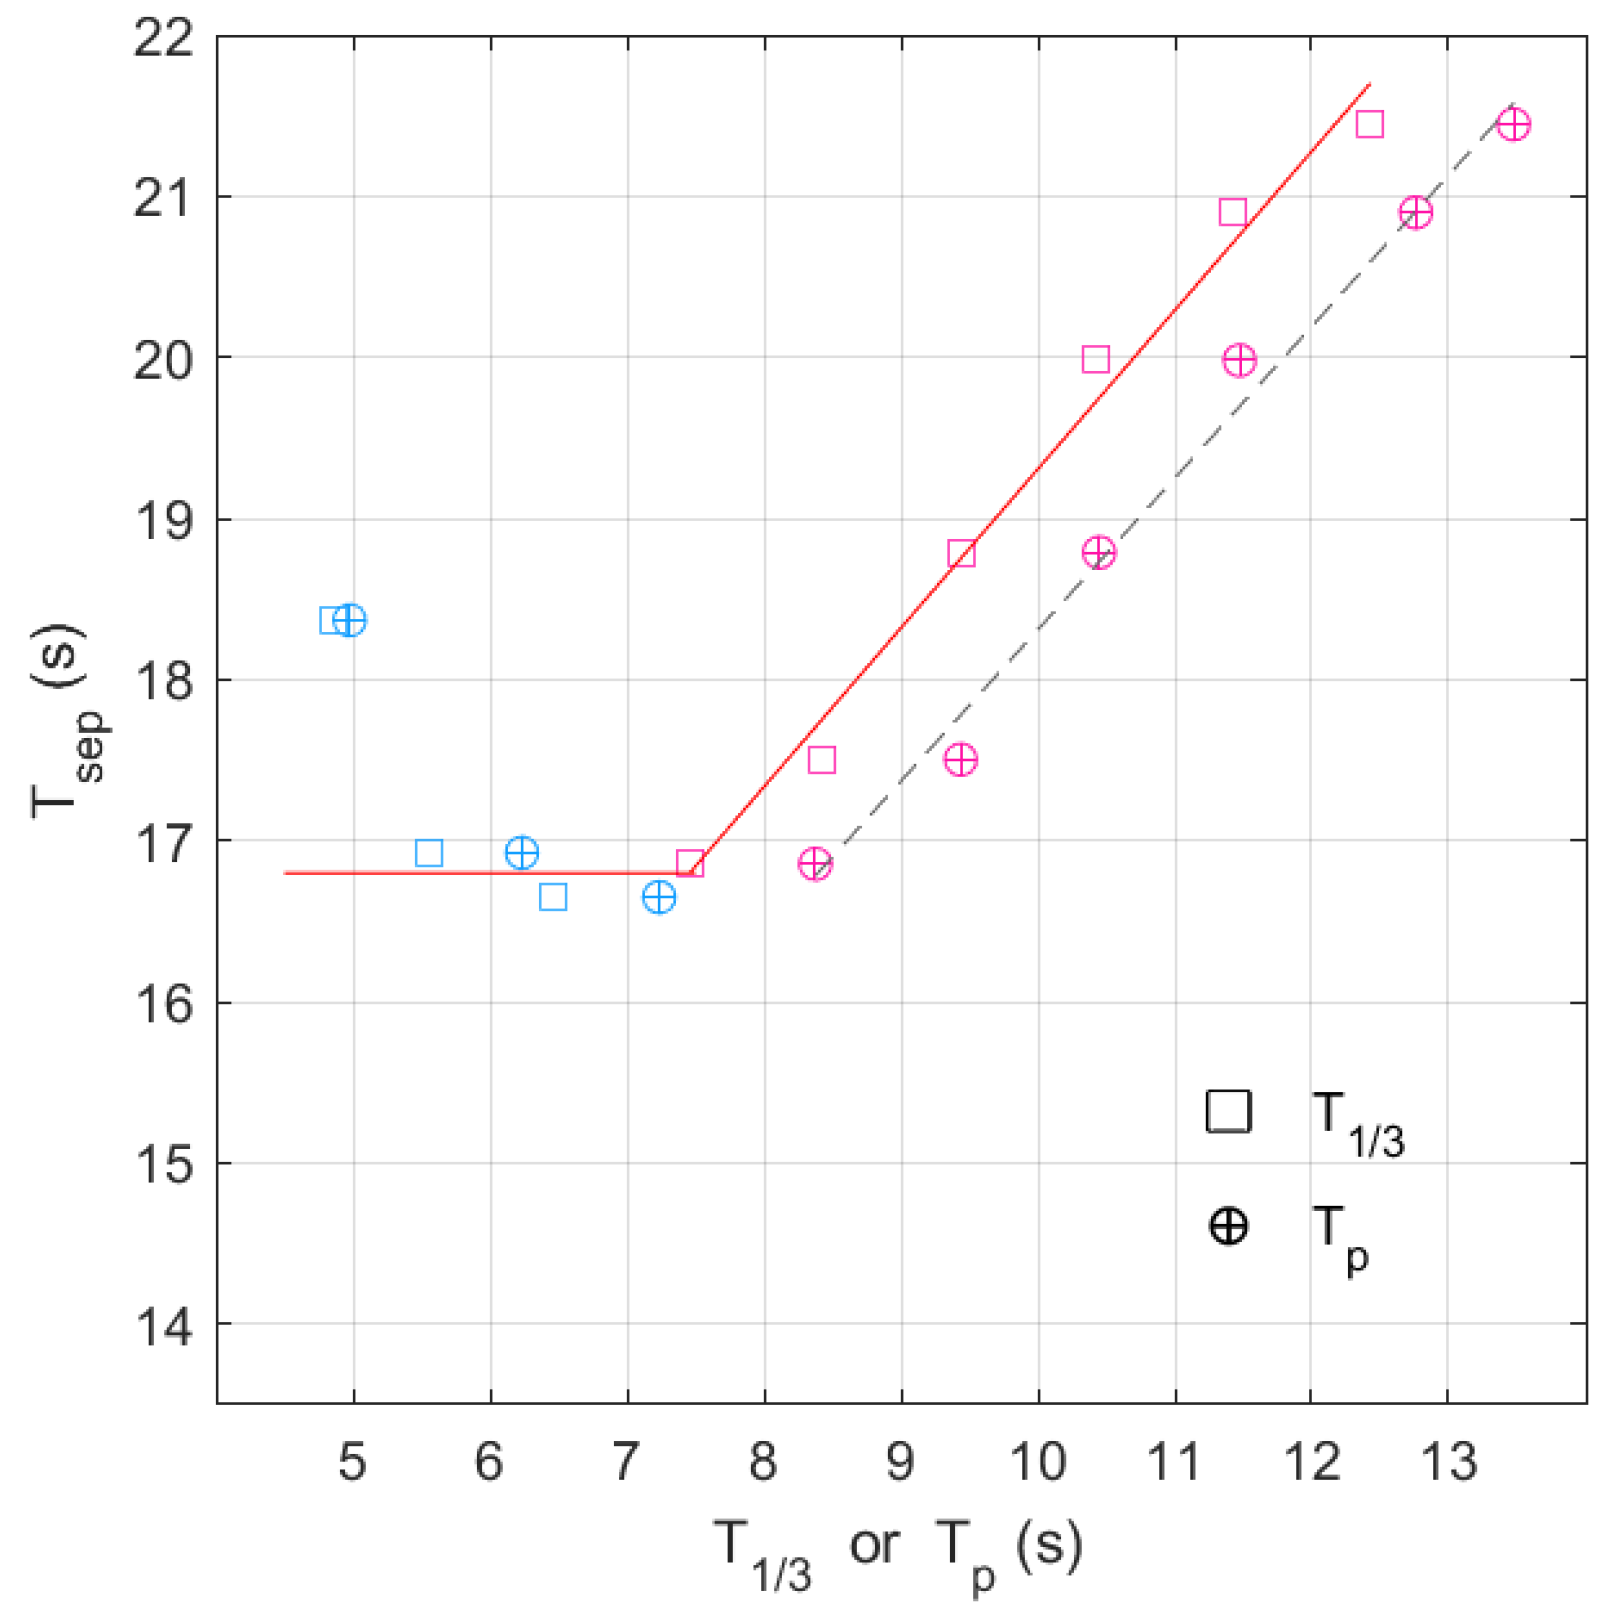
Figure 4 shows the plot between the separation period ( T s e p ) and the peak period ( T p ), which is marked with the symbol of “⊕”. Note that this symbol is a combination of “+” and “o” symbol that represent T p and T s e p , respectively, as defined in Figure 3. In the range of T p > 8.4 s, almost proportional relationship is found between the two quantities as marked with the symbol of magenta color. On the other hand, an inversely proportional relationship appears in the range of T p ≤ 7.2 s as marked with the symbol (⊕) of cyan color. Also shown in the figure is a similar plot between T s e p and T 1 / 3 , which is illustrated with the symbol of “□”. A very similar tendency to the plot of T s e p and T p is found between the two quantities, showing proportional relationship between T s e p and T 1 / 3 in the range of T 1 / 3 > 7.5 s, while almost invariant T s e p against T 1 / 3 ¯ outside this range.

3.2. A Formula for Evaluating the Separation Frequency

Based on the proportional relationship of the representative T 1 / 3 as a function of T s e p over the range of T 1 / 3 > 7.5 s, a linear regression analysis is carried out, which results in a fairly high value of R 2 = 0.99. The regression line is shown in red color in Figure 4. The formula corresponding to the regression line is given as Equation (5a). This implies that the separation frequency is well represented as a function of the significant wave period for the range of T 1 / 3 > 7.5 s. Over the range of T 1 / 3 ≤ 7.5 s, meanwhile, it is recommended to use a fixed value of T s e p as Equation (5b), which is shown as a horizontal red line that is connected to the regression lines at T 1 / 3 = 7.5 s.
T s e p = 0.99 T 1 / 3 + 9.44   for   T 1 / 3 > 7.5 s ,
T s e p = 16.87   for   T 1 / 3 7.5 s
The reason for applying a constant separation period for T 1 / 3 ≤ 7.5 s is because the separation period is less clearly identified in this range, as illustrated in Figure 3. This implies that there should be higher uncertainty of determining the cutoff frequency that separates gravity waves and infragravity waves. Considering this, it is suggested to determine T s e p to be constant as in Equation (5b), rather than a function of the significant wave period, over the range of T 1 / 3 ≤ 7.5 s.
As indicated in Table 1, the ratio of data corresponding to T 1 / 3 ≤ 7.5 s is 83.4% of the total data. For those data, T s e p = 16.87 s is suggested as Equation (5b), which is obviously smaller than the typical values in between 20 to 30 s in the previous studies. For the remaining 16.6% of the total data corresponding to T 1 / 3 > 7.5 s, meanwhile, a normalized histogram of T s e p is provided in Figure 5. It is a right-skewed histogram that has a short left tail and a long right tail up to 23 s. The median value of T s e p is 17.7 s in the histogram. The maximum value of T s e p is 22.9 s, the most right outlier in the box plot below the histogram. It is noteworthy that the maximum T s e p is still substantially smaller than 25 or 30 s that were applied in the previous study.
The separation period of the mean spectrum from all the data (dotted gray line in Figure 3) is 20 s, which is marked with a gray circle in the figure. As explained in the above, this value is the most suitable separation period for the waves observed at Gyeongpo, among the three candidates of 20, 25, and 30 s that were typically used in the previous studies. In this study, however, it is now clearly demonstrated that the separation period is a function of the significant wave period. Hence, use of the constant value of T s e p = 20 s is not sufficiently satisfactory to discriminate the spectral energies associated with infragravity and gravity waves respectively. For instance, the significant wave period associated with T s e p = 20 s is T 1 / 3 = 10.67 s, which is readily calculated by Equation (5a). Hence, if we apply T s e p = 20 s, instead of using the functional relationship suggested by Equation (5a), it would result in overestimation of the magnitude of infragravity waves for T 1 / 3 > 10.67 s whereas underestimation of the magnitude of infragravity waves for T 1 / 3 ≤ 10.67 s.
One noteworthy thing regarding the proposed method is that it has been developed based on wave observation data collected at a single location off Gyeongpo beach. The beach is on the Korean east coast, which faces the East Sea that has comparatively smaller basin area and shorter fetch length than an ocean. Hence, infragravity waves that arrive on the Korean east coast are likely to be less actively developed than those waves appearing at coasts in a large ocean. In this respect, it would be necessary to verify the adequacy of the suggested method with other data sets obtained at some coasts having different bathymetric conditions and incident wave characteristics.

3.3. Influence of Applying Different Methods of Determining the Separation Period

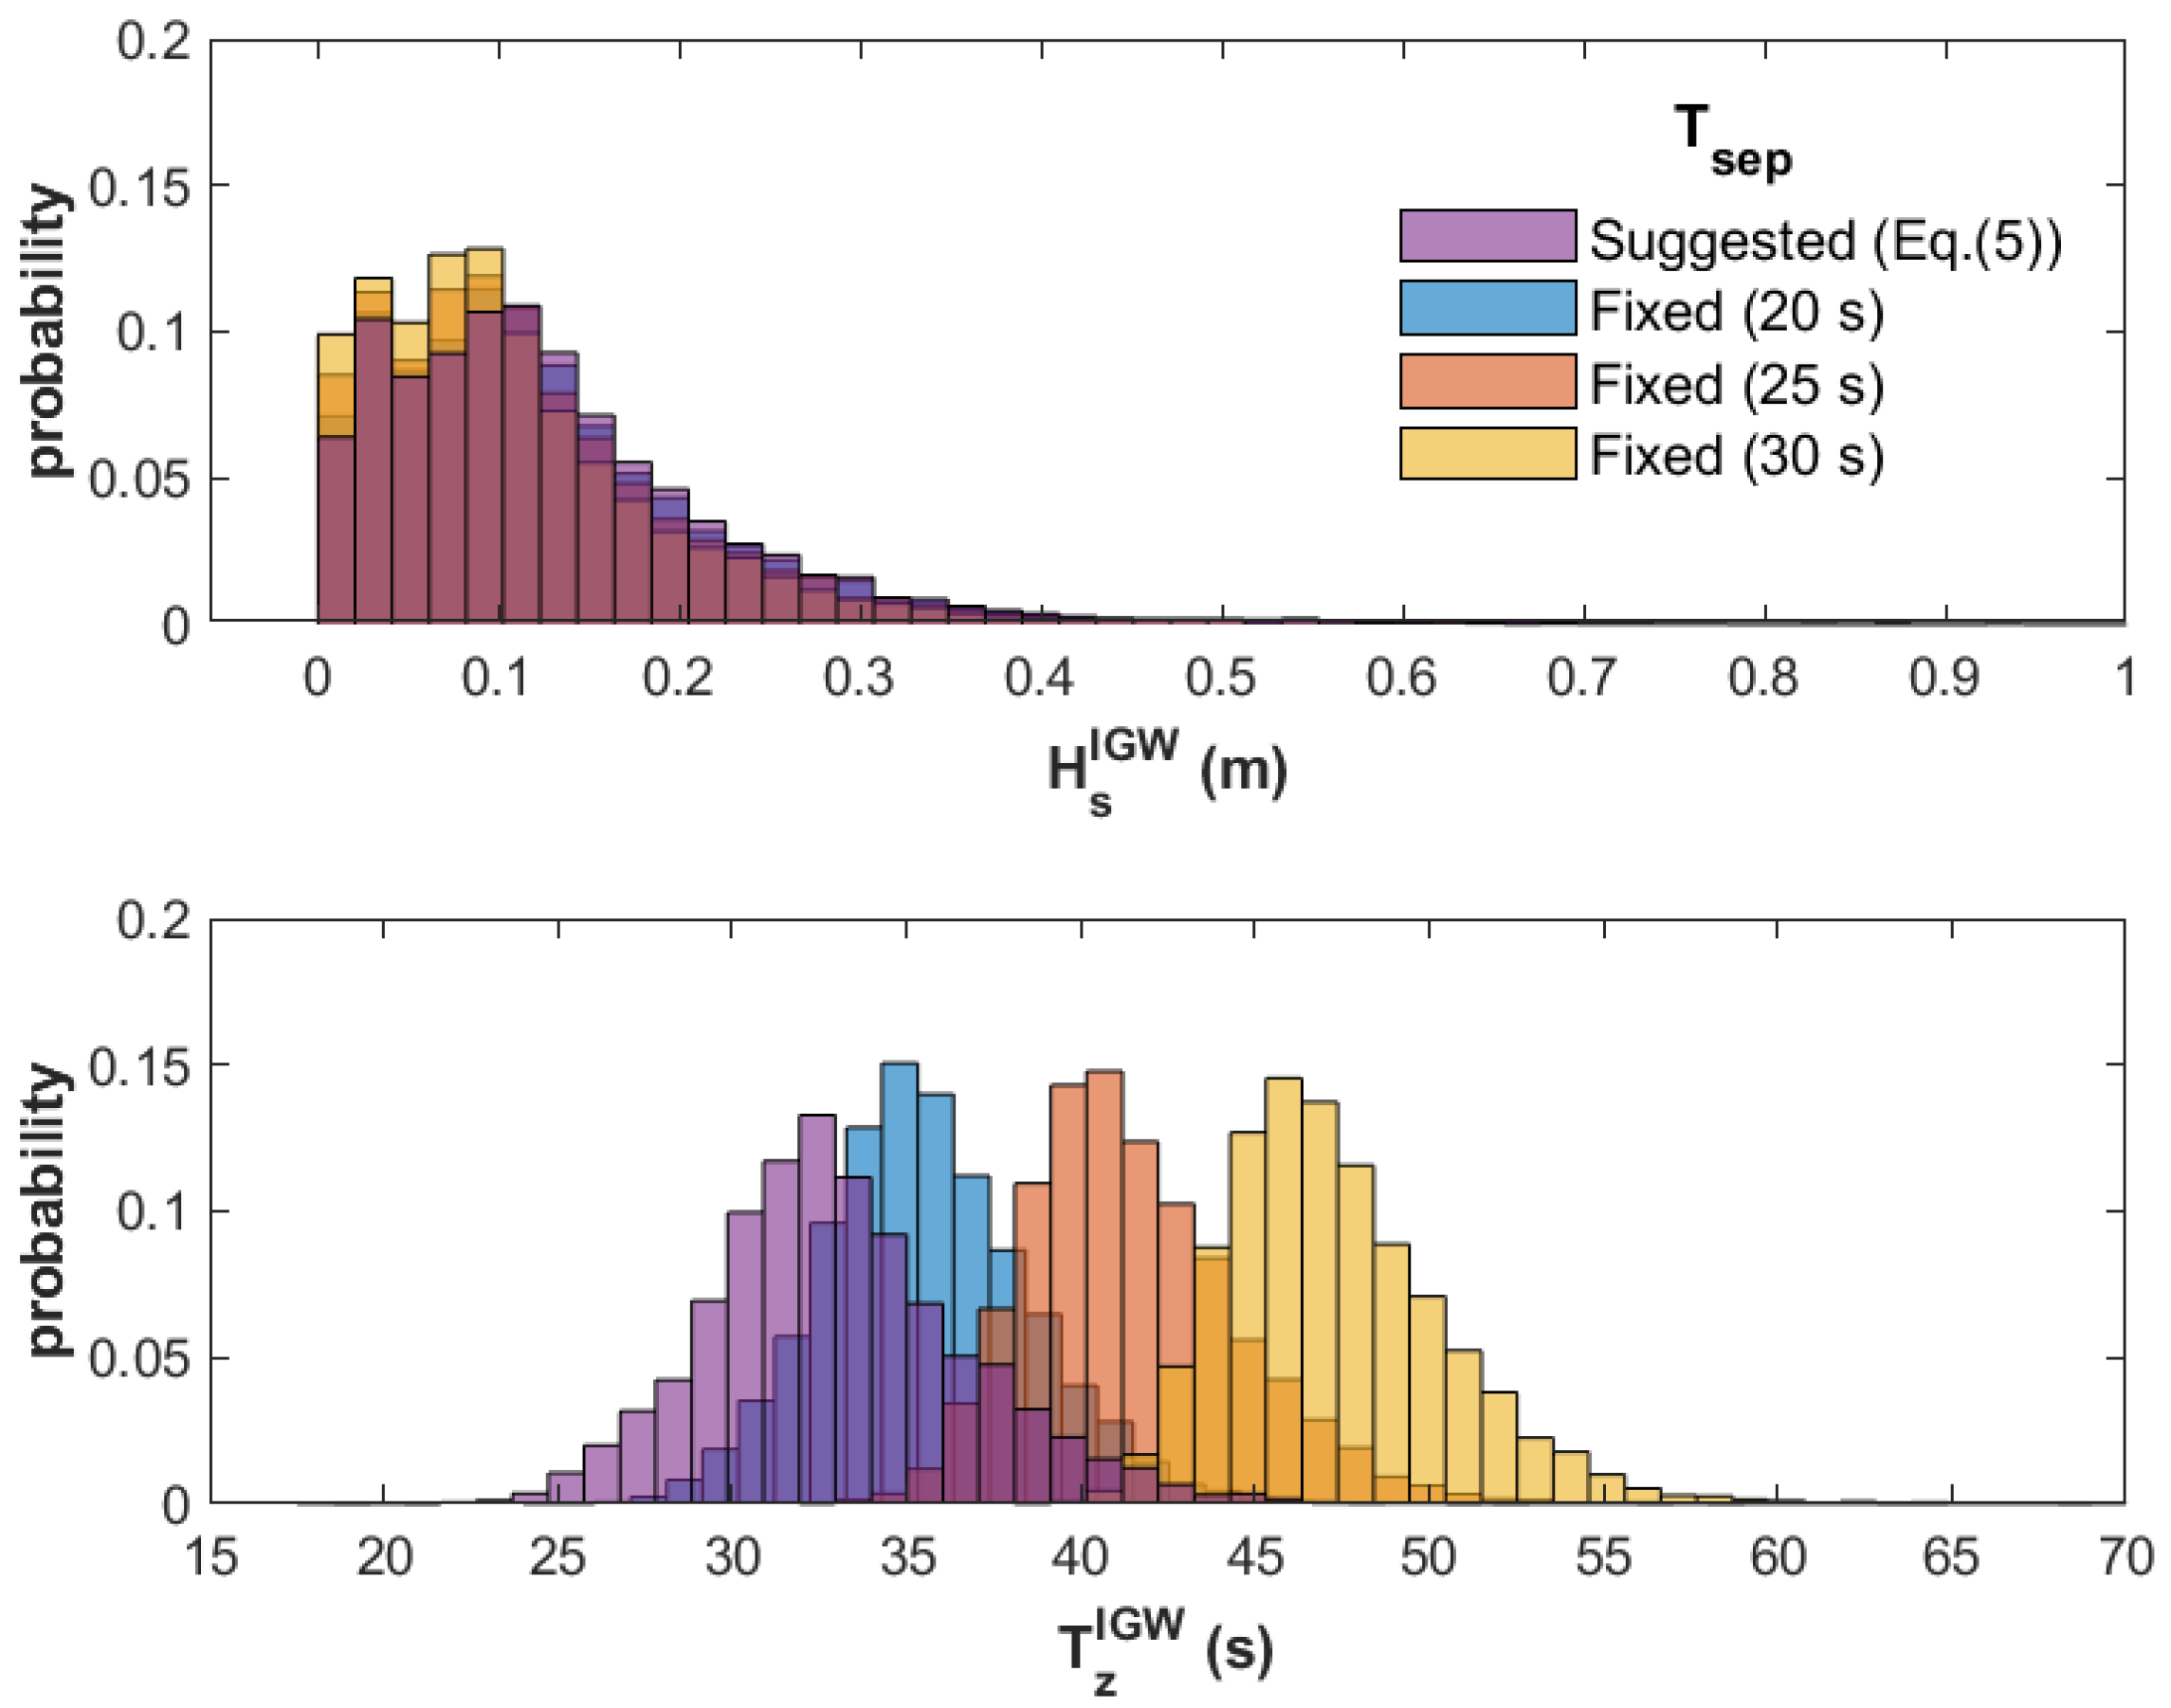
Figure 6 shows comparisons of the distributions of H s I G W and T z I G W obtained by using different separation periods. The separation period was applied either as one of the suggested methods (Equation (5a,b)) or with the values of 20, 25, and 30 s. Meanwhile, the upper cutoff period of the infragravity waves was set at 200 s identically. In the upper panel of Figure 6, the four distributions of H s I G W show little difference except the magnitudes of very small wave heights. In contrast, considerable differences appear among the four distributions of T z I G W according to different setup of the separation period. The shorter the separation period, the shorter the peak of T z I G W . When applying the suggested formulation, the peak of T z I G W was approximately 28 s.
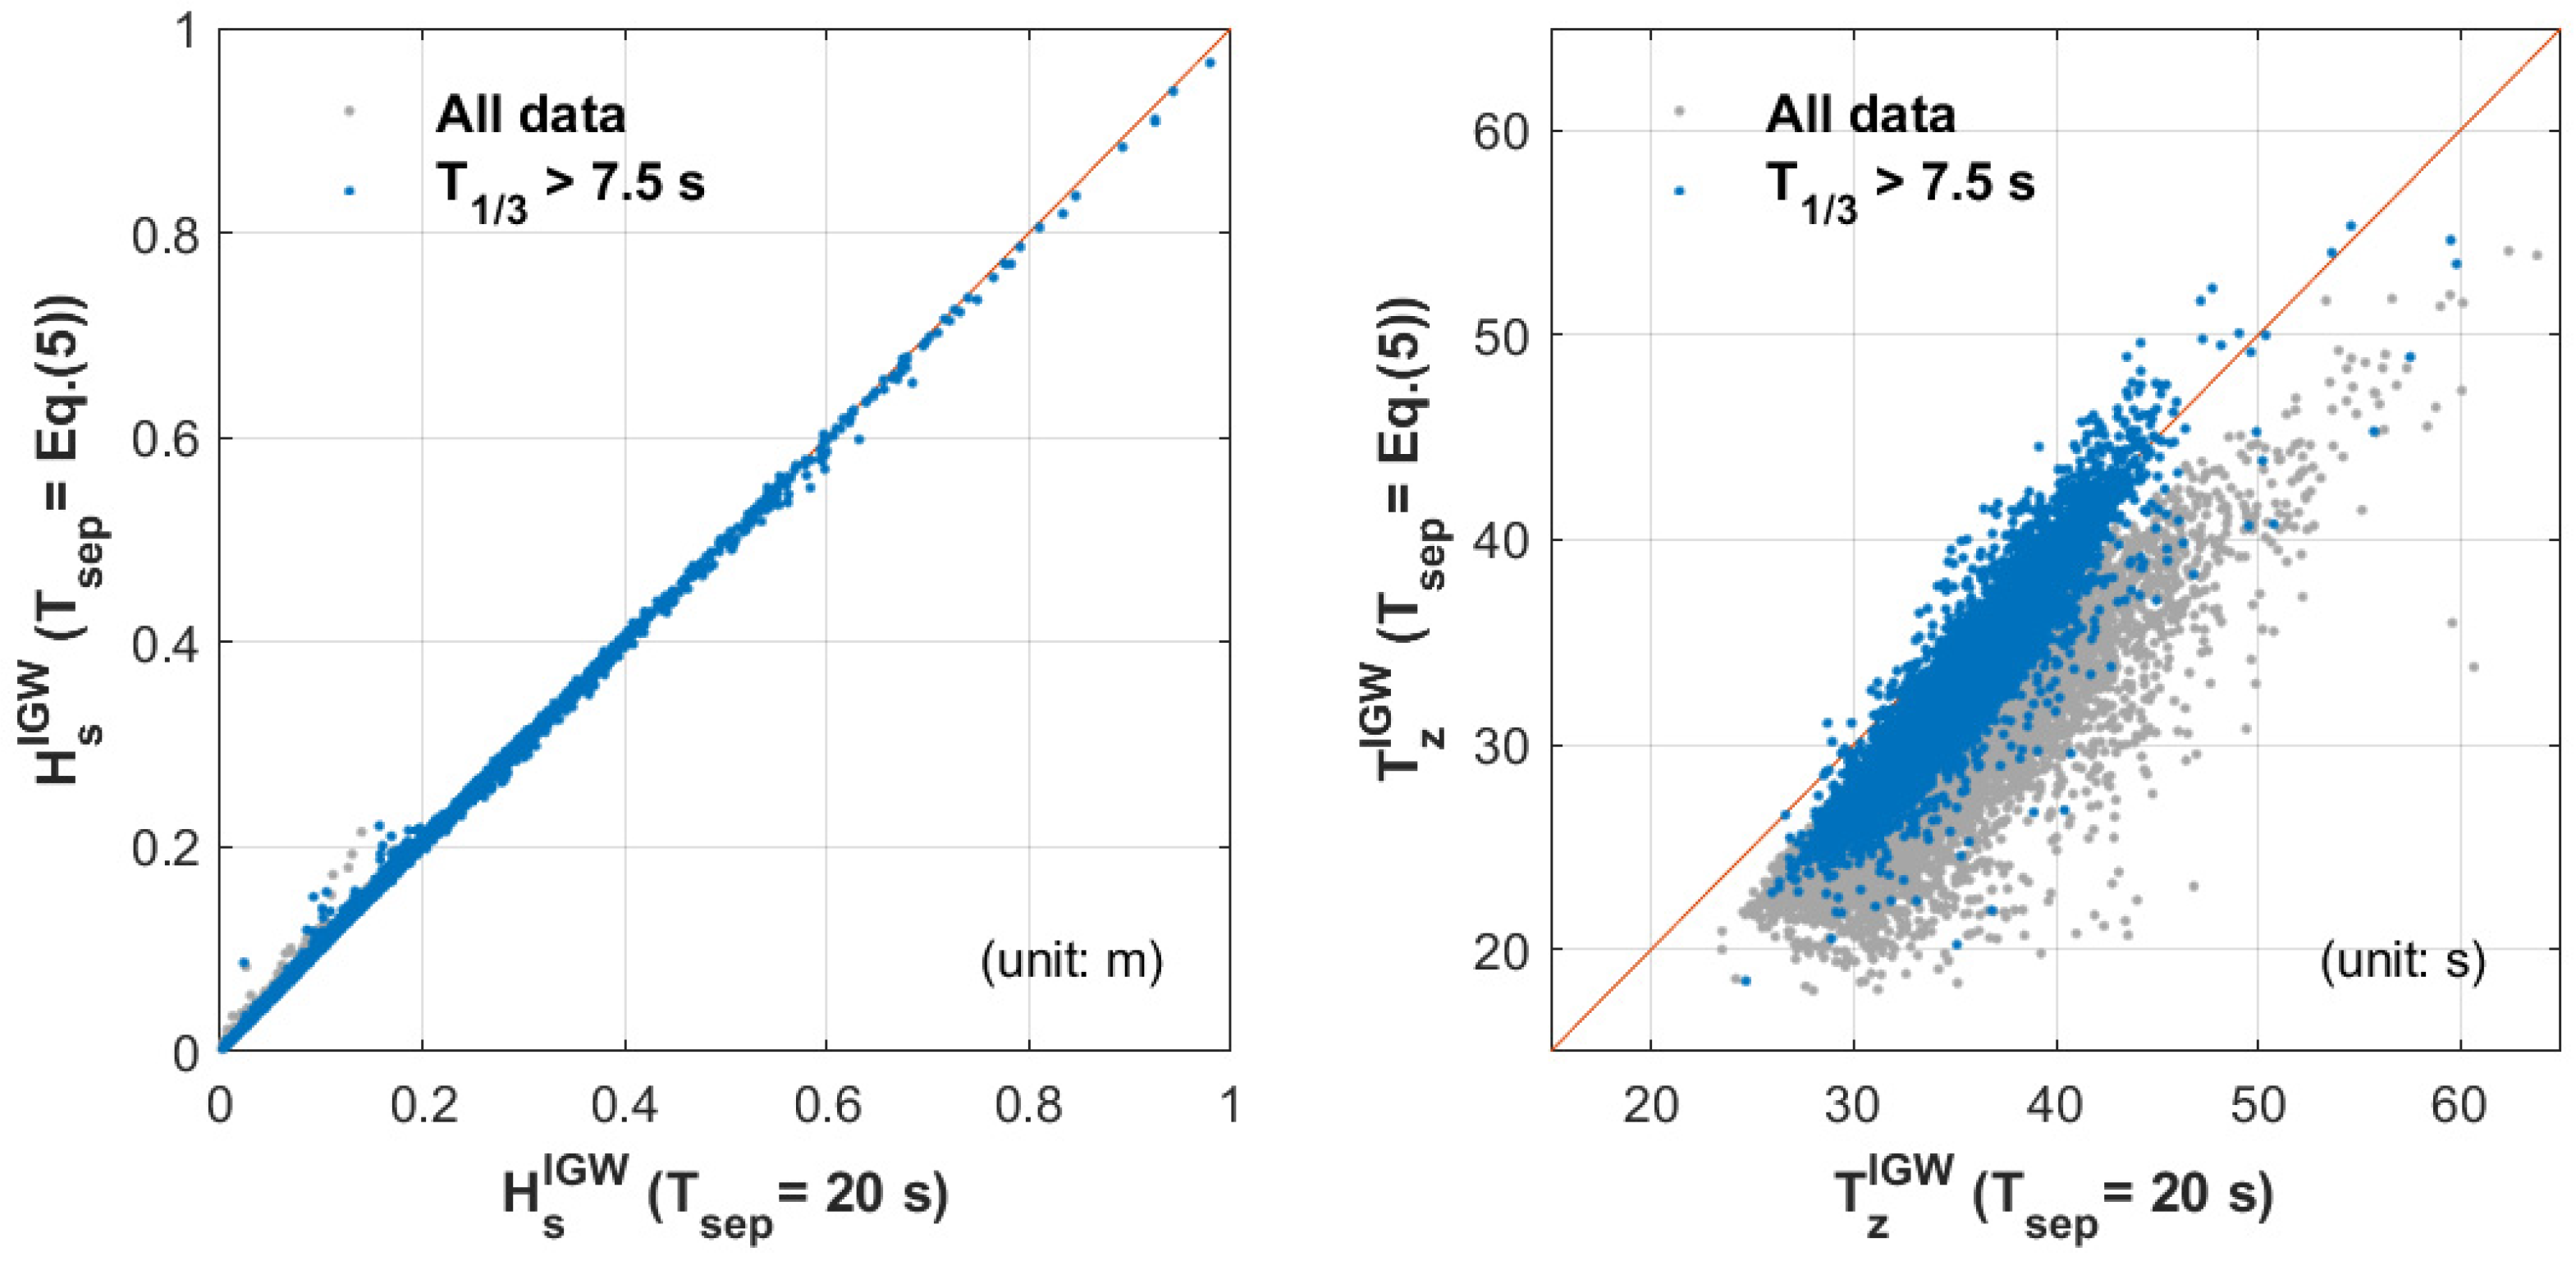
Figure 7 shows scatter diagrams of H s I G W and T z I G W that are calculated by using the separation period of the suggested method or a fixed value of 20 s. Among the three values of 20, 25, and 30 s that are used in the previous figure, the smallest value 20 s is adopted because it is the nearest value to the method suggested. As shown in Figure 7, almost a proportional relationship is found for H s I G W obtained by the two methods, except some data corresponding to relatively smaller wave heights. In contrast, considerable discrepancy appears for T z I G W between the two methods, resulting in comparatively smaller values of T z I G W with the suggested method. This implies that the values of T z I G W , rather than H s I G W , are more likely to be inaccurately estimated if a fixed separation period is used instead of the suggested method.
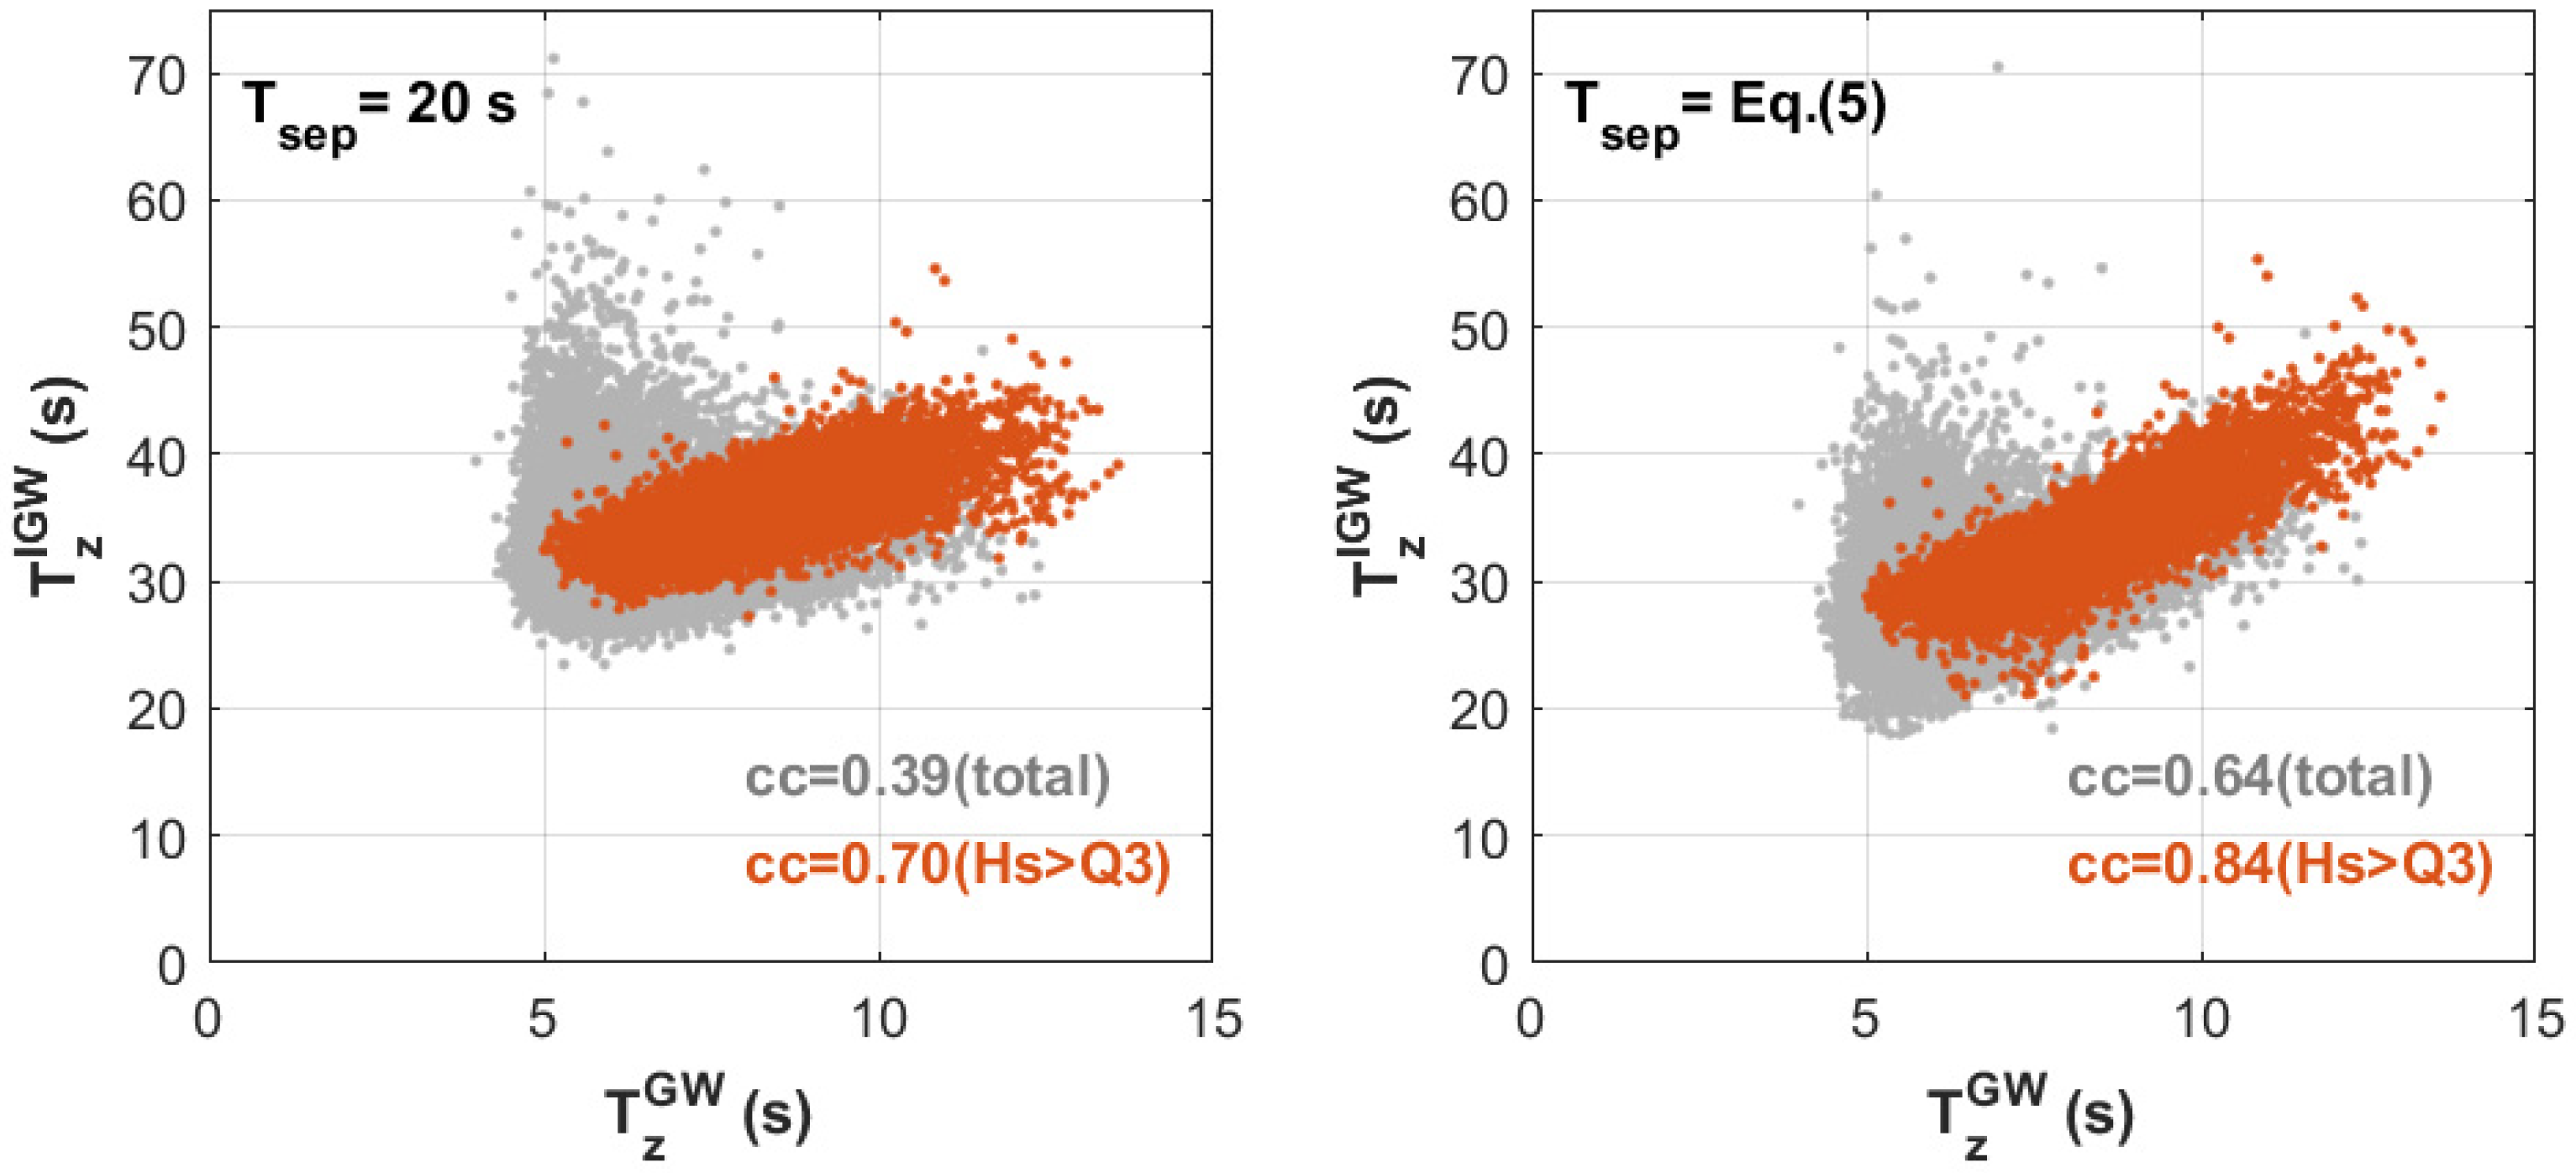
In order to further examine the influence of the separation period on T z I G W , scatter diagrams between T z I G W and T z G W are shown in Figure 8, depending on the use of the separation period for either the suggested method or a fixed value of 20 s. In the figure, the gray dots denote all the analyzed data whereas scarlet red dots correspond to the data whose gravity wave height ( H s I G W ) is greater than third quartile ( Q 3 ). It is clearly seen that the correlation coefficients (indicated as cc in the figure) of both data groups are apparently higher when the separation period is determined with Equation (5a,b). This implies that the relationship between gravity and infragravity waves is more clearly disclosed by use of the separation period suggested in this study.
Irrespective of such a determination of the separation period, meanwhile, the correlation coefficient increases when only the data of H s I G W > Q 3 are used. This shows that the relationship between the gravity and infragravity waves becomes closer for relatively higher waves. In fact, an almost linearly proportional relationship is found for the data marked as red dots in Figure 7. Such a fact indirectly implies that there would be higher energy exchange between gravity and infragravity waves for relatively higher waves.

3.4. Relationship between the Significant Wave Heights of Gravity and Infragravity Waves

The correlation between the energies of gravity and infragravity waves is one of main interests in research regarding infragravity waves. In this respect, the significant wave heights of gravity and infragravity waves are compared in Figure 9 for each of the nine classes according to T 1 / 3 as tabulated in Table 1. Because the adequacy of representing T s e p as a function of T 1 / 3 has been well demonstrated in the previous section, following analysis is carried out by applying T s e p as expressed by Equation (5a,b).
In Figure 9, gray dots denote all the data whereas blue dots indicate the data within a specific range of T 1 / 3 . The correlation coefficient (cc) of the specific data is displayed also in blue color. For instance, blue dots in the top right panel of Figure 8 illustrate the data in the range of 6 < T 1 / 3 ≤ 7, and the correlation coefficient obtained from such data is 0.93. Also shown in the figure is the linear regression line and the corresponding equation for the data of blue dots, which is shown in orange color.
As shown in Figure 9, the correlation coefficient between gravity and infragravity waves increases with T 1 / 3 , indicating a closer relationship between H s G W and H s I G W for longer waves. In addition, the slope of the regression line is also gradually increasing as T 1 / 3 increases. This implies that the energy exchange between gravity and infragravity waves would be augmented with the increase of the wave period. In other words, the longer the wave period of gravity waves, the higher the transfer of energy from gravity waves to infragravity waves.
Figure 10 shows a collection of the nine linear regression lines in Figure 9. In the figure, the regression lines are shown in different colors over the range where data exist. The gray dotted lines correspond to extrapolation from each of the regression lines. Along with increase of the significant wave period, the range of the significant wave height also increases. Based on the monotonous increase in the slope of the regression lines according to increase of T 1 / 3 , it is possible to represent the slope of each regression line as a function of T 1 / 3 . Then the following equation can be obtained which shows the functional relationship between the significant wave heights of gravity and infragravity waves.
H s I G W = ( 0.02 T 1 / 3 0.07 ) H s G W
Meanwhile, there exist a relationship between the significant wave period and the significant wave height of gravity waves. A formula listed in the Shore Protection Manual (SPM) is as follows [25]:
T 1 / 3 = 3.85 ( H s G W ) 0.5
where the coefficient was changed from 2.13 to 3.85 according to the unit conversion from foot to meter [31]. A similar formula was presented by Goda [32].
T 1 / 3 = 3.3 ( H s G W ) 0.63
Both SPM and Goda formulas tend to follow the lower limit of the T 1 / 3 when H s G W is small, while they are likely to coincide with T 1 / 3 as H s G W increases [25]. Considering this, by inserting Equation (7a,b) into Equation (6), it is possible to present the lower limit of H s I G W in terms of H s G W as in the following equations, respectively.
H s I G W ( 0.077 ( H s ) 0.5 0.07 ) H s
H s I G W ( 0.066 ( H s ) 0.63 0.07 ) H s
The two dotted curves in green and blue color in Figure 10 illustrate Equation (8a,b) derived from the SPM and Goda formulae, respectively. The right end points of the nine regression lines are generally close to the two curves, demonstrating the appropriateness of both formulae. Among the two curves, Goda formula shows better agreement with the observed wave data.

4. Conclusions

This study proposed an empirical method of evaluating the separation period based on intensive investigation on the observed wave spectra, which enables accurate estimation of infragravity waves that could be one of the important wave components in coastal waters. The separation period was determined adaptively, not as a fixed value, but as a simple function of the significant wave period. Such an adaptive method of determining the separation period showed better results for evaluating the infragravity wave periods than the conventional approach of applying a fixed value. In addition, a higher correlational relationship was obtained between the periods of gravity and infragravity waves. Additional work is required to further verify the appropriateness of the proposed method with wave data acquired at coasts on the East Sea or other oceans.

Author Contributions

Conceptualization and methodology, J.-E.O. and W.-M.J.; software, J.-E.O.; validation, J.-E.O. and S.-H.O.; formal analysis, J.-E.O., Y.S.C. and S.-H.O; investigation, J.-E.O. and S.-H.O.; data curation, J.-E.O.; writing—original draft preparation, review and editing, J.-E.O., W.-M.J., Y.S.C. and S.-H.O.; funding acquisition, J.-E.O. and W.-M.J. All authors have read and agreed to the published version of the manuscript.

Funding

This study was supported by Korea Institute of Ocean Science and Technology (Project No. PE99832). The first author was supported by the National Research Foundation of Korea (NRF) and the Center for Women In Science, Engineering and Technology (WISET) grant funded by the Ministry of Science and ICT (MSIT) under the Program for Returners into R&D (WISET-2019-231).

Acknowledgments

The authors would like to thank Weon-Dae Baek and Jae-Ho Choi for field assistance of collecting wave data.

Conflicts of Interest

The authors declare no conflict of interest.

References

  1. Munk, W.H. Origin and generation of waves. In Proceedings of the 1st International Conference on Coastal Engineering, Long Beach, CA, USA, 1 October 1950; pp. 1–4. [Google Scholar]
  2. Hathaway, K.K.; Oltman-Shay, J.; Howd, P.; Holman, R.A. Infragravity Waves in the Nearshore Zone; US Army Engineers, Waterways Experiment Station: Washington, DC, USA, 1998. [Google Scholar]
  3. Guza, R.T.; Thornton, E.B. Swash oscillations on a natural beach. J. Geophys. Res. Ocean. 1982, 87, 483–491. [Google Scholar] [CrossRef]
  4. Elgar, S.; Herbers, T.H.C.; Okihiro, M.; Oltman-Shay, J.; Guza, R.T. Observations of infragravity waves. J. Geophys. Res. Ocean. 1992, 97, 15573–15577. [Google Scholar] [CrossRef]
  5. De Bakker, A.T.M.; Brinkkemper, J.A.; Van der Steen, F.; Tissier, M.F.S.; Ruessink, B.G. Cross-shore sand transport by infragravity waves as a function of beach steepness. J. Geophys. Res. Earth Surf. 2016, 121, 1786–1799. [Google Scholar] [CrossRef]
  6. Okihiro, M.; Guza, R.T.; Seymour, R.J. Excitation of seiche observed in a small harbor. J. Geophys. Res. Ocean. 1993, 98, 18201–18211. [Google Scholar] [CrossRef] [Green Version]
  7. Cho, H.Y.; Jeong, W.M.; Oh, S.H. Analysis on the characteristics of the infragravity waves inside and outside Pohang new harbor using a transfer function model. J. Korean Soc. Coast. Ocean. Eng. 2014, 26, 131–139. [Google Scholar] [CrossRef]
  8. Jeong, W.M.; Back, J.D.; Choi, H.; Kim, S.I. Analysis on the reduction effects of the gravity waves and infragravity waves of detached submerged breakwater by field monitoring. J. Korean Soc. Coast. Ocean. Eng. 2018, 30, 51–60. [Google Scholar] [CrossRef]
  9. Son, D.; Yoo, J.; Shin, H. Effect of infragravity waves on nearshore morphodynamics in the east coast: Case study-Ilsan beach. Ocean. Polar Res. 2018, 40, 87–98. [Google Scholar]
  10. Longuet-Higgins, M.S.; Stewart, R.W. Radiation stress and mass transport in gravity waves, with application to ‘surf beats’. J. Fluid Mech. 1962, 13, 481–504. [Google Scholar] [CrossRef]
  11. Longuet-Higgins, M.S.; Stewart, R.W. Radiation stresses in water waves; a physical discussion, with applications. Deep Sea Res. 1964, 11, 529–562. [Google Scholar] [CrossRef]
  12. Gallagher, B. Generation of surf beat by non-linear wave interactions. J. Fluid Mech. 1971, 49, 1–20. [Google Scholar] [CrossRef]
  13. Van Dongeren, A.R.J.A.; Battjes, J.; Janssen, T.; Van Noorloos, J.; Steenhauer, K.; Steenbergen, G.; Reniers, A.J.H.M. Shoaling and shoreline dissipation of low-frequency waves. J. Geophys. Res. Ocean. 2007, 112. [Google Scholar] [CrossRef] [Green Version]
  14. Henderson, S.M.; Guza, R.T.; Elgar, S.; Herbers, T.H.C.; Bowen, A.J. Nonlinear generation and loss of infragravity wave energy. J. Geophys. Res. Ocean. 2006, 111. [Google Scholar] [CrossRef] [Green Version]
  15. De Bakker, A.T.M.; Herbers, T.H.C.; Smit, P.B.; Tissier, M.F.S.; Ruessink, B.G. Nonlinear infragravity-wave interactions on a gently sloping laboratory beach. J. Phys. Oceanogr. 2015, 45, 589–605. [Google Scholar] [CrossRef] [Green Version]
  16. De Bakker, A.T.M.; Tissier, M.F.S.; Ruessink, B.G. Shoreline dissipation of infragravity waves. Cont. Shelf Res. 2014, 72, 73–82. [Google Scholar] [CrossRef]
  17. Bowen, A.J.; Guza, R.T. Edge waves and surf beat. J. Geophys. Res. Ocean. 1978, 83, 1913–1920. [Google Scholar] [CrossRef]
  18. Herbers, T.H.C.; Elgar, S.; Guza, R.T. Infragravity-frequency (0.005–0.05 Hz) motions on the shelf. Part I: Forced waves. J. Phys. Oceanogr. 1994, 24, 917–927. [Google Scholar] [CrossRef]
  19. Herbers, T.H.C.; Elgar, S.; Guza, R.T. Generation and propagation of infragravity waves. J. Geophys. Res. Ocean. 1995, 100, 24863–24872. [Google Scholar] [CrossRef]
  20. Fiedler, J.W.; Brodie, K.L.; McNinch, J.E.; Guza, R.T. Observations of runup and energy flux on a low-slope beach with high-energy, long-period ocean swell. Geophys. Res. Lett. 2015, 42, 9933–9941. [Google Scholar] [CrossRef] [Green Version]
  21. Ruessink, B.G.; Kleinhans, M.G.; Van den Beukel, P.G.L. Observations of swash under highly dissipative conditions. J. Geophys. Res. Ocean. 1998, 103, 3111–3118. [Google Scholar] [CrossRef]
  22. Jeong, W.M.; Ryu, K.H.; Baek, W.D.; Choi, H.J. Downtime analysis for Pohang new harbor through long-term investigation of waves and winds. J. Korean Soc. Coast. Ocean. Eng. 2011, 23, 226–235. [Google Scholar] [CrossRef] [Green Version]
  23. Jeong, W.M.; Park, W.S.; Kim, K.H.; Kim, J.H. Correlations between long-and short-period waves in shallow water region around Sokcho harbor. J. Korean Soc. Civil. Eng. 2002, 22, 711–721. [Google Scholar]
  24. Jeong, W.M.; Chae, J.W.; Park, W.-S.; Lee, K.S.; Suh, K.-D. Correlation between storm waves and far-infra-gravity waves observed in Okkye harbor. J. Korean Soc. Coast. Ocean. Eng. 2001, 13, 209–229. [Google Scholar]
  25. United States Army Corps of Engineers (USACE). Shore Protection Manual, 3rd ed.; US Government Printing Office: Washington, DC, USA, 1977.
  26. Paroscientific, Inc. User’s Manual for Digiquartz ® Broadband Intelligent Instruments with Dual RS-232 and RS-485 Interfaces; Paroscientific, Inc.: Redmond, WA, USA, 2009. [Google Scholar]
  27. Polster, A.; Fabian, M.; Villinger, H. Effective resolution and drift of Paroscientific pressure sensors derived from long-term seafloor measurements. Geochem. Geophys. Geosyst. 2009, 10, Q08008. [Google Scholar] [CrossRef]
  28. DiMarco, S.F.; Kelly, F.J.; Zhang, J.; Guinasso, N.L., Jr. Directional wave spectra on the Louisiana-Texas shelf during Hurricane Andrew. J. Coast. Res. 1995, SI 21, 217–233. [Google Scholar]
  29. Kennedy, A.B.; Gravois, U.; Zachry, B.; Luettich, R.; Whipple, T.; Weaver, R.; Reynolds-Fleming, J.; Chen, Q.J.; Avissar, R. Rapidly installed temporary gauging for hurricane waves and surge, and application to Hurricane Gustav. Cont. Shelf Res. 2010, 30, 1743–1752. [Google Scholar] [CrossRef]
  30. Chun, H.; Suh, K.D. Estimation of significant wave period from wave spectrum. Ocean. Eng. 2018, 163, 609–616. [Google Scholar] [CrossRef]
  31. Suh, K.D.; Kwon, H.D.; Lee, D.Y. Some statistical characteristics of large deepwater waves around the Korean Peninsula. Coast. Eng. 2010, 57, 375–384. [Google Scholar] [CrossRef] [Green Version]
  32. Goda, Y. Revisiting Wilson’s formulas for simplified wind-wave prediction. J. Waterw. Port Coast. 2003, 129, 93–95. [Google Scholar] [CrossRef]
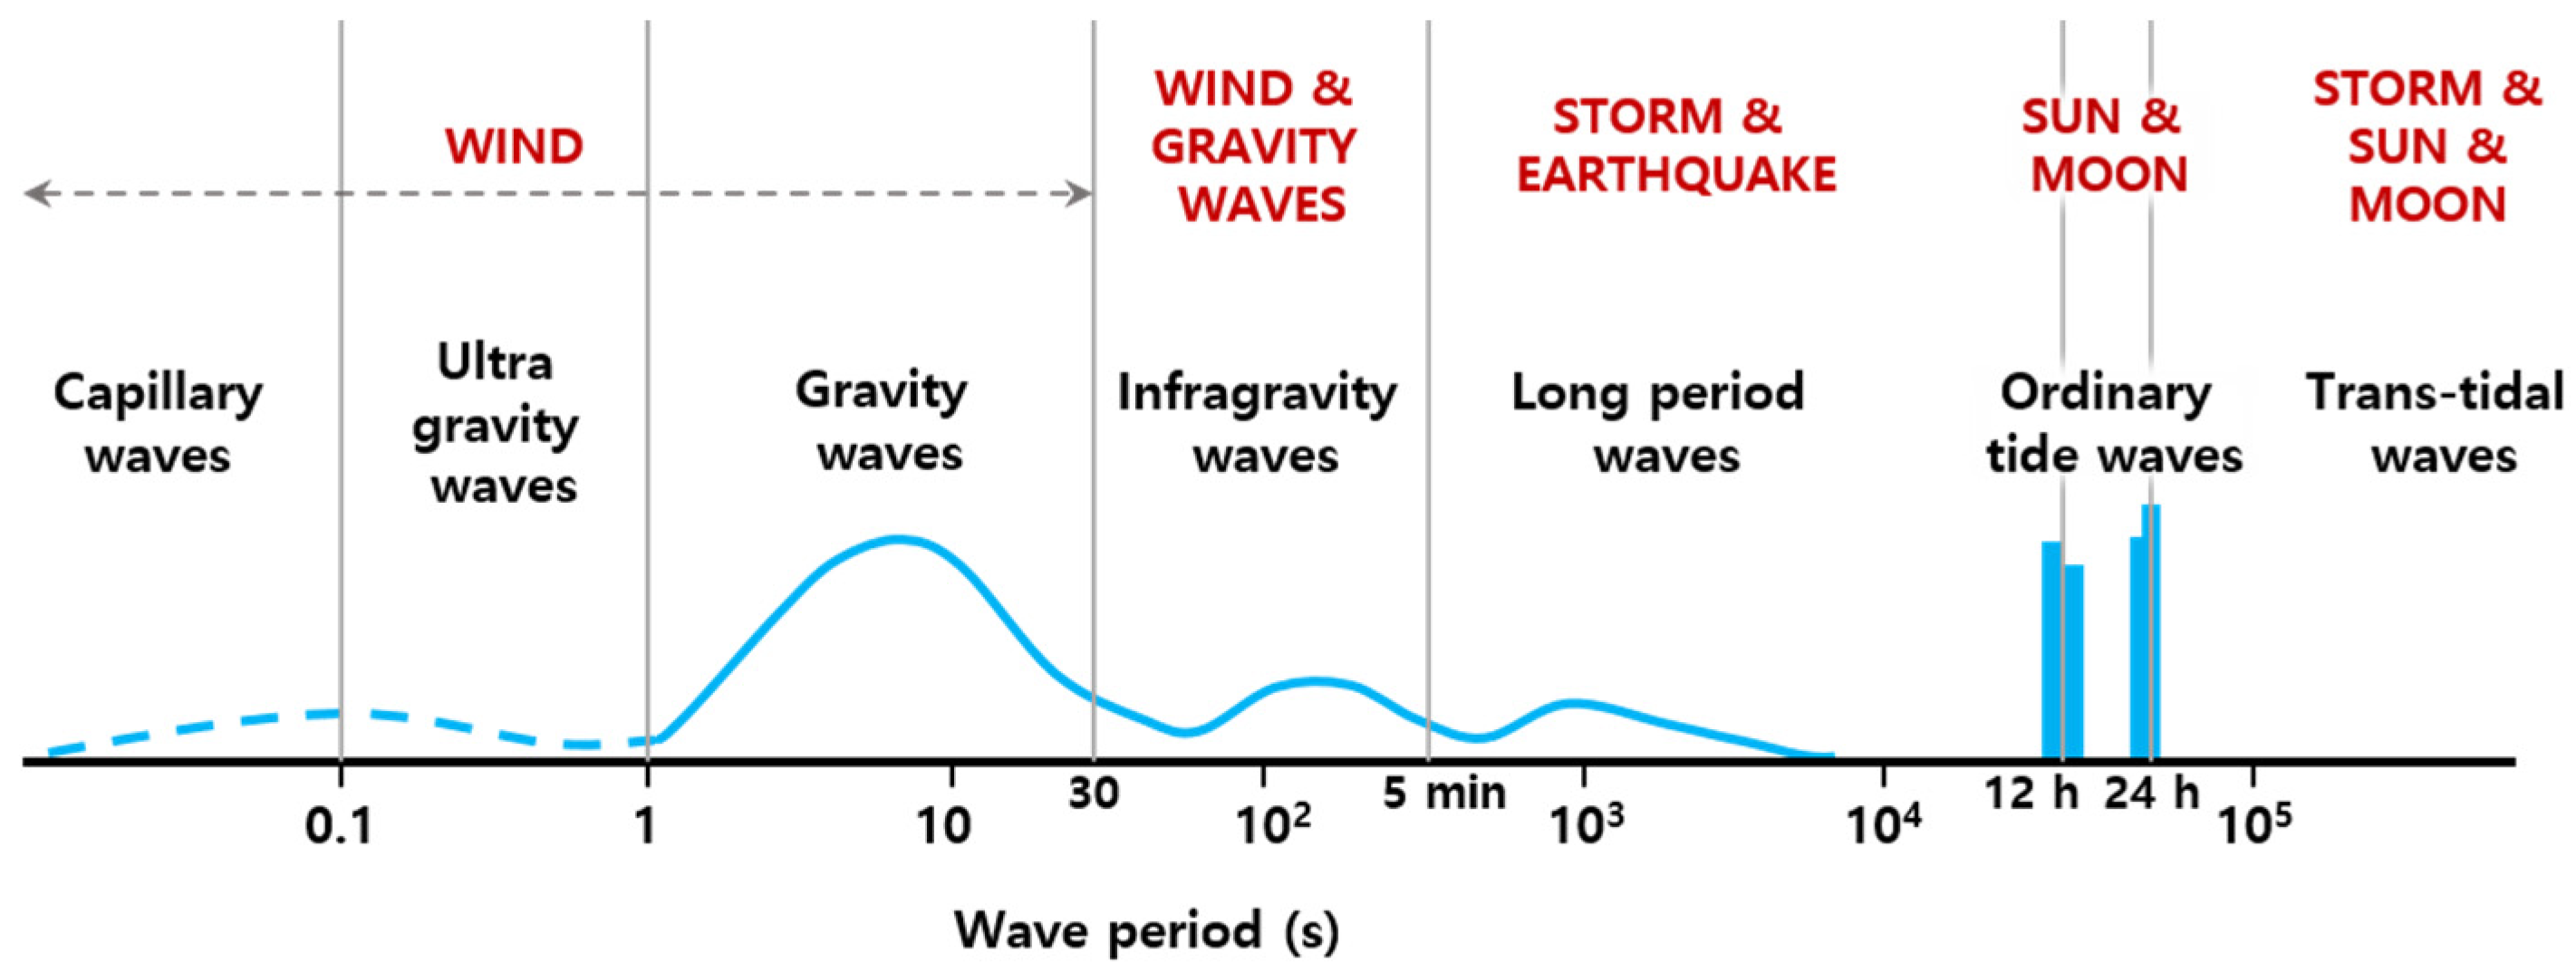
Figure 1. Classification of the spectrum of ocean waves according to wave period, adapted from [1].
Jmse 08 00167 g001
Figure 2. Location of Gyeongpo beach shown in the Google map. The red dot in the figure illustrates the point where wave observation was carried out.
Jmse 08 00167 g002
Figure 3. Mean wave spectra at Gyeongpo corresponding to each of the classes categorized by the significant wave period (the first column of Table 1).
Jmse 08 00167 g003
Figure 4. Plots of T p and the representative T 1 / 3 as a function of T s e p with the linear regression lines for the range of T 1 / 3 > 7.5 s.
Jmse 08 00167 g004
Figure 5. A normalized histogram of the separation period. Below the histogram is the box plot where the blue box represents the interquartile range (IQR). The vertical red line in the box corresponds to the median. Meanwhile, the red crosses on the right-hand side represents outliers (1.5 × IQR above the third quartile).
Jmse 08 00167 g005
Figure 6. Comparison of the normalized histograms of the significant wave height and period of the infragravity waves.
Jmse 08 00167 g006
Figure 7. Comparison of the wave heights and periods of the infragravity waves that are calculated by using the separation frequency of the suggested method and a fixed value of 20 s.
Jmse 08 00167 g007
Figure 8. Scatter diagrams between T z I G W and T z G W according to use of the two different separation periods.
Jmse 08 00167 g008
Figure 9. Scatter diagrams between H s G W and H s I G W for the nine classes depending on T 1 / 3 .
Jmse 08 00167 g009
Figure 10. Collection of the regression lines from Figure 8 and comparison with the formulae of the Shore Protection Manual (SPM) [25] and Goda [32].
Jmse 08 00167 g010
Table 1. Summary of the results of classification of the wave spectra.
ClassNo. of SpectraData
Ratio (%)
Energy
Ratio (%)
Representative   T 1 / 3   ( s ) T s e p   ( s ) T p   ( s )
0 < T 1 / 3   ≤ 513773.00.04.918.45.0
5 < T 1 / 3 ≤ 614,13630.41.95.616.96.2
6 < T 1 / 3 ≤ 714,46431.19.36.516.77.2
7 < T 1 / 3 ≤ 8878918.919.27.516.98.4
8 < T 1 / 3 ≤ 943519.422.78.417.59.4
9 < T 1 / 3 ≤ 1020414.419.99.418.810.5
10 < T 1 / 3 ≤ 119632.115.010.420.011.5
11 < T 1 / 3 ≤ 122840.67.811.420.912.8
12 < T 1 / 3 950.24.212.421.413.5
total46,500100.0100.0
mean 20.19.9