Abstract
Image semantic segmentation technology has been increasingly applied in many fields, for example, autonomous driving, indoor navigation, virtual reality and augmented reality. However, underwater scenes, where there is a huge amount of marine biological resources and irreplaceable biological gene banks that need to be researched and exploited, are limited. In this paper, image semantic segmentation technology is exploited to study underwater scenes. We extend the current state-of-the-art semantic segmentation network DeepLabv3 + and employ it as the basic framework. First, the unsupervised color correction method (UCM) module is introduced to the encoder structure of the framework to improve the quality of the image. Moreover, two up-sampling layers are added to the decoder structure to retain more target features and object boundary information. The model is trained by fine-tuning and optimizing relevant parameters. Experimental results indicate that the image obtained by our method demonstrates better performance in improving the appearance of the segmented target object and avoiding its pixels from mingling with other class’s pixels, enhancing the segmentation accuracy of the target boundaries and retaining more feature information. Compared with the original method, our method improves the segmentation accuracy by 3%.
1. Introduction
Image semantic segmentation has been an important research direction of computer vision, which is a key technology for image processing. The main concept of semantic segmentation is to classify each pixel in an image according to its own category and finally, to get a prediction result map containing “semantic” information [1]. Image semantic segmentation is related to research and applications in many fields, for example, medicine, industry and civilians and has achieved very significant results but its application in underwater scenes is less frequent than its application in other fields. However, as an area with less human development but the most abundant biological species, the ocean is rich in diverse biological resources, energy and strategic metals. The exploration and research of marine resources have become major demands for sustainable national development. Zhu et al. [2] proposed an automatic target recognition (ATR) method for a sonar-mounted unmanned underwater vehicle (UUV) with feature extraction through deep learning to achieve target recognition and classification in underwater sonar images, this method provides new ideas for improving the efficiency of image semantic segmentation. Wu et al. [3] proposed a novel and practical convolutional neural network architecture for semantic segmentation of high-resolution images of seabed and underwater targets provided by side-scan sonar (SSS), it provides a new way for the semantic segmentation of underwater images with different resolutions. Arain et al. [4] proposed the improvement of image-based underwater obstacle detection by combining sparse stereo point clouds with monocular semantic image segmentation. Chang et al. [5] proposed an automatic target recognition algorithm combined with deep convolutional neural network. These methods can predict the expected confidence level of future target classifications prior to acquiring new images. Gemerek et al. [6] proposed a vision-based controller that can stabilize the size and position of the target object in the image plane for extended periods of time and it is very effective in image object detection and classification. Liu et al. [7] proposed a novel vision-guided path planning and control method. By harnessing convolutional neural networks (CNNs) for computer vision, the surrounding environment information obtained through the vehicle camera can be integrated with prior information such as airport maps. This method provides a new idea for underwater robots to acquire underwater images. From the current status of development, image processing technology has provided important technical support for deep-sea exploration by allowing information to be obtained.
The study of the semantic segmentation of underwater images requires the collection and annotation of a number of underwater images. The emergence of autonomous underwater vehicles solves the problem of how to collect underwater images but annotation of the images has not been completed so far and manpower is still required to label the data. In 2015, Beijbom et al. [8] investigated the feasibility of using automated point-annotation to expedite cover estimation of the 17 dominant benthic categories from survey images captured at four Pacific coral reefs. Zurowietz et al. [9] proposed a new image annotation method for environmental monitoring and exploration by combining an autoencoder network and a masked region-based convolutional neural network (Mask R-CNN).
Regarding the development of image semantic segmentation technology, Long et al. proposed fully convolutional networks for semantic segmentation (FCN), which promoted the original Convolutional Neural Networks (CNN) [10]. In this method, the convolutional layer is employed to replace the previous fully connected layer to input different sizes of images for performing dense predictions simultaneously but the segmentation result is not fine enough and the training is more complicated. Another network model structure is an encoder-decoder structure [11]. The convolution of the encoder structure can be used to extract high-dimensional features and pooling is used to gradually reduce the spatial dimension of the feature maps. The decoder and encoder structures correspond to each other. The network layer, for example, deconvolution, is used to recover the detailed information of the feature maps and the corresponding spatial dimension. Encoder-decoder structures often have direct information connections, so the decoder structure can quickly and accurately recover target details. The U-Net [12] network is representative of this method. The U-net network also has related applications in the underwater field and has achieved good performance. For examples, Möller et al. [13] proposed an automated process based on convolutional networks (the U-Net) for high temporal coverage and resolution monitoring of specific regions of interest (such as coral reefs). This process can automatically generate a series of sponge sizes from an image series. Huang et al. [14] proposed a method to enhance object detection in the dark using a U-Net based reduction module. This method uses a deep neural network based on the U-Net architecture as a pre-processing module to restore images/videos with nonuniform light sources to ensure the accuracy of the subsequent target detection process.
Based on the above investigations, we selected the DeepLabv3 + model [15], which performs well in image semantic segmentation as the basic framework and the homemade underwater image dataset is the experiment dataset. The network model has considerable challenges in the segmentation of underwater images, for example, classification errors, inaccurate segmentation of target edges and a lack of target details. Drawing on the idea of the U-Net network structure, we perfected the decoding module of DeepLabv3 +, which tries to connect the low-level and high-level feature information as much as possible and retain the edge and detail information of objects. Then, we analyzed the differences between the underwater image and the terrestrial image to select an appropriate unsupervised color correction method (UCM) [16] through experiments. Afterwards, we processed the input image and input it to the encoder-decoder structure to obtain a complete segmentation map with clear edges. The experimental results indicate that the method in this paper can segment and identify a variety of underwater creatures and make a certain contribution to the exploration of marine resources.
2. Related Work
DeepLabv3 +, which was developed by the Google team, is the best network structure for semantic segmentation in the Deeplab series. It is a semantic segmentation method that combines deep separable convolution and an encoder-decoder structure. First, the lightweight network Xception [17] structure is employed for feature extraction and then, the Atrous Spatial Pyramid Pooling (ASPP) module is used to obtain multi-scale feature information [18]. After upsampling with four layers and concatenating with the low-level feature of the same spatial resolution from the Xception structure of the backbone network, the channel is reduced by 1 × 1 convolution before concatenating. Then, a 3 × 3 convolution fine-tuning feature is used and finally, upsampled with four layers to get the final prediction map [13].
DeepLabv3 + has achieved good results on datasets that are commonly used in semantic segmentation. The performance on the PASCAL VOC2012 and Cityscapes datasets has reached 89.0% and 82.1%, respectively [10]. In this study, DeepLabv3 + was used for the semantic segmentation of underwater images. The DeepLabv3 + network was retrained using a homemade underwater dataset [19] but experiments found that the network is not ideal for the semantic segmentation of underwater images. On the one hand, there are problems of target classification error and target pixel mixing in the method. On the other hand, there are some inadequacy problems, for example, the boundary segmentation of the target is not clear enough, the contour is incomplete and the feature information is insufficient
3. Model
In view of the problems with the DeepLabv3 + network when performing semantic segmentation tasks on the underwater image dataset, in this study, the encoder and decoder structures of the DeepLabv3 + network were improved, respectively. First, we added a UCM unit in the encoding structure. Second, the decoding structure was further optimized to capture more feature information. We introduce the improvement part in detail later. The proposed network model is shown in Figure 1.
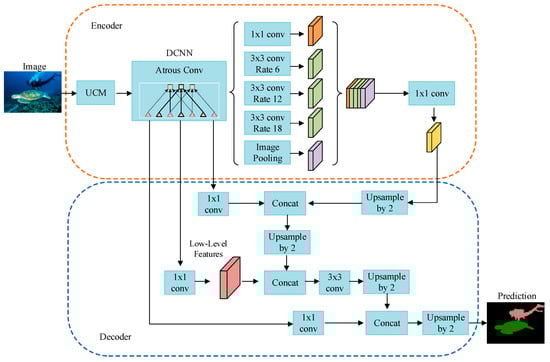
Figure 1.
Structure of underwater image semantic segmentation network.
In the entire network structure, the original image is processed by the UCM module to improve the quality of the image and then generate the binary files required for training. Then, the backbone network Xception_65 with 65 network layers, a filter size of 3 × 3 and a stride of 2 are used to extract feature information. The obtained feature maps are input into the ASPP [20] structure to obtain feature maps with different sampling rates and capture multi-scale context information. The ASPP module contains a 1 × 1 convolution and three 3 × 3 hole convolutions with sampling rates of 6, 12 and 18, respectively. The number of filters is 256, including the batch normalization layer and global average pooling. Subsequently, all feature maps are fused and cascaded together through a 1 × 1 convolution to obtain high-level feature maps.
The high-level feature map is up-sampled twice by bilinear interpolation to obtain an enlarged feature map. After another two rounds of unsampling, the feature map is restored to the same size as the low-level feature map extracted by the Xception structure. The high-level and low-level feature maps are connected and 3 × 3 convolution is used to fine-tune the features. Finally, the bilinear interpolation method is used to perform unsampling by 2 to obtain the final prediction segmentation map.
The loss function used in this article is a commonly used cross-entropy loss function [21]. The loss function formula is:
where is the number of samples and is the actual sample label and represents the training loss, is the prediction label. takes value 0 or 1, takes value from (0, 1). The smaller the value of L, the more accurate the prediction result and the better the performance of the network model.
3.1. Network Backbone
The Xception network model, a lightweight network that is improved from the Inception structure and includes deep separable convolution and residual network [22], is the network backbone used in this study. Ordinary convolution extracts all the spatial information and channel information by a convolution kernel. The idea of the Xception structure is to separate the two and extract the information separately, which can achieve better results. The improved Xception network is mainly composed of three parts, entry flow, middle flow and exit flow. The entry flow contains 11 convs, the middle flow contains 48 convs and the exit flow contains 6 convs, giving a total of 65 layers. We refer to this network as Xception_65 [13]. The Xception_65 network structure reduces the computational complexity, accelerates model training and guarantees its learning ability.
3.2. UCM Unit
The optical characteristics of water show that the imaging effect of objects in water is lower than the imaging effect of objects in air. A variety of substances in seawater cause significant attenuation of light. The underwater environment with a depth of 20 m can absorb 70% of the incident light [23] and environmental visibility is extremely low. Whether it is for humans or underwater robots, the difficulty factor will be greatly increased under these conditions. Poor lighting conditions make the imaging effect worse and are prone to certain phenomena, for example, false details, self-shadows, false contours and blurring. Underwater images are affected by reduced contrast and non-uniform color cast due to the absorption and scattering of light in the aquatic environment. This affects the quality and reliability of image processing and therefore color correction is a necessary image processing operation [24]. Compared with the Rayleigh Distribution [25], RGHS [26] and other underwater enhancement methods, we found that the method of unsupervised color correction (UCM) is an underwater image enhancement method for color correction and the image enhanced by this method has more edge information and the image with edge information has more feature content, which is helpful for feature extraction operating [16,24]. In Section 4 of the paper, we perform experiments on these underwater enhancement algorithms to verify the effectiveness of the UCM algorithm.
RGB and HSI color models were exploited to correct the color and lighting problems of images to improve the image quality in water [4]. The flow chart of the UCM algorithm is shown in Figure 2:
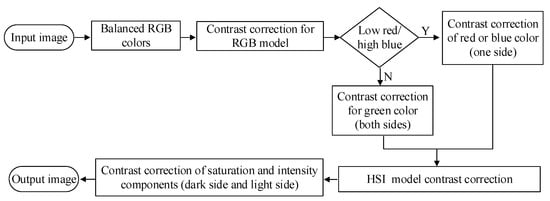
Figure 2.
Unsupervised color correction (UCM) algorithm flowchart.
First, the RGB color model is used to perform contrast correction. To obtain a high-quality image, the RGB color components need to be equal. represents the pixel values of the red, green and blue components of the RGB image, c represents the corresponding channel of the RGB image, represents the size of the image and represents the maximum value of each color component of an RGB image obtained. , .
Then, the average values of each color component R, G and B are calculated. represents the average values of each color component:
The remaining two gain factors are calculated based on the main color cast being blue. Finally, the final adjusted pixel value is obtained by Von Kries assumption and then, the RGB color model is exploited to perform upper and lower contrast correction by using the following formula:
where, is the pixel value after contrast correction; is the pixel value of the current image, is the lower limit, is the upper limit. is the minimum pixel value that exist in the current image, is the maximum pixel value that exist in the current image. and take values from .
If red is the lowest color component, a is the minimum pixel value of the red component; if a heavier color cast blue appears, b represents the maximum pixel value of the blue component; if you look for a color component value between blue and red, each variable in the formula remains unchanged. The HSI color model is used to perform contrast correction from both dark and light sides.
The experimental results are shown in Figure 3. The first row is the original image and the second row is an enhanced image after UCM processing. As can be seen, the UCM module unit effectively improves the phenomena of the underwater image, for example, blurring and dim light and increases the illumination of the underwater image, which has more texture features and detailed information and has clearer and richer colors. Therefore, adding the UCM module to the encoder structure can improve the segmentation accuracy.
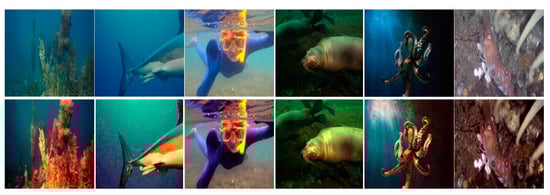
Figure 3.
UCM experimental results.
In order to further verify the applicability of the UCM algorithm in the research of underwater image semantic segmentation technology, we used the sobel operator to perform edge detection operations on the original image and the enhanced image and compared the results. Figure 4 is a comparison diagram of the experimental results of the sobel edge detection algorithm. In the figure, the first line is the edge detection result of the original image and the second line is the edge detection result of the enhanced image. It can be seen from the figure that the image processed by UCM in the second line has more edge information, while the image with more edge information is considered to have higher feature content. Therefore, the UCM algorithm is suitable for the study of semantic segmentation of underwater images.
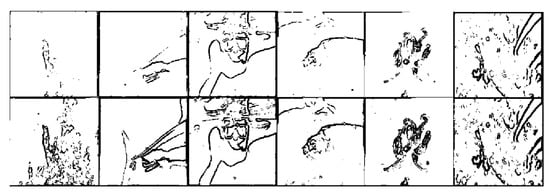
Figure 4.
Comparison of experimental results of edge detection.
3.3. Decoding Structure Optimization
In Figure 5, to the left is the encoder structure and to the right is the decoder structure. Considering the problem of unclear segmentation of the target boundary in the underwater image semantic segmentation result, upsampling with 4 layers directly by the decoding module will cause part of the feature information to be lost and it will also lack the contour and boundary information of the target if it is not connected to the low-level feature information.
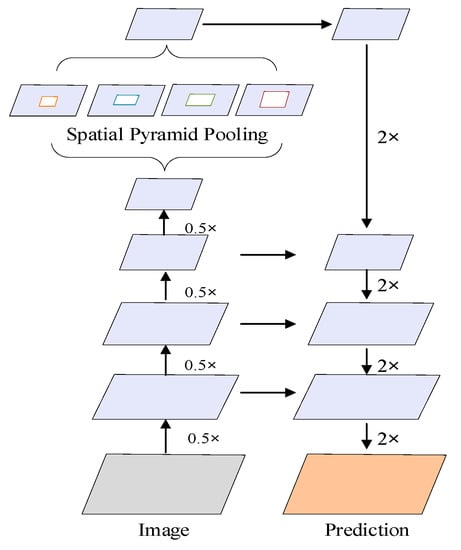
Figure 5.
Vertical structure of semantic segmentation of underwater images.
Therefore, we add two layers of upsampling to the decoding structure. The high-level feature map is upsampled by 2 layers to obtain part of the enlarged feature maps, which are concatenated with the same resolution low-level feature maps obtained from the backbone network to retain more feature information, make the boundary information of the object more complete and make the semantic information clearer.
We also apply deep separable convolutions and hole convolutions in the upsampling layer. Therefore, the decoder structure can more effectively control the resolution of the feature map extracted from the encoder structure.
4. Experiments
We used the training set of the homemade underwater image dataset to train the improved network model and we used the test set to test the trained network model. Compared with other semantic segmentation methods, our method showed better segmentation accuracy. We also showed which improvements are more effective using experiments.
4.1. Datasets
Note that fewer researchers have researched the image semantic segmentation of underwater scenes and public datasets are lacking. Therefore, the dataset used in this experiment was a self-made underwater image dataset. In our underwater dataset, some images were obtained from public resources on the Internet and another part was obtained from video images taken by a laboratory underwater robot (HUBOS-2K, Hokkaido University) [27]. The acquired images were labeled manually using Labelme annotation tools and then the original image and annotation files were generated in the same format as the PASVOL VOC 2012 dataset and finally, the Underwater dataset was produced. The dataset has 16 categories (when the background is added, there are 17 categories; the background category number is 0 and the category name is background). The names of the categories and their corresponding colors are shown in Table 1.

Table 1.
Table of category numbers, names and colors.
There are 2537 images in this dataset. In this experiment, 2237 and 300 for the training and test sets respectively. The training and test data were randomly selected. The sizes of the images we obtained varied. For training purposes, we set the image size to 512 × 512.
4.2. Network Training
The experimental environment of this research as follows: Intel (R) Core (TM) i7-7900X CPU @ 3.30 GHz, Ubuntu 18.04, 64-bit operating system, running memory 32 G, NVIDIA Corporation GV100 [TITAN V], CUDA10.1, CuDNN7.6.0 and Python 3.6.
The underwater dataset was used to train the DeepLabv3 + network model and the proposed network model, Xception_65, was the backbone network. The training parameters are shown in Table 2:
Table 2.
Training parameters.
“Num clones” indicates the number of GPUs used during training; “Training number of steps” represents the total number of steps in the training model, which can also be understood as the number of iterations; “Atrous rate” indicates the hole convolution rate in the ASPP module during network training; “Output stride” indicates the output step size of the encoder; the output stride refers to the ratio of the size of the input image to the final output image size of the encoder. “Decoder output stride” represents the output step of the decoder; “Crop size” represents the size of the image during training and “Batch size” indicates the number of images read in a batch.
Our network model takes about 2 h per 10,000 iterations. Figure 6 shows the loss curve of the average loss of the improved network model during training. From the figure, we can see that in the initial training period, the loss decreased relatively rapidly. As the number of training iterations increased, the loss value gradually tended to be stable and it reached convergence after 100 training iterations. We also retrained the semantic segmentation networks PSPNet [28] and DeepLabv3 + using the underwater dataset under the same experimental environment and obtained the corresponding semantic segmentation models for comparison between the test set and the proposed method. The loss curve is shown in Figure 6, which shows that the loss of the method in this paper reached the minimum level.
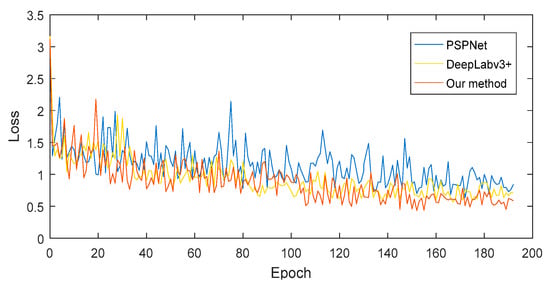
Figure 6.
Network model training loss curve.
4.3. Analysis of Results
We input the test dataset into the trained semantic segmentation models PSPNet, DeepLabv3 + and the proposed method and compared the results. As shown in Figure 7, from left to right are the original, PSPNet, DeepLabv3 +, the proposed method and ground truth images. Different colors represent different types of objects which have different types of semantic information.
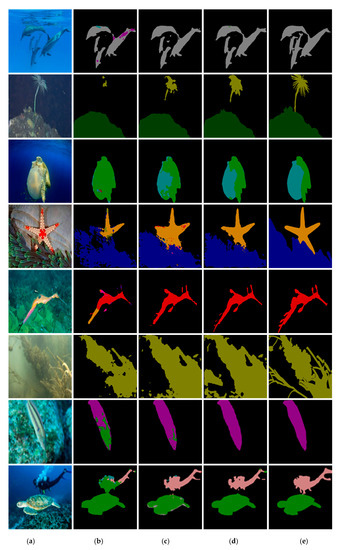
Figure 7.
Experimental results and comparison with other methods. (a) Original image. (b) PSPNet. (c) DeepLabv3+. (d) Our method. (e) Ground truth.
From the experimental results in Figure 7, we can observe that the “dolphin” in row 1, “Syngnathus” in row 5, “fish” in row 7 and “person” in row 8 in the PSPNet method and the “starfish” in row 4 in the DeepLabv3 + method have obvious multi-pixel blending problems. In the third row of the PSPNet method, the classification of the “Jelly Fish” and “Turtle” is incorrect. The method in this paper basically solves these two problems.
For the “starfish” category in the fourth row of the first two methods, the former has too little segmentation information, the latter has too much segmentation information and the “starfish” boundary positioning is not accurate enough. In the “Syngnathus” category in the fifth row, the tail and antenna information of the object are lacking in the first two segmentation methods and the outline of the object is not clear. The segmentation of object contours in this paper is more complete and contains more feature information.
However, for the “plant” category segmentation, these methods are not very good, the target object is incomplete. The segmentation results of the “plant” category in the second and sixth rows are much different from the ground truth. However, compared with other methods, the ratio of segmentation results obtained by this paper to the real semantic label prediction image (ground truth) is larger. Our method contains more feature information when segmenting the required object. The segmentation results obtained by our method are closer to the ground truth.
In the experimental results shown in Figure 8, the method in this paper can more effectively classify different objects and the overall effect of semantic segmentation is better.
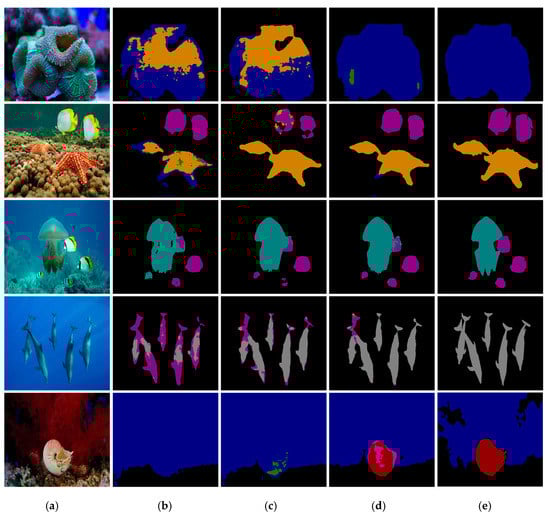
Figure 8.
Experimental results and comparison with other methods. (a) Original image. (b) PSPNet. (c) DeepLabv3+. (d) Our method. (e) Ground truth.
4.3.1. Analysis and Comparison of Test Data
We used the test set to test the segmentation accuracy values (Mean Intersection over Union (MIoU)) [29] of the three network models. MIoU is a cross-combination ratio. It is an important index for measuring the accuracy of image segmentation and is a standard measure of semantic segmentation. IoU can be understood as the intersection of the target area predicted by the network model and the real area marked in the ground truth. MIoU is calculated as the average IoU in different categories. The higher the MIoU value is, the more accurate the segmentation result is and the better the performance of the network model is. The calculation formula is as follows:
In the above formula, represents the number of categories, there are categories if background is included. represents the true value, represents the predicted value. represents the total number of pixels whose category is predicted as , means pixels that are correctly classified. represents the total number of pixels whose category is predicted as , represents the total number of pixels whose category is predicted as . and mean pixels that are incorrectly classified.
Relevant experiments have shown that when the output stride is 16 during training, a higher performance is obtained than when the output stride is 8 during testing.
Therefore, we used the test set to test the MIoU value of DeepLabv3 + and our method with the output stride of the training was 16 and the test output strides were 16 and 8, respectively. The test results are shown in Table 3:
Table 3.
Mean Intersection over Union (MIoU) value of the underwater image dataset.
Train OS represents the output stride used during training and Eval OS represents the output stride used during evaluation.
From the results in Table 3, it can be seen that, whether the DeepLabv3 + method or the method proposed in this paper was used, the accuracy value when the output stride was 8 during testing was slightly higher than the value when the output stride was 16, more time was also required to improve the accuracy.
We chose the result value with a Train OS of 16 and an Eval OS of 8 was used as the final MIoU value and compared with PSPNet, one of the current advanced segmentation models. The output stride parameter is not involved in PSPNet. Therefore, after training this network model using the training set, use the test set to calculate the MIoU value of the trained network model. The final semantic segmentation accuracy values are shown in Table 4.
Table 4.
MIoU value of the Underwater dataset.
As can be seen from Table 4, compared with the other two methods, our method achieved the highest segmentation accuracy value.
4.3.2. Improved Module Validity Verification
To further verify the efficiency of the UCM unit module and the optimized decoding structure, we tested them separately. The test results are shown in Table 5.
Table 5.
MIoU values in different situations.
The meaning of the checkmark in Table 5 is whether a certain module was used. “Encoder” represents the encoder structure in DeepLabv3 +, “Decoder” represents the decoder structure in DeepLabv3 +. “Our Decoder” represents our improved decoder structure. The first row in Table 5 indicates the combination of the network structure using the original DeepLabv3 + plus the UCM unit. Then, we calculated the MIoU value of this network model. The network model shown in the second row of Table 5 is the encoder structure in the original DeepLabv3 + plus our optimized decoder module. The third line in Table 5 represents the improved network model of DeepLabv3 +, which is the network model mentioned in this article. During testing, the training output stride was set to 16 and the test output stride was set to 8.
As shown in Table 5, the two improvements had certain effects and the accuracy of image semantic segmentation improved to various degrees. Compared to an optimized decoder module, the UCM unit had a relatively greater impact on the results of semantic segmentation.
Moreover, we also compared the effects of different enhancement algorithms mentioned in Section 3.2 on the accuracy of underwater image segmentation when applied to the DeepLabv3 + network model. The experimental results are shown in Table 6.
Table 6.
MIoU values in different situations.
From the experimental results in Table 6, it can be seen that different underwater enhancement algorithms was added to the original DeepLabv3 + encoding module can get different results. When the UCM unit is added, the performance of the network model can be significantly improved. Therefore, we choose the UCM algorithm to add to this article Network model.
Figure 9 shows some failure cases of the proposed semantic segmentation network model. The first row in the figure shows the original image and the second row shows the experimental result obtained by the proposed method, which shows that almost all kinds of objects have errors. The first and third images have serious multi-pixel mixing problems and the object segmentation in the first image is incomplete. The second image classifies “octopus” as “starfish.”
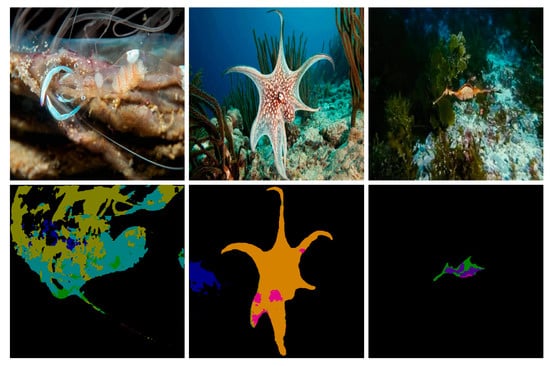
Figure 9.
Failure cases.
5. Discussion
The method in this paper performed well in the underwater image semantic segmentation task, with accurate classification and correct semantic information for a variety of objects. It improved the performance of underwater image semantic segmentation to a certain extent. However, there are still some shortcomings in this paper. From Figure 9, we can conclude that the proposed method does not perform well when processing small objects and semantic segmentation tasks of different types of objects with similar shapes. When the target object and the background are not easy to distinguish, the segmentation effect cannot reach the expected effect. Solving these problems and further improving the performance of semantic segmentation will be a focus and difficulty of our future research.
6. Conclusions
We have proposed an underwater image semantic segmentation model based on improved DeepLabv3 +. This model adds a UCM module to the encoder structure to improve the quality of underwater images and the performance of semantic segmentation. The existing methods have many challenges when processing underwater image semantic segmentation tasks, for example, less feature information, incomplete target contours and unclear target boundary segmentation. Therefore, we added two layers of upsampling in the decoder module and connected it with low-level feature maps with the same resolution extracted from the backbone network to retain more feature information, make the boundary information of the object more complete and make the semantic information clearer. The experimental results demonstrate that the proposed method obtains more feature information and sharper target boundaries, improves the accuracy of semantic segmentation of underwater images and provides certain help for the development and utilization of marine resources.
Author Contributions
Writing—original draft, F.L.; Conceptualization, Methodology, F.L; Conceptualization, M.F.; Methodology, M.F.; Formal analysis, M.F.; Supervision, M.F.; Validation, M.F. All authors have read and agreed to the published version of the manuscript.
Funding
This work was supported in part by the Key Scientific and Technological Achievements Transformation Project of Jilin Province (No. 20170307002GX) and the Consulting research project of the Chinese Academy of Engineering (No. 2019-JL-4-2). It was financially supported by the Marine S&T Fund of Shandong Province for the Pilot National Laboratory for Marine Science and Technology (Qingdao) (No. 2018SDKJ0102-6).
Conflicts of Interest
The author declares no conflict of interest.
References
- Guo, Y.; Liu, Y.; Georgiou, T.; Lew, M.S. A review of semantic segmentation using deep neural networks. Int. J. Multimed. Inf. Retr. 2018, 7, 87–93. [Google Scholar] [CrossRef]
- Zhu, P.; Isaacs, J.; Fu, B.; Ferrari, S. Deep learning feature extraction for target recognition and classification in underwater sonar images. In Proceedings of the 2017 IEEE 56th Annual Conference on Decision and Control (CDC), Melbourne, Australia, 12–15 December 2017; IEEE: Piscataway, NJ, USA; pp. 2724–2731. [Google Scholar]
- Wu, M.; Wang, Q.; Rigall, E.; Li, K.; Zhu, W.; He, B.; Yan, T. ECNet: Efficient Convolutional Networks for Side Scan Sonar Image Segmentation. Sensors 2019, 19, 2009. [Google Scholar] [CrossRef] [PubMed]
- Arain, B.; McCool, C.; Rigby, P.; Cagara, D.; Dunbabin, M. Improving underwater obstacle detection using semantic image segmentation. In Proceedings of the 2019 International Conference on Robotics and Automation (ICRA), Montreal, QC, Canada, 20–24 May 2019; IEEE: Piscataway, NJ, USA; pp. 9271–9277. [Google Scholar]
- Chang, S.; Isaacs, J.; Fu, B.; Shin, J.; Zhu, P.; Ferrari, S. Confidence level estimation in multi-target classification problems. In Proceedings of the Detection and Sensing of Mines, Explosive Objects and Obscured Targets XXIII, International Society for Optics and Photonics, Orlando, FL, USA, 30 April 2018; Volume 10628, p. 1062818. [Google Scholar]
- Gemerek, J.; Ferrari, S.; Wang, B.H.; Campbell, M.E. Video-guided Camera Control for Target Tracking and Following. IFAC-PapersOnLine 2019, 51, 176–183. [Google Scholar] [CrossRef]
- Liu, C.; Ferrari, S. Vision-guided Planning and Control for Autonomous Taxiing via Convolutional Neural Networks. In Proceedings of the AIAA Scitech 2019 Forum, San Diego, CA, USA, 7–11 January 2019; p. 0928. [Google Scholar]
- Beijbom, O.; Edmunds, P.J.; Roelfsema, C.; Smith, J.; Kline, D.I.; Neal, B.P.; Dunlap, M.J.; Moriarty, V.; Fan, T.-Y.; Tan, C.-J.; et al. Towards automated annotation of benthic survey images: Variability of human experts and operational modes of automation. PLoS ONE 2015, 10, e0130312. [Google Scholar] [CrossRef] [PubMed]
- Zurowietz, M.; Langenkämper, D.; Hosking, B.; Ruhl, H.A.; Nattkemper, T.W. MAIA—A machine learning assisted image annotation method for environmental monitoring and exploration. PLoS ONE 2018, 13. [Google Scholar] [CrossRef] [PubMed]
- Long, J.; Shelhamer, E.; Darrell, T. Fully Convolutional Networks for Semantic Segmentation. IEEE Trans. Pattern Anal. Mach. Intell. 2014, 39, 640–651. [Google Scholar]
- Badrinarayanan, V.; Kendall, A.; Cipolla, R. SegNet: A Deep Convolutional Encoder-Decoder Architecture for Scene Segmentation. IEEE Trans. Pattern Anal. Mach. Intell. 2017, 39, 2481–2495. [Google Scholar] [CrossRef] [PubMed]
- Ronneberger, O.; Fischer, P.; Brox, T. U-net: Convolutional Networks for Biomedical Image Segmentation. In Proceedings of the International Conference on Medical image computing and computer-assisted intervention, Munich, German, 18 May 2015; pp. 234–241. [Google Scholar]
- Möller, T.; Nilssen, I.; Nattkemper, T.W. Tracking sponge size and behaviour with fixed underwater observatories. In International Conference on Pattern Recognition; Springer: Cham, Switzerland, 2018; pp. 45–54. [Google Scholar]
- Huang, Y.T.; Peng, Y.T.; Liao, W.H. Enhancing object detection in the dark using U-Net based restoration module. In Proceedings of the 2019 16th IEEE International Conference on Advanced Video and Signal Based Surveillance (AVSS), Taipei, Taiwan, 18–21 September 2019; IEEE: Piscataway, NJ, USA, 2019; pp. 1–9. [Google Scholar]
- Chen, L.C.; Zhu, Y.; Papandreou, G.; Schroff, F.; Adam, H. Encoder-decoder with atrous separable convolution for semantic image segmentation. In Proceedings of the Computer Vision-ECCV, Munich, Germany, 10 September 2018; Volume 11211, pp. 833–851. [Google Scholar]
- Daway, H.G.; Daway, E.G. Underwater Image Enhancement using Colour Restoration based on YCbCr Colour Model. In Proceedings of the IOP Conference Series: Materials Science and Engineering, Kerbala, Irap, 3–5 May 2019; IOP Publishing: Bristol, UK, 2019; Volume 571, pp. 012125, 109–116. [Google Scholar]
- Chollet, F. Xception: Deep learning with depthwise separable convolutions. In Proceedings of the IEEE Conference on Computer Vision and Pattern Recognition, Honolulu, HI, USA, 21–26 July 2017; pp. 1251–1258. [Google Scholar]
- He, K.; Zhang, X.; Ren, S.; Sun, J. Spatial Pyramid Pooling in Deep Convolutional Networks for Visual Recognition. IEEE Trans. Pattern Anal. Mach. Intell. 2014, 37, 1904–1916. [Google Scholar] [CrossRef] [PubMed]
- LiuFangfang Underwater Dataset [EB/OL]. Available online: https://pan.baidu.com/s/1EMkOAhUQ7xH7_-r9Z67nQg (accessed on 14 January 2020).
- Yu, F.; Koltun, V. Multi-Scale Context Aggregation by Dilated Convolutions. In Proceedings of the International Conference on Learning Representations, San Juan, Puerto Rico, 2–4 May 2016; IEEE Press: San Juan, Puerto Rico, 2016; pp. 397–410. [Google Scholar]
- Sze, V.; Chen, Y.H.; Yang, T.J.; Emer, J.S. Efficient Processing of Deep Neural Networks: A Tutorial and Survey. Proc. IEEE 2017, 105, 2295–2329. [Google Scholar] [CrossRef]
- He, K.; Zhang, X.; Ren, S.; Sun, J. Deep residual learning for image recognition. In Proceedings of the IEEE Conference on Computer Vision and Pattern Recognition, Las Vegas, NV, USA, 26 June–1 July 2016; pp. 770–778. [Google Scholar]
- Zhu, Y.; Hao, B.; Jiang, B.; Nian, R.; He, B.; Ren, X.; Lendasse, A. Underwater image segmentation with co-saliency detection and local statistical active contour model. In Proceedings of the OCEANS 2017-Aberdeen, Aberdeen, UK, 19–22 June 2017; IEEE: Piscataway, NJ, USA, 2017; pp. 1–5. [Google Scholar]
- Iqbal, K.; Odetayo, M.; James, A.; Salam, R.A.; Talib, A.Z.H. Enhancing the low quality images using unsupervised colour correction method. In Proceedings of the 2010 IEEE International Conference on Systems, Man and Cybernetics, Istanbul, Turkey, 10–13 October 2010; IEEE: Piscataway, NJ, USA, 2010; pp. 1703–1709. [Google Scholar]
- Sankpal, S.; Deshpande, S. Underwater Image Enhancement by Rayleigh Stretching with Adaptive Scale Parameter and Energy Correction. In Computing, Communication and Signal Processing; Springer: Singapore, 2019; pp. 935–947. [Google Scholar]
- Huang, D.; Wang, Y.; Song, W.; Sequeira, J.; Mavromatis, S. Shallow-water image enhancement using relative global histogram stretching based on adaptive parameter acquisition. In Proceedings of the International Conference on Multimedia Modeling, Bangkok, Thailand, 5–7 February 2018; Springer: Cham, Switzerland, 2018; pp. 453–465. [Google Scholar]
- Fang, M.; Xu, J.; Takauji, H.; Kaneko, S.-I.; Xu, H.H. Efficient computation of optical flow using complementary voting. Acta Autom. Sin. 2013, 39, 1080–1092. [Google Scholar] [CrossRef]
- Zhao, H.; Shi, J.; Qi, X.; Wang, X.; Jia, J. Pyramid scene parsing network. In Proceedings of the IEEE Conference on Computer Vision and Pattern Recognition, Honolulu, HI, USA, 21–26 July 2017; pp. 2881–2890. [Google Scholar]
- Ren, S.; He, K.; Girshick, R.; Sun, J. Faster R-CNN: Towards Real-Time Object Detection with Region Proposal Networks. IEEE Trans. Pattern Anal. Mach. Intell. 2015, 39, 1137–1149. [Google Scholar] [CrossRef] [PubMed]


© 2020 by the authors. Licensee MDPI, Basel, Switzerland. This article is an open access article distributed under the terms and conditions of the Creative Commons Attribution (CC BY) license (http://creativecommons.org/licenses/by/4.0/).