Abstract
Electronic navigational charts (ENCs) are geospatial databases, compiled for the operational use of Electronic Chart Display and Information systems (ECDIS) according to strict technical specifications of the International Hydrographic Organization (IHO). ECDIS is a GIS system designed for marine navigation according to the relevant standards of the International Maritime Organization (IMO). The international standards for ENCs and ECDIS, issued by the IHO and IMO, cover many aspects of the portrayal of ENCs in ECDIS but do not specify or recommend map projections. Consequently, in some cases, the unjustified employment of map projections by the manufacturers has caused certain functional drawbacks and inadequacies. This article reviews, evaluates and supplements the results of earlier studies on the selection of map projections for the depiction of ENCs in ECDIS and proposes a reasonable set of suitable projections with pertinent selection/implementation rules. These proposals took into consideration that ECDIS users (navigators) are not GIS experts or professional cartographers and consequently, the proposed election/implementation rules have to be simple and straightforward.
1. Introduction
The resolutions of the International Maritime Organization (IMO) for safe navigation as they are laid down in the International Convention for the Safety of Life at Sea (SOLAS 1974, as amended) [1], require that all ships shall have official nautical charts to plan and display the ship’s route and to plot and monitor positions throughout the voyage. An official nautical chart is defined as “a special-purpose map or book, or a specially compiled database from which such a map or book is derived, that is issued officially by or on the authority of a Government, authorized Hydrographic Office or other relevant government institution and is designed to meet the requirements of marine navigation”. “Official nautical charts” are produced under the authority of a governmental organization; all other nautical charts that fulfill the same technical specifications, but have not been endorsed by a government authority, are by definition non-official and therefore not appropriate for safe navigation [2].
Traditional marine navigation is based on the mandatory use of official paper nautical charts compiled according to the IHO chart specifications [3]. In contemporary electronic navigation, the mandatory use of official paper nautical charts is replaced by the use of Electronic Chart Display and Information Systems (ECDIS) operated with Electronic Navigational Charts (ENCs). ENCs are geospatial databases that are compiled according to the strict technical specifications of the International Hydrographic Organization (IHO) [4,5]. ECDIS operated by ENCs is a Geographic Information System (GIS) for real-time navigation [6].
IMO issues, resolutions and recommendations for ECDIS that in turn refer to the IHO standards, and technical specifications for the structure and content of ENCs and their standardized display on the ECDIS screen. The initial resolution of the IMO, for the operational use of ECDIS on marine navigation dates back to 1995 [7]. This historical IMO resolution titled “Performance Standards for Electronic Chart Display and Information Systems”, thereafter called “IMO ECDIS Performance Standards”, marked a historical milestone in the evolution of marine navigation methods, providing the basis for the automation of traditional methods for “route preparation”, “route planning”, “route execution” and “route monitoring” in contemporary and future navigational systems. In 2006, the ECDIS Performance Standards were updated to comply with the technological progress and experience in the use of ECDIS [8]. The carriage of ECDIS on ships was initially optional, but, in 2009 IMO imposed a timetable for the mandatory outfit of various types of vessels with ECDIS by the end of 2018.
The IMO and IHO standards for ECDIS and ENCs are implemented by the ECDIS software (SW). The basic part of this SW is the “Kernel” or “Chart Engine”, that provides all significant ECDIS operations, such as the ENC handling tools (loading, decryption, update of ENCs), the ENC display tools (display mode, scale, etc.), the sensor handling (GNSS, Gyro, ARPA, AIS, etc.), the route planning and navigational calculations tools and the route monitoring and safety watch tools. Most ECDIS manufacturers develop their systems on a tested third party kernel, so that they rely on the SW update service of a provider and focus on the design of the ECDIS user interface [9].
The production of ENCs compared to the long-standing production of paper charts is still in its infancy and consequently there is still scope for improvement in the next generation of ENC and ECDIS [10]. According to relevant surveys different ECDIS systems provide different capabilities and a number of ECDIS operating anomalies have been identified [11,12]. One issue is that the international standards for ENCs and ECDIS do not specify or recommend map projections.
The lack of international standards on the employment of map projections in ENCs and ECDIS has been detected at least since 2010 [13,14] but, perhaps surprisingly, the selection of map projections for ENCs and ECDIS is still left to the manufacturers; as a result, different systems use different practices and methods [15] and some functional discomforts and inadequacies have been detected [14,16,17,18,19].
The aim of this study is:
- The detection and presentation of the consequences of the lack of international standards on the employment of map projections in ECDIS.
- The identification of a reasonable set of suitable map projections for the display of ENCs in ECDIS.
- The proposal of simple selection/implementation rules, that can be easily used by both ECDIS manufacturers and users.
The proposed in this study rules for the selection of suitable map projections in ECDIS, employ only three candidate map projections. These rules can be easily implemented by both manufactures and users (navigatos). The validity of the proposed map projections has been verified by the conducted comparative evaluation and numerical tests based on specific criteria and parameters for he requiremebts of all navigational usages of ENCs.
2. International Standards for ENCs and Manufacturer’s Practice on the Employment of Map Projections in ECDIS
2.1. ENC and ECDIS Definitions, Standards and Procedures
2.1.1. ENC and ECDIS Official Definitions
According to the IMO Performance Standards for ECDIS, the definitions and main characteristics of ECDIS and ENCs are:
- “Electronic Chart Display and Information System (ECDIS) is a navigation information system which with adequate back-up arrangements can be accepted as complying with the up-to-date chart required by regulations V/19 and V/27 of the 1974 SOLAS Convention, as amended, by displaying selected information from a system electronic navigational chart (SENC) with positional information from navigation sensors to assist the mariner in route planning and route monitoring, and if required display additional navigation-related information.
- “Electronic Navigational Chart (ENC) means the database, standardized as to content, structure and format, issued for use with ECDIS by or on the authority of a Government, authorized Hydrographic Office or other relevant government institution, and conforms to IHO standards. The ENC contains all the chart information necessary for safe navigation and may contain supplementary information in addition to that contained in the paper chart which may be considered necessary for safe navigation”.
- System electronic navigational chart (SENC) means a database, in the manufacturers internal ECDIS format, resulting from the lossless transformation of the entire ENC contents and its updates. It is this database that is accessed by ECDIS for the display generation and other navigational functions, and is equivalent to an up-to-date paper chart. The SENC may also contain information added by the mariner and information from other sources. Each ECDIS software manufacturer has its own SENC format.
2.1.2. International Standards for ENC and ECDIS
The IHO Standard S-57 defines the content, the topological structure and the format of ENCs [3]. This standard provides detailed strict technical specifications for the production of ENCs that satisfy the IMO ECDIS Performance Standards [7,8]. The content of ENCs is an object oriented database, comprising 200 classes of spatial objects and 185 classes of feature objects, used for the location and description of real world entities, such as navigational lights, buoys, categories of coastline etc.
Besides the S-57 Standard, the IHO has developed and maintains additional standards intended to contribute to the safe operation of ECDIS such as S-52 [20,21], S-63 [22], S-100 [5] and S-101 [23].
ENCs do not contain any symbols or presentation rules; the symbols and rules for the display of ENCs on the ECDIS screen are contained in a separate software component of ECDIS, the “ECDIS Presentation Library”. The detailed technical specifications of the ECDIS Presentation Library are contained in the IHO Standard S-52. The IHO S-52 standard contains symbols, color schemes and rules for the display of any ENC to any ECDIS. The objects of S-57 and S-52 standards are linked within the ECDIS software, in order to present the right information with the right symbols.
The IHO standard S-63 comprises specifications and security procedures for the encryption, authentication and licensing of ENC datasets, as described in Section 2.1.3.
The IHO standard S-100 provides the data framework for the development of the next generation ENCs, as well as other digital products required by the hydrographic, maritime and GIS communities. In order to manage the development of S-100 based products, IHO has allocated S-XXX numbers to be developed by:
- International Hydrographic Organization (IHO): numbers S-101 to S-199.
- International Association of Light Authorities (IALA): numbers S-201 to S-299.
- Intergovernmental Oceanographic Commission (IOC): numbers S-301 to S-399.
- Joint Technical Commission for Oceanography and Marine Meteorology (WMO/IOC JCOMM): numbers S-411 to S412.
- International Electrotechnical Commission–Technical Committee 80 (IEC-TC80): numbers S-421 to S-430.
- NATO Geospatial Maritime Working Group (GMWG) for Additional Military Layers (AML) for operational use in WECDIS (Warship Electronic Chart and Display Systems): numbers S-501 to 525.
The IHO standard S-101 defined as the “Electronic Navigational Chart Product Specification -Annex A Data Classification and Encoding Guide”, is the next generation ENC product specification, which has been designed to address some limitations of S-57. Edition 1.0.0 of S-101 has been released by the IHO in December 2018 for exhaustive testing before entering the market.
The S-101 standard has incorporated all the ENCs functionalities in the S-57 and S-52 format, concerning the digital content and display rules and symbols. Thus, in case of any future new object this will not be necessary to be inserted twice (in S-57 and S-52) as was done in the past [9] (pp. 79–80). S-57 ENC data could be easily converted to the S-1001 format. Consequently, new ECDIS systems based on S-101 will be compatible with S-57 ENC data. The backward compatibility of S-101 data to S-57 format will not be possible because S-101 contains objects and attributes that cannot be easily converted to S-57 [6] (pp. 443–445).
2.1.3. Dissemination of ENCs, Worldwide Electronic Navigational Chart Data Base and IHO Data Protection Scheme
In order to ensure the effective and secure dissemination of ENCs to the end users (navigators), the IHO has developed and implemented the concepts of the “Worldwide Electronic Navigational Chart Data Base” (WEND) and the “Data Protection Scheme” (Figure 1).
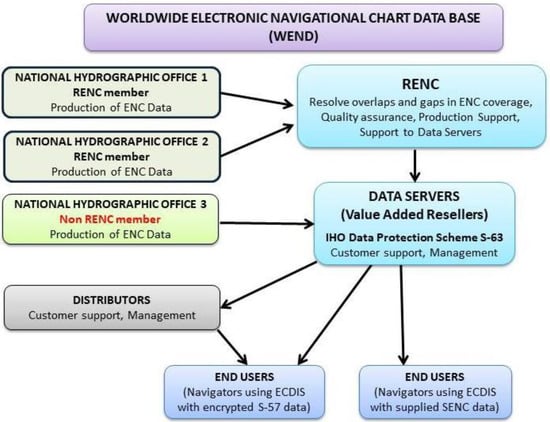
Figure 1.
The concept of Worldwide Electronic Navigational Chart Data Base (WEND) and the Data Protection Scheme of the International Hydrographic Organization (IHO).
WEND is a worldwide network of ENC datasets, based on IHO standards, designed specifically to meet the needs of marine navigation using ECDIS [24]. The purpose of WEND is to ensure a world-wide consistent level of high-quality, updated official ENCs through integrated services that support chart carriage requirements of SOLAS Chapter V, and the requirements of the IMO Performance Standards for ECDIS [2]. WEND comprised of two components. A “Charter” governing the international cooperation and the “Regional Coordinating Chart Centers” (RENCs) supports the dissemination of seamless high quality ENC data according to the “IHO Data Protection Scheme” [2,6].
RENCs are organizational entities established by cooperating IHO member states in order to resolve overlaps and gaps in ENC coverage, ensure compliance with the IHO technical specifications for ENCs and provide a timely, reliable, worldwide and uniform ENC data distribution service. To date (2020), three (3) RENCs are in operation:
- Primar, based in Norway
- IC-ENC, based in the United Kingdom, and
- IC-ENC, based in Australia.
The IHO standard S-63 “IHO Data Protection Scheme” defines the security constraints and operating procedures for: a) the prevention of illegal copy of data (Data Encryption), b) authentication of data (verification of the original source of data), and c) Selective data access (Data Licensing). Encryption is in principle a technique of applied number theory that scrambles the ENC digital files according to the Blowfish algorithm, so that ENCs become unreadable. Authentication is achieved by providing a digital signature file together with the encrypted ENC files. Licensing provides selective access of the procured ENCs. In order to procure and install ENCs to a particular ECDIS, the user needs two license keys called permits: a user permit (28 character code) and a cell permit (48 character code).
The user permit is an encrypted version of the unique hardware identification (HW_ID) that is built into a specific ECDIS by the manufacturer. The HW_ID is unknown to the ECDIS user, but the supplier of the ECDIS system provides to the user the encrypted version of the HW_ID as the 28 character code “User Permit”.
The cell permit is issued by the authorized ENC supplier and grants access to the procured ENCs for a specific period of time. For the issue of the cell permit, the user must forward the user permit of his specific ECDIS to the authorized ENC supplier. This is generated with this procedure cell permit and is bound to a specific HW_ID and consequently cannot be used in a different system.
2.2. Manufacturer’s Practice on the Employment of Map Projections in ECDIS
International standards for ENCs and ECDIS [4,8,20,21,22,23], provide detailed specifications and guidance for the depiction of the content of ENCs on ECDIS, such as: “Regulation of the amount of the displayed on the screen cartographic information”, “Choice between two standardized sets of symbols”, “Adjustment of screen colors according to the prevailing light conditions”, “Chart orientation”, “Display of ENC with own ship customized bathymetry and safety contour”, “Change the display scale of the ENC by means of range in nautical miles”, etc. Nevertheless these international standards do not mention anything about map projections in ECDIS. Due to the lack of international standards for the implementation of map projections in ECDIS, different systems provide different capabilities. Unfortunately, since ECDIS are commercial systems, there is not usually documentation or even basic information on the principles, methods and algorithms used in their systems. In this framework, most of the commercial systems do not even mention anything about the map projection, or the projections that they employ, so the following information is based mainly on operational trials of selected systems.
In the period between 1996 and 2005, almost all ECDIS systems employed only one map projection, usually the Mercator, or the Plate Carré. A limited number of the systems of this period offered the option of manual selection between 4–5 available map projections. Nevertheless, the choice of these projections by the manufacturers seems to be arbitrary and not based on any criteria for the operational use of ECDIS. For instance, the availability of the gnomonic projection in these systems was totally unjustified, since in ECDIS navigation is not conducted by graphical work on the gnomonic projection, as it is in traditional navigation.
During the period 2006–2015, some (very few) manufacturers developed systems with the capability of automatic selection between two available map projection. One was the Mercator and the other was the azimuthal Stereographic. In these systems the selection between these two projections is conducted automatically, according to simple rules based on “the location” and “the extend” of the area depicted on the ECDIS screen; the default projection is the Mercator, but if the depicted area on the screen includes polar regions or high latitudes, the system automatically switches from the Mercator to the azimuthal stereographic projection. Communication with the manufacturers at that time revealed that, according to the responses of their clients to a relative questionnaire, ECDIS users preferred to use only the Mercator projection and that other projections offered for manual selection in the earlier versions had not been used by their client (navigators). In these systems the automatic selection between two projections was a significant step forward. This automatic selection method, combines the characteristics and benefits of composite projections and intelligent map selection methods [25,26,27,28].
In the period form 2015 up to now (2020), one new system has been detected, that, according to information provided by the manufacturer, employs “an adjustable projection”, without any other information on the type or the basic characteristics of this projection. Trials of this system showed that this projection fits automatically to the window of the ECDIS screen that is available for the display of the ENC. The visual impression of these trials is that this system employs two map projections only, one cylindrical and one azimuthal, similarly to the earlier that employed the Mercator and the Azimuthal Stereographic projection.
The lack of international standardization on the employment of map projections for the display of ENcs in ECDIS, has in some cases resulted in the unjustified employment of map projections by the manufacturers, which in some cases has caused certain functional discomforts or inadequacies, such as:
- The inability of some systems to depict ENCs for navigation in the Arctic, reported by the Arctic Hydrographic Commission [17,18].
- The poor visualization caused by the extreme area distortion of the Mercator projection in high latitudes is an important issue [16,29].
Nowadays, after more than two decades of the initial issue of the IMO standards for ECDIS [7], there is still a big diversity on the manufacturers practice on the employment of map projections [15]. The majority of ECDIS systems doesn’t employ any map projection and so the ENC object are simply displayed according to their geographical coordinates (φ, λ). This method of presentation is the “Plate Carré” or “Rectangular” projection that uses the simplest possible map transformation formulae x= λ, y= φ [16,29]. Neglecting to select a map projection is an elementary mistake, made not only in ECDIS system but also in some GIS applications [30,31].
3. Methodology of the Present Study
The methodology for the selection of map projection for a particular application comprises two distinct processes [30,31]:
- -
- Derivation of an initial list of candidate projections.
- -
- Evaluation and ranking of candidate projections.
According to the conclusions of other studies on the selection of map projection in GIS and computer-based applications, the number and variety of candidate projections complicates the selection process. Consequently, limiting the number of candidate projections provides simple and straightforward process for election of map projections [30,31].
3.1. Identification of Candidate Map Projections for the Display of ENCs in ECDIS
The development of a computer-based method for the choice of a proper map projection, should follow the general principles listed in Table 1 [30]. However, these general principles are intended for professional cartographers and not for map users, such as the navigators operating ECDIS with ENCs. Therefore, the general principles of Table 1, in order to be pragmatic and applicable in ECDIS, have to be modified and become more specific taking into consideration the following rules:

Table 1.
General principles for developing a computer based method for map projection selection.
- The map projection selection should be guided by the purpose of the map (principle #1 of Table 1). In the case of ENCs the purpose of ENCs is the support of the needs of marine navigation in the applications of Table 2.
Table 2. Basic Navigational Usages of Electronic Navigational Charts (ENCs).
- The principle that the selection method should consider user preferences and aesthetics (principle #8 of Table 1). In the case of ENCs, the user (navigator) is accustomed to the use of the Mercator projection used in traditional paper nautical charts.
- The proposed election/implementation rules have to be simple and straightforward ECDIS because ECDIS users (navigators) are not GIS experts or professional cartographers capable of making selection decisions that in some cases are difficult, even for experienced cartographers and GIS experts [30,31].
Based on the abovementioned rules, the general principles of Table 1 have been modified to those listed in Table 3.
Table 3.
General principles for the selection of map projections in Electronic Chart Display and Information Systems (ECDIS).
From the three basic navigational usages of ENCs listed in Table 2, for coastal navigation and piloting, ENCs are displayed on the ECDIS screen at large scales and consequently all map projections provide practically the same results on the screen [16,32]. Therefore for coastal navigation and piloting with ECDIS, the choice of map projections is immaterial.
In the applications of Table 2, other than coastal navigation, the choice of a suitable map projection is vital. Particularly for navigation in the Arctic, it is imperative to employ a projection other than the Mercator [16,19].
In this study the research and methodology for the determination of an initial set of candidate map projections for ENCs and ECDIS has been based on the results of earlier studies [14,16,19,25,29], as well as, as presented in Section 2.2. experience from the manufacturer’s practice on the employment of map projections. Pallikaris [16] proposed eight (8) candidate projections that could be used for marine navigation with ECDIS according to the location and the extent of the area portrayed on the screen. Skopeliti and Tsoulos [19] proposed four (4) map projections for navigation in the Arctic and Subarctic regions. Jenny et al. [26] proposed a compromised aspect adaptive cylindrical projection for world maps, which can be easily modified for the worldwide depiction of ENCs, as an alternative to that of the standard Miller Cylindrical Projection.
Combining the proposals of previously conducted studies we came out with the nine (9) candidate map projections of Table 4.
Table 4.
Initial set of candidate map projections for ECDIS.
Based on the experience of ECDIS manufacturers and users on the employment of map projections as well as on the results of other studies [30,32], the initial set of candidate map projections has to be restricted to a minimum, preferably to two or three. Restricting candidate projections to three (one projection from the families of cylindrical, azimuthal and pseudocylindrical projections), it will be possible to develop the simplest concise selection rules requiring little or no participation from the user.
In the conducted study, the restriction of the nine candidate map projections of Table 4 to three has been based on the amalgamation, supplementation and simplification of the results of other relevant studies [16,19,25] according to the principles and methodology described in Section 3.2. The development of practical selection rules has been based on the exploitation of the capability of ECDIS to change the scale of the displayed on the screen ENC by means of range scale, as presented in Section 3.3 and Section 5.
3.2. Principles and Methodology for the Evaluation of Candidate Map Projections for ECDIS
The evaluation of map projections for GIS and WEB applications can be conducted according to the general principles and rules for the selection of proper map projections in traditional cartography, adapted to the particular requirements of each specific GIS or WEB application [30,31].
In the present study the evaluation of the candidate map projections of Table 4 for navigation with ECDIS has been based on: the principles of Table 3 by:
- The calculation and analysis of the distribution of angular and area distortions.
- The assessment of the shape of long navigational paths.
The calculation and analysis of the distribution of angular and area distortions is a valuable tool for the selection of a suitable map projections according to preset tolerances, depending on the specific use of the map. In this study, the analysis of distribution of distortions aims to restrict visual distortion on the displayed in the ECDIS screen ENC as explained in Section 4.1. The assessment of the shape of long navigational paths in this study has been conducted by 1) the construction of special maps showing great circles (GCs) and rhumb lines (RLs)/loxodromes routes for each projection and 2) the employment of loxodromicity and orthodromicity factors that have been employd for the evaluation of long navigational paths in earlier studies [16,29]. The results of the comparative evaluation of the candidate map projections (distortion analysis and assessment of the shape of long navigational paths) are presented in Section 4.
3.3. Exploitation of “Range Scale” for the Selection of Map Projections in ECDIS
The lack of international standards for the employment of map projections in ECDIS can be overcome by the exploitation of ECDIS capability to change the scale of the displayed ENC by means of range scale. Range scale is a method of expressing the scale of the displayed on the screen electronic chart, that can be exploited analogously to the “scale parameter” and the “height to width aspect ratio” recommended for self-adaptive intelligent projections [25,26,27,28].
According to the IMO Performance Standards for ECDIS [7,8], it should be possible to change the display scale by means of either chart scale values or ranges in nautical miles. Some systems use the chart scale option; usually a menu of fixed scale options is given and the user can either select the desired scale, or change the display scale by successive steps for larger or smaller scale. Other systems use the concept of ranges in nautical miles; usually a menu of fixed ranges is given (Figure 2) and the user can either select the desired range, or change the display scale by successive steps for larger or smaller ranges. In these systems, the range, measured in nautical miles (NM), indicates the distance between the center of the display area and the top or the bottom of the screen, respectively. If for instance the range is 6 NM the displayed area between the top and bottom of the screen will be 12 NM. This value may vary slightly, due to the distance distortion of the employed map projection.
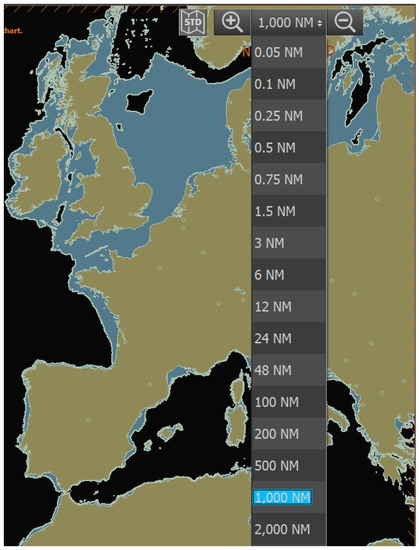
Figure 2.
Change the display scale of ENC in ECDIS by means of range in nautical miles (NM).
In order to facilitate the display of a radar overlay on ENCs, the IHO ENC specifications recommend that hydrographic offices set the compilation scales of their ENCs to be consistent with the standard radar range scales as in Table 5.
Table 5.
Standard Radar ranges and recommended ENC compilation scales.
The capability of ECDIS to change the scale of the displayed on the screen ENC by means of range scale can be exploited for the development of simple rules for the automatic selection of a suitable map projection in ECDIS among three prosed candidate projections, as it is explained in Section 5.
3.4. Developing Map Projections on the Ellipsoid for ECDIS by the Bijective Double Projection Transformation
The “Miller Modified Cylindrical Projection” proposed in this study has been developed by the the principles of bijective double projection transformation (Figure 3). In this transformation, the surface of the ellipsoid is initially transformed onto the surface of an auxiliary sphere and then the surface of this auxiliary sphere is transformed to the surface of the plane by the employment of map projections for the sphere [33,34,35,36,37]. The basic principle used in the bijective double projection transformation is that the ellipsoid is transformed into a sphere under certain conditions, preserving properties of “conformal mapping”, “equi-areal mapping”, or “equidistant mapping” of one surface onto another [34]. Based on the imposed restraints, the bijective transformation of the surface of the ellipsoid to an auxiliary sphere can be:
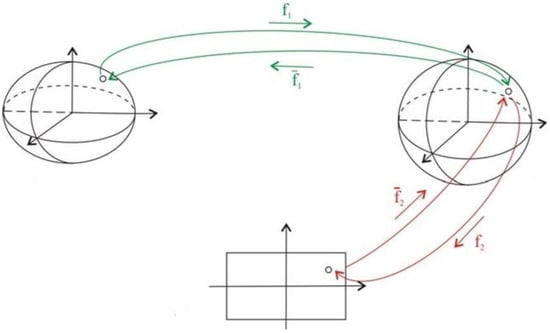
Figure 3.
Bijective double projection transformation. “Ellipsoid to Sphere” and “Sphere to Plane”.
- Transformation onto a “conformal sphere” without angle distortion.
- Transformation onto an “equivalent sphere” without area distortion.
- Transformation onto an “equidistant along the meridians sphere” without length distortion along the meridians.
- Transformation onto an “equidistant along a certain parallel sphere” without length distortion along this parallel.
The bijective transformation of the elliptical geodetic coordinates (φ, λ) of a point on the surface of the ellipsoid to the spherical geographical coordinates (φ΄, λ΄) of the image of this point onto the auxiliary sphere are given by (1)–(3) [35].
where:
- -
- φ: is the geodetic latitude of a point on the surface of the ellipsoid
- -
- φ΄, λ΄: are the auxiliary spherical latitude and the auxiliary spherical longitude of a point on the surface of the auxiliary sphere
- -
- The coefficients A2, A4, A6, etc., and B2, B4, B6, etc., take different values for each one of the four auxiliary spheres [35,37].
For the development of the direct and inverse map transformation formulae of the proposed modification of the Miller Cylindrical projection on the ellipsoid, has been employed as an auxiliary sphere equidistant along the 30° parallel. This auxiliary sphere has been selected because [35]:
- The map transformation formulas are more straightforward than those for the other auxiliary spheres.
- The magnitude of angle and area distortion is negligible for the effect on visual perception on the ECDIS screen.
4. Evaluation of Candidate Map Projections for ECDIS
4.1. Distortion Analysis
Distortion analysis enables the comparative evaluation of map projections [30,31,34,38,39]. In GIS and computer-based applications applications, without the requirement of measurements on the projection the aim of distortion analysis, they eliminate or reduce the visual distortion to a minimum. According to the results of earlier studies, the tolerances (acceptable limits) of distortion, ensuring that no serious visual distortion is generated are between 10°–12° for angular distortion and between 10–12% for the area distortion [34].
In this study, a distortion analysis has been conducted by the commercial software Matlab-Mapping Toolbox for the computation of area and angle distortion for each projection and the subsequent construction of relevant graphs and isoline maps, such as those of Figure 4, Figure 5 and Figure 6. Existing matlab libraries, cover most of the evaluated map projections of Table 4, except those proposed in this study “Miller Modified Cylindrical Projection”. For this projection the computation of area and angle distortion and the construction of relevant graphs and isoline maps has been conducted by the modification of map transformation formulae of the Miller Cylindrical projection with the principles of bijective transformation that have been presented in Section 3.4.
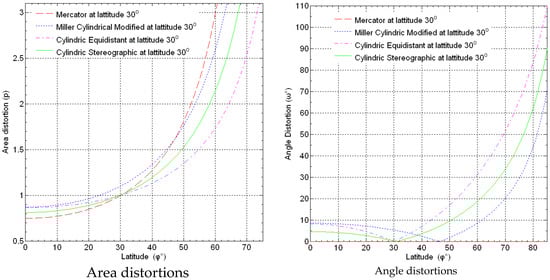
Figure 4.
Area and angle distortions in cylindrical projections with standard parallel at 30°.
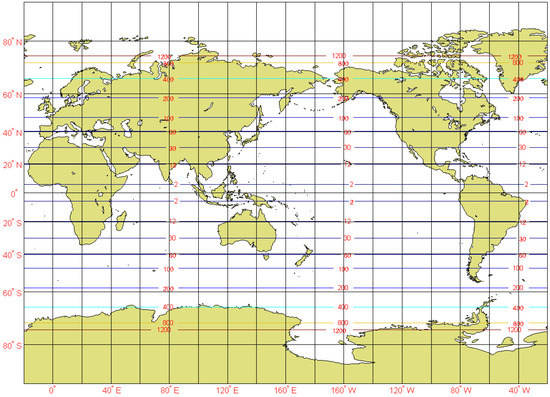
Figure 5.
Area distortion isolines on the Standard Miller Cylindrical Projection.
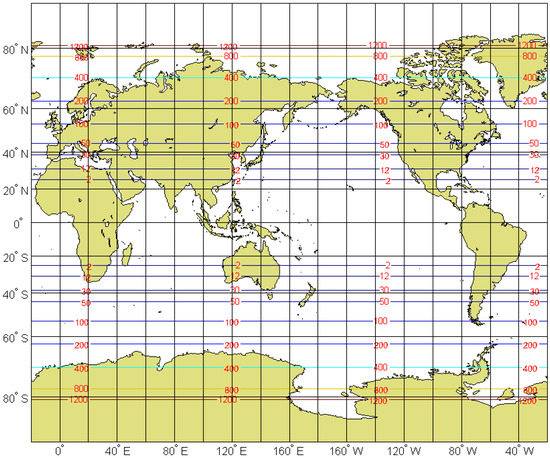
Figure 6.
Area distortion isolines in the Modified Miller Cylindrical Projection.
The results of the conducted comparative evaluation showed that:
- The Mercator projection, has zero angle distortion and provides optimum distribution of area distortion (≤12%) over a broad and continuous latitude zone extending from 24° S to 24° N, when the standard parallels are at latitudes 15° S and 15° N.
- The cylindrical equidistant projection provides optimum distribution of distortion when the standard parallels are at latitudes 30° S and 30° N. With these standard parallels the cylindrical equidistant projection has the following characteristics:
- ▪
- Satisfies the desired tolerances of angle distortion for reduced visual distortion (12°) over a broad and continuous latitude zone extending from 45° S to 45° N. In this latitude zone (−45°, 45°) the cylindrical equidistant projection with standard parallel at latitude 30°, provides considerably less area distortion compared to the Mercator projection. The magnitude of area distortion is −13.4% at the equator and 22.7 % at latitude 45°. The Mercator projection with the same standard parallel at latitude 30° provides −25% area distortion on the equator and 49.5 % area distortion at latitude 45°.
- ▪
- Satisfies the desired tolerances of area distortion for reduced visual distortion (± 12%) over a broad and continuous latitude zone extending from 10° to 39°. It is noted though that for latitude lower than 10° the maximum value of area distortion is only 13.4% at the equator, which is only 1.4% in excess of the desired tolerance (±12%).
- ▪
- Practically satisfies both desired tolerances of angular distortion and of area distortion over the latitudes zone from −39° to 39°, with only a small (1.4%) excess of the tolerance for area distortion for latitudes lower than 10°.
- The cylindrical equal area projection provides considerable angle distortion and therefore is not recommended for use in ECDIS and other electronic chart systems.
- The cylindrical stereographic projection with standard parallels at latitudes 30° S and 30° N known as BASM (Bol’soy Sovetskiy Atlas Mira) projection [40], satisfies the desired tolerances of angular distortion for reduced visual distortion (12°) over a latitude zone ex-tending from 53° S to 53° N. This projection has area distortion −19% at the equator and 67% at latitude 53°. The Mercator projection with the same standard parallel at latitude 30° provides −25% area distortion on the equator and a 06 % area distortion at latitude 53°.
- The cylindrical stereographic projection with standard parallels at latitudes 45° S and 45° N known as Gall cylindrical projection [40], satisfies the desired tolerances of angle distortion for reduced visual distortion (12°) over a latitude zone extending from 59° S to 59° N. This projection has area distortion −39.2% at the equator and 54.2% at latitude 59°. The Mercator projection with the same standard parallel at latitude 45° provides −50% area distortion on the equator and 87.6% area distortion at latitude 59°.
- The miller cylindrical projection satisfies the desired tolerances of angle distortion for reduced visual distortion (12°) over a latitude zone extending from 53° S to 53° N. This projection has an area distortion of −0.7% on the equator and 125.6% at latitude 53°. At this latitude (53°) the Mercator projection has an area distortion of 175%.
- The proposed miller cylindrical modified projection at latitude 30° satisfies the desired tolerances of angle distortion for reduced visual distortion (12°) over a latitude zone extending from 63.5° S to 63.5° N. This projection has area distortion −12.8% on the equator and 307.5% at latitude 63.5°. The Mercator projection with the same standard parallel has area distortion −25% at the equator and 375% at latitude 63.5°
- The polar azimuthal equidistant projection provides zero or less visual distortion in areas extending from the pole down to the 75° parallel.
- The polar azimuthal stereographic projection provides zero or less visual distortion in areas extending from the pole down to the 82° parallel.
4.2. Assessment of the Shape of Long Navigational Paths
The assessment of the shape of long navigational paths has been conducted by the calculation of the loxodromicity factor ξL and the orthodromicity factor ξο that have been also emploted in other studies [16,25]. The values of ξL ans ξO are given by (4) and (5).
where:
L, is the length of the straight line segment connecting the points of departure and destination on the projection.
hO and hL are the maximum distances of the line depicting the great circle (GC) or the rhumbline (RL) from the straight line segment connecting the points of departure and destination on the projection (Figure 7).
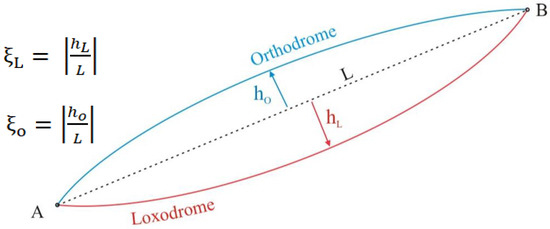
Figure 7.
Loxodromicity and Orthodromicity factors ξL and ξO.
In the present study, the assessment of the shape of long navigational paths has been conducted on the three routes listed in Table 6 and depicted in Figure 8, that extend over the Pacific and Indian Oceans. The criterion for the selection of these routes is that in routes at mid and high latitudes that approach the East-West (E-W) direction). The deviation between orthodromes and loxodromes on the surface of the earth is bigger than the deviation of other long routes [16,41].
Table 6.
Long navigational routes selected for evaluation.
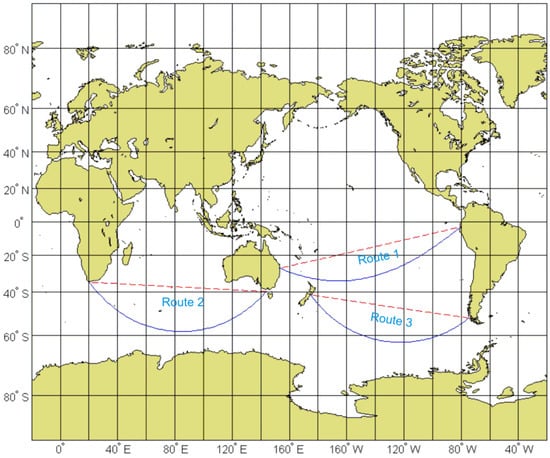
Figure 8.
Long navigational routes on the Modified Miller Cylindrical Projection. Orthodromes depicted as solid lines-Loxodromes depicted as dashed lines.
The results of the conducted numerical tests (Figure 9), showed that, for the routes of Table 6, the values of the loxodromicity factors for all evaluated cylindrical projections are equal to zero. This means that the shape of the rhumb lines (loxodromes) is practically depicted as straight lines as in the Mercator projection. This finding might be initially surprising because according to standard books on the theory of map projections, the only map projection that depicts loxodromes as straight lines is the Mercator projection. However, despite this true theoretical fact/rule, the conducted tests showed that in practice the display of the loxodromes on all and every evaluated cylindrical map projections are practically depicted as straight line segments. (as they are perceived by the human eye).
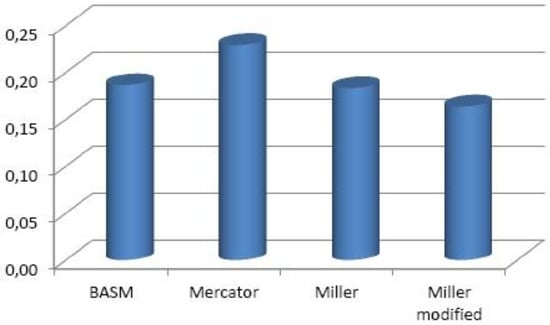
Figure 9.
Orthodromicity factors on different map projections (average values for the routes of Figure 8).
Since in all the evaluated map projections, the values of the loxodromicity factors are all equal to zero, the assessment of the shape of long navigational paths has been restricted to the calculation of the orthodromicity factors. This calculation showed that the Miller modified cylindrical projection, provides slightly better orthodromicity factors than the other evaluated map projections (Figure 9).
5. Discussion, Conclusions and Proposals
The lack of international standards for the employment of map projections in ECDIS, has in some cases led to the incompetent use of map projections in ECDIS causing some operational limitations and discomforts. The incompetent use of map projections may lead firstly to the arbitrary use of map projections, without considering the relevant consequences, and secondly to the repeated use of a map projection that for some specific reason(s) has been established for certain applications, without considering the advantages of other more suitable projections [30,31]. An example of unjustified use of map projections is the extensive and repeated use of the Mercator projection for ECDIS and web maps, regardless of the ‘long history of discussion about its inappropriateness for Electronic Navigation with ECDIS and other web based applications, particularly at the global scale [16,30,42]
The selection of a suitable map projection among a set of candidate projections for GIS and Web applications is not an easy task even for professional cartographers and GIS experts. However the solution to this problem is not the employment of just one map projection, but the restriction of candidate map projections to a reasonable number that satisfy rivaling factors that cannot be met by a single map projection [30,31,34,39].
The selection of a suitable map projection in ECDIS has to be conducted according to a simple and straightforward procedure among a limited set of candidate map projections in order to avoid complicated and impractical implementation rules. This procedure is imposed by the fact that ECDIS users are navigators and not professional cartographers or GIS experts, who can apply more sophisticated selection methods between a larger set of candidate map projections.
The detected problems in the choice of proper map projections for ENCs and ECDIS, can be overcome by the employment of just two or three candidate projections. The restriction of candidate projections to “two” or “three” offers the capability to develop and implement convenient automa tic, semi-automatic or manual selection rules that can be easily implemented in ECDIS by both manufacturers and users.
According to the comparative evaluation of nine projections conducted in this study, that have been proposed in other studies, the three projections of Table 7 provide very satisfactory results for all navigational usages. Very satisfactory results can also be obtained by the employment of just two of the there candidate projections of Table 7: The “Miller Modified Cylindrical Projection” with standard parallel at 30° for all navigational applications except navigation in the arctic and subarctic and the “Azimuthal Stereographic” for navigation in the arctic and subarctic. One minor deficiency of this “two projection model” is the inadequacy for A worldwide display of very long navigational which is not a requirement for the majority of vessels that sail only in low and mid latitudes.
Table 7.
Proposed triad of map projections for the depiction of ENCs in ECDIS.
Automatic selection without user interference is possible if the candidate projections are just three as those in Table 7 (miller modified cylindrical projection, azimuthal equidistant projection and Loximuthal). Alternatively, instead of automatic selection, manual selection between these three map projections is possible with very little user interference.
The automatic selection of a suitable map projection among the proposed three projections of Table 7 can be easily conducted by the exploitation of the, presented in Section 3.3, range scale, according to the following rules (see also the block diagam of Figure 10):
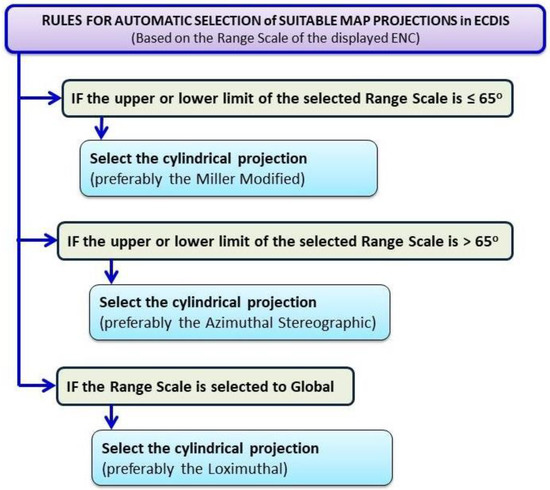
Figure 10.
Automatic selection of suitable map projections in ECDIS.
- If the upper or lower limit of the selected Range Scale is ≤ 65°, THEN, the cylindrical projection should be used.
- If the upper or lower limit of the selected Range Scale is ˃ 65°, THEN, the azimuthal projection should be used.
- If the Range Scale is selected to Global, THEN, the pseudocylindrical projection should be used.
Of course, other choices of a satisfactory triad of map projections for the portrayal of ENCs on the ECDIS screen are possible, such as: the employment of a “self-adaptive cylindrical projection” instead of the Miller Modified Cylindrical projection and the employment of a “self-adaptive azimuthal projection” instead of the azimuthal stereographic projection, developed according to the principles of the self-adaptive map projections [25,26].
Author Contributions
Conceptualization, A.P. and A.K.M.; methodology, A.P. and A.K.M.; software, A.P.; investigation, A.P. and A.K.M.; data curation, A.P.; writing—original draft preparation, A.P.; Review and editing, A.P. and A.K.M.; visualization, A.K.M. All authors have read and agreed to the published version of the manuscript.
Funding
This research received no external funding.
Conflicts of Interest
The authors declare no conflict of interest.
References
- International Maritime Organization. Resolution MSC.350(92). Annex 2. Amendments to the International Convention for the Safety of Life at Sea, 1974, as Amended. Chapter V Safety of Navigation. Regulation 19 Carriage Requirements for Shipborne Navigational Systems and Equipment; IMO: London, UK, 2013. [Google Scholar]
- International Hydrographic Organization. Facts About Electronic Charts and Carriage Requirements, Publication S-66, Edition 1.1.0; IHO: Monaco, Monaco, 2018. [Google Scholar]
- International Hydrographic Organization. Regulations of the IHO for International (INT) Charts and Chart Specifications of the IHO, Publication S-4; IHO: Monaco, Monaco, 2018. [Google Scholar]
- International Hydrographic Organization. IHO Transfer Standard for Digital Hydrographic Data Special, Publication S-57, Edition 3.1; IHO: Monaco, Monaco, 2000. [Google Scholar]
- International Hydrographic Organization. Universal Hydrographic Data Model Special, Publication S-100, Edition 4.0.0; IHO: Monaco, Monaco, 2018. [Google Scholar]
- Hecht, H.; Berking, B.; Jonas, M.; Alexander, L. The Electronic Chart—Fundamentals, Functions, Data and Other Essentials, 4th ed.; Geomares Publishing: Lemmer, The Netherlands, 2017. [Google Scholar]
- International Maritime Organization. Performance Standards for Electronic Chart Display and Information Systems (ECDIS), Resolution A817(19); IMO: London, UK, 1995. [Google Scholar]
- International Maritime Organization. Revised Performance Standards for Electronic Chart Display and Information Systems (ECDIS), Resolution MSC 282(82), MSC 82/24/Add.2/Annex 24; IMO: London, UK, 2006. [Google Scholar]
- Becker-Heins, R. ECDIS Basics; Genres Publishing: Lemmer, The Netherlands, 2014. [Google Scholar]
- International Hydrographic Organization. Report on the Results of the ECDIS Survey Conducted by BIMCO and Denmark; IHO: Monaco, Monaco, 2014. [Google Scholar]
- International Maritime Organization. Operating Anomalies Identified within ECDIS, IMO SN.1/Circ.312. 9; IMO: London, UK, 2012. [Google Scholar]
- International Maritime Organization. ECDIS—Guidance for Good Practice, MSC.1-Circ.1503-Rev.1; IMO: London, UK, 2017. [Google Scholar]
- Noris, A. Integrated Bridge Systems Vol. 2. ECDIS and Positioning; The Nautical Institute: London, UK, 2010. [Google Scholar]
- Palikaris, A.; Tsoulos, L. Map projections and visualization of navigational paths in electronic chart systems. In Proceedings of the 3rd International Conference on Cartography and GIS, Nessebar, Bulgaria, 12–15 June 2010. [Google Scholar]
- Weintrit, A. Clarification, Systematization and General Classification of Electronic Chart Systems and Electronic Navigational Charts Used in Marine Navigation. Part 2—Electronic Navigational Charts. Transnav Int. J. Mar. Navig. Saf. Sea Transp. 2018, 12, 769–780. [Google Scholar] [CrossRef]
- Pallikaris, A. Map Projections for Electronic Navigation and other Marine GIS Applications. Int. Hydrogr. Rev. 2012, 8, 7–20. [Google Scholar]
- Arctic Regional Hydrographic Commission. Report of the 2nd Meeting of the Arctic Regional Hydrographic Commission; IHO/ARHC: Monaco, Monaco, 2011. [Google Scholar]
- Arctic Regional Hydrographic Commission. ArHC2-09A INF1, Precautions in using navigational charts in Polar waters—Draft SN1 Circ. In Proceedings of the 2nd ARHC Meeting, Copenhagen, Denmark, 27–29 September 2011. [Google Scholar]
- Skopeliti, A.; Tsoulos, L. Choosing a Suitable Projection for Navigation in the Arctic. Mar. Geod. 2013, 36, 234–259. [Google Scholar] [CrossRef]
- International Hydrographic Organization. Specifications for Chart Content and Display Aspects of ECDIS, Special Publication S-52; IHB: Monaco, Monaco, 2014. [Google Scholar]
- International Hydrographic Organization. ECDIS Presentation Library, Special Publication S-52, Annex A. Edition 4.0.(2); IHO: Monaco, Monaco, 2017. [Google Scholar]
- International Hydrographic Organization. IHO Data Protection Scheme. IHO Publication S-63. Edition 1.2.0; IHO: Monaco, Monaco, 2015. [Google Scholar]
- International Hydrographic Organization. Electronic Navigational Chart Product Specification. Annex A. Data Classification and Encoding Guide, Version 1.0.0; IHO: Monaco, Monaco, 2018. [Google Scholar]
- International Hydrographic Organization. Glossary of ECDIS Related Terms. Special Publication S-32 Appendix 1; IHO: Monaco, Monaco, 2007. [Google Scholar]
- Jenny, B.; Šavrič, B.; Patterson, T. A compromise aspect-adaptive cylindrical projection for world maps. Int. J. Geogr. Inf. Sci. 2015, 29, 935–952. [Google Scholar] [CrossRef]
- Jenny, B. Adaptive composite map projections. IEEE Trans. Vis. Comput. Graph. 2012, 18, 2575–2582. [Google Scholar] [CrossRef] [PubMed]
- Jenny, B.; Šavrič, B. Combining world map projections. In Choosing a Map Projection. Lecture Notes in Geoinformation and Cartography; Lapaine, M., Usery, E.L., Eds.; Springer: Berlin, Germany, 2017; pp. 203–211. ISBN 978-3-319-51834-3. [Google Scholar]
- Helali, H.; Alesheikh, A.; Hamrah, M. Multi map projection in modern cartography. In Proceedings of the 22nd International Cartographic Conference, La Coruña, Spain, 9–16 July 2005. [Google Scholar]
- Pallikaris, A. Choosing Suitable Map Projections for World-wide Depiction of Electronic Charts in ECDIS. Coordinates 2014, 10, 21–28. [Google Scholar]
- Canters, F. Small-Scale Map Projection Design; Taylor & Francis: London, UK, 2002. [Google Scholar]
- Gosling, P.; Symeonakis, E. Automated map projection selection for GIS. Cartogr. Geogr. Inf. Sci. 2020, 47, 261–276. [Google Scholar] [CrossRef]
- Pearson, F., II. Map Projections: Theory and Applications; CRC Press: Boca Raton, FL, USA, 1990; ISBN 0-8493-6888-X. [Google Scholar]
- Grafarend, E.W.; You, R.-J.; Syffus, R. Map Projections—Cartographic Information Systems; Springer Verlag: Berlin/Heidelberg, Germany, 2014. [Google Scholar]
- Bugayevskiy, L.M.; Snyder, J.P. Map Projections—A Reference Manual; Taylor & Francis: London, UK, 1998. [Google Scholar]
- Yang, Q.; Snyder, J.P.; Tobler, W.R. Map Projection Transformation, Principles and Applications; Taylor & Francis: London, UK, 2000. [Google Scholar]
- Snyder, J.P. Calculating Map Projections for the Ellipsoid. Am. Cartogr. 1978, 6, 67–76. [Google Scholar] [CrossRef]
- Pallikaris, A. Methods of transforming the ellipsoid of revolution onto the surface of a sphere (in Greek). Nausivios Chora 2014, 4, 137–152. [Google Scholar]
- Snyder, J.P. Map Projections: A working manual. In US Geological Survey Professional Paper 1395; Government Printing Office: Washington, DC, USA, 1987; pp. 86–89. [Google Scholar]
- Maling, D.H. Coordinate Systems and Map Projections, 2nd ed.; George Philip and Son, Pergamon Press: Oxford, UK, 1992. [Google Scholar]
- Snyder, J.P.; Voxland, P.M. An album of map projections. In U.S. Geological Survey Professional Paper 1453; United States Government Printing Office: Washington, DC, USA, 1989. [Google Scholar]
- Haiwara, T. Proposal on the modification of sailing calculations. J. Navig. 1987, 40, 138–148. [Google Scholar] [CrossRef][Green Version]
- Battersby, S.E.; Finn, M.P.; Usery, E.L.; Yamamoto, K.H. Implications of web Mercator and its use in online mapping. Cartogr. Int. J. Geogr. Inf. Geovis. 2014, 49, 85–101. [Google Scholar] [CrossRef]


© 2020 by the authors. Licensee MDPI, Basel, Switzerland. This article is an open access article distributed under the terms and conditions of the Creative Commons Attribution (CC BY) license (http://creativecommons.org/licenses/by/4.0/).