Article

A Tidal Hydrodynamic Model for Cook Inlet, Alaska, to Support Tidal Energy Resource Characterization

Pacific Northwest National Laboratory, 1100 Dexter Avenue North, Suite 500, Seattle, WA 98109, USA
*
Author to whom correspondence should be addressed.
J. Mar. Sci. Eng. 2020, 8(4), 254; https://doi.org/10.3390/jmse8040254
Submission received: 21 March 2020 / Accepted: 31 March 2020 / Published: 4 April 2020

Abstract

:
Cook Inlet in Alaska has been identified as a prime site in the U.S. for potential tidal energy development, because of its enormous tidal power potential that accounts for nearly one-third of the national total. As one important step to facilitate tidal energy development, a tidal hydrodynamic model based on the unstructured-grid, finite-volume community ocean model (FVCOM) was developed for Cook Inlet to characterize the tidal stream energy resource. The model has a grid resolution that varies from about 1000 m at the open boundary to 100–300 m inside the Inlet. Extensive model validation was achieved by comparing model predictions with field observations for tidal elevation and velocity at various locations in Cook Inlet. The error statistics confirmed the model performs reasonably well in capturing the tidal dynamics in the system, e.g., R2 > 0.98 for tidal elevation and generally > 0.9 for velocity. Model results suggest that tides in Cook Inlet evolve from progressive waves at the entrance to standing waves at the upper Inlet, and that semi-diurnal tidal constituents are amplified more rapidly than diurnal constituents. The model output was used to identify hotspots that have high energy potential and warrant additional velocity and turbulence measurements such as East Foreland, where averaged power density exceeds 5 kw/m2. Lastly, a tidal energy extraction simulation was conducted for a hypothetical turbine farm configuration at the Forelands cross section to evaluate tidal energy extraction and resulting changes in far-field hydrodynamics.

1. Introduction

In recent decades, the interest in harnessing energy directly from tidal streams with marine hydrokinetic (MHK) devices has been renewed in many countries [1,2]. Compared to other renewable energy sources, such as wind and solar power, tidal energy is highly predictable in time and space [3]. It thus can potentially serve as a dependable, clean energy resource for suitable tidal systems. A growing number of studies that involve laboratory experiments, computational modeling, as well as field measurements and device testing have been conducted worldwide [4,5,6,7,8,9,10,11]. To date, however, very few tidal turbines have been deployed in the field to harness tidal energy from natural tidal flows for commercial or operational use, due to various reasons, including concerns of the high operational cost and potential environmental risk. The MeyGen project in Scotland [12] is among the pioneering projects in which extracting tidal energy from tidal streams becomes operational and is also connected to the electric grid. In comparison, most other efforts have been largely focused on the earlier stage of tidal energy development, such as characterizing available tidal energy resources using computational models and testing MHK devices in the laboratory and at representative field-testing sites [13,14,15,16].
In the U.S., the first nationwide assessment of tidal stream energy production potential was released in 2011 [17]. In this assessment, the Regional Ocean Modeling System (ROMS) was applied to more than 50 individual coastal subdomains along the U.S. coastline. The findings suggest that the state of Alaska has the most abundant tidal energy resource in the country. For instance, the estimated theoretical available power for Cook Inlet alone exceeds 18 GW, which accounts for nearly one-third of the national total. Because of its great tidal energy potential, Cook Inlet is regarded as a prime site for future tidal energy project development; hence, it warrants more detailed site characterization using fine-resolution numerical modeling and monitoring practices.
Coastal circulation models have been widely used to support earlier-stage tidal energy development by providing a large-scale assessment of theoretically and practically available tidal energy resources, as well as the potential physical impact of energy extraction [5,6,8,11,17,18,19,20,21,22,23,24,25]. In these studies, both structured-grid and unstructured-grid coastal circulation models have been used. However, models based on an unstructured-grid framework also have a unique advantage, because they can be readily refined at local scales to a spatial resolution comparable to marine and hydrokinetic (MHK) devices. For instance, in a study conducted by Rao et al. (2015) [26] to specifically investigate the tidal turbine farm efficiency in the Western Passage of the Gulf of Maine, the minimum grid size used for turbine arrays is about 20 m, the same as the turbine dimensions, while the maximum grid size reaches 5 km at the open boundaries. Therefore, the unstructured-grid models can provide an efficient solution for obtaining a more detailed resource characterization for top tidal energy candidate sites in the U.S. (e.g., Cook Inlet), which often require various levels of grid refinement at local scales to meet different research and project needs.
The objective of this study was to develop and validate an unstructured-grid, tidal hydrodynamic model framework for Cook Inlet, Alaska to support tidal energy research in this energetic tidal system. Compared to the first nation-wide tidal energy resource assessment by Haas et al [17], this study uses an unstructured-grid modeling approach. The model grid can be easily refined on an as-needed basis at local scales to provide a higher-resolution representation of tidal velocity and energy resource distributions at potential energy hotspots. Thus, this model can serve as a flexible and useful tool to support a variety of tidal-energy related research activities in Cook Inlet. As the first step, this study summarizes the model development, calibration and validation processes. In the current phase, the tidal hydrodynamic model was calibrated using observational data for both tidal water level and currents, and then was used to characterize tidal dynamics and tidal energy distribution in Cook Inlet. In the future, the unstructured model grid will be further refined for top energy hotspots to provide device-resolution (e.g., on the order of meters) velocity and turbulence profiles to assist with turbine farm siting and field measurement planning.

2. Methods

2.1. Study Site

Cook Inlet is a major estuary in the U.S. state of Alaska; it stretches roughly 300 km from the Gulf of Alaska to the Municipality of Anchorage (the largest city in Alaska) in south-central Alaska (Figure 1). At its northern end, Cook Inlet branches into Knik and Turnagain Arms surrounding Anchorage. At its south entrance, the Inlet extends and merges into Shelikof Strait and the Gulf of Alaska. Cook Inlet has many glacial-fed tributaries that have carried enormous quantities of sediment into the estuary. The sediment formed intertidal mud flats, which are especially predominant near the northern end of the Inlet, including the Knik and Turnagain Arms and the Susitna River Delta [27], and also pose a challenge for acquiring accurate bathymetry datasets.
The inlet has long been regarded as one of the top candidates for tidal energy development (e.g., [17,27,28]) because of its extremely large tidal ranges. For instance, the Turnagain Arm near the northern end has the largest tidal range in the U.S.; it has a mean of 9.2 m. Tidal fluctuations in the main body of Cook Inlet, while not as extreme as those in the shallow and narrow Turnagain Arm, regularly reach 7 m or higher during the spring tide. In addition, Cook Inlet has a distinct advantage in terms of tidal energy development potential because of its adjacency to Alaska’s industry and population centers, as well as the state’s primary power grid—the Railbelt power grid that powers Anchorage, Fairbanks, and Alaska’s south-central region [28].
In Cook Inlet, water levels are continuously monitored by three tidal gages operated by the National Oceanic and Atmospheric Administration (NOAA). From the south entrance to the north end, these three stations are located near Seldovia, Nikiski, and Anchorage (Figure 1), and they roughly capture the tidal range distributions inside Cook Inlet. In addition, NOAA has conducted a series of current surveys using Acoustic Doppler Current Profilers (ADCPs) in the summer months between 2005 and 2012. These surveys covered many locations in the Cook Inlet region, including data acquired from a total of 39 stations inside Cook Inlet. For this study, we chose Year 2005 as the model calibration period, because the current survey in 2005 has the best spatial coverage among all the years. In addition, we chose Year 2012 as the model validation period, because it provides the second-best spatial coverage that complements those survey stations in Year 2005. Table 1 summarizes those selected current survey stations used for model-data comparisons. Among the total of nine stations, three stations (COI0501, COI0502, and COI0503) are located in the Foreland cross section (Figure 1), a natural restriction formed by two opposing peninsulas, namely East and West Forelands, to capture the complex and strong currents there.

2.2. Hydrodynamic Model

The hydrodynamic model used for this study is the unstructured-grid, finite-volume, community ocean model (FVCOM) [29,30]. As a general-purpose coastal ocean model, FVCOM simulates water surface elevation, velocity, salinity, temperature, and other scalar constituents in an integral form by computing fluxes between non-overlapping horizontal triangular grid cells. By using the unstructured-grid framework in the horizontal plane, and a sigma-stretched coordinate system in the vertical direction, the model is especially suitable for resolving the complex geometry in estuaries and coastal oceans [31,32,33]. It also provides the flexibility for refining computational grid locally in regions of interest, such as tidal energy hotspots.
To simulate tidal energy extraction, a MHK module was implemented in the FVCOM model based on the momentum sink approach [10]. The MHK module was validated against the analytical solution [10] and laboratory experiments [34], and has also been subsequently applied to studying tidal energy extraction and associated environmental impacts [11,35,36]. The modified governing equations in FVCOM with added momentum sink terms due to tidal energy extraction have the following general form [10]:
u t + u u x + v u y + w u z fv = 1 ρ o p x + z ( K m u z ) + F x   F x M
v t + u v x + v v y + w v z + fu = 1 ρ o p y + z ( K m v z ) + F y F y M
where (x, y, z) are the east, north, and vertical axes in the Cartesian coordinates; (u, v, w) are the three velocity components in the x, y, and z directions; (Fx, Fy) are the horizontal momentum diffusivity terms in the x and y directions; Km is the vertical eddy viscosity coefficient; ρ is water density; p is pressure; and f is the Coriolis parameter. F M = ( F x M , F y M ) are the turbine-induced momentum sink terms in the x and y directions and are defined as follows:
F M = 1 2 C T A V c | u | u
where Vc is the momentum control volume, CT is the turbine thrust coefficient, A is the flow-facing area swept by turbines, and u is the velocity vector at turbine hub height. The total extracted tidal power at any given time can be calculated using the following formula:
P total = i = 1 M ( N × 1 2 ρ C T A | u | 3 ¯ ) i
where N is the number of turbines in each grid element and M is the total number of elements containing turbines.

2.3. Model Configuration

The Cook Inlet hydrodynamic model domain covers the entire Cook Inlet with grid resolution (i.e., side length of triangular grid cells) varying from about 1000 m at the entrance to less than 300 m inside the Inlet. In terms of element area, they are roughly equivalent to a side length of 660 m and 200 m, respectively, for equilateral structured-grid cells. In channels and areas that have steep bathymetry gradients, a finer grid resolution of 100–300 m was used. The model grid consists of approximately 120,000 nodes and 240,000 triangular elements in the horizontal plane. In the vertical direction, 10 uniform sigma layers were applied. Although higher spatial resolutions can be used in both the horizontal and vertical planes, the adopted resolutions are adequate to fulfill the need for this initial phase of tidal hydrodynamic model development and validation. Model bathymetry was interpolated from the NOAA Alaska Fisheries Science Center’s 50 m resolution Cook Inlet bathymetry data set [37]. The horizontal and vertical mixing schemes were based on the default Smagorinsky parameterization and Mellor-Yamada level 2.5 turbulent closure in FVCOM, respectively [38]. The bottom drag coefficient was calculated using the default option based on the logarithmic boundary layer assumption. The user-specified bottom roughness height and minimum bottom drag coefficient were treated as the calibration parameters with their values fine-tuned through the process of model calibration.
To simulate tidal hydrodynamics and characterize the tidal energy resource in Cook Inlet, the prescribed open boundary tidal elevations were considered the primary external forcing in the model. Specifically, the open boundary tidal elevation time series were obtained from Oregon State University’s TPXO8-atlas tidal database [39], which consists of 13 major harmonic constituents, namely M2, S2, N2, K1, O1, P1, Q1, M4, MS4, MN4, Mm, and Mf. In addition, all model runs were conducted in the barotropic mode, without considering the effect of water density variation caused by salinity and temperature. River discharge and meteorological forcing were not included in the current study either. Although these factors/processes could be important in modulating the transport processes, their contribution to tidal hydrodynamics is generally small considering the extremely large tidal ranges in Cook Inlet.

3. Results and Discussion

3.1. Model Calibration

Since this study is focused on tidal-driven hydrodynamics in Cook Inlet, model calibration was achieved by adjusting user-specified parameter values that directly control tidal wave propagation in the system through a series of iterative model runs. In FVCOM, these parameters include bottom roughness height and minimum bottom drag coefficient for the bottom boundary condition, as well as the sponge layer radius and friction coefficient for the open boundary condition. For instance, the sponge layer is typically specified as a damping zone weighted from the open boundary nodes to the interior, with a specified influence radius and a friction coefficient to ensure that the radiation boundary condition will also suppress the noise perturbation of wave energy reflected back to the computational domain [38]. During the model calibration, the sponge layer parameters were first adjusted to obtain an overall reasonable comparison between model predictions and field observations at three NOAA tidal gauges and six selected ADCP stations in Year 2005. The bottom roughness height and minimum bottom drag coefficient were further adjusted to fine-tune water level comparisons at individual tidal gauges and ADCP stations. Through the course of model calibration, to quantify the model’s performance and to help identify the best set of model calibration parameters, three representative error statistical parameters, the root-mean-square-error (RMSE), the scattered index (SI), and the coefficient of determination (R2), were calculated using the following equations for both water elevation and currents, following each iterative model run.
The RMSE, or root mean square deviation, represents the sample standard deviation of the differences between predicted values and measured values. It is defined as
RMSE = i = 1 N ( P i M i ) 2 N
where N is the number of observations, M i is the measured value, and P i is the predicted value.
The SI is defined as the normalized RMSE (i.e., NRMSE) by the average of all measured values. Because water level and velocity can both be negative, the absolute values were used in this study to calculate the mean of the measured values.
SI = R M S E M ¯
where the overbar indicates the mean of the measured values.
The R 2 is a measure of the strength of the linear relationship between the predicted and measured values. In this study, R 2 was tested at the significance level of 0.05.
R 2 = ( i = 1 N ( M i M ¯ ) ( P i P ¯ ) ) 2 ( i = 1 N ( M i M ¯ ) 2 ) ( i = 1 N ( P i P ¯ ) 2 )
It was found that tidal range and current speed in Cook Inlet was very sensitive to open boundary sponge layer parameterization. A combination of a uniform sponge layer radius of 1500 m and a friction coefficient of 0.0012 produced the best overall model-data comparisons at all calibration stations. The bottom roughness height and the minimum bottom drag coefficient tended to affect more on the tidal phase and magnitude toward the upper Inlet. The final parameter values for the bottom roughness height and minimum bottom drag coefficient were both set as 0.005, based on the calibration results.

3.1.1. Tidal Elevation

Figure 2 shows the time-series comparisons of FVCOM predictions and NOAA observations at three NOAA tidal gages during a two-week spring-neap cycle in May 2005. As indicated by the error statistical parameters, the model-predicted tidal elevations match NOAA predictions very well at all stations; the R2 is greater than 0.98 at all three gages. The spring-neap tidal cycle was successfully reproduced by the model. In general, tides inside Cook Inlet are semi-diurnal—two unequal high and two unequal low tides occur per tidal day (24 h and 50 min). The tidal range also increases rapidly from Seldovia near the entrance to Anchorage in the upper Inlet. For instance, at Anchorage, the tidal range exceeds 10 m during the spring tide (Figure 2c).
To further assess the model’s skills in capturing individual tidal constituents, harmonic analysis for major tidal constituents was performed, and the results are presented in Figure 3. First, there is an overall good agreement between model predictions and field observations for both amplitude and phase at all three tidal gages. Second, the results confirmed that tides in Cook Inlet are dominated by semi-diurnal constituents, as indicated in Figure 2. For example, the form ratio (the ratio between the sum of the amplitudes of the two main diurnal constituents K1 and O1, and that of the two main semi-diurnal constituents M2 and S2) varies from to 0.30 at Seldevia to 0.23 at Anchorage, suggesting the increasing dominance of semi-diurnal tides toward the upper Inlet.
There is a general trend suggesting the amplification in tidal amplitude from the Inlet entrance to the upper inlet was slightly over-predicted by the model. In Figure 3a, tidal amplitude for most tidal constituents is under-predicted at Seldevia, but becomes over-predicted at Anchorage. However, the differences between predicted and observed values are very small, and mostly are on the order of a few centimeters. For instance, the maximum difference is for the M2 constituent at Anchorage, which is 0.21 m but only accounts for about 6% of the tidal amplitude. At Nikiski, there is a near perfect match between predicted and observed tidal amplitude for all seven tidal constituents. Interestingly, Figure 3a shows that the amplification in tidal amplitude responds differently in diurnal and semi-diurnal constituents. In general, the semi-diurnal constituents become much more amplified than the diurnal ones, which should be largely a result of the basin geometry (e.g., length and depth) of Cook Inlet. The same pattern also holds for the tidal phase. For example, the phase lag between Seldevia and Anchorage for the M2 constituent is nearly 140 degrees, but it is less than 60 degrees for the K1 constituent.
Overall, the differences between predicted and observed tidal phases are mostly on the order of a few degrees for major tidal constituents. The error statistics suggest that model-predicted tidal elevations match NOAA observations generally better than those (e.g., an average of 10% over-prediction in M2 amplitude) reported in the earlier study [17]. For example, in the earlier study [17], the amplitude difference for M2 constituent between model prediction and field observation at Nikiski tidal gage was 0.17 m (or 7% less than the observed value). In comparison, the difference in this study was reduced to 0.01 m (or 0.4%). In addition, the same trend was found for phase predictions, i.e., a 12-minute phase difference in this study vs. a 25-min difference in the earlier study [17].

3.1.2. Tidal Velocity

The ADCP data in Cook Inlet mainly cover the middle-depth bins, and a substantial portion of the surface and bottom depths is missing, likely as a result of the removal of bad-quality data during the QA/QC process. To accurately compare model output with observations, the FVCOM velocity was interpolated in space and time onto each depth bin of the ADCP data. The interpolated model velocity and ADCP data were averaged over the water depth and compared. Error statistics were calculated to quantify the model’s performance in simulating observed currents.
Figure 4 shows the scatterplot comparisons of depth-averaged velocity at six representative ADCP stations in Cook Inlet. At all stations except for Station COI0501 located near West Foreland, the model was able to capture current magnitude and direction reasonably well. The results also indicate that at most stations, currents tend to flow in a well-defined direction (i.e., along the principal axis) that aligns with the channel orientation, especially at Station COI0511. In comparison, tidal currents at Stations COI0514 and COI0502 appear to be more in a circular nature. The observed currents at Station COI0501 show distinct flow directions between flood and ebb. During the flood, the currents are generally toward the northwest direction while during the ebb, currents are more toward the southwest direction. The model was not able to accurately capture the observed flow pattern there. The results also indicate that depth-averaged maximum current magnitude exceeds 2 m/s at nearly all the stations except for Station COI0514, which is located near the entrance of the Inlet.
The error statistics were calculated for the east and north velocity components, respectively, to quantify the model’s performance in simulating tidal currents. The results are provided in Table 2. Overall, there is a very good correlation between model predictions and observations, i.e., 10 of 12 R2 values are greater than or equal to 0.9. As expected from the scatterplot comparisons in Figure 4, Station COI0501 has the worst correlation for the east component, as the model failed to capture the flows across the channel (east-west direction). By looking at the RMSE and SI values together, the absolute errors (RMSE) tend to be larger for the major velocity components, while the relative errors (SI) are comparably smaller at most stations. For example, at Station COI0503, where the north-south velocity is the major velocity component, the corresponding RMSE is bigger than that of the east-west component. In contrast, the SI shows the exact opposite result. This suggests that the model tends to simulate velocity better in the main flow directions. Depending on the location of the station, the RMSE can vary from 0.07 m/s to as big as 0.31 m/s, but most RMSEs are under 0.2 m/s.

3.2. A Sensitivity Test on the Effect of Grid Resolution

The calibration results (Figure 5 and Table 3) show that the discrepancy between model predictions and field observations becomes larger at those three ADCP stations located in the Foreland region. This discrepancy is especially apparent at Station COI0501—the data indicate there is a clear rectilinear misalignment between flood and ebb current directions while the model predictions did not reproduce the same pattern. We suspected that a grid resolution of 200 m might not be adequate to resolve the complex channel geometry there. Therefore, a sensitivity test was conducted by refining the grid resolution to about 50 m in the Foreland region to assess if an increased spatial resolution will help improve current predictions. A model grid resolution of 50 m matches the resolution of the bathymetry dataset, and was thus considered sufficient to capture the geometry feature represented by the bathymetry data. The sensitivity test results for the same calibration period were compared with the earlier model results and field observations and presented in Figure 5 and Table 3.
As one can see from Figure 5, the sensitivity test results did not show any substantial improvement over the previous model results. The new model results mostly overlay with those in the calibration run. The error statistics also largely remain the same (Table 3). We suspect this should be due to the insufficient accuracy of the bathymetry dataset in the Foreland region and the upper Inlet. Although the bathymetry dataset used for this study has a relatively high nominal spatial resolution of 50 m, it should be noted that this dataset was largely re-produced (or re-gridded) from historical bathymetry surveys in Cook Inlet. Hence, the bathymetry data couldn’t sufficiently capture the dynamic changes of bed morphology in the Foreland region contributed by the interplay of the large amount of sediment input and energetic tidal currents. It is reasonable to conclude that without more accurate bathymetry information, a further refinement of the model grid resolution will not help improve velocity predictions.

3.3. Model Validation

Model validation is another important step in hydrodynamic modeling. In this study, we picked Year 2012 as model validation period. Since the sensitivity test using the refined model grid did not show any substantial improvement in velocity predictions, we chose to use the same model grid used for the baseline calibration model run for the validation run. The model predicted current velocities at three additional ADCP stations deployed in Year 2012, and these were compared with NOAA observations. The model-data comparisons were summarized in Figure 6 and Table 4. At Station COI1210, the model predictions match field observations nearly perfect over a full-month period (Figure 6a). The model performance becomes worse for the other two ADCP stations located further upstream. For example, the results at Station COI1207, the velocity magnitude is substantially under-predicted (Figure 6b), which can be seen from the large RMSE (0.58 m/s) and SI (0.48) values. Despite of underpredicting current magnitude, the model performs very well in predicting current direction. At Station COI1209 (Figure 6c), the model was not able to accurately resolve the moderate rectilinear misalignment between flooding and ebbing current directions. A closer look at the bathymetry feature near these two ADCP stations indicates the mismatch between model predictions and field observations is likely due to the inaccuracy of the bathymetry dataset (Figure 7). For example, the existing bathymetry dataset shows the presence of a shallow sill in the middle of the channel that is adjacent to COI1207. This shallow sill will reduce tidal flows through the channel and subsequently contribute to the underprediction of current magnitude at COI1207. A high-quality, ground truthing bathymetry survey in the upper Cook Inlet is highly warranted to improve model predictions.

3.4. Tidal Characteristics

As shown in Figure 3, tides in Cook Inlet are dominated by semi-diurnal constituents. It is important to see how tides propagate within the system and amplify toward the upper Inlet to produce the largest tidal ranges of all U.S. coastal waters. According to the co-tidal charts (Figure 8a,b) for the largest semi-diurnal and diurnal constituents (M2 and K1), M2 tide is more amplified than K1, which also agrees with earlier observations at three NOAA tidal gages (Figure 2). For the tidal phase (Figure 8c,d), M2 tide shows a much greater phase change than K1 constituent, which is consistent with the amplitude. The co-phase chart for M2 tide (Figure 8c) suggests the length of Cook Inlet is smaller but close to the half wave length of M2 constituent. Also, the narrowed Foreland cross section appears to be the critical location that substantially affects tidal propagation in Cook Inlet. Above the cross section, tidal amplitude and phase both change much more rapidly than in the lower Inlet.
The tidal stage plots (Figure 9) provide additional information on the tidal characteristics in Cook Inlet. Together with the co-tidal charts (Figure 8), the results suggest that tides are essentially progressive Kelvin waves in the lower Inlet, and that they propagate faster toward the right (east) side of the channel along with larger amplitudes. Tidal velocity tends to be in phase with the water level; the maximum tidal velocity occurs during low and high tides (Figure 9a–c). The co-tidal lines also appear to lie perpendicular to co-range lines (Figure 8). In the upper Inlet region above the Foreland cross section, tides behave more like standing waves; e.g., maximum velocities tend to occur toward the mean tidal level rather than during the low and high tides (Figure 9d–f).

3.5. Spatial Variability of Tidal Currents

Because optimal turbine siting (e.g., hub height) relies on detailed knowledge of vertical velocity structure, it is important to further examine vertical current profiles at potential tidal energy hotspots in Cook Inlet. The depth-averaged velocity comparisons (Figure 4) suggest that Station COI0503 near East Foreland appears to be the top hotspot because it has the strongest current magnitude of all the stations. Figure 10 shows the 2-D current vertical profile comparisons at Station COI0503 on 25 May 2005, during the spring tide. It should be mentioned that the currents have been projected along the principal-axis direction to better show the current magnitude. The model-data comparisons show an overall good match with respect to the vertical structure and timing. The model results indicate that maximum current magnitude exceeds 4 m/s during peak flood and ebb at depths close to the surface. There are visible velocity gradients especially during the peak flood and ebb stages; e.g., the maximum differences between surface and bottom velocities reaches 1.5 m/s during peak flood around noon on 25 May 2005.
A detailed understanding of the temporal distribution/variability of tidal velocity provides critical information for optimizing tidal turbine device selection and operation [40]. Figure 11a shows the histogram plot of the density/frequency distribution of depth-averaged current speed at Station COI0503 over a three-month simulation period. The corresponding probability of exceedance curve is provided in Figure 11b, with additional results at three depths—surface layer, middle layer, and bottom layer. The histogram plot (Figure 11a) shows that current speed mostly ranges from 1 m/s to 3 m/s at Station COI0503, and has a peak density between 2 and 2.5 m/s. The probability of exceedance plot (Figure 11b) suggests the current speed exceeds 1 m/s more than 75% of the time. In addition, comparing the probability of exceedance plots at different depths indicates that the current speed for the bottom layer is much smaller than at the other depths. This is consistent with what we observed in the vertical profile plot (Figure 10). The depth-averaged current speed distribution appears to be very close to that found at the middle depth. As expected, surface current is the strongest of all the depths—current speed exceeds 2 m/s for more than half of the time.

3.6. Tidal Energy Extraction Potential in Cook Inlet

3.6.1. Tidal Energy Resource Distribution

In the previous sections, we demonstrated that the hydrodynamic model was able to capture the tidal hydrodynamics in Cook Inlet. For this reason, the model simulation results were further used to characterize tidal energy resource distribution in the system. Figure 12 shows the 2-D distribution of depth-averaged tidal power density (or energy density flux) in the entire system and in the zoom-in area near Foreland. The 2-D plots suggest that the areas that have high energy density (i.e., >2000 W/m2) are mostly located in the upper Inlet. The Foreland area appears to have the most abundant tidal energy resources in the entire system, both in terms of magnitude and spatial coverage, primarily as a result of the much narrower cross section due to the presence of two forelands. More specifically, the area immediately adjacent to East Foreland has the strongest power density, which exceeds 5000 W/m2. Considering that water depth is typically on the order of 50 m in this area, it should be the top hotspot for potential tidal energy harnessing. It has a substantially larger tidal stream power density sustained over a very large area. This is consistent with previous findings by Haas et al. [17].

3.6.2. Assessing Tidal Energy Extraction Potential

While the East Foreland region appears to be the most promising site for tidal energy harnessing, it is also important to assess the possibility of extracting tidal energy at a much broader spatial scale to effectively reduce the energy cost. As suggested by the inset plot in Figure 12, a substantial portion of the Foreland area has a power density exceeding 2000 W/m2. Therefore, a sensitivity test was conducted by deploying hypothetical turbine arrays along one single transect across the entire Foreland cross section. Two tidal turbine array scenarios were considered. In both scenarios, tidal turbines were assumed to extract energy from the middle depths (Layers 5 and 6 in the hydrodynamic model) of the water column. More specifically, in Scenario 1 (S1), a 5% blockage ratio of the entire cross-sectional area was used to determine the tidal array density along the transect. In Scenario 2 (S2), a much higher (20%) blockage ratio was used. It should be mentioned that in both scenarios, the blockage ratios are higher than typical values reported in the literature, because in our case tidal turbines are only considered to occupy one cross section. In both scenarios, the tidal turbine module was configured in a way similar to that in [20]; e.g., a thrust coefficient (CT) of 0.5 was used, and no cut-in and cut-out speed limit was considered [20].
Figure 13 shows the instantaneous extracted tidal power time series under both energy extraction scenarios. The extracted power was calculated using Equation 4. The extracted tidal power time series exhibit strong temporal variability over spring and neap tidal cycles. The extracted power during the spring tide is nearly an order of magnitude higher than that during the neap tide. The maximum instantaneous power rate during the spring tide is close to 180 MW and 800 MW for S1 and S2, respectively. The mean power rate for S1 and S2 is approximately 46 MW and 181 MW, respectively. The extracted power rate in S2 is considerably larger than that in S1. It should be noted that this power extraction rate is only a theoretical value calculated by the hydrodynamic model.
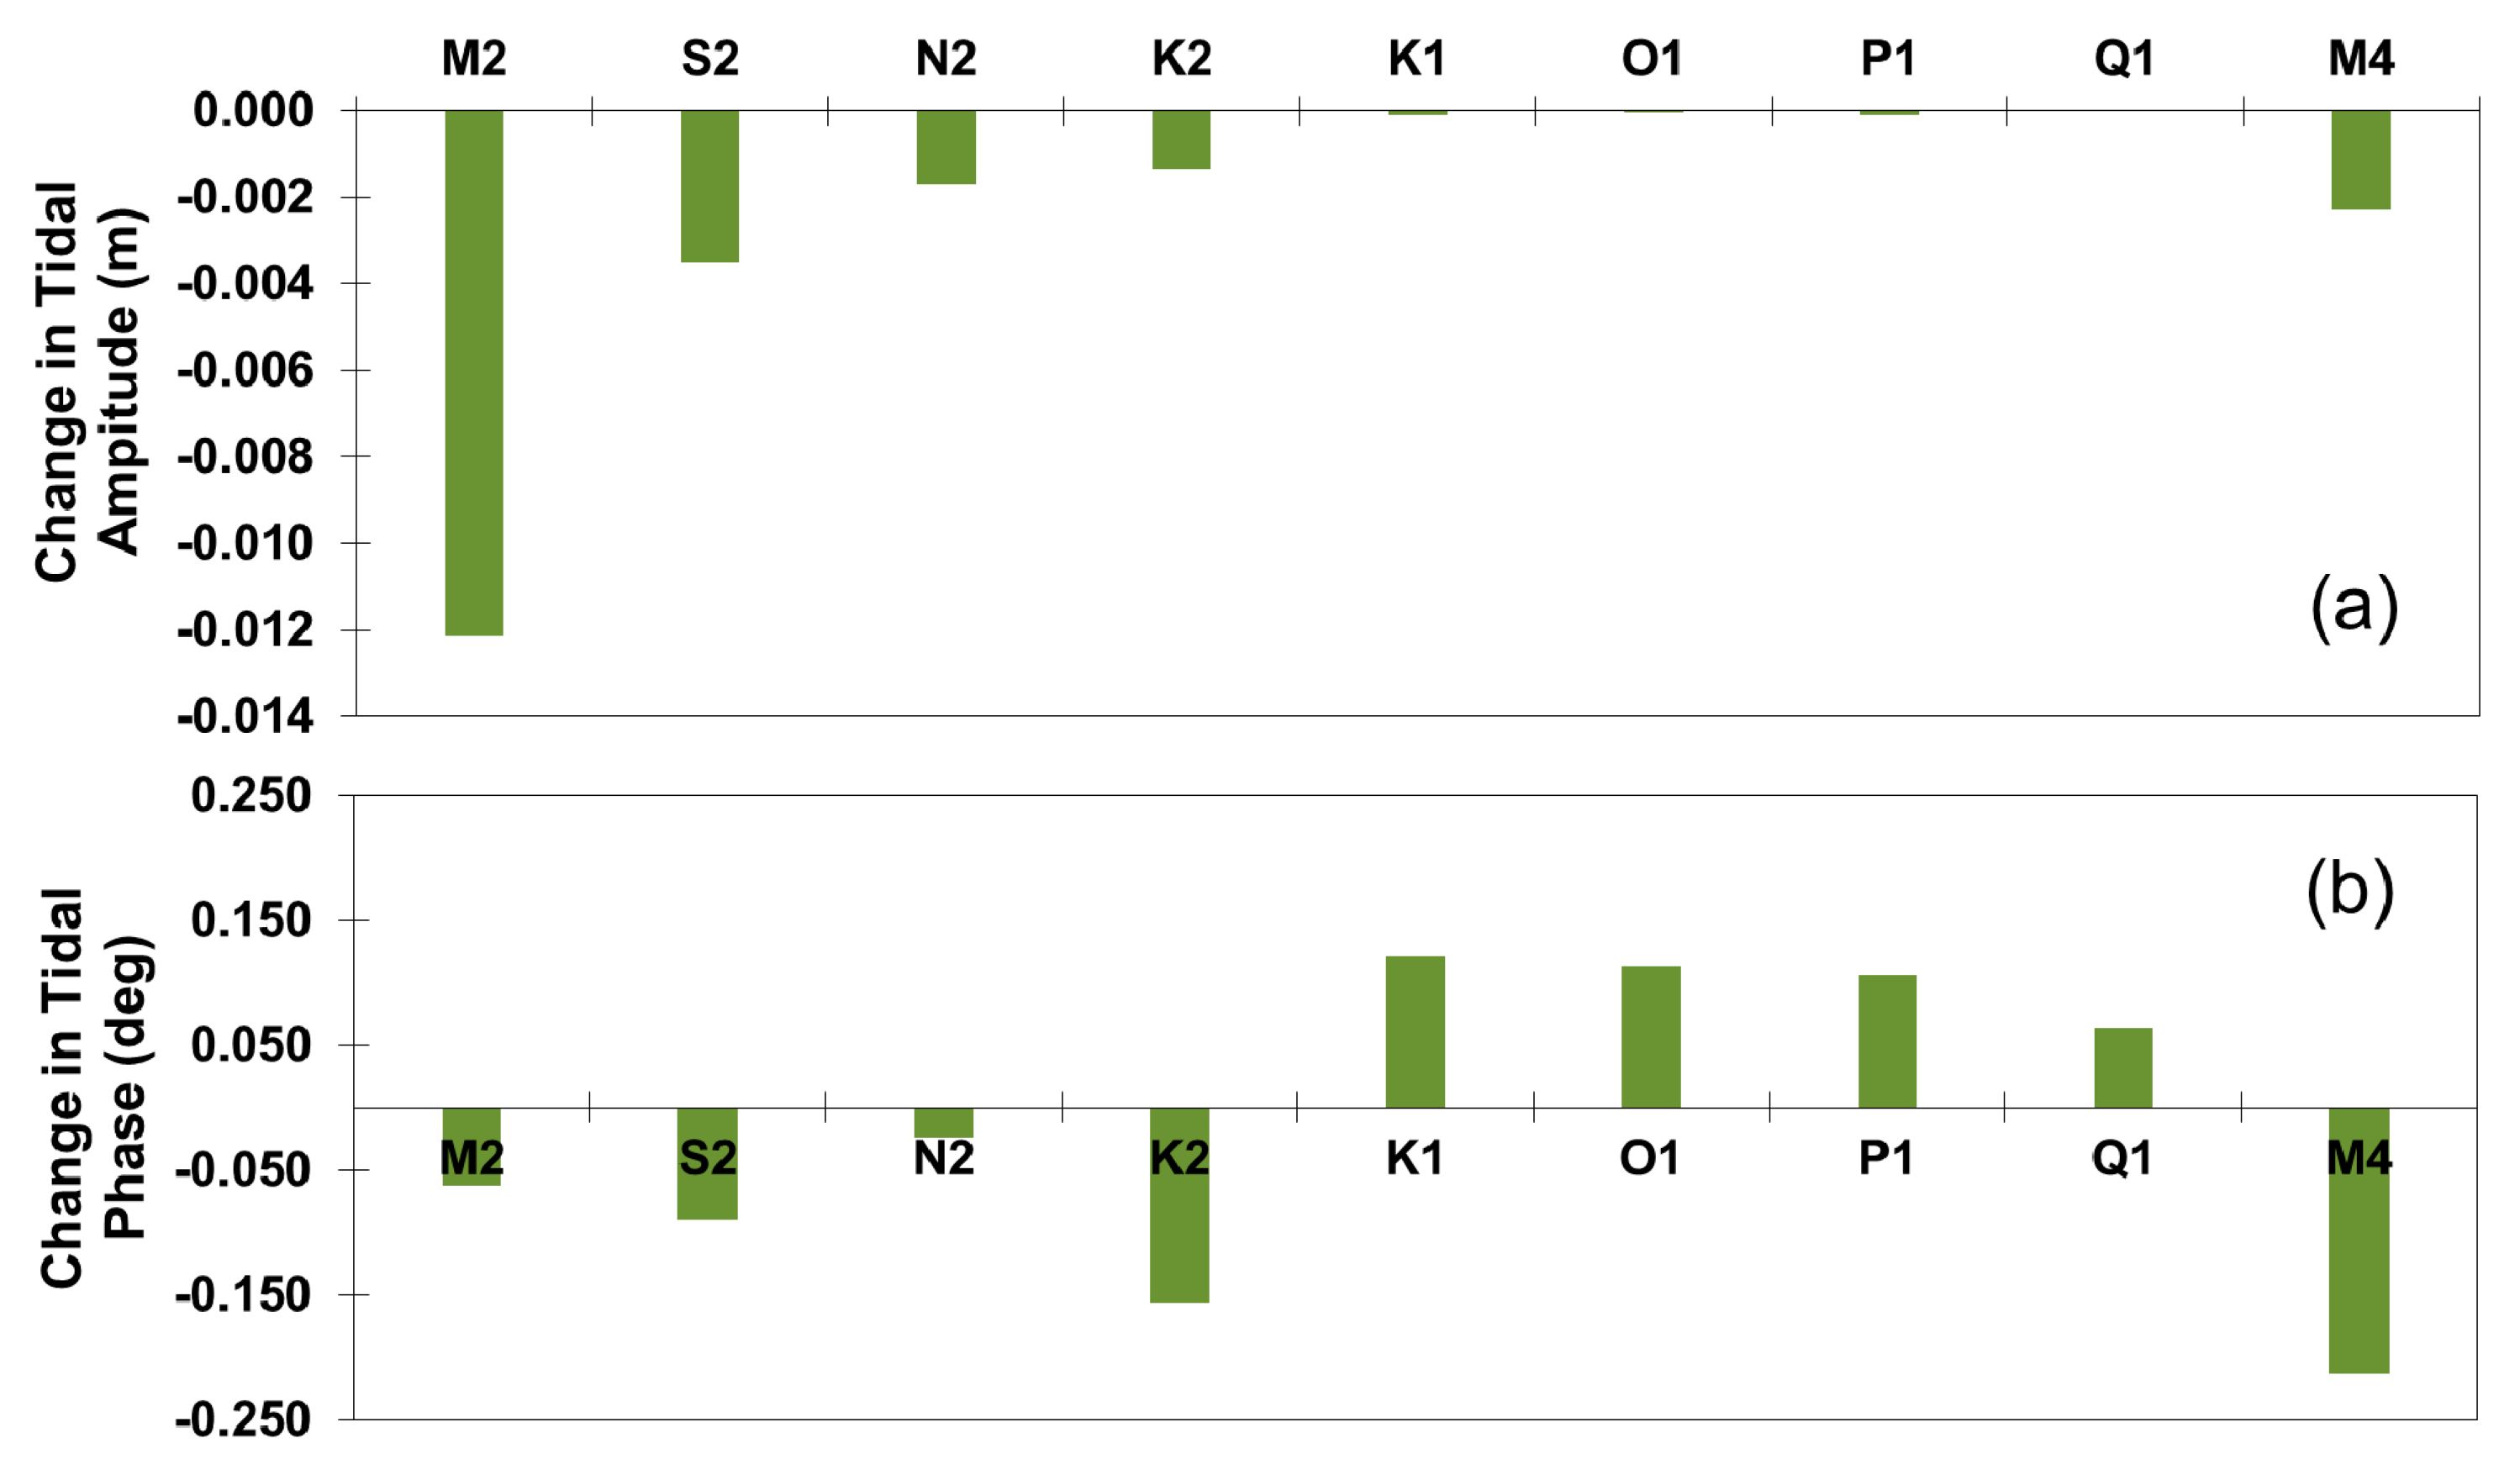
It is important to investigate the system’s response to energy extraction. One potential response is the changes (i.e., sensitivity-baseline) in tidal regime. We calculated the changes in tidal amplitude and phase for major tidal constituents between power extraction scenarios and the baseline condition at all three NOAA tidal gages in Figure 1. The results suggest that the resulting changes at the two southern gages, Seldovia and Nikiski, are minimal. In addition, the changes for S1 are barely detectable. Hence, only the results for S2 and at the Anchorage tidal gage are presented here to illustrate the potential impact of energy extraction (Figure 14).
Figure 14a shows that extracting tidal energy from the Foreland transect reduced tidal amplitude in the upper inlet. However, the magnitude of change is very small for the energy extraction rate in S2. The M2 constituent experiences the maximum amplitude drop of all constituents, but the reduction is only on the order of 1 cm. Compared to its amplitude, the reduction ratio is only about 0.3%. The higher-frequency constituents, which include four semi-diurnals (M2, S2, N2, and K2) and one quarter-diurnal (M4), exhibit a larger amplitude drop than the four diurnal ones (K1, O1, P1, and Q1). This is expected, considering that higher-frequency tidal currents tend to be dampened faster by friction force, or turbine drag in this case. Interestingly, the changes in tidal phase (Figure 14b) also shows a similar pattern in which semi-diurnal and quarter-diurnal constituents respond differently from the diurnal ones. Specifically, the negative changes in tidal phase for semi-diurnal and quarter-diurnal constituents suggest these tidal constituents propagate faster than the baseline condition. In contrast, all the diurnal constituents experience a phase lag, meaning they propagate slower than the baseline condition. However, the changes in tidal phase are also very small—all are less than a quarter degree.
The reduction in tidal amplitude affects tidal prism in the upper inlet, which is also reflected in the tidal flux across the Foreland transect. Figure 15 shows the changes in tidal flux between two energy extraction scenarios and the baseline condition. Compared to tidal flux under the baseline condition that varies between ±1.7 × 10⁶ m3/s across the Foreland transect, the changes in tidal flux for both energy extraction scenarios is much smaller. For instance, the maximum flow reduction typically occurs during the peak and ebb flood stages when the tidal flux is highest.

4. Summary

In this study, an unstructured-grid based tidal hydrodynamic model was developed for Cook Inlet, Alaska, to assist tidal energy resource characterization in the estuary. The model-data comparisons indicated that the model has very promising skills in capturing the major tidal characteristics of Cook Inlet; e.g., a semi-diurnal tidal regime with tidal range rapidly amplifying toward the upper Inlet. The model simulated tidal energy density distribution confirms the abundant tidal energy potential in Cook Inlet especially in the East Foreland region where time- and depth-averaged power density exceeds 5 kw/m2. This region should be considered as the most promising tidal energy hotspot in Cook Inlet. Furthermore, a model test with a hypothetical tidal turbine farm configuration in the Foreland cross section indicates the upper Inlet is most sensitive to tidal energy extraction; higher-frequency tidal constituents (e.g., semi-diurnal and quarter-diurnal) experience more impact than low frequency (diurnal) constituents, although the overall impact on tidal dynamics is minimum for the hypothetical energy extraction scenario considered in this study. Compared to the earlier tidal resource assessment by Haas et al. [17], the unstructured-grid modeling approach provides an additional flexibility for future grid refinement at any local scales and resolutions on an as-needed basis.
The model results also suggest that, to better capture the spatial variability of currents in areas that have complex geometry and are also subject to dynamic morphological changes, higher-quality bathymetry survey data are warranted. These areas are mostly located in the upper inlet, where river discharge and associated sediment load become increasingly important in modulating water circulation and geomorphology. In addition, sea-ice can also form during cold months. It should be taken into consideration for more accurate tidal energy resource characterization during the winter. While the model has reasonably captured the general tidal wave characteristics in Cook Inlet, more research needs to be conducted to understand the mechanisms responsible for the rapid tidal amplification toward the upstream, such as the resonant effects. In the future, the model will be more comprehensively improved to include the effects of river input, sediment transport, and sea-ice, as these processes have been shown to be increasingly important, especially in the upper Inlet [41].

Author Contributions

Conceptualization, T.W. and Z.Y. Methodology, T.W. and Z.Y. Validation, T.W. Formal analysis, T.W. and Z.Y. Investigation, T.W. and Z.Y. Resources, Z.Y. Data curation, T.W. Writing—original draft preparation, T.W. Writing—review and editing, T.W. and Z.Y. Visualization, T.W. Supervision, Z.Y. Project administration, Z.Y. Funding acquisition, Z.Y. All authors have read and agreed to the published version of the manuscript.

Funding

This research was funded by the Water Power Technology Office of the U.S. Department of Energy’s Office of Energy Efficiency and Renewable Energy, under Contract DE-AC05-76RL01830 to the Pacific Northwest National Laboratory.

Acknowledgments

We would like to thank the technical steering committee, chaired by Bryson Robertson of Oregon State University, for providing external oversight for, input to, and review of this modeling study. Steering committee members include Henrique Alves of the National Oceanic and Atmospheric Administration; Brian Polagye of Pacific Marine Energy Center at University of Washington; James Behrens of the Coastal Data Information Program at the University of California San Diego; Pukha Lenee-Bluhm of Columbia Power; Bill Staby of Resolute Marine Energy, and Sean Anderton of Ocean Renewable Power Company. Thanks also go to Simon Waldman at The University of Hull for helpful discussion during this study. The model computations were performed using resources available through Research Computing at PNNL. PNNL is operated by Battelle for the U.S. Department of Energy under Contract DE-AC05-76RL01830.

Conflicts of Interest

The authors declare no conflicts of interest.

References

  1. Blunden, L.S.; Bahaj, A.S. Initial evaluation of tidal stream energy resources at Portland Bill, UK. Renew. Energy 2006, 31, 121–132. [Google Scholar] [CrossRef]
  2. Grabbe, M.; Lalander, E.; Lundin, S.; Leijon, M. A review of the tidal current energy resource in Norway. Renew. Sustain. Energy Rev. 2009, 13, 1898–1909. [Google Scholar] [CrossRef] [Green Version]
  3. Lewis, M.; McNaughton, J.; Márquez-Dominguez, C.; Todeschini, G.; Togneri, M.; Masters, I.; Allmark, M.; Stallard, T.; Neill, S.; Goward-Brown, A.; et al. Power variability of tidal-stream energy and implications for electricity supply. Energy 2019, 183, 1061–1074. [Google Scholar] [CrossRef]
  4. O’Carroll, J.P.J.; Kennedy, R.M.; Creech, A.; Savidge, G. Tidal Energy: The benthic effects of an operational tidal stream turbine. Mar. Environ. Res. 2017, 129, 277–290. [Google Scholar] [CrossRef]
  5. Hasegawa, D.; Sheng, J.; Greenberg, D.A.; Thompson, K.R. Far-field effects of tidal energy extraction in the Minas Passage on tidal circulation in the Bay of Fundy and Gulf of Maine using a nested-grid coastal circulation model. Ocean Dyn. 2011, 61, 1845–1868. [Google Scholar] [CrossRef]
  6. Lewis, M.; Neill, S.P.; Robins, P.E.; Hashemi, M.R. Resource assessment for future generations of tidal-stream energy arrays. Energy 2015, 83, 403–415. [Google Scholar] [CrossRef] [Green Version]
  7. Goward Brown, A.J.; Neill, S.P.; Lewis, M.J. Tidal energy extraction in three-dimensional ocean models. Renew. Energy 2017, 114, 244–257. [Google Scholar] [CrossRef] [Green Version]
  8. Mejia-Olivares, C.J.; Haigh, I.D.; Wells, N.C.; Coles, D.S.; Lewis, M.J.; Neill, S.P. Tidal-stream energy resource characterization for the Gulf of California, México. Energy 2018, 156, 481–491. [Google Scholar] [CrossRef]
  9. Ward, S.L.; Robins, P.E.; Lewis, M.J.; Iglesias, G.; Hashemi, M.R.; Neill, S.P. Tidal stream resource characterisation in progressive versus standing wave systems. Appl. Energy 2018, 220, 274–285. [Google Scholar] [CrossRef]
  10. Yang, Z.; Wang, T.; Copping, A.E. Modeling tidal stream energy extraction and its effects on transport processes in a tidal channel and bay system using a three-dimensional coastal ocean model. Renew. Energy 2013, 50, 605–613. [Google Scholar] [CrossRef]
  11. Yang, Z.; Wang, T.; Copping, A.; Geerlofs, S. Modeling of in-stream tidal energy development and its potential effects in Tacoma Narrows, Washington, USA. Ocean Coast. Manag. 2014, 99, 52–62. [Google Scholar] [CrossRef]
  12. MeyGen Project. Available online: https://simecatlantis.com/projects/meygen/ (accessed on 11 November 2019).
  13. Verdant Power. Available online: https://www.verdantpower.com/ (accessed on 11 November 2019).
  14. Neary, V.S.; Gunawan, B.; Hill, C.; Chamorro, L.P. Near and far field flow disturbances induced by model hydrokinetic turbine: ADV and ADP comparison. Renew. Energy 2013, 60, 1–6. [Google Scholar] [CrossRef]
  15. Defne, Z.; Haas, K.A.; Fritz, H.M. Numerical modeling of tidal currents and the effects of power extraction on estuarine hydrodynamics along the Georgia coast, USA. Renew. Energy 2011, 36, 3461–3471. [Google Scholar] [CrossRef]
  16. Richmond, M.; Harding, S.; Romero-Gomez, P. Numerical performance analysis of acoustic Doppler velocity profilers in the wake of an axial-flow marine hydrokinetic turbine. Int. J. Mar. Energy 2015, 11, 50–70. [Google Scholar] [CrossRef] [Green Version]
  17. Haas, K.A.; Fritz Hermann, M.; French Steven, P.; Smith Brennan, T.; Neary, V. Assessment of Energy Production Potential from Tidal Streams in the United States; Tech Research Corporation: Atlanta, GA, USA, 2011. [Google Scholar] [CrossRef] [Green Version]
  18. Martin-Short, R.; Hill, J.; Kramer, S.C.; Avdis, A.; Allison, P.A.; Piggott, M.D. Tidal resource extraction in the Pentland Firth, UK: Potential impacts on flow regime and sediment transport in the Inner Sound of Stroma. Renew. Energy 2015, 76, 596–607. [Google Scholar] [CrossRef] [Green Version]
  19. Thiébot, J.; Bailly du Bois, P.; Guillou, S. Numerical modeling of the effect of tidal stream turbines on the hydrodynamics and the sediment transport–Application to the Alderney Race (Raz Blanchard), France. Renew. Energy 2015, 75, 356–365. [Google Scholar] [CrossRef]
  20. Wang, T.; Yang, Z. A modeling study of tidal energy extraction and the associated impact on tidal circulation in a multi-inlet bay system of Puget Sound. Renew. Energy 2017, 114, 204–214. [Google Scholar] [CrossRef]
  21. Karsten, R.H.; McMillan, J.M.; Lickley, M.J.; Haynes, R.D. Assessment of tidal current energy in the Minas Passage, Bay of Fundy. Proc. Inst. Mech. Eng. Part A J. Power Energy 2008, 222, 493–507. [Google Scholar] [CrossRef]
  22. Neill, S.P.; Litt, E.J.; Couch, S.J.; Davies, A.G. The impact of tidal stream turbines on large-scale sediment dynamics. Renew. Energy 2009, 34, 2803–2812. [Google Scholar] [CrossRef]
  23. Karsten, R.; Swan, A.; Culina, J. Assessment of arrays of in-stream tidal turbines in the Bay of Fundy. Philos. Trans. A Math. Phys. Eng. Sci. 2013, 371, 20120189. [Google Scholar] [CrossRef] [Green Version]
  24. Ramos, V.; Carballo, R.; Álvarez, M.; Sánchez, M.; Iglesias, G. Assessment of the impacts of tidal stream energy through high-resolution numerical modeling. Energy 2013, 61, 541–554. [Google Scholar] [CrossRef]
  25. Nash, S.; O’Brien, N.; Olbert, A.; Hartnett, M. Modelling the far field hydro-environmental impacts of tidal farms – A focus on tidal regime, inter-tidal zones and flushing. Comput. Geosci. 2014, 71, 20–27. [Google Scholar] [CrossRef]
  26. Rao, S.; Xue, H.; Bao, M.; Funke, S. Determining tidal turbine farm efficiency in the Western Passage using the disc actuator theory. Ocean Dyn. 2015, 66, 41–57. [Google Scholar] [CrossRef]
  27. State of Alaska, Officer of the Governor. Preliminary assessment of Cook Inlet Tidal Power. Phase 1 Rep. 1981, 1, 97. [Google Scholar]
  28. Kilcher, L.; Thresher, R. Marine Hydrokinetic Energy Site Identification and Ranking Methodology Part II: Tidal Energy. 2016; 30. Available online: https://www.nrel.gov/docs/fy17osti/66079.pdf (accessed on 4 April 2020).
  29. Chen, C.; Liu, H.; Beardsley, R.C. An Unstructured Grid, Finite-Volume, Three-Dimensional, Primitive Equations Ocean Model: Application to Coastal Ocean and Estuaries. J. Atm. Ocean. Tech. 2003, 20, 159–186. [Google Scholar] [CrossRef]
  30. Chen, C.B.; Robert, C.; Cowles, G. An unstructured grid, finite-volume coastal ocean model (FVCOM) system. Oceanography 2006, 19, 78–89. [Google Scholar] [CrossRef] [Green Version]
  31. Chen, C.; Xu, Q.; Houghton, R.; Beardsley, R.C. A model-dye comparison experiment in the tidal mixing front zone on the southern flank of Georges Bank. J. Geophys. Res. 2008, 113. [Google Scholar] [CrossRef] [Green Version]
  32. Xuan, J.; Yang, Z.; Huang, D.; Wang, T.; Zhou, F. Tidal residual current and its role in the mean flow on the Changjiang Bank. J. Mar. Syst. 2016, 154, 66–81. [Google Scholar] [CrossRef]
  33. Lai, Z.; Ma, R.; Gao, G.; Chen, C.; Beardsley, R.C. Impact of multichannel river network on the plume dynamics in the Pearl River estuary. J. Geophys. Res. Ocean. 2015, 120, 5766–5789. [Google Scholar] [CrossRef] [Green Version]
  34. Wang, T.; Khangaonkar, T.; Long, W.; Gill, G. Development of a Kelp-Type Structure Module in a Coastal Ocean Model to Assess the Hydrodynamic Impact of Seawater Uranium Extraction Technology. J. Mar. Sci. Eng. 2014, 2, 81–92. [Google Scholar] [CrossRef]
  35. Yang, Z.; Wang, T. Modeling the Effects of Tidal Energy Extraction on Estuarine Hydrodynamics in a Stratified Estuary. Estuaries Coasts 2013, 38, 187–202. [Google Scholar] [CrossRef]
  36. Wang, T.; Yang, Z.; Copping, A. A Modeling Study of the Potential Water Quality Impacts from In-Stream Tidal Energy Extraction. Estuaries Coasts 2013, 38, 173–186. [Google Scholar] [CrossRef]
  37. Zimmermann, M.P.; Megan, M. AFSC/RACE: Cook Inlet Grid. 2014. Available online: http://www.afsc.noaa.gov/RACE/groundfish/bathymetry/Cook_bathymetry_grid.zip (accessed on 4 April 2020).
  38. Chen, C.; Beardsley, R.C.; Cowles, G. An unstructured grid, finite-volume coastal ocean model: FVCOM user manual. School for Marine Science and Technology. Oceanography 2006, 19, 78. [Google Scholar] [CrossRef] [Green Version]
  39. Egbert, G.D.E.; Svetlana, Y. Efficient Inverse Modeling of Barotropic Ocean Tides. J. Atmos. Ocean. Technol. 2002, 19, 183–204. [Google Scholar] [CrossRef] [Green Version]
  40. International Electrotechnical Commission. Tidal Energy Resource Assessment and Characterization (Technical Specification No. 62600-201), Marine Energy-WAVE, Tidal and Other Water Current Converters; IEC: Geneva, Switzerland, 2015; p. 46. [Google Scholar]
  41. Oey, L.-Y.; Ezer, T.; Hu, C.; Muller-Karger, F.E. Baroclinic tidal flows and inundation processes in Cook Inlet, Alaska: Numerical modeling and satellite observations. Ocean Dyn. 2007, 57, 205–221. [Google Scholar] [CrossRef]
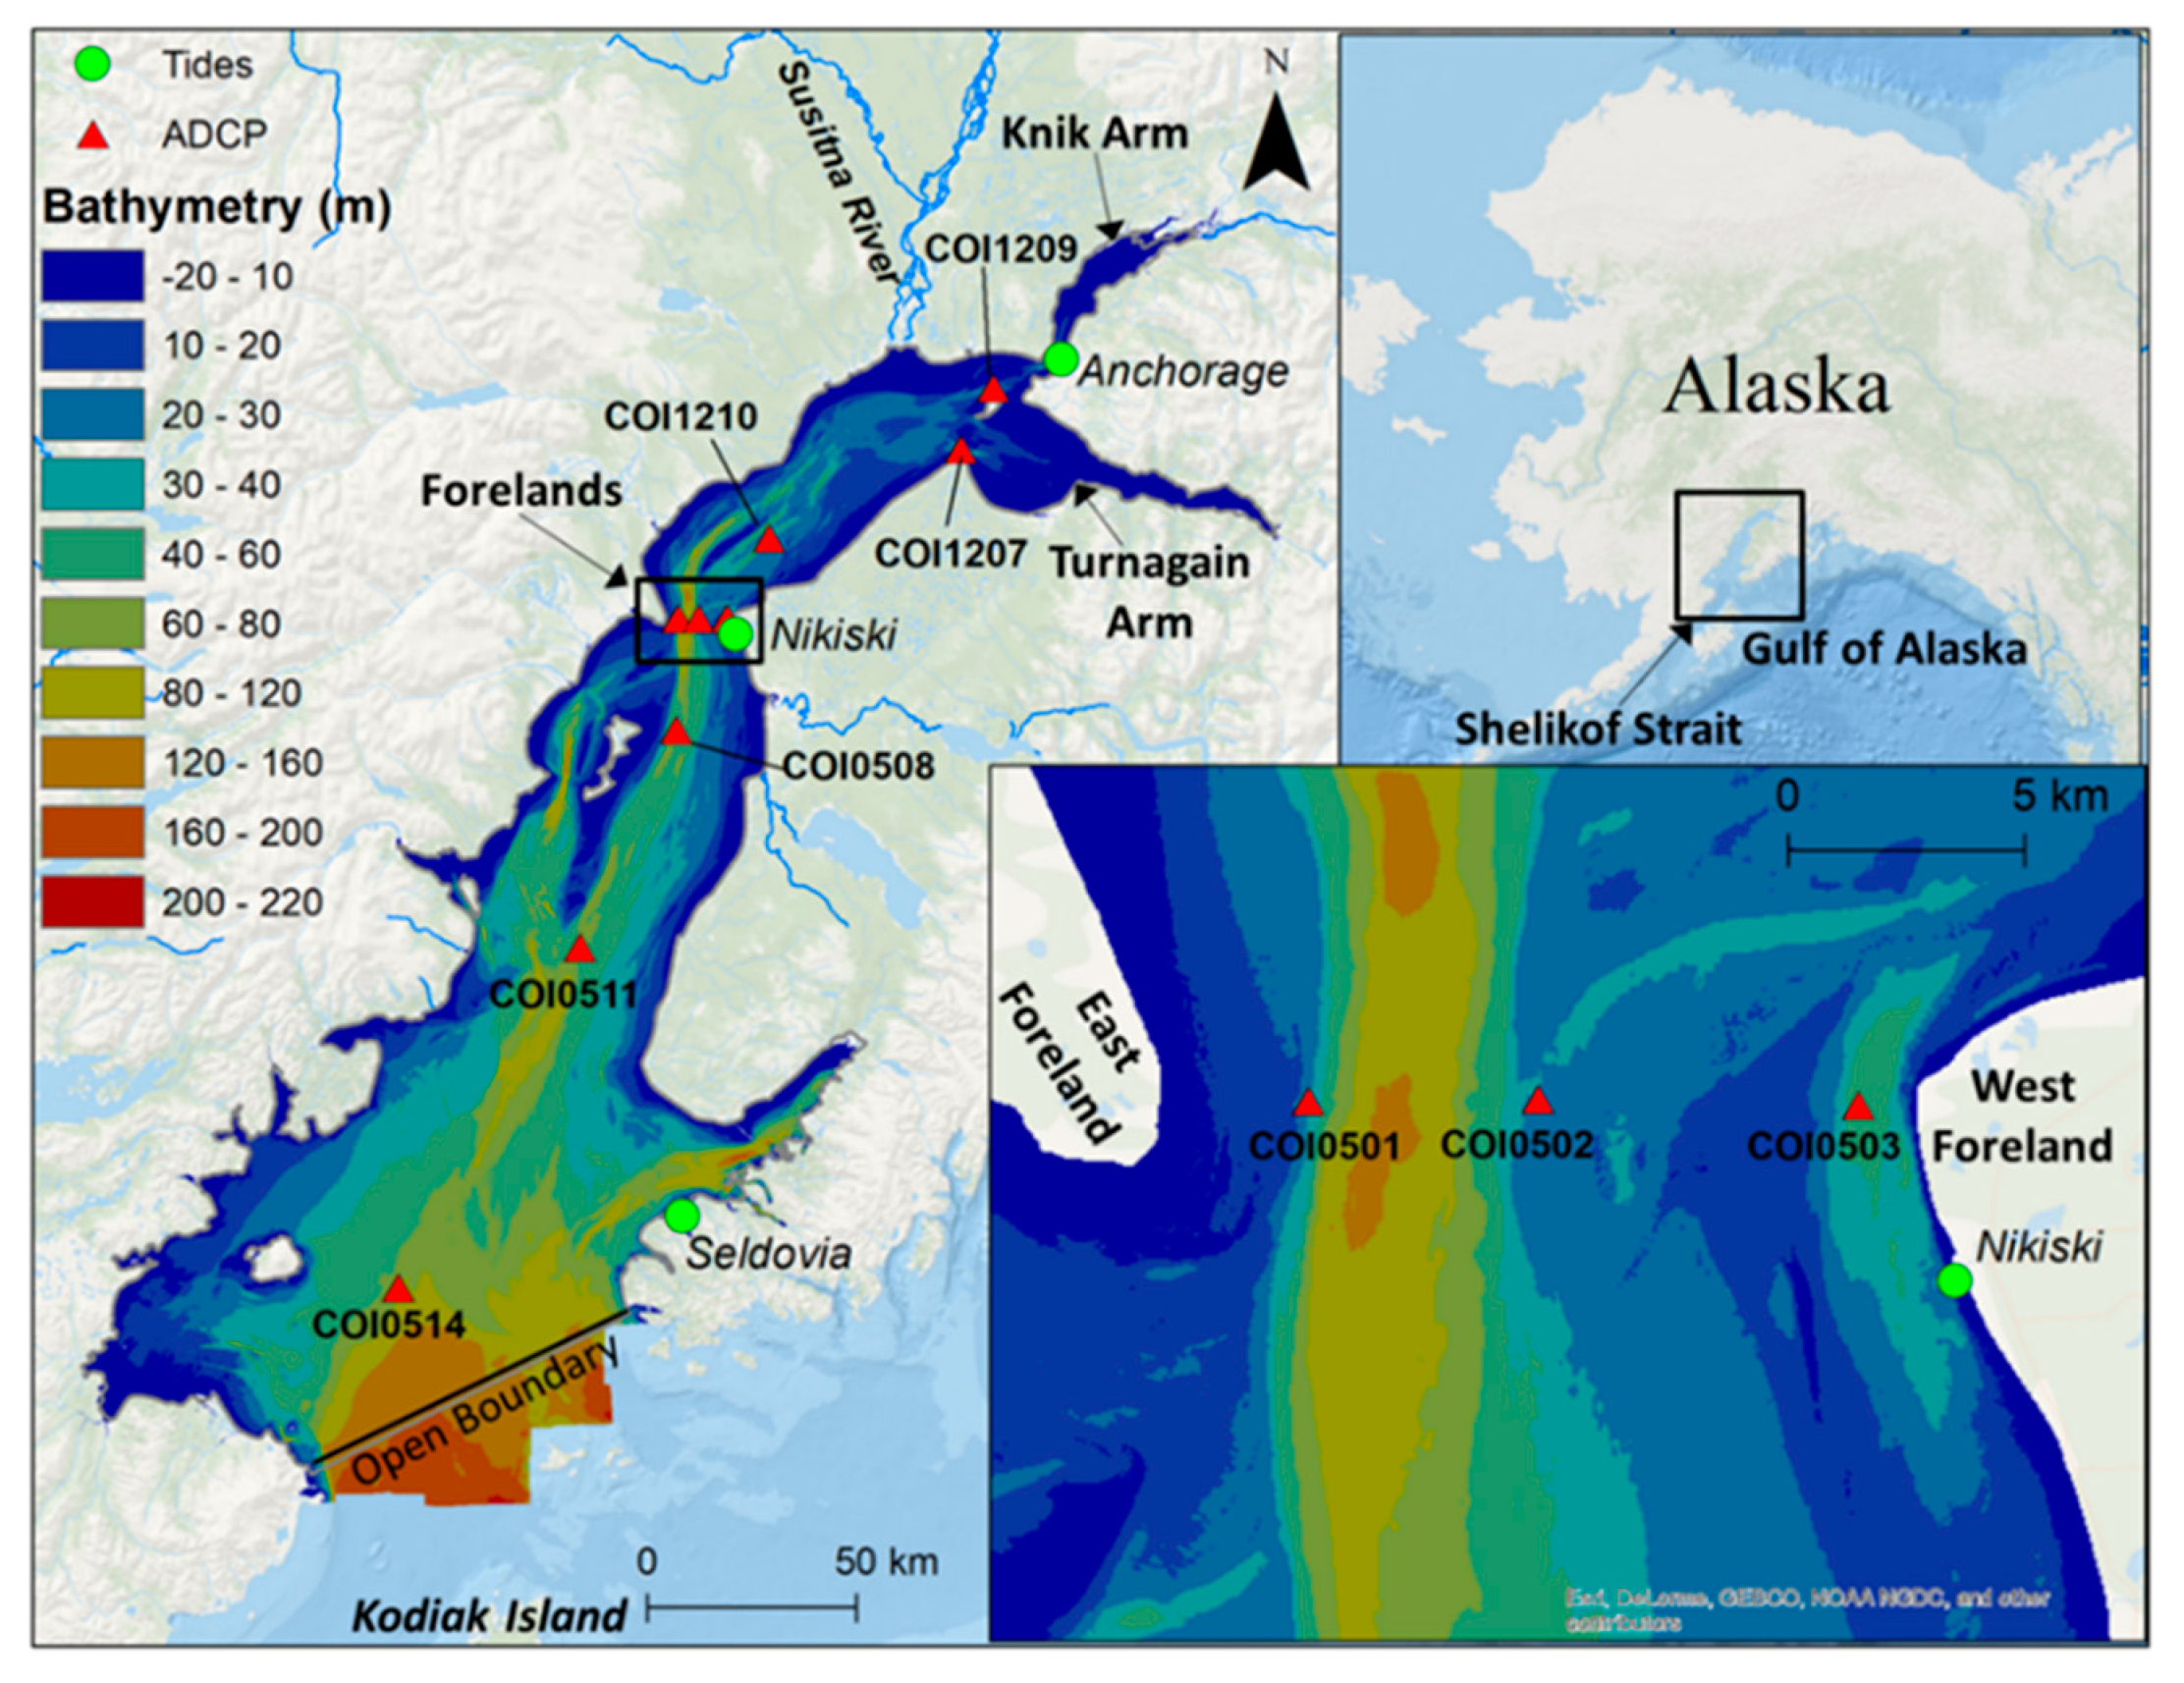
Figure 1. A map showing the study site, Cook Inlet in Alaska, USA, and selected field monitoring stations. The bottom-right inset provides a zoom-in view of the bathymetric features and field observational stations near the Forelands.
Jmse 08 00254 g001
Figure 2. Time-series comparisons of model-predicted tidal elevations and National Oceanic and Atmospheric Administration (NOAA) observations at three tidal gages inside Cook Inlet, (a) Seldevia, (b) Nikiski, and (c) Anchorage. The numbers inside the brackets are root-mean-square-error (RMSE), scattered index (SI), and coefficient of determination (R2) values.
Jmse 08 00254 g002
Figure 3. Model-data comparisons of major tidal constituents at three tidal gages inside Cook Inlet (a) tidal amplitude and (b) tidal phase.
Jmse 08 00254 g003
Figure 4. Scatterplots of U and V velocity components for model-predicted depth-averaged tidal currents and NOAA observations at six ADCP locations inside Cook Inlet (a) COI0514; (b) COI0511; (c) COI0508; (d) COI0501; (e) COI0502; (f) COI0503. The plots were generated from depth-averaged velocity time series for both model predictions and field observations.
Jmse 08 00254 g004
Figure 5. Scatterplots comparisons of U and V velocity components for model-predicted depth-averaged tidal currents (including both the baseline calibration run and the sensitivity test run with refined model grid) and NOAA observations at three ADCP locations in the Foreland region (a) COI0501; (b) COI0502; (c) COI0503. The plots were generated from depth-averaged velocity time series for both model predictions and field observations.
Jmse 08 00254 g005
Figure 6. Scatterplots of U and V velocity components for model-predicted depth-averaged tidal currents and NOAA observations at three Year 2012 ADCP survey stations located in the upper Cook Inlet (a) COI1210; (b) COI1207; (c) COI1209. The plots were generated from depth-averaged velocity time series for both model predictions and field observations.
Jmse 08 00254 g006
Figure 7. The bathymetric feature near ADCP Stations COI1207 and COI1209 in upper Cook Inlet. The location of a shallow sill near Station COI1207 is pointed by an arrow.
Jmse 08 00254 g007
Figure 8. Two-dimensional distributions of tidal amplitude and phase inside Cook Inlet for the most dominant semi-diurnal (M2) and diurnal (K1) constituents (a) M2 amplitude; (b) K1 amplitude; (c) M2 phase; and (d) K1 phase.
Jmse 08 00254 g008
Figure 9. Tidal stage (water level vs. velocity) curves at six ADCP stations along the main axis of Cook Inlet showing the propagation of tidal wave in the system (a) COI0514; (b) COI0511; (c) COI0508; (d) COI0502; (e) COI1210; and (f) COI1209.
Jmse 08 00254 g009
Figure 10. Projected principal-axis (along channel) vertical velocity profile comparison of model prediction (a) and ADCP measurements (b) at Station COI0503 for 25 May 2005. The positive values indicate flooding currents flowing toward upstream.
Jmse 08 00254 g010
Figure 11. (a) histogram plot of current speed at the middle depth of Station COI0503 over the three months of model simulation in summer 2005; (b) the corresponding cumulative frequency distribution plots of current speed over various water depths.
Jmse 08 00254 g011
Figure 12. Two-dimensional distribution of time- and depth-averaged tidal power density inside Cook Inlet based on a three-month model simulation. The inset shows the zoom-in tidal power density distribution near the Foreland region. The dashed line indicates the location of the tidal turbine farm transect.
Jmse 08 00254 g012
Figure 13. Time series of extracted power rate for two hypothetical tidal turbine farm scenarios (S1 and S2).
Jmse 08 00254 g013
Figure 14. The changes in tidal amplitude (a) and phase (b) at the NOAA tidal gage near Anchorage, Alaska, as a result of power extraction in S2.
Jmse 08 00254 g014
Figure 15. The change in tidal flux across the tidal farm transect near the Forelands as a result of energy extraction for two hypothetical tidal turbine farm scenarios (S1 and S2).
Jmse 08 00254 g015
Table 1. The list of selected Acoustic Doppler Current Profilers (ADCP) stations for model-data comparisons.
StationSample YearLongitudeLatitudeDepth (m)# of BinsStation Full Name
COI05142005−152.9302859.3018080.220Augustine Island
COI05112005−152.1201860.0232768.618Cape Ninilchik, west of
COI05082005−151.6732560.4829551.511Kalgin Island, east of
COI05012005−151.6469060.7219833.59West Foreland
COI05022005−151.5573360.7206733.87The Forelands
COI05032005−151.4329760.7172744.212East Foreland
COI12102012−151.2326860.8869743.315Middle Ground Shoal, east of
COI12072002−150.3603561.0566053.319Point Possession
COI12092012−150.2015061.1848329.415Fire Island, north of
Table 2. Error statistics (RMSE, SI, and R2) for depth-averaged tidal currents at six ADCP survey stations inside Cook Inlet (The top row is for the east velocity (U) component and the bottom row is for the north velocity (V) component).
StationVel. CompCOI
0514
COI
0511
COI
0508
COI
0501
COI
0502
COI
0503
RMSE
(m/s)
U0.070.090.130.450.150.17
V0.080.110.200.240.170.31
SIU0.620.230.431.350.420.82
V0.290.170.180.200.140.18
R2U0.850.970.920.190.930.90
V0.950.980.980.980.990.99
Table 3. Error statistics (RMSE, SI, and R2) for depth-averaged tidal currents at three ADCP survey stations in the Foreland region (The top row is for the east (U) velocity component and the bottom row is for the north (V) velocity component). The model results are from the sensitivity test.
StationVel. CompCOI
0501
COI
0502
COI
0503
RMSE
(m/s)
U0.450.150.19
V0.240.170.23
SIU1.370.420.90
V0.200.140.18
R2U0.190.930.90
V0.980.990.99
Table 4. Error statistics (RMSE and R2) for depth-averaged tidal currents at selected ADCP stations inside Cook Inlet. (The top row is for the east velocity (U) component and the bottom row is for the north (V) velocity component.).
StationVel. CompCOI
1210
COI
1207
COI
1209
RMSE
(m/s)
U0.120.580.37
V0.120.230.38
SIU0.110.420.30
V0.160.481.0
R2U0.990.970.97
V0.990.970.57