Article

Virtual Replica of a Towing Tank Experiment to Determine the Kelvin Half-Angle of a Ship in Restricted Water

1
Department of Naval Architecture, Ocean and Marine Engineering, University of Strathclyde, Glasgow G4 0LZ, UK
2
Faculty of Engineering, University of Strathclyde, Glasgow G1 1XJ, UK
*
Author to whom correspondence should be addressed.
J. Mar. Sci. Eng. 2020, 8(4), 258; https://doi.org/10.3390/jmse8040258
Submission received: 9 March 2020 / Revised: 1 April 2020 / Accepted: 1 April 2020 / Published: 6 April 2020
(This article belongs to the Special Issue CFD Simulations of Marine Hydrodynamics)

Abstract

:
The numerical simulation of ship flows has evolved into a highly practical approach in naval architecture. In typical virtual towing tanks, the principle of Galilean relativity is invoked to maintain the ship as fixed, while the surrounding water is prescribed to flow past it. This assumption may be identified, at least partly, as being responsible for the wide-scale adoption of computational solutions within practitioners’ toolkits. However, it carries several assumptions, such as the levels of inlet turbulence and their effect on flow properties. This study presents an alternative virtual towing tank, where the ship is simulated to advance over a stationary fluid. To supplement the present work, the free surface disturbance is processed into Fourier space to determine the Kelvin half-angle for an example case. The results suggest that it is possible to construct a fully unsteady virtual towing tank using the overset method, without relying on Galilean relativity. Differences between theoretical and numerical predictions for the Kelvin half-angle are predominantly attributed to the assumptions used by the theoretical method. The methods presented in this work can potentially be used to validate free-surface flows, even when one does not have access to experimental wave elevation data.

1. Introduction

Computational fluid dynamics (CFD) has become widely accepted as a useful tool to predict the flow around a ship. This is facilitated by the increase in available computational power, which has allowed practitioners to re-create the flow around a vessel even on a standard computer. Thus, the number of cells or, more generally, the computational effort required to perform a numerical simulation in model-scale is not thought to be prohibitive for practical applications.
Regardless of the advances in every field of numerical modelling, CFD is not yet considered a replacement of model-scale experimentation. This is because it is not possible to guarantee that a particular numerical model will perform with the same level of accuracy across all possible case studies. For example, new energy-saving devices, or novel underwater shapes may require research into the best applicable modelling approaches. Additionally, the consequences of implementing modelling assumptions may not be fully understood. Specifically, although in model-scale computations, a significant portion of the ship hull is covered by a laminar layer, most turbulence models assume the flow is fully turbulent. Yet, results with accuracy of a few percentage error can be found in the open literature [1,2,3,4,5,6,7].
There are also different aspects of the problem of modelling ship flows that can be validated with different levels of confidence. For instance, the resistance of a ship can be measured accurately. However, velocities in the wake of the ship or free surface elevations require complex and expensive equipment. Thus, in the course of validating a numerical result, researchers typically analyse the error in observed integral quantities (resistance, motions, etc.) but tend to assume that other flow features are also accurately modelled as a consequence. Although this may be the true in many cases, an approach to validate aspects of the flow around a ship, such as the generated wave field, is necessary. Ideally, such a method would not rely on expensive equipment nor complex mathematics; in other words, it should be accessible. It is important to mention that some experimental campaigns report on a wide range of features of the flow around the ship, for instance, the flow properties in the wake [8,9].
The research presented herein is motivated primarily by the manner in which the problem of ship resistance is typically solved. That is, the principle of Galilean relativity is invoked (also called frame invariance; further information can be found in [10]). Namely, the water is flowing over a stationary ship (in the direction of the incoming flow). This assumption has several consequences. Those particularly important to the naval architect are:
(1)
Levels of inlet turbulence.
This can have an impact on the overall properties of the flow [11] and may require calibration in some cases. For example, according to Lopes et al. [12], the onset of transition from laminar to turbulent boundary layer is strongly dependent on the level of free-stream turbulence. Some two-equation models, such as the SST k–ω model (which is widely used in marine hydrodynamics), are known to predict excessive decay of free-stream turbulence, which may affect the results. More recently, Lopes et al. [13] examined the same topic. According to them, even if one were to employ a more advanced eddy-viscosity model, capable of accounting for transition, the location of where laminar–turbulent transition occurs is highly dependent on the level of inlet turbulence.
(2)
Wave reflections and their damping.
In cases where the volume of fluid (VOF) method is used [14], a damping length is often prescribed. That is, a length over which all waves are damped, extending from the boundary it is applied to in the normal direction. Setting an inappropriate damping length can have severe consequences to the predicted parameters [15].
(3)
The temporal dependency of free surface flows.
The simulation of free surface flows via CFD cannot be solved using steady-state solvers (except in rare academic cases), because they require that properties are convected through the domain [14]. Theoretically, in the frame of reference of the ship, the flow—once converged—is steady. Therefore, ship resistance is frequently classed as a pseudo-steady problem. In reality, towing takes place over time and is a fundamentally unsteady process. Here, the presence of turbulence, which is by definition time-dependent [16], should also be kept in mind.
A second aspect inspiring this work partly stems from point (2) above. Although these may be of less interest to the naval architect, they carry their own importance nonetheless. Specifically, this concerns the destruction of ship waves, regardless of whether or not damping is prescribed. Once a ship-generated wave reaches the outlet, it is irreversibly destroyed, and the information it carries is lost. In shallow and restricted waters, ship waves are of great importance because they cause bank erosion and may even lead to destruction of coastal features/infrastructure [17,18]. In extreme cases, they may even be the cause of loss of life, as stated by Soomere [19]. Therefore, the accurate modelling of ship waves and their interactions with riverbeds or canal sides is important. Soomere [19] also advances a criticism of ship-induced flow predictions, pointing out that the flow is only described at a distance of few ship lengths.
Clearly, ship waves are both of practical and research interest. Therefore, the validation of numerical ship-generated waves is of high importance. In this respect, the work Caplier et al. [20], Fourdrinoy et al. [21], and Gomit et al. [22] is important to mention. The authors of the aforementioned references systematically developed and implemented a technique to capture and analyse ship-generated waves from a model experiment. Of interest to the present researchh is the fact that in their studies, the authors proved the dispersion relation in deep and shallow water and demonstrated its validity for ships experimentally. Since the developed technique relies primarily on spectral representation of the wave field, it is thought prudent to attempt its application to a numerically generated free surface disturbance caused by a ship. It is expected that, if applied correctly, it is possible to validate a numerical wave field simply by means of processing a virtual free surface, which would be undoubtedly of practical use. Such a method has the potential to change how numerical solutions of surface piercing bodies are treated.
The present paper will attempt to apply the aforementioned spectral technique on a different type of numerical towing tank. Instead of relying on Galilean relativity, the present paper will present a numerical replica of a towing tank, where the ship advances over a stationary fluid. This is achieved via the overset domain method, where the ship is encased in what is essentially a moving box. To perform the numerical simulations, the commercial Reynolds-averaged Navier–Stokes (RANS) solver, Star-CCM+ version 13.06, is used. The specific case studies adopted in this paper are selected to maximise the practical relevance of the study. Specifically, the New Suez Canal is replicated, alongside a standard rectangular canal, which were investigated experimentally by Elsherbiny et al. [23]. The KRISO container ship (KCS) with a scale factor of 1:75, following the available experimental data, is used for all simulations.
The aim of this paper is primarily to demonstrate that it is possible to create a virtual towing tank where the ship is towed using the overset method, i.e., a virtual towing tank that does not rely on Galilean relativity. The generated wave field will then be used to estimate the Kelvin half-angle for an example case. The adopted approach also allows one to split the near- and far-field wave systems, which is used on the fully nonlinear disturbance, generated by the KCS at a variety of speeds in two different canals.
This work is organised as follows. Section 2 contains a description of the adopted case studies, while Section 3 explains the adopted methodology, which is split into the two techniques used in this paper, namely the computational set-up and the spectral representation techniques. Section 4 is dedicated to results and their discussion, whereas Section 5 contains conclusions and summary.

2. Case Studies

As mentioned in the previous section, the case studies adopted for this work are taken from the experimental work of by Elsherbiny et al. [23]. The rationale behind this choice relates to the particular objective of this study. To elaborate, shallow-water studies are a natural choice for the examination of ship-generated waves. This is because they present several features that are absent in deep-water ship-generated waves. Shallow-water waves are nonlinear, and their Kelvin half-angle is speed-dependent [24,25]. This is illustrated in Figure 1, which is constructed via Havelock’s [17] linear method. Here, the Kelvin wake angle increases from its deep-water value of 19.47 ° to 90 ° . The theory predicts that at a depth Froude number ( F h = U / g h , where U is the ship speed in m/s, g is the gravitational acceleration and h is the water depth) of one, F h = 1 , the ship-generated waves will travel at the same speed as the disturbance, indicating the Kelvin wedge fills the entire half-plane aft of the disturbance, i.e., at a half-angle of θ = 90 ° . The relationships derived by Havelock [17] are omitted in the present work, as they are available in the open literature.
Ship-generated waves are also of greater concern in restricted areas than in deep waters, because they may affect the surrounding environment detrimentally. In navigational fairways, bank erosion is of particular concern, which has led to authorities restricting the speed with which vessels are legally allowed to operate [26]. Such a restriction simultaneously guards against groundings.
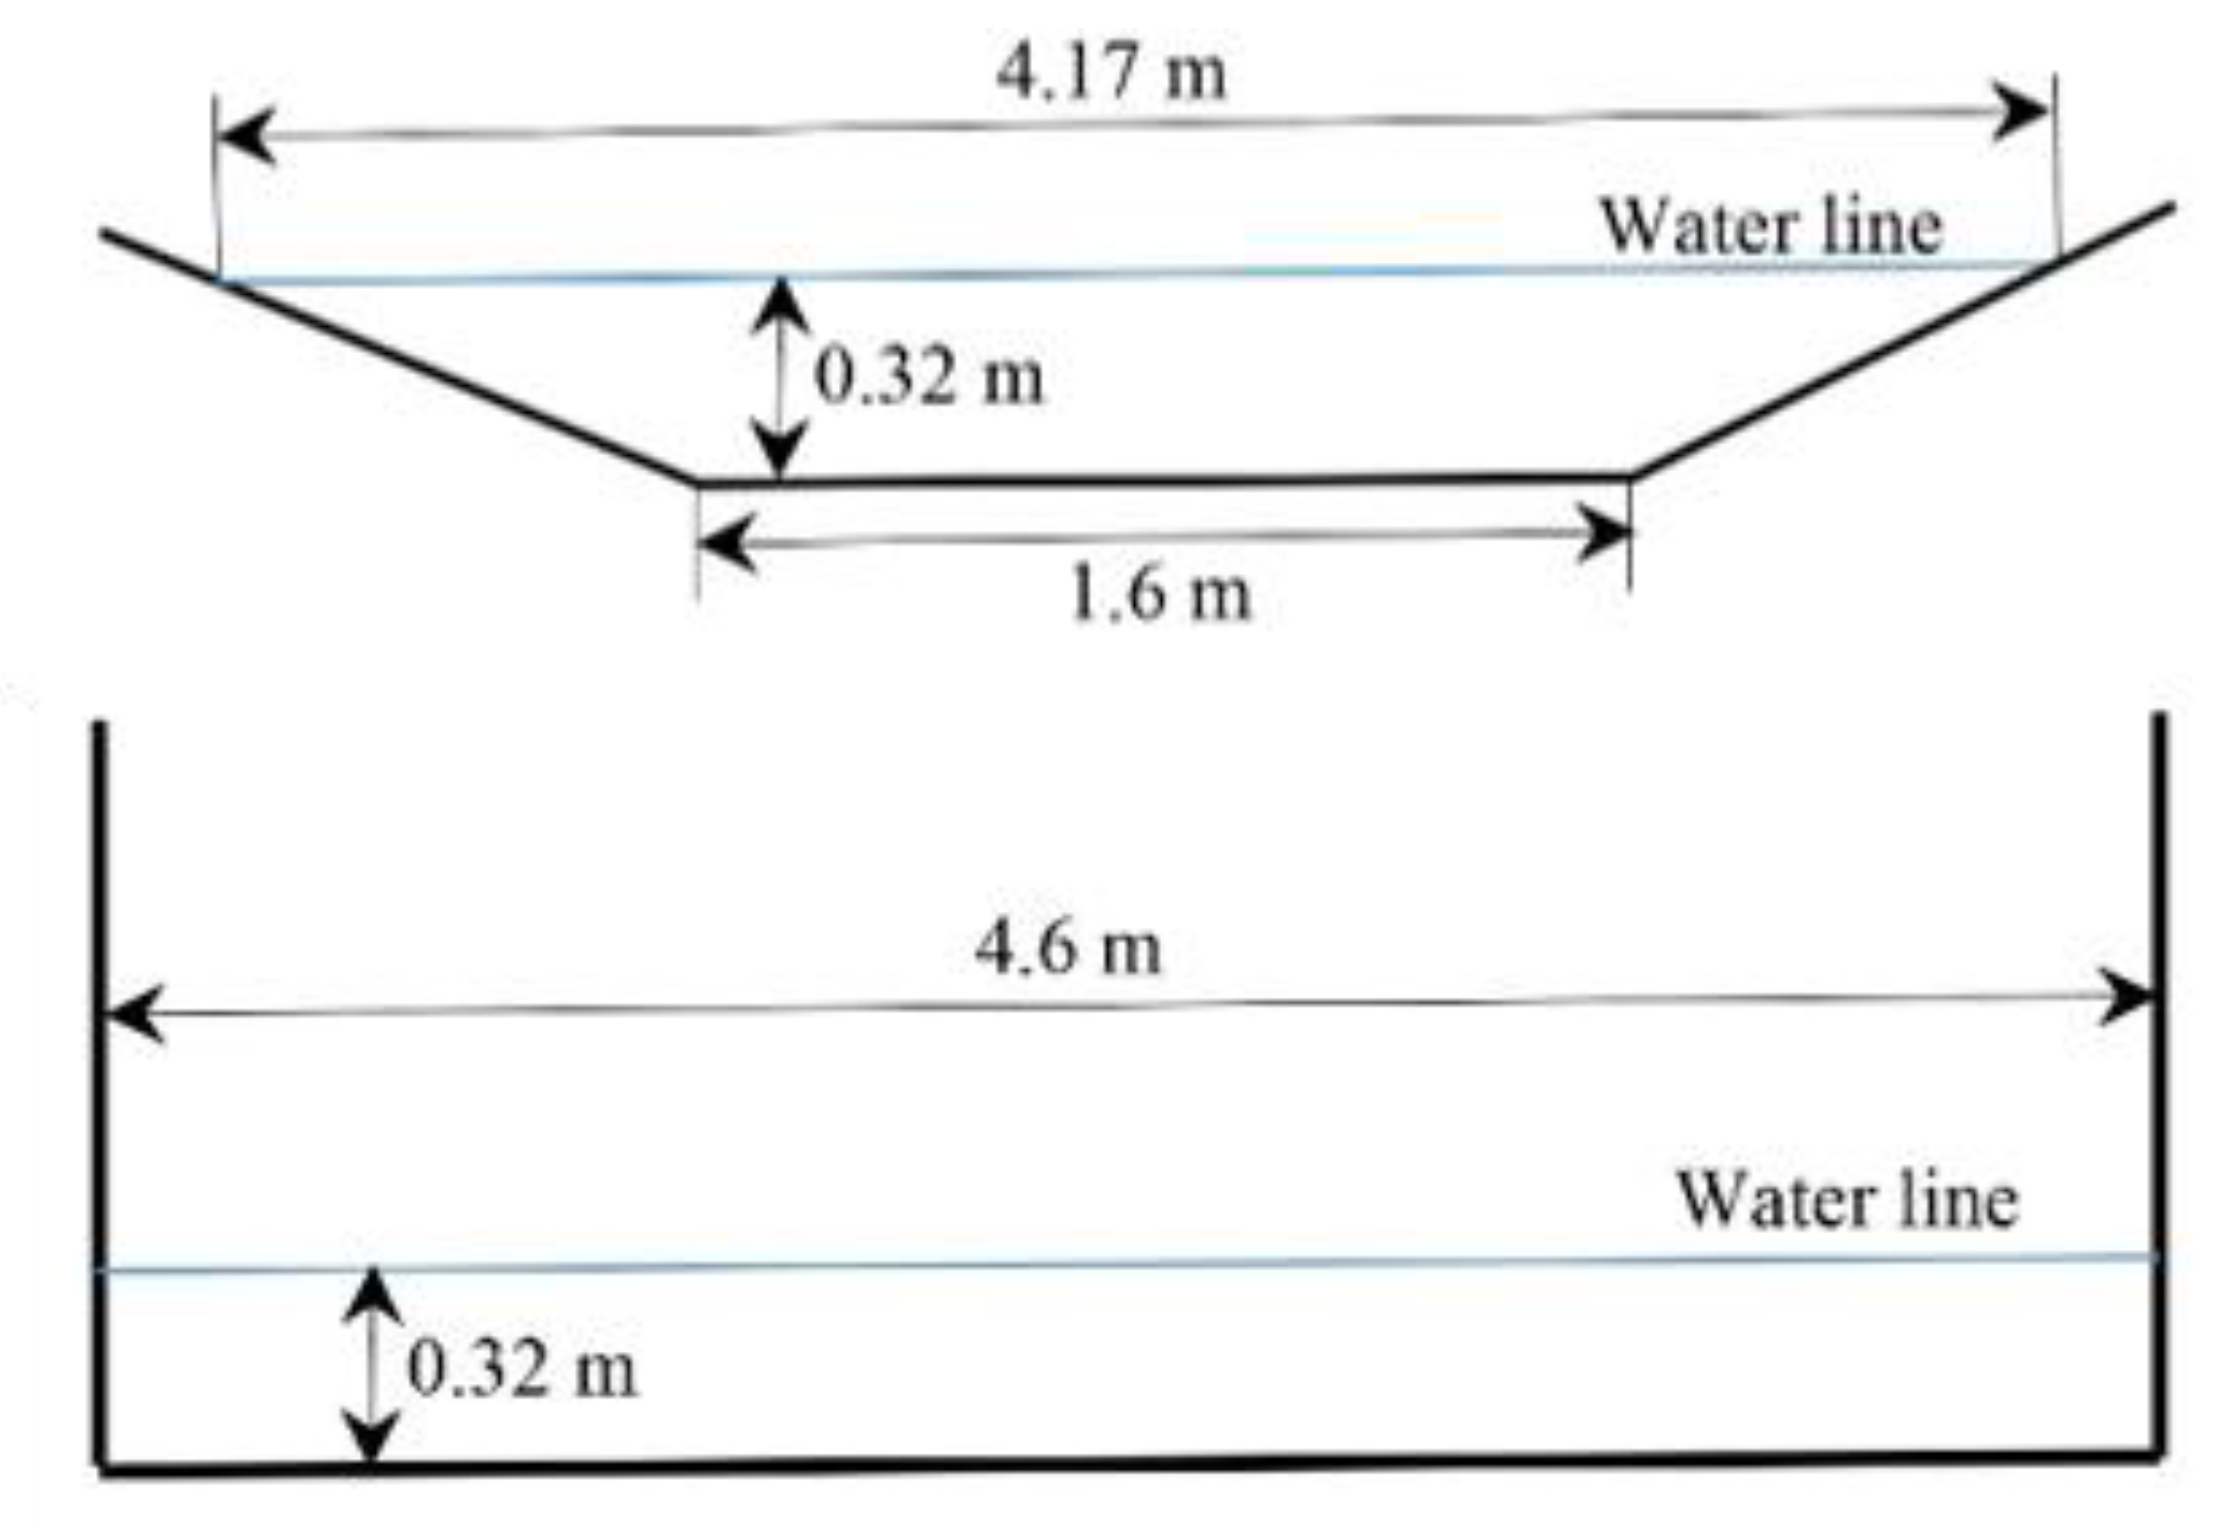
The case studies adopted herein are chosen to reflect the aforementioned points. In this respect, the recent work of Elsherbiny et al. [24] is used as a benchmark. From their experimentally investigated cases, two different canal cross-sections are selected: the New Suez Canal and a standard rectangular canal. These are graphically depicted in Figure 2.
The ship used in this study also follows from the experimental campaign of Elsherbiny et al. [23]. Namely, the KCS hull form is used, scaled by a factor of 1:75. This translated into a depth-to-draught ratio of 2.2, based on the ship’s design draught. In order to ensure that a well-defined Kelvin wake is simulated, the chosen depth Froude numbers are towards the high end of the experimentally available conditions. The ship’s particulars are given in Table 1, whereas test matrix alongside the predicted Kelvin half-angles (via Havelock’s [17] method) are described in Table 2. It should be noted that Havelock’s [17] method was originally devised for point sources and is therefore not expected to be perfectly accurate for nonlinear three-dimensional surface piercing bodies. Nonetheless, it is a useful starting point. Additionally, turbulence, viscosity and vorticity may influence ship-generated waves, particularly in the near-field [27].
The relatively high depth Froude numbers ensure the numerically generated wave field will be discernible. The spectral method used also performs best at high speeds, where the near- and far-field disturbances generated by the ship are well visible. This can be seen by consulting the results of Caplier et al. [20].

3. Methodology

This section is presented in two major parts. These reflect the methodologies used in this work. The first section presents the numerical set-up, which is followed by an explanation of the spectral method in the second subsection.

3.1. Numerical Aspects

The solver, Star-CCM+ version 13.06, employs the finite volume method to model the flow, which uses the integral form of the incompressible RANS equations and divides the computational domain into a finite number of adjoining cells. Continuity and momentum are linked via a predictor–corrector approach. Further details pertaining to the implementation and algorithms used can be accessed in Siemens [28] and Ferziger and Peric [29].
To account for turbulence within the fluid, the kω model of Wilcox [30] is used. This choice is made following previous work, which showed the particular model to be stable and provide the fastest solution time of all two-equation variants [31]. Benefits of using the k–ω model include its seamless application to low y+ type meshes (y+ < 1). This is a desirable feature, because it avoids the use of wall functions, or any other bifurcations of the solution, as is the case with the kε model [28]. Although wall functions can predict the forces acting on a body with good accuracy, they may introduce errors in the modelling of hydrodynamic properties in the wake of a ship. For instance, they are unable to account for flow separation [32]. To facilitate a good representation of turbulent properties, a second-order convection scheme is applied throughout all simulations.
To characterise the fluid interphase, the volume of fluid (VoF) method is used [33]. Moreover, Star-CCM+ offers a high-resolution interphase-capturing (HRIC) scheme to enhance the definition of the free surface, which is employed in this study [34]. Vertical ship movements, i.e., sinkage and trim, are not accounted for to reduce the complexity of the simulations. Instead, the ship’s position in the x–z plane is adjusted prior to initiating the simulation according to the published results of Elsherbiny et al. [23,35]. This is done in an attempt to reduce the discrepancy between the experimental results and those derived herein. However, some difference is expected to persist since the experimental data, reported by Elsherbiny et al. [23], were determined for a free to sink and trim KCS model.

3.1.1. Computational Domain

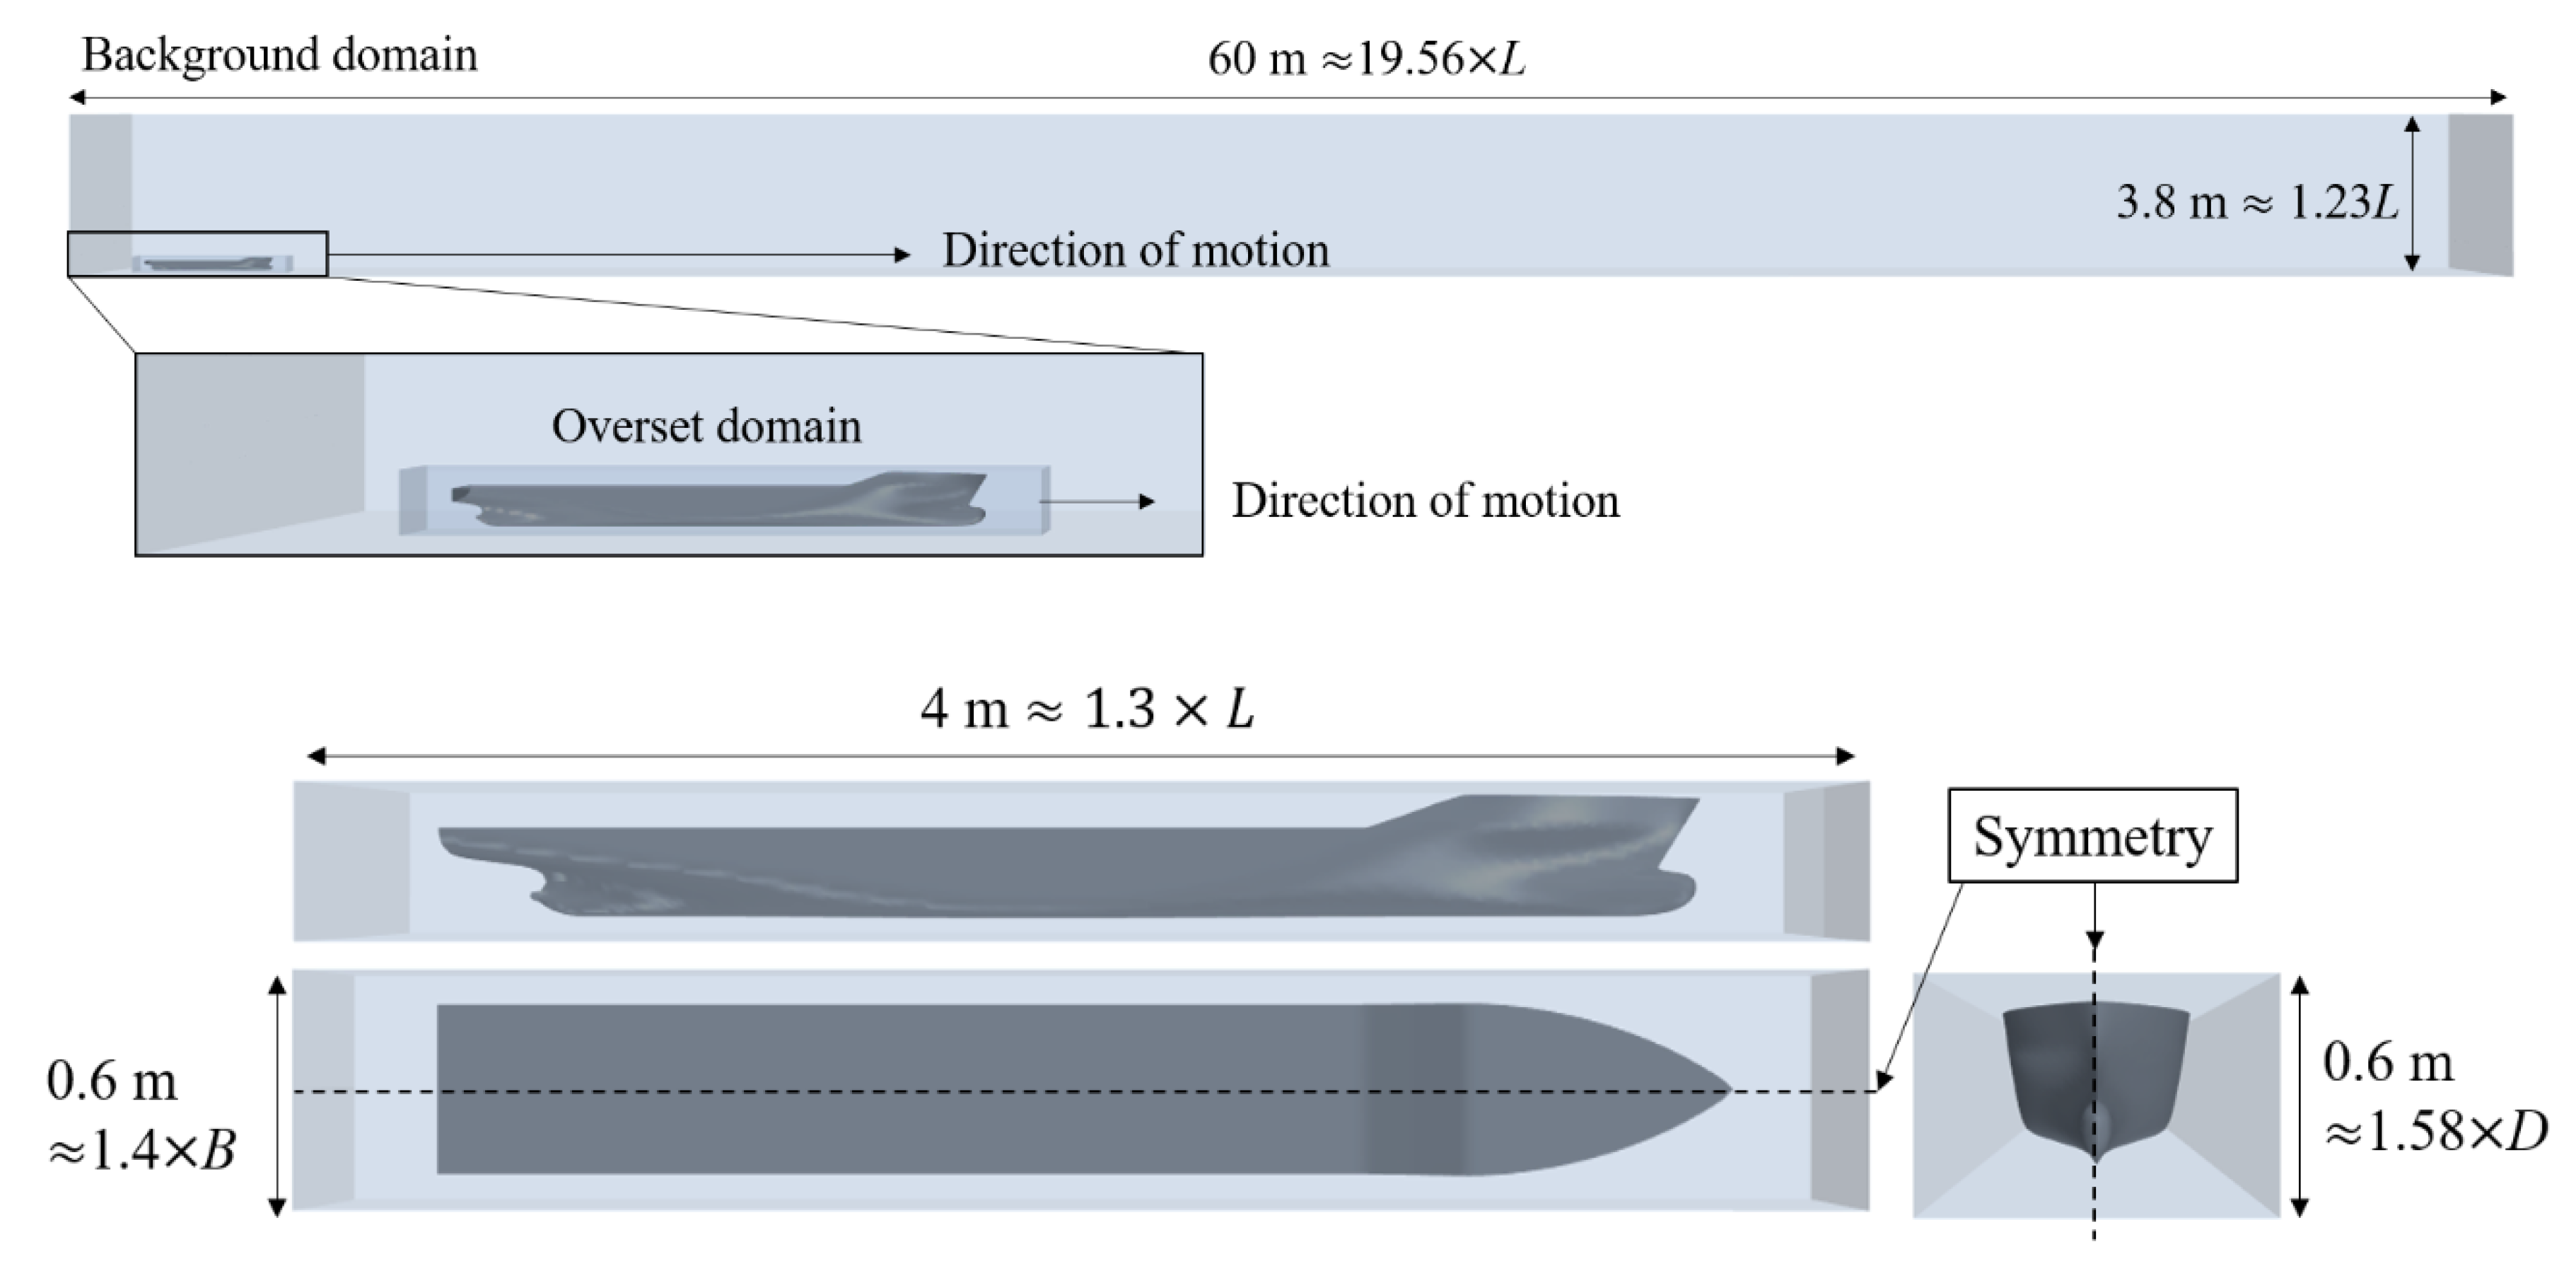
As stated previously, frame invariance is not used in this work. Instead, the ship is given the corresponding velocity, which can be consulted in Table 2 for each canal. To model the motion of the ship along the canal, the overset domain approach is used. Thus, the ship is towed in the virtual environment over a static fluid. This has two main consequences. Firstly, the computational domain can no longer conform to the recommendations of the ITTC [36] relating to the positioning and dimensions of the computational boundaries. Instead, an attempt is made to replicate the towing tank used for the experimental work, which is used as a benchmark. Specifically, the towing tank at the Kelvin Hydrodynamics Laboratory at the University of Strathclyde. Naturally, the width and depth of the computational domain must satisfy the test cases (given in Table 2). On the other hand, the length of the computational domain is set as 60 m long. The dimensions are kept the same across case studies (pertaining to the overset domain and the length of the tank). These are shown in Figure 3. The height of the static domain is set as 1.23 ship lengths from the undisturbed water surface in all cases to eliminate any possible effects stemming from the height of the domain.
The dimensions of the overset domain, which are maintained identical across case studies, are also shown in Figure 3. It should be noted that for visualisation purposes the figures have been mirrored about the central plane. Other than the boundary, coincidental with the canal and ship centrelines where a symmetry condition is imposed, all other boundaries within the background domain are no-slip walls. This is in line with our goal of designing a more realistic representation of a towing tank. Specifically, so-called ‘open boundaries’ do not exist in reality [37]. Examples of such boundaries include velocity inlets and pressure outlets. Although it is easier to define the conditions at such boundaries mathematically, they are a definite source of modelling error as discussed earlier.
The manner in which the computational domain is constructed allows the removal of wave damping. Moreover, the definition of turbulent properties on boundaries (such as levels of inlet turbulence) of the fluid is not necessary since there are no inlets nor outlets present. However, it should be noted that the initial conditions in terms of turbulence in the fluid must be specified. In this study, a turbulent viscosity ratio of 0.1% is used, which decays rapidly and is effectively zero in the nondisturbed region of the domain at the end of the acceleration phase, limiting its influence to the early stages of the simulation.

3.1.2. Computational Mesh

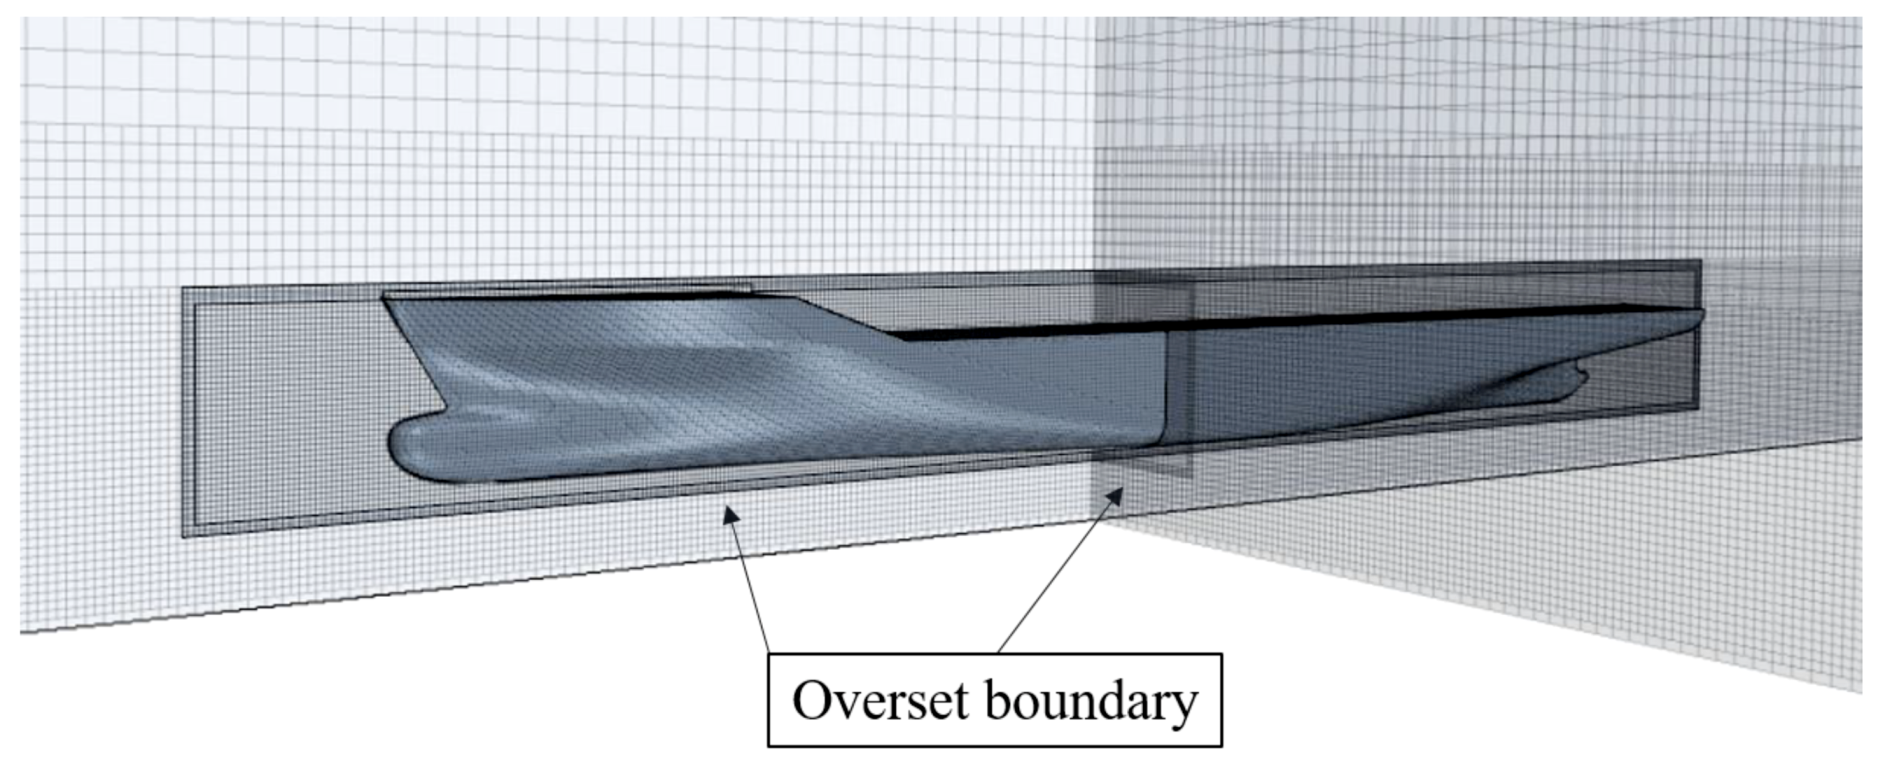
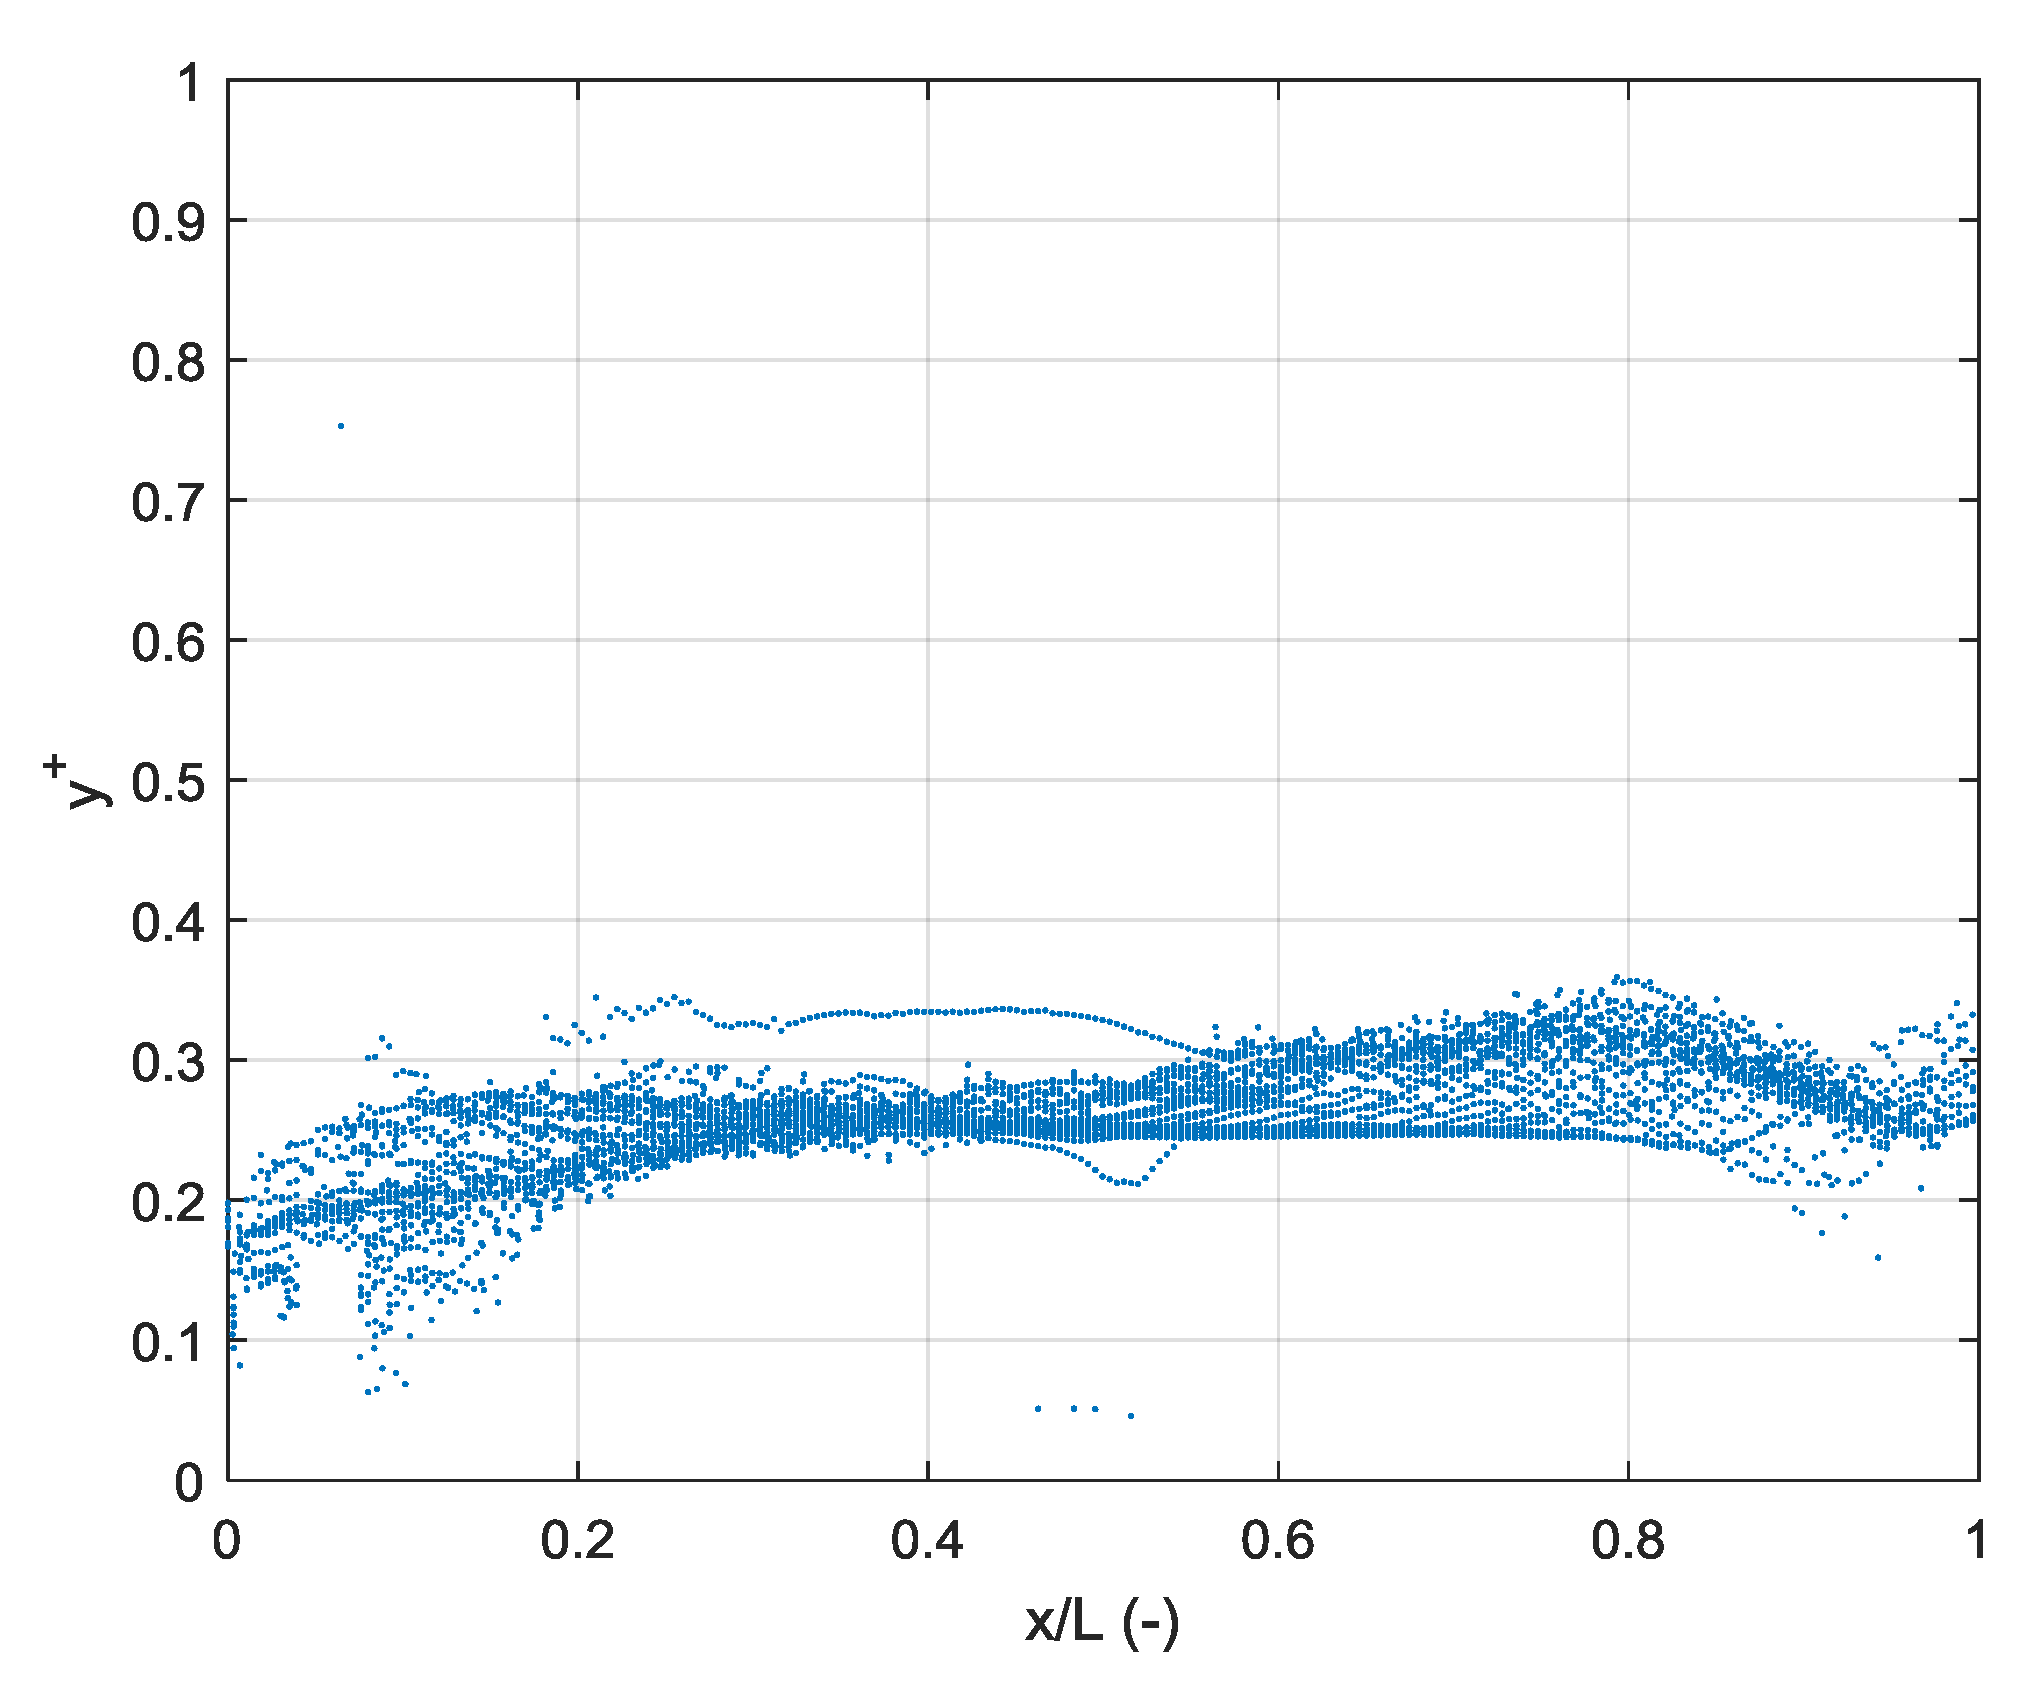
The computational mesh is generated entirely within the automatic facilities of Star-CCM+. As stated earlier, the near-wall mesh is generated so that y+ < 1 over the wetted area of the ship. This is achieved via the prism layer mesher, offered by Star-CCM+. It should be noted that no prism layer refinement has been applied to the side walls and canal bottom. Therefore, wall functions are employed on these boundaries. The choice of background and overset mesh is of critical importance. This must be done in a way that enables the solver to adequately capture flow properties as they transition from the background into the overset mesh. The cell distribution of each domain is depicted graphically in Figure 4, whereas Figure 5 depicts the y+ distribution on the hull at a physical time of 40 s for the F h = 0.77 case.
The arrangement of the mesh does not vary across case studies; the total cell numbers for each canal are shown in Table 3. The circa 8 million cell difference between the two adopted canals is a direct result of the smaller wetted volume occupied by the Suez Canal.
Figure 4 also depicts the manner in which the mesh coarsens as the distance from the waterline is increased. This gradual coarsening is implemented to reduce the overall number of computational cells.

3.1.3. Time-Step Selection

Time-step selection is of high importance in CFD. In this respect, the Courant–Friedrichs–Lewy (CFL) number may be used as an assessment criterion. The CFL number is defined as the product of the flow speed and time-step, divided by the mesh size [29]. As a fluid parcel propagates through the mesh, one would ideally aim to capture its properties at each cell. This is satisfied when CFL < 1. Since the mesh is kept identical for all cases, the highest speed can be used to assess the CFL condition. Moreover, a CFL condition onto the background domain is not a meaningful metric, since the majority of the fluid is static. Instead, the CFL number within the overset box is monitored throughout the duration of the simulation.
Typically, when solid body motion is present, the time-step requirements are relatively low. In this work, a trial with a time-step of 0.0035L/U, where L is the ship length and U is the ship speed in m/s was used. The results indicated satisfactory agreement with experimental data, as will be demonstrated in the following section. For this reason, the time-step is set at 0.0035L/U for all simulations. For the highest speed, the average CFL within the overset domain did not exceed 0.7, which is considered adequate for a first-order temporal discretisation scheme. It should also be borne in mind that if the time-step is too low, severe numerical noise may be noticed in the solution time-history [38].

3.1.4. Time-History of the Solution

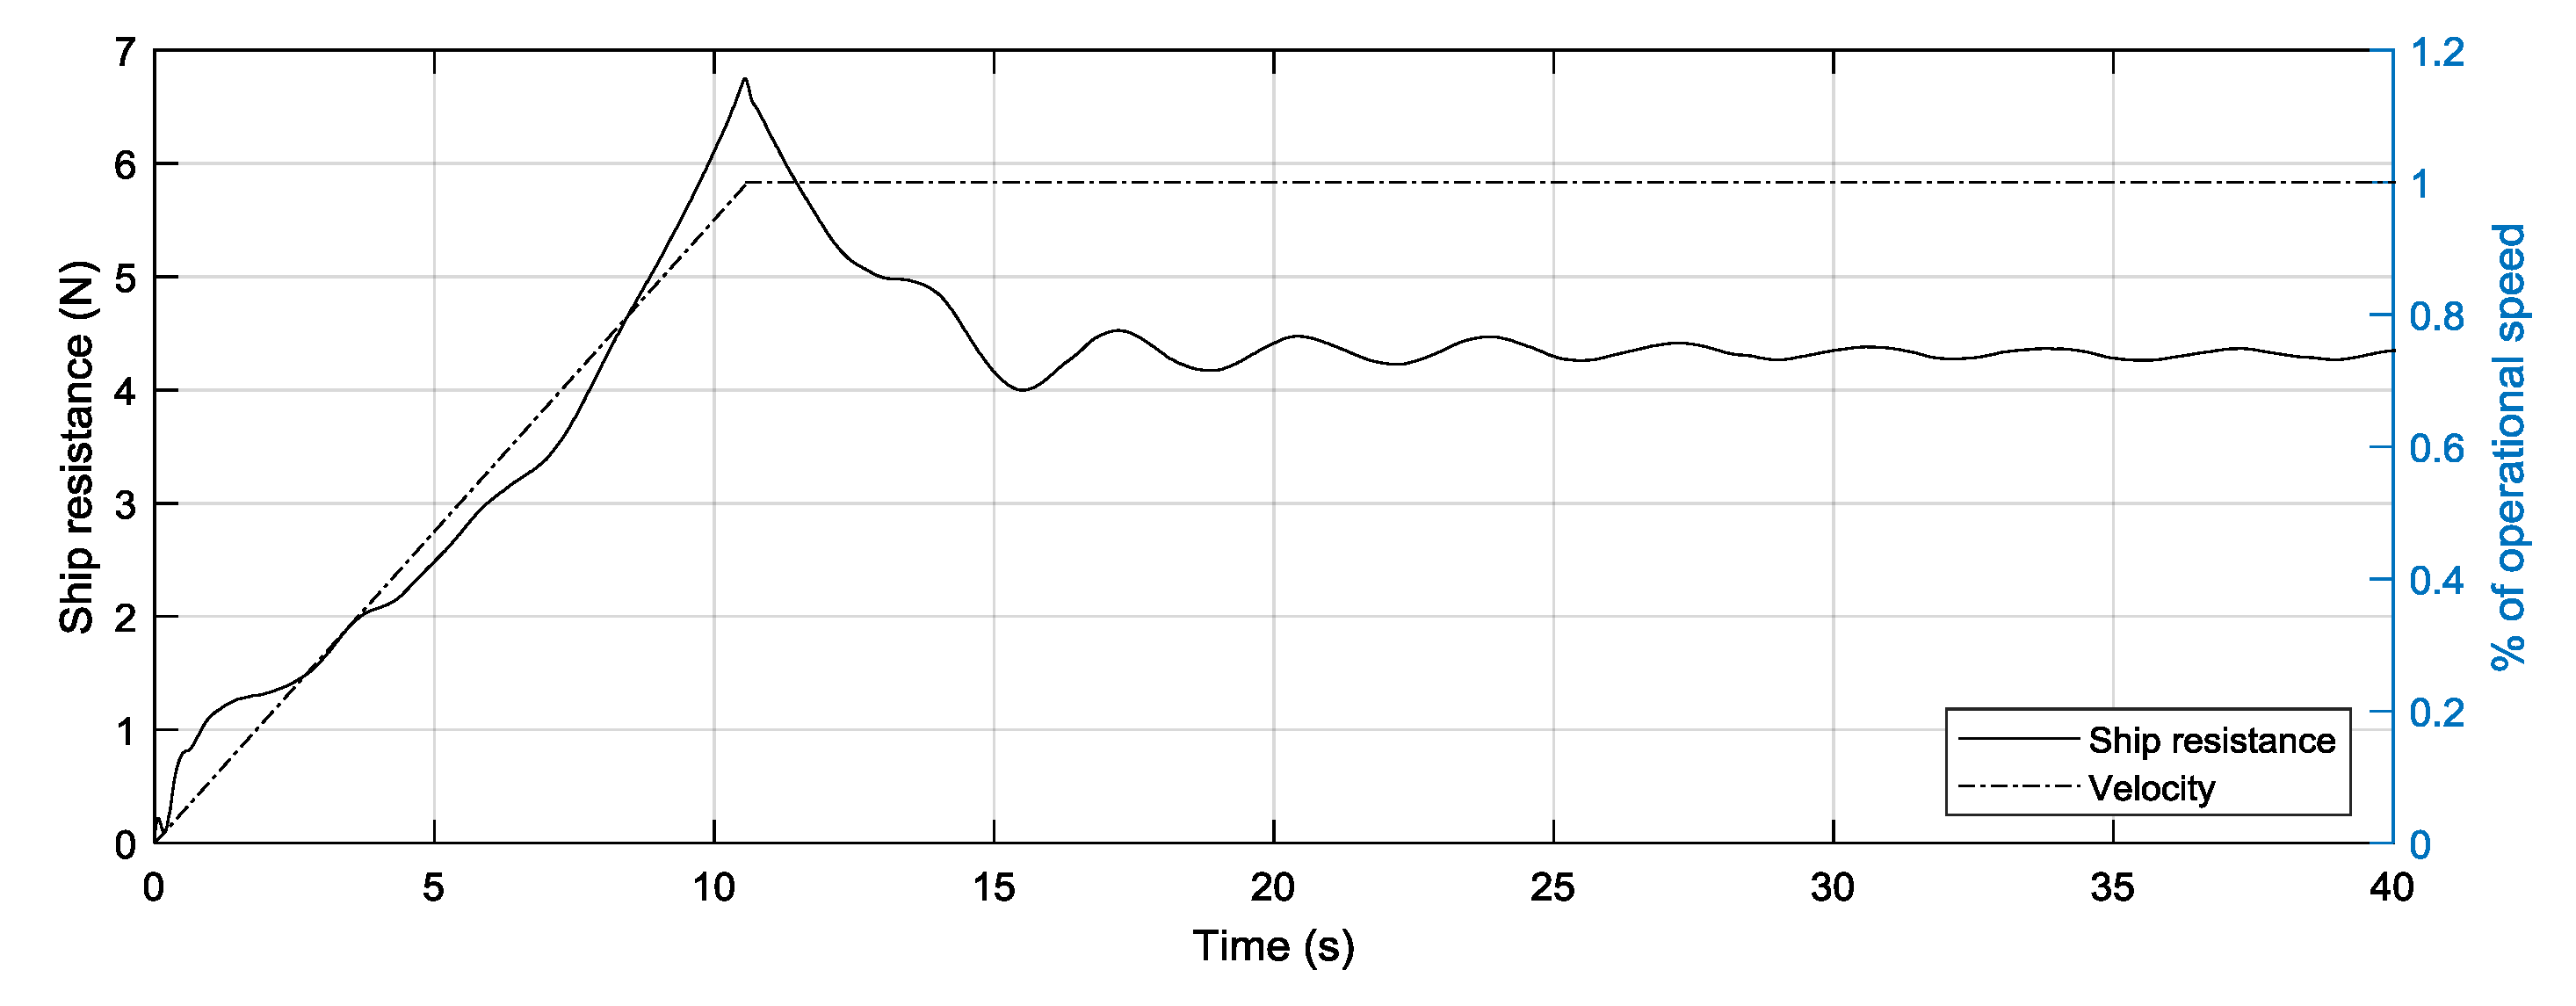
An example time-history of the resistance of the ship is given in Figure 6. The figure is characterised by two distinct regions. Firstly, the ship velocity is linearly increased up to the target velocity. This is done by linking the time-step and velocity. The specific approach adopted requires the ship speed to reach its steady value at the end of the first 1000 time-steps. In other words, the ship’s velocity is increased by U t a r g e t / 1000 each time-step. Thus, after an initial oscillatory behaviour, the resistance time-history exhibits oscillatory convergence towards its steady-state value. The oscillations are liked with the reflections of waves from the side walls, which also impact the observed resistance [39]. All final values reported in this work are obtained by averaging over one period of oscillation of the resistance curve. The specific point where averaging is performed is chosen to be sufficiently far from the acceleration phase to eliminate its effect.

3.1.5. Verification

This section contains the numerical verification of the case study in the rectangular canal, F h = 0.57. The numerical uncertainties are estimated via the grid convergence index (GCI) method. This is the standard way to report numerical uncertainties in ship CFD [40]. It is assumed that the remaining cases are characterised by similar levels of numerical uncertainty.
The GCI method requires three systematically coarsened solutions for the same case. In this study, the recommendations of the ITTC [40] are followed. Specifically, the refinement ratio, r = 2 is adopted. The refinement ratio is used to coarsen and lessen the grid size and time-step, respectively. The GCI method assumes that all three solutions are close to the asymptotic range and are sufficiently different, which may be difficult to achieve in practice. The proximity to the asymptotic range is typically characterised by the convergence ratio, p, which is shown in Equation (1).
p = ln ( ε 32 / ε 21 ) / ln r
where ε 32 = f3 − f2 and ε 21 = f2 − f1. Here, fn represents the n-th solution, generated by a systematic coarsening/lessening of the input parameter (grid or time-step). If p = 2 , then the grid or time-step can be deemed asymptotic [41]. The convergence properties, however, can be determined in a different manner, which also carries information on what type of convergence/divergence is achieved with refinement. This is known as the convergence ratio, R = ε 21 / ε 32 [42]. Based on the value of R, the following may be interpreted:
  • Monotonic convergence is observed if 0 < R < 1;
  • Oscillatory convergence is observed if R < 0;
  • Divergence is observed if R > 1.
The GCI method is only applicable in case (1). Next, an error estimate ( e 21 ) is defined as [43]:
e 21 = ( f 1 f 2 ) / f 1
Once the error is known, the numerical uncertainty can be calculated as shown in Equation (3) [44]:
G C I = 1.25 e 21 / ( r k p 1 )
where k represents the k-th input variable (grid or time-step). The factor 1.25 in the numerator of the expression, defining the numerical uncertainty represents a factor of safety. This has been devised to ensure that the true solution lies within the bracket provided by the GCI with 95% confidence. The results from the convergence study can be seen in Table 4.
The successive grid coarsening resulted in 10,955,825 and 4,155,326 cells for the medium and coarse solutions, respectively. In terms of spatial dependence, the solution exhibited rapid ranges with reduction in cell numbers. This ‘superconvergence’ can be deduced by examining the order of accuracy, p. While in the case of grid coarsening it is approximately 9, when the time-step is lessened, the solution changes according to ptime = 0.463. According to Eca and Hoekstra [45], orders of accuracy between in the range 0.5 and 2 can still be treated as asymptotic. Eca and Hoekstra [45] devised a procedure based on a least-squares fit to estimate the numerical uncertainty. Their method is not employed in this study, because it requires a minimum of four solutions. Further coarsening of the computational mesh resulted in divergent behaviour in the simulation. The consequence of the time-step exhibiting the above order of accuracy means that the GCI method predicts large numerical uncertainties, even though the overall change between the coarse and fine solution is less than 3% of the fine solution’s value.
It should be noted that the time-step is kept at the smallest value while coarsening the grid. Conversely, the finest grid was maintained throughout the temporal convergence analysis. To ensure that the ratio of overset cell to background cell dimension is kept constant, both domains were coarsened simultaneously. In this study, it is assumed that all examined cases will exhibit similar levels of spatial and temporal dependence. For this reason, the above procedure is not repeated.

3.2. Spectral Representation of the Wave Field

In this section, the method devised by Caplier et al. [20] and Gomit et al. [22] is briefly examined. This method has previously been used to determine a ship’s speed via satellite imagery [46,47]. The essence of the approach is to process an available water surface in Fourier space. To achieve this, a 2D Fourier transform is used to represent the disturbance in the spectral space ( k x , k y ). These arise by defining the angular wavenumber, k, as a vector containing x and y components, k = k x 2 + k y 2 . The spatial equivalent of these components are used to calculate the extents of the spectrum. The x-direction length of the entire water surface ( L x ) becomes k x , m a x ; similarly, using the extent in the y-direction ( L y ) one obtains k y , m a x , as shown in Equation (4). Likewise, the resolution of the water surface in real space dictates the steps in Fourier space Δ k x and Δ k y in the x and y directions, respectively (Equation (5)).
k x , m a x = 2 π / L x ,   k y , m a x = 2 π / L y
Δ k x = 1 2 × 2 π Δ X , Δ k y = 1 2 × 2 π Δ Y
where Δ X and Δ Y are the resolutions in the x and y directions, respectively.
If surface tension is ignored, the dispersion relation in shallow water may be expressed via the angular frequency ( ω ) of the waves as shown in Equation (6). This is justified, because surface tension becomes important only in waves characterised by wavelengths smaller than 7 cm. Alternatively, the travelling disturbance should propagate with a speed higher than 0.23 m/s [48] for surface tension to be negligible.
ω ( k ) = ± g k tanh k h
A moving ship will cause the waves to be Doppler-shifted, and setting ω = ω U k x and k = k , the resulting dispersion relation becomes [20]:
ω ( k ) = ± g k tanh k h U k x
To obtain the locus of the dispersion relation, Equation (7) is solved for ω ( k ) = 0 [49], which yields:
U 2 k x 2 g k x 2 + k y 2 tanh ( h k x 2 + k y 2 ) = 0
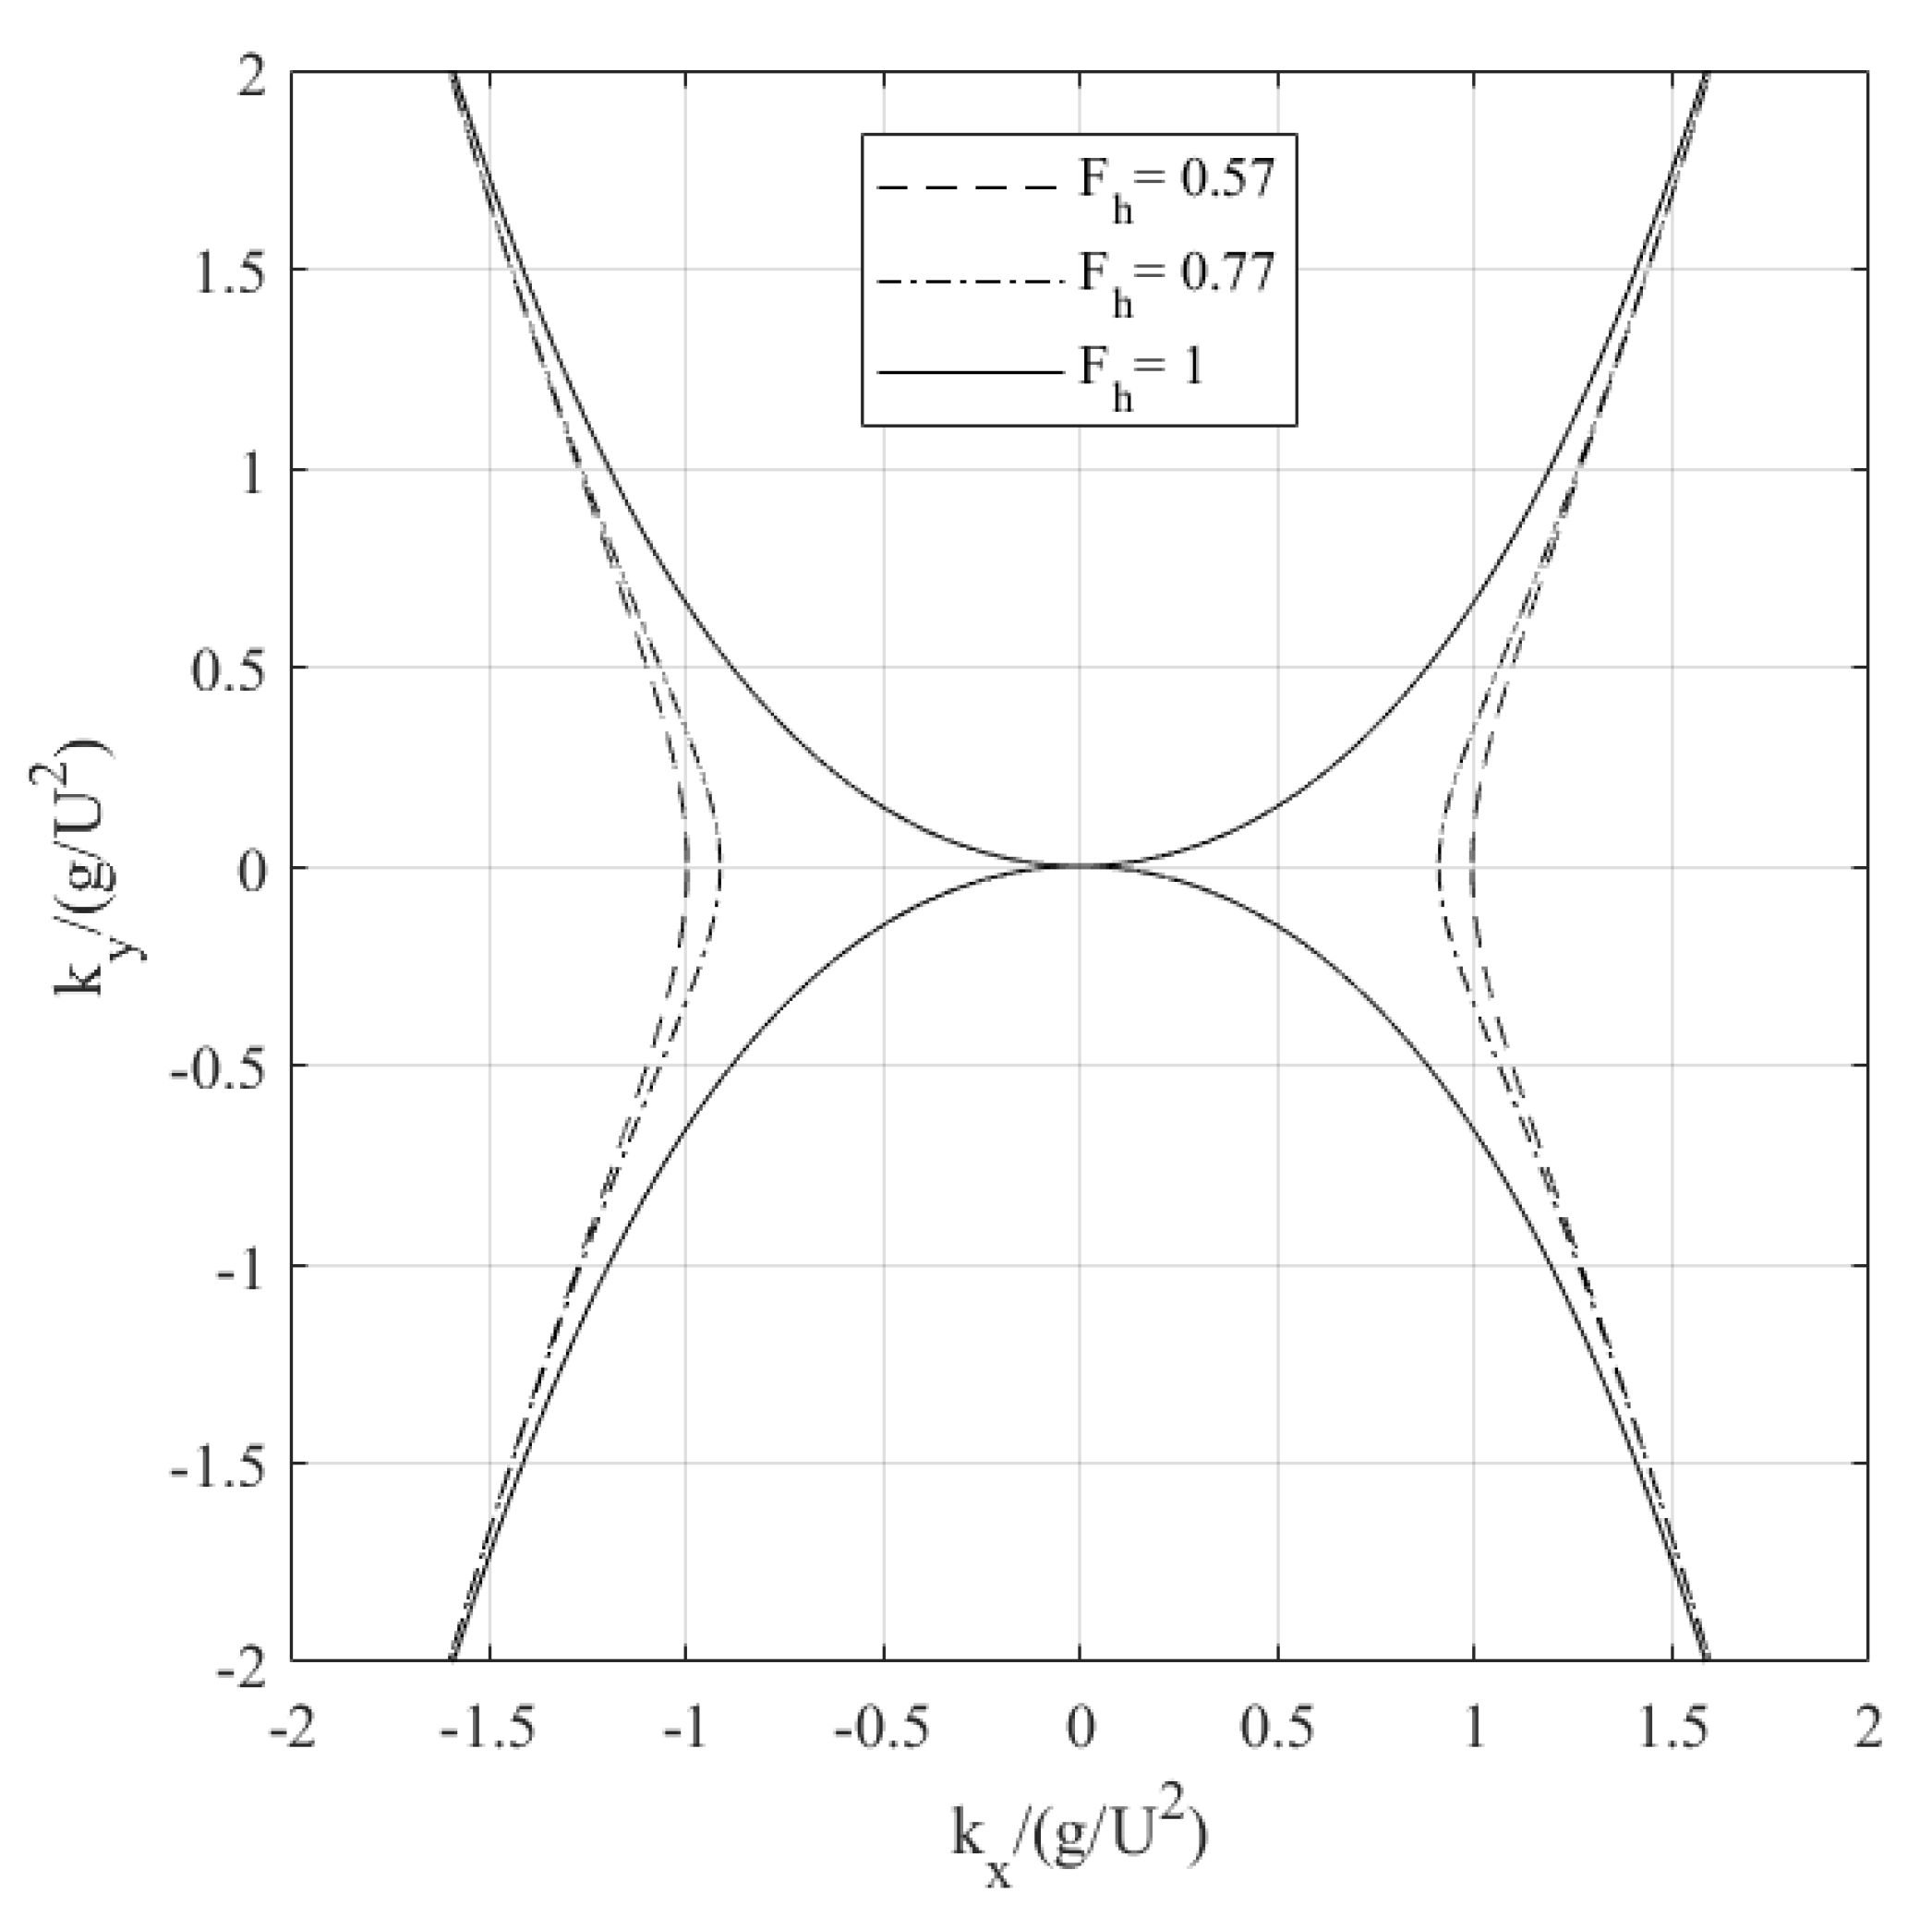
Equation (8) is symmetrical with respect to both axes [50]. This is demonstrated in Figure 7, which includes computed loci (this is used to represent the solutions of Equation (8)) for F h = 0.57, 0.77, according to the adopted cases. Alongside these, the critical depth Froude number is depicted to demonstrate the effect of ship speed on the dispersion relation in shallow water. It should be noted that the dispersion relation is speed-independent in deep water [20]. The arms of the loci always begin at k y , x / ( g / U 2 ) = 1 in deep water. This is also the cut-off wavenumber. In shallow waters on the other hand, the cut-off wavenumber varies with speed. This can be seen by consulting Figure 7, specifically, where the curves cross the abscissa. Here, the case for F h = 0.47 is not shown, as it is practically impossible to distinguish it from the F h = 0.57 case. Deep and shallow water cases are essentially identical when k h   1 .
The cut-off wavenumber separates the near-field disturbance from the far-field waves generated by the ship. Thus, useful analysis with applications to loads on coastal structures may be performed by removing the near-field disturbance, which does not propagate away from the ship. To determine the cut-off wavenumber ( k x c ) in shallow water, Caplier et al. [20] solved Equation (9).
U 2 k x c g k x c tanh ( h k x c ) = 0
Finally, the Kelvin half-angle may be determined by computing tan θ = ( d k y / d k x ) 1 at the inflection point. According to Nakos and Sclavounos [51], numerical errors will manifest near cut-off wavenumbers. This can be deduced by examining Figure 7. Even a small deviation in the intersection between the locus and the abscissa will lead to large errors. The specific example given demonstrates the relatively short distance between the intersection points of F h = 0.57 and 0.77. On the other hand, as the speed is increased further, the locus approaches the origin. At the critical depth Froude number, the locus will transition into crossing the origin and progressing into a quadrant characterised by opposite signs of the abscissa and ordinate.
The manner in which a numerical free surface generates this pattern is in terms of maxima of the spectrum in Fourier space. This can be extracted and compared to the theoretical prediction provided by Equation (8). Caplier et al. [20] demonstrated that the relationship holds well despite its neglect of nonlinear and three-dimensional terms. Thus, if one can prove that a numerically generated free surface (once processed to the spectral domain) provides maxima near the locus, then the free surface can be considered validated. This is explored in the following section.

4. Results and Discussion

The presentation and analysis of the results generated in this study are split into two major parts. The first relates to the computed ship resistance coefficients, while the second subsection relates to the spectral analysis of ship waves.

4.1. Ship Resistance

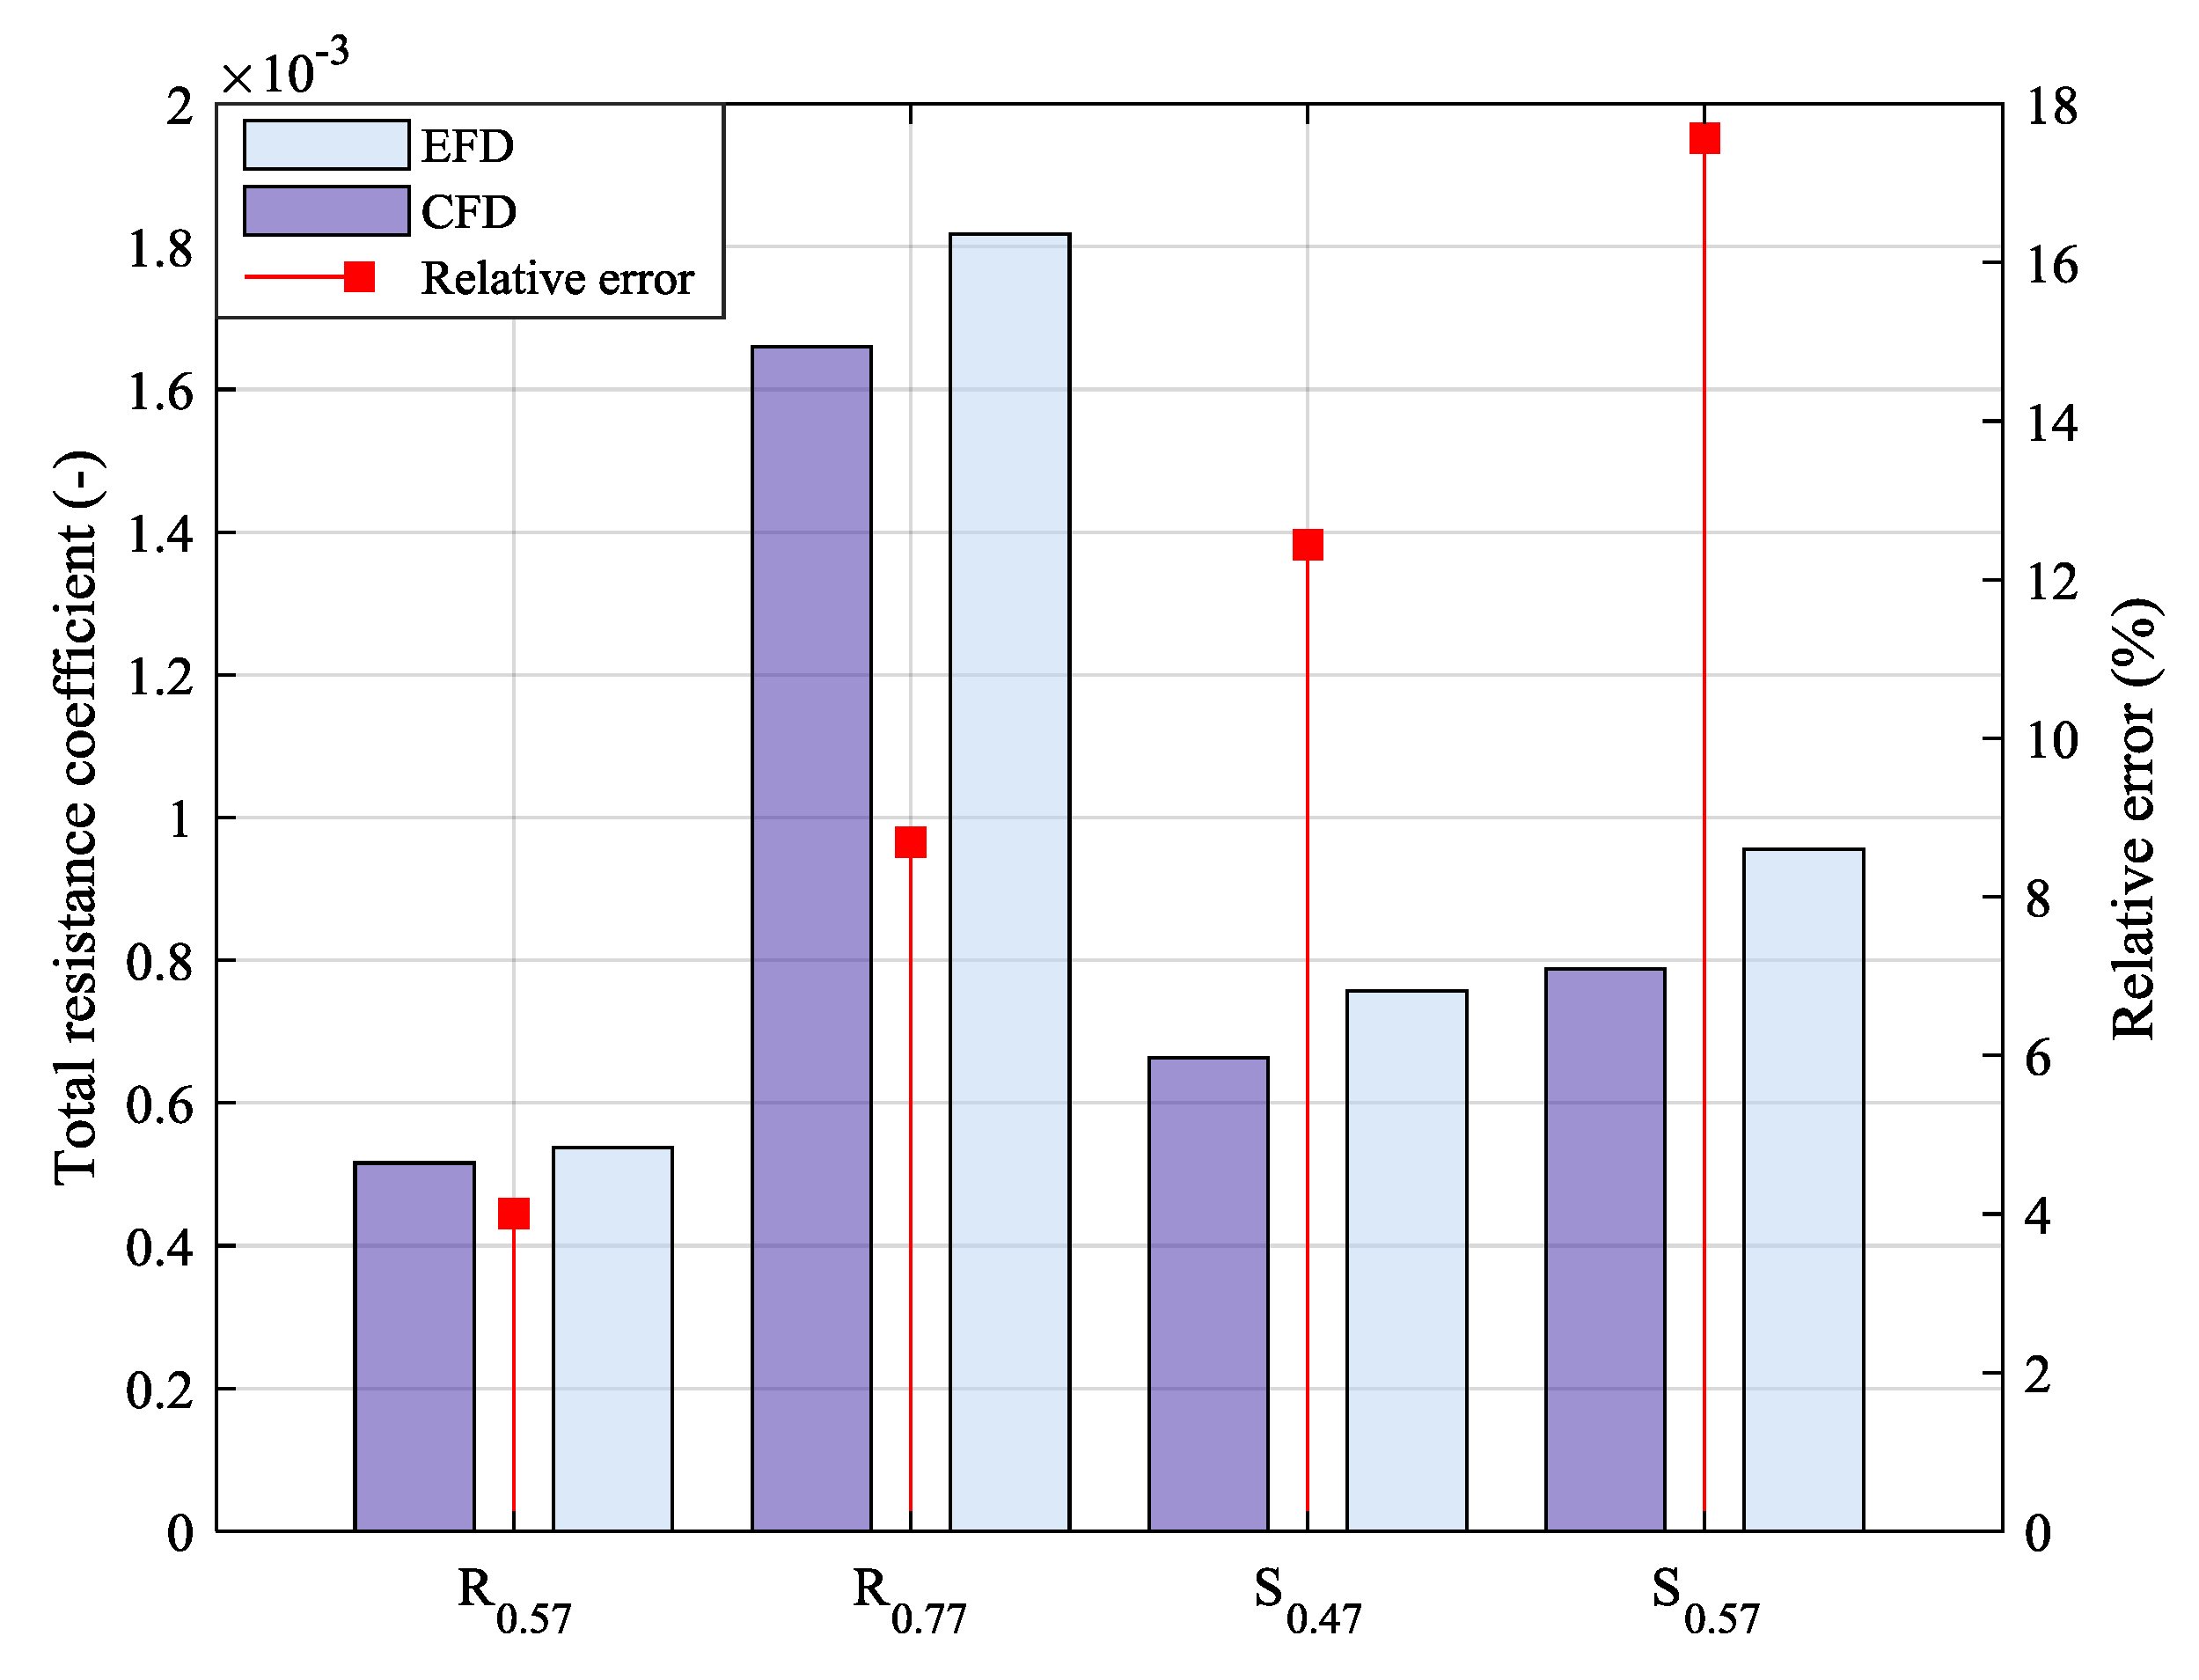
In this subsection, the numerically obtained resistance is briefly discussed and compared to the experimental data. To begin with, the total resistance coefficients are presented in Figure 8 for all cases. The experimental data of Elsherbiny et al. [23] is included alongside each numerical result to enable comparison. Figure 8 clearly indicates the numerical prediction has a well-defined tendency to underpredict the experimental data. Here, the subscripts refer to depth Froude number. As one might expect, the ship’s resistance at higher speeds becomes more challenging to predict by CFD. This is evident, especially in the resistance characteristics at the highest depth Froude number for each case.
The overall agreement between the experimental and numerical data is encouraging. This is the first sign that the constructed towing tank is capable of providing good predictions for the resistance of a ship. Possible sources of discrepancy are suspected to stem from the fact that the numerical approach did not model sinkage and trim. In shallow waters, their combined effect, termed ship squat, is attributed greater relative importance than in deep waters. Thus, the imperfect modelling adopted may have been partly the cause of the observed levels of discrepancy between the experimental and numerical results. Moreover, as the ship speed is increased, the difference also grows. This matches the pattern observed in the sinkage and trim curves for a ship, both theoretically [52,53] as well as numerically [54]. Turbulence modelling is also a source of error in the results presented herein. Based on previous research, it is expected and indeed observed that the kω model has a tendency to underpredict resistance [31]. More sophisticated modelling approaches, such as those accounting for transition or those resolving large parts of the turbulent kinetic energy spectrum, should be used to assess the sensitivity of the adopted approach to turbulence modelling. Recent studies have demonstrated that the latter approach can be highly beneficial in terms of accuracy [55].
In practice, the cell numbers used in this study tend towards being prohibitively high. As stated earlier, a virtual towing tank where the principle of Galilean invariance has been utilised will consist of no more than 2–3 million cells. Such simulations can be performed within a few days on a standard computer. Thus, the adopted approach of virtually towing the ship may not become widespread soon. Nevertheless, the additional information that may be extracted from a case such as this can be useful. An example of this is given in the following subsection.

4.2. Spectral Analysis of the Numerical Free Surface

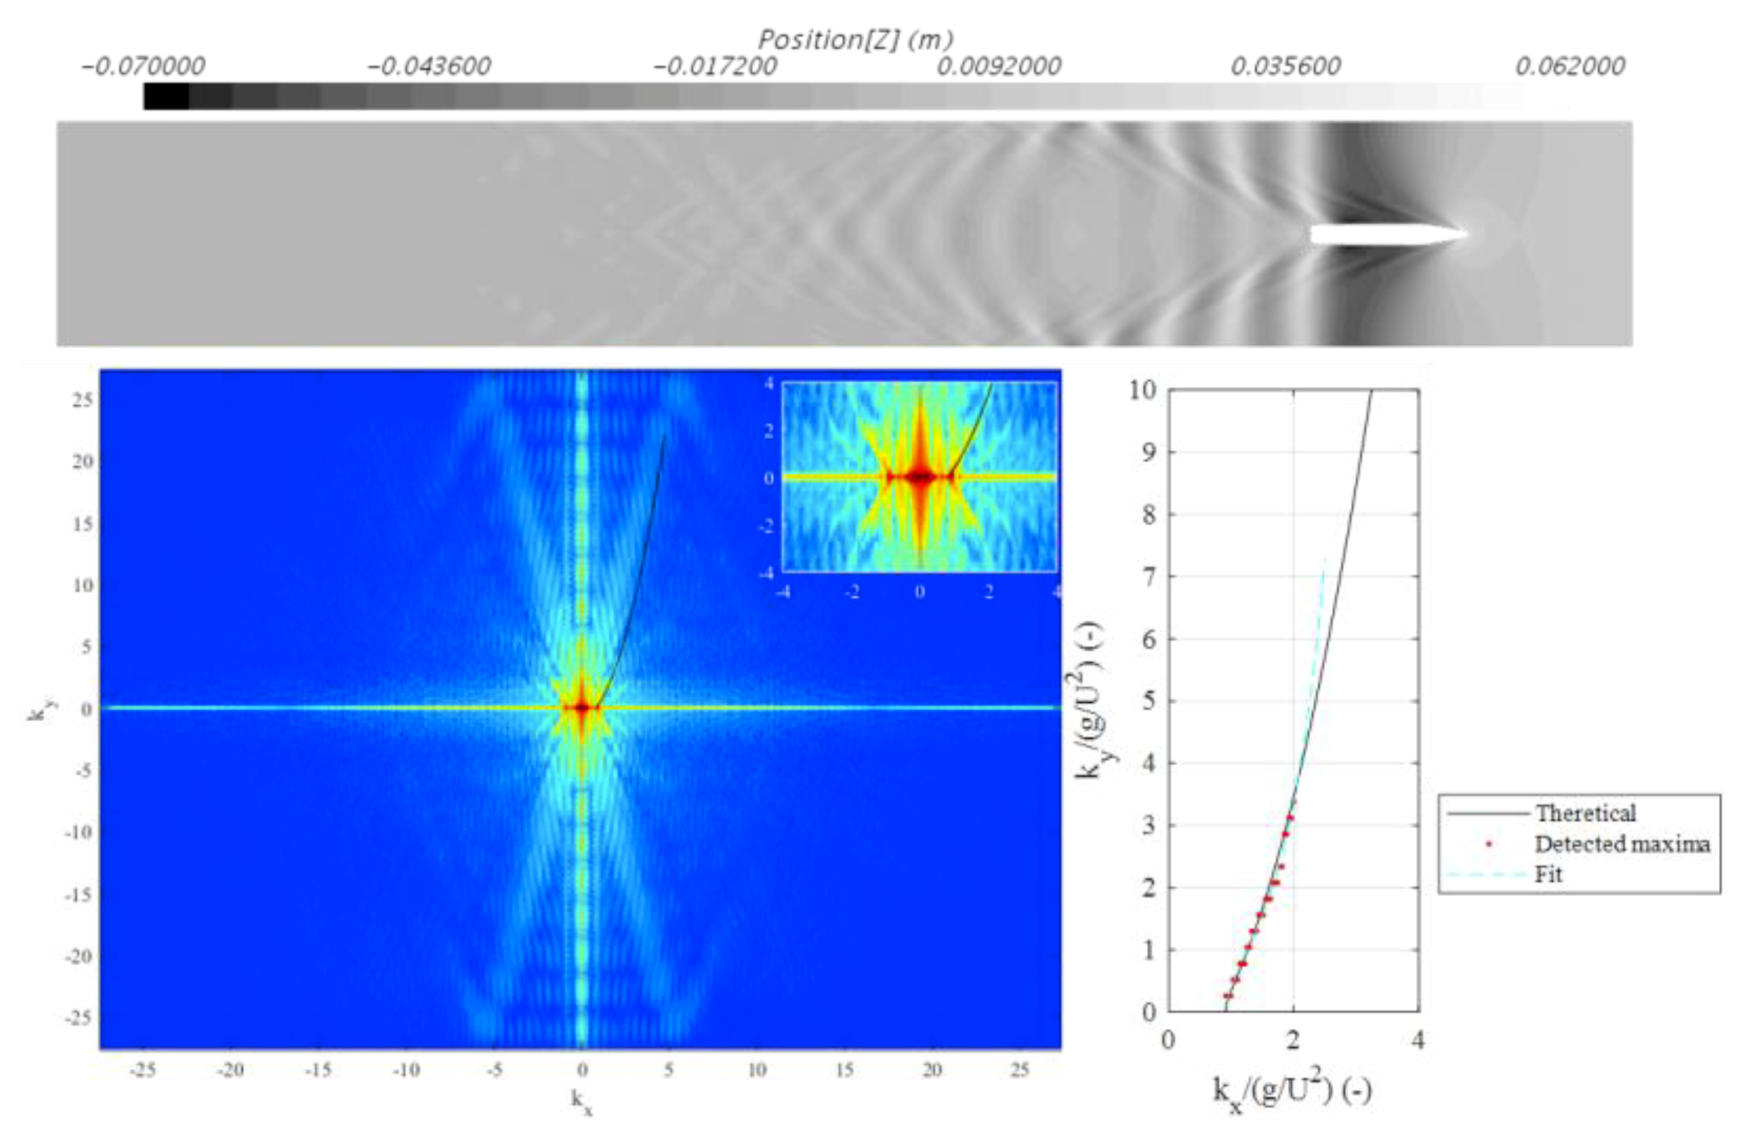
We begin by examining the highest speed, simulated in the virtual towing tank, F h = 0.77 in the rectangular canal. The numerical free surface is depicted in Figure 9. Here, the far-field waves generated by the ship are clearly visible. Due to the lateral restriction, waves have reflected approximately 2.5 ship lengths aft of the ship. It should be noted that Figure 9 and other figures are reflected around the central symmetry plane to enable a better visualisation.
At this point, it is useful to attempt to determine the wave angle. According to Havelock’s [17] method, the Kelvin half-angle is θ = 21.58 ° . Figure 10 depicts an attempt at solving this problem by projecting a (dashed) straight line from the forward perpendicular (FP) to the sides (and its reflection) at an angle of 21.58 ° . The line ‘lands’ at a wave trough on the canal wall—clearly, this is not the correct approach. The solid line in Figure 10 represents the same process but in this case beginning from the nearest peak downstream at the wall and projecting in both directions. The line intersects the ship approximately ¼L from the forward perpendicular. Then, the broken line is initiated at the highest peak at the wall, where wave reflection occurs. This intersects the ship approximately ¾ L from the FP. Finally, the dotted line shows the same process. It originates at the point of the ship defined by [min(x), max(y)], representing the point where the aft wave system is generated.
Clearly, neither line in Figure 10 accounts for the wave angle well. This is not surprising since the method used to estimate the half-angle is linear and devised for a point source. In this case, the spectral representation may be used to approach the problem. As explained earlier, the first step is to calculate the Fourier transform of the wave field. This is performed in MATLAB, which uses grayscale images. For this reason, the images used henceforth to represent the free surface will be shown in the grayscale format used to perform the analysis. By doing so, other researchers may cross-reference results obtained herein by analysing the provided images.
Figure 11 depicts the process used in this study. Specifically, the image is first represented in Fourier space. Then, for each column of the matrix defining the Fourier transform, a maximum is identified. The kx, ky components of these maxima are then compared to the theoretical relationship provided by Equation (8). A polynomial fit is constructed from these points to demonstrate the accuracy of large and small kx on the fit. In the present case, it is apparent that as one progresses in the kx range to higher values, agreement deteriorates quickly. According to Nakos and Sclavounos [51], insufficient grid resolution will be manifest as numerical dispersion in the kx, ky plane being curved towards high values of kx, eventually forming closed curves. Since this is not what is observed in the present study, it may be concluded that the numerical wave field is represented with sufficient grid resolution. Nonlinear phenomena will be revealed in the appearance of additional branches in the spectrum. In each quadrant, a branch, emanating from the origin and propagating linearly to the edge of the plot, where it reflects, is observed. Moreover, smaller branches of the dispersion relation are observed, with origins at higher kx values, indicating nonlinearity [21]. These lead to deformation of the wake in the real space.
Now, it is important to deduce the origin of the apparent disagreement in the high kx region, as well as its effect on the predicted Kelvin half-angle. One source of disagreement inevitably stems from the fact that the dispersion relation used for comparison is linear [56]. Ship waves, particularly in shallow water, are nonlinear. Even in deep waters, Ma et al. [57] found significant nonlinear influence on the dynamic pressure of the KCS. On the other hand, the experimental data presented in Caplier et al. [20] suggest that the theory approximates real ship waves very well for the Wigley hull. This may not be a fair comparison, because nonlinear effects for the Wigley hull are known to be small [57,58,59]. In other words, using the parabolic hull plays to the method’s strengths.
The neglect of nonlinear terms is chiefly manifest in the near-field disturbance, close to the ship. Although a modification to the Kelvin half-angle may be produced as a consequence of modified pressure in the near-field, the magnitude of such an effect is not known. Interference between transverse and divergent waves, generated at the ship’s bow, may be one cause of the observed disagreement [60]. This interference effect, along with the nonlinearity exhibited by the KCS, and the influence of viscosity are all thought to be the contributing to the observed discrepancy.
There is one more aspect of the solution that one should consider carefully. This relates to the curve fit used to approximate the numerical dispersion for higher kx values than maxima were detected for. In shallow waters, the arms of the locus are typically not well developed [20]. Thus, it is difficult to extract a sufficient number of points to perform the analysis. For this reason, the only fair assessment recommended is within the range where maxima have been detected from the Fourier transform. The range kx/(g/U2) [1, 2.5] is used to perform all subsequent analysis. This includes part of the fit over which no maxima have been detected to illustrate the effect of limited data samples.
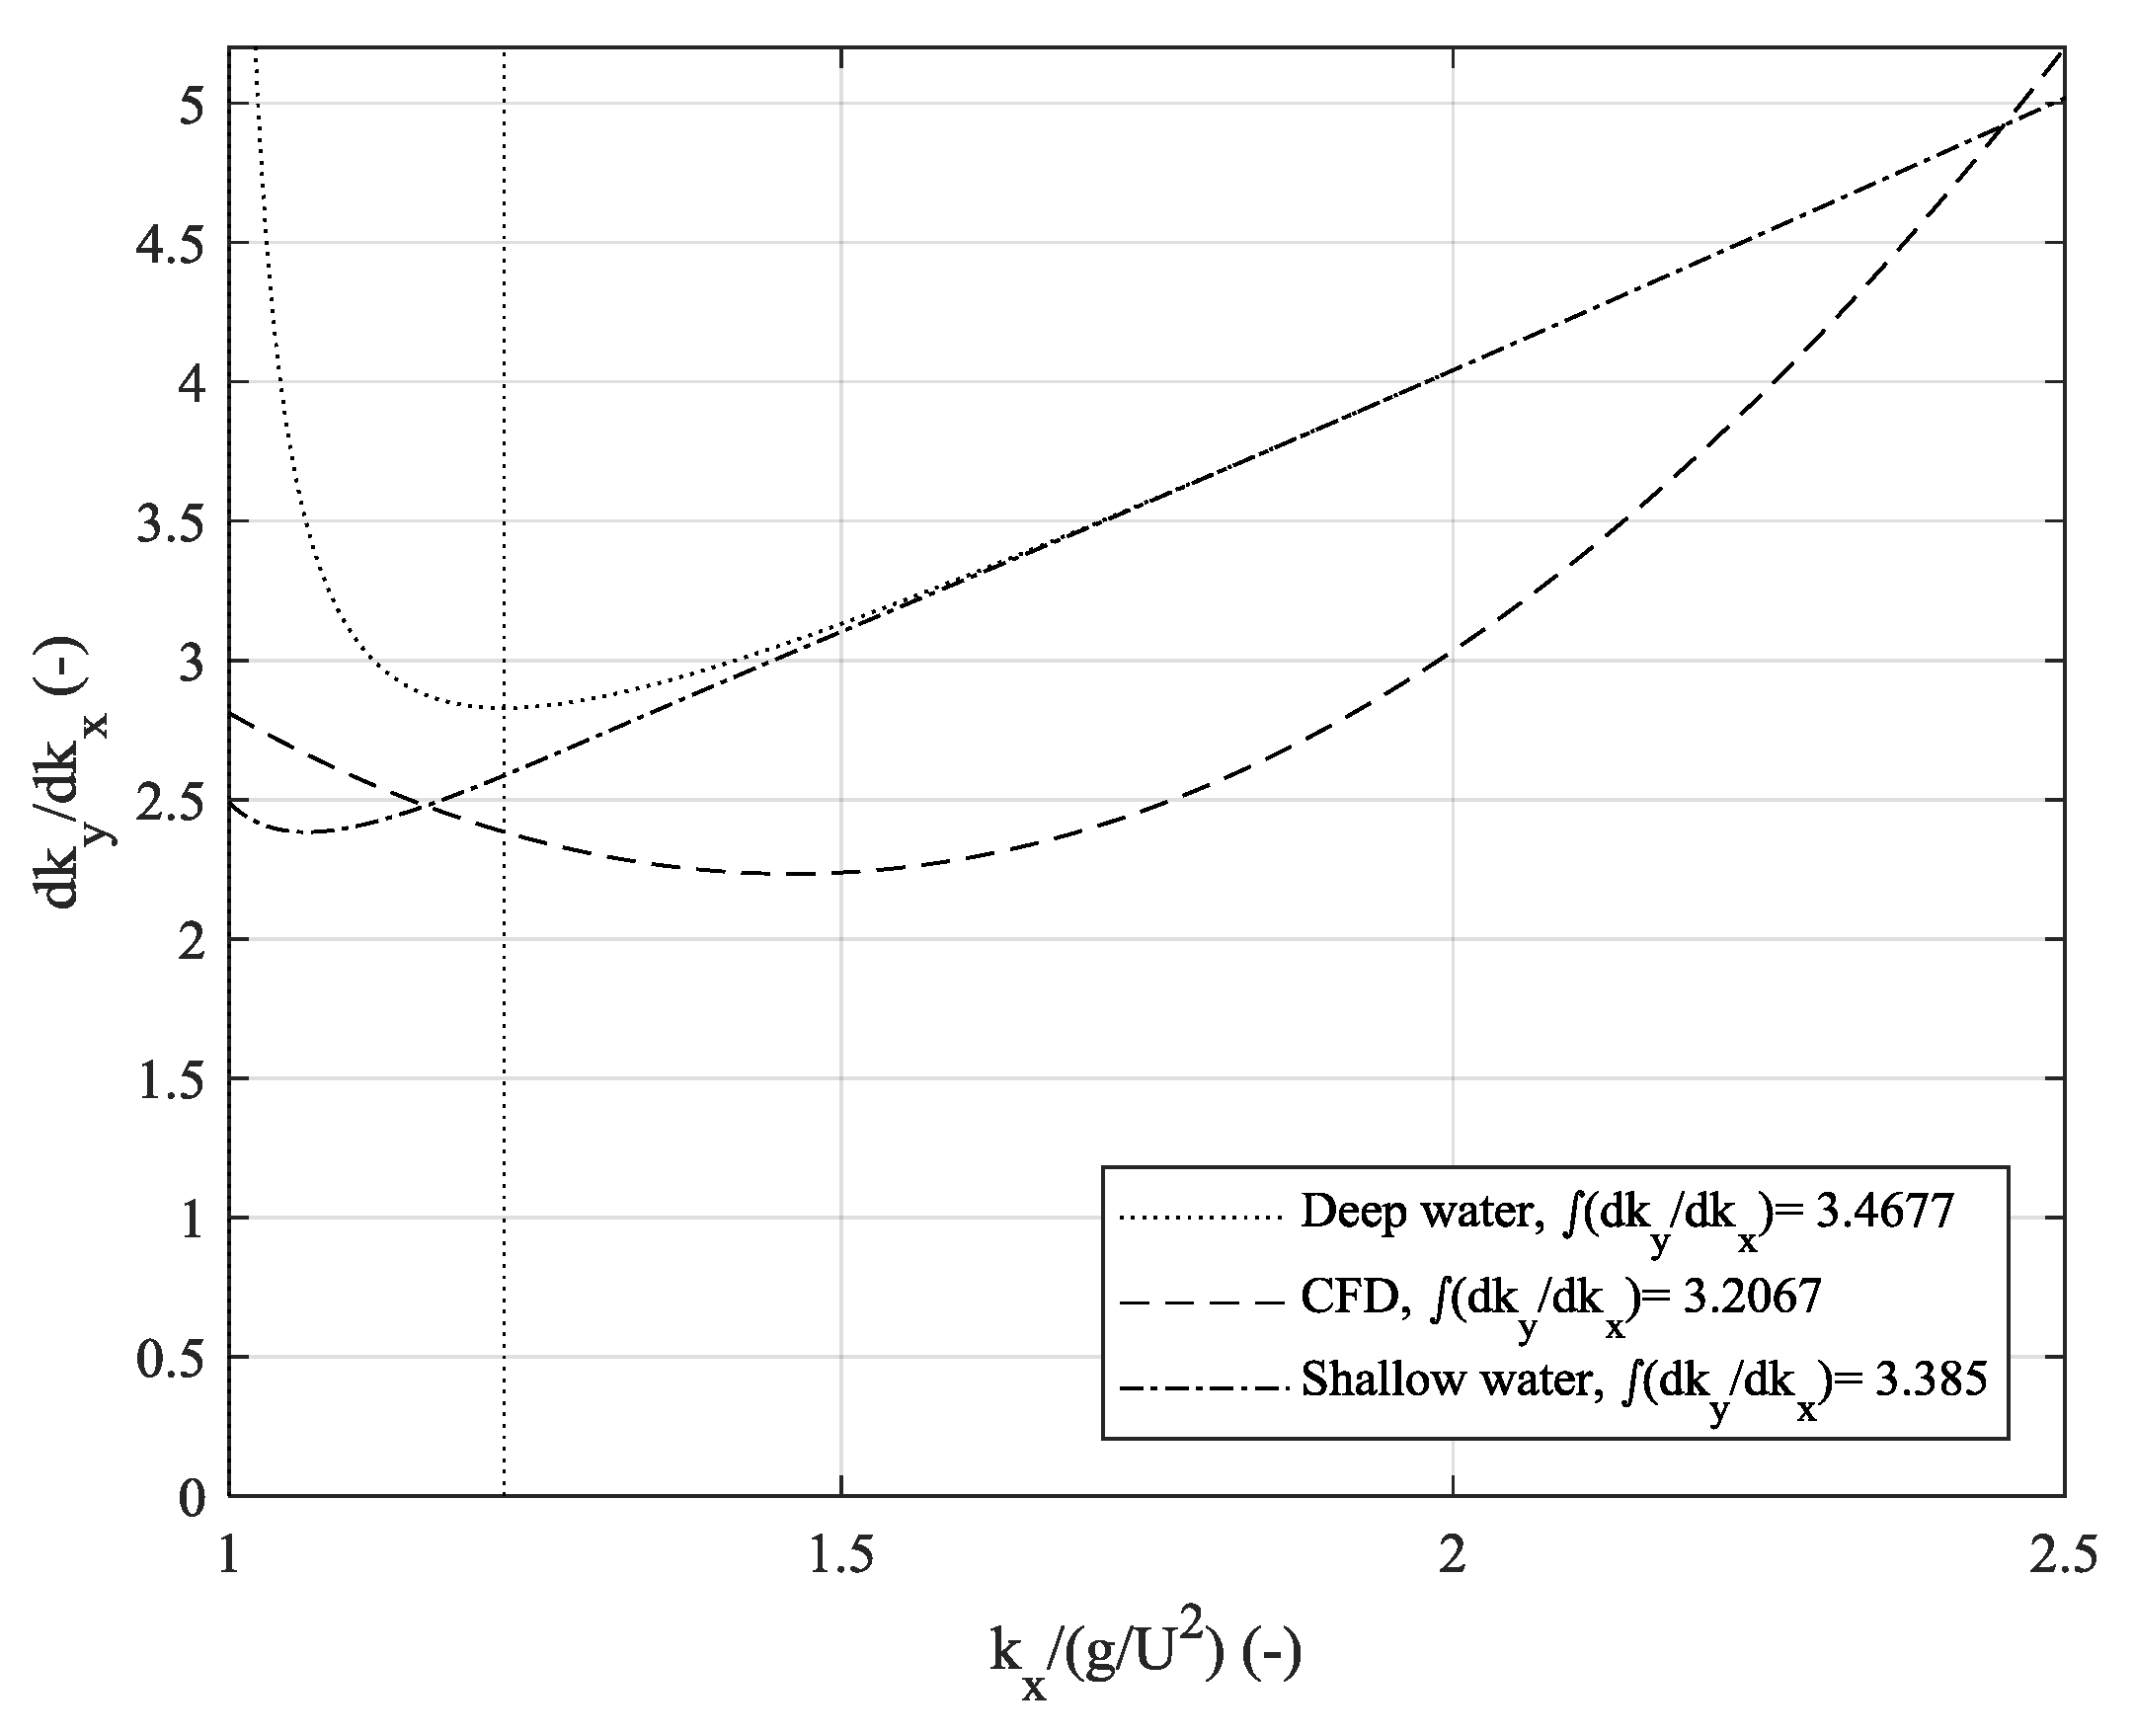
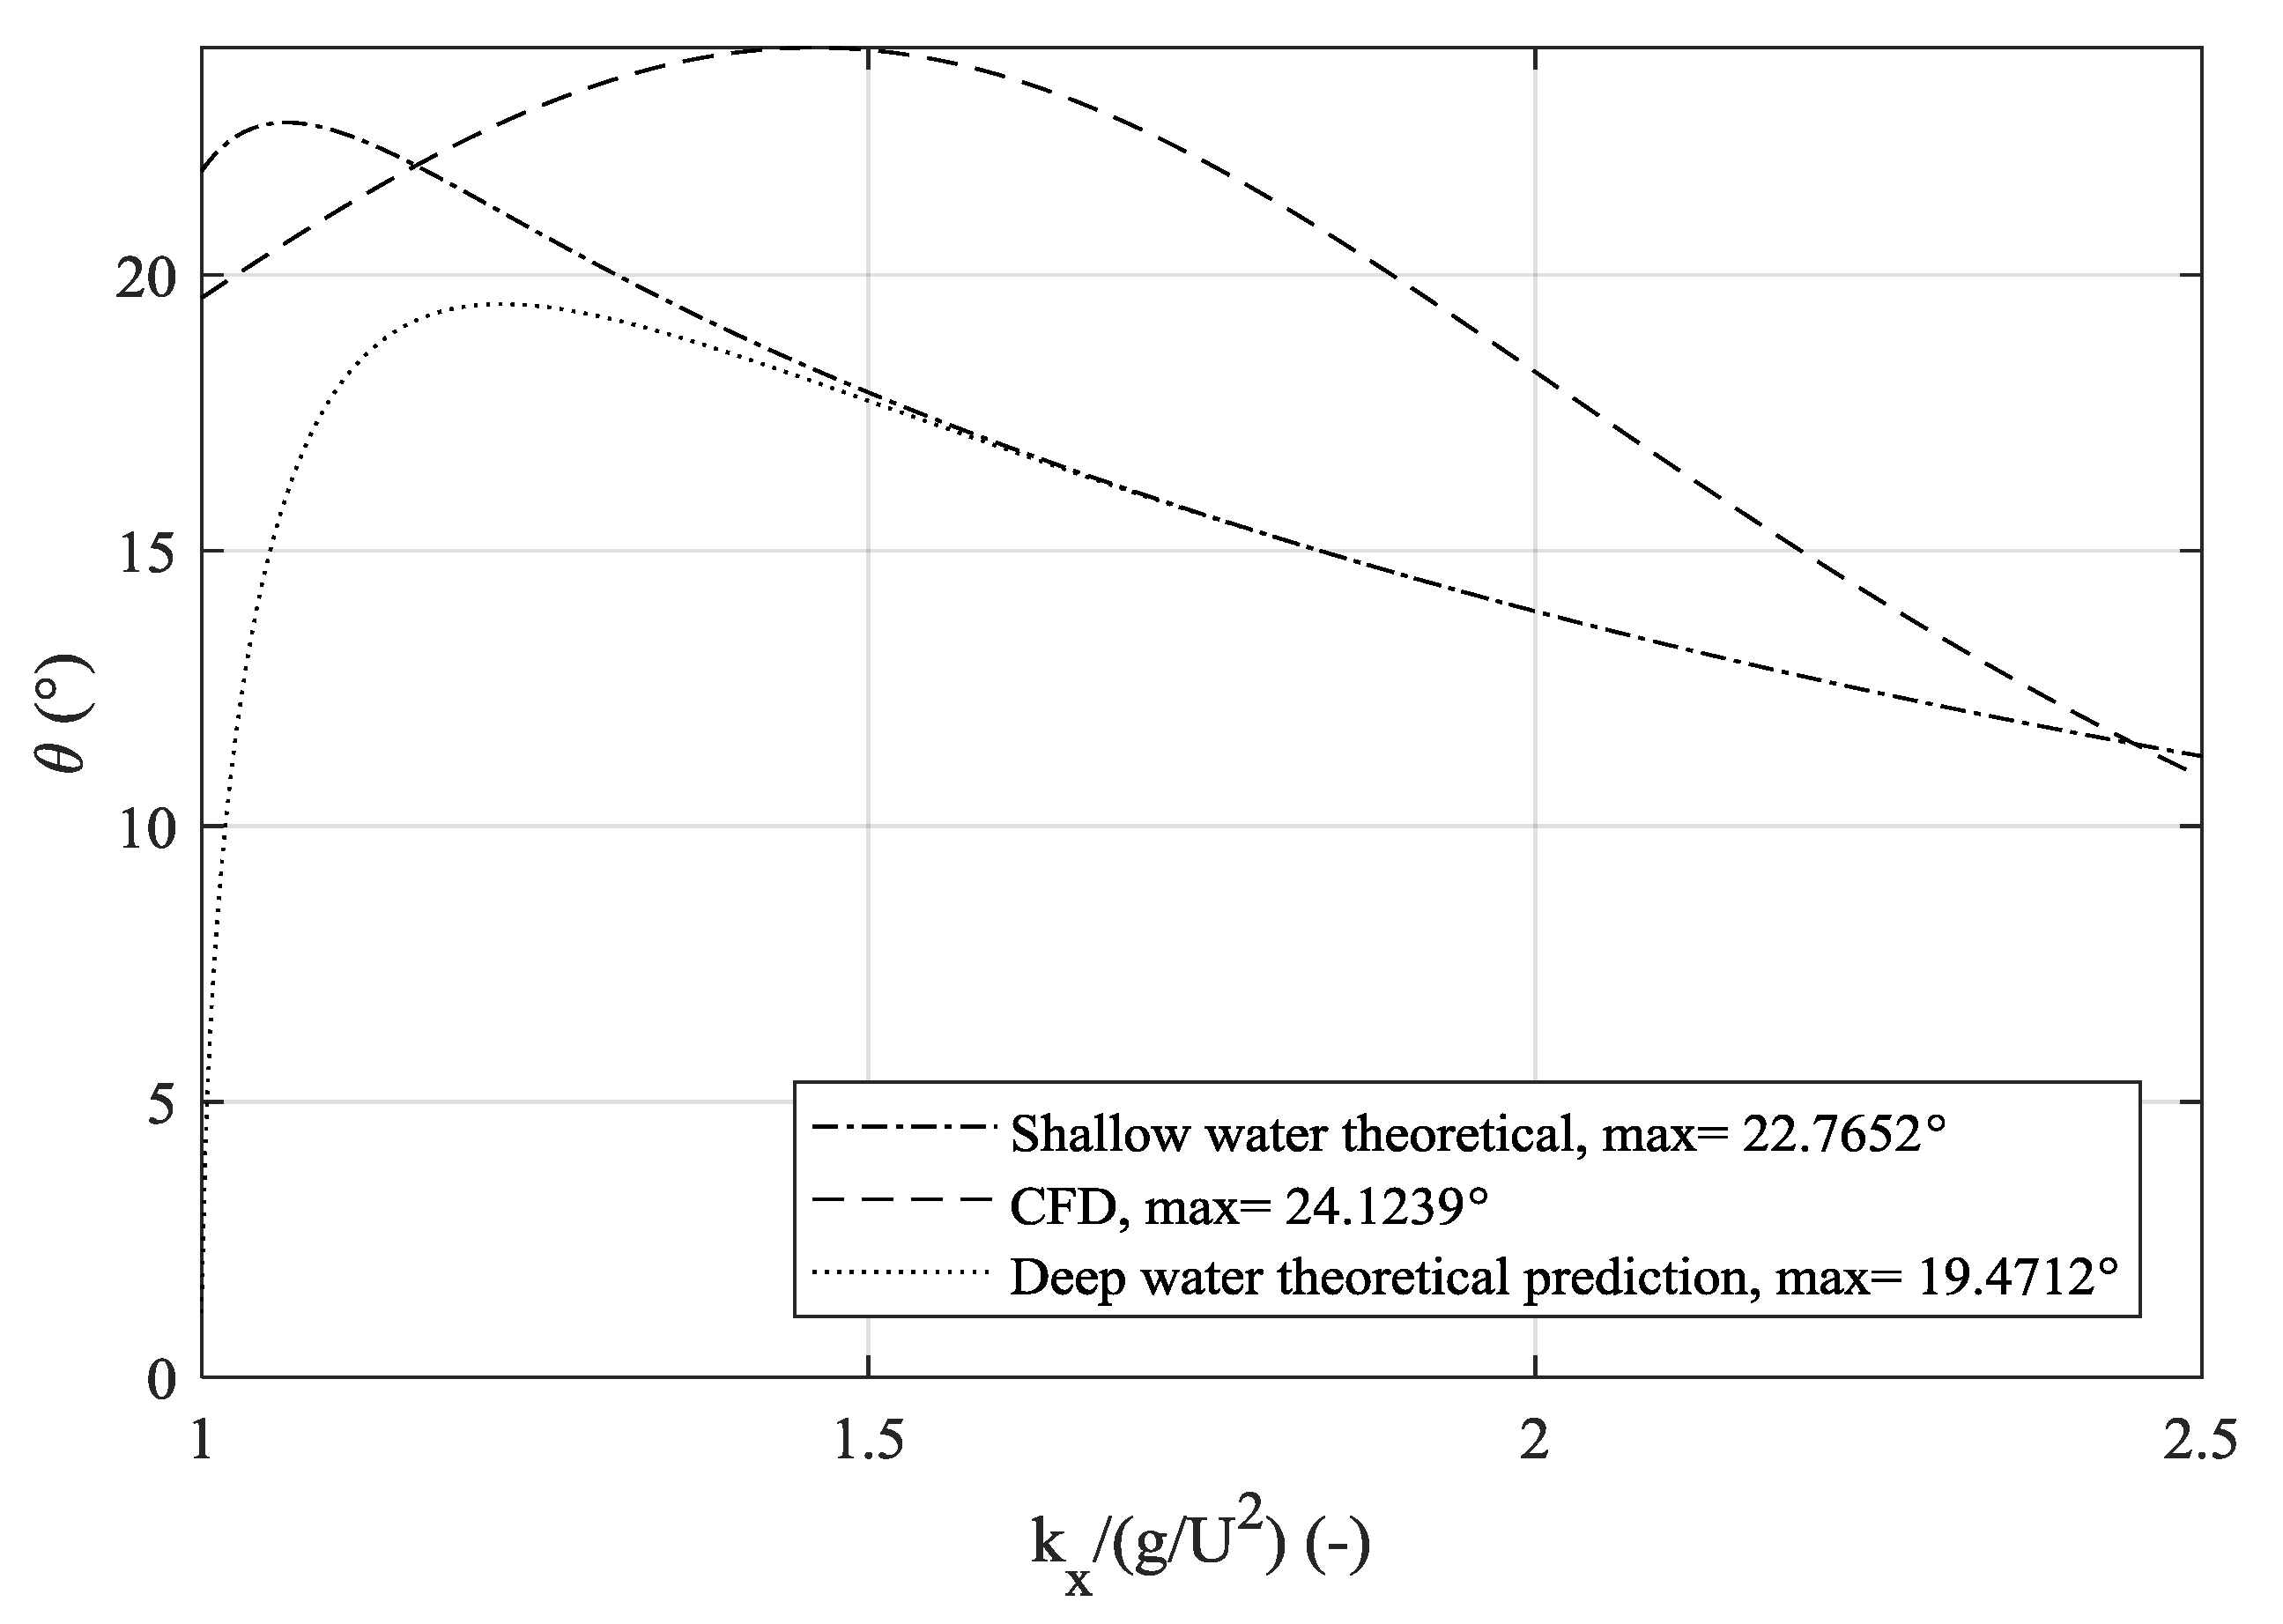
Figure 12 contains the derivatives dky/dkx for deep and shallow water, alongside the numerically generated fit from CFD. This is shown because upon evaluating dky/dkx at the inflection point, the Kelvin half-angle can be obtained. Moreover, Nakos and Sclavounos [51] recommend the examination of these derivatives to highlight differences between numerical and theoretical dispersion relations. Figure 12 also includes the area under each curve for reference. Clearly, assessing solely the area under each curve is not a good approach to determine an apparent disagreement, or error, which is −3.901% in this case. This is the case because different parts of the kx range over which the derivative is shown may attenuate or reinforce the total favourably. On the other hand, the RMS (root mean square) of the difference between the theoretical and numerical curve is predicted as 0.456. The effect of this on the predicted half-angle is illustrated in Figure 13, where the consequences of the previously examined differences are highlighted.
The net effect of the difference between the fit and theoretical curves is translated into a difference of approximately 2.6 ° in the predicted half-angle. This is not considered as a substantial discrepancy. However, the locations where inflection occurs are significantly different between the two sets of data. This occurs at kx,theory/(g/U2) = 1.06 according to the theoretical relationship, whereas CFD predicts this at kx,CFD/(g/U2) 1.46. The identification of this half-angle does not help in visualising the wake better. Plotting a line with origins at the bow with an angle of 24.1 ° causes an intersection with the wall earlier than what is shown in Figure 10. The relative error between the two predictions is 5.93% (arrived at by computing |(θtheoryθCFD)/ θtheory × 100)|).
There are several aspects of this technique that should be improved. Firstly, the range over which it is acceptable to find maxima of the Fourier transform should be defined. The only way to accomplish this is via an extensive experimental campaign. If such an interval is known, then it may be possible to define a metric expressing the degree to which waves are correctly modelled. It may also be possible to link specific parts of the computational free surface with increased error in the representation of ship waves. The only manner in which this can be achieved is via experimental work, which should demonstrate the validity of the assumptions as they apply to waves generated by a ship, rather than point sources. Specifically, this concerns ships causing highly nonlinear flows, thereby generating waves that may not resemble the method’s predictions well.
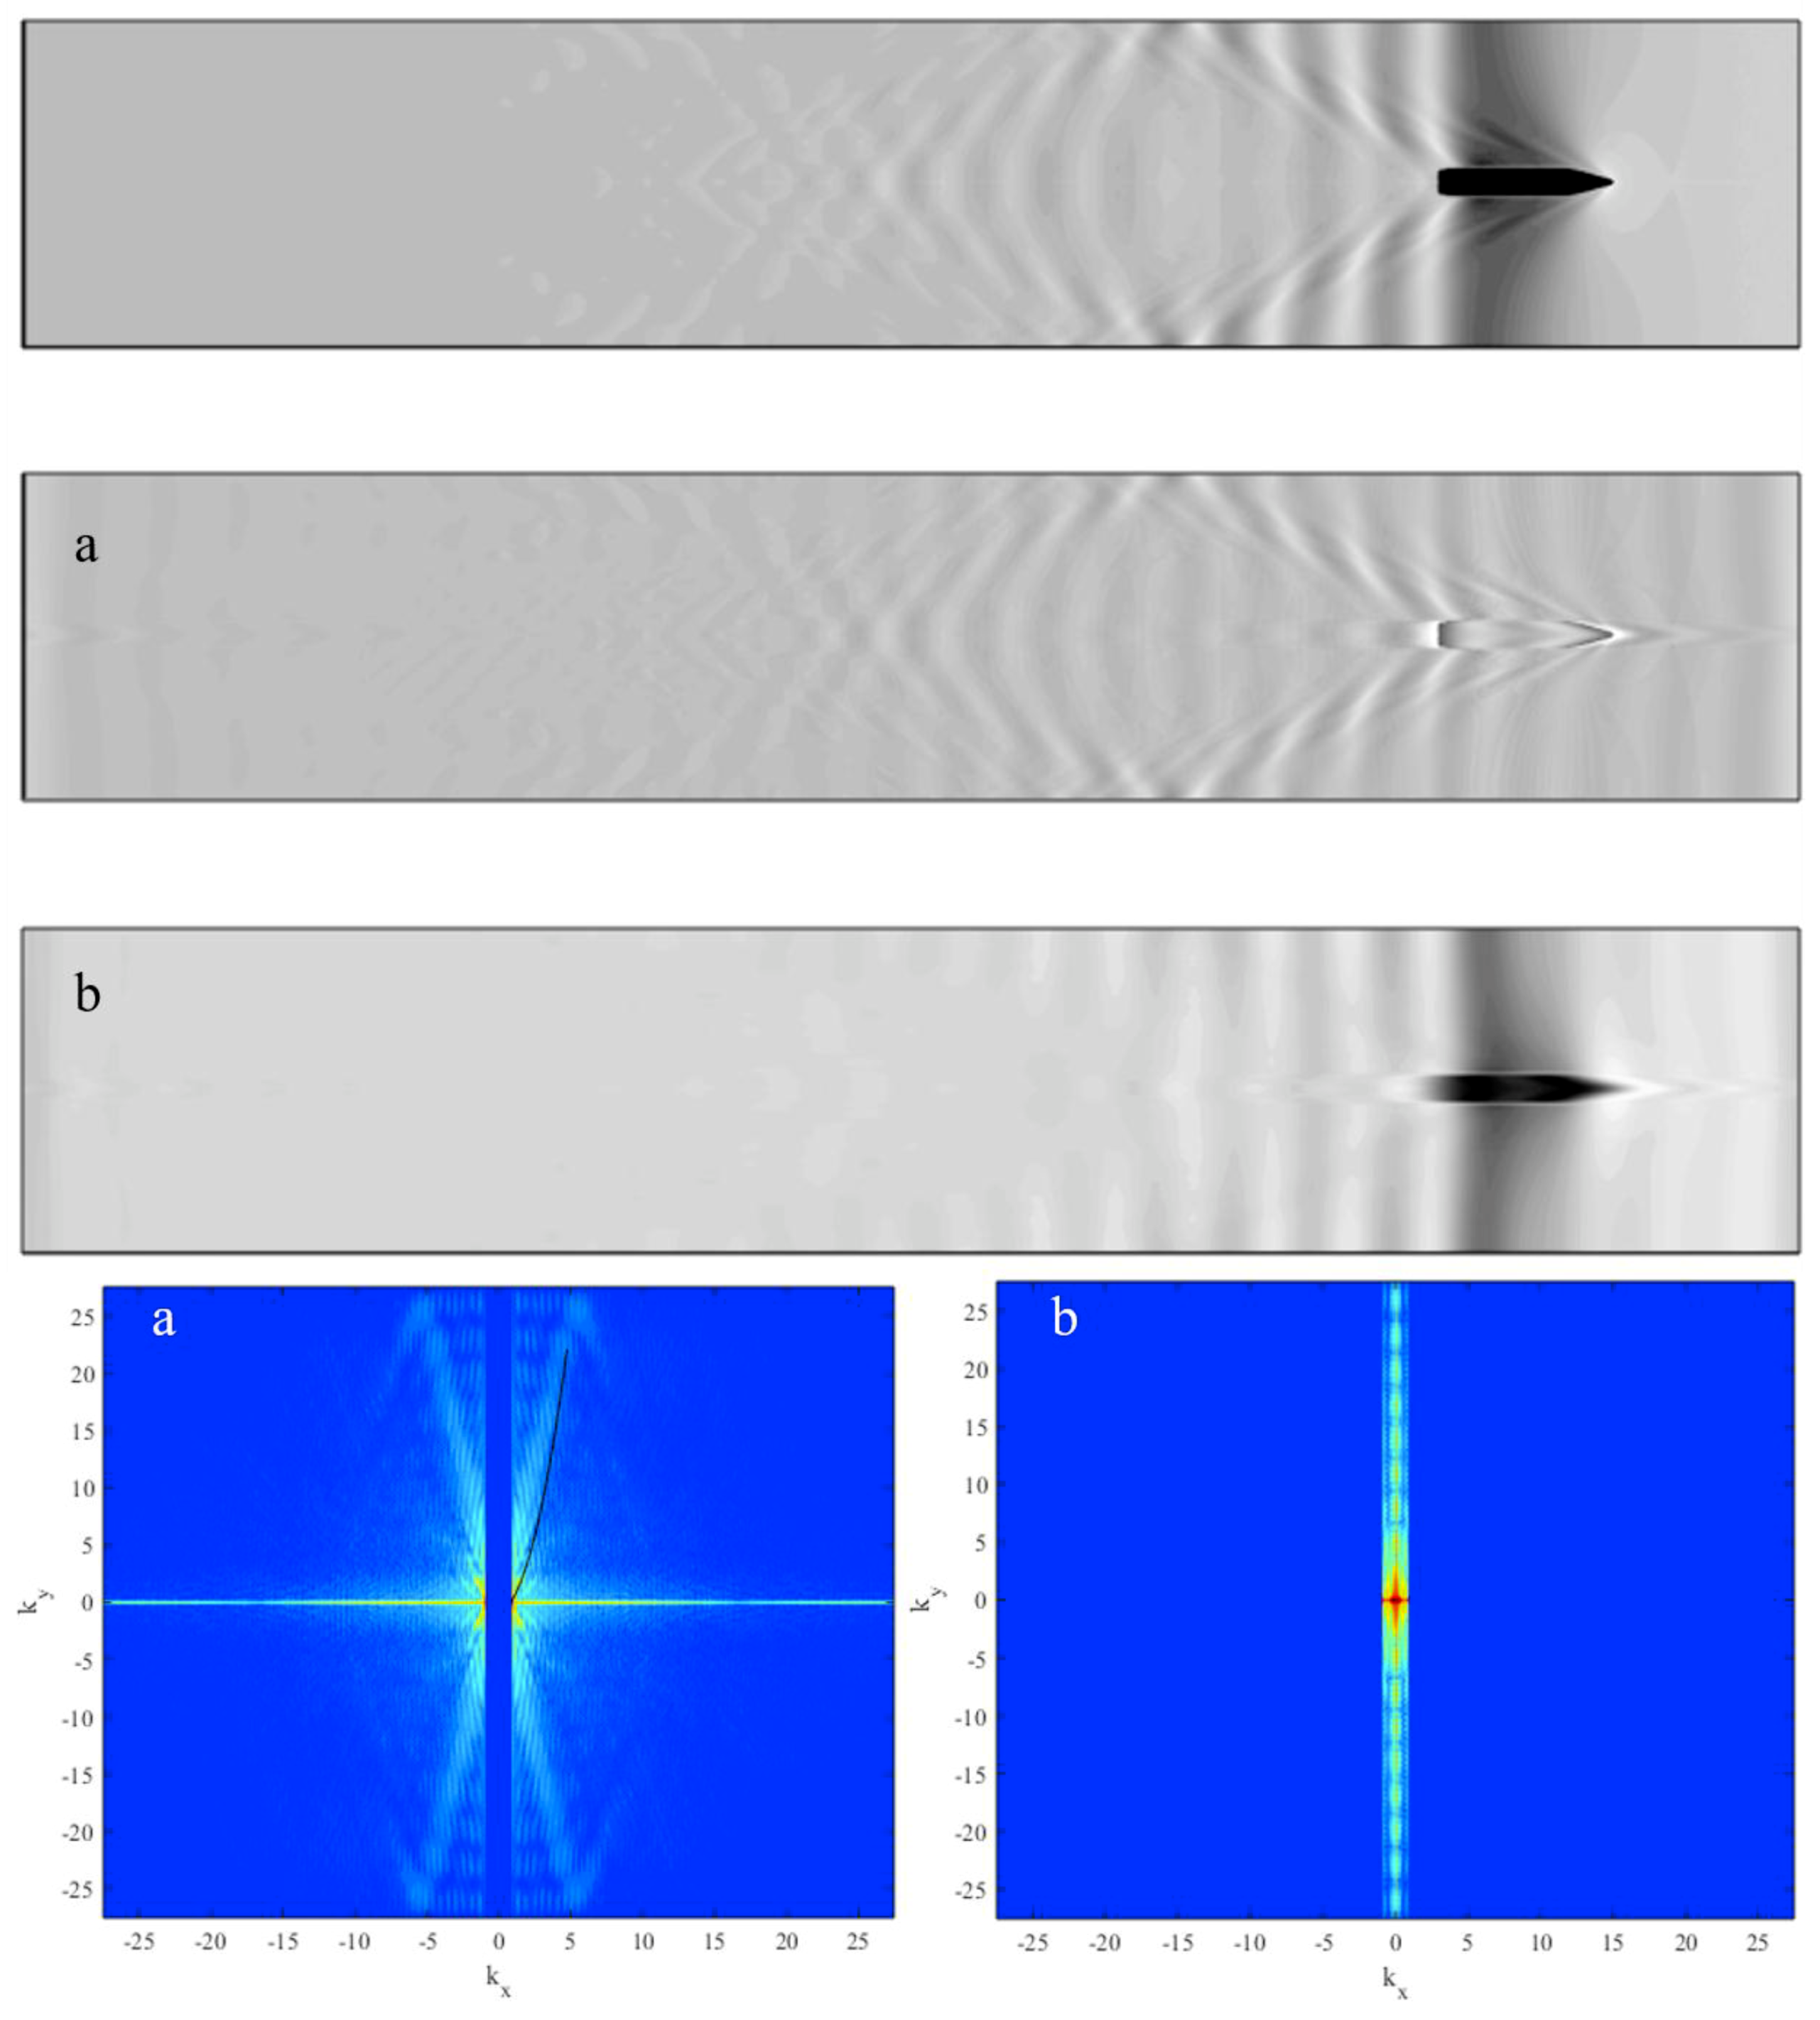
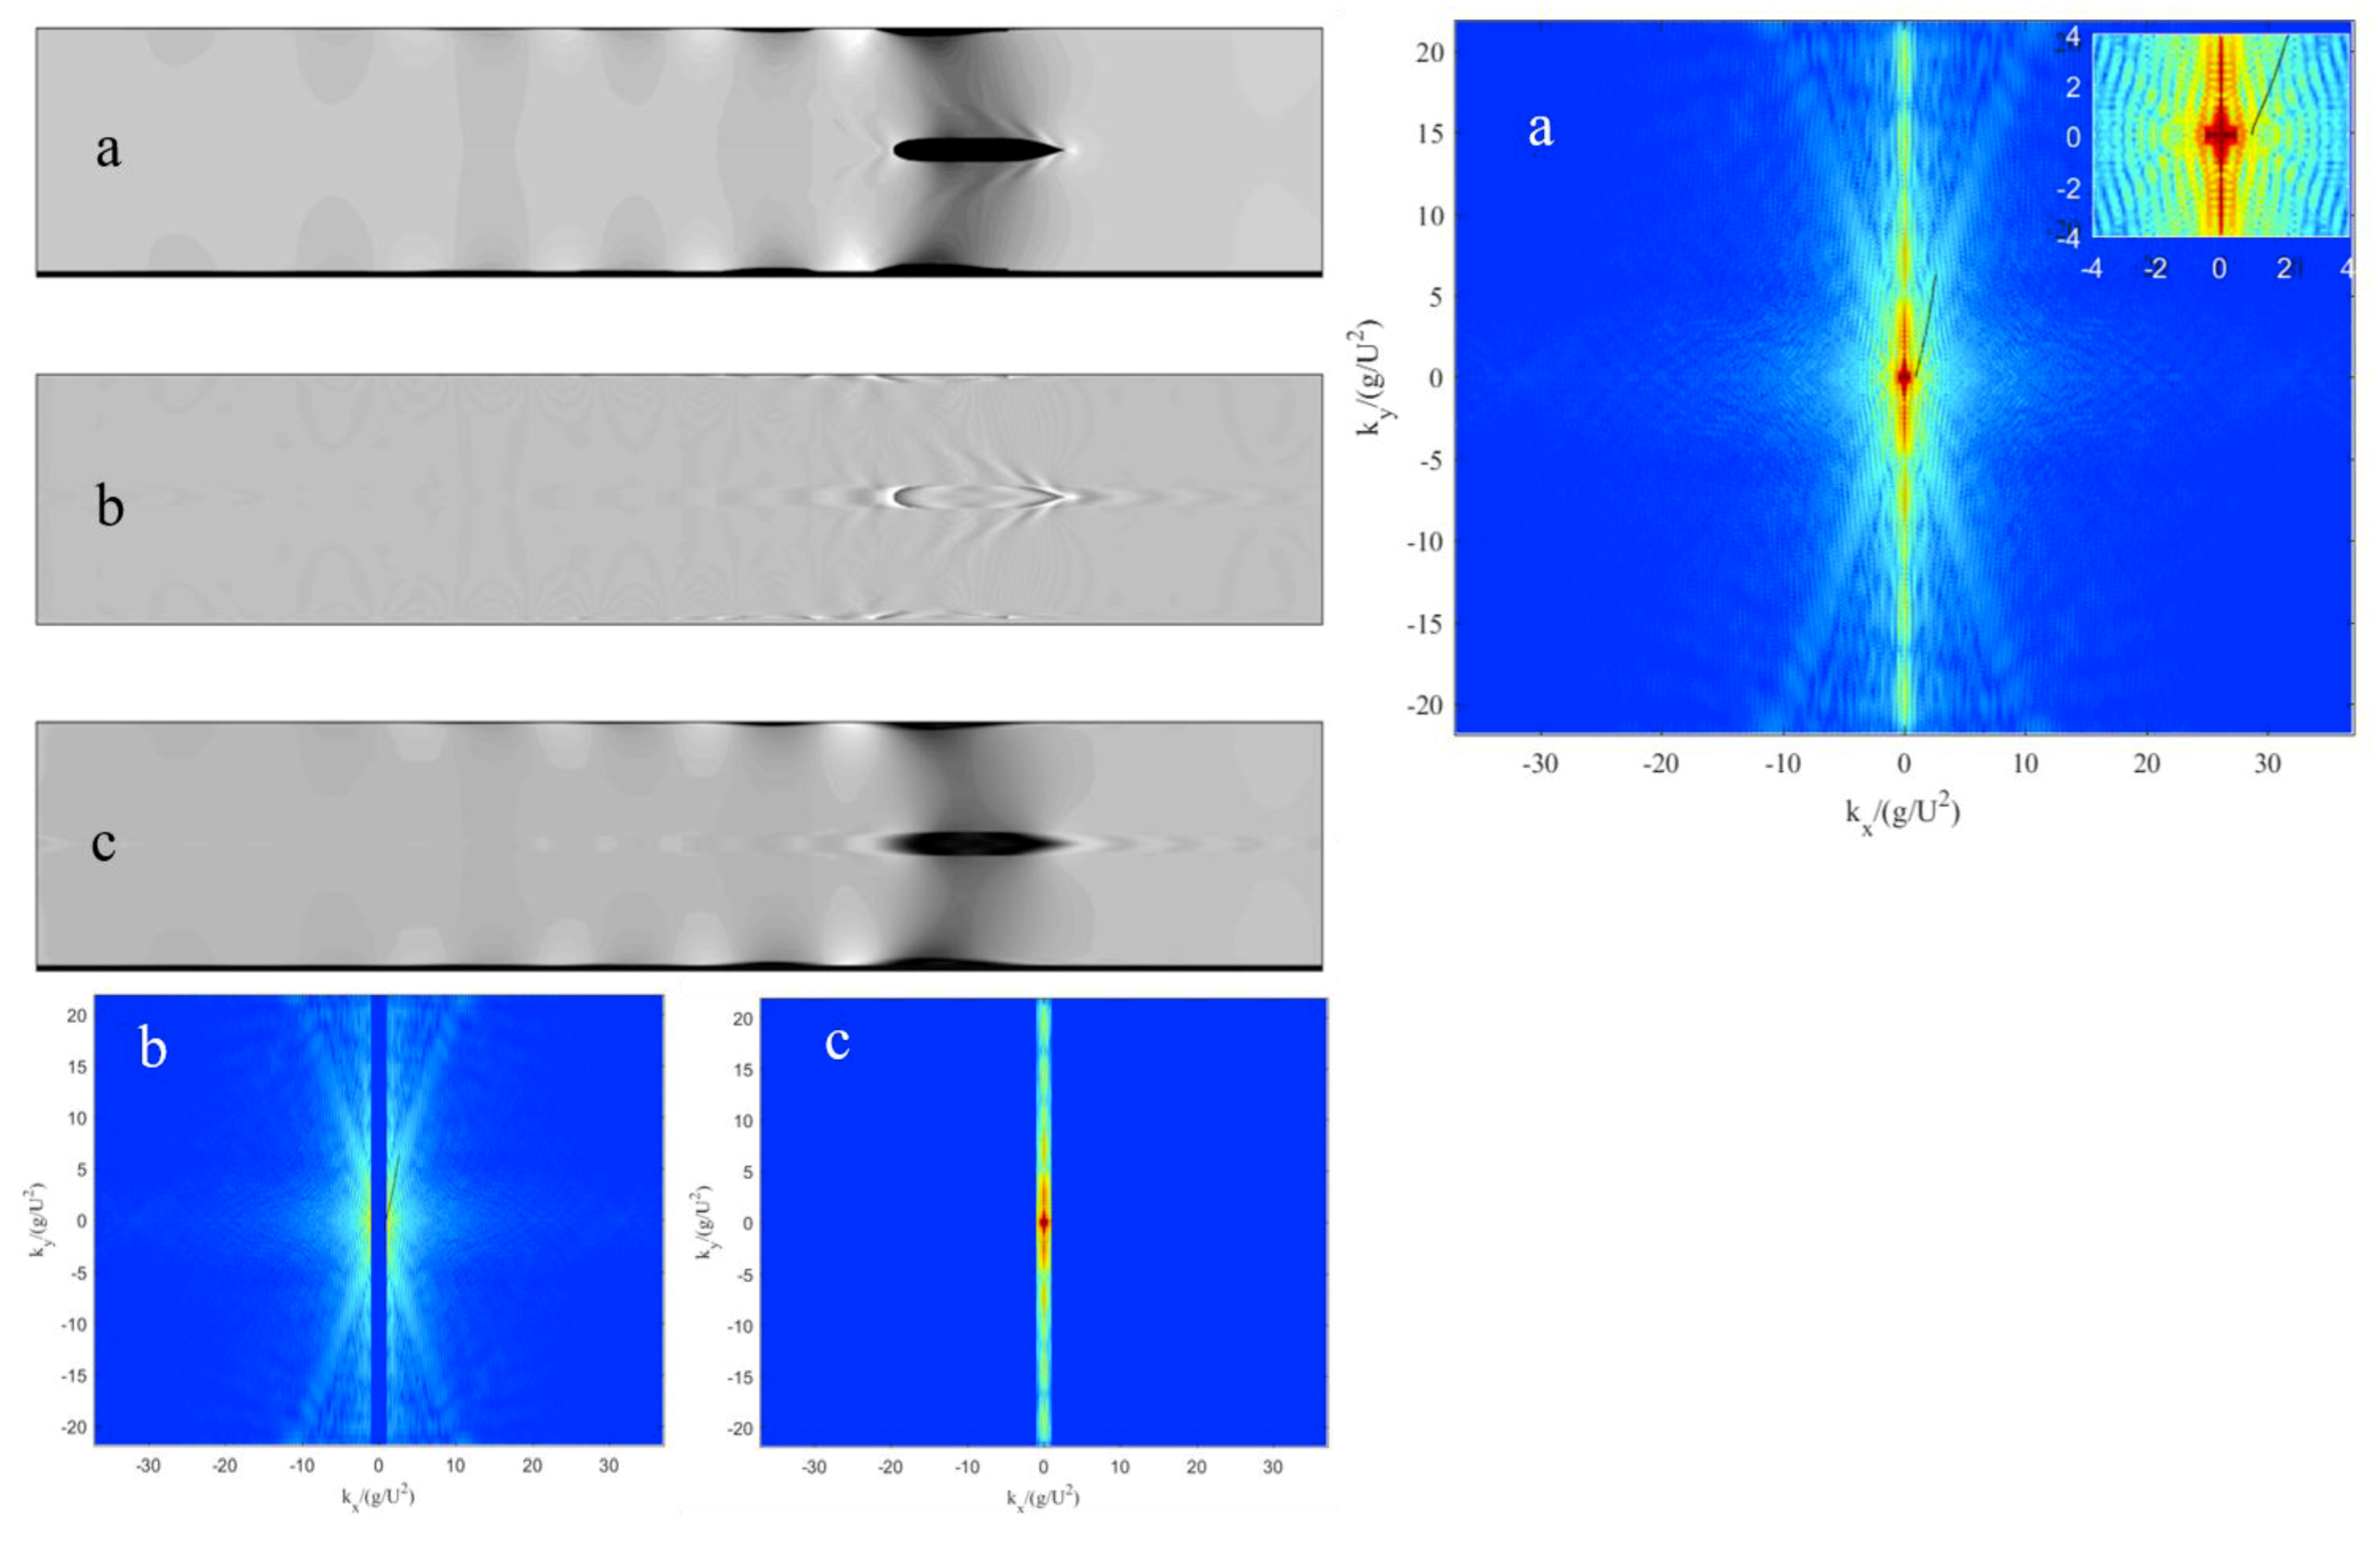
This work proceeds with the next aspect of the solution, which one may obtain via the spectral representation. Specifically, this concerns splitting the near-field from the far-field components. This is illustrated for the rectangular case study at F h = 0.77 in Figure 14, where the cut-off wave number is k x c = 4.7885. Here, the shape of the ship leaves a small effect onto the corresponding near- and far-field systems because the outline of the vessel forms part of the free surface itself. The intensity of the spectrum depends on the input and can be changed based on the brightness of the supplied input. The range of the spectrum is therefore not shown.
The near-field disturbance is not confined in the immediate vicinity of the ship in Figure 14, contrary to expectations. Instead, it is shed from the ship downstream, with its influence being clearly visible near the domain walls. This representation also allows the detection of the far-field waves, as well as their reflection from the side walls, with ease. It is apparent that the wave system is convex with respect to the ship centreline. Once reflected, this is not as clearly visible. The full spectrum for this case can be consulted in Figure 11.
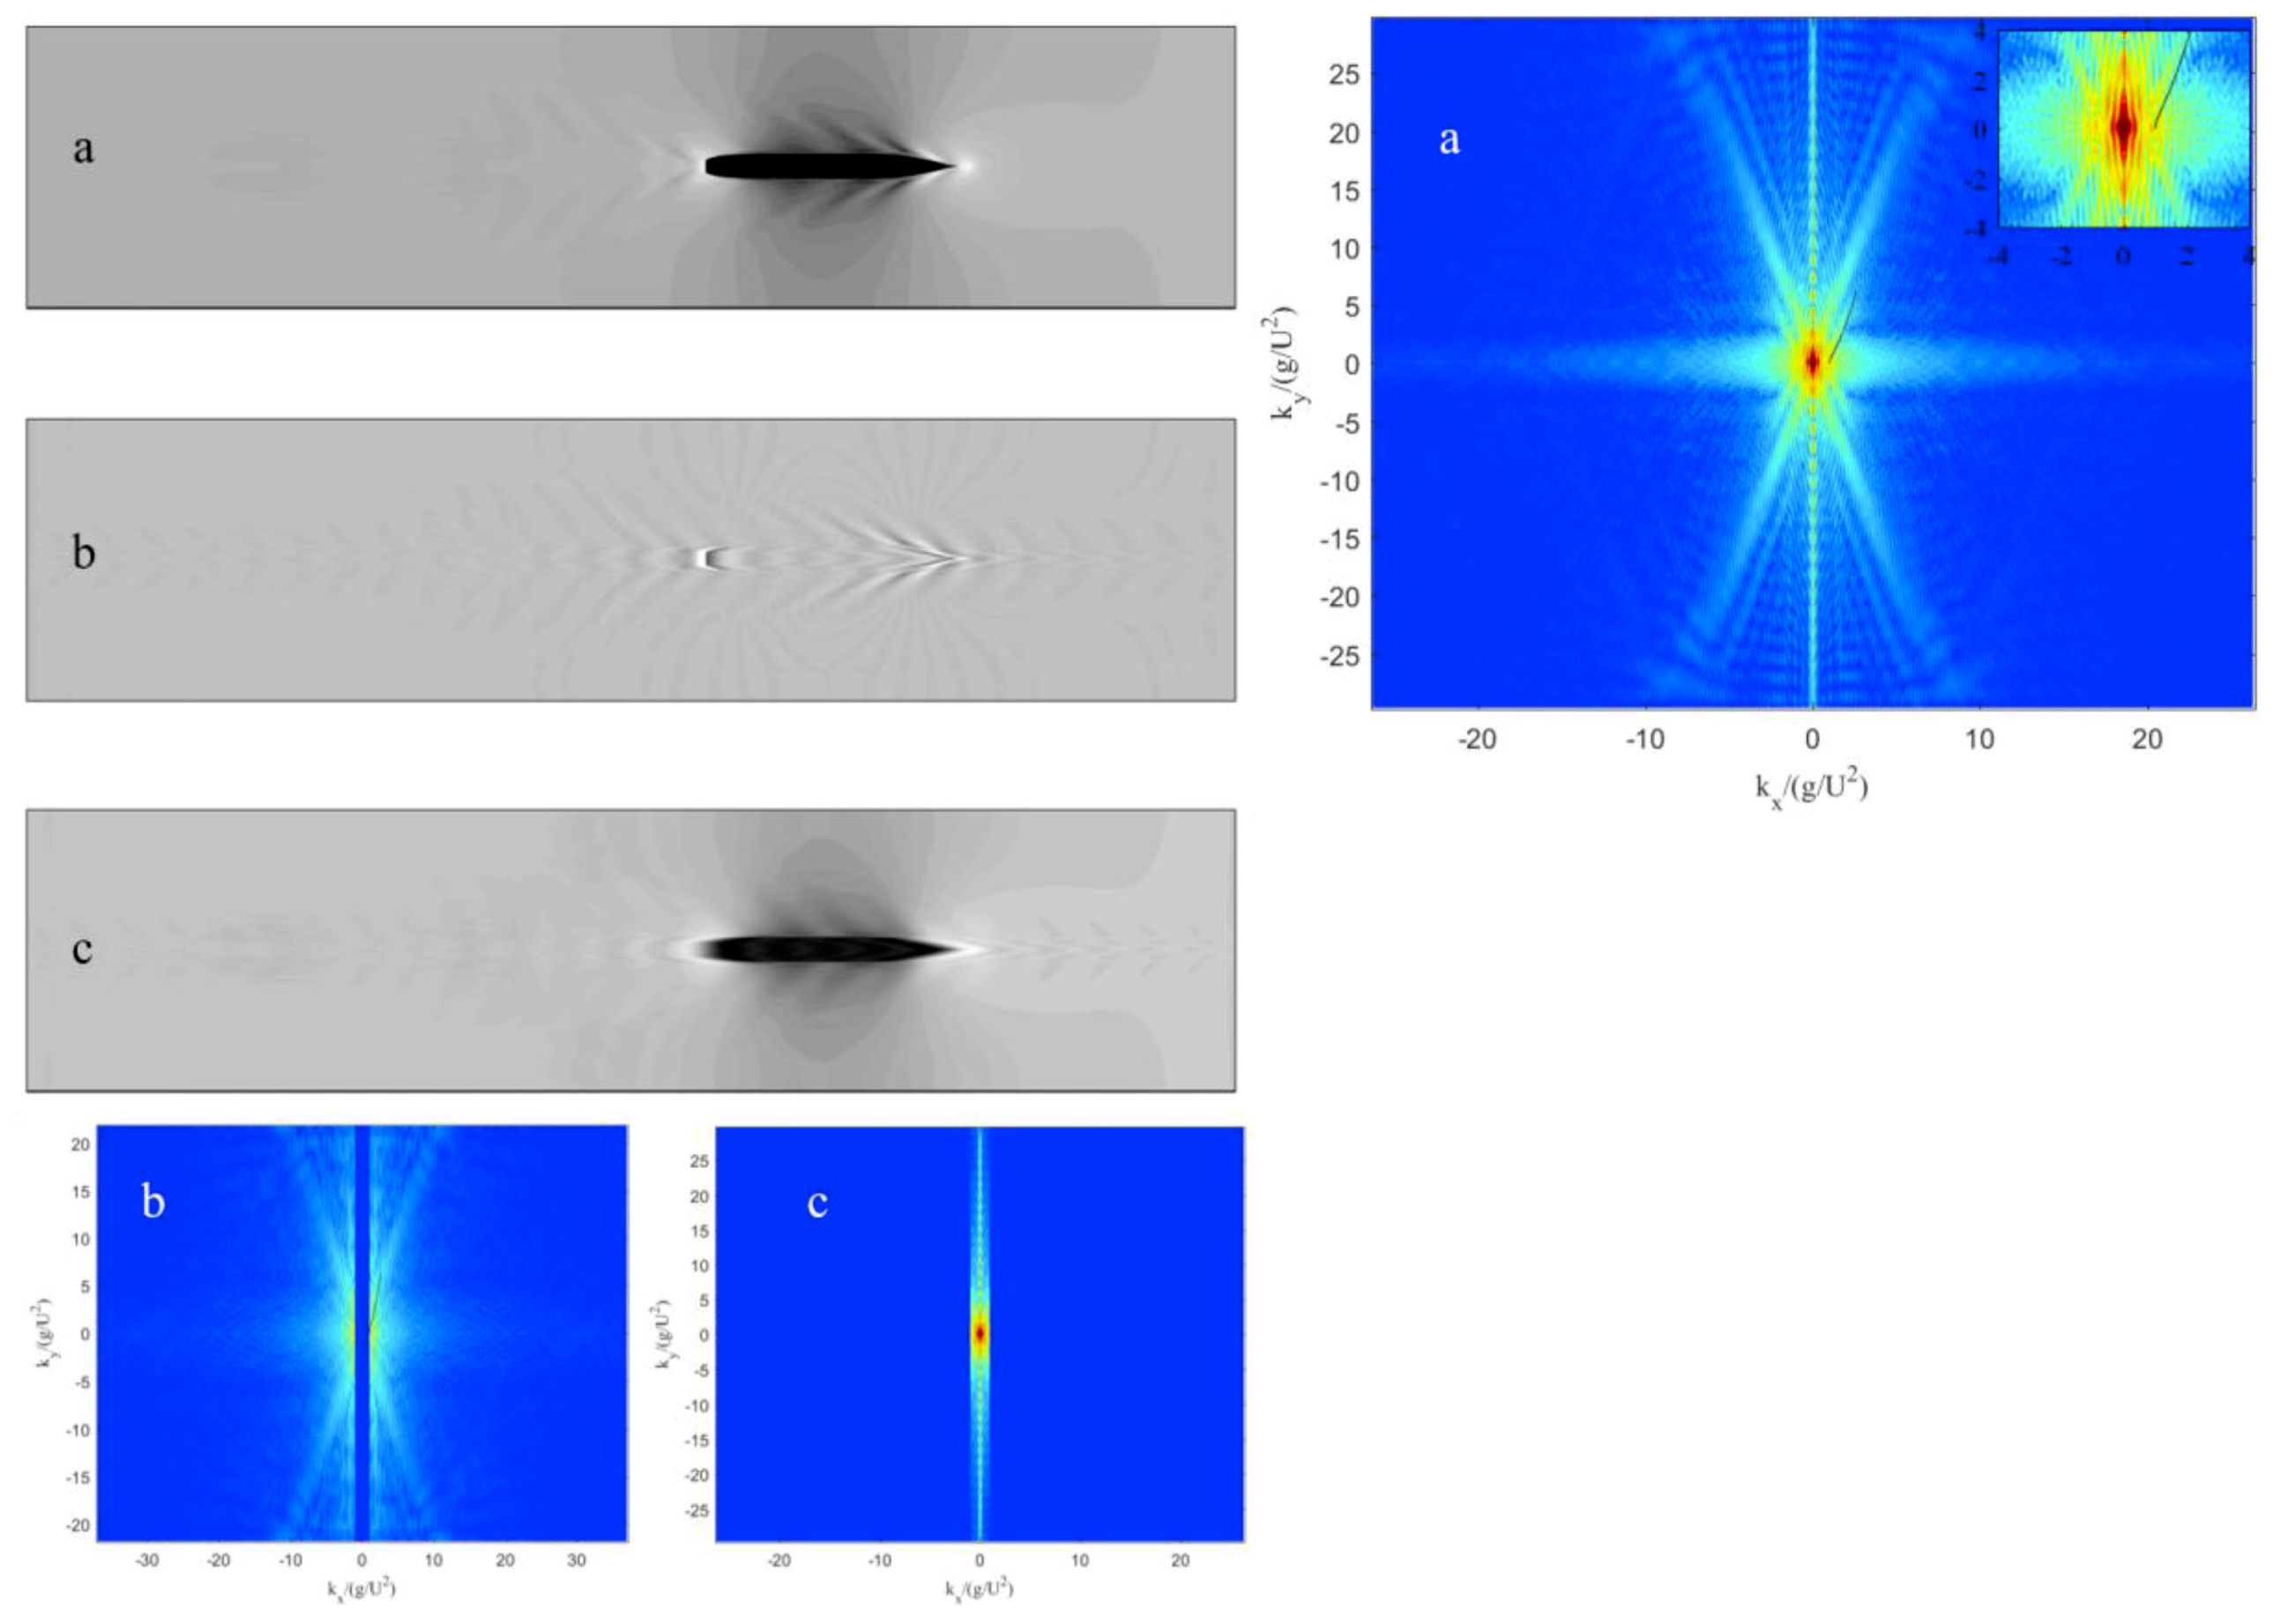
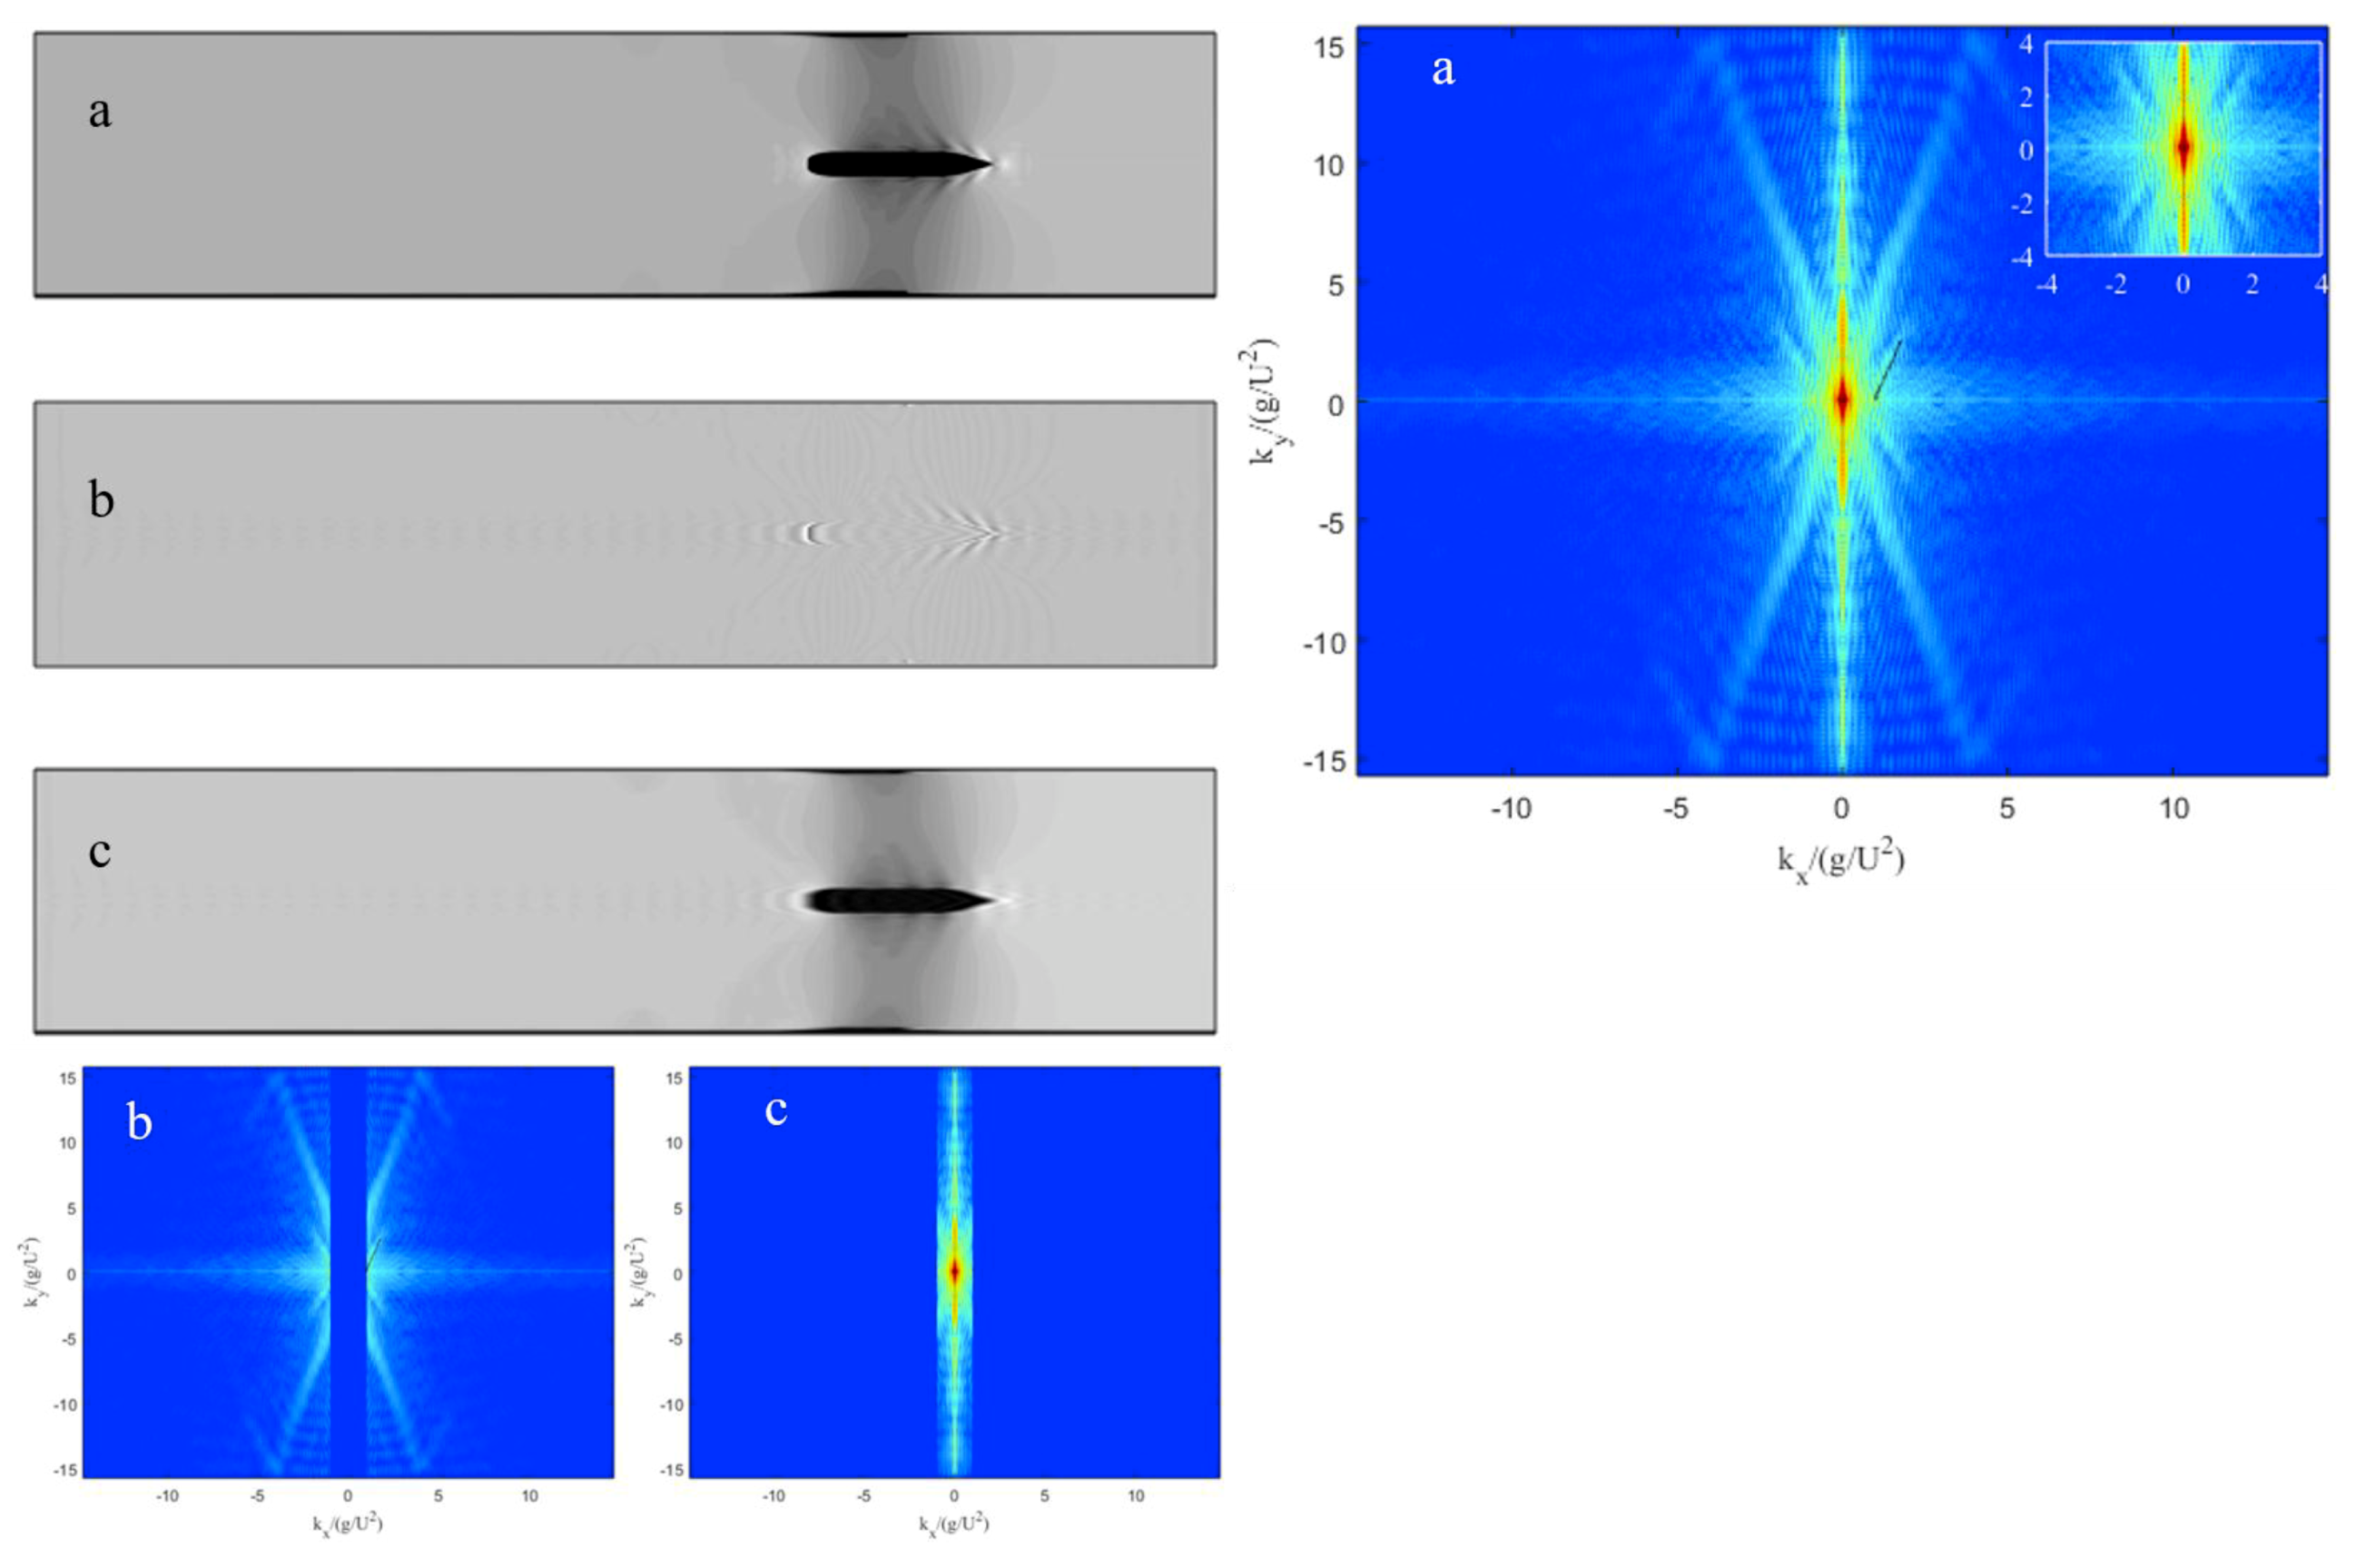
Figure 15 shows the spectral decomposition process as applied to the rectangular canal for F h = 0.57. Here, the arms of the spectrum, previously used to extract maxima and compare with the theoretical relationship, are not formed. This is consistent with findings of other researchers [20]. Specifically, the higher the depth Froude number is, the more clearly the arms of the spectrum are formed. The physical origins of this relate to the relatively small far-field disturbance generated by the ship in the examined speed range. Simultaneously, speeds corresponding to F h 1 are impractical, which is why they have not been investigated. Experimental data in terms of resistance are also not available for the adopted case studies at the aforementioned speeds. In any case, several features of the spectrum can be observed. Firstly, the low-intensity arms, observed in Figure 11 and Figure 14, extending into the far field are reproduced. However, in Figure 15, the arms are not reflected from the boundaries of the plot; instead, they exhibit periodic structures, which vanish near the limits.
It is now appropriate to shift the focus onto the Suez Canal and the spectral representation of the wave field obtained. As before, the higher speed ( F h = 0.57) is examined first, as shown in Figure 16. An immediately apparent difference relates to the structure of the wave field. Specifically, the slopped canal banks have caused a rundown of the water surface. Since the theoretical relationship used to plot the solid line in the plot can only account for a single depth, it is not seen to represent the Fourier representation of the numerical wave field well. Interestingly, the spectrum contains maxima arranged in semi-circular arcs. An interpretation of this is not attempted at present; instead, this is left for a more theoretical piece of work. Such research would need to determine the form of the dispersion relation in nonconstant water depths. The cut-off wave number used to produce Figure 15 and Figure 16 is the same ( k x c = 9.5796 m−1) for this reason. As was the case for F h = 0.77, the near-field disturbance is trapped near the canal walls and shed over a great distance downstream.
The lower speed investigated in the Suez Canal and the Fourier representation of its wave field are depicted in Figure 17. As expected, the disturbance generated by the ship at F h = 0.47 is significantly smaller than that produced at F h = 0.57 (Figure 16). The spectrum exhibits a similar structure to what was previously observed for F h = 0.57. For both results shown in Figure 16 and Figure 17, the near-field hydrodynamic response has caused bright parts of the spectrum, which are periodically broken. These correspond to what is identified as a near-field wave by the method, trapped at the lateral extents of the tank. This is primarily the case due to the relative size of these disturbances. Namely, their wavelength is of the order of magnitude of the ship itself. Whether this classification itself is correct probably requires further research. However, their effect on the Fourier representation is clearly visible, especially in Figure 16, where a high-intensity patch can be seen undulating along the ordinate.

5. Summary and Future Work

This paper presented a towing tank which does not make use of on the principle of Galilean relativity. This was accomplished via the overset method, which was used to actually ‘tow’ the KCS model in a virtual environment. The main benefits of adopting such an approach were identified in terms of the reduced number of assumptions needed to perform the analysis. Specifically, all boundaries (except those prescribed as symmetries or overset boundaries) are no-slip walls, which is more physically consistent than ‘traditional’ virtual towing tanks. Since the ship advances over a static fluid, the approach presented in this paper does not require the definition of inlet turbulent properties, as is usually the case. Thereby, one major source of modelling error and uncertainty is removed.
The adopted case studies numerically replicated recently published results in a rectangular canal and in the New Suez Canal [23]. The computed resistance of the ship was compared to the experimentally obtained values. Satisfactory agreement was found, although some discrepancy persisted in the highest speeds examined. The source of the difference between the experimental and numerical results is primarily attributed to the fixed sinkage and trim used in the virtual towing tank. The study was supplemented by a recently developed method to decompose the wave field and determine the Kelvin wake angle. In terms of the former, it was discovered that near-field disturbances propagate outwards towards the canal sides and are shed by the ship downstream. Their effect persisted over a significant distance. This is of practical interest, because near-field disturbances are typically linked with strong pressure variations. Thus, information extracted via the spectral decomposition method may be used to assess the optimum slope and positioning of canal sides to avoid excessive forces linked with bank erosion.
On the other hand, it was shown that it is difficult to identify the boundaries of the Kelvin wake in a narrow canal. Values for the half-angle computed via linear point-source methods were compared with those obtained by CFD. The effects of nonlinearity and interference of wave systems shed by the bow and stern were identified potential sources of discrepancy. The numerical ( θ C F D = 24.1 ° ) and theoretical ( θ T h e o r y = 22.756 ° ) Kelvin wake half-angles for F h = 0.77 in the rectangular canal were found to compare reasonably well. However, the inflection point, which governs the value of the half-angle, was found to be in some disagreement. According to the theory, this should occur at approximately kx = 1.06, whereas CFD suggests the inflection point is located at kx = 1.46. The potential sources of this discrepancy likely pertain not only to limitations in terms of mesh size and time-step in CFD, but also, and likely more importantly, the theoretical assumptions.
One of the main conclusions drawn from this study is that the theoretical method used to predict the locus location has great potential for validation of numerical free surface problems. However, bounds of validity are yet to be determined. This forms the primary recommendation for future work. Specifically, a method should be devised to equip the practitioner with a number indicating how well the problem at hand is modelled. The answer to such a question can be found by performing a systematic experimental campaign, which should feature a variety of hull forms. These must ensure that the method is challenged with nonlinear forms to rigorously test its applicability. For example, these would include ships with high block coefficients, nonslender forms, as well as immersed transoms, where separation would be expected.
Another aspect requiring further attention is the manner in which the ship is accelerated up to the target velocity. In this study, the velocity changes linearly, inducing shocks onto the ship at the initial and target speeds. This results in longer times for convergence. To reduce the time taken to converge the result, different acceleration profiles must be compared, such as sinusoidal velocity changes. This is left as a piece of future work, alongside a turbulence dependence study and the relative impact of sinkage and trim.

Author Contributions

Conceptualization, M.T. and G.Z.; methodology, M.T. and G.Z.; software, M.T.; validation, M.T. and G.Z.; formal analysis, M.T. and G.Z.; investigation, M.T. and G.Z.; resources, T.T., Z.Y., A.I.; data curation, M.T. and G.Z.; writing—original draft preparation, M.T.; writing—review and editing, all authors; visualization, M.T. and G.Z.; supervision, T.T., Z.Y., A.I.; project administration, T.T., Z.Y., A.I.; All authors have read and agreed to the published version of the manuscript.

Funding

This research received no external funding.

Acknowledgments

Results were obtained using the ARCHIE-WeSt High-Performance Computer (www.archie-west.ac.uk) based at the University of Strathclyde. The work reported in this paper is drawn from the first author’s PhD thesis. The first author gratefully acknowledges the scholarship provided by the Faculty of Engineering at the University of Strathclyde, which fully supports his PhD.

Conflicts of Interest

The authors declare no conflict of interest.

References

  1. Bašić, J.; Degiuli, N.; Dejhalla, R. Total resistance prediction of an intact and damaged tanker with flooded tanks in calm water. Ocean Eng. 2017, 130, 83–91. [Google Scholar] [CrossRef]
  2. Bechthold, J.; Kastens, M. Robustness and quality of squat predictions in extreme shallow water conditions based on RANS-calculations. Ocean Eng. 2020, 197, 106780. [Google Scholar] [CrossRef]
  3. Farkas, A.; Degiuli, N.; Martić, I. Assessment of hydrodynamic characteristics of a full-scale ship at different draughts. Ocean Eng. 2018, 156, 135–152. [Google Scholar] [CrossRef]
  4. Larsson, L.; Stern, F.; Visonneau, M. Numerical Ship Hydrodynamics: An Assessment of the Gothenburg 2010 Workshop; Springer: Berlin/Heidelberg, Germany, 2014. [Google Scholar] [CrossRef]
  5. Razgallah, I.; Kaidi, S.; Smaoui, H.; Sergent, P. The impact of free surface modelling on hydrodynamic forces for ship navigating in inland waterways: Water depth, drift angle, and ship speed effect. J. Mar. Sci. Technol. 2018, 1–22. [Google Scholar] [CrossRef]
  6. Simonsen, C.D.; Otzen, J.F.; Joncquez, S.; Stern, F. EFD and CFD for KCS heaving and pitching in regular head waves. J. Mar. Sci. Technol. 2013, 18, 435–459. [Google Scholar] [CrossRef]
  7. Toxopeus, S.L. Viscous-flow calculations for KVLCC2 in deep and shallow water. Comput. Methods Appl. Sci. 2013, 29, 151–169. [Google Scholar] [CrossRef] [Green Version]
  8. Longo, J.; Stern, F. Effects of drift angle on model ship flow. Exp. Fluids 2002, 32, 558–569. [Google Scholar] [CrossRef]
  9. Tahara, Y.; Longo, J.; Stern, F. Comparison of CFD and EFD for the Series 60 C B = 0.6 in steady drift motion. J. Mar. Sci. Technol. 2002, 7, 17–30. [Google Scholar] [CrossRef]
  10. Kundu, P.; Cohen, I.M.; Dowling, D.R. Fluid Mechanics; Elsevier: Cambridge, MA, USA, 2012. [Google Scholar]
  11. Wang, Z.Z.; Xiong, Y.; Shi, L.P.; Liu, Z.H. A numerical flat plate friction line and its application. J. Hydrodyn. 2015, 27, 383–393. [Google Scholar] [CrossRef]
  12. Lopes, R.; Eca, L.; Vaz, G. On the Numerical Behavior of Rans-based Transition Models. J. Fluids Eng. 2019, 142, 1–14. [Google Scholar] [CrossRef]
  13. Lopes, R.; Eca, L.; Vaz, G. On the Decay of Free-stream Turbulence Predicted by Two-Equation Eddy-Viscosity Models; NuTTS-2017: Wageningen, The Netherlands, 2017; pp. 1–6. [Google Scholar]
  14. Wackers, J.; Koren, B.; Raven, H.C.; van der Ploeg, A.; Starke, A.R.; Deng, G.B.; Queutey, P.; Visonneau, M.; Hino, T.; Ohashi, K. Free-Surface Viscous Flow Solution Methods for Ship Hydrodynamics. Arch. Comput. Methods Eng. 2011, 18, 1–41. [Google Scholar] [CrossRef] [Green Version]
  15. Perić, R.; Abdel-Maksoud, M. Reliable damping of free-surface waves in numerical simulations. Ship Technol. Res. 2016, 63, 1–13. [Google Scholar] [CrossRef] [Green Version]
  16. Durbin, P.A.; Pettersson Reif, B.A. Statistical Theory and Modelling for Turbulent Flow, 2nd ed.; Wiley: Hoboken, NJ, USA, 2011. [Google Scholar]
  17. Havelock, T. The Propagation of Groups of Waves in Dispersive Media, with Aplication to Waves on Water produced by a Travelling Disturbance. Proc. R. Soc. London. Ser. A, Math. Phys. Sci. 1933, 140, 359–377. [Google Scholar] [CrossRef] [Green Version]
  18. Sorensen, R.M. Prediction of Vessel-Generated Waves with Reference to Vessels Common to the Upper Mississippi River System, US Army Corps of Engineers, Waterways Experiment Station, ENV Report 4; 1997. Available online: https://pdfs.semanticscholar.org/6ea7/49e2817a7e9d262e30ba3b5d07a9554a7f1b.pdf (accessed on 3 March 2020).
  19. Soomere, T. Nonlinear components of ship wake waves. Appl. Mech. Rev. 2007, 60, 120–138. [Google Scholar] [CrossRef]
  20. Caplier, C.; Rousseaux, G.; Calluaud, D.; David, L. Energy distribution in shallow water ship wakes from a spectral analysis of the wave field. Phys. Fluids 2016, 28, 107104. [Google Scholar] [CrossRef]
  21. Fourdrinoy, J.; Caplier, C.; Devaux, Y.; Rousseaux, G.; Isae, C.U.D.P.; Jouteur, I.; Poitiers, U.; De France, F.; Martin, P.; Montpellier, U.; et al. The naval battle of actium and the myth of the ship-holder: The effect of bathymetry. arXiv 2019, arXiv:1905.13024. [Google Scholar]
  22. Gomit, G.; Rousseaux, G.; Chatellier, L.; Calluaud, D.; David, L. Spectral analysis of ship waves in deep water from accurate measurements of the free surface elevation by optical methods. Phys. Fluids 2014, 26. [Google Scholar] [CrossRef]
  23. Elsherbiny, K.; Tezdogan, T.; Kotb, M.; Incecik, A.; Day, S. Experimental analysis of the squat of ships advancing through the New Suez Canal. Ocean Eng. 2019, 178, 331–344. [Google Scholar] [CrossRef] [Green Version]
  24. Tunaley, J.K.E. Ship Wakes in Shallow Waters; LRDC Report: Pittsburgh, PA, USA, 2014; pp. 6–9. [Google Scholar]
  25. Yang, R.; Shugan, I.V.; Fang, M. Kelvin ship wake in the wind and waves field and on the finite sea depth. Environment 2011, 27, 71–77. [Google Scholar] [CrossRef]
  26. Suez Canal Authority. Suez Canal Rules of Navigation. 2019. Available online: https://www.suezcanal.gov.eg/English/Navigation/Pages/RulesOfNavigation.aspx (accessed on 6 January 2020).
  27. Lee, B.W.; Lee, C. Equation for ship wave crests in the entire range of water depths. Coast. Eng. 2019, 153, 103542. [Google Scholar] [CrossRef]
  28. Siemens. Star-CCM+ User Guide Version 13.04; Siemens: Munich, Germany, 2018. [Google Scholar]
  29. Ferziger, J.H.; Peric, M. Computational Methods for Fluid Dynamics; Springer: Berlin/Heidelberg, Germany, 2002. [Google Scholar]
  30. Wilcox, D.C. Formulation of the k-w Turbulence Model Revisited. AIAA J. 2008, 46, 2823–2838. [Google Scholar] [CrossRef] [Green Version]
  31. Terziev, M.; Tezdogan, T.; Incecik, A. Application of eddy-viscosity turbulence models to problems in ship hydrodynamics. Ships Offshore Struct. 2019. [Google Scholar] [CrossRef]
  32. Pettersson Reif, B.A.; Mortensen, M.; Langer, C.A. Towards sensitizing the nonlinear v 2-f model to turbulence structures. Flow Turbul. Combust. 2009, 83, 185–203. [Google Scholar] [CrossRef]
  33. Hirt, C.W.; Nichols, B.D. Volume of fluid (VOF) method for the dynamics of free boundaries. J. Comput. Phys. 1981, 39, 201–225. [Google Scholar] [CrossRef]
  34. Muzaferija, S.; Peric, M. Computation of free-surface ows using interface- tracking and interface-capturing methods. In Chapter 2, Nonlinear Water Wave Interaction, Computational Mechanics Publications; Mahrenholtz, O., Markiewicz, M., Eds.; WIT Press: Southampton, UK, 1999. [Google Scholar]
  35. Elsherbiny, K.; Terziev, M.; Tezdogan, T.; Incecik, A.; Kotb, M. Numerical and experimental study on hydrodynamic performance of ships advancing through different canals. Ocean Eng. 2019, 106696. [Google Scholar] [CrossRef]
  36. International Towing Tank Conference. ITTC–Recommended Procedures and Guidelines-Practical guidelines for ship CFD Applications, 7.5-03-02-03 (Revision 01), ITTC–Recomm. Proced. Guidel. 19; ITTC: Zürich, Switzerland, 2014. [Google Scholar]
  37. Oberkampf, W.L.; Blottner, F.G. Issues in computational fluid dynamics code verification and validation. AIAA J. 1998, 36, 687–695. [Google Scholar] [CrossRef] [Green Version]
  38. Yuan, Z.M. Ship Hydrodynamics in Confined Waterways. J. Sh. Res. 2019, 63, 1–14. [Google Scholar] [CrossRef] [Green Version]
  39. Yuan, Z.M.; Zhang, X.; Ji, C.Y.; Jia, L.; Wang, H.; Incecik, A. Side wall effects on ship model testing in a towing tank. Ocean Eng. 2018, 147, 447–457. [Google Scholar] [CrossRef] [Green Version]
  40. International Towing Tank Conference. ITTC–Recommended Procedures and Guidelines Uncertainty Analysis, Example for Resistance Test; ITTC: Zürich, Switzerland, 2002. [Google Scholar]
  41. Roy, C.J. Review of code and solution verification procedures for computational simulation. J. Comput. Phys. 1997, 205, 131–156. [Google Scholar] [CrossRef]
  42. Stern, F.; Wilson, R.; Shao, J. Quantitative V&V of CFD simulations and certification of CFD codes. Int. J. Numer. Methods Fluids 2006, 50, 1335–1355. [Google Scholar] [CrossRef]
  43. Celik, I.B.; Ghia, U.; Roache, P.J.; Freitas, C. Procedure for Estimation and Reporting of Uncertainty Due to Discretization in CFD Applications. J. Fluids Eng. 2008, 130, 078001. [Google Scholar] [CrossRef] [Green Version]
  44. Roache, P.J. Quantification of Uncertainty in Computational Fluid Dynamics. Annu. Rev. Fluid Mech. 1997, 29, 123–160. [Google Scholar] [CrossRef] [Green Version]
  45. Eca, L.; Hoekstra, M. Evaluation of numerical error estimation based on grid refinement studies with the method of the manufactured solutions. Comput. Fluids 2009, 38, 1580–1591. [Google Scholar] [CrossRef]
  46. Arnold-Bos, A.; Martin, A.; Khenchaf, A. Obtaining a ship’s speed and direction from its Kelvin wake spectrum using stochastic matched filtering. In Proceedings of the International Geoscience and Remote Sensing Symposium (IGARSS), Barcelona, Spain, 23–27 July 2007; pp. 1106–1109. [Google Scholar]
  47. Wu, Z. On the Estimation of a Moving Ship’s Velocity and Hull Geometry Information from its Wave Spectra. Ph.D. Thesis, University of Michigan, Ann Arbor, MI, USA, 1992. [Google Scholar]
  48. Lighthill, M.J. Waves in Fluids; Cambridge University Press: Cambridge, UK, 1990. [Google Scholar]
  49. Carusotto, I.; Rousseaux, G. The Cerenkov Effect Revisited: From Swimming Ducks to Zero Modes in Gravitational Analogues In Analogue Gravity Phenomenology; Springer: Berlin/Heidelberg, Germany, 2013; pp. 109–144. [Google Scholar]
  50. Crapper, G.D. Surface waves generated by a travelling pressure point. Proc. R. Soc. London. Ser. A. Math. Phys. Sci. 1964, 282, 547–558. [Google Scholar] [CrossRef]
  51. Nakos, D.E.; Sclavounos, P.D. On steady and unsteady ship wave patterns. J. Fluid Mech. 1990, 215, 263. [Google Scholar] [CrossRef]
  52. Tuck, E.O. Sinkage and Trim in Shallow Water of Finite Width. Schiffstechnik 1967, 14, 92–94. [Google Scholar]
  53. Tuck, E.O. Shallow-Water Flows Past Slender Bodies. J. Fluid Mech. 1966, 26, 81–95. [Google Scholar] [CrossRef]
  54. Jachowski, J. Assessment of ship squat in shallow water using CFD. Arch. Civ. Mech. Eng. 2008, 8, 27–36. [Google Scholar] [CrossRef]
  55. Pena, B.; Muk-Pavic, E.; Ponkratov, D. Achieving a high accuracy numerical simulations of the flow around a full scale ship. In Proceedings of the International Conference on Offshore Mechanics and Arctic Engineering-OMAE, Scotland, UK, 9–14 June 2019; pp. 1–10. [Google Scholar] [CrossRef]
  56. Whitham, G.B. Linear and Nonlinear Waves; Wiley-Interscience: Hoboken, NJ, USA, 2011. [Google Scholar]
  57. Ma, C.; Zhu, Y.; He, J.; Zhang, C.; Wan, D.; Yang, C.; Noblesse, F. Nonlinear corrections of linear potential-flow theory of ship waves. Eur. J. Mech. B/Fluids 2018, 67, 1–14. [Google Scholar] [CrossRef]
  58. Chen, X.; Zhu, R.; Ma, C.; Fan, J. Computations of linear and nonlinear ship waves by higher-order boundary element method. Ocean Eng. 2016, 114, 142–153. [Google Scholar] [CrossRef]
  59. Wu, H.; Wu, J.; He, J.; Zhu, R.; Yang, C.J.; Noblesse, F. Wave profile along a ship hull, short farfield waves, and broad inner Kelvin wake sans divergent waves. Phys. Fluids 2019, 31. [Google Scholar] [CrossRef]
  60. Noblesse, F.; He, J.; Zhu, Y.; Hong, L.; Zhang, C.; Zhu, R. Why can ship wakes appear narrower than Kelvin’s angle? Eur. J. Mech. -B/Fluids 2014, 46, 164–171. [Google Scholar] [CrossRef]
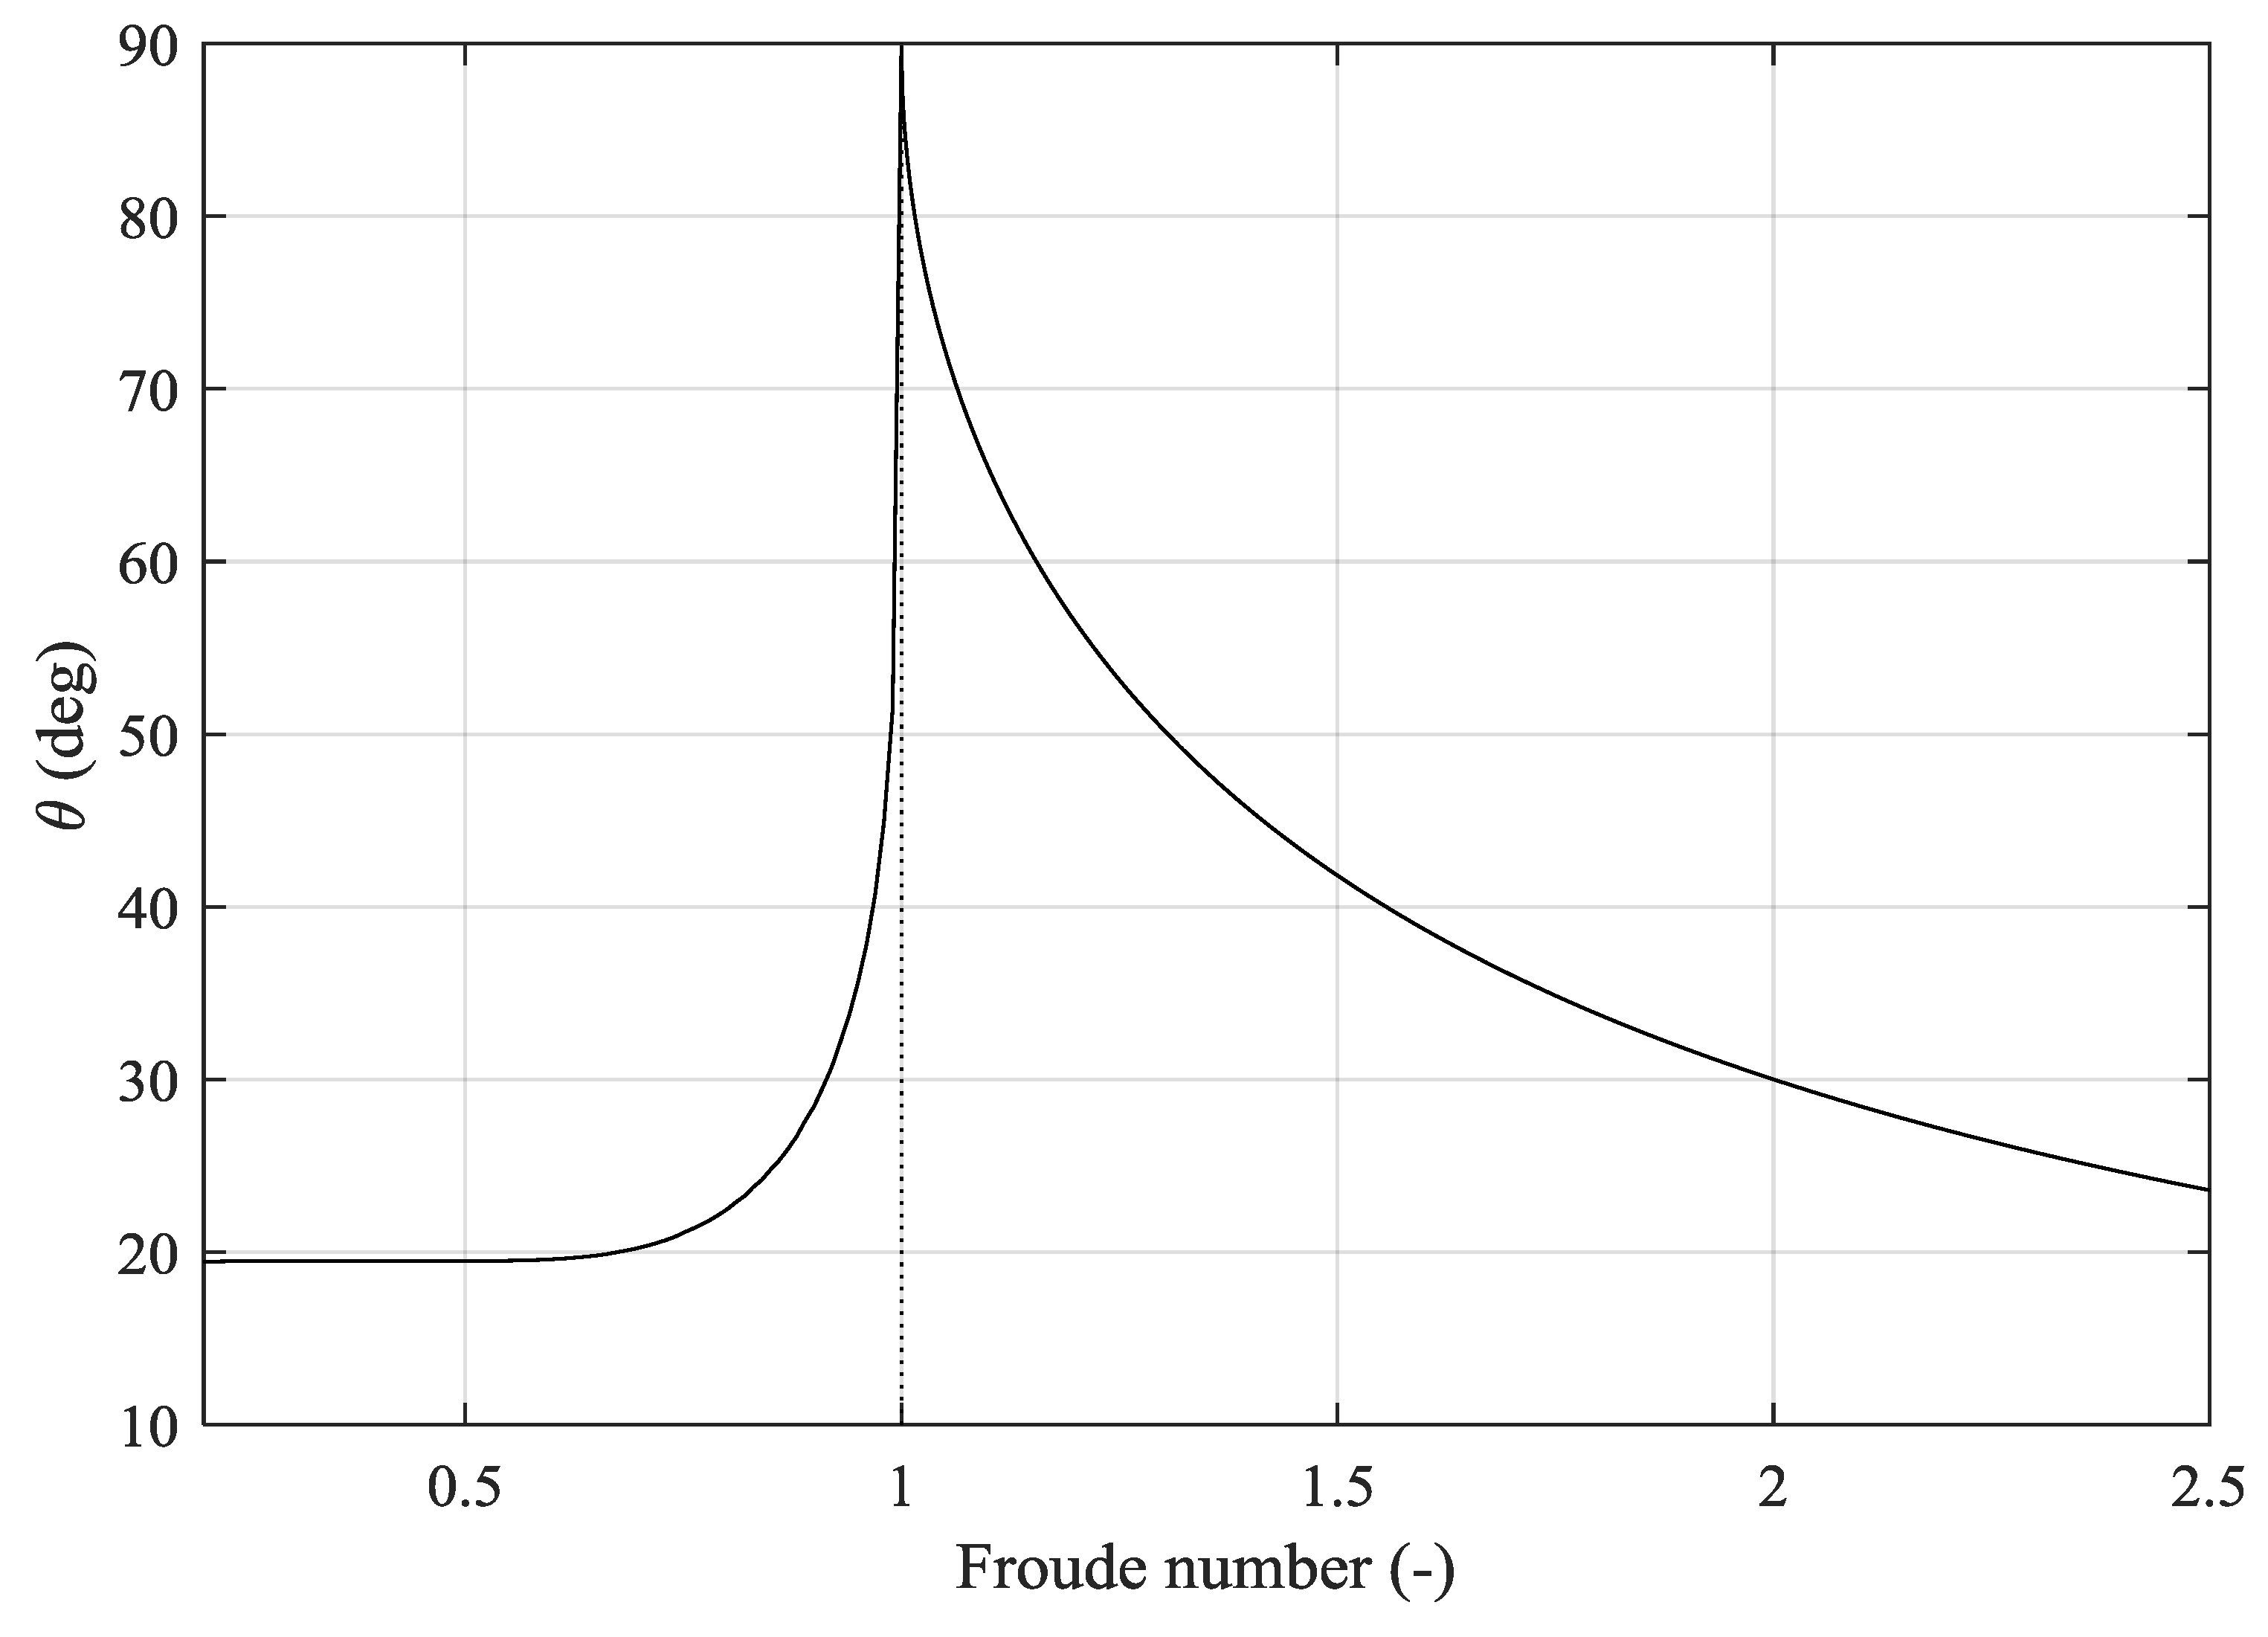
Figure 1. Kelvin half-angle of ship-generated waves in shallow waters as a function of the depth Froude number.
Jmse 08 00258 g001
Figure 2. Graphical depiction of the cross-section of the selected case studies. Top: New Suez Canal; bottom: rectangular canal.
Jmse 08 00258 g002
Figure 3. Length of the computational domain and dimensions of the overset domain.
Jmse 08 00258 g003
Figure 4. Three-dimensional depiction of the computational mesh.
Jmse 08 00258 g004
Figure 5. The y+ distribution on the ship hull at F h = 0.77, sampled at 40 s physical time.
Jmse 08 00258 g005
Figure 6. Example time-history of the solution (depicted: F h = 0.57).
Jmse 08 00258 g006
Figure 7. Solutions to Equation (8). Figure depicts the examined loci alongside the critical depth Froude number (Fh = 1) to demonstrate the effect of speed.
Jmse 08 00258 g007
Figure 8. Comparison of total resistance coefficients for all cases (R indicates the rectangular canal case, whereas S indicates the Suez Canal). Subscripts refer to depth Froude number. Relative error computed as (EFD − CFD)/EFD × 100.
Jmse 08 00258 g008
Figure 9. Generated wave field in the rectangular canal at F h = 0.77.
Jmse 08 00258 g009
Figure 10. Generated wave field in the rectangular canal at F h = 0.77 and corresponding half-angle according to Havelock [17]. Dashed line originates at FP; solid line originates at the nearest downstream peak, where the dashed line is reflected. Broken line originates at the highest wave elevation on the wall; dotted line originates at the ship coordinates representing the point where the aft wave system is generated.
Jmse 08 00258 g010
Figure 11. Processing of the wave field. Depicted: F h = 0.77 in the rectangular canal. Top: the raw image, where real space extents are 32 m in the stream-wise and 4.6 m in the span-wise directions. Bottom left: the Fourier representation of the wave field. Bottom right: detected maxima and fit, superimposed onto the theoretical relationship, Equation (8).
Jmse 08 00258 g011
Figure 12. Derivatives dky/dkx for deep water, shallow water and numerical shallow water cases.
Jmse 08 00258 g012
Figure 13. Predicted and theoretical half-angles.
Jmse 08 00258 g013
Figure 14. Splitting of near- and far-field components via manipulations of the spectrum (cut-off wave number k x c = 4.7885). Top: original free surface; (a) indicates the far-field component, whereas (b) indicates the near-field disturbance and their corresponding Fourier representations. Longitudinal extent: 32 m.
Jmse 08 00258 g014
Figure 15. Free surface disturbance in the rectangular canal, F h = 0.57; (a) Computed free surface. (b) Far-field and (c) near-field representations in the real and spectral space ( k x c = 9.5796). Longitudinal extent: 16.5 m.
Jmse 08 00258 g015
Figure 16. Free surface disturbance in the Suez Canal, F h = 0.57; (a) Computed free surface. (b) Far-field and (c) near-field representations in the real and spectral space ( k x c = 9.5796). Longitudinal extent: 13 m.
Jmse 08 00258 g016
Figure 17. (a) Computed free surface in the Suez Canal, F h = 0.47. Far-field (b) and near-field (c) representations in the real and spectral space ( k x c = 14.1833). Longitudinal extent: 20 m.
Jmse 08 00258 g017
Table 1. Ship characteristics.
QuantitySymbolValueUnit
Scale Factorλ75-
LengthL3.067m
BeamB0.429m
DraughtT0.144m
DepthD0.253m
Water depthh0.32m
Block coefficientCB0.651-
Longitudinal Centre of GravityLCG1.488m
Wetted areaS1.694m2
Table 2. Test matrix and resultant Kelvin half-angles according to Havelock’s [17] method.
CanalCase NumberDepth-to-Draught (h/T)Depth Froude Number ( F h ) Ship Speed (m/s)Kelvin Half-Angle ( ° ) [17]
Rectangular canal12.20.571.0119.52
20.771.36421.58
New Suez Canal30.470.81519.47
40.571.0119.52
Table 3. Cell numbers for both canals.
CanalBackground CellsOverset CellsTotal
Rectangular canal29,312,452766,40230,078,854
Suez Canal 21,496,179766,40222,262,581
Table 4. Grid and time independence (rectangular canal, F h = 0.57). Experimental result: 4.5047 N.
ParameterMeshTime-StepUnits
r 2 2 -
f14.325 (29,312,452 cells)4.325N
f24.356 (10,955,825 cells)4.381N
f35.045 (4,155,326 cells)4.446N
R0.0440.852-
p9.0050.463-
GCI (%)0.670419.609-