Abstract
Dissolved organic matter present in natural aquatic environments is a heterogeneous mixture of allochthonous and autochthonous materials. In coastal areas vulnerable to sewage waste, its biologically active component, the chromophoric dissolved organic matter (CDOM), is expected to change its composition and distribution in relation to anthropogenic activities, suggesting the possible use of CDOM as a proxy of fecal contamination. This study aimed at testing such hypothesis by investigating and relating the optical properties of CDOM with Escherichia coli abundance, physiological state, and enzymatic activities in a bathing area of the Northern Tyrrhenian Sea (Latium, Italy) affected by urban wastewaters. The parallel factor analysis (PARAFAC) applied to the excitation–emission matrices (EEMs) of CDOM allowed us to distinguish three main components: C1 (λEx/λEm = 342 nm/435 nm), C2 (λEx/λEm = 281–373 nm/460 nm), and C3 (λEx/λEm = 286 nm/360 nm). C1 and C2 corresponded to humic acids of terrestrial origin, while C3 to tryptophan, whose fluorescence peak was detected close to sewage sites, strongly related to active E. coli cells. The comparison between spectral and microbiological methods is suggested as a suitable approach to monitor bathing water quality for the implementation of coastal observing system capability.
1. Introduction
Coastal marine environments are known to be highly susceptible to pollution as they are characterized by the coexistence of multiple human activities (e.g., aquaculture, industries, maritime transport, and tourism) as well as high population densities. Productive settlements, industries and power plants, and tourist commercial ports involve the presence of numerous discharges that spill abundant volumes of organic matter, fecal bacteria, viruses and potentially polluting chemical elements (e.g., metals, hydrocarbons, pesticides, etc.) into the sea [1,2,3,4,5]. Moreover, during the tourist season or under intense rainfall, sewage networks can overload, spreading untreated sewage waste directly into the sea. Such episodes are the main cause of the occurrence of fecal contamination events on coastal bathing areas limiting their recreational uses and increasing possible risks for public health [6]. In this context, monitoring the quality of recreational waters is essential to quickly detect areas exposed to potential pollution and to prevent the outbreak of infectious diseases. Fecal coliforms and intestinal streptococci are widely used as fecal pollution indicators due to their easy and low cost determination; moreover, among fecal coliforms, Escherichia coli is recognized as the best indicator of fecal pollution [7]. In the current European Bathing Water Directive [8] these indicators are included among the criteria prescribed for the designation of natural waters for bathing purposes. However, laboratory analysis based on culture methods is time and labor-consuming, making their use in environmental monitoring largely inadequate [9,10]. To this end, rapid microscopic analytical protocols such as those based on specifically labeled immune sera, applied in immunofluorescence, provide an estimate of fecal contamination by E. coli more accurately than conventional plate methods. Indeed, fluorescent antibody methods allow for the detection of target bacteria, regardless of their physiological status, including moribund or stressed cells that have lost their ability to grow on conventional culture media [11,12,13].
In recent years, thanks to its optical properties, chromophoric dissolved organic matter (CDOM) has been increasingly used as a tracer of organic matter related to urban wastewaters, which are characterized by a large amount of organic compounds [14,15,16,17,18,19]. CDOM is a ubiquitous component of dissolved organic matter (DOM) that absorbs light over a wide range of visible and ultraviolet wavelengths and can emit part of the absorbed light as fluorescence (FDOM) [20]. Excitation emission matrices (EEM) and parallel factor analysis (PARAFAC) provide an efficient tool to characterize CDOM origin and composition [20,21,22,23,24,25,26,27]. Earlier studies have focused on the detection of sewage contamination through CDOM spectral characterization in groundwater systems [28,29], wastewater treatment systems [30,31,32], drinking water treatment plants [33,34], natural surface waters [35], or sewage-contaminated water bodies [36,37]. However, few studies on Mediterranean coastal areas have been reported; Tedetti et al. [5] first identified the spectral characteristics of the CDOM pool in a coastal area affected by the presence of untreated wastewater. Cyr et al. [38] reported the application of a new glider equipped with tryptophan and phenanthrene fluorometers for the measurement of DOM in the NW Mediterranean Sea. Zoppini et al. [39] investigated the effects of extreme floods from the Po River on the physical and chemical seawater properties, together with the responses of phytoplanktonic and heterotrophic microbial communities to riverine inputs.
In coastal areas, CDOM mainly has a terrestrial origin [40,41,42,43,44] with a high fraction of humic acids produced by the microbial decomposition of plant tissues and derived from soil leaching from rainfall [45,46]. In sewage-contaminated waters, the protein-CDOM pool is dominated by the presence of tryptophan, widely recognized as an indicator of microbiological activity and as a useful tool for marine pollution monitoring [47,48,49]. Tryptophan fluorescence was attributed either to the presence of free amino acids [50] or to their association with proteins on the cell walls of microorganisms in seawater [51]. CDOM is a heterogeneous pool of organic matter that plays a key role in the biogeochemical carbon cycle in aquatic environments [5,52,53,54], influencing the quantity and quality of light available for marine photosynthetic processes and supporting the heterotrophic prokaryotic growth as a trophic substrate [55,56,57]. On the other hand, microorganisms are well equipped with a range of enzymes, allowing them to break down high-molecular weight organic polymers into smaller ones (<600 Da), so that they can be transported across the cytoplasmic membrane and used for metabolic and/or catabolic processes [58]. Extracellular enzymatic activities (EEA) can provide important insights on the relationship between bacteria and CDOM pool [43]. In particular, leucine aminopeptidase (LA), beta-glucosidase (BG), and alkaline phosphatase (AP), specific for proteins, polysaccharides, and organic phosphates degradation, respectively, are widely distributed across marine environments [59]. Estimates of their potential activity rates give information on the composition and bioavailability of organic matter to satisfy the needs of total microbial community. Indeed, LA is an inducible enzyme related to fresh, labile organic matter derived from phytoplankton production, while BG is an enzyme active on more refractory compounds. Coastal areas such as other eutrophic environments are generally rich in organic polymers, so stimulating the production and release of hydrolytic enzymes by microbes.
This study aimed to evaluate the relationship between CDOM and E. coli abundance, assessed by standard culture (membrane filtration, MF) and fluorescent antibody technique (immunofluorescence, IF), and its physiological state, as detected by EEA estimates. This last relationship was also taken into consideration in order to assess the role of microbial metabolism in DOM decomposition. Finally, the integration of CDOM measurements to implement the capability of coastal observing systems with new cost-effective technologies for bathing water quality monitoring is discussed, with a particular focus on the Civitavecchia Coastal Environment Monitoring System (C-CEMS) [6].
2. Materials and Methods
2.1. Study Area and Samplings
The study area was located in the southern part of the Civitavecchia coast (northern Latium, Italy) near a permanent coastal discharge (Figure 1). Being used in summer by numerous tourists and local bathers, the Santa Cecilia bathing area is particularly suitable for the purpose of this study, having recorded, in the last few years, numerous fecal contamination episodes, that caused bathers diseases such as skin irritation and gastroenteritis. To detect the distribution of both CDOM and E. coli abundance within the study area, a dataset collecting together data obtained during the 2015, 2016, and 2017 summer seasons at seven sampling stations (SC0-SC6) was analyzed. In particular, the SC0 and SC1 stations were located in an area where wastewaters accumulate before their discharge into the sea and immediately in front of the outflow, respectively; stations SC2, SC3, and SC4 were located in the zones most frequented by bathers; finally, stations SC5 and SC6 were positioned in two sites reciprocally opposite with respect to the discharge, in order to spatially define the zone potentially affected by the wastewater discharge.
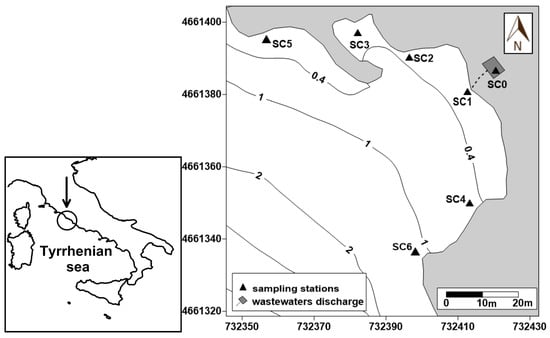
Figure 1.
Study area and sampling stations.
In more detail, during 2015 and 2017, four daily samplings were carried out every three hours on 22 July and 14 August, respectively: Early Morning (EM) sampling was carried out at 07:00 UTC; Before Lunch (BL) sampling at 10:00 UTC; After Lunch (AL) sampling at 13:00 UTC and Late Afternoon (LA) sampling at 16:00 UTC. Sampling activities were repeated over time at all the stations, except at SC0 in 2015 where only during the AL sampling was there enough wastewater to be collected. During 2016, two samplings were carried out on 30 August and 27 September only at the SC0–SC4 stations and the sampling activities were only conducted at 7:00 UTC. In each sampling and at each station, subsurface samples (0.3 m) for CDOM analysis were collected in 200 mL amber glass bottles preconditioned with ultrapure water and rinsed three times with the sample before its collection. Seawater samples for microbiological analyses were stored in sterile 50 mL disposable Falcon tubes and kept at 4 °C in the dark prior to laboratory analysis within 24 h. Temperature and salinity were measured at each station using an Idronaut 316 multiparametric probe.
2.2. Laboratory Analyses
2.2.1. Chromophoric Dissolved Organic Matter (CDOM) Absorption and Fluorescence Measurements
Seawater samples were filtered through 0.22 μm polycarbonate filters (Nuclepore) under low pressure. CDOM absorbance was measured in the spectral range of 250–700 nm by a Shimadzu UVmini1240 spectrophotometer with a 10 cm quartz cuvette. The spectrum of Milli-Q water, measured in the same conditions, was subtracted from each sample. Absorbance values were converted into absorption coefficients according to Mitchell et al. [60] and Twardowski et al. [61] considering Equation (1):
where Aλ is the absorbance and l is the path length in meters. Absorption coefficients at 280 nm (a280) and 355 nm (a355) were used as indicators of CDOM abundance since these wavelengths correspond to the excitation maxima observed for protein-like and humic-like substances, respectively [44]. The spectral slope (S) of the absorption curve [62,63] was calculated according to Equation (2):
where λ0 is the first wavelength in the range and aλ0 is the absorption coefficient at λ0.
aλ = 2.303 × Aλ/l
aλ = aλ0 × e−S(λ−λ0)
Only for the samples collected in 2017, fluorescence excitation emission matrices (EEMs) were recorded using a Horiba Fluoromax Spex spectrofluorometer with a 1 × 1 cm quartz cuvette, according to Tedetti et al. [5]. The emission spectra were measured in the range 280–550 nm over an excitation wavelength ranging between 200 and 500 nm (5 nm increment). Three replicates per sample were performed (N = 60). The EEMs were corrected for instrumental bias and the EEM of Milli-Q water measured in the same conditions (blank) was subtracted.
2.2.2. Microbiological Counts and Extracellular Enzymatic Activities
E. coli abundance was determined by immunofluorescence (IF) count under an epifluorescence microscope using fluorescently labelled anti-E. coli polyvalent immune sera (Behring), according to Caruso et al. [12]. Simultaneously, the culturable fraction was estimated by plate count method after filtration of 100 mL of water through 0.45 µm cellulose filter membranes (MF) and incubation at 35 °C for 24 h on E. coli Direct MUG (ECD-MUG) agar (Biolife) selective for E. coli. The total IF labelled E. coli were reported as cells per 100 mL, while the culturable E. coli were expressed in colony forming units (CFU) per 100 mL.
For the samples collected in 2015 and 2017, microbial EEA rates of LA, BG, and AP were measured on unfiltered water samples using fluorogenic 4-methylcoumarinyl-7-amide (MCA) and 4-methylumbelliferone (MUF) derivatives according to Hoppe et al. [58]. The substrates employed for LA, AP, and BG determinations were MCA-L-leucine, MUF phosphate, and MUF-ß-D-glucopyranoside (Sigma-Aldrich), respectively. For each sample, the maximum velocity of the reaction (Vmax) was calculated through a Lineweaver–Burke linear transformation and reported as nanomoles per liter and hour (nmol l−1h−1). LA and BG activity rates were expressed as the amounts of carbon potentially released from proteins and carbohydrates, taking into consideration the number of C atoms in the final products of enzymatic hydrolysis (leucine and β− glucoside). AP activity was expressed in terms of the atoms of dissolved inorganic phosphorus (DIP) or orthophosphate potentially released from organic phosphates [59,64].
2.2.3. Statistical Analysis
To evaluate the relationships between CDOM and microbiological parameters during the three-year survey, the Pearson correlation coefficients were calculated with the relative confidence intervals using PAST software [65]. Correlations were considered significant at a probability level of p < 0.05. Analysis of variance (ANOVA) was computed in order to assess if there were statistically significant differences among the stations.
To analyze the links and the reciprocal influence existing among the measured parameters, the principal component analysis (PCA) was only performed on the data that were shared by all variables using PRIMER (Plymouth Routines In Multivariate Ecological Research) software package v.6.0 (developed at the Plymouth Marine Laboratory, United Kingdom). This analysis, which was carried out on normalized data, generated new linear components of the original variables, called principal components (PCs), which explain the dispersion of the samples. Only the PCs with Eigenvalues > 1 were considered.
The PARAFAC model [66] was applied to the spectral measurements to decompose EEMs into their individual fluorescent profiles by using the MATLAB DOM fluor toolbox [67] together with N-Way toolbox v.3.1 [68]. Before applying the PARAFAC analysis, different processing steps were performed on the fluorescence data: (1) The Rayleigh (first- and second-order) and Raman scatter peaks were removed from the sample and pure water EEMs (measured before each sample in the same conditions of the sample) and replaced with values calculated by monotone cubic interpolation (shape-preserving) [69]; (2) Sample EEMs signals were then corrected for the inner-filter effect using the equation developed by Lakowicz [70]; (3) Sample EEMs were blank corrected subtracting the pure water EEMs corrected in (1); and (4) the matrices obtained by (3) were normalized to the water Raman signal, dividing the fluorescence by the integrated Raman band of Milli-Q water (λEx = 350 nm, λEm = 371–428 nm), measured the same day of the analysis.
The PARAFAC model was run and validated for 60 EEMs according to the method reported in the literature [21,65]. Before running the PARAFAC, EEMs were normalized to their maximum in order to facilitate the comparison between the samples analyzed in the discharge area (SC0 and SC1) and those in the control points (SC3, SC4, SC5, and SC6) [71]. In the first explorative data analysis, three outliers (all the replicates of SC6 station) were identified in the dataset and were removed from the analysis. Subsequently, the validation of the PARAFAC model (running with the non-negativity constraint) and the determination of the correct number of components were achieved through the examination of the percentage of explained variance, the shape of residuals, the split half analysis, and the random initialization using the Tucker congruence coefficients [5,72].
3. Results
3.1. CDOM Absorption
A strong salinity gradient was observed among the stations, with minimum medians (0.55–0.47) at SC0 and maximum ones at the SC2–SC6 stations (38.70–37.52) (Table 1). ANOVA confirmed the highly significant statistical differences (F = 786.6, p < 0.001) in the salinity values occurring between the stations. Moreover, the ANOVA results showed the presence of statistically significant differences between the SC0, SC1, and SC2–SC6 sites considering the CDOM absorption coefficients at 280 and 355 nm (p < 0.01). The absorption spectra recorded at all the stations showed the typical CDOM decreasing exponential trend at increasing wavelengths, from ultraviolet to the visible region (Figure 2). According to their range of variations, the stations were classified into three groups: (1) the station located in the proximity of the discharge point SC0 (Figure 2a) showed the maximum median values of the absorption coefficients at 280 nm (a280) and 355 nm (a355), which ranged from 59.88 m−1 and 26.37 m−1 (a280 and a355 in 2017) to 9.45 and 3.02 m−1 (a280 and a355 in 2016), respectively (Table 1), indicating that at this station, CDOM was abundant; (2) Station SC1 (Figure 2b), immediately in front of SC0, showed intermediate values ranging from maximum peaks of 19.16 m−1 and 7.44 m−1 (a280 and a355 in 2017) to minimum ones of 2.82 m−1 and 0.78 (a280 and a355 in 2016), respectively (Table 1); and (3) moving from the discharge to more marine stations, at stations SC2, SC3, SC4, SC5, and SC6 (Figure 2c), significantly lower a280 and a355 values were recorded, with medians that varied from maxima of 2.49 and 1.02 m−1 (a280 and a355 in 2015) to minimum values of 1.97 and 0.54 m−1 (a280 and a355 in 2016), respectively.

Table 1.
Physico-chemical characteristics, chromophoric dissolved organic matter (CDOM) optical properties, E. coli abundances, and extracellular enzymatic activities (EEA) of the three groups of stations: SC0, inside the discharge point; SC1, immediately in front of it; SC2–SC6 within the bathing area. Each value was obtained as the median of the four daily samplings in 2015 and 2017 and of the two sampling days in 2016. Temp., Temperature; a280 and a355, CDOM absorption coefficients at 280 and 355 nm wavelengths respectively; E. coli MF, E. coli abundance obtained by the culture method; E. coli IF, E. coli abundance obtained by immunofluorescence; BG, beta-glucosidase; leucine aminopeptidase, LA; AP, alkaline phosphatase.
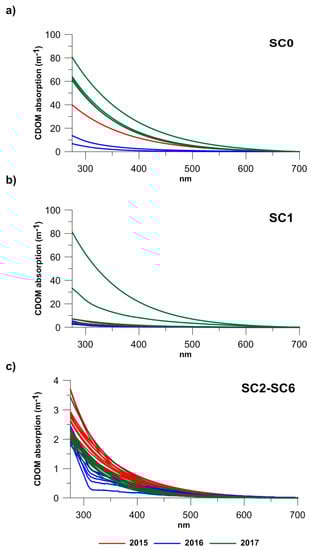
Figure 2.
CDOM absorption spectra measured at: (a) SC0 station, inside the discharge point; (b) at SC1 station, immediately in front of the discharge; (c) at SC2, SC3, SC4, and SC6 stations within the bathing area, in 2015 (red lines), 2016 (blue lines), and 2017 (green lines).
E. coli abundances measured by both MF and IF methods described a clear decreasing trend as the distance from the discharge point increased, with maximum values observed at SC0 (median E. coli MF = 20,000 CFU 100 mL−1; median E. coli IF = 27,460 cells 100 mL−1) and minimum ones at SC2–SC6 stations for all years (median E. coli MF = 228 CFU 100 mL−1; median E. coli IF = 4000 cells 100 mL−1). In line with the CDOM data, in 2016, consistently lower values were measured at all three groups of stations (Table 1). ANOVA results confirmed that statistically significant differences (p < 0.01) occurred between the SC0, SC1, and SC2–SC6 sites when also considering the E. coli abundances measured by both MF and IF methods.
The patterns of enzymatic activity rates followed the order BG > AP > LA at station SC0, while at all the other stations, the enzyme patterns were in the order AP > BG > LA (Table 1). Enzyme values followed a progressively decreasing trend moving from the discharge point toward the stations unaffected by sewage; they already decreased by 2–3 times at station SC1, where AP and BG were reciprocally comparable. Activity rates one order of magnitude lower than those measured at station SC0 were reached at the marine stations SC2–SC6, characterized by high AP. This spatial distribution confirmed that sewage outflow discharged into the sea organic polymers—mostly polysaccharides and organic phosphates—prone to microbial degradation; conversely, the low LA activity rates found at all the examined stations suggested that within the organic matter released by the sewage, proteinaceous substrates were scarcely represented.
Pearson correlation coefficients between CDOM, E. coli abundance, and enzymatic data, as reported in Table 2, showed that both a280 and a355 CDOM absorption coefficients were significantly related with E. coli abundance (p < 0.001). A more significant correlation was found at 280 nm between CDOM and MF values (r = 0.939) compared to IF (r = 0.619); a similar result was observed at 355 nm, suggesting that culturable E. coli cells were sustained by the CDOM pool more significantly than the total E. coli, these latter including also non culturable or inactive cells that were unable to metabolize CDOM. Among the three examined enzymes, BG activity related significantly with all the parameters (p < 0.001), except with AP, LA only with E. coli IF, and BG (p < 0.05), while AP was not correlated with any of the parameters.
Table 2.
Pearson correlation coefficients (below the diagonal) calculated among CDOM (a280, a355) and microbiological parameters (E. coli abundances estimated with MF and IF methods, BG, LA, and AP enzymatic activities) with associated p values (above the diagonal). See caption to Table 1 for abbreviations.
Additionally, the PCA outputs (not shown) demonstrated that the E. coli MF and IF counts were inversely related to salinity. The two components PC1 and PC2 explained 86.5 and 13.5% of the total variability, respectively. Stations SC0 and SC1 (2015 and 2017) were grouped together and were related to E. coli MF; this relationship confirmed that viable E. coli cells were relevant at the discharge stations. Conversely, stations SC2–SC6 were reciprocally related and with E. coli IF, whose abundance included all E. coli cells, regardless of their viability state.
3.2. CDOM Fluorescence
The fluorescence EEM matrix of CDOM is shown in Figure 3. PARAFAC analysis applied to the EEMs measured on the samples collected in 2017 allowed for the identification of three main components within CDOM: The C1 (λEx/λEm = 342 nm/435 nm) and C2 (λEx/λEm = 281–373 nm/460 nm) peaks corresponded to the peak “C” of terrestrial humic acids while C3 (λEx/λEm = 286 nm/360 nm) was consistent with protein-like fluorophores with particular reference to the peak “T” of tryptophan, according to the classification proposed by Coble [45]. The results of the fluorescence measures confirmed the differences within the study area in the CDOM pool, characterized by a mixture of fluorophores of autochthonous, terrestrial, and anthropogenic origin.
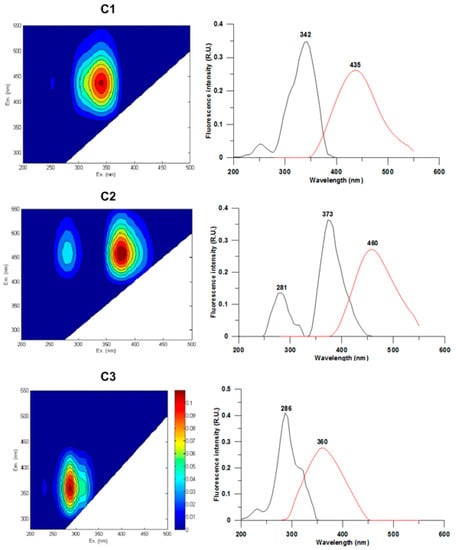
Figure 3.
(Left) EEMs of the three components (C1–C3) identified with PARAFAC analysis. (Right) the line plots show the excitation (black lines) and emission (red lines) fluorescence spectra.
Figure 4 shows the relative abundances of the three components detected by PARAFAC analysis within the study area. The C1 and C2 peaks were present with the highest percentages at all the sampling stations in the four sampling phases, with a median value of 46.6% and 39.2%, respectively. A significant difference was observed for the C3 peak between SC0 and SC1 stations compared to those located within the bathing area (SC3, SC4, SC5, and SC6), with median values ranging from 19.91% to 39.21%. Positive Pearson correlations were detected between the C3 peak and microbiological analyses (MF and IF), and a355 (MF: r = 0.94; IF: r = 0.68, a355 r = 0.87, p < 0.01 for all the parameters) as well as with all the three examined enzymes (BG: r = 0.83, LA: r = 0.62; AP: r = 0.87, p < 0.01 for all the parameters). Such results pointed out the strict relation between the CDOM pool and microbial activity in seawater, giving evidence that the occurrence of CDOM substances depends on the metabolic dynamics of autochthonous as well as allochthonous microbial communities.
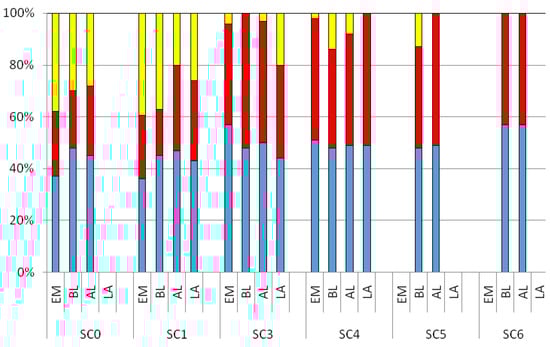
Figure 4.
Relative abundances (as percentage of the total) of the three components recorded over a diurnal study (EM: Early Morning; BL, Before Lunch; AL, After Lunch; LA, Late Afternoon), obtained by the PARAFAC analysis within the bathing area. Blue, C1; red, C2; yellow, C3.
4. Discussion
This study focused on CDOM measurements and their use as a rapid tool to assess and quantify the occurrence of fecal pollution, allowing the detection of the presence of untreated urban wastewater in the study area. During 2015–2017 summer seasons, high levels of both CDOM and E. coli abundances were found at the discharge point. CDOM absorption spectra measured at all the stations showed a typical descending exponential trend at increasing wavelengths in the Ultraviolet–Visible range, with a marked decrease in the absorption coefficients moving from the discharge point to the seawater stations, in concomitance with a strong salinity gradient. In particular, maximum median values of a280 and a355 were detected at discharge station SC0 (a280 = 38.01 m−1; a355 = 18.20 m−1), where the maximum E. coli abundances were also found (MF = 20,000 CFU 100 mL−1; IF = 27,460 cells 100 mL−1), highlighting the presence of highly microbial polluted waters rich in both protein and humic-like substances [44]. Despite the inputs of organic matter within the bathing area, a280 and a355 median values at marine stations SC2–SC6 were consistently lower (a280 = 2.04 m−1; a355 = 0.72 m−1) and the E. coli medians did not exceed the limit value of 500 CFU 100 mL−1 established by Italian Legislation Decree 116/08, falling within the classification of excellent quality waters, according to Bathing Water 2006/7/EC. Considering the distribution of E. coli, bacterial concentrations only exceeded the threshold limit during three samplings: at SC2 station in 2015 (1565 CFU 100 mL−1) and at SC4 station in 2015 and 2017 (635 and 846 CFU 100 mL−1, respectively), highlighting the bathing areas where the probability of pathogenic bacteria to concentrate was higher, with consequent potential human health risks. Such results pointed out that the overall level of fecal pollution in the Santa Cecilia bathing area was maintained at low level by the rapid dilution of the polluted waters spilled into the bathing area with offshore waters, thanks to the high recirculation driven by sea currents in the absence of artificial barriers limiting water renewal [73]. Conversely, in the bathing area of Santa Marinella, close to Santa Cecilia, lower E. coli abundances were detected at the discharge point, while the threshold limits were often exceeded in the area most frequented by bathers, confirming the pivotal role of the hydrodynamic processes in affecting the dispersion of fecal bacteria [74].
The dual approach applied in our study (i.e., spectral CDOM analysis coupled with estimates of microbial metabolism through enzyme activities) allowed for the assessment of the spatial impact of fecal pollution over the bathing area as well as the role of allochthonous bacterial communities such as fecal microorganisms in the fate of organic matter. Indeed, microbial community members (bacteria, archaea, protists) are key elements driving the ecological dynamics of marine environments, and are characterized by a wide functional diversity [9]. The ability of microbes to respond to natural and anthropogenic perturbations by modifying their abundance and/or metabolism makes them sensitive sentinels of environmental changes [75]. In natural ecosystems, heterotrophic microbial communities use extracellular enzymes to degrade high molecular weight organic matter and high rates of organic matter degradation are generally found in coastal environments characterized by high trophic conditions [9,59,76]. Furthermore, through modulation of their enzymatic patterns, microorganisms may regulate their metabolic activities with important implications in biogeochemical cycles and organic matter turnover, and, more generally, in ecosystem functioning, especially in the coastal regions that are among the most biogeochemically active areas [76]. In our survey, peak values of CDOM were associated with high E. coli abundances and enzyme activity rates at the discharge point compared with uncontaminated stations. This result suggests that DOM inputs released by sewage wastes acted as a trophic source, stimulating microbial metabolism and growth. In agreement with our observations, a coupling between CDOM, microbial abundance, and metabolic activity patterns occurred at riverine discharges during extreme flood events, suggesting the stimulation of microbial processes in response to land-derived substrates and contaminants, with consequences on the productivity of the whole area [39]. In aquatic environments, both photochemical and microbial processes such as enzymatic decomposition have been reported to modify spectral DOM characteristics, as observed in the marine zone of the estuarine area of Ria de Aveiro, Portugal [77], where positive correlations between total bacterial abundance, LA activity, and CDOM a254 and a350 absorption coefficients as well as annual and inter-annual variations of the relative proportions of “labile” and “refractory” fractions of the DOM pool were found, suggesting a microbial contribution to the high molecular weight DOM. Among the enzymes assayed in our study, BG was found to correlate significantly to both E. coli abundance and CDOM analysis, confirming the relationship linking fecal pollution to this enzyme, synthesized by human fecal microbiota [78,79].
PARAFAC model application allowed us to identify three main components with different fluorescence signatures: according to the classification reported by Coble [45]; the C1 (λEx: 342 nm; λEm: 435 nm) and C2 (λEx: 281/373 nm; λEm: 460 nm) peaks corresponded to the peak “C” (λEx: 350 nm; λEm: 420–480 nm) characteristics of the humic acids of terrestrial origin (humic-like), while the C3 peak (λEx: 286 nm; λEm: 360 nm) was homologous to the tryptophan peak “T” of protein-like fluorophores. As specified by Coble [45], the excitation and emission wavelengths characterizing the peaks may vary according to the composition of the samples. The relative abundance of the peaks detected at the monitored stations showed a significant difference between the stations near the discharge (SC0 and SC1) and those further away (SC2–SC6). The C1 and C2 peaks (humic acids) were mostly constant both over a spatial and temporal scale, while the C3 peak (tryptophan) was more abundant at the SC0 and SC1 stations compared to the other ones. Singh et al. [80] reported that the presence of the same peaks correlated with the microbial activity involved in the organic matter degradation processes. The high fluorescence of tryptophan has been extensively described in the literature regarding wastewaters, constituting both a metabolic product and a bioavailable substrate for active bacterial communities [16]. PARAFAC results from EEMs were in agreement with the microbiological analyses, confirming the link at the discharge point between the abundance of organic matter in terms of tryptophan and the concentration of E. coli cells measured by both MF and IF methods.
In the last decades, fluorescence spectroscopy allowed us to widely characterize aquatic DOM from natural or anthropogenic sources, enabling the development of cost-effective technologies for the rapid monitoring of water quality from various environments [49]. In particular, Moore et al. [81], Zielinski et al. [82], and Conmy et al. [83] provided in-depth reviews of the in situ monitoring studies focused on the marine environment and the technical details of the used field fluorometers. Despite recent technological advances, there are still some limitations in terms of sensitivity as well as the need to define a common protocol for data correction (i.e., in relation to suspended particles, dissolved matter, or temperature) and calibration strategies to obtain more reliable quantitative in situ measurements for bathing water quality monitoring. The inclusion of real time CDOM/tryptophan fluorescence measurements within coastal observing systems is essential to quickly detect fecal contamination events occurring in coastal areas, thus enabling decision makers to promptly set intervention measures for human health protection. It also responds to the urgent need arisen by the international scientific governance and policy communities of up-to-date knowledge of the status and trends of coastal systems, providing essential information on the effects of human pressures on marine ecosystems to implement new management solutions. In addition, microbial diversity and biomass have recently been identified as emerging essential ocean variables to be implemented in Global Ocean Observing Systems [84]. This leads to the need to extend the spatial coverage of observations to coastal waters, thus requiring additional technologies for the application of integrated multidisciplinary approaches.
To face this issue, a strong effort has been devoted to develop Spectra cost-effective technology [85,86], which provides continuous real-time information about the physical and biological state of surface waters (temperature, conductivity, chlorophyll-a fluorescence, CDOM fluorescence). First conceived to be used onboard both coastal, smaller vessels, and ships of opportunity, it can also be installed as a coastal fixed station to monitor potentially contaminated discharge inputs, thanks to its modularity and low power consumption. The acquired time series, integrated with high-resolution remote sensing data (Sentinel 2-Landsat 8) and mathematical dispersion models are going to be included within the Civitavecchia Coastal Environment Monitoring System C-CEMS [6], implementing its capability in forecasting potential pollution phenomena.
5. Conclusions
This study showed that, during the 2015–2017 bathing seasons, coastal marine areas of the Northern Latium experienced fecal contamination. The association of CDOM composition with fecal pollution assessment and the measurement of microbial metabolism by enzyme activities could be a valuable proxy of the physiological state of allochthonous bacteria introduced into the marine ecosystem, and the results obtained in this survey encourage its use in future monitoring studies. As a practical application, the same sample could be partitioned and analyzed for spectral and enzymatic measurements performed in short times and with simple procedures, allowing accurate information on organic matter origin and composition to be obtained in near-real time. These analytical approaches could implement the array of methodological strategies available for fecal contamination determination [87]. Aside from their role for human health risk assessment, the inclusion of microbial variables as sensitive indicators of overall ecosystem health status has also been suggested by recent directives regarding the sustainable management and safeguard of marine and coastal ecosystems. In this context, strong effort must be dedicated to the development of new technologies, which allow direct in situ bacterial abundance and activity measurements. Enzyme measurements could also be automatized through the use of advanced systems, allowing the remote addition of reagents [88]. These technologies should be based on low-cost and low power consumption components [89] in order to expand observatory networks and increase data availability; in addition, the devices should be able to provide near-real time data in order to set up early-warning systems for monitoring bathing waters.
Author Contributions
Conceptualization, A.M., S.B., D.P., V.P., and M.M.; Methodology, A.M., S.B., and G.C.; Software, S.B., A.M., and D.P.; Validation, G.Z. and G.C.; Formal analysis, G.Z.; Investigation, A.M., G.C., D.P., S.B., and V.P.; Resources, M.M.; Data curation, A.M., G.C., D.P., and S.B.; Writing—original draft preparation, all authors; Writing—review and editing, all authors.; Visualization, A.M. and G.C.; Supervision, A.M.; Project administration, A.M.; Funding acquisition, M.M. All authors have read and agreed to the published version of the manuscript.
Funding
This research received no external funding.
Conflicts of Interest
The authors declare no conflict of interest.
References
- Holm, S.E.; Windsor, J.G., Jr. Exposure assessment of sewage treatment plant effluent by a selected chemical marker method. Arch. Environ. Contam. Toxicol. 1990, 19, 674–679. [Google Scholar] [CrossRef] [PubMed]
- Chambers, P.A.; Allard, M.; Walker, S.L.; Marsalek, J.; Lawrence, J.; Servos, M.; Busnarda, J.; Munger, K.S.; Jefferson, C.; Kent, R.A.; et al. Impacts of municipal wastewater effluents on Canadian waters: A review. Water Qual. Res. J. Can. 1997, 32, 659–714. [Google Scholar] [CrossRef]
- Singh, K.P.; Mohan, D.; Sinha, S.; Dalwani, R. Impact assessment of treated/untreated wastewater toxicants discharged by sewage treatment plants on health, agricultural, and environmental quality in the wastewater disposal area. Chemosphere 2004, 55, 227–255. [Google Scholar] [CrossRef] [PubMed]
- Brown, C.J.; Knight, B.W.; McMaster, M.E.; Munkittrick, K.R.; Oakes, K.D.; Tetreault, G.R.; Servos, M.R. The effects of tertiary treated municipal wastewater on fish communities of a small river tributary in southern Ontario, Canada. Environ. Pollut. 2011, 159, 1923–1931. [Google Scholar] [CrossRef]
- Tedetti, M.; Longhitano, R.; Garcia, N.; Guigue, C.; Ferretto, N.; Goutx, M. Fluorescence properties of dissolved organic matter in coastal Mediterranean waters influenced by a municipal sewage effluent (Bay of Marseilles, France). Environ. Chem. 2012, 9, 438–449. [Google Scholar] [CrossRef]
- Bonamano, S.; Piermattei, V.; Madonia, A.; Paladini de Mendoza, F.; Pierattini, A.; Martellucci, R.; Stefanì, C.; Zappalà, G.; Caruso, G.; Marcelli, M. The Civitavecchia Coastal Environment Monitoring System (C-CEMS): A new tool to analyse the conflicts between coastal pressures and sensitivity areas. Ocean Sci. 2016, 12, 87–100. [Google Scholar] [CrossRef]
- Odonkor, S.T.; Ampofo, J.K. Escherichia coli as an indicator of bacteriological quality of water: An overview. Microbiol. Res. 2013, 4, e2. [Google Scholar] [CrossRef]
- TEPatCotE Union. Directive 2006/7/EC of the European Parliament and of the Council of 15 February 2006 concerning the management of bathing water quality and repealing Directive 76/160/EEC. Off. J. Eur. Union 2006, 64, 37–51. [Google Scholar]
- Caruso, G.; La Ferla, R.; Azzaro, M.; Zoppini, A.; Marino, G.; Petochi, T.; Corinaldesi, C.; Leonardi, M.; Zaccone, R.; Fonda Umani, S.; et al. Microbial assemblages for environmental quality assessment: Knowledge, gaps and usefulness in the European Marine Strategy Framework Directive. Crit. Rev. Microbiol. 2016, 42, 883–904. [Google Scholar] [CrossRef]
- Sorensen, J.P.R.; Baker, A.; Cumberland, S.A.; Lapworth, D.J.; MacDonald, A.M.; Pedley, S.; Taylor, R.G.; Ward, J.S.T. Real-time detection of faecally contaminated drinking water with tryptophan-like fluorescence: Defining threshold values. Sci. Total Environ. 2018, 622–623, 1250–1257. [Google Scholar] [CrossRef]
- Zaccone, R.; Crisafi, E.; Caruso, G. Evaluation of fecal pollution in coastal Italian waters by immunofluorescence. Aquat. Microb. Ecol. 1995, 9, 79–85. [Google Scholar] [CrossRef][Green Version]
- Caruso, G.; Crisafi, E.; Mancuso, M. Development of an enzyme assay for rapid assessment of Escherichia coli in seawaters. J. Appl. Microbiol. 2002, 93, 548–556. [Google Scholar] [CrossRef] [PubMed]
- Caruso, G.; Manucso, M.; Crisafi, E. Combined fluorescent antibody assay and viability staining for the assessment of the physiological states of Escherichia coli in seawaters. J. Appl. Microbiol. 2003, 95, 225–233. [Google Scholar] [CrossRef] [PubMed]
- Petrenko, A.A.; Jones, B.H.; Dickey, T.D.; LeHaitre, M.; Moore, C. Effects of a sewage plume on the biology, optical characteristics, and particle size distributions of coastal waters. J. Geophys. Res. 1997, 102, 25061. [Google Scholar] [CrossRef]
- Clark, C.D.; O’Connor, A.P.; Foley, D.M.; de Bruyn, W.J. A study of fecal coliform sources at a coastal site using colored dissolved organic matter (CDOM) as a water source tracer. Mar. Pollut. Bull. 2007, 54, 1507–1513. [Google Scholar] [CrossRef]
- Hudson, N.; Baker, A.; Reynolds, D. Fluorescence analysis of dissolved organic matter in natural, waste and polluted waters-a review. River Res. Appl. 2007, 23, 631–649. [Google Scholar] [CrossRef]
- Tedetti, M.; Guigue, C.; Goutx, M. Utilization of a submersible UV fluorometer for monitoring anthropogenic inputs in the Mediterranean coastal waters. Mar. Pollut. Bull. 2010, 60, 350–362. [Google Scholar] [CrossRef]
- Zhuo, J.F.; Guo, W.D.; Deng, X.; Zhang, Z.Y.; Xu, J.; Huang, L.F. Fluorescence excitation-emission matrix spectroscopy of CDOM from Yundang Lagoon and its indication for organic pollution. Spectrosc. Spect. Anal. 2010, 30, 1539–1544. [Google Scholar] [CrossRef]
- Tzortziou, M.; Zeri, C.; Dimitriou, E.; Ding, Y.; Jaffé, R.; Anagnostou, E.; Pitta, E.; Mentzafou, A. Colored dissolved organic matter dynamics and anthropogenic influences in a major transboundary river and its coastal wetland. Limnol. Oceanogr. 2015, 60, 1222–1240. [Google Scholar] [CrossRef]
- Coble, P.G. Marine optical biogeochemistry—The chemistry of ocean color. Chem. Rev. 2007, 107, 402–418. [Google Scholar] [CrossRef]
- Stedmon, C.A.; Markager, S.; Bro, R. Tracing dissolved organic matter in aquatic environments using a new approach to fluorescence spectroscopy. Mar. Chem. 2003, 82, 239–254. [Google Scholar] [CrossRef]
- Murphy, K.R.; Stedmon, C.A.; Waite, T.D.; Ruiz, G.M. Distinguishing between terrestrial and autochthonous organic matter sources in marine environments using fluorescence spectroscopy. Mar. Chem. 2008, 108, 40–58. [Google Scholar] [CrossRef]
- Guo, W.; Yang, L.; Hong, H.; Stedmon, C.A.; Wang, F.; Xu, J.; Xie, Y. Assessing the dynamics of chromophoric dissolved organic matter in a subtropical estuary using parallel factor analysis. Mar. Chem. 2011, 124, 125–133. [Google Scholar] [CrossRef]
- Jørgensen, L.; Stedmon, C.A.; Kragh, T.; Markager, S.; Middelboe, M.; Søndergaard, M. Global trends in the fluorescence characteristics and distribution of marine dissolved organic matter. Mar. Chem. 2011, 126, 139–148. [Google Scholar] [CrossRef]
- Dainard, P.G.; Guéguen, C. Distribution of PARAFAC modeled CDOM components in the North Pacific ocean, Bering, Chukchi and Beaufort seas. Mar. Chem. 2013, 157, 216–223. [Google Scholar] [CrossRef]
- Yamashita, Y.; Boyer, J.N.; Jaffé, R. Evaluating the distribution of terrestrial dissolved organic matter in a complex coastal ecosystem using fluorescence spectroscopy. Cont. Shelf Res. 2013, 66, 136–144. [Google Scholar] [CrossRef]
- Galletti, Y.; Gonnelli, M.; Brogi, S.R.; Vestri, S.; Santinelli, C. DOM dynamics in open waters of the Mediterranean Sea: New insights from optical properties. Deep Sea Res. Pt. I 2019, 144, 95–114. [Google Scholar] [CrossRef]
- Stedmon, C.A.; Seredyńska-Sobecka, B.; Boe-Hansen, R.; Le Tallec, N.; Waul, C.K.; Arvin, E. A potential approach for monitoring drinking water quality from groundwater systems using organic matter fluorescence as an early warning for contamination events. Water Res. 2011, 45, 6030–6038. [Google Scholar] [CrossRef]
- Nowicki, S.; Lapworth, D.J.; Ward, J.S.; Thomson, P.; Charles, K. Tryptophan-like fluorescence as a measure of microbial contamination risk in groundwater. Sci. Total Environ. 2019, 646, 782–791. [Google Scholar] [CrossRef]
- Henderson, R.K.; Baker, A.; Murphy, K.R.; Hambly, A.; Stuetz, R.M.; Khan, S.J. Fluorescence as a potential monitoring tool for recycled water systems: A review. Water Res. 2009, 43, 863–881. [Google Scholar] [CrossRef]
- Hambly, A.C.; Henderson, R.K.; Storey, M.V.; Baker, A.; Stuetz, R.M.; Khan, S.J. Fluorescence monitoring at a recycled water treatment plant and associated dual distribution system-implications for cross-connection detection. Water Res. 2010, 44, 5323–5333. [Google Scholar] [CrossRef] [PubMed]
- Yu, H.; Song, Y.; Gao, H.; Liu, L.; Yao, L.; Peng, J. Applying fluorescence spectroscopy and multivariable analysis to characterize structural composition of dissolved organic matter and its correlation with water quality in an urban river. Environ. Earth Sci. 2015, 73, 5163–5171. [Google Scholar] [CrossRef]
- Bieroza, M.; Baker, A.; Bridgeman, J. Relating freshwater organic matter fluorescence to organic carbon removal efficiency in drinking water treatment. Sci. Total Environ. 2009, 407, 1765–1774. [Google Scholar] [CrossRef] [PubMed]
- Baghoth, S.A.; Sharma, S.K.; Amy, G.L. Tracking natural organic matter (NOM) in a drinking water treatment plant using fluorescence excitation–emission matrices and PARAFAC. Water Res. 2011, 45, 797–809. [Google Scholar] [CrossRef]
- Zhou, Y.; Jeppesen, E.; Zhang, Y.; Shi, K.; Liu, X.; Zhu, G. Dissolved organic matter fluorescence at wavelength 275/342 nm as a key indicator for detection of point-source contamination in a large Chinese drinking water lake. Chemosphere 2016, 144, 503–509. [Google Scholar] [CrossRef]
- Baker, A. Fluorescence excitation-emission matrix characterization of some sewage-impacted rivers. Environ. Sci. Technol. 2001, 35, 948–953. [Google Scholar] [CrossRef]
- Baker, A.; Spencer, R.G. Characterization of dissolved organic matter from source to sea using fluorescence and absorbance spectroscopy. Sci. Total Environ. 2004, 333, 217–232. [Google Scholar] [CrossRef]
- Cyr, F.; Tedetti, M.; Besson, F.; Beguery, L.; Doglioli, A.M.; Petrenko, A.A.; Goutx, M. A new glider-compatible optical sensor for dissolved organic matter measurements: Test case from the NW Mediterranean Sea. Front. Mar. Sci. 2017, 4, 89. [Google Scholar] [CrossRef]
- Zoppini, A.; Ademollo, N.; Bensi, M.; Berto, D.; Bongiorni, L.; Campanelli, A.; Casentini, B.; Patrolecco, L.; Amalfitano, S. Impact of a river flood on marine water quality and planktonic microbial communities. Estuar. Coast. Shelf Sci. 2019, 224, 62–72. [Google Scholar] [CrossRef]
- Seritti, A.; Russo, D.; Nannicini, L.; Del Vecchio, R. DOC, absorption and fluorescence properties of estuarine and coastal waters of the Northern Tyrrhenian Sea. Chem. Speciat. Bioavailab. 1998, 10, 95–106. [Google Scholar] [CrossRef]
- Vignudelli, S.; Santinelli, C.; Murru, E.; Nannicini, L.; Seritti, A. Distributions of dissolved organic carbon (DOC) and chromophoric dissolved organic matter (CDOM) in coastal waters of the northern Tyrrhenian Sea (Italy). Estuar. Coast. Shelf Sci. 2004, 60, 133–149. [Google Scholar] [CrossRef]
- Para, J.; Coble, P.G.; Charrière, B.; Tedetti, M.; Fontana, C.; Sempéré, R. Fluorescence and absorption properties of chromophoric dissolved organic matter (CDOM) in coastal surface waters of the northwestern Mediterranean Sea, influence of the Rhône River. Biogeosciences 2010, 7, 4083. [Google Scholar] [CrossRef]
- Gonnelli, M.; Vestri, S.; Santinelli, C. Chromophoric dissolved organic matter and microbial enzymatic activity. Biophys. Chem. 2013, 182, 79–85. [Google Scholar] [CrossRef]
- Retelletti Brogi, S.; Gonnelli, M.; Vestri, S.; Santinelli, C. Biophysical processes affecting DOM dynamics at the Arno river mouth (Tyrrhenian Sea). Biophys. Chem. 2015, 197, 1–9. [Google Scholar] [CrossRef] [PubMed]
- Coble, P. Characterization of marine and terrestrial DOM in seawater using excitation-emission matrix spectroscopy. Mar. Chem. 1996, 51, 325–346. [Google Scholar] [CrossRef]
- Fellman, J.B.; Hood, E.; Spencer, R.G.M. Fluorescence spectroscopy opens new windows into dissolved organic matter dynamics in freshwater ecosystems: A review. Limnol. Oceanogr. 2010, 55, 2452–2462. [Google Scholar] [CrossRef]
- Reynolds, D.M. The differentiation of biodegradable and non-biodegradable dissolved organic matter in wastewaters using fluorescence spectroscopy. J. Chem. Technol. Biotechnol. 2002, 77, 965–972. [Google Scholar] [CrossRef]
- Hudson, N.; Baker, A.; Ward, D.; Reynolds, D.M.; Brunsdon, C.; Carliell-Marquet, C.; Browning, S. Can fluorescence spectrometry be used as a surrogate for the biochemical oxygen demand (BOD) test in water quality assessment? An example from South West England. Sci. Total Environ. 2008, 391, 149–158. [Google Scholar] [CrossRef] [PubMed]
- Carstea, E.M.; Popa, C.L.; Baker, A.; Bridgeman, J. In situ fluorescence measurements of dissolved organic matter: A review. Sci. Total Environ. 2020, 699, 134361. [Google Scholar] [CrossRef]
- Yamashita, Y.; Tanoue, E. Chemical characterization of protein-like fluorophores in DOM in relation to aromatic amino acids. Mar. Chem. 2003, 82, 255–271. [Google Scholar] [CrossRef]
- Determann, S.; Lobbes, J.M.; Reuter, R.; Rullkutter, J. Ultraviolet fluorescence excitation and emission spectroscopy of marine algae and bacteria. Mar. Chem. 1998, 62, 137–156. [Google Scholar] [CrossRef]
- Carlson, C.A. Production and removal processes. In Biogeochemistry of Marine Dissolved Organic Matter; Hansell, D.A., Carlson, C.A., Eds.; Academic Press: San Diego, CA, USA, 2002; pp. 91–152. [Google Scholar]
- Hedges, J.I. Why dissolved organics matter? In Biogeochemistry of Marine Dissolved Organic Matter; Hansell, D.A., Carlson, C.A., Eds.; Academic Press: San Diego, CA, USA, 2002; pp. 1–33. [Google Scholar]
- Jiao, N.; Herndl, G.J.; Hansell, D.A.; Benner, R.; Kattner, G.; Wilhelm, S.W.; Kirchman, D.L.; Weinbauer, M.G.; Luo, T.; Chen, F.; et al. Microbial production of recalcitrant dissolved organic matter: Long-term carbon storage in the global ocean. Nat. Rev. Microbiol. 2010, 8, 593. [Google Scholar] [CrossRef] [PubMed]
- Smith, R.C.; Prezelin, B.B.; Baker, K.E.A.; Bidigare, R.R.; Boucher, N.P.; Coley, T.; Karents, D.; Macintyre, S.; Matlick, H.A.; Menzies, D.; et al. Ozone depletion: Ultraviolet radiation and phytoplankton biology in Antarctic waters. Science 1992, 255, 952–959. [Google Scholar] [CrossRef] [PubMed]
- Herndl, G.J.; Müller-Niklas, G.; Frick, J. Major role of ultraviolet-B in controlling bacterioplankton growth in the surface layer of the ocean. Nature 1993, 361, 717–719. [Google Scholar] [CrossRef]
- Nelson, N.B.; Siegel, D.A. The global distribution and dynamics of chromophoric dissolved organic matter. Annu. Rev. Mar. Sci. 2013, 5, 447–476. [Google Scholar] [CrossRef]
- Hoppe, H.G.; Arnosti, C.; Herndl, G.J. Ecological Significance of Bacterial Enzymes in the Marine Environment. In Enzymes in the Environment: Activity, Ecology and Applications; Burns, R., Dick, R., Eds.; Marcel Dekker: New York, NY, USA, 2002; pp. 73–108. [Google Scholar]
- Caruso, G. Leucine aminopeptidase, b-glucosidase and alkaline phosphatase activity rates and their significance in nutrient cycles in some coastal Mediterranean sites. Mar. Drugs 2010, 8, 916–940. [Google Scholar] [CrossRef]
- Mitchell, B.G.; Kahru, M.; Wieland, J.; Stramska, M. Determination of spectral absorption coefficients of particles, dissolved material and phytoplankton for discrete water samples. In Ocean Optics Protocols for Satellite Ocean Color Sensor Validation, Revision 3; Muller, J.L., Fargion, G.S., Eds.; NASA: Hanover, NH, USA, 2002; Volume 2, Chapter 15; pp. 231–257. [Google Scholar]
- Twardowski, M.S.; Boss, E.; Sullivan, J.M.; Donaghay, P.L. Modeling the spectral shape of absorption by chromophoric dissolved organic matter. Mar. Chem. 2004, 89, 69–88. [Google Scholar] [CrossRef]
- Bricaud, A.; Morel, A.; Prieur, L. Absorption by dissolved organic matter of the sea (yellow substance) in the UV and visible domains 1. Limnol. Oceanogr. 1981, 26, 43–53. [Google Scholar] [CrossRef]
- Helms, J.R.; Stubbins, A.; Ritchie, J.D.; Minor, E.C.; Kieber, D.J.; Mopper, K. Absorption spectral slopes and slope ratios as indicators of molecular weight, source, and photobleaching of chromophoric dissolved organic matter. Limnol. Oceanogr. 2008, 53, 955–969. [Google Scholar] [CrossRef]
- Monticelli, L.S.; Caruso, G.; Decembrini, F.; Caroppo, C.; Fiesoletti, F. Role of prokaryotic biomasses and activities in carbon and phosphorus cycles at a coastal, thermohaline front and in offshore waters (Gulf of Manfredonia, Southern Adriatic Sea). Microb. Ecol. 2014, 67, 501–519. [Google Scholar] [CrossRef]
- Hammer, Ø.; Harper, D.A.T.; Ryan, P.D. PAST: PAleontological STatistics software package for education and data analysis. Paleontol. Electron. 2001, 4, 1–9. Available online: http://palaeo-electronica.org/2001_1/past/issue1_01.htm (accessed on 1 October 2019).
- Bro, R. PARAFAC. Tutorial and applications. Chemometr. Intell. Lab. 1997, 38, 149–172. [Google Scholar] [CrossRef]
- Stedmon, C.A.; Bro, R. Characterizing dissolved organic matter fluorescence with parallel factor analysis: A tutorial. Limnol. Oceanogr. 2008, 6, 572–579. [Google Scholar] [CrossRef]
- Andersen, C.M.; Bro, R. Practical aspects of PARAFAC modeling of fluorescence excitation-emission data. J. Chemom. 2003, 17, 200–215. [Google Scholar] [CrossRef]
- Bahram, M.; Bro, R.; Stedmon, C.; Afkhami, A. Handling of Rayleigh and Raman scatter for PARAFAC modeling of fluorescence data using interpolation. J. Chemom. 2006, 20, 99–105. [Google Scholar] [CrossRef]
- Lakowicz, J.R. Principles of Fluorescence Spectroscopy, 3rd ed.; Springer-Verlag: Berlin/Heidelberg, Germany, 2006. [Google Scholar] [CrossRef]
- Gonnelli, M.; Galletti, Y.; Marchetti, E.; Mercadante, L.; Brogi, S.R.; Ribotti, A.; Sorgente, R.; Vestri, S.; Santinelli, C. Dissolved organic matter dynamics in surface waters affected by oil spill pollution: Results from the Serious Game exercise. Deep-Sea Res. PT II 2016, 133, 88–99. [Google Scholar] [CrossRef]
- Tedetti, M.; Marie, L.; Röttgers, R.; Rodier, M.; Van Wambeke, F.; Helias, S.; Caffin, M.; Cornet-Barthaux, V.; Dupouy, C. Evolution of dissolved and particulate chromophoric materials during the VAHINE mesocosm experiment in the New Caledonian coral lagoon (south-west Pacific). Biogeosciences 2016, 13, 3283–3303. [Google Scholar] [CrossRef]
- Zappalà, G.; Bonamano, S.; Madonia, A.; Caruso, G.; Marcelli, M. Microbial risk assessment in a coastal marine environment through the use of mathematical models. WIT Trans. Ecol. Environ. 2012, 164, 3–14. [Google Scholar] [CrossRef]
- Bonamano, S.; Madonia, A.; Borsellino, C.; Stefanì, C.; Caruso, G.; De Pasquale, F.; Piermattei, V.; Zappalà, G.; Marcelli, M. Modeling the dispersion of viable and total Escherichia coli cells in the artificial semi-enclosed bathing area of Santa Marinella (Latium, Italy). Mar. Pollut. Bull. 2015, 95, 141–154. [Google Scholar] [CrossRef]
- Caruso, G.; Azzaro, M.; Caroppo, C.; Decembrini, F.; Monticelli, L.S.; Leonardi, M.; Maimone, G.; Zaccone, R.; La Ferla, R. Microbial community and its potential as descriptor of environmental status. ICES J. Mar. Sci. 2016, 73, 2174–2177. [Google Scholar] [CrossRef]
- Zaccone, R.; Caruso, G. Microbial enzymes in the Mediterranean Sea: Relationship with climate changes. AIMS Microbiol. 2019, 5, 251–271. [Google Scholar] [CrossRef] [PubMed]
- Santos, L.; Santos, E.B.H.; Dias, J.M.; Cunha, A.; Almeida, A. Photochemical and microbial alterations of DOM spectroscopic properties in the estuarine system Ria de Aveiro. Photochem. Photobiol. Sci. 2014, 13, 1146–1159. [Google Scholar] [CrossRef] [PubMed]
- Nowak, A.; Slizewska, K. B-Glucuronidase and -glucosidase activity and human fecal water genotoxicity in the presence of probiotic lactobacilli and the heterocyclic aromatic amine IQ in vitro. Env. Toxicol. Pharmacol. 2014, 37, 66–73. [Google Scholar] [CrossRef] [PubMed]
- Flores, R.; Shi, J.; Gail, M.H.; Ravel, J.; Goedert, J.J. Assessment of the human fecal microbiota: I. Measurement and reproducibility of selected enzymatic activities. Eur. J. Clin. Investig. 2012, 42, 848–854. [Google Scholar] [CrossRef]
- Singh, S.; D’Sa, E.J.; Swenson, E.M. Chromophoric dissolved organic matter (CDOM) variability in Barataria Basin using excitation–emission matrix (EEM) fluorescence and parallel factor analysis (PARAFAC). Sci. Total Environ. 2010, 408, 3211–3222. [Google Scholar] [CrossRef]
- Moore, C.; Barnard, A.; Fietzek, P.; Lewis, M.R.; Sosik, H.M.; White, S.; Zielinski, O. Optical tools for ocean monitoring and research. Ocean Sci. 2009, 5, 661–684. [Google Scholar] [CrossRef]
- Zielinski, O.; Busch, J.A.; Cembella, A.D.; Daly, K.L.; Engelbrektsson, J.; Hannides, A.K.; Schmidt, H. Detecting marine hazardous substances and organisms: Sensors for pollutants, toxins, and pathogens. Ocean Sci. 2009, 5, 329–349. [Google Scholar] [CrossRef]
- Conmy, R.N.; Del Castillo, C.E.; Downing, B.D.; Chen, R.F. Experimental design and quality assurance: In situ fluorescence instrumentation. In Aquatic Organic Matter Fluorescence; Coble, P.G., Lead, J.R., Baker, A., Reynolds, D.M., Spencer, R.G.M., Eds.; Cambridge University Press: New York, NY, USA, 2014; pp. 190–230. [Google Scholar]
- Miloslavich, P.; Bax, N.; Simmons, S.; Klein, E.; Appeltans, W.; Aburto-Oropeza, O.; Andersen Garcia, M.; Batten, S.; Benedetti-Cecchi, L.; Checkley, D.; et al. Essential Ocean Variables for global sustained observations of biodiversity and ecosystem changes. Glob. Chang. Biol. 2018, 24, 2416–2433. [Google Scholar] [CrossRef]
- Marcelli, M.; Piermattei, V.; Madonia, A.; Mainardi, U. Design and application of new low-cost instruments for marine environmental research. Sensors 2014, 14, 23348–23364. [Google Scholar] [CrossRef]
- Marcelli, M.; Piermattei, V.; Madonia, A.; Lacava, T.; Mainardi, U. T-FLaP advances: Instrumental and operative implementation. J. Oper. Oceanogr. 2016, 9, 185–192. [Google Scholar] [CrossRef]
- Caruso, G.; Denaro, R.; Genovese, M.; Giuliano, L.; Mancuso, M.; Yakimov, M. New methodological strategies for detecting bacterial indicators. Chem. Ecol. 2004, 20, 167–181. [Google Scholar] [CrossRef]
- Ammerman, J.W.; Glover, W.B. Continuous underway measurement of microbial ectoenzyme activities in aquatic ecosystems. Mar. Ecol. Progr. Ser. 2000, 201, 1–12. [Google Scholar] [CrossRef]
- Piermattei, V.; Madonia, A.; Bonamano, S.; Martellucci, R.; Bruzzone, G.; Ferretti, R.; Odetti, A.; Azzaro, M.; Zappalà, G.; Marcelli, M. Cost-Effective Technologies to Study the Arctic Ocean Environment. Sensors 2018, 18, 2257. [Google Scholar] [CrossRef] [PubMed]


© 2020 by the authors. Licensee MDPI, Basel, Switzerland. This article is an open access article distributed under the terms and conditions of the Creative Commons Attribution (CC BY) license (http://creativecommons.org/licenses/by/4.0/).