1. Introduction
The global energy scenario promotes renewable energy sources (RES) as the base of a new, cleaner and safer energy production frontier. With the goal of reaching net overall CO
2 null emissions, as far as RES are concerned, sources other than wind, solar, and hydropower should be further developed and encouraged. Ocean energy electrical generation is a technology that has not yet reached grid parity, but is nowadays approaching the commercialization stage. It is commonly referred to wave, tidal, and thermal energy sources [
1]. Even if tidal range is currently the most mature sea technology, the wave resource seems to be the most interesting among ocean energy resources because of its wide potential. In these, always changing, energy production circumstances, offshore power extraction is becoming more and more interesting, aiming at taking advantage of stronger resources than onshore ones and at reducing land consumption.
Floating offshore wind platforms are imposing themselves as the most suitable option to exploit marine renewable energy sources in the case the sea depth is higher than 50 m [
2]. Therefore, there is the necessity to deeply comprehend and model the natural environment in which they will operate. Nevertheless, floating offshore wind turbines (FOWTs) usually challenge significant motions that could worsen the aerodynamic performance of the turbine and also induce additional structural loadings. A possible solution to face this issue could be the use of damping systems that passively disperse the energy induced by the waves and improve the stability of the overall platform. On the other hand, rather than dissipating wave-induced energy, another solution sees the structural loading being absorbed by a wave energy converter (WEC) [
3], integrating it on the offshore wind structure. This solution would actively reduce the offshore floater motions, increasing the power production of the whole platform. Furthermore, the WEC integration would provide other advantages such as the possibility of sharing the infrastructure between the two energy technologies as well as the electrical grid connection and the mooring system, finally reducing the overall cost of the energy platform.
It is also important to highlight that the integration of wind and wave technologies into hybrid offshore platforms has lately been hypothesized in several scientific publications.
Muliawan et al. [
4] proved the benefits on the total capital costs and on the energy production provided by the installation of an axi-symmetric WEC on a floating wind turbine. This approach also to led to the registration of a patent for the Spar Torus Combination (STC) WEC [
5].
Then, Karimirad et al. [
6] carried out a feasibility study about the integration of a spar-type FOWT and a WEC, taking inspiration from two real systems, Hywind and Wavestar, respectively. Furthermore, Peiffer and Roddier [
7] provided a detailed description of numerical modeling and experimental tests regarding the hybrid platform composed by the Wind Float structure and an Oscillating Wave Surge Converter (OWSC). Finally, Ding et al. [
8] and Perez-Collazo [
9] both provided overviews about possible wave-wind operational solutions, highlighting the need for special design requirements, but also the significant benefits provided by hybrid platforms. One of the examples of a floating hybrid system project is the W2Power plant, developed by Pelagic Power AS [
10]. The project is based on a semi-submersible triangular structure: 3 MW turbines are positioned, while the third one is used as a heliport to have easy access for maintenance and control. Another example is the Kriso semisubmersible multiunit floating offshore wind turbine (MUFOWT) in irregular waves [
11]: the square floating platform is equipped with four offshore wind turbines and wave energy converter (WEC) buoys along the sides. The WEC buoys move vertically along the waves to absorb the energy, thereby producing electrical power from the movements of the waves. Thereby, the platform becomes a power generation system for energy produced from both wind and wave.
This paper proposes a new way to stabilize wind platforms by mean of gyroscopic energy harvesting. Benefits on both the produced power and the reduction of the floater motion are demonstrated. The rest of this paper is organized as follows.
Section 2 presents the System model that describes all the subsystems composing the whole offshore energy platform, entering in detail each subsystem numerical model equation and the chosen simulation site.
Section 3 shows the most interesting results obtained and the conclusions close the work.
2. System Models
This paper aimed to assemble a reliable numerical model of a hybrid offshore energy platform that is composed of a FOWT and a WEC. This model can be exploited to simulate the behavior of the device in different environmental conditions, providing the energy production of the hybrid platform as well as its dynamic behavior as the main outputs. Furthermore, the possibility of simulating wind and wave technologies individually allows us to characterize the benefits or drawbacks caused by the hybrid coupling.
The final configuration of the platform is made of the following subsystems:
The motions of a floating body in seakeeping, that are described by a vector, are composed of the three translations of the center of gravity of the floater (COG) and of the three rotations about the axes . In this work, only the three degrees of freedom in the plane (surge, heave, pitch) were implemented since the analysis of all six degrees of freedom (DOFs) would uselessly complicate the modeling. The physical integration of the WEC with the FOWT hull is obtained through two connections:
the platform pitch motion is equal to the delta motion of the gyroscope system. Thus, it is used as input to the gyroscope subsystem, in order to evaluate its performance and power production.
the torque exerted by the Power Take Off (PTO) of the WEC is used as input to the hull subsystem, considering it as the reaction of the gyroscope system on the whole platform, that then is part of the force and torque balance that is executed inside the hull subsystem. The structural stability depends on wave, current, wind loads, and the contribution of the mooring system and the gyro system.
The description of the equation of motion in the time domain is provided by Cummins [
12] and it contains all the forces previously defined:
where
is the matrix of structural mass/inertia;
is the added mass/inertia;
Fexc is the excitation force of the floating platform;
Fmoor is the force exerted by the moorings;
FWT is the force exerted by the wind turbine; and
Fgyro is the force unloaded by the gyroscopic harvester. In the following, the loads for each system are presented.
2.1. The Sea Flower Floater Hydrodynamic Model
The “Sea Flower” floater, designed by Fincantieri (
Figure 1), consists of a “hexagonal submerged platform acting as the main buoyant body and damper, and six semi-submerged columns at the corners, that fulfil the static and dynamic lateral stability requirements while ensuring high transparency to wave motions” [
13]. In
Table 1, the main physical parameters of Fincantieri’s floater are summarized.
As far as the analysis of the movements of floating bodies is concerned, the main issue is represented by the approximation degree of the chosen model. Accurate and computationally efficient mathematical models are important for designing, optimizing, and controlling wave energy converters [
14]. Linear models are convenient because of the low computational time, but their good accuracy for small fluid/body motions is in contrast with the large movement that the wave energy converter experiences. Consequently, nonlinear effects arise [
15]. In this paper, the linear potential flow models were the most suitable due to a good trade-off between numerical accuracy and efficiency. Potential flow models, also known as boundary element methods (BEM) [
16,
17], define the velocity field as the gradient of the velocity potential. Furthermore, the ANSYS Aqwa commercial software package is used [
18]. Aqwa implements numerically linear BEM exploiting the panel method, which represents the structure surfaces through diffraction panels, in order to determine the physical parameters of floating bodies, considering small wave steepness and small amplitude motions. In addition, the instantaneous wetted surface of the body is approximated as a mean wetted surface. The linear boundary value problem (BVP) is solved by Aqwa through Green’s function in the frequency domain, in order to obtain the potential flow function
The total flow potential can be expressed as a superposition of single flow potentials, as follows:
Here, the subscripts , and indicate the incident wave, the diffracted wave, and the radiated wave flow potential, respectively. The last term depends on the six body motions, therefore the radiated term can be expressed as the vector product . Then, the incident wave term is .
Once the potentials are known, the first order hydrodynamic pressure may be calculated using the following linearized Bernoulli’s equation:
Integrating the pressure field over the wetted body surface, all the different linear hydrodynamic forces and moments may be calculated:
The force acting on the platform can be obtained as follows:
The description of the equation of platform motion in the time domain [
12] contains all the forces previously defined:
where
is the retardation function.
However, the simulations that exploit the time-domain implementation of Equation (6) have high computational demand, both in terms of time and memory, because of the presence of the convolution integral related to the radiation damping. Therefore, some approximations have been developed by Perez [
19,
20], which exploit the linear-time-invariant state-space model, resulting in a set of linear ordinary differential equations.
2.2. Wind Turbine
The wind turbine installed on Sea Flower is the NREL offshore 5-MW baseline wind turbine [
21]. It was developed and standardized by the Wind Department of the National Renewable Energy Laboratory of the U.S. Department of Energy, and is fully coupled to the floater, since the Sea Flower is designed for a turbine of 5 MW nominal power. The principal characteristics of NREL5MW are shown in
Table 2.
2.2.1. Aerodynamic Forces
Steady blade element momentum theory, that is, the most widely used method to calculate the velocities and the loads acting on a wind turbine rotor for any set of wind speed, rotor speed, and pitch angle, was applied in this work. It was developed in 1935 by Glauert [
22] and originates from the union of the blade element model and momentum theory.
However, many limitations affect the simple blade element momentum model. Therefore, to overcome some of these, the following corrections were implemented:
Prandtl’s tip-loss factor [
22];
Skewed wake correction [
24]; and
Dynamic wake model [
24,
25].
Introducing the corrections described above, the BEM model was implemented following the algorithm that sees each blade discretized in
nodes for which loads are calculated. Normal and tangential loads are defined per unit length of blades:
where
and
are the normal and tangential force coefficients that depend on the lift and drag coefficients identified for the airfoil in the function of the angle of attack and the flow angle.
is the relative wind speed and c is the chord. Finally, the thrust and torque are calculated as the integral of the normal and tangential loads over the length of the
blades,
:
2.2.2. Control System
The control system selected for the NREL5MW wind turbine is a conventional one, characterized by a variable-speed, variable pitch-to-feather configuration, and composed of two independent control systems:
Controller of the generator torque, which has the aim of maximizing the power production below the rated wind speed.
A full-span rotor-collective blade-pitch controller, designed to adjust the generator speed above the rated wind speed.
Specifically, the rated (or nominal) point is the reference operational point in which the power conversion is maximized toward which the control system tends to.
Table 3 summarizes the main characteristics of the control system.
2.2.3. Generator-Torque Controller
The control law of the generator-torque has three core regions separated by two transition regions. It is important to remember that the torque caused by the wind tries to accelerate the turbine, while the generator torque, which converts mechanical energy into electrical one, acts as a braking load; an equilibrium must be reached between them in order to have regular motions and outputs.
Figure 2 shows the overall control law, which is herein described in detail.
Region n.1 is characterized by no power conversion since the momentum cause by wind is used to accelerate the rotor.
In region n.2, the optimization of the power extraction is achieved exploiting the adjustment of the control system to maintain the tip-speed ratio constant. Therefore, the torque of the generator and
, which is a proportionality coefficient, are defined as:
and are influenced by the chosen aerodynamic model [
26,
27,
28]. The maximum rotor power for each wind speed fits a ‘power’ law (intended in a mathematical way): if the power extraction exerted by the generator is governed to follow this maximum power curve, then the wind turbine would work at its maximum efficiency, given the wind. Wind speeds are normalized with respect to the available wind power and by substituting the rotor speed Ω with the tip-speed ratio, then the obtained power coefficient curve
Cp(
λ) is unique:
Working at the maximum power coefficient Cp means working with constant tip-speed ratio λ.
In region n.3, the nominal operation point was contained, and characterized by a torque of 43,100 Nm at 1173.7 rpm, with a rated electric power of 5 MW and 94.4% of generator efficiency. Here, the control law for speeds higher than 1173.7 rpm can also be found, usually set to keep a constant power of the generator by forcing a torque inversely proportional to the generator velocity. Then, the blade-pitch controller operates just in this region, where the generator surpasses its own nominal speed, since the blade pitch lower limit is 0 degrees.
Region represents the linear evolution from region 1 to region 2, starting from the cut-in speed of the generator at 670 rpm (6.9 rpm for the rotor) to 871 rpm (i.e., 130% of that value).
Region 2 draws the transition between regions 2 and 3, which was also linear. This is needed to bind noise emissions at the nominal power. In this region, the control on the torque follows the slope of an induction machine, with a generator-slip percentage of 10%. The edges of the region are represented by the optimum power extraction curve of the second region and the constant power curve of the third region, crossed at 99% of the rated generator speed (i.e., 1162 rpm).
Finally, this control system does not consider any control loop for the high-speed shaft rotation, since the damping of the inner drivetrain is assumed to be enough to filter all the torsional vibrations.
2.3. Moorings
Mooring systems for floating offshore platforms are planned to increase the overall rotational stability of the platform and to avoid drifts under the actions of wave, wind, and current [
29]. The omni-directional mooring solution proposed in this paper was made of six pre-tensioned lines starting from each vertex of the floater. Each line was composed of three parts: starting from the anchor fixed on the seabed, the segments are metal chain, polyester rope, and metal chain, with the rope being by far the longest part. This implementation provides good stiffness and light lines at the same time: the stiffness is only given by the fiber rope part and the weight of a single line is assumed constant, equal to that of a 100 m long chain.
Table 4 summarizes the most important characteristics of the mooring system.
Since a catenary mooring line is a complex system and a complete model would be significantly time-consuming, the following assumptions were made about moorings [
28,
30]:
the model of the catenary system is quasi-static, therefore dynamic actions are neglected, and the only effect of mass is weight, since inertia is neglected. Additionally, all kinds of damping sources are neglected (e.g., frictions at connection points, at ropes inner, and also with seabed and hydrodynamic resistances);
the ropes of polyester have an elastic behavior only; and
during the computation, all the mooring lines are assumed to be rectilinear in every instant. It is justified by considering that the rope part of the line is predominant in length and kept in tension by the two chain sections, so that the catenary curves formed by the three segments are close to linearity, since the angle between the lines and seabed is very low. In typical floater motions, the lines do not vary significantly in their configuration due to their large length.
Figure 3 shows the 200 m depth arrangement mooring with the rectilinear mooring. This assumption allows us to approximate the whole mooring line as a single spring, fixed at the seabed to the anchor and connected at its top to the moving floater, as shown in
Figure 4.
Dynamics Modeling
In order to approximate mooring lines as springs, the instantaneous length and the relative distance between the anchor and the fairlead (fixed points where the lines are attached to the floater) are needed for each polyester rope.
The incoming waves induce motions on the hull structure, computed in the hydrodynamic part of the model with respect to the local structure axes frame of reference, and subsequently the connection points also move in the space, causing a change in the length of the lines and also in the mooring tension.
In
Figure 5, the Sea Flower floater moves in the space through the generic translation vector
and subsequently the center of mass
, which coincides with the fixed reference axis (FRA), becomes
. As the picture shows, the grey hexagonal surface is the bottom surface of the floater, on which
, the connection point, and
, the z-axis projection of the mass center, stay. Additionally, the entire platform rotates with the generic rotation vector
This means that the new connection point (
) position results from both a translation of the mass center
and a rotation of the whole structure around
. As a result, the length of the mooring line, which is originally
, becomes
.
The contribution of the rigid translation to the connection point
displacement is equal to the translation of the mass center:
Multiplying the matrix obtained by left-hand rotations around x, y, z with
(i.e., the position vector of the connection point with respect to the LSA reference frame), the rotation contribution can be determined:
After the movement, the position vector of the point of connection is given by the sum of the translation and the rotation:
Now that position vector
is known, the moments and the forces applied on the structure by the mooring can be obtained.
indicates the tension at the connection point, and it lies on the line linking anchor point
and connection point
. The following piecewise-defined function describes the magnitude of
:
where
represents the line stiffness;
is its unstretched length at rest; and
is the instantaneous stretched length of the line. The last mathematical definition considers that the mooring line exerts elastic reactions when it is stretched from its starting length. Therefore, the vector of the tension is:
where the fraction represents the unit vector defining the direction from
to
in the FRA reference.
The force triads previously computed produce moments on the structure, since they have an arm defined by the position vector
of the point of connection
on the rotated platform surface in the LSA reference frame. These moments are defined as follows:
Finally, the contributions of generalized forces caused by all six mooring lines are summed, and their sign was changed in order to obtain the overall reaction acting on the floater by the moorings.
2.4. Gyroscopic Harvester
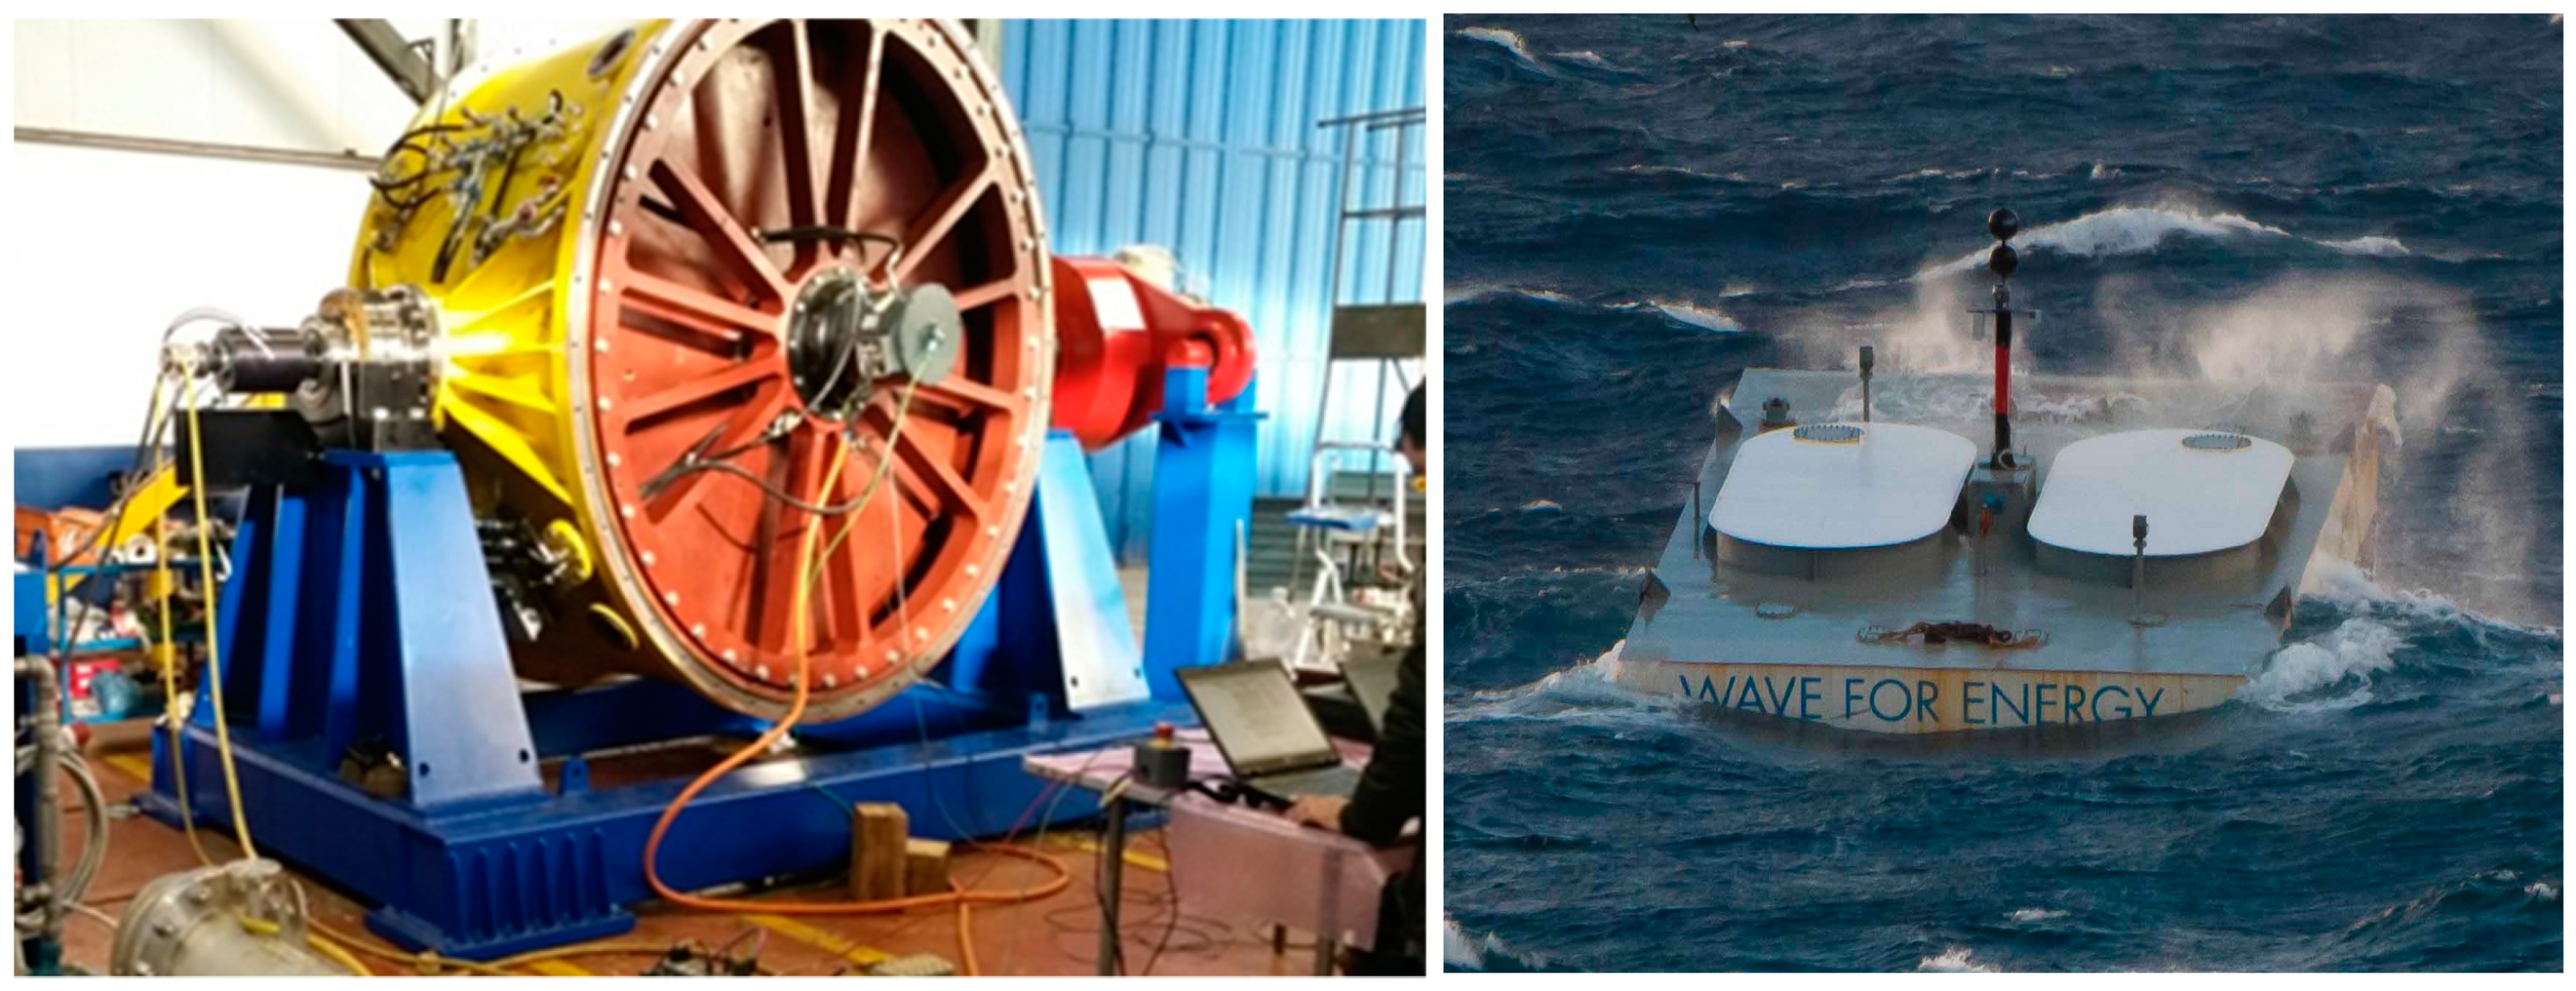
Finally, the gyroscopic harvester was modeled. This was based on the inertial sea wave energy converter (ISWEC) [
31,
32], which is a gyroscopic device allowing the conversion of wave power into electrical power. Its main system is a floating body slack moored to the seabed. As the waves tilt the buoy with a rocking motion, this move is transmitted to the gyroscopic system placed inside the buoy. This system is composed of a spinning flywheel, and carried on a platform that allows the rotation δ and then, when the device works, the gyroscopic effects caused by the flywheel spinning velocity
and the rocking velocity
induced by the waves, result in torque along the
coordinate. This torque can be finally used to drive an electrical generator, also referred as, power take off (PTO) [
33], so that the extraction of energy from the waves is possible.
Figure 6 shows the ISWEC working principle.
2.4.1. Dynamic Model
It is possible to obtain the equations describing the dynamics of the PTO ε-axis from the time-derivation of the flywheel angular momentum. To reduce the complexity of the study, it was simplified as a planar problem, with the work plane defined by the vertical gravity axis and the direction of the incoming wave. This hypothesis is possible since the system, thanks to its mooring configuration, is self-orientating. The dynamical equilibrium of the PTO axis and the torque on the motor driving the flywheel can be written as:
For our purposes, the gyroscope inertial torque equation related to the pitching axis is also needed:
where
Jg is the inertia of the gyroscope around its spinning axis u, and
Ig is the inertia around the other two axes.
In order to evaluate the time evolution of the system, these equations can be implemented numerically, but the aim of designing the device linearization is needed [
34]. It is possible to build a device in which
, and assuming that the gyroscope speed is constant and the steady condition
, the previous equations can be simplified. The PTO behaves as a spring-damper group, with damping factor
and stiffness
. The linearized torques on the float, on the PTO, and on the gyro axis are as follows:
2.4.2. Extractable Power
As [
35] demonstrates, the maximum extractable power is reached when
, the wave and the natural frequency, respectively (i.e., the frequency in resonating conditions). Therefore, with a PTO controlled with the aim of making the device resonate with the wave or a wave resonating mechanical system, the following expression can be obtained:
where
is the average power absorbed from the system through the damper;
is the moment of inertia of the flywheel around its spinning axis ;
is the constant angular velocity of the flywheel around axis (therefore is the angular momentum of the gyro);
is the wave frequency;
is the angle of pitching; and
is the damping factor.
Then, the damping coefficient
can be defined also as
where
is the angle of the PTO oscillation.
Substituting
in the
definition, the following equation is obtained:
In conclusion, following a linear approach, with the aim of increasing the extracted power of a wave resonating ISWEC, we should increase:
is the angular momentum of the gyroscope;
is the pitching amplitude of the floater; and
is the amplitude of the oscillation on the PTO shaft
In addition, the device can produce more power if the incoming waves have a shorter period.
2.4.3. The Gyro Unit
In this work, a predesigned gyro unit was used; this was also replicated in order to understand the effects on the floating structure of an equivalent bigger gyroscopic system and PTO [
36]. Additionally, an increase in the number of units increased the damping effect on the floater. Once the correct angular momentum is identified, a proper design of the gyro can be performed; however, this was out of the scope of the present paper.
The chosen gyro unit is the one carried by the ISWEC 100 at the Pantelleria site with a rated PTO size of 50 kW.
Table 5 and
Figure 7 show the main design parameters and the aspect of the device, respectively. The number of gyros varied logarithmically as the power of 2 and the maximum number of gyro units used in this work was 128, for a total power of 6.4 MW, comparable with the power of the wind turbine. Moreover, it corresponded to an additional mass of 1280 tons, which was just the 8.3% of the hull mass, and then did not significantly affect the whole platform physical balance. It could seem unfeasible to put more than one hundred gyroscope systems on the Sea Flower, but a gyro is relatively small: the additional weight in the case of 128 gyros is 1500 tons; compared to the weight of more 15,000 tons of the Sea Flower hull mass is barely 10% of the original one. The number of gyroscopes to be installed is just an approximation, since a further investigation of this solution could lead to the installation of less gyroscope systems, but with the equivalent mass and inertia comparable to one with 128 gyros.
2.5. Case Study Site
In order to produce a plausible analysis, a specific site was chosen: 61.37°N, 0.67°W, in the North Sea near the Shetland Islands, an archipelago belonging to Scotland. The bathymetry at the location is 210 m. The wave conditions and mean wind speed occurrences make this site very attractive from both wind turbine and wave energy converter points of view.
The top 90% of all the occurrences of waves and wind in that site is summarized in
Figure 8.
On the left, the 72 sea states considered in our simulations are shown, while on the right, the cross-correlation between the significant wave height of the chosen sea state and the correspondent mean wind speed is given. The most frequent wave conditions in the chosen site are described by Hs equal to 1.25 m and Tp equal to 7.5 s. The five representative mean wind speeds are summarized in
Table 6. These speeds are logarithmically spaced between the null and the maximum value, which was 25.84 m/s, which, according to the correlation of
Figure 8 (right) between V0 and Hs, corresponds to the maximum simulated value of the significant wave height of the sea state (i.e., 6.25 m).
3. Results
Figure 9,
Figure 10 and
Figure 11 show the time series for the most common wave with Hs = 1.25 m, Tp = 7.5 s, and a wind speed of 6.17 m/s. The model was then used in a parametric run to assess all the possible weather conditions. Since the energy carried by the wind is proportional to the cube of its speed, the study of the wind resource is fundamental to estimate the energy production of a wind turbine. Wind is characterized by a strong changeability, both on a local scale, caused by sudden variations, three-dimensional gradients, and features of the environment. The wind profile is described by the Weibull distribution since it proved the well fit of the historical distribution of wind speed [
37].
The first positive effect provided by the gyroscope system installation on the offshore wind platform is the stabilization of the floater itself.
Figure 12 highlights the reduction of the Sea Flower pitch angle as the number of gyros installed increases. The most common wave conditions with wind speed equal to roughly 13 m/s also showed the maximum pitch abatement with a reduction of −37%, with respect to the configuration without gyroscopes.
However, an accurate analysis of
Figure 12 shows that the wind speed making the platform pitch the most was 13 m/s, due to the high loads unloaded from the wind turbine. First of all, the wind turbine blade pitch angle was not influenced by the number of gyros, but it increased as the mean wind speed increased, reaching a maximum value of roughly 25 degrees. This can be understood by looking at the wind turbine generator speed with respect to the mean wind speed. The last wind condition makes the generator work at a mean speed far higher than 1170 rpm, which is its rated speed, then the generator acts on the wind turbine controller, increasing the blade pitch of the turbine and decreasing the “useful section” that the wind turbine shows to the incoming wind. The thrust acting on the wind turbine rotor, in the last wind condition, is far lower than that of the previous wind mean speed. This phenomenon finally explains why, in
Figure 12, the highest Sea Flower pitch motion curve was the purple one, with the mean wind speed equal to 13 m/s, instead of the curve with the maximum mean wind speed condition.
Figure 13 shows the percentage variation of the Sea Flower pitch, with respect to the configuration without gyroscopes installed, for each mean wind speed. Once more, the behavior at 13 m/s obtained the most relevant reduction.
Another advantage of the gyroscope integration is the reduction of the acceleration detected at the nacelle of the wind turbine, which could reach values of −11% when the mean wind speed was roughly 13 m/s.
Figure 14 shows the evolution of the acceleration as the number of installed gyros increased, and also distinguished the different wind speeds. This refers to the most common sea state, with Hs equal to 1.25 m and Tp equal to 7.5 s.
The installation of the gyroscope PTO on the offshore wind turbine showed a third advantage: a significant increase in the electric power produced by the whole platform.
Table 7 and
Figure 15 show this positive effect, describing the percentage variation of the total electric power produced by the entire offshore energy platform, thus summing both the wind turbine and the gyroscope produced powers, with respect to the configuration without WEC. It is noticeable that when the mean wind speed was lower, and consequently the wind turbine power was lower, the contribution of the gyroscope system to the overall power production was significant, as it can lead to an increase of roughly 155% with respect to the no-gyro configuration. Nevertheless, as the mean wind speed increased, this influence decreased because the wind turbine power output increased significantly, reaching a value of an order of magnitude higher than the one of the gyroscopes produced power. Furthermore, the curve related to the 0 m/s mean wind speed was not plotted, and the data not reported in
Table 7, since it would provide infinite values as a consequence of the null produced power in calm wind and without installed gyroscopes.
It is of interest to discuss the scatter maps of the platform pitch motion, the nacelle acceleration, and the power produced by the wind turbine, the gyroscope PTO, and the overall system. Since the mean wind speeds considered are those given in
Table 6, for each sea state, the corresponding mean wind speed was obtained through the correlation shown in
Figure 8, right; then a linear interpolation was performed among the five wind speeds available results.
Figure 16 shows the standard deviation of the offshore platform pitch motion for each simulated sea state;
Figure 17 depicts the pitch motion percentage variation when 128 gyros were installed with respect to the no-gyro configuration. It is noticeable that, in
Figure 16, the highest values of pitch were related to medium values of Hs, due to the fact that they were coupled to medium values of mean wind speed, around 13 m/s, which were the most challenging for platform stability, as shown in
Figure 13. Moreover,
Figure 17 shows that even though in a number of sea states the positive effect is roughly null, when Hs equal to 1.25 m, the sea flower pitch can be reduced by 20%; in particular, it can reach a peak reduction of the pitch motion of −37% in the most favorable conditions.
Figure 18 and
Figure 19 show the nacelle acceleration and the variation between the 128-gyro configuration and the one without gyroscopes. This acceleration as quite low, with a peak of 0.6 m/s
2 reached when the significant wave height was 6.25 m. However,
Figure 19 shows that the WEC integration allowed an important percentage reduction of the acceleration detected at the nacelle of the wind turbine, with a reduction greater than 15%. This means a significant reduction of the mechanical stress on the turbine itself, which could also provide an interesting improvement to the useful life of the wind turbine.
Figure 20 shows the total produced power of the platform with respect to Hs and Tp, where it reached a maximum of roughly 4500 kW, when Hs equal to 5.75 m and Tp equal to 10.5 s. As logically expected, the higher the wave height, and subsequently the mean wind speed, the higher the overall electricity production.
Finally,
Figure 21 shows the overall power production variation using 128 gyroscopes with respect to the no-gyro configuration. It is possible to notice that in every sea state, a positive effect was given by the presence of the gyroscopes, from a minimum of roughly +1% to a maximum of +10%. On a yearly basis, the improvement of the whole platform productivity as significant, since it went from 26.11 GWh/year of electricity production to a maximum of 27.28 GWh/year, corresponding to an increase of 4.28%.
4. Conclusions
Stated that numerical models are fundamental for the future development of new energy harvesting technologies, this study aimed at being a further step into marine offshore technology growth and future application, since electrical energy production will likely become a more challenging issue as time goes by and as the human population increases.
The main goal of this work was the development of reliable models for FOWTs by integrating a gyroscope system. This objective was achieved, since the gyroscope integrated model showed interesting and consistent results for a wide range of wind and wave conditions.
Additionally, the results of the simulations with the addition of gyroscopes showed that three main useful effects can be provided by the WEC integration into Sea Flower:
stabilization of the floater, which could reach reductions in the hull pitch motions up to −37% in favorable conditions (i.e., the case study ones);
reduction of the acceleration at the turbine nacelle, in the order of −10% in the case study wave conditions; and
improved power production, coming from both the WEC electrical outcome and the slight increase of the wind turbine power. It can reach values of +120%, when the mean wind speed is low (and thus the wind turbine power is also low), around 3.4 m/s, and 128 gyros are installed, with respect to the configuration without gyroscopes.
This work aimed to provide a first assessment of the power produced by the Sea Flower platform equipped with gyroscopic systems. Further work can investigate the economic analysis of the proposed solution and the engineering studies to embed the gyros in the platform. Moreover, the hydrodynamic properties of the platform can be adjusted to optimize the combined energy production and the cost of energy. It would also be interesting to evaluate the system performance at other sites to assess the project replicability.

 ,
, 


