Cavitation Prediction of Ship Propeller Based on Temperature and Fluid Properties of Water


 ,
,
Abstract
1. Introduction
2. Literature Review
2.1. Numerical Method of Cavitation Phenomenon
2.2. Related Research
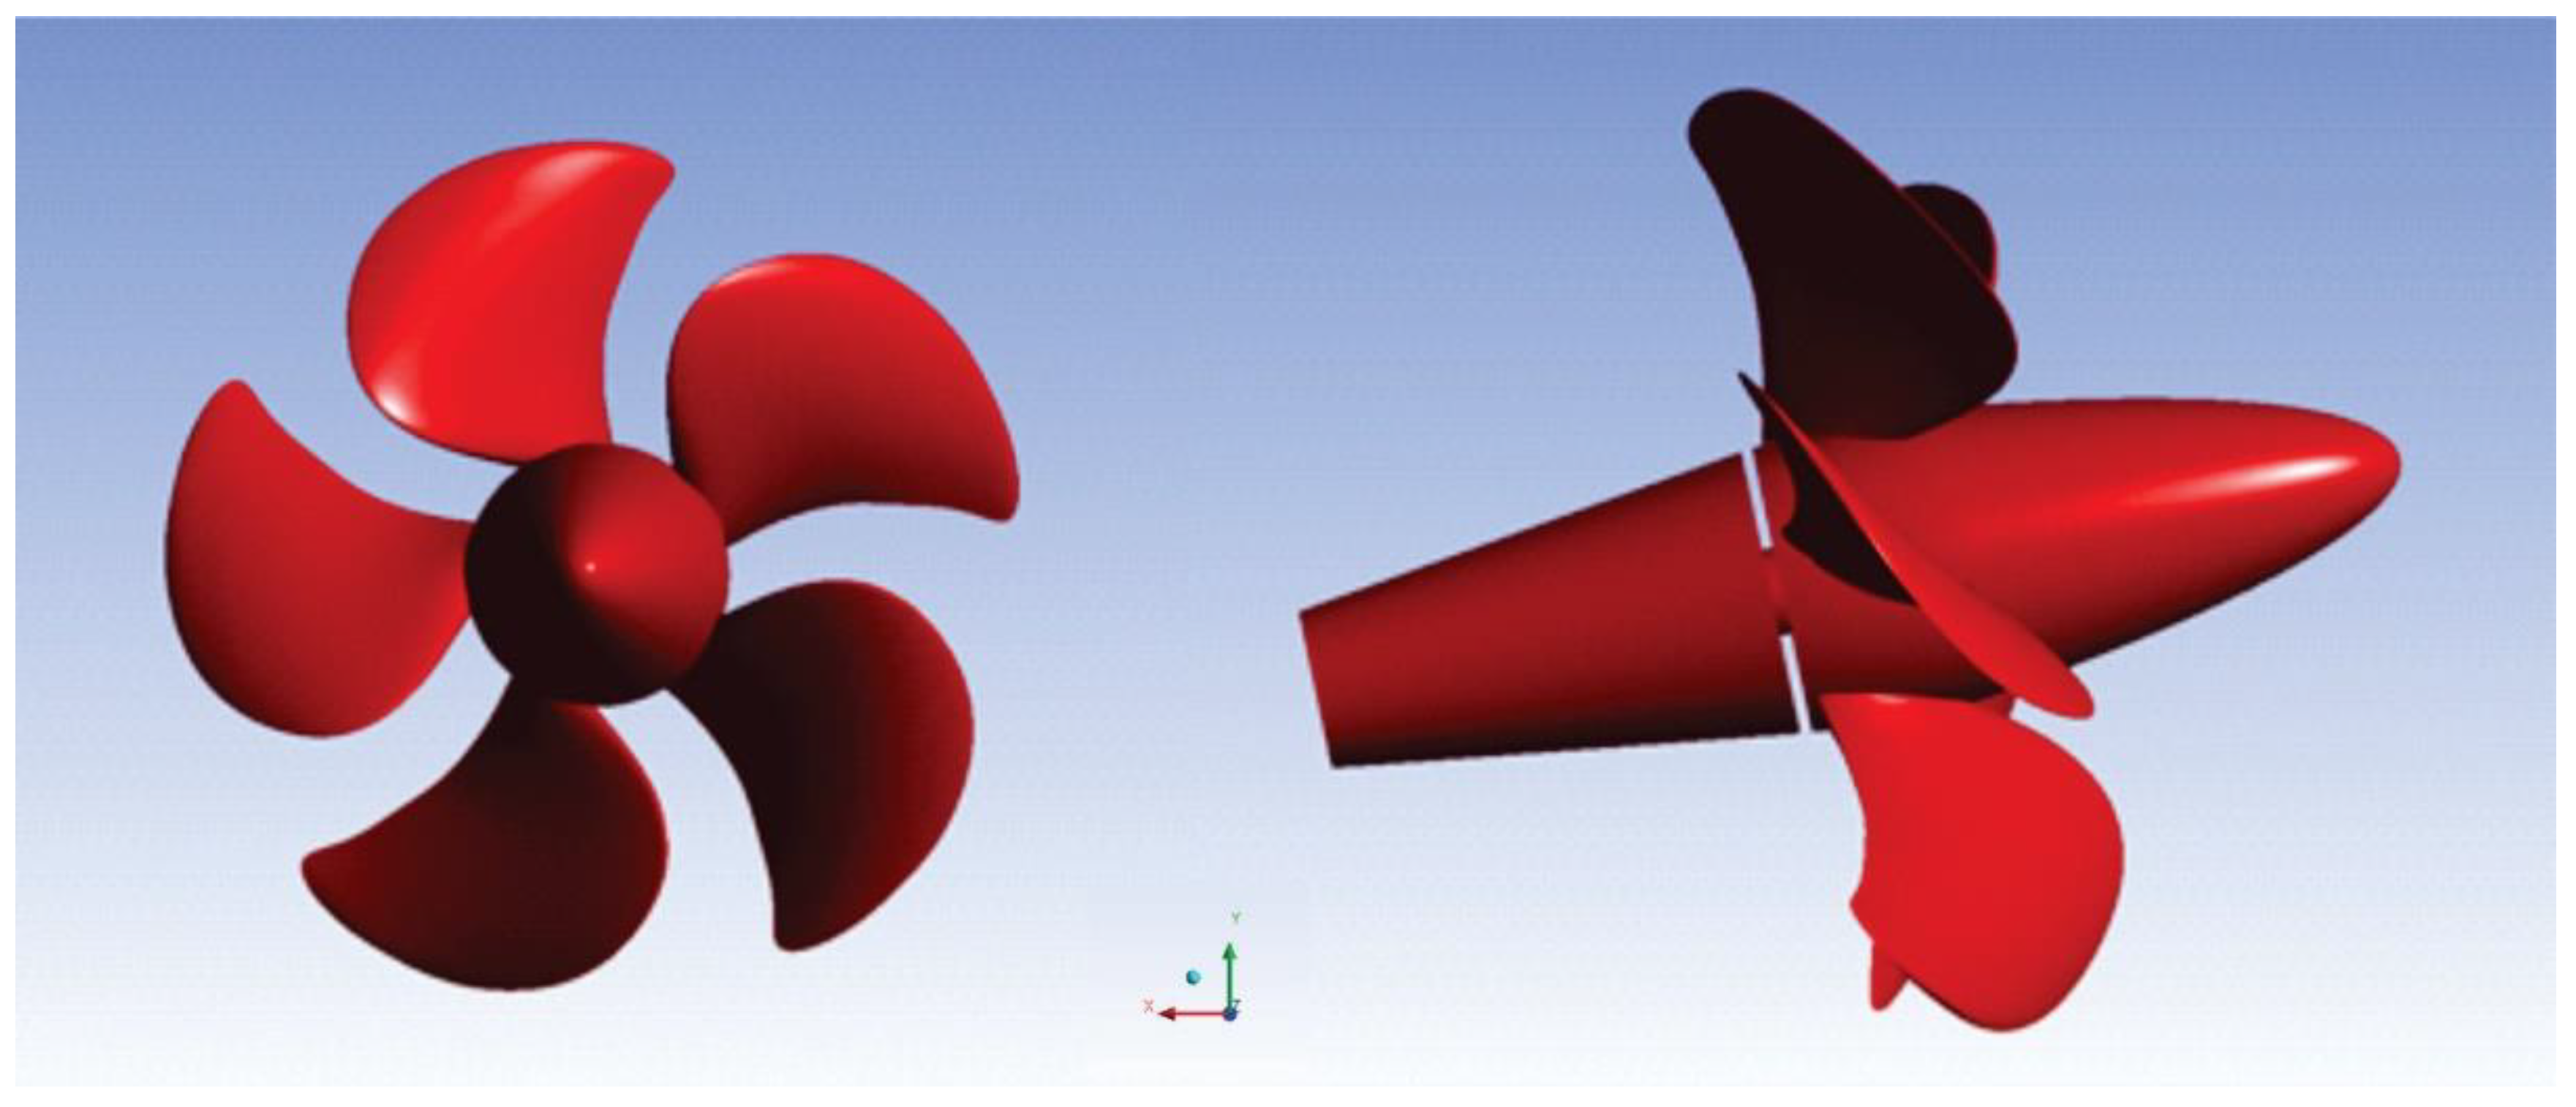
3. Propeller Model and Test Case
4. Theoretical Analysis and Numerical Methods
4.1. Performance Characteristics of Marine Propellers
4.2. Cavitation Calculations
4.3. Multi-Phase RANS Method
4.4. Mass Transfer Model
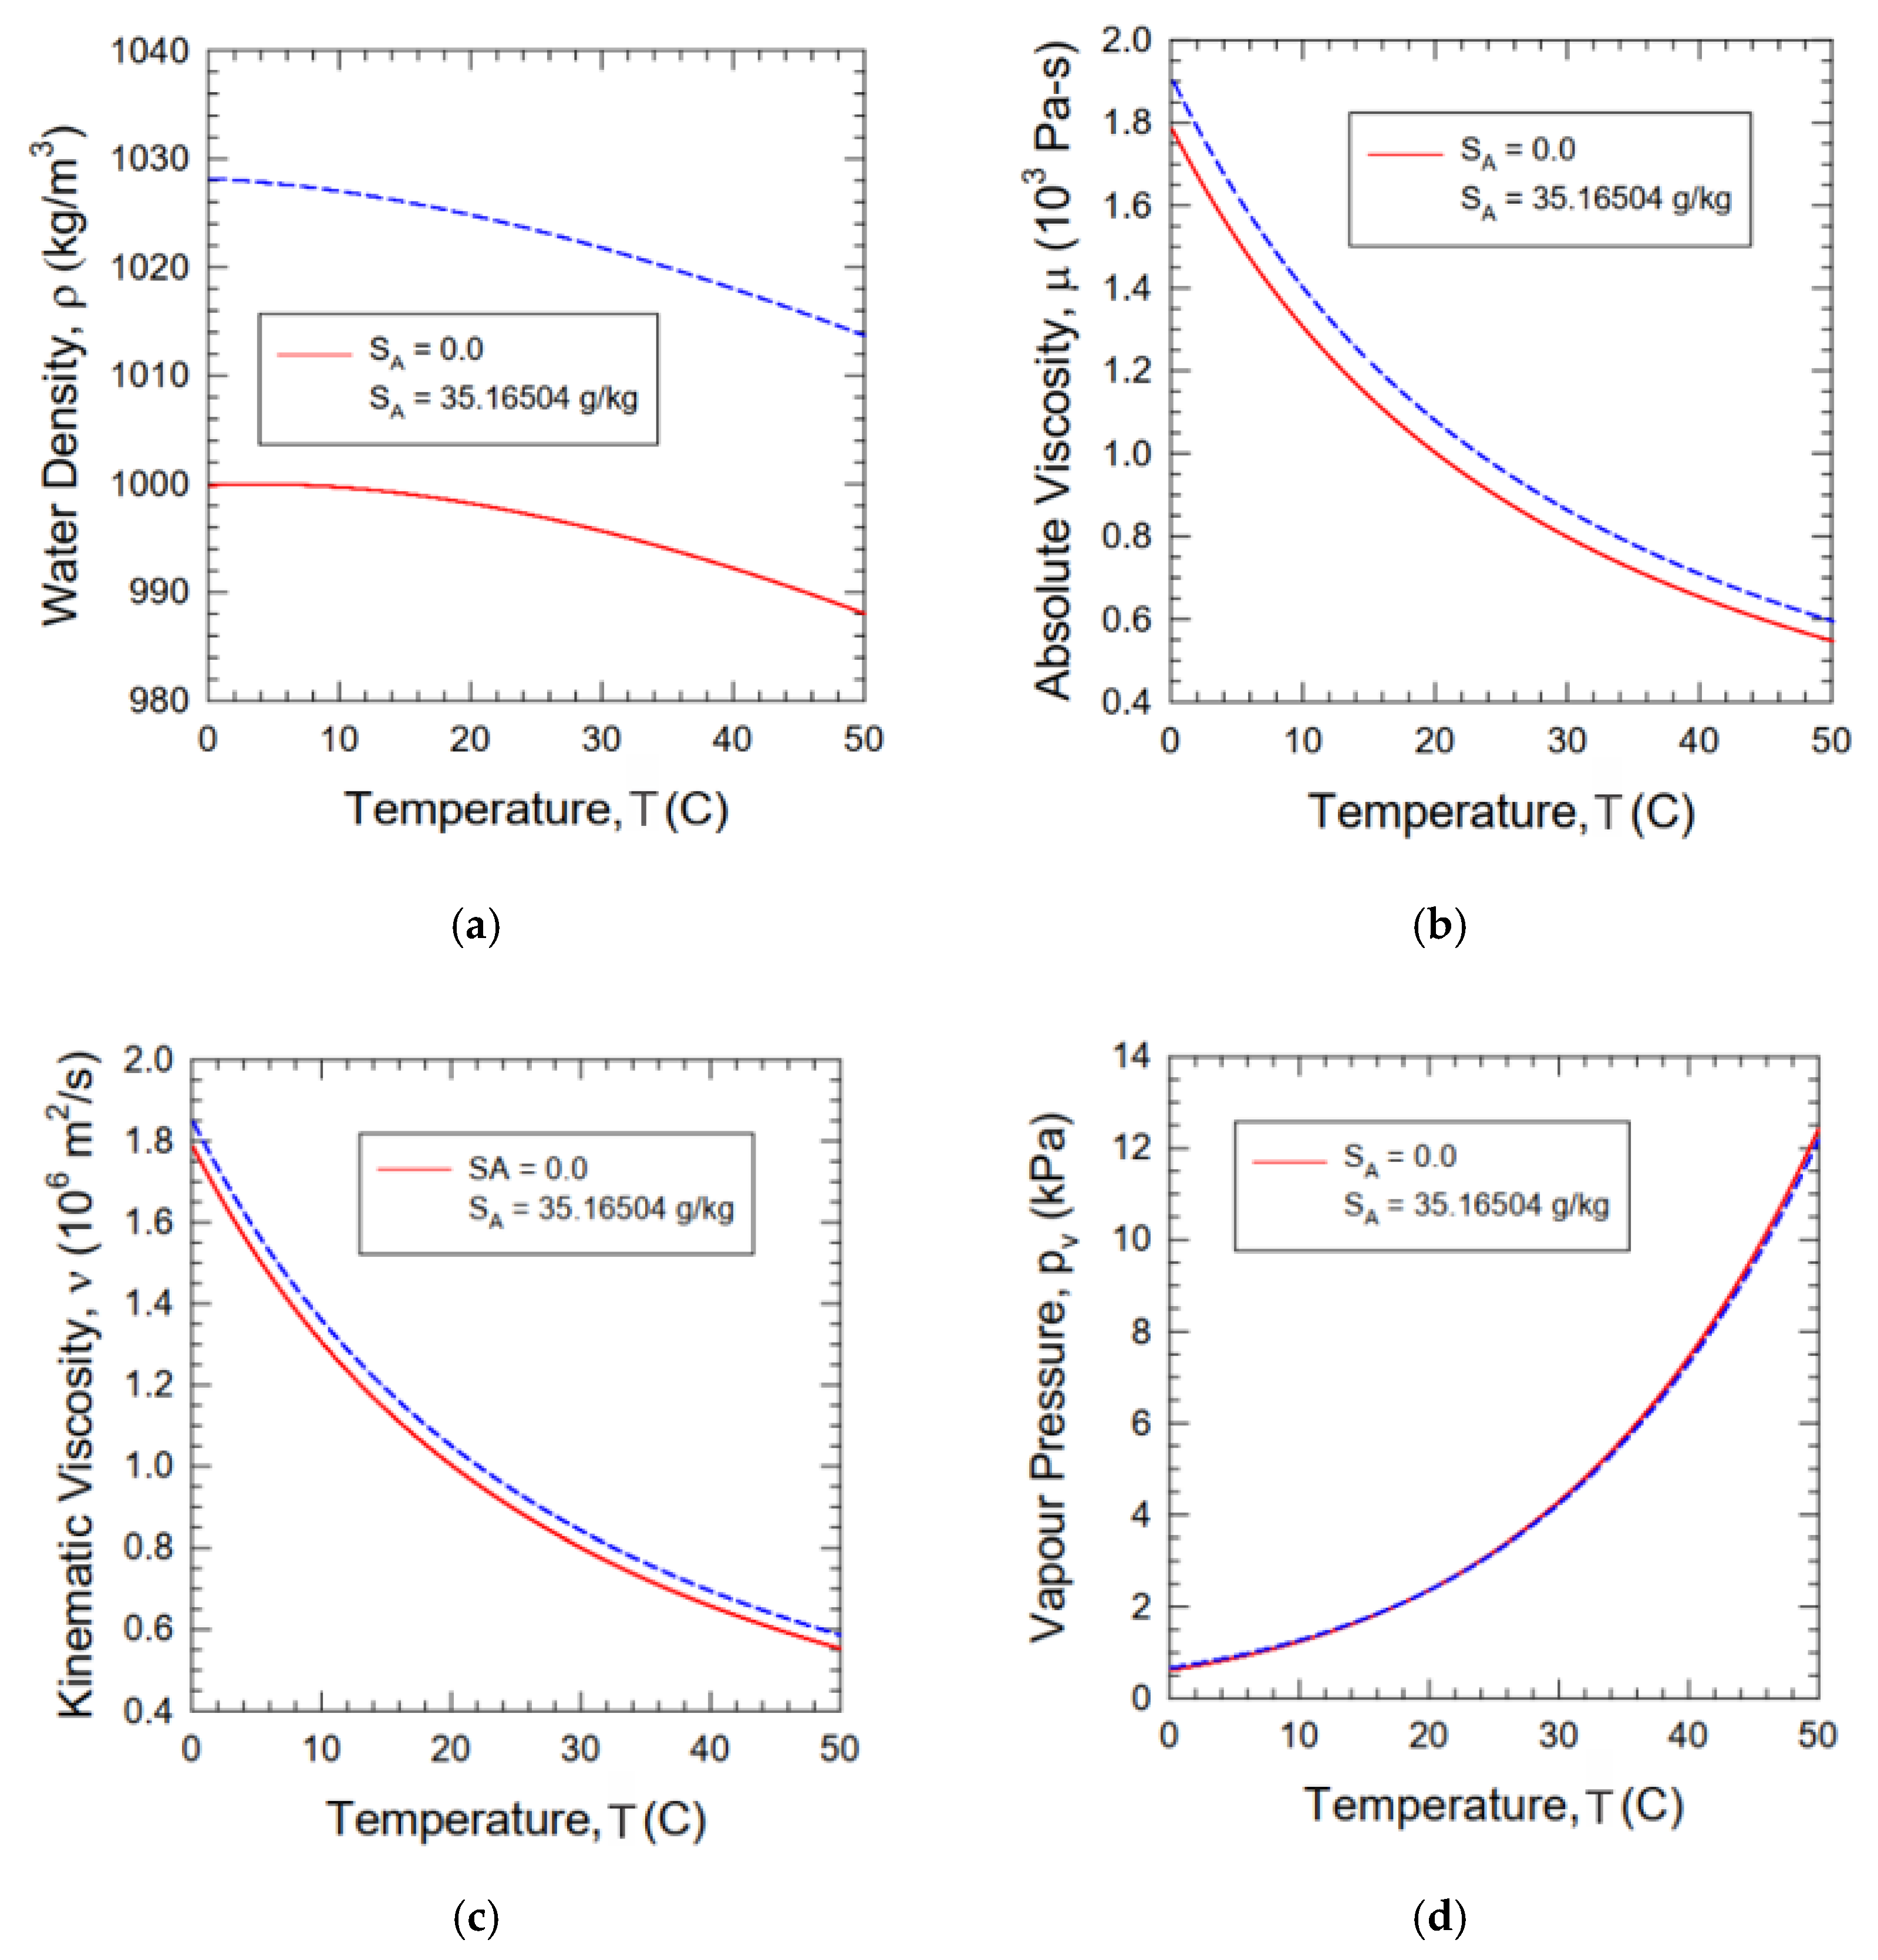
4.5. Thermodynamic Parameter
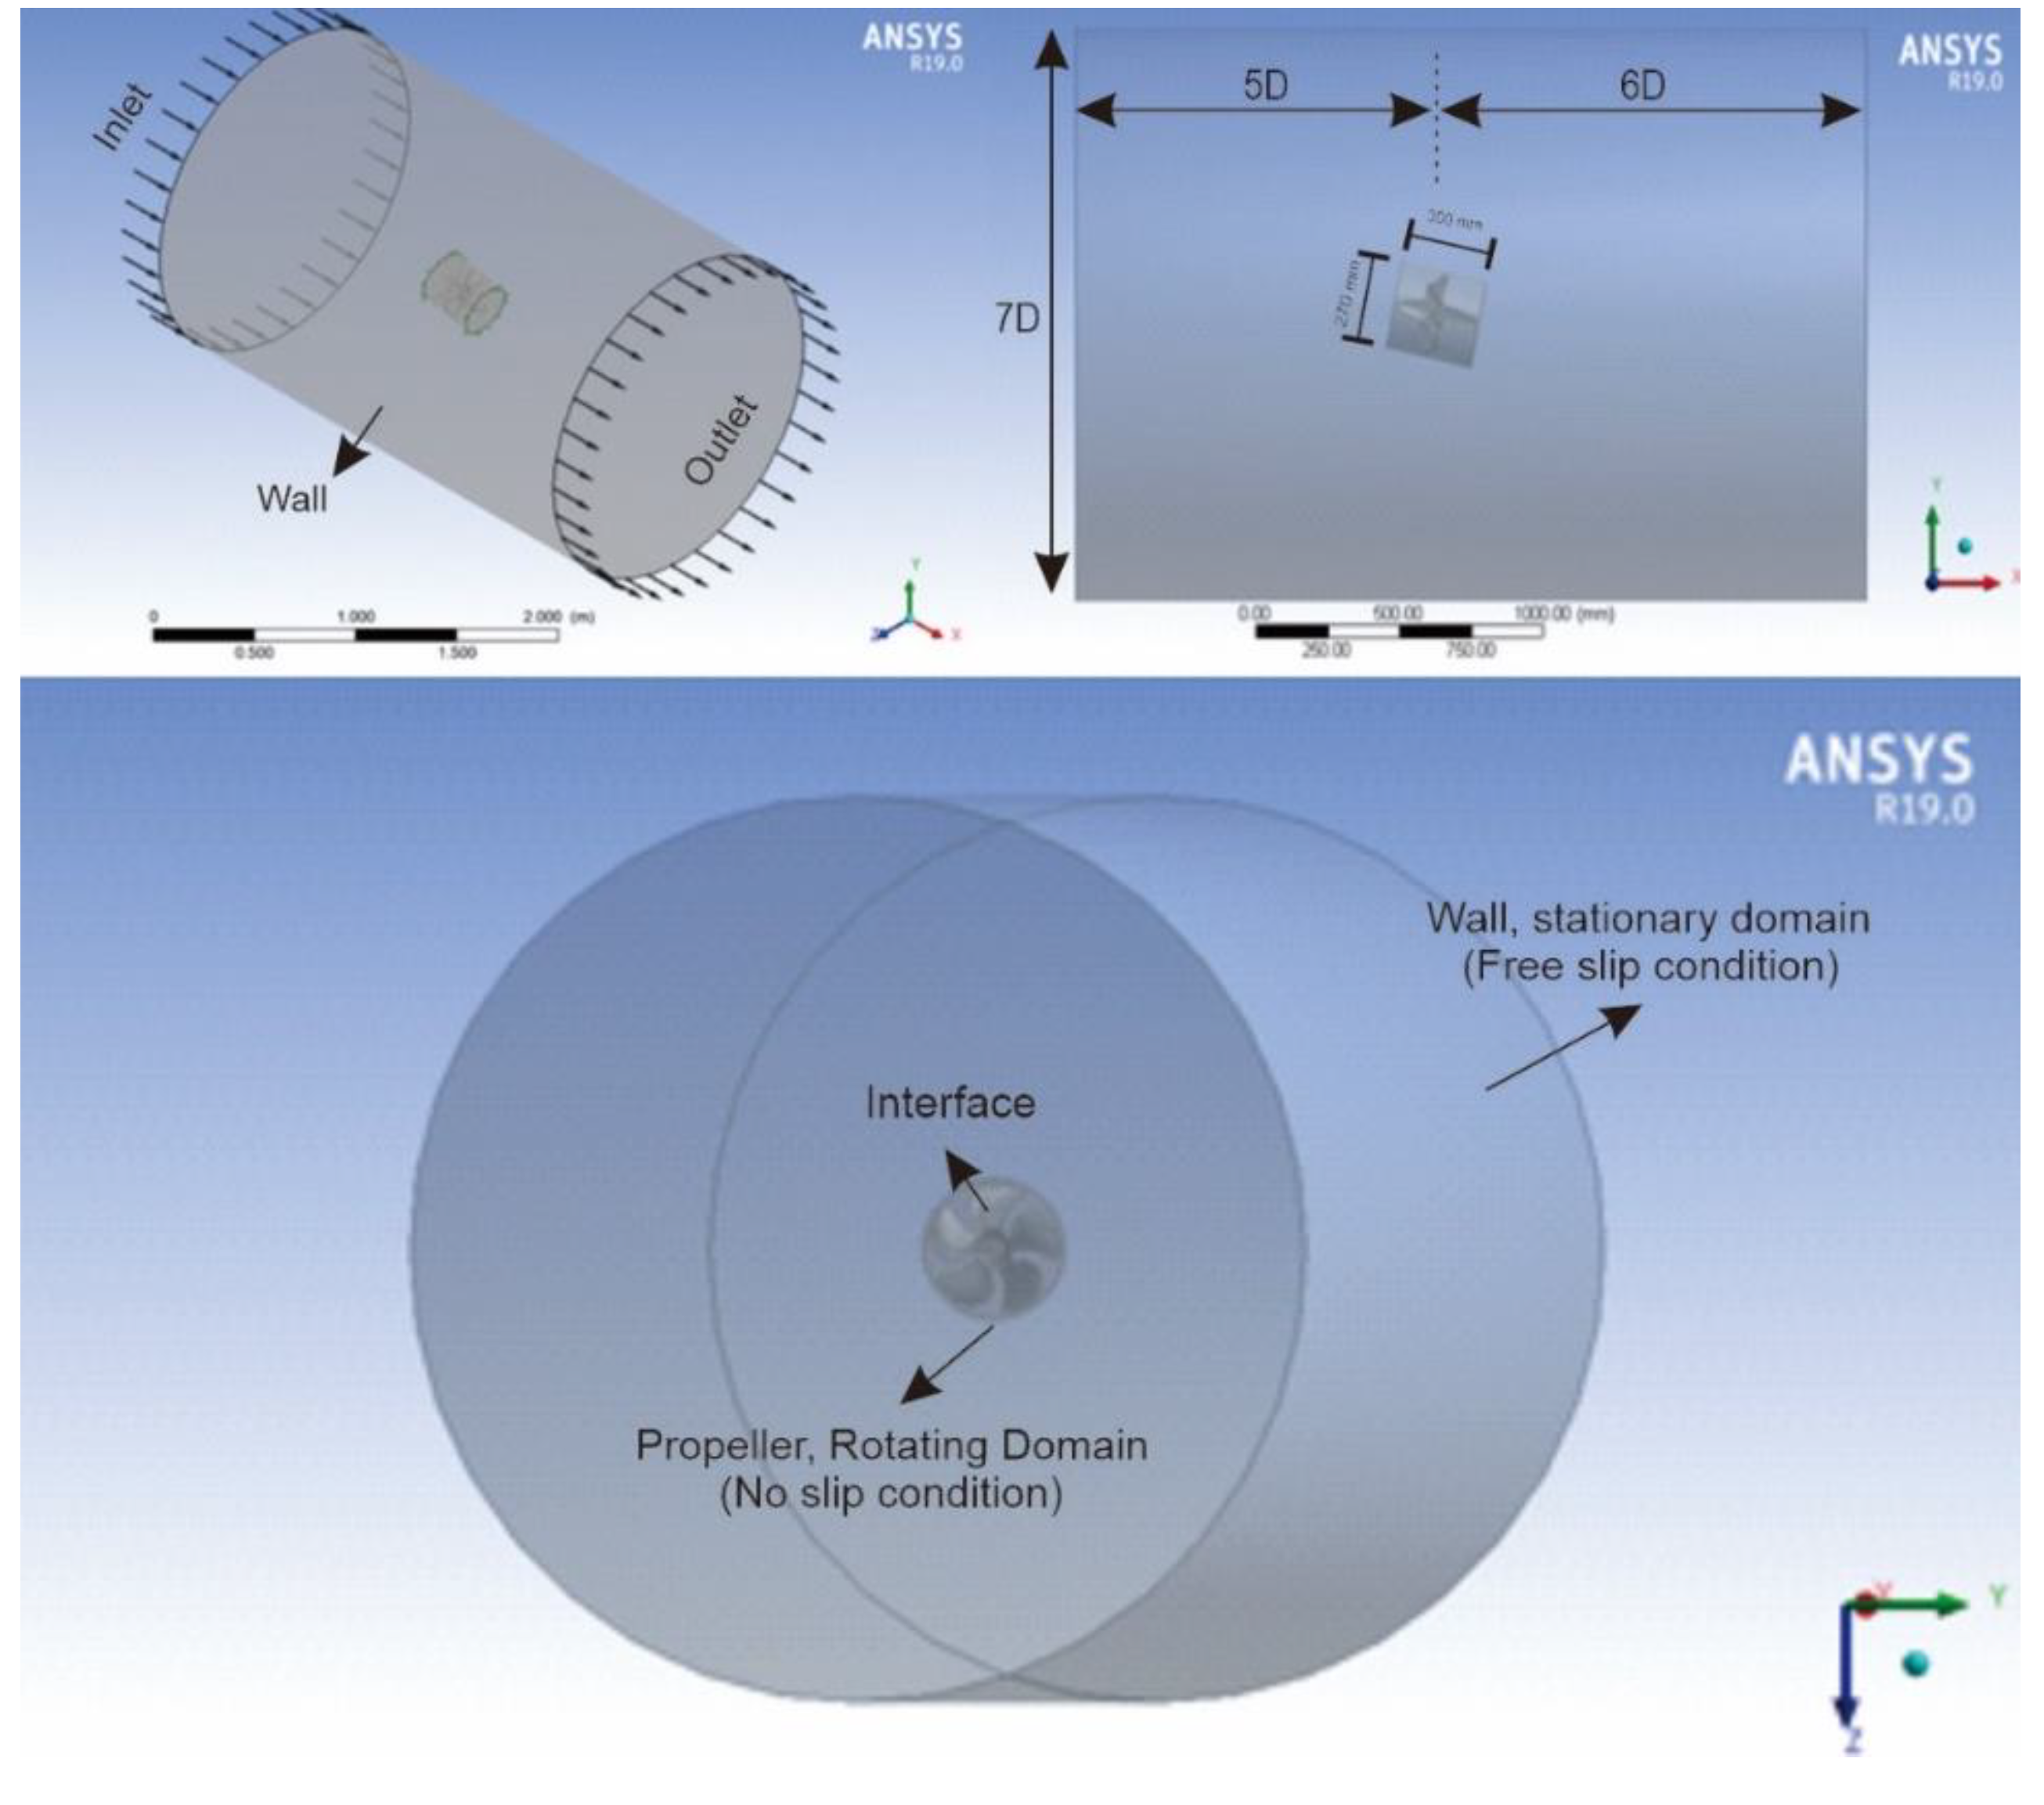
5. Numerical Modelling
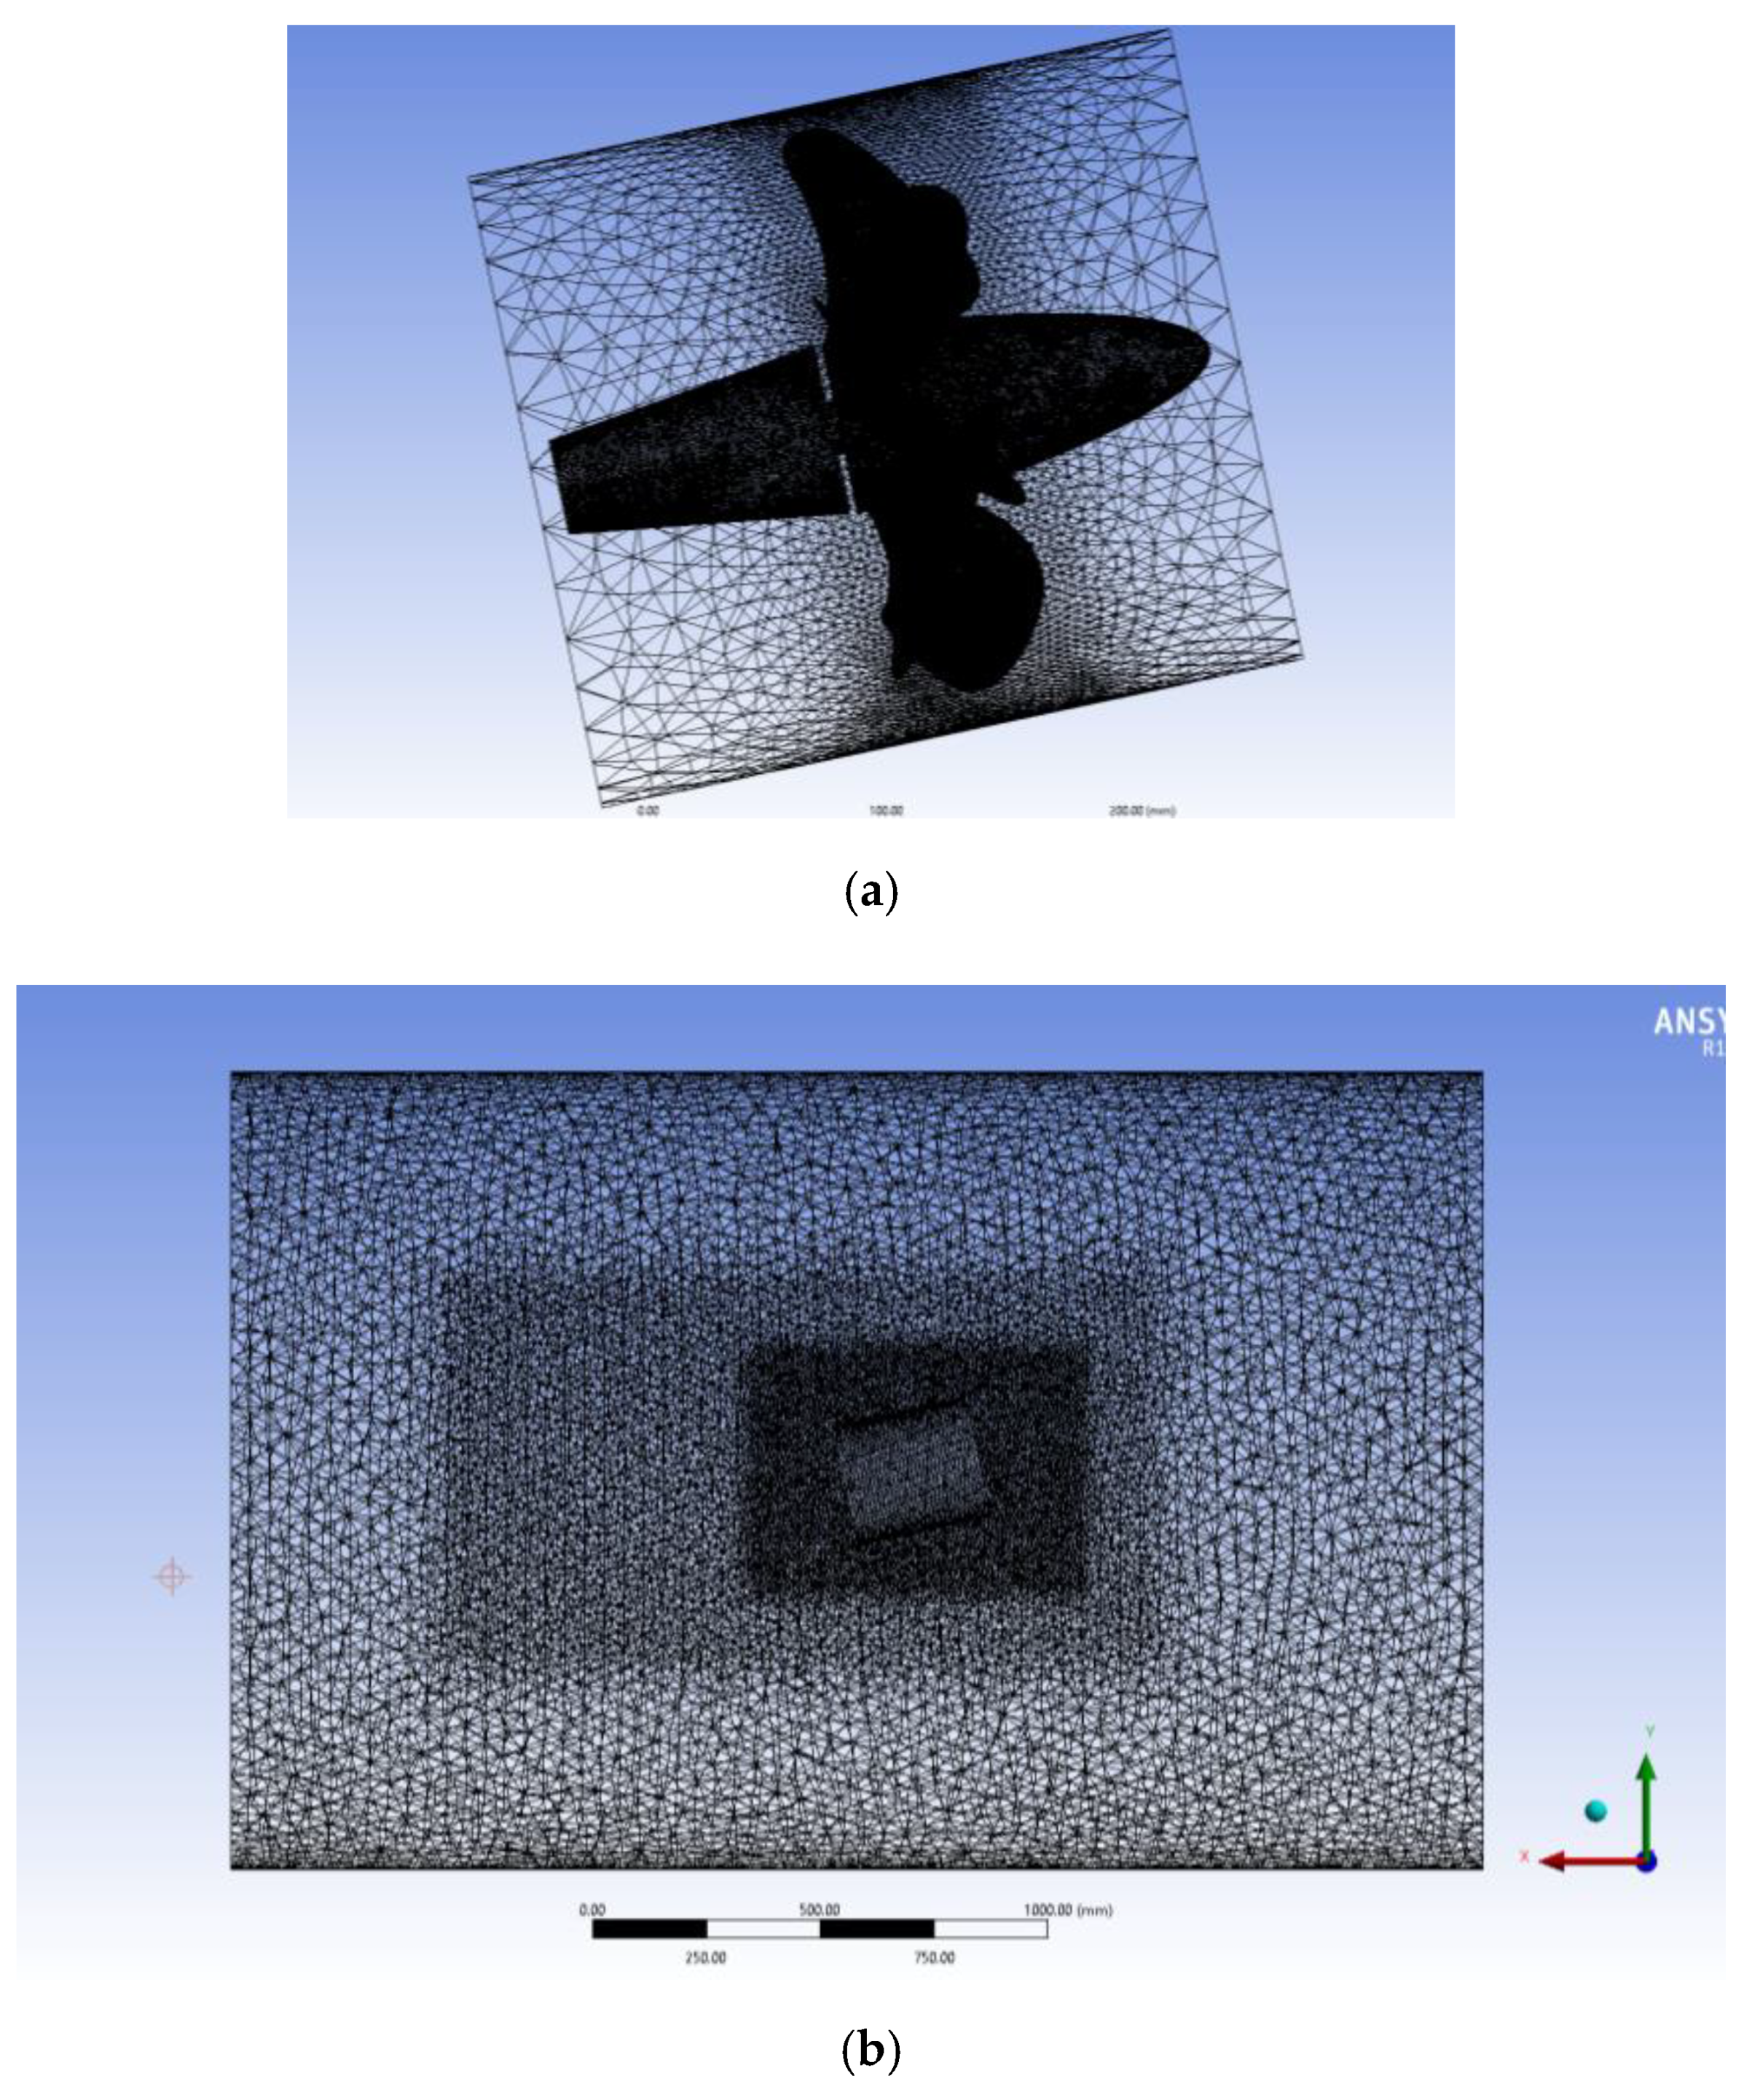
6. Meshing
7. Solution and Solver Setting
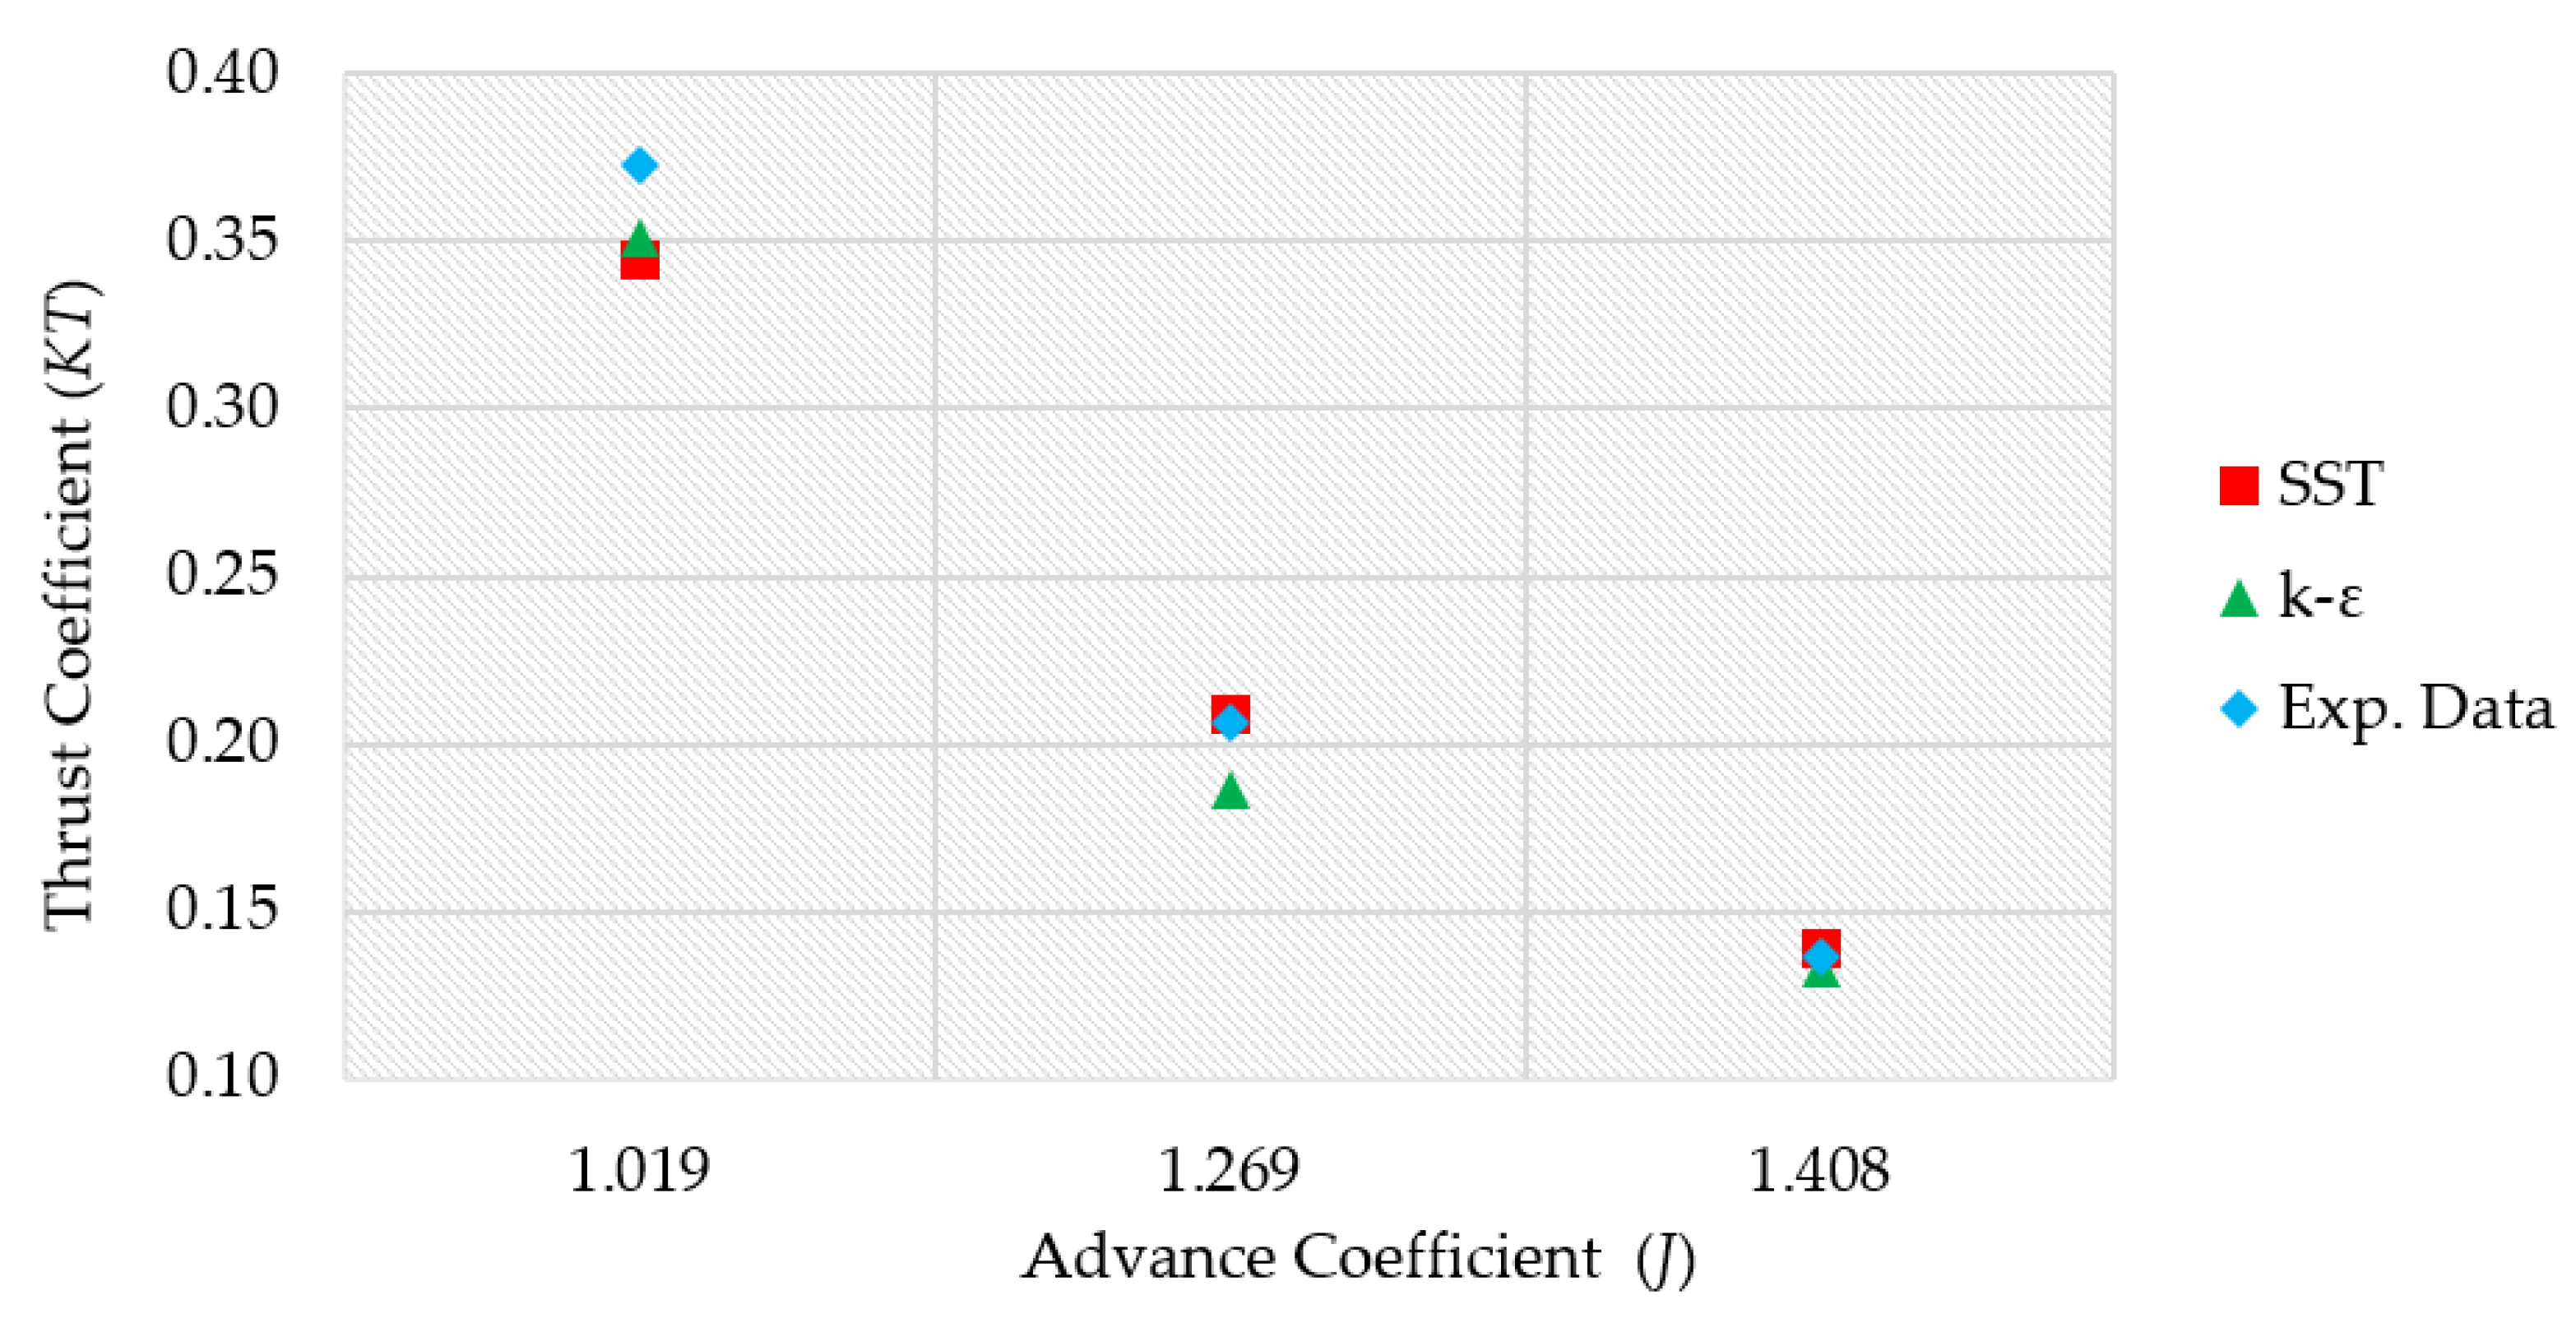
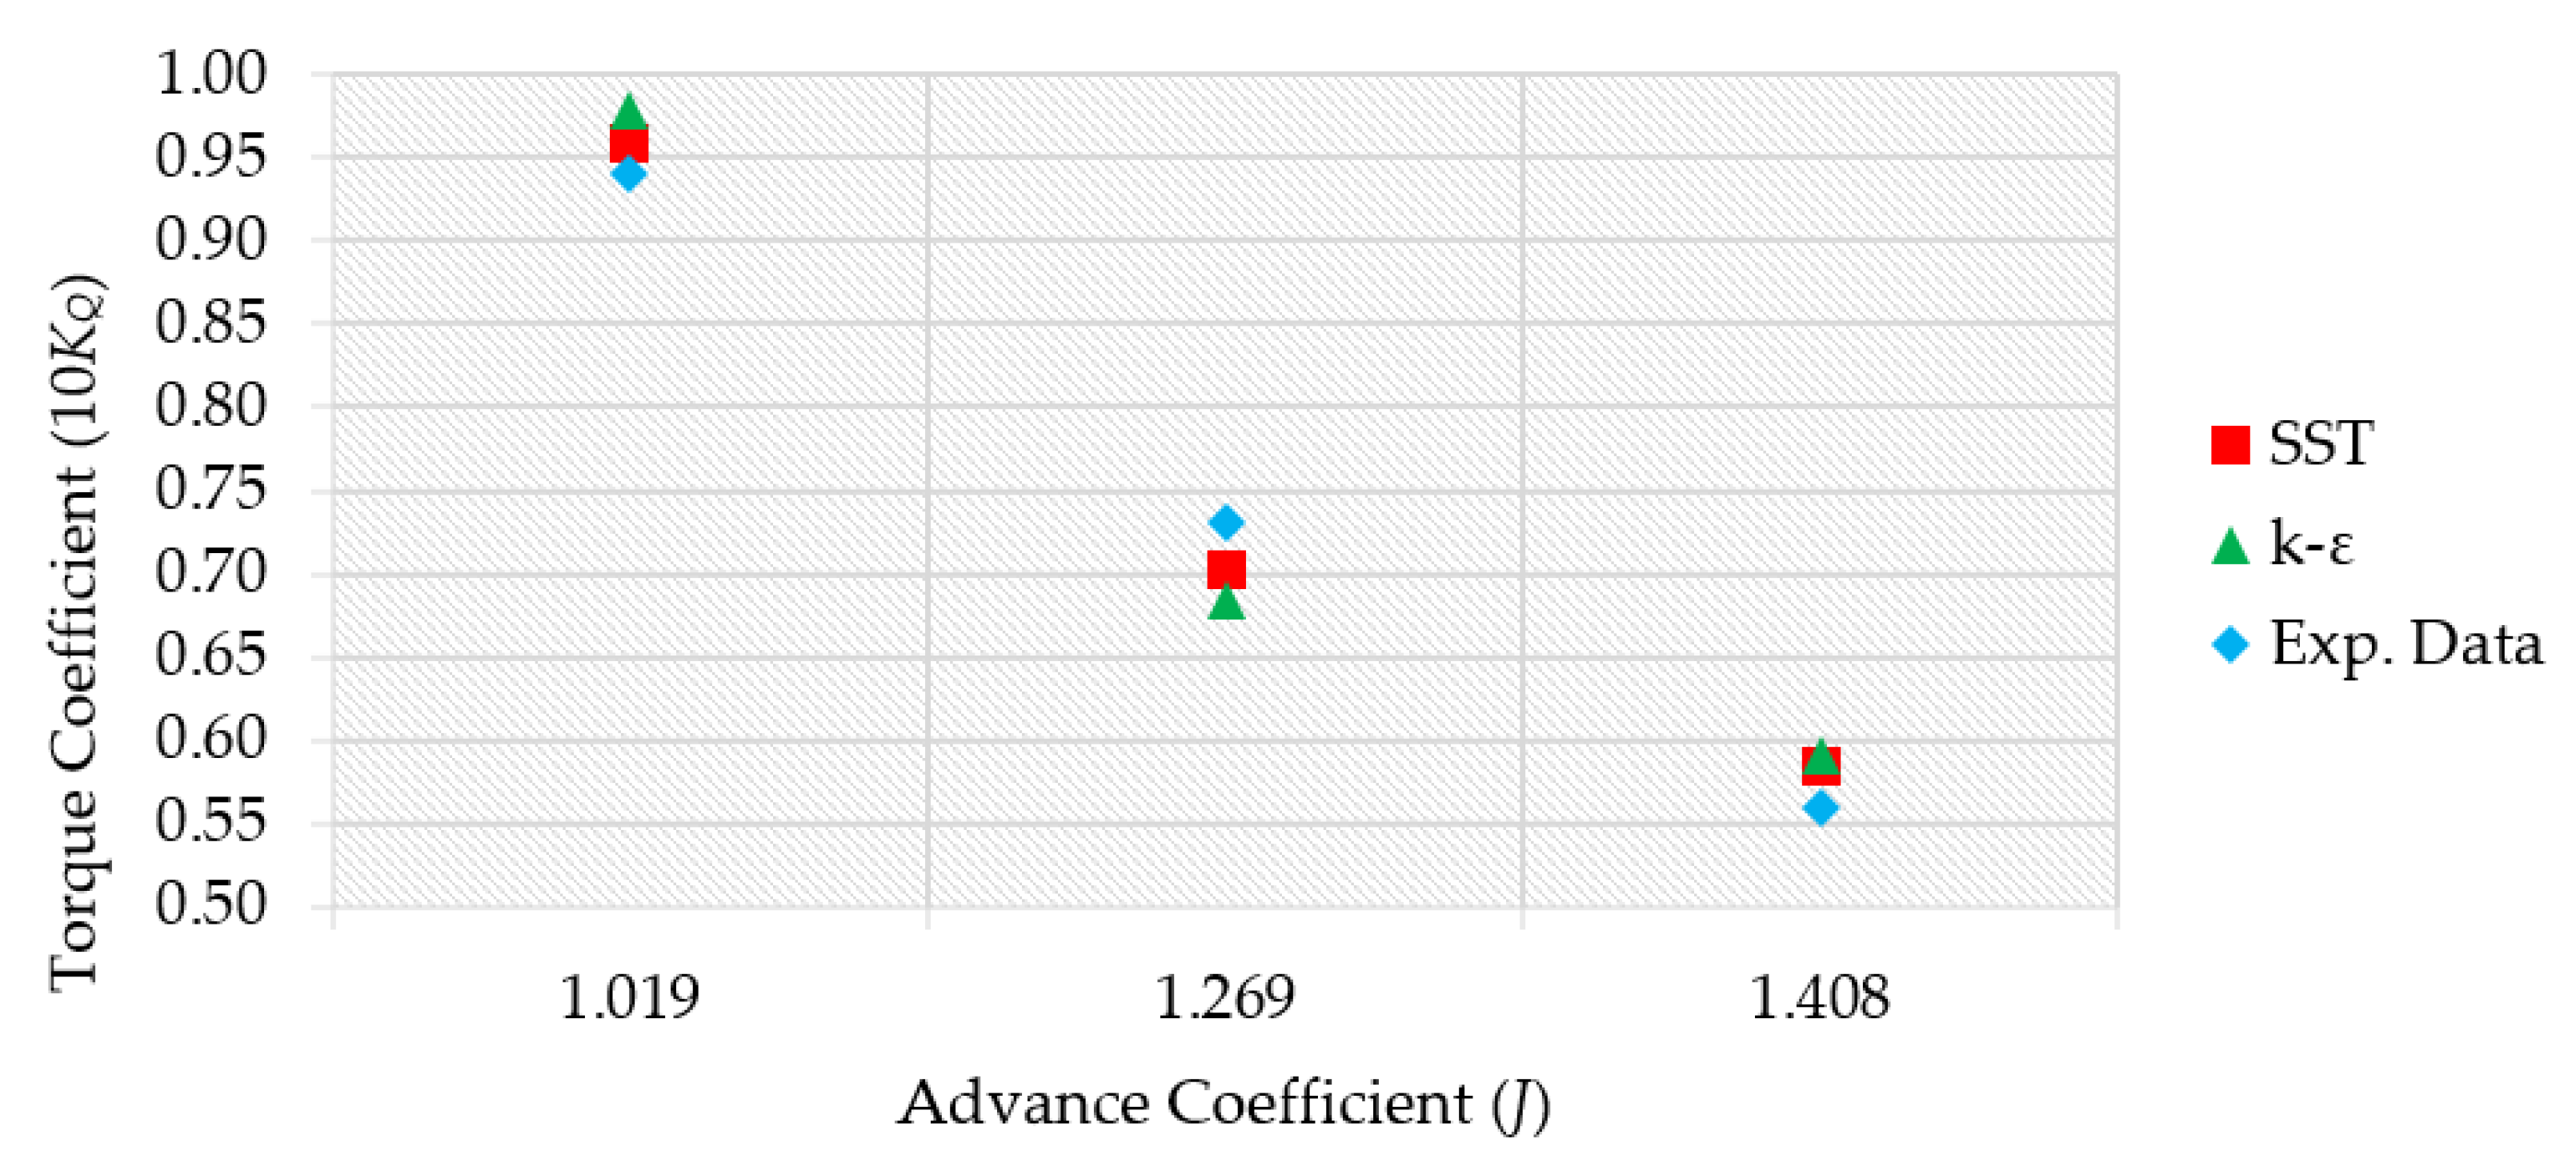
8. Verification and Validation
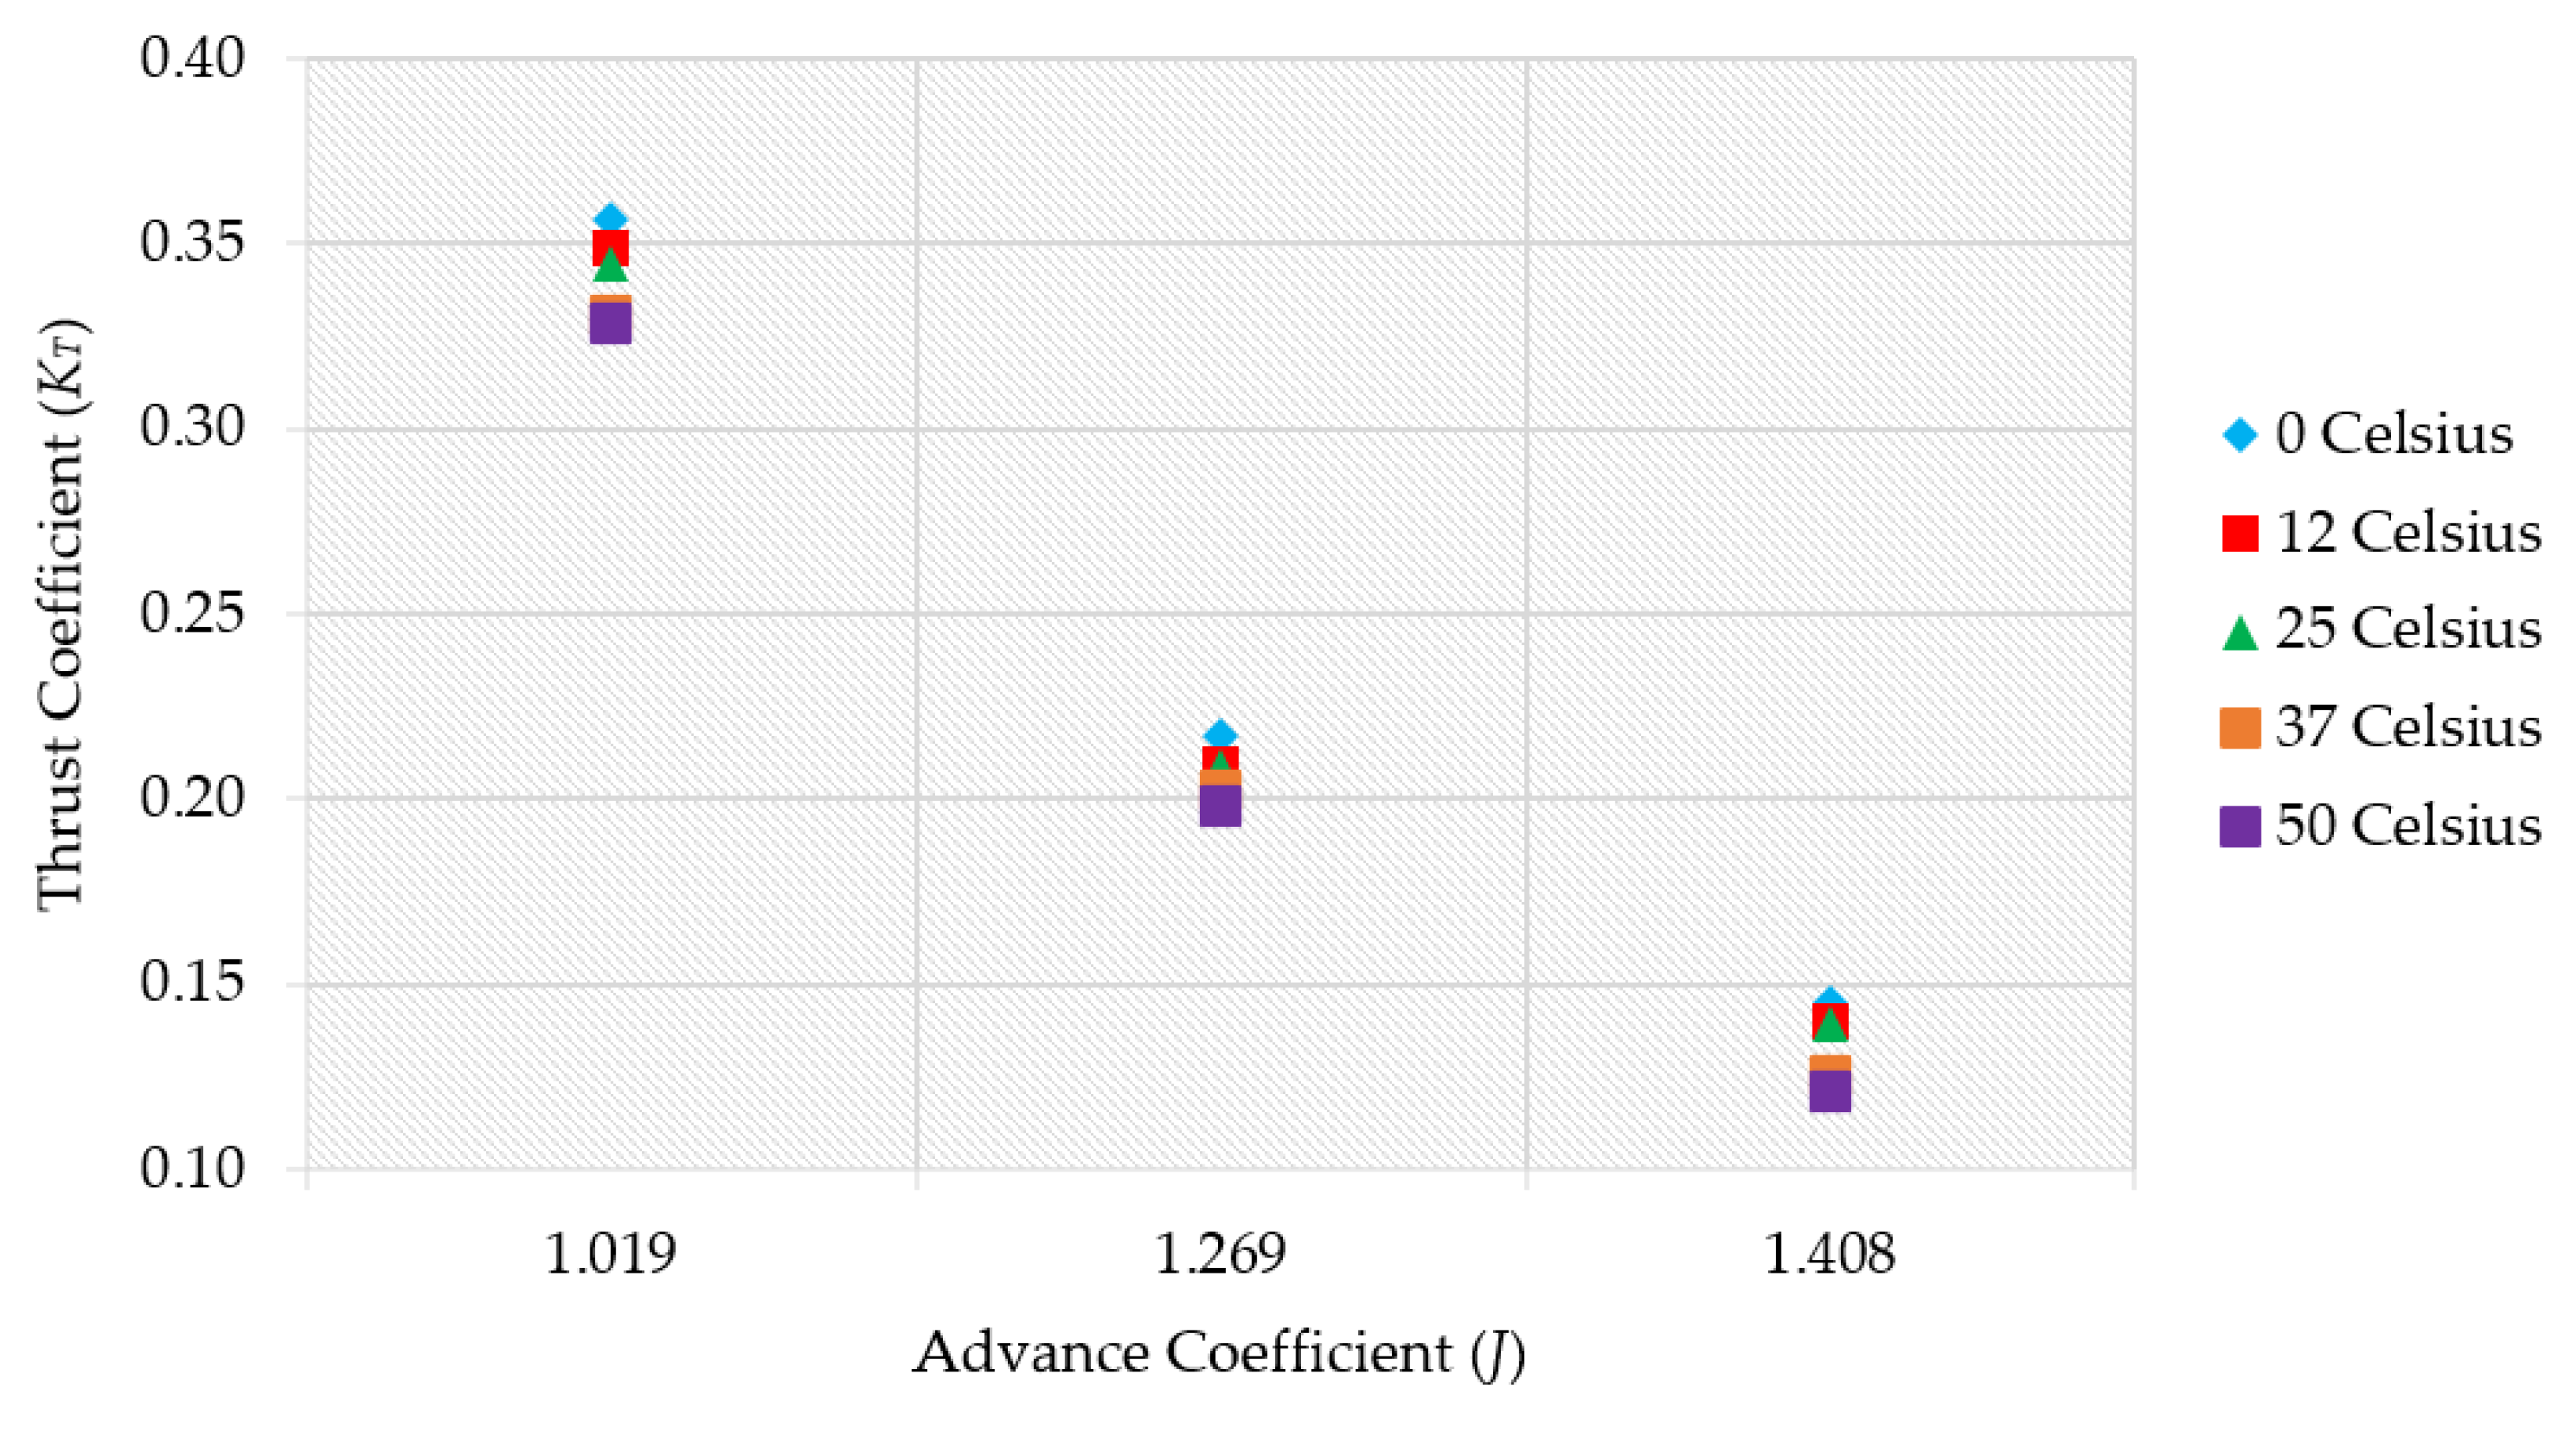
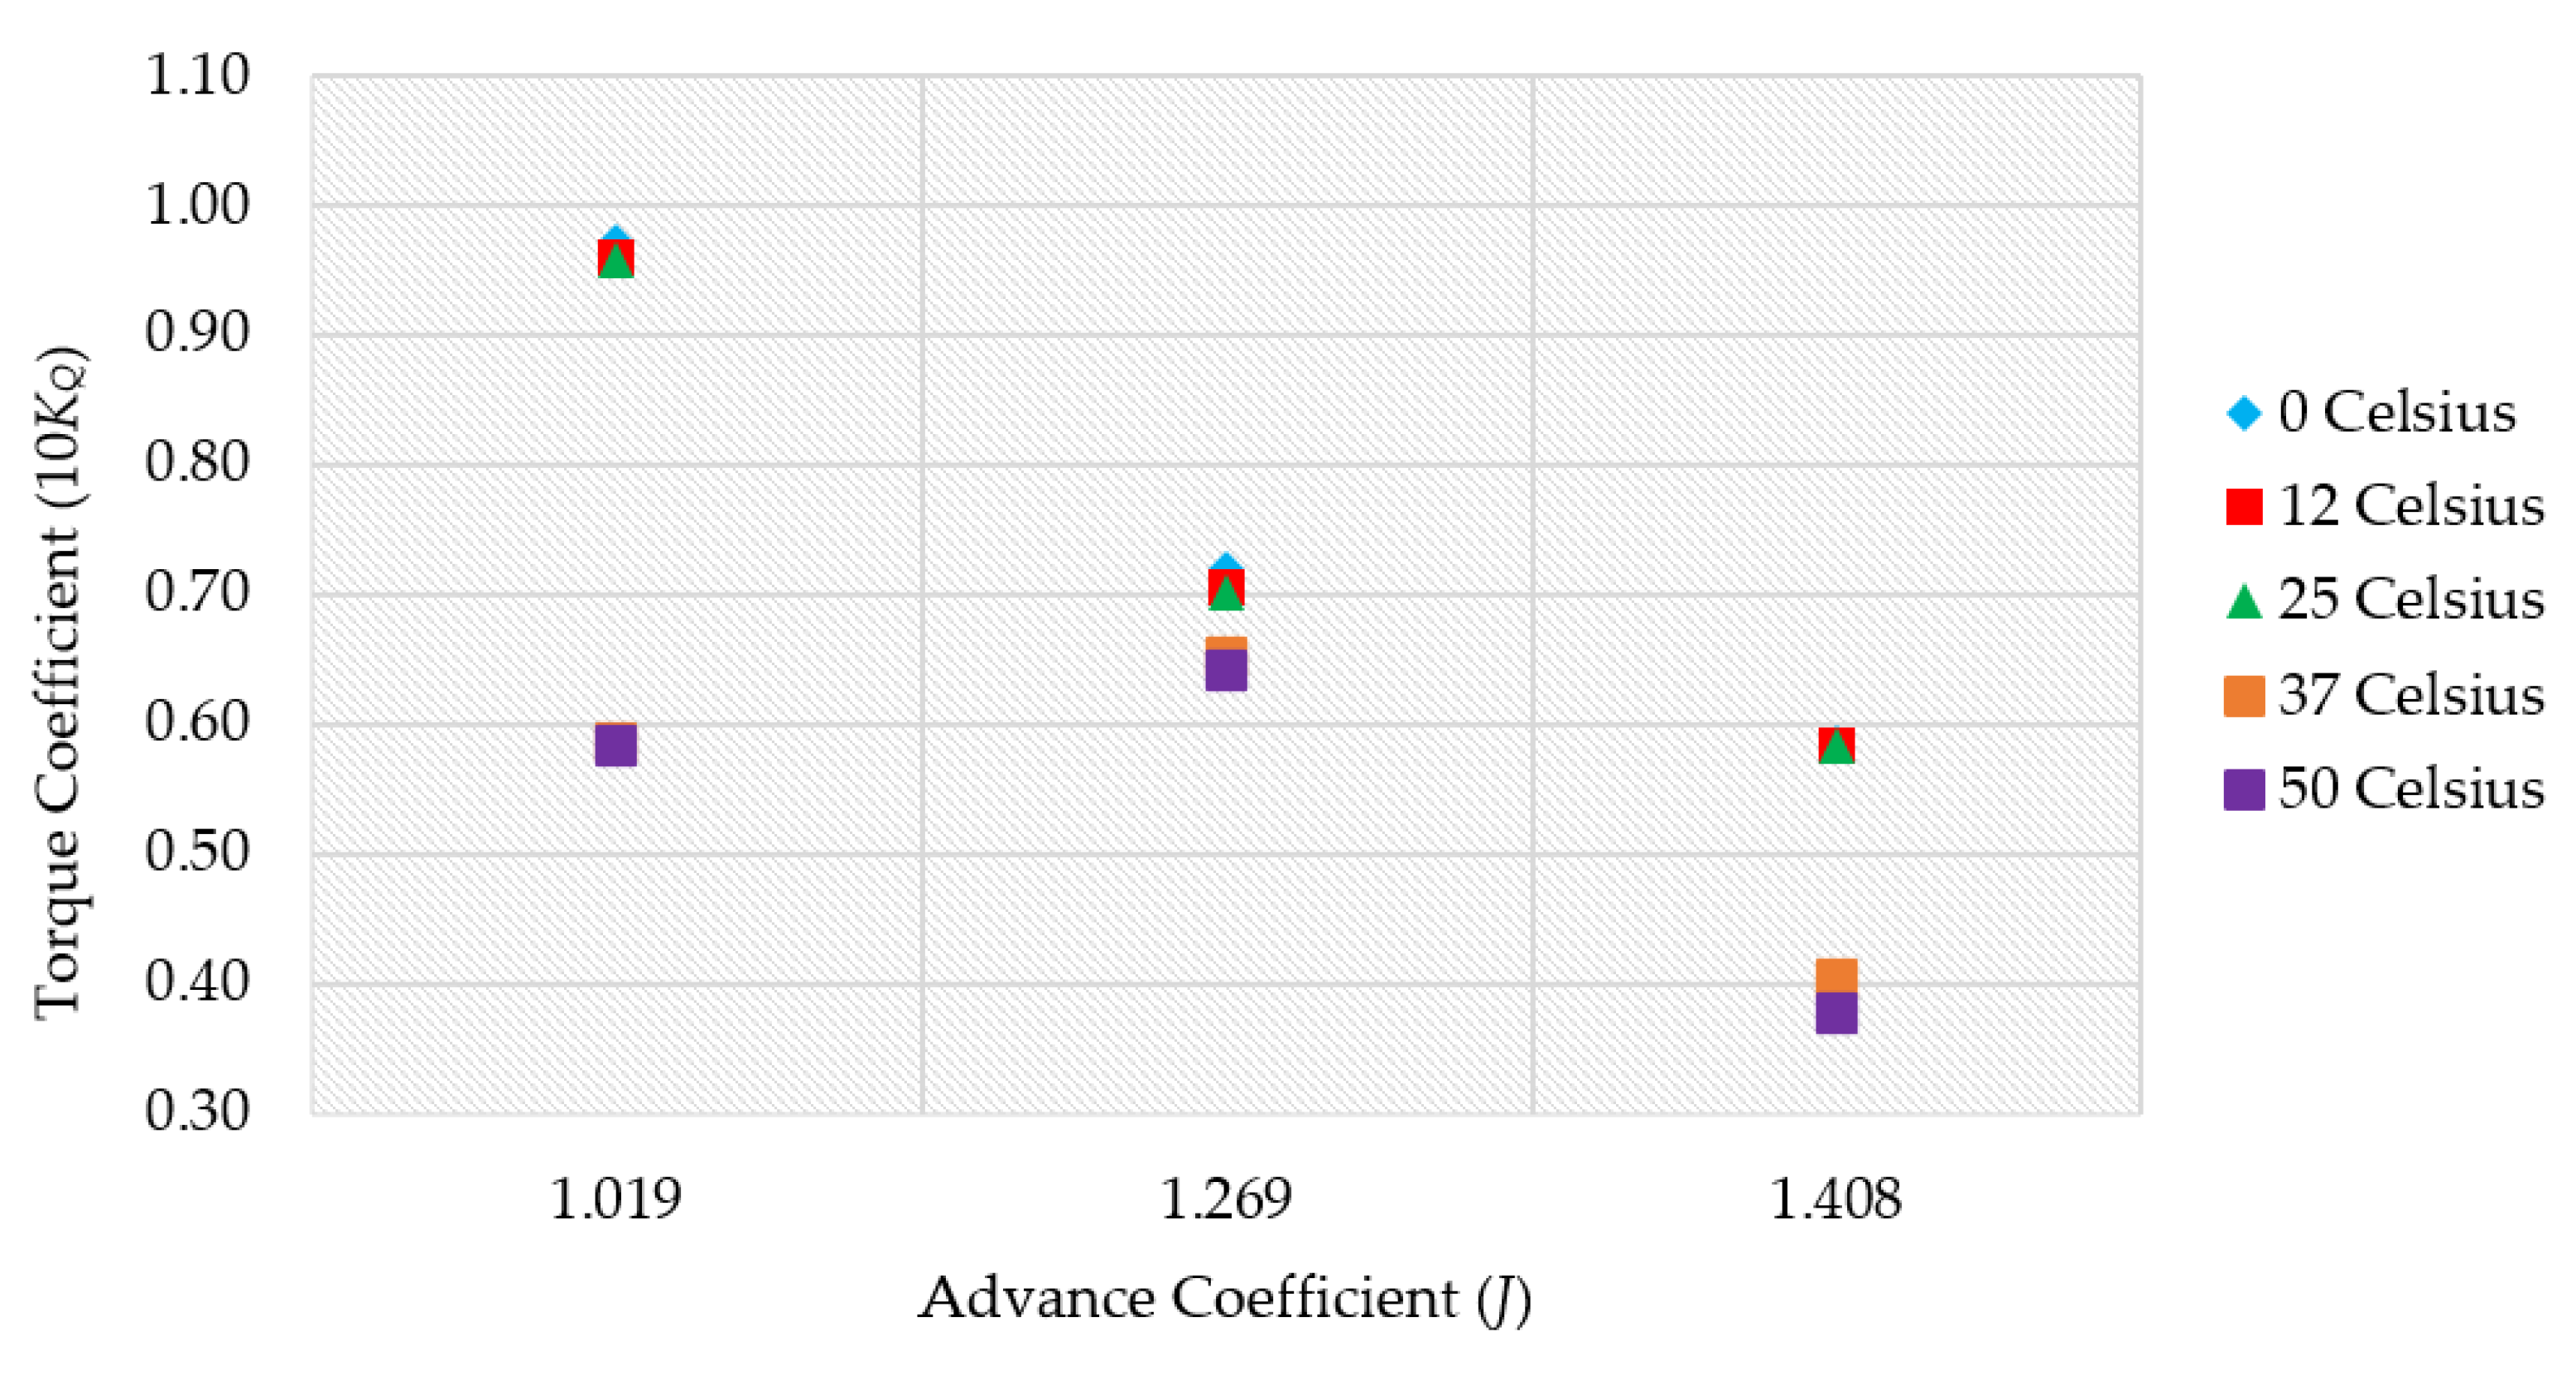
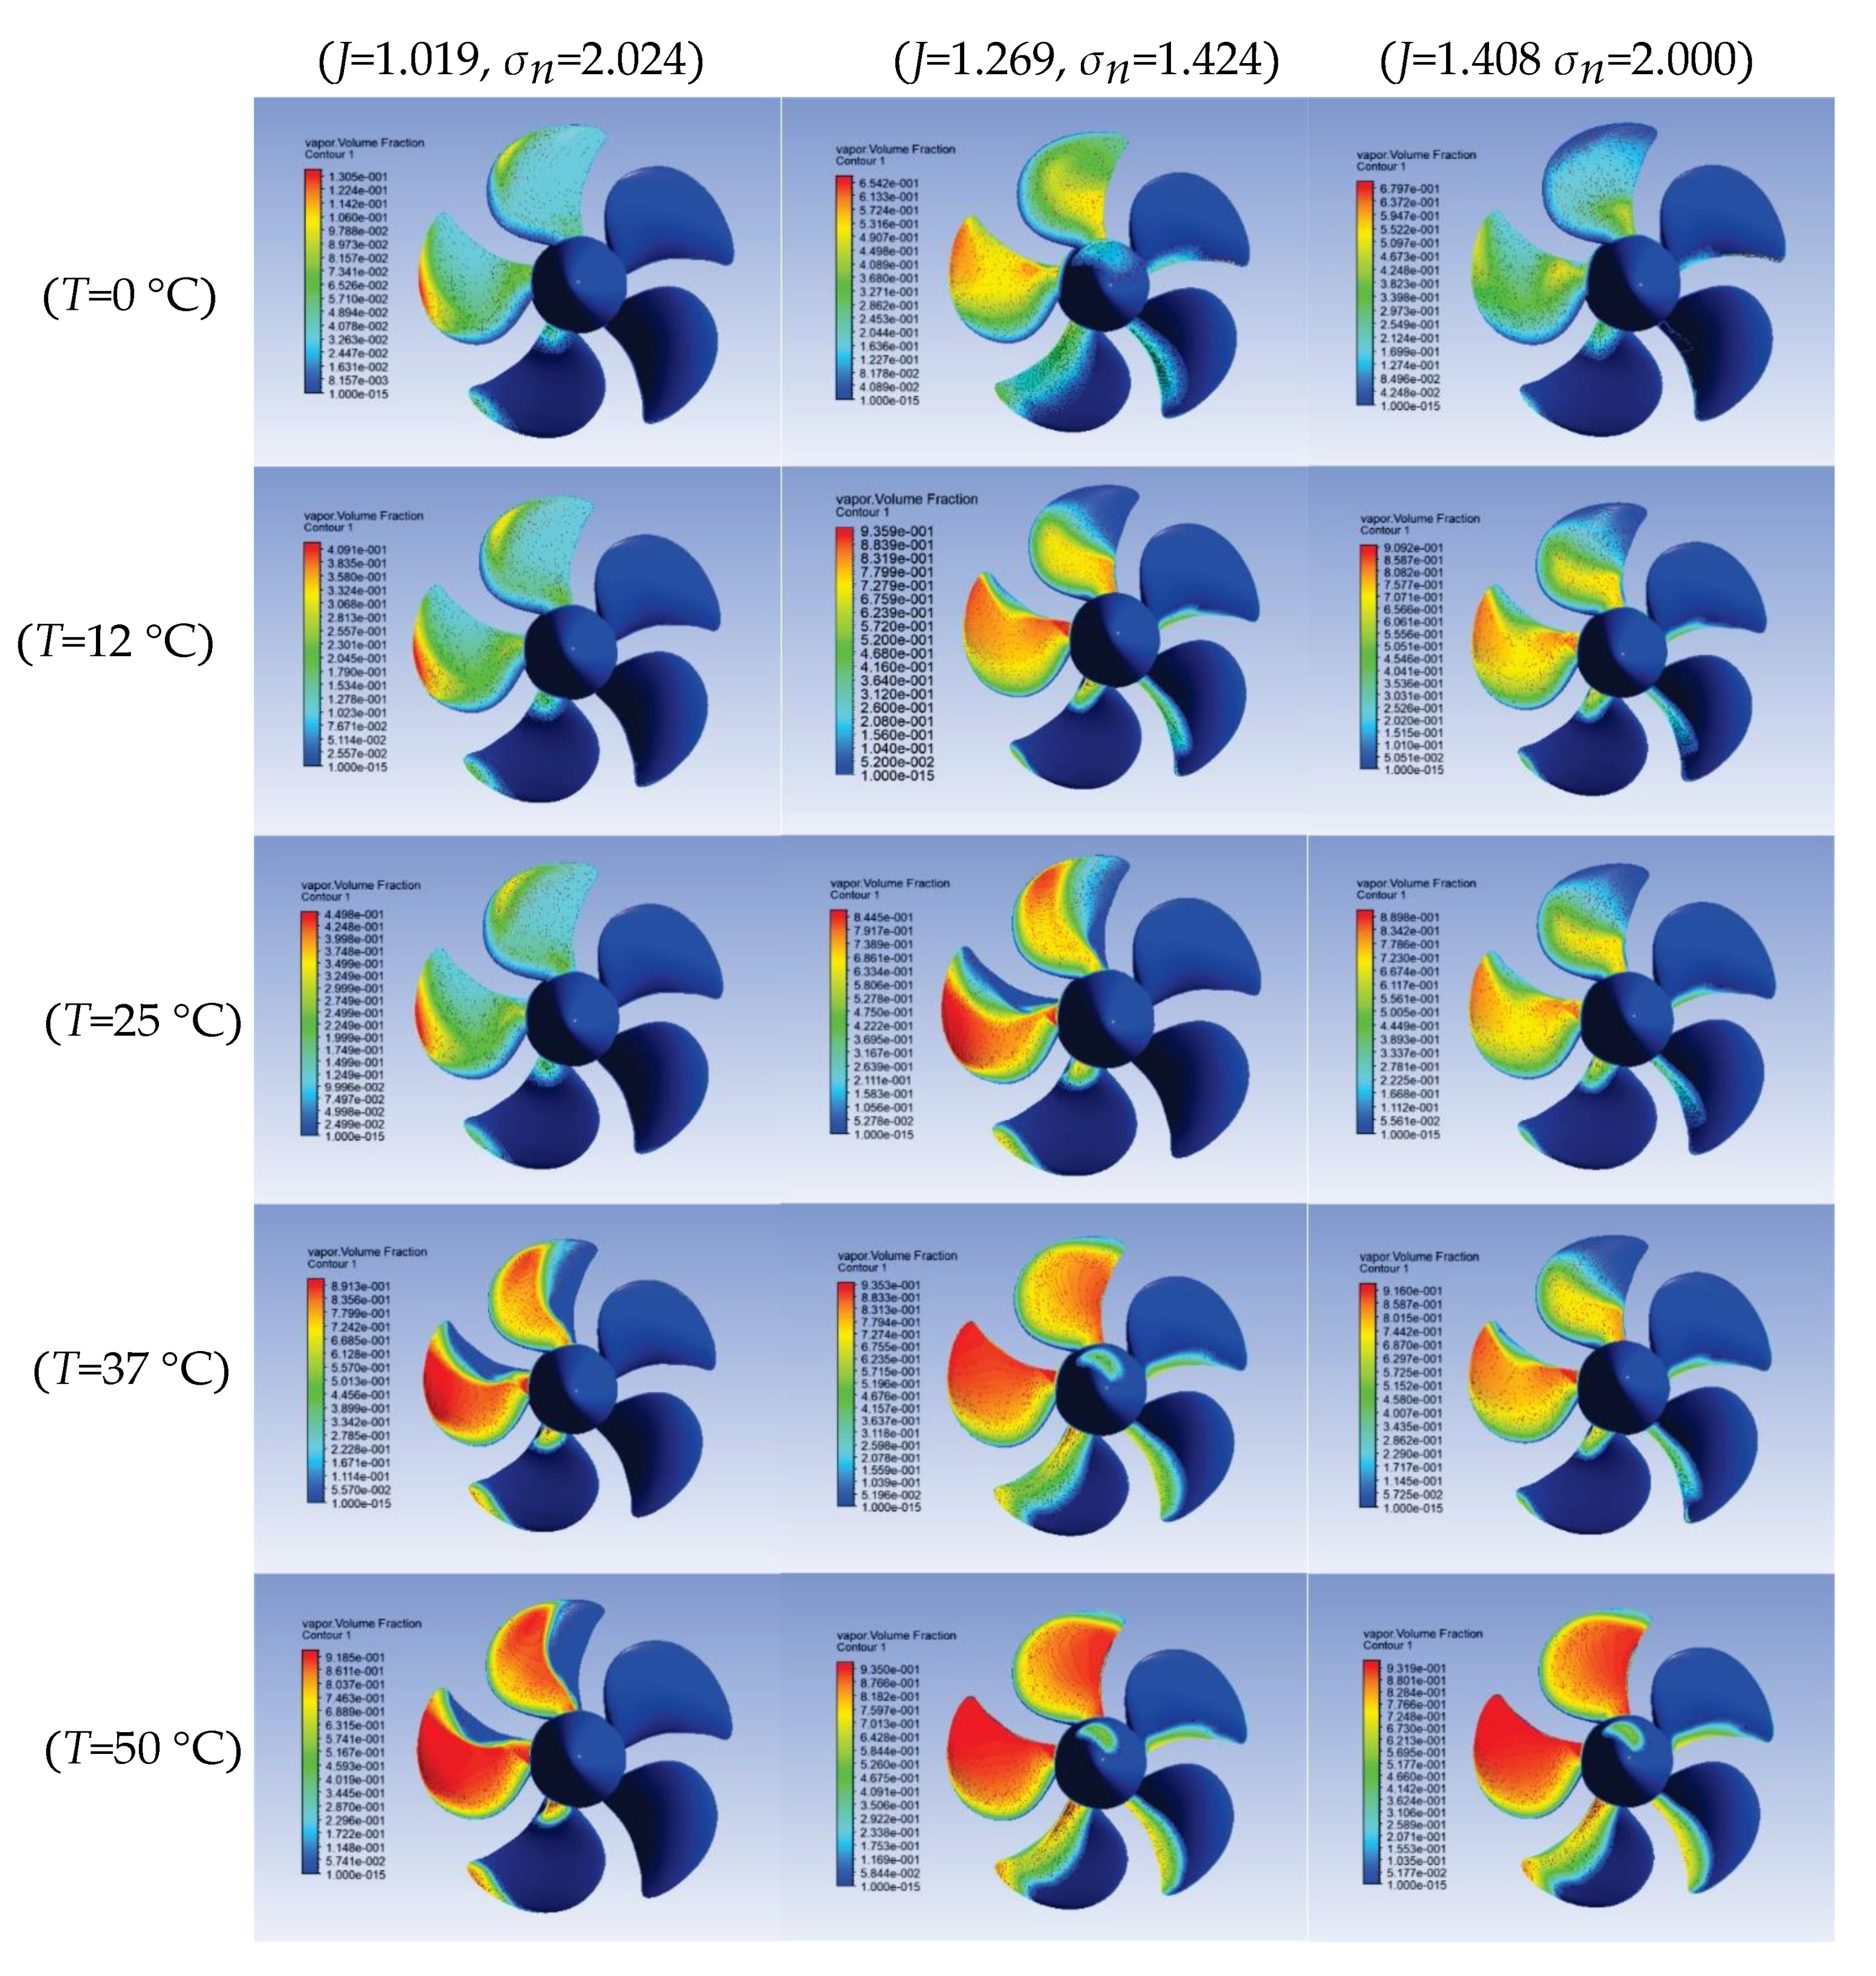
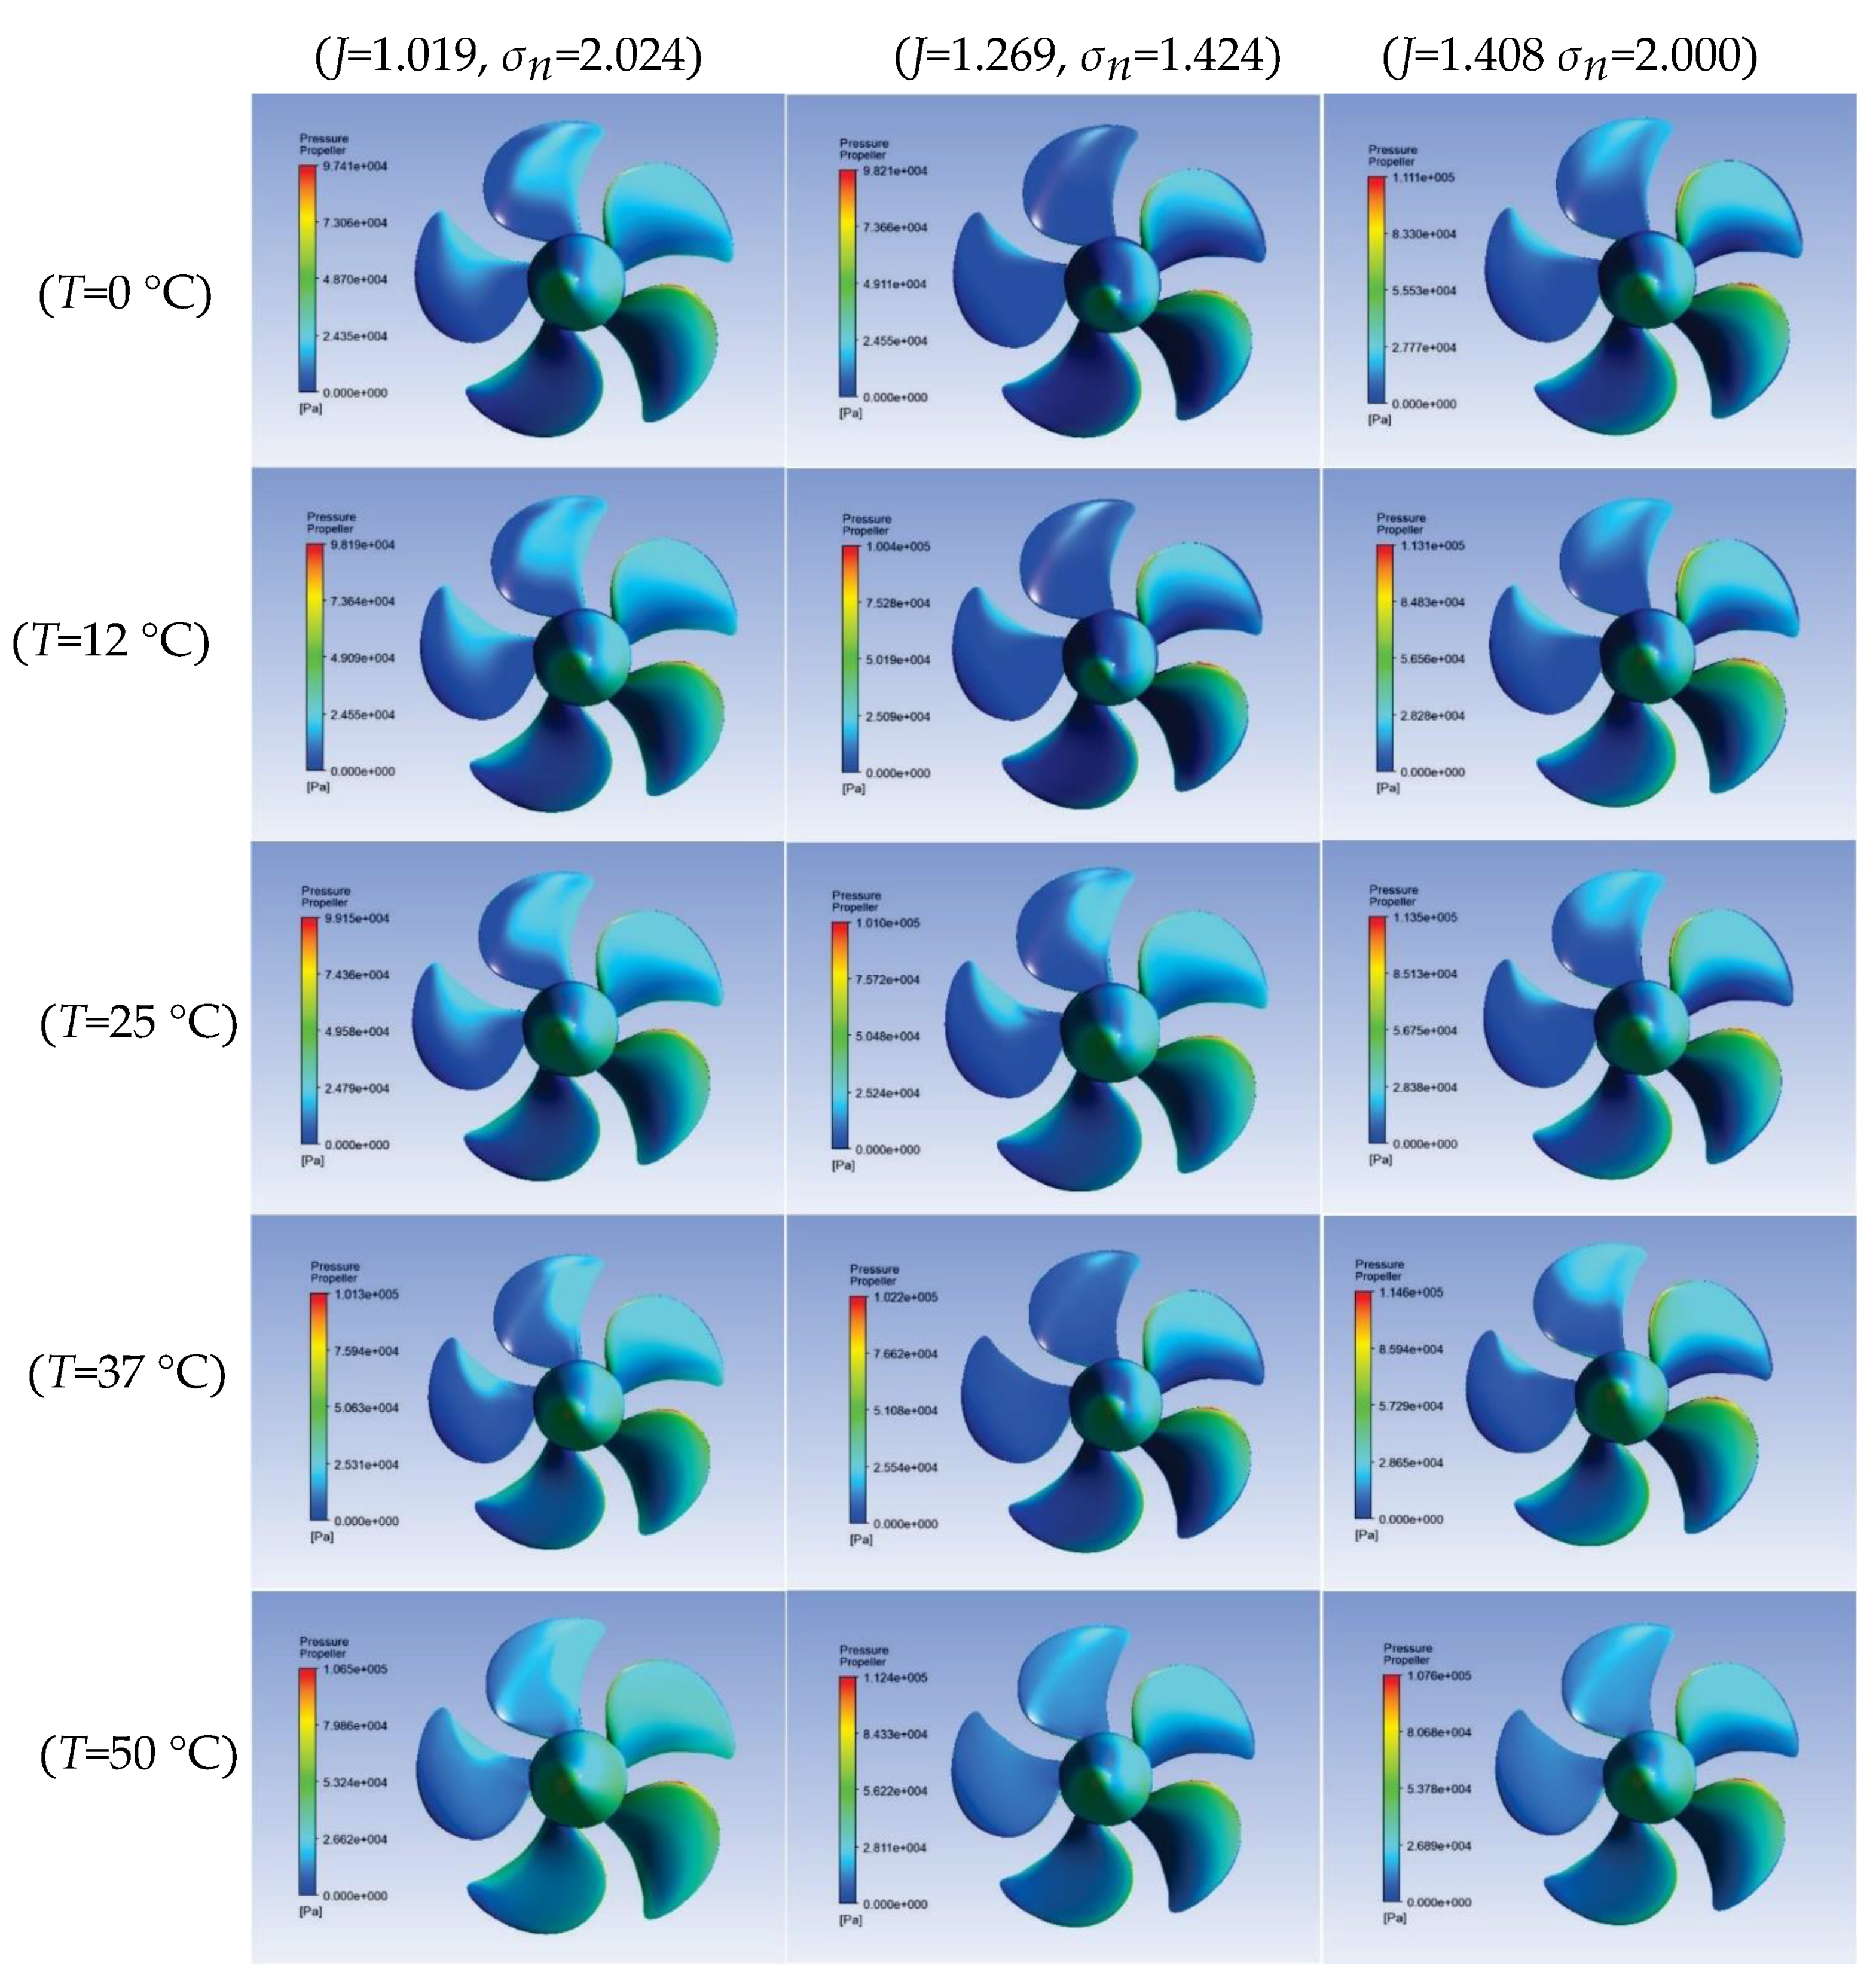
9. Observation Results
10. Conclusions
- Cavitation improved equally with increasing temperature, whereas at low temperatures, cavitation inhibited the inception of cavitation bubbles.
- The water vapor pressure (, vapor density , latent heat (L), and surface tension () of the liquid played important roles in the rate of cavitation formation based on the different physical properties of water.
- With an increase in temperature, cavitation in case 3 was the most aggressive.
- Cavitation modeling with the Rayleigh–Plesset equation can provide a general description of the effects of different physical properties of water.
Author Contributions
Funding
Conflicts of Interest
Nomenclature
| Pressure coefficient | Greek symbols | ||
| Isobaric heat capacity () | Vapor volume fraction | ||
| Propeller diameter (m) | Thermal conductivity () | ||
| Force (N) | Water volume fraction | ||
| h | Specific enthalpy () | Efficiency | |
| Advance coefficient | Dynamic viscosity () | ||
| Torque coefficient | Kinematic fluid viscosity () | ||
| Thrust coefficient | Liquid density () | ||
| Latent heat (J/kg) | Cavitation number | ||
| Interphase transfer rate () | Surface tension () | ||
| Mass of single bubble (kg) | Shear stress at the wall () | ||
| Number of bubbles | Pi (3.14159265359) | ||
| Rotational speed (rps) | |||
| Local pressure (Pa) | Subscripts | ||
| Average pressure (Pa) | B | Bubble | |
| Outlet pressure (bar) | l | Liquid | |
| Reference pressure (bar) | m | Mixture | |
| Vapor pressure (bar) | v | Vapor | |
| Torque (Nm) | |||
| Nucleation site volume fraction | Abbreviations | ||
| Bubble radius (m) | CFD | Computational fluid dynamics | |
| Salinity () | DES | Detached eddy simulation | |
| Specific entropy () | FCM | Full cavitation model | |
| Water temperature (°C) | GGI | Generalized grid interface | |
| Freestream velocity () | LES | Large eddy simulation | |
| U | Average velocity () | MRF | Multiple reference frame |
| Bubble volume () | PPTC | Potsdam Propeller Test Case | |
| Normal distance from the wall (m) | RANS | Reynolds-averaged Navier–Stokes | |
| Non-dimensional normal distance | smp’15 | 4th International Symposium on Marine Propulsors, 2015 | |
| Thermodynamics glossary | |||
| Thermal conductivity is the intensive quantity of a material that shows its ability to conduct heat. Thermal conduction is a transport phenomenon in which temperature differences cause the transfer of thermal energy from one region of a hot object to the same region at a lower temperature. The heat is transferred from one point to another through one of three methods: Conduction, convection, or radiation. | |||
| Heat capacity is the amount of heat absorbed by objects with certain mass to raise the temperature by 1 °C. | |||
| h | Enthalpy is a thermodynamic characteristic that represents the amount of internal energy contained in a thermodynamic system plus the amount of energy used. Total enthalpy can only be measured by changes that occur. | ||
| L | Latent heat is the heat used by a substance to change the shape of a fluid. In the case of cavitation, it is the process of evaporation and condensation during the cavitation process. The amount of latent heat is the heat received or released per unit mass. | ||
| Entropy is a thermodynamic quantity used to measure energy in temperature units, which is not used for work. The entropy of a closed system will always increase under heat transfer conditions. Then the heat will move from high temperature to low temperature. | |||
References
- Prabowo, A.R.; Putranto, T.; Sohn, J.M. Simulation of the Behavior of a Ship Hull under Grounding: Effect of Applied Element Size on Structural Crashworthiness. J. Mar. Sci. Eng. 2019, 7, 270. [Google Scholar] [CrossRef]
- Bae, D.M.; Prabowo, A.R.; Cao, B.; Sohn, J.M.; Zakki, A.F.; Wang, Q. Numerical Simulation for the Collision between Side Structure and Level Ice in Event of Side Impact Scenario. Lat. Am. J. Solids Struct. 2016, 13, 2691–2704. [Google Scholar] [CrossRef][Green Version]
- Prabowo, A.R.; Bae, D.M.; Sohn, J.M. Comparing Structural Casualties of the Ro-Ro Vessel Using Straight and Oblique Collision Incidents on the Car Deck. J. Mar. Sci. Eng. 2019, 7, 183. [Google Scholar] [CrossRef]
- Prabowo, A.R.; Bahatmaka, A.; Cho, J.H.; Sohn, J.M.; Bae, D.M.; Samuel, S.; Cao, B. Analysis of Structural Crashworthiness on a Non-Ice Class Tanker during Stranding Accounting for the Sailing Routes. Marit. Transp. Harvest. Sea Resour. 2016, 1, 645–654. [Google Scholar]
- Saleh, B.; Abouel-Kasem, A.; El-Deen, A.E.; Ahmed, S.M. Investigation of Temperature Effects on Cavitation Erosion Behavior Based on Analysis of Erosion Particles. J. Tribol. 2010, 132. [Google Scholar] [CrossRef]
- Morgut, M.; Nobile, E. Numerical Predictions of Cavitating Flow around Model Scale Propellers by CFD and Advance Model Calibration. Int. J. Rotating Mach. 2012, 2012. [Google Scholar] [CrossRef]
- Morgut, M.; Nobile, E. Numerical Predictions of the Cavitating and Non-Cavitating Flow around the Model Scale Propeller PPTC. In Proceedings of the Workshop on Cavitation and Propeller Performance, the 2nd International Symposium on Marine Propulsors (SMP’11), Hamburg, Germany, 15–17 June 2011. [Google Scholar]
- Cooper, J.R.; Dooley, R.B. Revised Release on the IAPWS Industrial Formulation 1997 for the Thermodynamic Properties of Water and Steam; The International Association for the Properties of Water and Steam (IAPWS): Lucerne, Switzerland, 2007. [Google Scholar]
- Spraker, W.A. The Effects of Fluid Properties on Cavitation in Centrifugal Pumps. J. Eng. Gas Turbines Power 1965, 87, 309–318. [Google Scholar] [CrossRef]
- Alarabi, A. Effect of Water Temperature on Centrifugal Pumps Performance under Cavitating and Non-Cavitating Conditions. In Proceedings of the 8th Internal Conference on Sustainable Energy Technologies, Seoul, Korea, 24–27 August 2008; pp. 24–27. [Google Scholar]
- Hosien, M.A.; Selim, S.M. Experimental and Theoretical Investigation on the Effect of Pumped Water Temperature on Cavitation Breakdown in Centrifugal Pumps. J. Appl. Fluid Mech. 2017, 10, 1079–1089. [Google Scholar] [CrossRef]
- Meijn, G.J. Physical Modeling of Cavitation Using an Enthalpy Based Model. In Faculty of Mechanical, Maritime and Material Engineering; Delft University of Technology: Delft, The Netherlands, 2015. [Google Scholar]
- Chivers, T.C. Temperature Effects on Cavitation in a Centrifugal Pump. Theory and Experiment. Proc. Inst. Mech. Eng. 1969, 184, 37–47. [Google Scholar] [CrossRef]
- Lubke, L. Potsdam Propeller Test Case (PPTC) Cavitation in Oblique Flow Case 2. Available online: https://www.sva-potsdam.de/wp-content/uploads/2016/03/3_PPTC-CAV-smp15.pdf (accessed on 1 June 2020).
- Kunz, R.F.; Boger, D.A.; Stinebring, D.R.; Chyczewski, T.S.; Gibeling, H.J.; Venkateswaran, S.; Govindan, T.R. A Preconditioned Navier-Stokes Method for Two-Phase Flows with Application to Cavitation Prediction. In Proceedings of the 14th Computational Fluid Dynamics Conference, Norfolk, VA, USA, 1–5 November 1999; Volume 29, pp. 676–688. [Google Scholar] [CrossRef]
- Salvatore, F.; Greco, L.; Calcagni, D. Computational Analysis of Marine Propeller Performance and Cavitation by Using an Inviscid-Flow BEM Model. In Proceedings of the Second International Symposium on Marine Propulsors (SMP2011), Hamburg, Germany, 15–17 June 2011; p. 8. [Google Scholar]
- Zwart, P.J.; Gerber, A.G.; Belamri, T. A Two-Phase Flow Model for Predicting Cavitation Dynamics. In Proceedings of the Fifth International Conference on Multiphase Flow, Yokohama, Japan, 30 May–4 June 2004; p. 152. [Google Scholar]
- Singhal, A.K.; Athavale, M.M.; Li, H.; Jiang, Y. Mathematical Basis and Validation of the Full Cavitation Model. J. Fluids Eng. Trans. ASME 2002, 124, 617–624. [Google Scholar] [CrossRef]
- Brennen, C.E. Cavitation and Bubble Dynamics; Oxford University Press: Oxford, UK, 1995; ISBN 0-19-509409-3. [Google Scholar]
- Lungu, A. A DES-SST Based Assessment of Hydrodynamic Performances of the Wetted and Cavitating PPTC Propeller. J. Mar. Sci. Eng. 2020, 8, 297. [Google Scholar] [CrossRef]
- Regener, P.B.; Mirsadraee, Y.; Andersen, P. Nominal vs. Effective Wake Fields and Their Influence on Propeller Cavitation Performance. J. Mar. Sci. Eng. 2018, 6, 34. [Google Scholar] [CrossRef]
- Rodio, M.G.; De Giorgi, M.G.; Ficarella, A. Influence of Convective Heat Transfer Modeling on the Estimation of Thermal Effects in Cryogenic Cavitating Flows. Int. J. Heat Mass Transf. 2012, 55, 6538–6554. [Google Scholar] [CrossRef]
- Franc, J.P.; Pellone, C. Analysis of Thermal Effects in a Cavitating Inducer Using Rayleigh Equation. J. Fluids Eng. Trans. ASME 2007, 129, 974–983. [Google Scholar] [CrossRef]
- Viitanen, V.; Siikonen, T.; Sánchez-Caja, A. Cavitation on Model-and Full-Scale Marine Propellers: Steady and Transient Viscous Flow Simulations at Different Reynolds Numbers. J. Mar. Sci. Eng. 2020, 8, 141. [Google Scholar] [CrossRef]
- Pereira, F.A.; Di Felice, F.; Salvatore, F. Propeller Cavitation in Non-Uniform Flow and Correlation with the near Pressure Field. J. Mar. Sci. Eng. 2016, 4, 70. [Google Scholar] [CrossRef]
- Sharqawy, M.H.; Lienhard, V.J.H.; Zubair, S.M. Erratum to Thermophysical Properties of Seawater: A Review of Existing Correlations and Data. Desalin. Water Treat. 2011, 29, 355. [Google Scholar] [CrossRef]
- Lungu, A. Scale Effects on a Tip Rake Propeller Working in Open Water. J. Mar. Sci. Eng. 2019, 7, 404. [Google Scholar] [CrossRef]
- ASIMPTOTE Software. Available online: http://www.asimptote.nl/software/fluidprop/ (accessed on 20 May 2020).
- Helal, M.M.; Ahmed, T.M.; Banawan, A.A.; Kotb, M.A. Numerical Prediction of Sheet Cavitation on Marine Propellers Using CFD Simulation with Transition-Sensitive Turbulence Model. Alexandria Eng. J. 2018, 57, 3805–3815. [Google Scholar] [CrossRef]
- ANSYS CFX-Solver Theory Guide; ANSYS Inc.: Canonsburg, PA, USA, 2009.
- Chen, T.R.; Wang, G.Y.; Huang, B.; Li, D.Q.; Ma, X.J.; Li, X.L. Effects of Physical Properties on Thermo-Fluids Cavitating Flows. J. Phys. Conf. Ser. 2015, 656. [Google Scholar] [CrossRef]
- Dular, M.; Petkovšek, M. Cavitation Erosion in Liquid Nitrogen. Wear 2018, 400, 111–118. [Google Scholar] [CrossRef]
- Plesset, M.S. Temperature Effects in Cavitation Damage. J. Fluids Eng. Trans. ASME 1972, 94, 559–563. [Google Scholar] [CrossRef]


| Parameter | Symbol | Unit | Case 1 | Case 2 | Case 3 |
|---|---|---|---|---|---|
| Advance Coefficient | - | 1.019 | 1.269 | 1.408 | |
| Cavitation Number | - | 2.024 | 1.424 | 2.000 | |
| Rotational Speed | rps | 20 | 20 | 20 | |
| Saturated Pressure | 0.029 | 0.029 | 0.029 | ||
| Water Temperature | °C | 23.7 | 23.7 | 23.7 |
| Fluid | Unit | |||||
|---|---|---|---|---|---|---|
| 0.006 | 0.014 | 0.032 | 0.063 | 0.124 | ||
| 999.793 | 999.452 | 997.004 | 993.294 | 988.009 | ||
| 0.005 | 0.011 | 0.023 | 0.044 | 0.083 | ||
| 1.79 × 10⁻³ | 1.23 × 10⁻³ | 8.90 × 10⁻⁴ | 6.91 × 10⁻⁴ | 5.47 × 10⁻⁴ | ||
| 9.22 × 10⁻⁶ | 9.51 × 10⁻⁶ | 9.87 × 10⁻⁶ | 1.02 × 10⁻⁵ | 1.06 × 10⁻⁵ | ||
| −0.042 | 50.410 | 104.838 | 155.004 | 209.336 | ||
| 2500.893 | 2522.886 | 2546.544 | 2568.173 | 2591.310 | ||
| −1.55 × 10⁻⁴ | 0.181 | 0.367 | 0.532 | 0.704 | ||
| 9.156 | 8.851 | 8.557 | 8.313 | 8.075 | ||
| 4.220 | 4.193 | 4.182 | 4.179 | 4.180 | ||
| 1.888 | 1.898 | 1.912 | 1.928 | 1.948 | ||
| 0.561 | 0.584 | 0.607 | 0.626 | 0.644 | ||
| 0.017 | 0.018 | 0.019 | 0.019 | 0.020 |
| Parameter | Type | Setting |
|---|---|---|
| Inlet domain | Normal speed | |
| Inlet heat transfer | Static temperature | |
| Turbulent intensity | Low intensity | |
| Outlet pressure | Static pressure | |
| Fluid definition | Volume fraction | Water (1) and vapor (0) |
| Rotating domain | Angular velocity | 20 rps |
| Multiphase | Mixture | Homogeneous |
| Heat transfer | Homogenous | Total energy |
| Turbulent | Shear stress transport | Automatic wall function |
| Mass transfer | Cavitation | Rayleigh–Plesset |
| Nucleation | Mean diameter | 2 × 10⁻⁶ |
| Saturation vapor | Pressure |
| Experiment | Simulation | Relative Error (%) | |||||||||
|---|---|---|---|---|---|---|---|---|---|---|---|
| k–ε | k–ε | k–ε | k–ε | ||||||||
| 1.019 | 2.024 | 0.373 | 0.123 | 0.351 | 0.345 | 0.098 | 0.096 | −5.8 | −7.4 | 4.2 | 1.9 |
| 1.269 | 1.424 | 0.206 | 0.073 | 0.186 | 0.216 | 0.068 | 0.071 | −9.8 | 1.2 | −6.3 | −3.8 |
| 1.408 | 2.000 | 0.136 | 0.056 | 0.133 | 0.139 | 0.059 | 0.058 | −2.5 | 2.3 | 5.6 | 4.2 |
| Mesh | Rotating | Fixed | Error | |
|---|---|---|---|---|
| A | 4,754,160 | 1,159,145 | 0.129 | −5.27% |
| B | 7,301,426 | 2,452,774 | 0.139 | 2.32% |
| C | 8,476,318 | 3,780,050 | 0.141 | 3.22% |
| Temperature (°C) | Change in | |||
|---|---|---|---|---|
| Existing Temperature (23.7) | 0.345 | - | 0.958 | - |
| 0 | 0.356 | 3.378% | 0.973 | 1.470% |
| 12 | 0.349 | 1.166% | 0.960 | 0.194% |
| 25 | 0.345 | −0.081% | 0.958 | −0.063% |
| 37 | 0.331 | −4.100% | 0.586 | −38.874% |
| 50 | 0.329 | −4.687% | 0.585 | −38.970% |
| Temperature (°C) | Change in | |||
|---|---|---|---|---|
| Existing temperature (23.7) | 0.209 | – | 0.702 | – |
| 0 | 0.217 | 4.154% | 0.721 | 2.854% |
| 12 | 0.210 | 0.475% | 0.707 | 0.822% |
| 25 | 0.209 | −0.024% | 0.702 | 0.084% |
| 37 | 0.202 | −3.111% | 0.652 | −7.039% |
| 50 | 0.199 | −4.874% | 0.642 | −8.400% |
| Temperature (°C) | Change in | |||
|---|---|---|---|---|
| Existing temperature (23.7) | 0.139 | – | 0.584 | – |
| 0 | 0.145 | 4.041% | 0.585 | 0.207% |
| 12 | 0.140 | 0.737% | 0.584 | −0.076% |
| 25 | 0.139 | 0.029% | 0.584 | 0.038% |
| 37 | 0.125 | −10.299% | 0.404 | −30.850% |
| 50 | 0.121 | −12.838% | 0.378 | −35.339% |
© 2020 by the authors. Licensee MDPI, Basel, Switzerland. This article is an open access article distributed under the terms and conditions of the Creative Commons Attribution (CC BY) license (http://creativecommons.org/licenses/by/4.0/).
Share and Cite
Yusvika, M.; Prabowo, A.R.; Tjahjana, D.D.D.P.; Sohn, J.M. Cavitation Prediction of Ship Propeller Based on Temperature and Fluid Properties of Water. J. Mar. Sci. Eng. 2020, 8, 465. https://doi.org/10.3390/jmse8060465
Yusvika M, Prabowo AR, Tjahjana DDDP, Sohn JM. Cavitation Prediction of Ship Propeller Based on Temperature and Fluid Properties of Water. Journal of Marine Science and Engineering. 2020; 8(6):465. https://doi.org/10.3390/jmse8060465
Chicago/Turabian StyleYusvika, Muhammad, Aditya Rio Prabowo, Dominicus Danardono Dwi Prija Tjahjana, and Jung Min Sohn. 2020. "Cavitation Prediction of Ship Propeller Based on Temperature and Fluid Properties of Water" Journal of Marine Science and Engineering 8, no. 6: 465. https://doi.org/10.3390/jmse8060465
APA StyleYusvika, M., Prabowo, A. R., Tjahjana, D. D. D. P., & Sohn, J. M. (2020). Cavitation Prediction of Ship Propeller Based on Temperature and Fluid Properties of Water. Journal of Marine Science and Engineering, 8(6), 465. https://doi.org/10.3390/jmse8060465