Model-Based Safety Analysis and Design Enhancement of a Marine LNG Fuel Feeding System


Abstract
:1. Introduction
1.1. Background
1.2. Literature Review
2. Materials and Methods
2.1. Methods and Tools
2.2. Methodology Description
2.3. Step 1—Preparatory Work
2.4. Step 2—System Functional Modelling
2.5. Step 3—Enriching the Functional Model with Failure Modes and Failure Diagrams
2.6. Step 4—Failure Modes, Effects, and Criticality Analysis
2.7. Step 5—System Safety Enhancement
2.8. Step 6—Fault Tree and Dynamic Fault Tree Analysis
3. Case Study Description
3.1. System Description
3.2. Analysis Input
3.3. Analysis Scope and Assumptions
- The operation of the LNG fuel system is assessed in terms of its ability to supply natural gas at a constant temperature and pressure.
- Interactions with humans (undertaking the system operation and maintenance) are out of the scope of this study.
- The potential software and hardware failure modes for the system controllers are excluded from this analysis.
- System decomposition reaches to the subsystems and components level. The components parts failure modes are considered at the respective component level.
- The following worst-case scenarios were considered: (a) disruption of the natural gas supply and (b) shut down (stop) of the LNG fuel system. The severity ranking (S) of these scenarions was set to eight (8).
- Due to the lack of relevant data, the occurrence likelihood is considered the same for all the failure modes of each system component.
- The RPN threshold of 100 is employed to describe a safe system conditions in line with [32]. The systems components exhibiting the highest RPN values are flagged as critical.
- Pressure relief valves are excluded from this analysis, as they are not considered to influence the natural gas supply.
- Due to the lack of data for the LNG valve assemblies, the failure rates were not derived considering each valve component. Instead, one failure rate was assigned to all LNG valve components (actuator, body, control unit).
4. Results and Discussion
4.1. Step 1—Preparatory Work
4.2. Step 2—System Functional Modelling
4.3. Step 3—Enriching the Functional Model with Failure Modes and Failure Diagrams
4.4. Step 4—FMECA and Safety Enhancement Based on MADeTM
4.5. Step 5—System Safety Enhancement
4.6. Step 6—FT and DFT Analysis
4.7. Discussion on the Results and Methodology
5. Conclusions
- The system functional modelling substantially contributed to the better understanding of the system components interactions and their impact on the overall system safety.
- The FMECA led to the identification of failure modes and the RPN calculation, which resulted in the classification of the system critical components and the specification of the most critical failure events.
- The FTA allowed for the quantitative evaluation of the identified top events and the comparative assessment of the alternative system configurations employing as safety metrics the top event failure rates.
- The developed methodology effectively supported the quantitative safety analysis and the design of safe marine systems. In the design phase, emphasis must be placed on the critical system components, sensors, and control equipment.
- The most critical components (in terms of the RPN) of the investigated low-pressure LNG fuel feeding system were found to be the evaporator, the pressure build-up unit (PBU), the temperature and pressure sensors, as well as the LNG and cryogenic valve assemblies.
- The recommended modified system configuration included additional valves, a re-heater assembly, an LNG tank heating system, as well as pressure and temperature sensors.
- The modified system configuration exhibited a reduction in the failure rate of the system shut down top event by 69% compared with the baseline system design.
- Particular attention must be placed on the quality of the data obtained from the pertinent literature, as it strongly influences the safety analysis results. As the LNG technology is relatively recent, data discrepancies or unavailability must be compensated by the use of reasonable and justifiable assumptions. In this respect, the results must be used with caution and need to be verified by considering the pertinent literature and experts’ advice.
- The proposed methodology leads to better insights of the underlying parameters that affect the investigated system safety and can be swiftly applied to other ship systems.
Author Contributions
Funding
Data Availability Statement
Acknowledgments
Conflicts of Interest
Abbreviations
| CFD | Computational Fluid Dynamics |
| CO2 | Carbon dioxide |
| ECA | Emission control areas |
| FMECA | Failure Modes, Effects, and Criticality Analysis |
| FTA | Fault Tree Analysis |
| DFTA | Dynamic Fault Tree Analysis |
| GA | Genetic Algorithms |
| HFO | Heavy Fuel Oil |
| IGF | International code of safety for ships using Gas and other low flashpoint Fuels |
| LNG | Liquefied Natural Gas |
| BOG | Boil-off gas |
| MBSA | Model-Based Safety Analysis |
| NOx | Nitrogen oxide |
| PM | Particulate matter |
| SOx | Sulphur oxide |
| PBU | Pressure build-up unit |
| GVU | Gas Valve Unit |
Appendix A. Employed Fault Trees and Dynamic Fault Trees structure


References
- Andersen, M.L.; Clausen, N.B.; Sames, P.C. Costs and Benefits of LNG as Ship Fuel for Container Vessels. Available online: http://www.lngbunkering.org/sites/default/files/2013%20GL_MAN_LNG_study_web.pdf (accessed on 25 December 2018).
- Banks, J.; Hines, J.; Lebold, M. Failure Modes and Predictive Diagnostics Considerations for Diesel Engines; Defense Technical Information Center: Virginia, VA, USA, 2001. [Google Scholar]
- Bolbot, V.; Theotokatos, G.; Boulougouris, E.; Psarros, G.; Hamann, R. A Novel Method for Safety Analysis of Cyber-Physical Systems—Application to a Ship Exhaust Gas Scrubber System. Safety 2020, 6, 26. [Google Scholar] [CrossRef]
- Bolbot, V.; Trivyza, N.; Theotokatos, G.; Boulougouris, E.; Rentizelas, A.; Vassalos, D. Cruise ships power plant optimisation and comparative analysis. Energy 2020, 196, 117061. [Google Scholar] [CrossRef]
- Trivyza, N.L.; Rentizelas, A.; Theotokatos, G. A novel multi-objective decision support method for ship energy systems synthesis to enhance sustainability. Energy Convers. Manag. 2018, 168, 128–149. [Google Scholar] [CrossRef] [Green Version]
- Schlick, H. Potentials and Challenges of Gas and Dual-Fuel Engines for Marine Application. Available online: https://www.cimac.com/cms/upload/events/cascades/cascades_2014_busan/presentations/Presentation_Session2_AVL_CASCADES_Busan_Oct2014_Harald_Schlick (accessed on 10 April 2019).
- Pitblado, R.; Baik, J.; Hughes, G.; Ferro, C.; Shaw, S. Consequences of liquefied natural gas marine incidents. Process Saf. Prog. 2004, 24, 108–114. [Google Scholar] [CrossRef]
- Hamutuk, L. Appendix 4. History of Accidents in the LNG Industry. Sunrise LNG in Timor-Leste: Dreams, Realities and Challenges. Available online: https://www.laohamutuk.org/Oil/LNG/app4.htm (accessed on 4 January 2021).
- IMO. FSA-Liquefied Natural Gas (LNG) Carriers Details of the Formal Safety Assessment. FORMAL SAFETY ASSESSMENT. Denmark: IMO. Available online: http://www.safedor.org/resources/MSC_83-INF-3.pdf (accessed on 4 January 2021).
- Chu, B.; Chang, D. Effect of full-bore natural gas release on fire and individual risks: A case study for an LNG-Fueled ship. J. Nat. Gas Sci. Eng. 2016, 37, 237–247. [Google Scholar] [CrossRef]
- Fu, S.; Yan, X.; Zhang, D.; Li, C.; Zio, E. Framework for the quantitative assessment of the risk of leakage from LNG-fueled vessels by an event tree-CFD. J. Loss Prev. Process Ind. 2016, 43, 42–52. [Google Scholar] [CrossRef] [Green Version]
- Lee, S.; Seo, S.; Chang, D. Fire risk comparison of fuel gas supply systems for LNG fuelled ships. Nat. Gas. Sci. Eng. 2015, 27, 1788–1795. [Google Scholar] [CrossRef]
- Nwaoha, T.C.; Yang, Z.; Wang, J.; Bonsall, S. Application of genetic algorithm to risk-based maintenance operations of liquefied natural gas carrier systems. Proc. Inst. Mech. Eng. Part E J. Process Mech. Eng. 2010, 225, 40–52. [Google Scholar] [CrossRef]
- Lv, P.; Zhuang, Y.; Jian, D.; Su, W. Study on lockage safety of LNG-fueled ships based on FSA. PLoS ONE 2017, 12, 1–12. [Google Scholar] [CrossRef]
- Seo, S.; Han, S.; Lee, S.; Chang, D. A pump-free boosting system and its application to liquefied natural gas supply for large ships. Energy 2015, 105, 70–79. [Google Scholar] [CrossRef]
- Park, H.; Lee, S.; Jeong, J.; Chang, D. Design of the compressor-assisted LNG fuel gas supply system. Energy 2018, 158, 1017–1027. [Google Scholar] [CrossRef]
- Goo, B.; Lee, J.; Seo, S.; Chang, D.; Chung, H. Design of reliability critical system using axiomatic design with FMECA. Int. J. Nav. Archit. Ocean Eng. 2017, 11, 11–21. [Google Scholar] [CrossRef]
- Martins, M.R.; Schleder, A.M. Reliability Analysis of the Regasification System on Board of a FSRU Using Bayesian Networks, Natural Gas—Extraction to End Use, Sreenath Borra Gupta, IntechOpen. Available online: https://www.intechopen.com/books/natural-gas-extraction-to-end-use/reliability-analysis-of-the-regasification-system-on-board-of-a-fsru-using-bayesian-networks (accessed on 10 May 2020).
- Niculita, O.; Nwora, O.; Skaf, Z. Towards Design of Prognostics and Health Management Solutions for Maritime Assets. Procedia CIRP 2016, 59, 122–132. [Google Scholar] [CrossRef]
- Lazakis, I.; Raptodimos, Y.; Varelas, T. Predicting ship machinery system condition through analytical reliability tools and artificial neural networks. Ocean Eng. 2018, 152, 404–415. [Google Scholar] [CrossRef] [Green Version]
- Cicek, K.; Turan, H.H.; Topcu, Y.I.; Searslan, M.N. Risk-Based Preventive Maintenance Planning using Failure Mode and Effect Analysis (FMEA) for Marine Engine Systems. In Proceedings of the 2nd International Conference on Engineering System Management and Applications, Sharjah, UAE, 30 March–1 April 2010. [Google Scholar]
- PHM Technology. MADe-Maintenance Aware Design. Available online: https://www.phmtechnology.com (accessed on 5 October 2018).
- Bolbot, V.; Theotokatos, G.; Bujorianu, L.; Boulougouris, E.; Vassalos, D. Vulnerabilities and safety assurance methods in Cyber-Physical Systems: A comprehensive review. Reliab. Eng. Syst. Saf. 2019, 182, 179–193. [Google Scholar] [CrossRef] [Green Version]
- Thomas, J. Extending and automating a systems-theoretic hazard analysis for requirements generation and analysis, Engineering Systems Division, Massachusetts Institute of Technology. Available online: http://sunnyday.mit.edu/JThomas-Thesis.pdf (accessed on 7 December 2020).
- PHM Technology. MADe Training Course-Fundamentals & Application-MADe v3.7.2. Available online: https://www.phmtechnology.com/made/how-made-works/ (accessed on 20 December 2018).
- Department of Defense, USA. MIL-HDBK-338B: Military Handbook—Electronic Reliability Design Handbook. Available online: https://www.navsea.navy.mil/Portals/103/Documents/NSWC_Crane/SD-18/Test%20Methods/MILHDBK338B.pdf (accessed on 7 December 2020).
- ISO 31010. Risk management—Risk assessment techniques, International Organization for Standardization. Available online: https://www.iso.org/standard/72140.html (accessed on 10 April 2019).
- Department of Defense, USA. MIL-STD-1629A: Military Standard—Electronic Reliability Design Standard. Available online: http://www.barringer1.com/mil_files/MIL-STD-1629RevA (accessed on 10 April 2019).
- PTC. Windchill PLM Software. Available online: https://www.ptc.com/en/products/plm/plm-products/windchill (accessed on 2 March 2019).
- PHM Technology. MADe for Safety. Available online: https://www.phmtechnology.com/assets/downloads/default/MADe%20for%20Safety.pdf (accessed on 5 October 2018).
- OREDA. OREDA Handbook, SINTEF & NTNU, 6th Edition. Available online: https://www.sintef.no/en/projects/oreda-handbook2 (accessed on 15 February 2019).
- Kim, K.O.; Zuo, M.J. General model for the risk priority number in failure mode and effects analysis. Reliab. Eng. Syst. Saf. 2018, 169, 321–329. [Google Scholar] [CrossRef]
- Bona, G.; Silvestri, A.; Forcina, A.; Petrillo, A. Total efficient risk priority number (TERPN): A new method for risk assessment. J. Risk Res. 2017, 21, 1384–1408. [Google Scholar] [CrossRef]
- Bona, G.; Silvestri, A.; Felice, F.; Forcina, A.; Petrillo, A. An Analytical Model to Measure the Effectiveness of Safety Management Systems: Global Safety Improve Risk Assessment (G-SIRA) Method. J. Fail. Anal. Prev. 2016, 16, 1024–1037. [Google Scholar] [CrossRef]
- Ruijters, E.; Stoelinga, M. Fault tree analysis A survey of the state-of-the-artin modeling, analysis, and tools. Comput. Sci. Rev. 2014, 15, 29–62. [Google Scholar]
- Čepin, M.; Mavko, B. A dynamic fault tree. Reliab. Eng. Syst. Saf. 2002, 75, 83–91. [Google Scholar] [CrossRef]
- Cobo, G.A. Importance Measures, Workshop on “PSA Applications”, Sofia, Bulgaria. Available online: https://inis.iaea.org/collection/NCLCollectionStore/_Public/28/059/28059559.pdf (accessed on 15 March 2019).
- Komal, C.D.; Lee, S.Y. Fuzzy reliability analysis of dual-fuel steam turbine propulsion system in LNG carriers considering data uncertainty. J. Nat. Gas. Sci. Eng. 2015, 23, 148–164. [Google Scholar] [CrossRef]
- Wärtsilä. Wärtsilä 50DF Product Guide. 2018. Available online: https://cdn.wartsila.com/docs/default-source/product-files/engines/df-engine/product-guide-o-e-w50df.pdf?sfvrsn=9 (accessed on 12 November 2018).
- Theotokatos, G.; Livanos, G.A.; Dimitrellou, S.; Strantzali, E.; Pagonis, D.N.; Politis, K.; Theodoulides, A.; Peirounakis, D.; Mizithras, P. Design of LNG Storage and Feeding System for an Open Type Ferry, Towards Green Marine Technology and Transport, 1st ed.; CRC Press: Boca Raton, FL, USA, 2015; pp. 473–481. [Google Scholar]
- DNV-GL. LNG Regulatory Update: “Best Fuel of the Future”, Conference & Study Tour. 2018. Available online: http://www.golng.eu/files/Main/20180417/2.%20Ole%20Vidar%20Nilsen%20-%20DNV%20GL.pdf (accessed on 28 October 2018).
- HSE. Health & Safety Executive—Failure Rate and Event Data for Use within Risk Assessments. Available online: https://www.hse.gov.uk/landuseplanning/failure-rates.pdf (accessed on 4 April 2019).
- Davies, P.A.; Fort, E. LNG as a marine fuel: Likelihood of LNG releases. Mar. Eng. Technol. 2013, 12, 3–10. [Google Scholar]
- Cadwallader, L.C. Reliability Estimates for Selected Sensors in Fusion Applications, Idaho National Engineering Laboratory, Office of Scientific and Technical Information (OSTI). Available online: https://www.researchgate.net/publication/236539403_Reliability_estimates_for_selected_sensors_in_fusion_applications (accessed on 10 February 2019).
- Fydrych, J.; Consogno, G. A maintenance strategy for a multi-valve cryogenic distribution system. Mater. Sci. Eng. 2017, 278, 012014. [Google Scholar] [CrossRef] [Green Version]
- Wärtsilä Oil & Gas Systems AS. Wärtsilä Gas. Systems: LNG Systems. Available online: https://cdn.wartsila.com/docs/default-source/oil-gas-documents/brochure-offshore-lng-systems.pdf (accessed on 10 April 2019).


| Component | Function | Failure Mode | Causes of Failure | ||
|---|---|---|---|---|---|
| Functional Failure | Fault | Mechanism | Cause | ||
| Evaporator | Converts LNG to natural gas at the desired temperature | Low natural gas temperature | Ice outgrowths | Ice formation | Low temperature |
| N° | Component | Description |
|---|---|---|
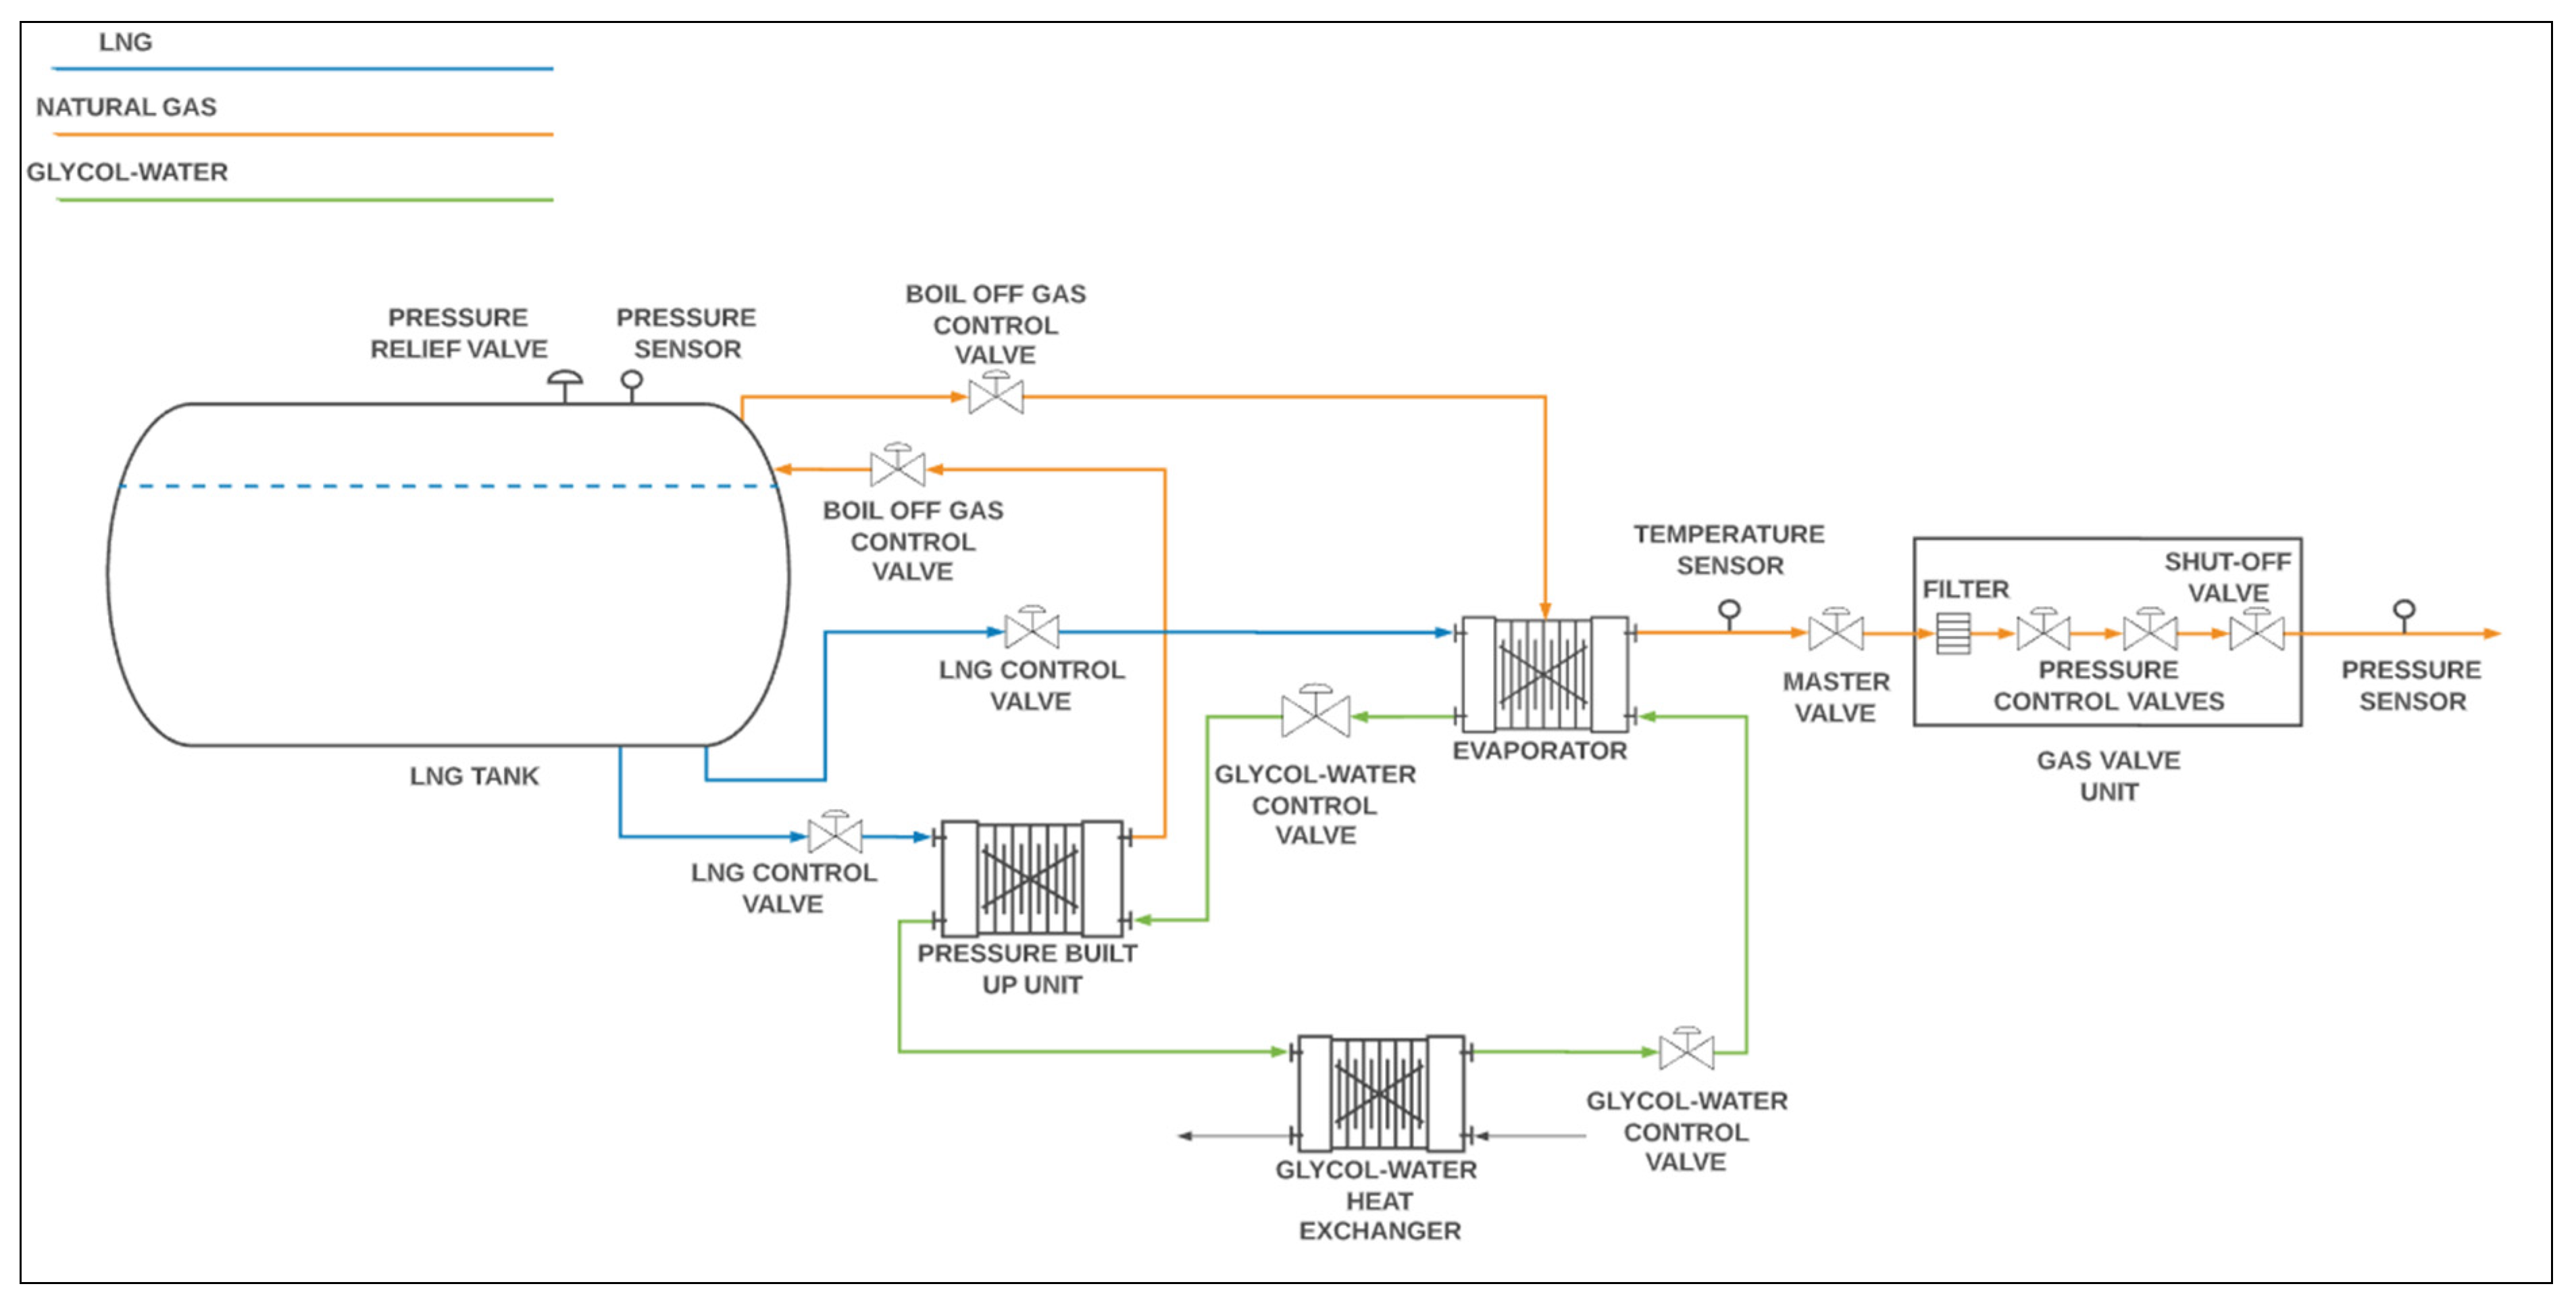
| 1 | LNG tank type “C” | The IMO type C tank is cylindrical by design and is a suitable solution for small-scale LNG storage. It can handle the increased pressure from boil-off gas (BOG) accumulation up to 9 bar rendering the need for BOG venting unnecessary [39]. |
| 2 | Pressure build-up unit (PBU) | The pressure build-up unit (PBU) maintains a high pressure inside the tank by evaporating LNG. The PBU is utilised to maintain a steady flow of natural gas when the tank pressure drops. It consists of a heat exchanger (that employs a glycol-water solution as heating medium), insulated pipes, and regulating valves,; it is connected to the tank pressure monitoring system [39]. |
| 3 | Evaporator | It is a heat exchanger that utilises a glycol-water solution as heating medium to evaporate the LNG and heat up the produced gas. The evaporator is designed so that it can deliver the gas to the engine at the required temperature of 20 °C. The evaporator also receives boil-off gas from the LNG tank, which is then heated to the desired temperature. It must be noted that the additional boil-off gas serves as a supplementary function and is not sufficient by itself to cover the requred engine fuel flow. |
| 4 | Glycol-water heat exchanger | It receives the cold glycol-water from the evaporator and PBU and heats it using warm engine cooling water to send it back and repeat the process. |
| 5,6,7,8,9 | Control valves (Boil-off gas control valve, LNG control valve, glycol water control valve) | All the system valve assemblies include a valve control unit, a valve actuator, and a valve body. They are used to regulate the flow of the relevant medium. |
| 10,11 | Pressure and temperature sensors | The pressure and temperature sensors are used to monitor the relevant operating parameters. Their measurement is used to detect abnormalities in the system and to control the position (opening) of control valves. The temperature measurement is used to control the flow of glycol-water that enters the evaporator. The pressure measurement at the LNG tank is fed via a control signal to the PBU valve assembly, which maintains the high pressure inside the tank. One additional pressure sensor is placed after the GVU for regulating the natural gas pressure according to the engine(s) manufacturer requirements. |
| 12 | Natural gas filter | Cleans the natural gas from impurities before it enters the engine(s). |
| 13 | Pressure relief valve | A pressure relief valve is used to expand the pressure in the LNG tank if it exceeds the maximum allowed pressure. |
| 14 | Glycol-water | Glycol-water solution is a chemical mixture highly resistant to low temperature conditions and a reliable anti-freezer [40] |
| 15 | Gas valve unit (GVU) | It is a safety feature required by the classification societies and consists of a natural gas filter, and a series of pressure control, ventilating, and shut-off valves. It is included within a stainless steel enclosure, which is insulated and inerted for fire prevention, and it is located in a designated area outside the engine room. In this study, it is not considered as an assemply of separate components; instead, it includes the combined functionality of a natural gas valve assembly, shut-off valve, and natural gas valve filter. |
| No. | Components | Estimated Range of Failure Rates Per Year |
|---|---|---|
| 1 | LNG tank minor failure [42] | |
| 2 | Pressure build-up unit (PBU) [31] | |
| 3 | Evaporator/Reheater [31] | |
| 4 | Glycol-water heat exchanger [31] | |
| 5 | Valve actuators [31] | |
| 6 | Valve control units [31] | |
| 7 | Valve body [31] | |
| 8 | Shut-off valve [31] | |
| 9 | LNG valve assembly [43] | – |
| 10 | Pressure sensor [44] | |
| 11 | Temperature sensor [44] | |
| 12 | Natural gas filter [18] |
| No. | Components | Failure Modes | ||
|---|---|---|---|---|
| Faults | Mechanisms | Causes | ||
| 1 | LNG tank | High boil-off gas evaporation rate | - | Heat penetration into the fuel tank |
| 2 | Pressure build-up unit | Fractured | Brittle fracture | Low temperature |
| Ice outgrowths | Ice formation | Low temperature | ||
| Shrunk | Thermal contraction | Low temperature | ||
| Corroded | Corrosive fatigue | Temperature fluctuations | ||
| Surface cracks | Corrosive fatigue | Temperature fluctuations | ||
| 3 | Evaporator | Fractured | Brittle fracture | Low temperature |
| Ice outgrowths | Ice formation | Low temperature | ||
| Shrunk | Thermal contraction | Low temperature | ||
| Corroded | Corrosive fatigue | Temperature fluctuations | ||
| Surface cracks | Corrosive fatigue | Temperature fluctuations | ||
| 4 | Glycol–water heat exchanger | Fractured | Thermal fatigue | Temperature fluctuations |
| Corroded | Corrosive attack | Corrosive contaminant | ||
| Perforated | Corrosive attack | Corrosive contaminant | ||
| Shrunk | Thermal contraction | Low temperature | ||
| Expanded | Thermal expansion | Temperature difference | ||
| 5 | Valve actuator | Open circuit | Tensile fracture | Transient mechanical load |
| Fractured | Brittle fracture | Low temperature | ||
| Seized | Abrasive wear | Insufficient lubricant | ||
| 6 | Valve control unit | Short circuit | Thermal degradation | High temperature |
| Open circuit | Tensile fracture | Transient mechanical load | ||
| 7 | Valve body | Fractured | Brittle fracture | High mechanical load |
| Blocked | Silting | Contaminated input flow | ||
| 8 | LNG valve actuator | Ice outgrowths | Ice formation | Low temperature |
| Open circuit | Tensile fracture | Transient mechanical load | ||
| Fractured | Brittle fracture | Low temperature | ||
| 9 | LNG valve control unit | Short circuit | Thermal degradation | High temperature |
| Open circuit | Tensile fracture | Transient mechanical load | ||
| 10 | LNG valve body | Frozen | Ice formation | Low temperature |
| Fractured | Brittle fracture | High mechanical load | ||
| 11 | Sensors | Open circuit | Burnout | Short circuit |
| Electrical potential decreased | Burnout | Short circuit | ||
| Dielectric strength decreased | Dielectric breakdown | Line defects or over-voltage | ||
| 12 | Natural gas filter | Blocked | Silting | Contaminated input flow |
| No. | Component | Functions |
|---|---|---|
| 1 | LNG Tank | Store/Provide LNG |
| 2 | PBU | Convert LNG, Regulate Pressure |
| 3 | Evaporator | Convert LNG, Regulate Pressure |
| 4 | Glycol-Water Heat Exchanger | Regulate LNG Supply, Increase Water Flow |
| 5 | Natural Gas Valve Actuator | Convert Amplitude to Mechanical Energy |
| 6 | Natural Gas Valve Control Unit | Convert Data to Amplitude |
| 7 | Natural Gas Valve Body | Regulate the Flow |
| 8 | LNG Valve Actuator | Convert Amplitude to Mechanical Energy |
| 9 | LNG Valve Control Unit | Convert Data to Amplitude |
| 10 | LNG Valve Body | Regulate the Flow |
| 11 | Temperature and Pressure Sensors | Convert Amplitude to Data |
| 12 | Natural Gas Filter | Regulate NG Supply, Decontamination |
| No. | Component | Flow Property | Functional Failure Response |
|---|---|---|---|
| 1 | LNG tank | Pressure | Low and High |
| 2 | Pressure build-up unit | Pressure | Low |
| 3 | Evaporator | Pressure and Temperature | Low |
| 4 | Glycol-water heat exchanger | Pressure and Temperature | Low |
| 5 | Valve actuators | Mechanical energy | Low |
| 6 | Valve control units | Amplitude | Low |
| 7 | Valve bodies | Pressure | Low |
| 8 | Pressure sensors | Data | Low and High |
| 9 | Temperature sensor | Data | Low and High |
| 10 | Natural gas filter | Pressure | Low |
| No | Component | Function | Failure Mode | Causes of failure | Failure end effect | Detection method | Criticality | |||||
|---|---|---|---|---|---|---|---|---|---|---|---|---|
| Functional Failure | Fault | Mechanism | Cause | O | S | D | RPN | |||||
| 1 | LNG tank | Stores the LNG | Overpressure | High boil-off gas evaporation rate | - | Heat penetration into the fuel tank | To vent the excessive boil-off gas | LNG pressure sensor | 3 | 4 | 1 | 12 |
| 2 | Pressure build-up unit | Maintains the pressure inside the LNG tank | Disrupted natural gas supply to the LNG tank | Fractured | Brittle fracture | Low temperature | To stop the entire system | LNG pressure sensor | 4 | 8 | 4 | 128 |
| Ice outgrowths | Ice formation | Low temperature | ||||||||||
| Shrunk | Thermal contraction | Low temperature | ||||||||||
| Corroded | Corrosive fatigue | Temperature fluctuations | ||||||||||
| Surface cracks | Corrosive fatigue | Temperature fluctuations | ||||||||||
| 3 | Evaporator | Converts LNG to natural gas at the desired temperature | Low natural gas temperature | Fractured | Brittle fracture | Low temperature | To stop the entire system | Temperature sensor | 4 | 8 | 4 | 128 |
| Ice outgrowths | Ice formation | Low temperature | ||||||||||
| Shrunk | Thermal contraction | Low temperature | ||||||||||
| Corroded | Corrosive fatigue | Temperature fluctuations | ||||||||||
| Surface cracks | Corrosive fatigue | Temperature fluctuations | ||||||||||
| 4 | Glycol-water heat exchanger | Increases the temperature of the natural gas | Low natural gas temperature & pressure | Fractured | Thermal fatigue | Temperature fluctuations | To stop the entire system | Temperature & Pressure sensors | 3 | 8 | 3 | 72 |
| Corroded | Corrosive attack | Corrosive contaminant | ||||||||||
| Perforated | Corrosive attack | Corrosive contaminant | ||||||||||
| Shrunk | Thermal contraction | Low temperature | ||||||||||
| Expanded | Thermal expansion | Temperature difference | ||||||||||
| 5 | Natural gas valve assembly | Regulates the flow of natural gas via control signal | Controller malfunction | Short circuit | Thermal degradation | High temperature | To stop the entire system | Natural gas temperature sensor | 2 | 8 | 3 | 48 |
| Open circuit | Tensile fracture | Transient mechanical load | ||||||||||
| Actuator malfunction | Open circuit | Tensile fracture | Transient mechanical load | |||||||||
| Valve body malfunction | Seized | Abrasive wear | Insufficient lubricant | |||||||||
| Fractured | Brittle fracture | High mechanical load | ||||||||||
| Blocked | Silting | Contaminated input flow | ||||||||||
| 6 | Glycol-water valve assembly | Regulates the flow of glycol-water via control signal | Controller malfunction | Short circuit | Thermal degradation | High temperature | To stop the entire system | Natural gas temperature sensor | 2 | 8 | 3 | 48 |
| Open circuit | Tensile fracture | Transient mechanical load | ||||||||||
| Actuator malfunction | Open circuit | Tensile fracture | Transient mechanical load | |||||||||
| Fractured | Brittle fracture | Low temperature | ||||||||||
| Valve body malfunction | Seized | Abrasive wear | Insufficient lubricant | |||||||||
| Fractured | Brittle fracture | High mechanical load | ||||||||||
| Blocked | Silting | Contaminated input flow | ||||||||||
| 7 | Shut-off valve | Blocks the flow of natural gas via control signal | Controller malfunction | Short circuit | Thermal degradation | High temperature | Failure to stop the supply of natural gas to the engine | Human perception, Natural gas pressure sensor | 2 | 10 | 2 | 40 |
| Open circuit | Tensile fracture | Transient mechanical load | ||||||||||
| Valve body malfunction | Seized | Abrasive wear | Insufficient lubricant | |||||||||
| Fractured | Brittle fracture | High mechanical load | ||||||||||
| Corroded | Corrosive fatigue | Insufficient lubricant | ||||||||||
| 8 | LNG valve assembly | Regulates the flow of LNG via control signal | Controller malfunction | Short circuit | Thermal degradation | High temperature | To stop the entire system | LNG pressure sensor | 5 | 8 | 3 | 120 |
| Open circuit | Tensile fracture | Transient mechanical load | ||||||||||
| Actuator malfunction | Ice outgrowths | Ice formation | Low temperature | |||||||||
| Open circuit | Tensile fracture | Transient mechanical load | ||||||||||
| Fractured | Brittle fracture | Low temperature | ||||||||||
| Valve body malfunction | Frozen | Ice formation | Low temperature | |||||||||
| Fractured | Brittle fracture | High mechanical load | ||||||||||
| 9 | Pressure sensor | Measures the pressure inside the LNG tank | Faulty measurement | Open circuit | Burnout | Short circuit | To stop the entire system | Incomplete engine combustion | 2 | 8 | 8 | 128 |
| Electrical potential decreased | Burnout | Short circuit | ||||||||||
| Dielectric strength decreased | Dielectric breakdown | Line defects or Over voltage | ||||||||||
| 10 | Temperature sensor | Measures the temperature of the natural gas coming from the evaporator | Faulty measurement | Open circuit | Burnout | Short circuit | To stop the entire system | Incomplete engine combustion | 2 | 8 | 8 | 128 |
| Electrical potential decreased | Burnout | Short circuit | ||||||||||
| Dielectric strength decreased | Dielectric breakdown | Line defects or Over voltage | ||||||||||
| 11 | Natural gas filter | Cleans natural gas from impurities | Natural gas filter blocked | Blocked | Silting | Contaminated input flow | Natural gas flow pressure drop | Pressure sensor, regular maintenance | 1 | 4 | 2 | 8 |
| Top Event | Reduction |
|---|---|
| Fuel System Shut Down | 69% |
| Temperature Drop | 97% |
| Pressure Drop | 46% |
Publisher’s Note: MDPI stays neutral with regard to jurisdictional claims in published maps and institutional affiliations. |
© 2021 by the authors. Licensee MDPI, Basel, Switzerland. This article is an open access article distributed under the terms and conditions of the Creative Commons Attribution (CC BY) license (http://creativecommons.org/licenses/by/4.0/).
Share and Cite
Milioulis, K.; Bolbot, V.; Theotokatos, G. Model-Based Safety Analysis and Design Enhancement of a Marine LNG Fuel Feeding System. J. Mar. Sci. Eng. 2021, 9, 69. https://doi.org/10.3390/jmse9010069
Milioulis K, Bolbot V, Theotokatos G. Model-Based Safety Analysis and Design Enhancement of a Marine LNG Fuel Feeding System. Journal of Marine Science and Engineering. 2021; 9(1):69. https://doi.org/10.3390/jmse9010069
Chicago/Turabian StyleMilioulis, Konstantinos, Victor Bolbot, and Gerasimos Theotokatos. 2021. "Model-Based Safety Analysis and Design Enhancement of a Marine LNG Fuel Feeding System" Journal of Marine Science and Engineering 9, no. 1: 69. https://doi.org/10.3390/jmse9010069
APA StyleMilioulis, K., Bolbot, V., & Theotokatos, G. (2021). Model-Based Safety Analysis and Design Enhancement of a Marine LNG Fuel Feeding System. Journal of Marine Science and Engineering, 9(1), 69. https://doi.org/10.3390/jmse9010069