Article

Estimation of Propagation Speed and Direction of Nonlinear Internal Waves from Underway and Moored Measurements

1
School of Earth and Environmental Sciences, College of Natural Sciences, Seoul National University, Seoul 08826, Korea
2
Research Institute of Oceanography, College of Natural Sciences, Seoul National University, Seoul 08826, Korea
*
Author to whom correspondence should be addressed.
J. Mar. Sci. Eng. 2021, 9(10), 1089; https://doi.org/10.3390/jmse9101089
Submission received: 1 September 2021 / Revised: 2 October 2021 / Accepted: 2 October 2021 / Published: 6 October 2021

Abstract

:
Propagation speed and direction of nonlinear internal waves (NLIWs) are important parameters for understanding the generation and propagation of waves, and ultimately clarifying regional ocean circulation. However, these parameters cannot be directly measured from in-situ instruments, but can only be estimated from post-processing in situ data. Herein, we present two methods and an optimal approach to estimate the propagation speed and direction of waves using underway and moored observations. The Doppler shift method estimates these parameters from apparent observations concerning a moving ship using the Doppler shift induced by the changing relative distance of the NLIWs from the moving ship. The time lag method estimates the parameters using the distance between two locations of the NLIW observed at different times and the time lag. To optimize the speed and direction of NLIWs, the difference in the propagation direction independently estimated by the two methods needs to be minimized concerning the optimal propagation speed to yield the optimal propagation direction. The methods were applied to two cases observed in the northern East China Sea in May 2015 and August 2018. This study has practical significance for better estimating the propagation speed and direction of NILWs particularly over a broad continental shelf.

1. Introduction

Nonlinear internal waves (NLIWs) are ubiquitous in stratified seas and are accompanied by isopycnal fluctuations with a sharp vertical density gradient. They play an important role in underwater acoustics, regional circulation, local biogeochemistry, and energetics, mostly via vertical mixing in the stages of generation, propagation, evolution, and dissipation. NLIWs affect the transportation of momentum, heat, and energy via turbulent dissipation and mixing [1,2,3,4,5]. Marine ecosystems are significantly influenced by vertical nutrient supply, chlorophyll bloom, and biological redistribution, which can be modulated by NLIWs [6,7,8,9]. The NLIWs drive sediment resuspension and transportation; thus, they affect marine geophysics and underwater acoustics [10,11,12,13,14,15]. Vertical isopycnal displacements, which allow the wave amplitude to be defined, and propagation speed and direction, are fundamental parameters of NLIWs that are useful, but cannot be directly measured from in situ sampling, for a clear understanding of their generation, propagation, evolution, and dissipation. Estimating the propagation speed and direction can be important for assessing regional ocean circulation, biogeochemical cycles, energetics, underwater acoustics, and the dynamics of NLIWs.
Methods to estimate the propagation speed and direction have been suggested but are mostly limited by sampling strategies that have not yet been validated. The most common method using multiple moorings aligned in the propagation direction of NLIWs aims to divide the distance between the mooring locations by the arrival time differences [16,17,18,19,20,21,22]. However, it is not practical to deploy many moorings along the ray of NLIWs, particularly where the continental shelf is wide and multiple NLIWs are generated from multiple sources with different unknown propagation directions. Another method is to use the principal direction of the wave-induced horizontal velocity and the temporal difference of enhanced echo intensity from acoustic Doppler current profiler (ADCP) measurements [23,24,25,26,27]. This method is useful, but not very practical, as extracting the propagation speed and direction is not straightforward. Using remote sensors, such as synthetic aperture radar (SAR) and spectroradiometer, the propagation speed and direction can be estimated from the horizontal curvature of satellite images [28,29,30,31,32]; however, the limited spatiotemporal satellite sampling from polar orbits does not allow NLIWs to be easily detected. Therefore, it is necessary to develop a method to estimate the propagation speed and direction of NLIWs from widely used ship-based in situ measurements.
In the northern East China Sea (ECS), NLIWs are mainly formed by strong tidal forces that interact with bathymetric features. NLIWs in this region have been observed in association with strong semidiurnal internal tides over slope areas in the southern and southeastern parts of the ECS [33] and local lee-wave generation by small islands and seamounts near Jeju Island and the Ieodo Ocean Research Station (IORS) in the northern ECS [34,35,36] (Figure 1). Unlike the typical setting where dominant first-mode NLIWs in a two-layered condition propagate from the shelf break towards the coast, high NLIW modes propagating in multiple directions from multiple sources have been identified in the northern ECS [34,37].
Herein, we present a new method for estimating the propagation speed and direction of NLIWs using both moored and underway measurements, and the results of applying the method to two cases of NLIWs observed in the northern ECS in May 2015 and August 2018 (Figure 1).

2. Data and Methods

2.1. Data and Processing

Shallow-water Acoustic Variability EXperiment 2015 (SAVEX15) was conducted on 14–28 May 2015, focusing on a relatively small area (water depth: ~100 m , area shown in Figure 1a,b) in the northern ECS [38,39,40,41,42]. During the experiment, two moorings (vertical line arrays [VLAs]) and underway conductivity–temperature–depth (UCTD) instruments were used to collect moored temperature (with no conductivity) time series at multiple depths and vertical profiles [43]. The two moorings (VLA1 and VLA2) deployed at water depths of 101 and 102 m , were horizontally separated by ~5.5 km ; 25 temperature loggers and 5 Star-Oddi temperature–depth–tilt sensors were attached at nominal depths of 2–80 m with an interval of 1–5 m . The sampling time interval of the moored temperature sensors was 30 s .
Ieodo Ocean Research Station 2018 (IORS18) was conducted in the northern ECS in the vicinity of IORS (32°7.4′ N, 125°10.9′ E, constructed at a water depth of 41 m) on 28 August–1 September 2018 (Figure 1a,c). During the IORS18 experiment, UCTD was used to collect ship-based vertical profiles of temperature and salinity and the IORS-based time series of temperature and pressure data observed at nominal depths of 2, 5, 11, 16, 22, 32, and 37 m , with a typical sampling time interval of 60 s [44].
The depths of the moored temperature sensors attached to the VLAs were corrected using the tilt and pressure data recorded by five Star-Oddi temperature–depth–tilt sensors. After the removal of outliers, the moored temperature data were vertically interpolated using the Akima spline method [45] at 1 m intervals. The UCTD data were processed following the method described by Ullman and Herbert [46], except for the alignment process to correct the mismatch due to different time delays of the conductivity and temperature sensors. The raw temperature and conductivity measured by the UCTD were filtered with a cut-off period of four scans (0.25 s ). The raw pressure measured using the UCTD was filtered with a cut-off period of 32 scans (2 s ). The time delay between the conductivity and temperature sensors was corrected using lagged correlation. Then, spikes in the salinity data were removed by aligning the data of the temperature and conductivity sensors. After the alignment processing, the data were corrected for the effect of viscous heating and finally vertically averaged over 1 d b a r bin.
To discuss the theoretical propagation speed of NLIWs in the northern ECS in the context of long-term and interannual variations, vertical profiles of temperature and salinity routinely observed every other month from 1990 to 2019, at two hydrographic stations of the National Institute of Fisheries Science (NIFS), Republic of Korea, were used in this study (red open circles in Figure 1a). To ensure the quality of the temperature and salinity data, vertical profiles containing unreasonable values (both global and local) were removed. Quality control procedures, such as the spike and gradient tests, were applied to extract reliable salinity and temperature profiles. Because the profiles are only available at standard depths (i.e., surface, 10, 20, 30, 50, 75, 100, 125, 150, 200, and 250 m ), linear interpolation was conducted to determine data at 1 m vertical intervals [47].
Moderate resolution imaging spectroradiometer (MODIS) sensors onboard the National Aeronautics and Space Administration (NASA) satellites Terra and Aqua, provided true-color images from calibrated, corrected, and geo-located radiance (Level-1 B) data, with a spatial resolution of 250 m . As NLIWs induce the divergence and convergence of sea surface currents as they propagate, thereby modifying the sea surface roughness, they are visible in MODIS true-color images if they are in a sun-glint area [48]. In this study, two images obtained by MODIS Terra on 2 August 2015, and MODIS Aqua on 30 July 2018, were used to estimate the propagation direction of NLIWs from sea surface manifestations.

2.2. Methods

2.2.1. Two-Layered KdV (Korteweg-de Vries) Theories

In classical KdV theory [49], a leading-order weak non-linearity and dispersion are competing but comparable to each other. For the two-layered KdV theory, the thicknesses ( h 1 , h 2 ) and densities ( ρ 1 , ρ 2 ) of the upper and lower layers can be used to estimate the parameters of mode-1 NLIWs, including linear phase speed c K d V . l , theoretical propagation speed c K d V . i w , characteristic width 2 Δ K d V . i w , nonlinear parameter α , and dispersion parameter β , yielding the wave equation as follows [14,50]:
η t + c K d V . l η x + α η η x + β 3 η x 3 = 0 ,
where η , t , and x are the vertical displacement of the isopycnals (or isotherms), time, and horizontal coordinates, respectively. The c K d V . l , α , and β can be estimated using the density stratification parameters ( ρ 1 , ρ 2 , h 1 , and h 2 ) in a two-layered system as follows:
c K d V . l = g ρ 2 ρ 1 ( ρ 1 + ρ 2 ) / 2 h 1 h 2 ( h 1 + h 2 ) ,
α = 3 2 c K d V . l h 1 h 2 ρ 2 h 1 2 ρ 1 h 2 2 ρ 2 h 1 + ρ 1 h 2 ,
β = c K d V . l h 1 h 2 6 ρ 1 h 1   + ρ 2 h 2   ρ 2 h 1 + ρ 1 h 2 .
Here, g is the gravity acceleration set to 9.80 m   s 2 . The thicknesses of the upper and lower layers ( h 1 and h 2 ) were determined based on the depth of the maximum density gradient from the density profiles obtained from the UCTD. The densities at the upper and lower layers ( ρ 1 and ρ 2 , respectively) were determined as the minimum density within the upper layer and the maximum density within the lower layer, respectively. The solution of Equation (1) for the displacement η ( x , t ) yields the nonlinear soliton as follows:
η ( x , t ) = η 0 sech 2 ( x c K d V . i w t Δ K d V . i w ) .
Here, the theoretical propagation speed c K d V . i w and characteristic width 2 Δ K d V . i w were calculated from the linear phase speed c K d V .   l and the amplitude ( η 0 ) of the vertical displacement of η are as follows:
c K d V . i w = c K d V .   l + | α | η 0 3 ,
2 Δ K d V . i w = 2 ( 12 β | α | η 0 ) 1 / 2 .
By considering cubic nonlinearity, Equation (1) becomes as follows, yielding the extended KdV (eKdV) theory [51]:
η t + c K d V . l η x + α η η x + α 1 η 2 η x + β 3 η x 3 = 0 .
Here, α 1 = 3 c K d V . l ( h 1 h 2 ) 2 [ 7 8 ( ρ 2 h 1 2 ρ 1 h 2 2 ρ 2 h 1 + ρ 1 h 2 ) 2 ( ρ 2 h 1 3 + ρ 1 h 2 3 ρ 2 h 1 + ρ 1 h 2 ) ] is a cubic nonlinear parameter in the two-layer system. The theoretical propagation speed c e K d V . i w and characteristic width 2 Δ e K d V . i w based on the eKdV theory in the two-layered system are as follows:
c e K d V . i w = c K d V .   l + | α | η 0 3 + α 1 η 0 2 6 ,
2 Δ e K d V . i w = 2 ( 12 β | α | η 0 + 0.5 α 1 η 0 2 ) 1 / 2 .

2.2.2. Doppler Shift Method

To estimate the propagation direction of NLIWs using the Doppler shift caused by propagating NLIWs observed from a moving ship, the theoretical propagation speed c K d V . i w and ship speed v s h were assumed to be constant during the measurement period, and the propagation direction was assumed to be orthogonal to the constant phase lines parallel to the wavefront lines (Figure 2a,b). As the estimated propagation direction ϕ d s is in reference to the ship course ϕ s h , the apparent propagation speed c a p can be represented as the difference between c K d V . i w and the ship speed in direction θ d s as follows:
c a p = c K d V . i w v s h cos ( θ d s ) .
Here, θ d s = | ϕ s h ϕ d s | is the angular difference between the ship course and the propagation direction of the NLIWs. Because the Doppler-shifted apparent frequency f a p or the inverse of the apparent period T a p can be represented by c a p and c i w = λ K d V . i w f i w , where λ K d V . i w is the wavelength of the NLIWs and the Doppler equation f a p = f i w c a p c i w [52], the following equation can be used to estimate the ϕ d s :
1 T a p = f a p = f i w c a p c i w = c a p λ K d V . i w .
Here, T a p is determined from measurements (Table 1), while λ K d V . i w is determined by the Cnoidal model [50] as
λ K d V . i w = 2 Δ K d V . i w K ( s ) 3.7 Δ K d V . i w ,
where K ( s ) is a complete elliptic integral of the first kind and parameter s is set to 0.5. Equation (11) can then be rewritten using Equation (12) as follows:
c K d V . i w v s h cos | ϕ s h ϕ d s | = f a p λ K d V . i w .
Further, the ϕ d s is obtained as follows:
ϕ d s = ϕ s h ± cos 1 ( c K d V . i w f a p λ K d V . i w v s h ) .
The propagation direction of the NLIWs estimated using the method described above has an angular ambiguity caused by the sign of the arccosine part. Thus, a physically reasonable direction between the two was selected. The ϕ d s and ϕ s h are angles in degrees measured counter-clockwise from the east (for example, 180 ° and 270 ° correspond to the westward and southward directions, respectively).

2.2.3. Time Lag Method

Independent of the method described in Section 2.2.2, the propagation direction of NLIWs was estimated using the distance between two locations of the NLIW front observed at different times, with the assumption that the NLIWs propagate across the two measurement locations with an angle orthogonal to the constant phase lines at a constant speed (Figure 2a,c). The observed propagation speed was estimated by dividing the distance between the two locations D o b s by the arrival time lag T o b s , for example, c o b s = D o b s T o b s . Then, c K d V . i w was calculated from c o b s and angular difference θ t l = | ϕ o b s ϕ t l | between ϕ o b s (direction from the first measurement location to the second measurement location) and the propagation direction of NLIWs ϕ t l as
c K d V . i w = c o b s cos ( θ t l ) = D o b s T o b s cos ( | ϕ o b s ϕ t l | ) .
Finally, the ϕ t l was obtained from Equation (16) as
ϕ t l = ϕ o b s ± cos 1 ( c K d V . i w T o b s D o b s ) .
The propagation direction estimated using the method described above (time lag method) also has an angular ambiguity caused by the sign of the arccosine part. Thus, a physically reasonable direction is selected. The ϕ t l and ϕ o b s are angles in degrees measured counter-clockwise from the east.

2.2.4. Estimation of Propagation Speed and Direction

Two propagation directions of NLIWs estimated from the two methods were used to estimate the optimal propagation direction and successive propagation speed. First, a consistent direction between the two directions derived from each method was selected to minimize the ambiguity where the two methods yield angular difference | ϕ d s ϕ t l | typically less than 30 ° . For example, each one (bold green and blue colors in Figure 2b,c) among two ϕ d s and two ϕ t l are selected as more consistent between the two methods and physically reasonable, while inconsistent ϕ d s and ϕ t l (deemed green and blue colors in Figure 2b,c) among the two ϕ d s and two ϕ t l were not selected. To optimize the propagation speed and direction, the difference in consistent propagation directions from the two methods | ϕ d s ϕ t l | was minimized by iteratively changing c K d V . i w at intervals of 0.01 m · s 1 instead of using the constant propagation speed derived from the two-layered KdV theory. The updated propagation speed was determined from the iterations, and the final propagation direction of NLIWs ϕ i w was determined by averaging the two directions ( ϕ d s + ϕ t l ) / 2 when | ϕ d s ϕ t l | reached its minimum value for the updated propagation speed. Iterations were performed for a range of 30% deviation from c K d V . i w (typically requiring 38 iterations to reach the minimum), which is comparable to the range of the interannual variation of propagation speed reported in a previous study [47], as discussed in Section 4.

2.2.5. Estimation of Propagation Direction Using Satellite Images

The propagation directions from the MODIS images (Figure 3) were estimated from the horizontal curvature of the leading fronts from the sea surface manifestations [28]. The propagation direction was calculated by the direction of the center of the straight line connecting the endpoints of the manifestations to the center of the arc for the manifestations. For example, a manifestation of NLIW is shown in the blue box in Figure 3a,c. The orange curvature line from both endpoints (Points A and B) is the leading front of the NLIW. Point C is the center of line AB. Point D is the center of the arc AB. In this case, the angle between the vectors from C to D, measured counter-clockwise from the east, is the propagation direction.

3. Applications

3.1. SAVEX15

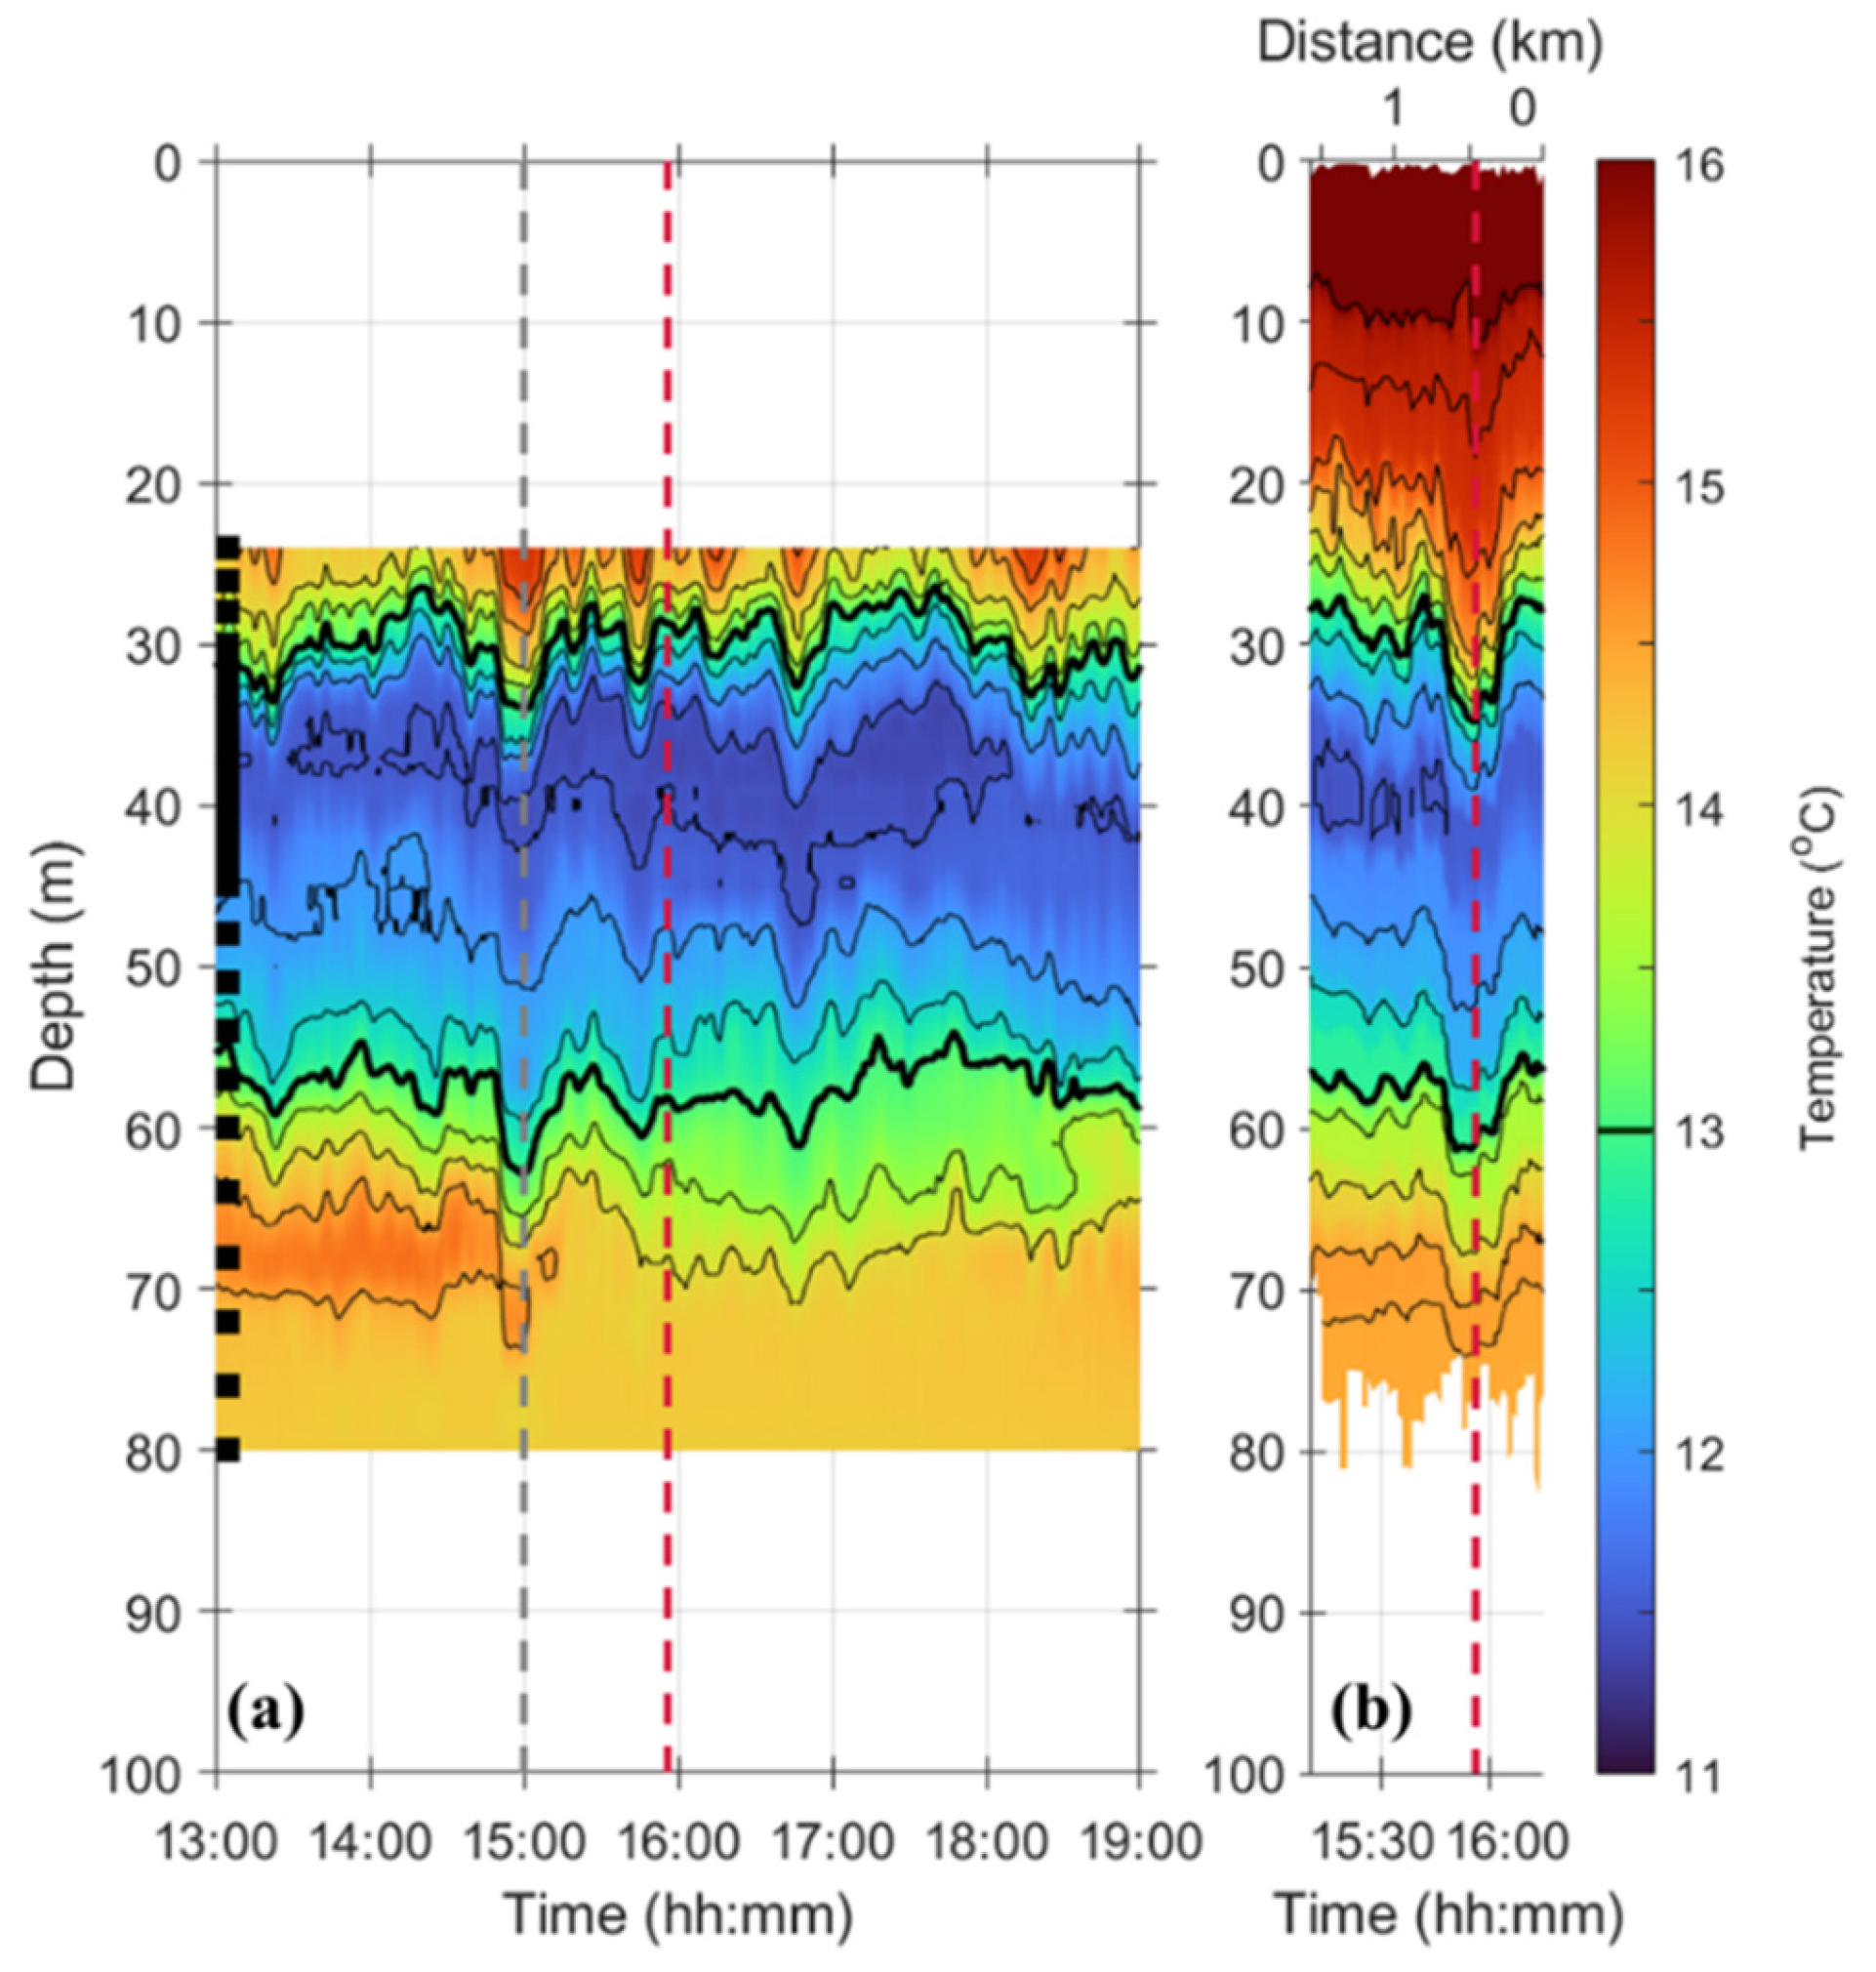
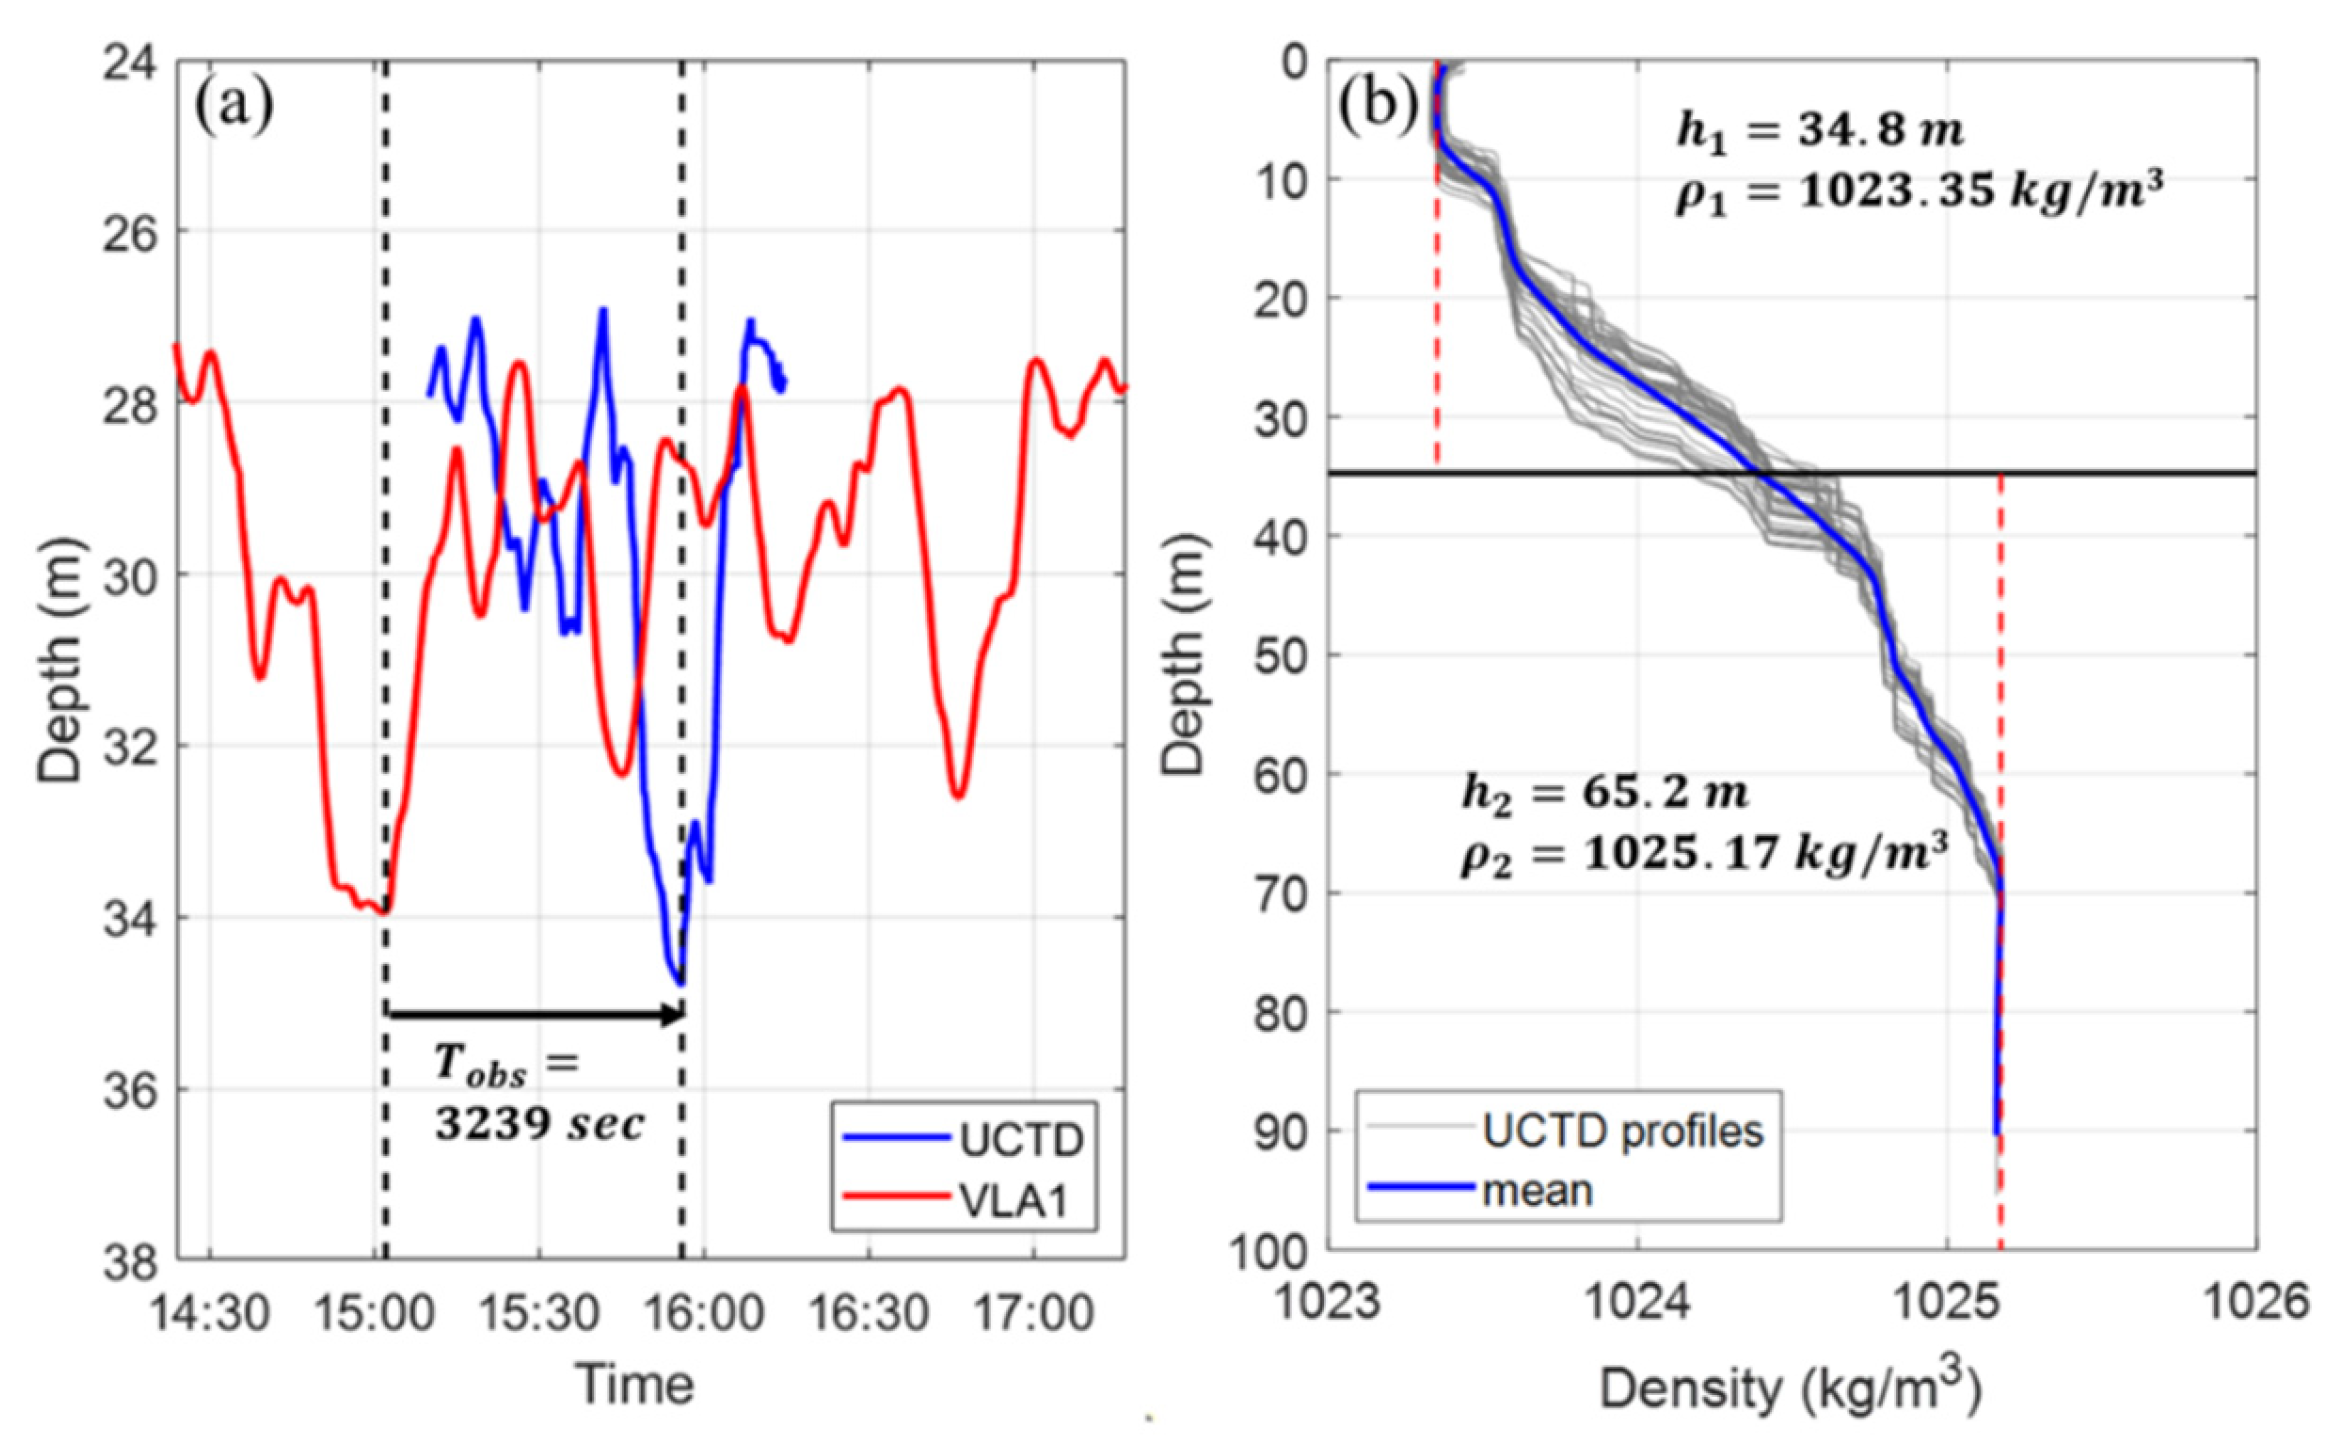
On 23 May 2015 during the SAVEX15, the existence of NLIWs was confirmed from a series of UCTD profiling measurements, for example, at 15:56 UTC (vertical red dashed line in Figure 4b), and the time-depth pattern of temperature variations observed at the northern mooring VLA1 at 15:02 UTC (vertical grey dashed line in Figure 4a). The NLIW was observed at VLA1 3239 s earlier than that observed in the UCTD measurements (Figure 4 and Figure 5a). The 13 °C isotherm displacements, derived from the UCTD and VLA1 observations, commonly range from 27 to 35 m (Figure 5a). The NLIW has an amplitude ( η 0 ) of 6.1 and 5.9 m estimated from UCTD and VLA1 observations, respectively (Figure 4 and Figure 5a). The two-layered theoretical parameters of the NLIWs are listed in Table 1, along with the estimated parameters, where the upper and lower layer densities ( ρ 1 and ρ 2 ) are 1023.35 and 1025.17 kg · m 3 , respectively, and the upper and lower layer thicknesses ( h 1 and h 2 ) are 34.8 and 65.2 m , respectively (Figure 5b and Table 1).
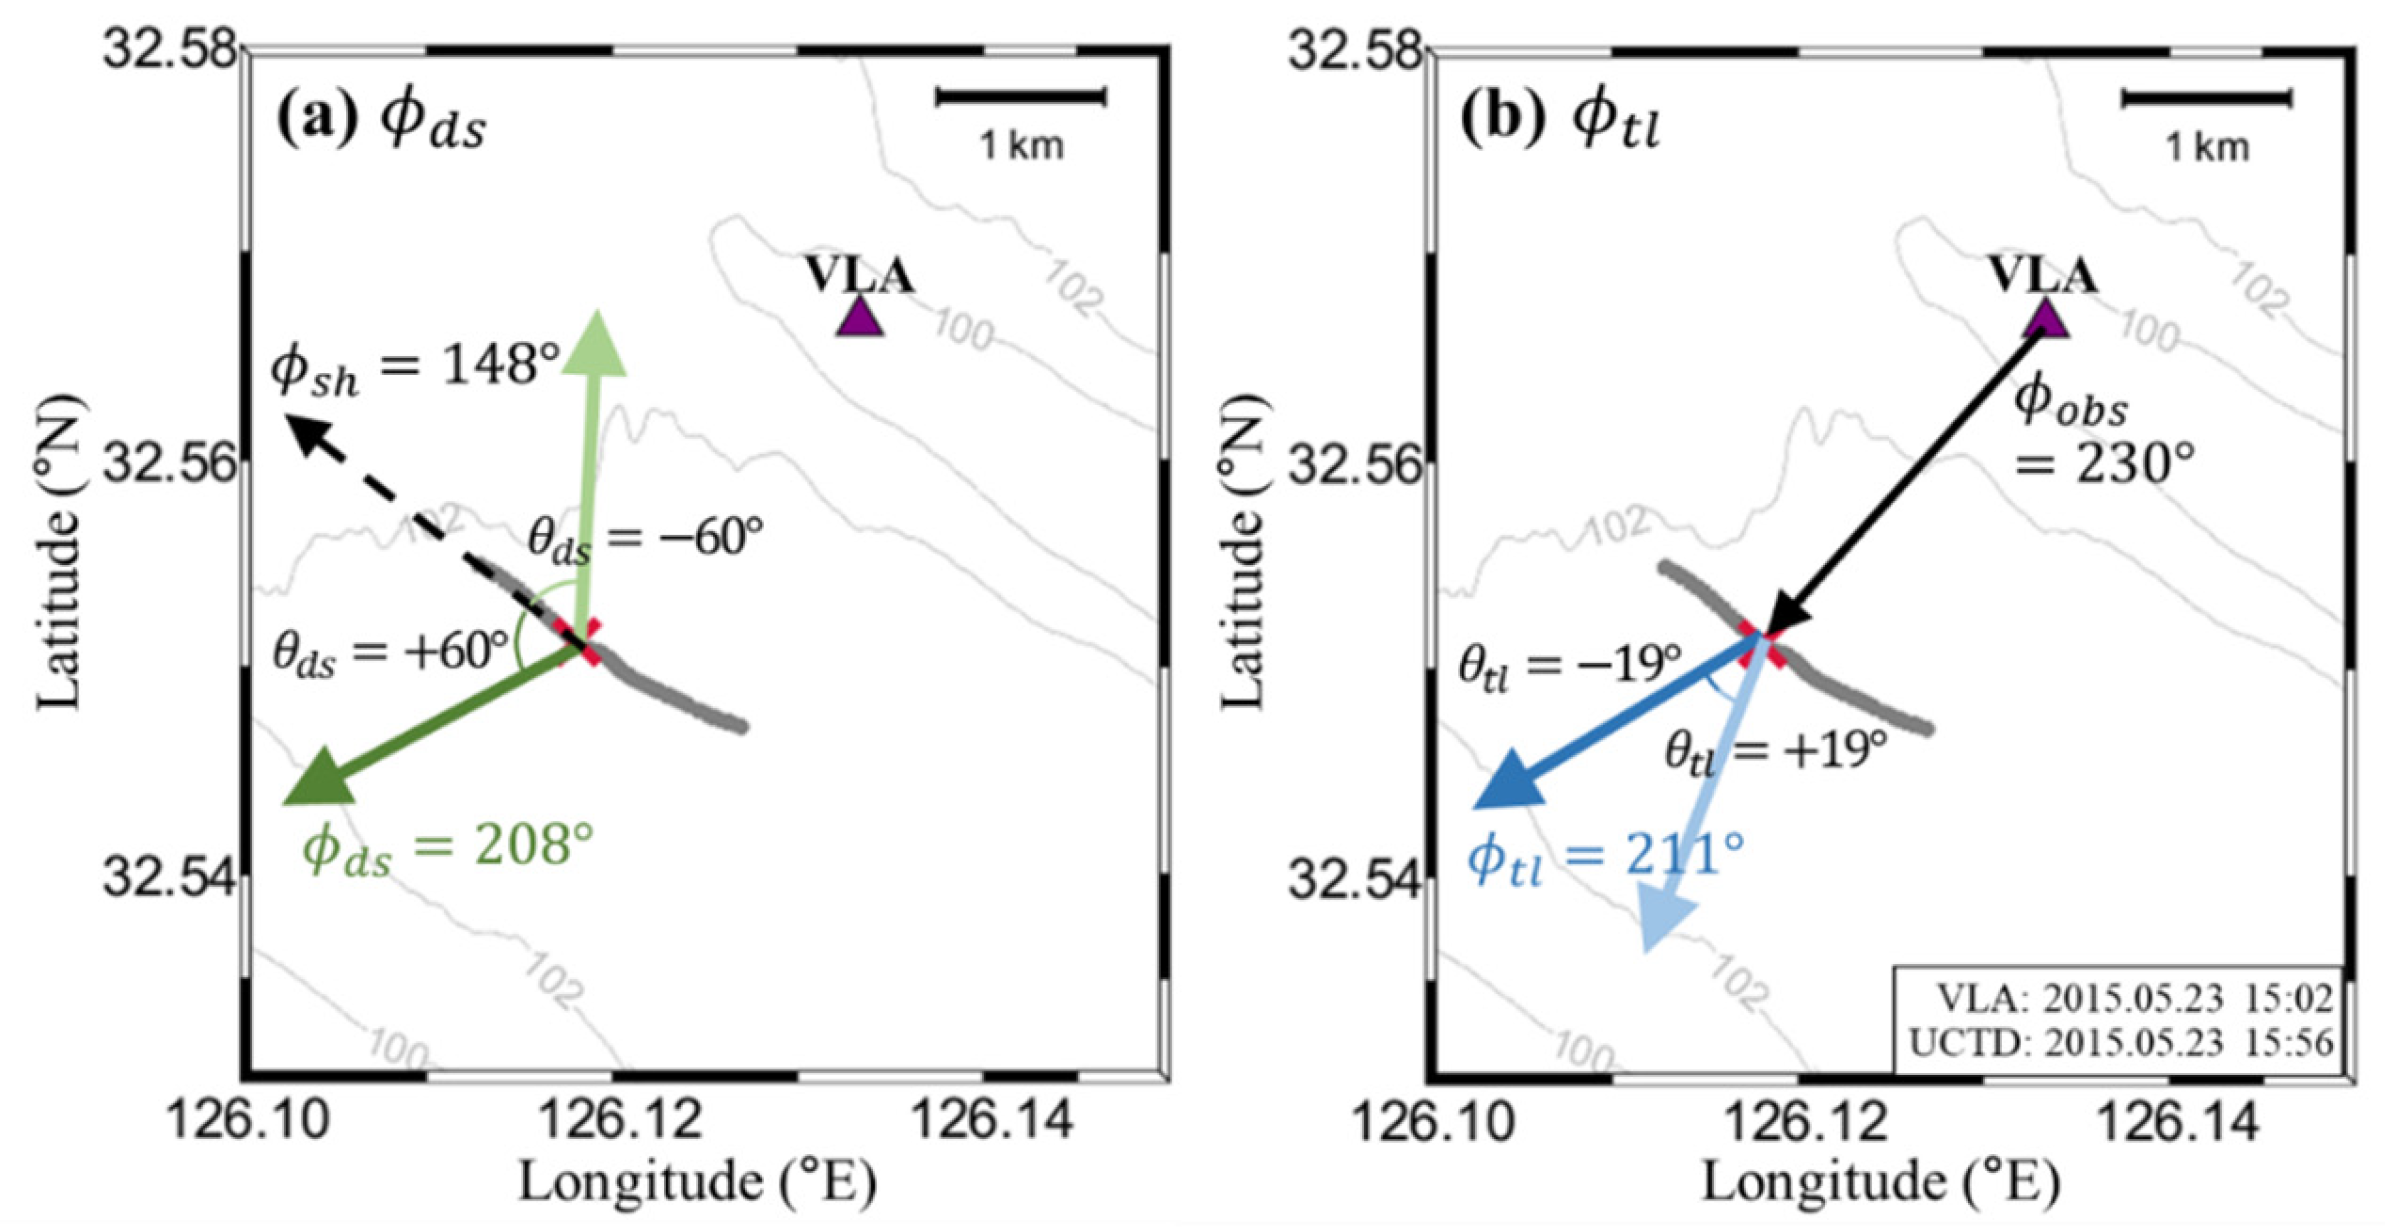
When the ship moved at a speed of 0.47 m · s 1 and a direction of 148 ° (northwestward), the apparent propagation direction ϕ d s of NILWs had an angular difference θ d s of ± 60 ° with ship course ϕ s h (Figure 6a), derived from the Doppler shift method using Equation (15), resulting in ϕ d s = 208 ° (southwestward) or ϕ d s = 88 ° (northward). From the distance ( D o b s = 2233 m ) between the two measurement locations (VLA1 and ship) and the time lag of the NLIW arrivals ( T o b s = 3239 s ), the observed propagation direction of NILWs ϕ t l was estimated to have an angular difference θ t l of ± 19 ° with ϕ o b s (Figure 6b), derived from the time lag method using Equation (17), resulting in ϕ t l = 211 ° (southwestward) or ϕ t l = 249 ° (slightly more southwestward). Thus, more consistent propagation directions of ϕ d s = 208 ° and ϕ t l = 211 ° were selected to optimize the propagation speed and direction. By minimizing | ϕ t l ϕ d s | , the optimal propagation speed ( c i w ) of 0.64 m · s 1 was derived from the iterative calculations, yielding ϕ d s = 208 ° and ϕ t l = 211 ° with | ϕ t l ϕ d s | = 3 ° , and the resultant propagation direction ( ϕ i w ) of 210 ° (southwestward).

3.2. IORS18

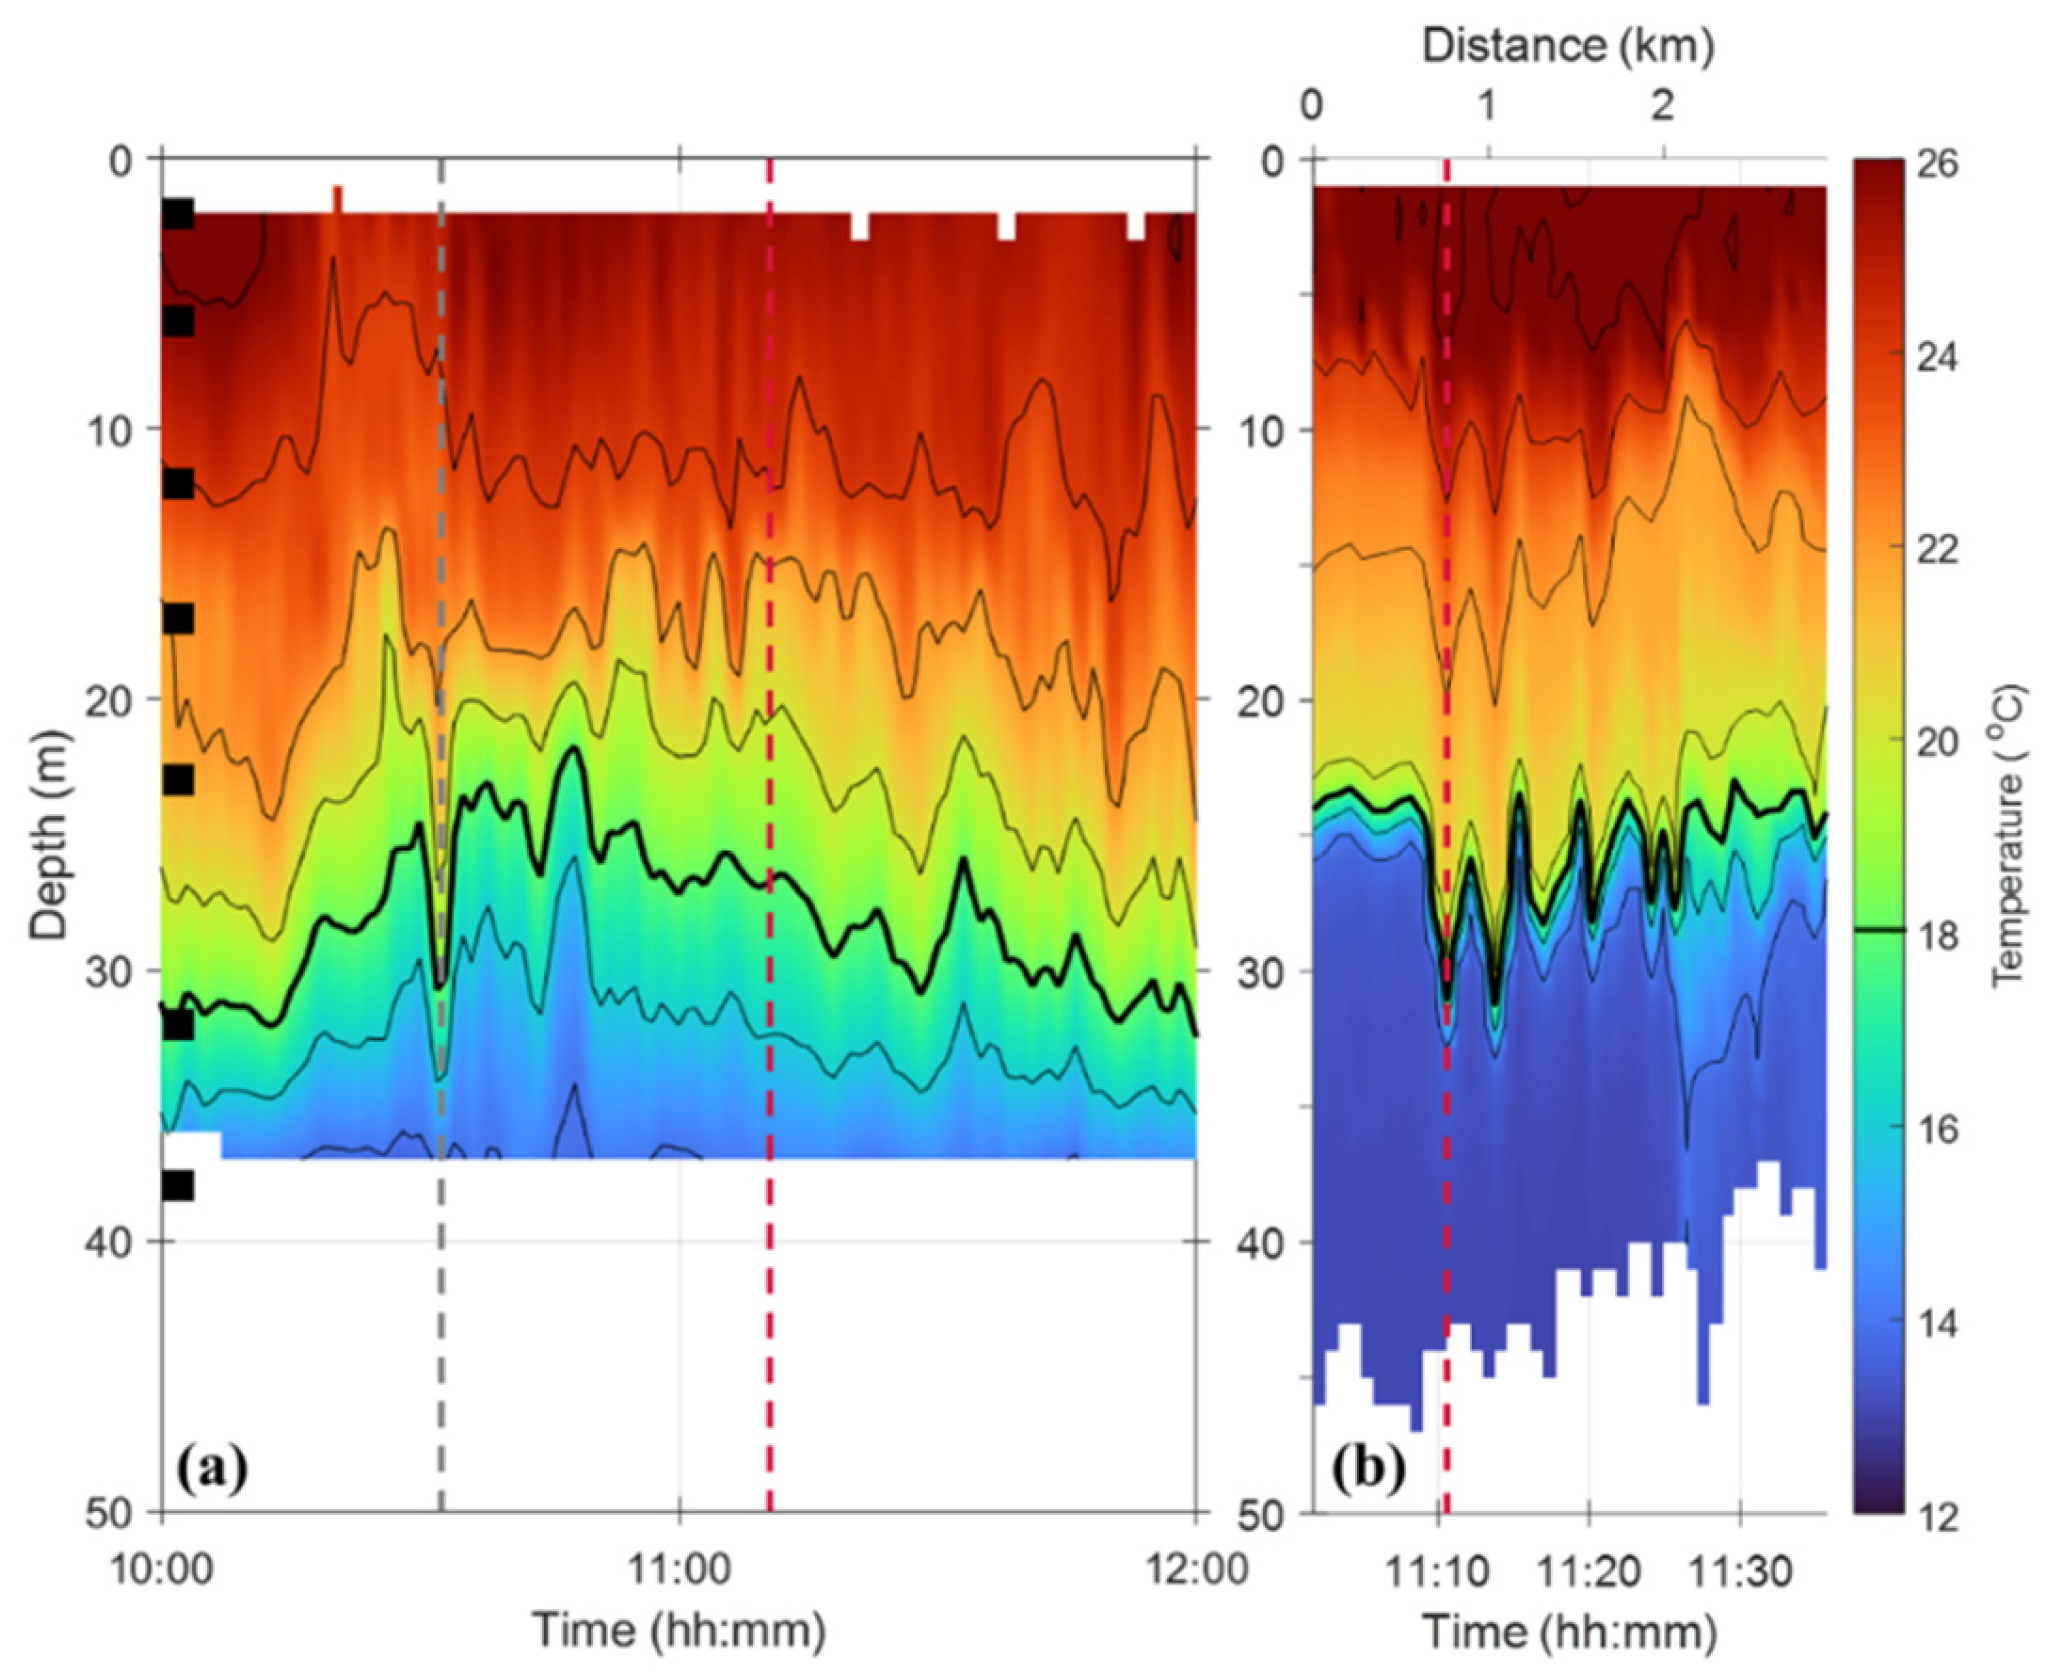
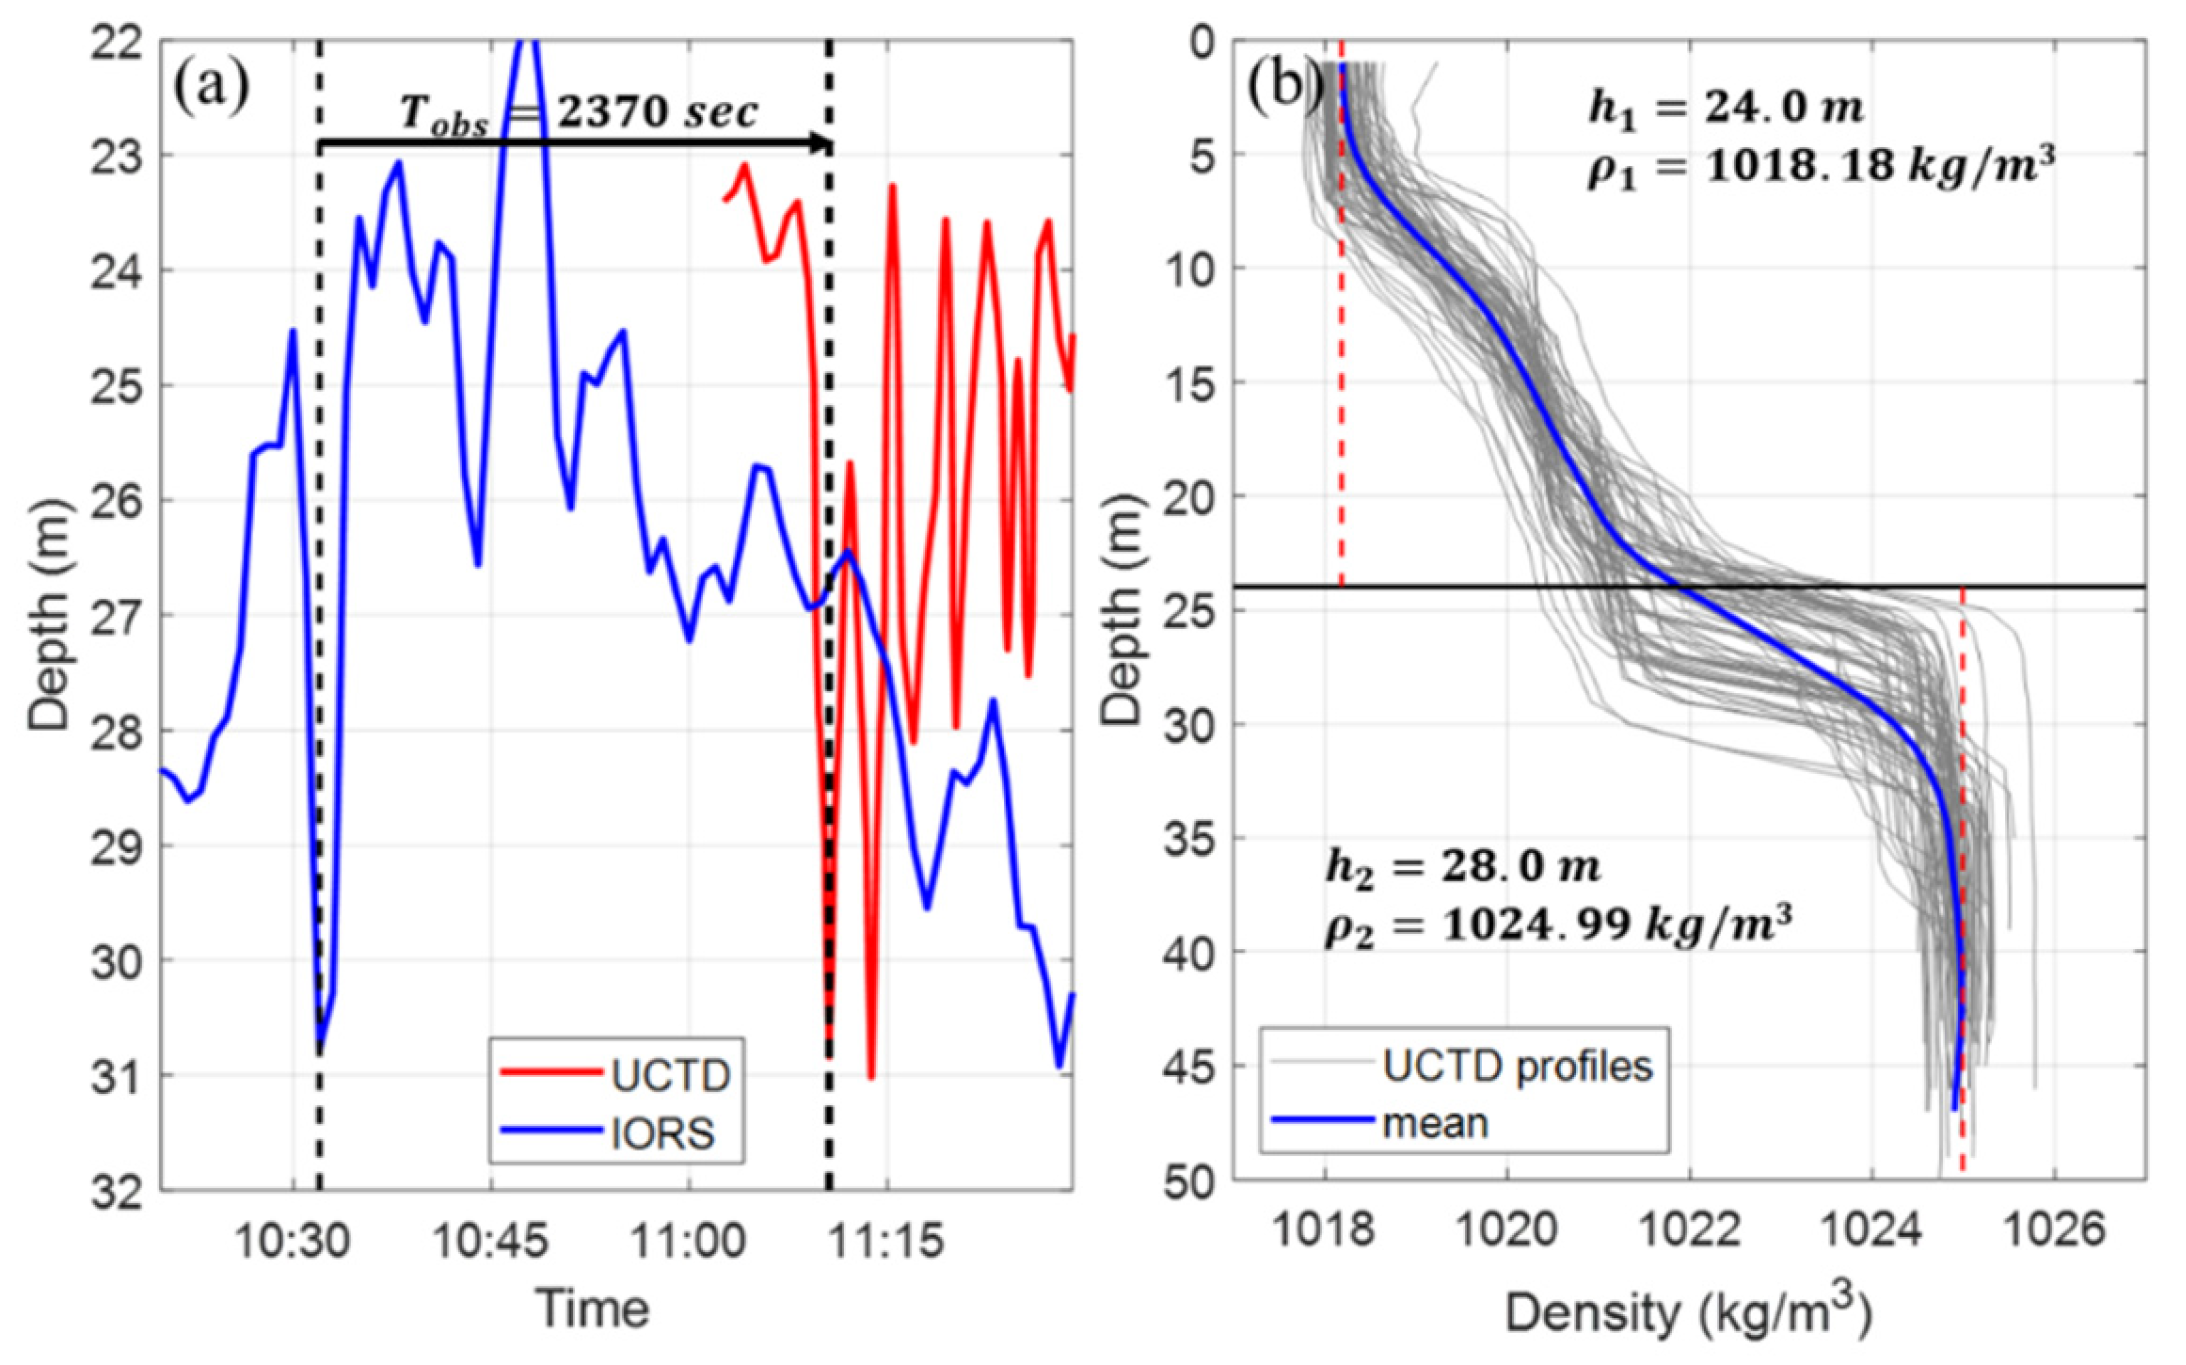
On 30 August 2018 during the IORS18, the existence of NLIWs was confirmed from the isotherm displacements observed by a series of vertical profiling UCTD measurements, particularly at 11:11 UTC (vertical red dashed line in Figure 7b), and the time-depth pattern of temperature measurements at the IORS, at 10:32 UTC (vertical grey dashed line in Figure 7a). The NLIWs observed at IORS were 2370 s earlier than those observed at the UCTD (Figure 8a). The 18 °C isotherm displacements observed from the UCTD and IORS were comparable, ranging from 23 to 31 m (Figure 8a). The NLIWs (the leading NLIW among a set observed by the UCTD) had an amplitude ( η 0 ) of 6.8 and 7.0 m derived from the IORS and UCTD observations, respectively (Figure 7 and Figure 8a). The densities at the upper and lower layers ( ρ 1 and ρ 2 ) were 1018.18 and 1024.99 kg∙m−3, and thicknesses of the upper and lower layers ( h 1 and h 2 ) were 24.0 and 28.0 m, respectively (Figure 8b and Table 1).
When the ship moved at a speed of 1.38 m · s 1 and a direction of 334 ° (southeastward), the apparent propagation direction ϕ d s of NLIWs had the angular difference θ d s of ± 126 ° with the ship course ϕ s h (Figure 9a), derived from the Doppler shift method using Equation (15), resulting in ϕ d s = 208 ° (southwestward) or ϕ d s = 100 ° (northward). From the distance ( D o b s = 3045 m ) between the two measurement locations (IORS and ship) and the time lag of the NLIW arrivals ( T o b s = 2370 s ), the observed propagation direction of NLIW ϕ t l was estimated to have an angular difference θ t l = ± 45 ° with ϕ o b s (Figure 9b), derived from the time lag method using Equation (17), resulting in ϕ t l = 198 ° (southwestward) or ϕ t l = 288 ° (southeastward). Thus, more consistent propagation directions of ϕ d s = 208 ° and ϕ t l = 198 ° were selected to optimize the propagation speed and direction. By minimizing | ϕ t l ϕ d s | , optimal propagation speed ( c i w ) of 1.06 m · s 1 was derived from the iterative calculations, yielding ϕ d s = 205 ° and ϕ t l = 205 ° with | ϕ t l ϕ d s | = 0 ° , and the resulting propagation direction ( ϕ i w ) of 205 ° was obtained.

4. Discussion

Herein, we discussed whether the propagation speeds of NLIWs estimated using the proposed method are reasonable based on the KdV theory and previous observations. Interannual variations of the theoretical propagation speed ( c K d V . i w , NIFS-SAVEX15) in May from 1994 to 2019 derived from the NIFS historical hydrographic data near the SAVEX15 area range from 0.36 to 0.71 m · s 1 , with a temporal mean and standard deviation of 0.50 and 0.09 m · s 1 , respectively (red line in Figure 10a). A long-term decreasing trend was observed in May c K d V . i w (NIFS-SAVEX15) at a rate of −0.004 m · s 1 · yr 1 (red dotted line in Figure 10a), primarily because of the decreasing density stratification, that is, increasing ρ 1 and decreasing ρ 2 with no significant change in h 1 and h 2 in May (red lines in Figure 10b,c). The propagation speed for May 2015 estimated using the proposed method ( c i w ) was consistent with the theoretical propagation speed ( c K d V . i w ; SAVEX15) derived from the hydrographic data obtained during SAVEX15 and that (NIFS-SAVEX15) derived from the nearby NIFS data, with minor (<0.05 m · s 1 ) differences (closed square, open square, and open circle in Figure 10a).
Similarly, interannual variations in the theoretical propagation speed ( c K d V . i w , NIFS-IORS18) in August from 1994 to 2019 derived from the NIFS historical hydrographic data near the IORS ranged from 0.42 to 0.86 m · s 1 , with a temporal mean and standard deviation of 0.66 and 0.10 m · s 1 , respectively (blue line in Figure 10a). However, the long-term trend in August c K d V . i w (NIFS-IORS18) was positive (at a rate of 0.003 m · s 1 · yr 1 ; blue dotted line in Figure 10a) because of the increasing density stratification between the layers, that is, decreasing ρ 1 and increasing ρ 2 with no significant change in h 1 and h 2 in August (blue lines in Figure 10b,c). In contrast to May 2015, the propagation speed for August 2018 estimated using the proposed method ( c i w ) was not consistent with the theoretical propagation speed ( c K d V . i w ; IORS18) derived from the hydrographic data obtained during IORS18 and that (NIFS-IORS18) derived from the nearby NIFS data, yielding significant (>0.25 m · s 1 ) differences (closed square, open square, and open circle in Figure 10a). The difference in density stratification between the NIFS and IORS18 data cannot explain the difference in c i w from the theoretical propagation speeds of c K d V . i w (IORS18) and c K d V . i w (NIFS-IORS18), implying the limitation of theoretical estimation. A similar difference in the observed propagation speed from the theoretical propagation speed in the area near the IORS was reported from the observations in August 2005 (blue diamond in Figure 10) [33].
To determine whether the propagation directions of NLIWs estimated using the proposed method are physically reasonable, we compared the ϕ i w values with those derived from satellite images and previous observations. The ϕ i w values estimated during the two experiments (SAVEX15 and IORS18) using the proposed method were consistent with those derived from MODIS images. Despite the fact that the surface manifestations of NLIWs observed in the two MODIS images were distant (56–123 km from the SAVEX15 area and 42–190 km from the IORS) from the locations of NLIWs observed during the two experiments, south-westward-propagating NLIWs (propagation direction of 186–209 ° ) were consistently found in the two images (Figure 3). Previous observations based on satellite SAR and optical images taken between 1993 and 2004 [35] and SAR images taken between 2014 and 2015 [36] in the northern ECS also support the south-westward-propagating NILWs (propagation direction ranging from 212 ° to 245 ° ), which may be dominant among the various NLIWs propagating in multiple directions from multiple sources in the northern ECS (Figure 1a).
The two-layered classical (ordinary) KdV theory used in this study has clear limitations. The classical KdV theory is very simplified and assumes weak non-linearity and weak dispersiveness. In fact, NLIWs observed in many areas have been better explained by the eKdV theory than by the KdV theory. However, propagation speeds, in cases of SAVEX15 and IORS18, derived based on the eKdV theory ( c e K d V . i w ) including the cubic non-linearity are not significantly different from those based on the KdV theory ( c K d V . i w ), yielding the difference less than 0.02 m · s 1 due to relatively small η 0 (Table 1). Furthermore, as in the case of NLIWs in the South China Sea, finite-depth theory may be theoretically more appropriate than shallow-water theory where the KdV and eKdV theories are based on [53]. The theoretical propagation speeds in the forms of Equations (6) and (9) are limited to the case of no background pedestal condition that could not be considered in this study and might affect the speed significantly. The rigid lid assumption of the KdV and eKdV theories at the top boundary is not fully realistic, although reasonable in many cases, because the resonant interaction between the surface and internal waves supports the possible need for the presence of a free surface at the top boundary to yield more realistic theoretical estimates [54]. In addition, the results presented in this study are limited to only mode-1 NLIWs by applying the two-layered system, yet the vertical profiles of mean density observed during the two experiments (Figure 5b and Figure 8b) support normal mode decompositions (J. Klinck’s Matlab program dynmodes.m, available online at http://github.com/sea-mat/dynmodes; accessed on 5 October 2021) for the first three modes corresponding to 49%, 18%, and 14% for SAVEX15 and 50%, 21%, and 13% for IORS18, respectively. Multi-mode NLIWs beyond the mode-1 NLIWs in the region, not investigated in this study, yet explaining about half of NLIWs, need to be examined in the future.

5. Concluding Remarks

We present a novel method to estimate the propagation speed and direction of NLIWs using widely collected underway and moored observations, and the results of applying the method to two cases of NLIWs observed in May 2015 (SAVEX15) and August 2018 (IORS18). Two-layered KdV theory and satellite images were used to discuss the results of the proposed method. The propagation direction of NLIWs was estimated with respect to a moving ship using the Doppler shift relationship (1. Doppler shift method) and independently using the time lag between the NLIWs observed at two different locations (2. time lag method). Then, the propagation speed and direction were optimized to minimize the difference in propagation directions derived from the two methods by iterating the propagation speed in the range of ±30% at a resolution of 0.01 m · s 1 . The results derived from the proposed method are robust, as the range of iterative propagation speeds is comparable to the interannual variation of theoretical propagation speeds estimated using historical hydrographic data, yielding an error of less than 15% for the propagation direction. Because in situ observations of NLIWs are still challenging to collect and propagation speed and direction cannot be directly measured from subsurface instruments, our proposed method for estimating the propagation speed and direction of NLIWs using common underway and moored measurements is of practical importance, particularly over a broad shelf, such as the northern ECS, where the multi-directional propagation of multi-mode NLIWs from multiple sources is often observed.

Author Contributions

Conceptualization, S.-W.L. and S.-H.N.; methodology, S.-W.L. and S.-H.N.; validation, S.-W.L. and S.-H.N.; formal analysis, S.-W.L.; investigation, S.-W.L. and S.-H.N.; data curation, S.-W.L.; writing—original draft preparation, S.-W.L.; writing—review and editing, S.-W.L. and S.-H.N.; visualization, S.-W.L.; supervision, S.-H.N.; project administration, S.-H.N. Both authors have read and agreed to the published version of the manuscript.

Funding

SAVEX15 was funded by the US ONR (N00014-13-1-0510), KIOST (PE99531), and KRISO (PES1940). This work was funded by the Ministry of Oceans and Fisheries, Republic of Korea through the “Establishment of the Ocean Research Station in the Jurisdiction Zone and Convergence Research” and “Deep Water Circulation and Material Cycling in the East Sea (20160040)”.

Institutional Review Board Statement

Not applicable.

Informed Consent Statement

Not applicable.

Data Availability Statement

All data supporting this manuscript are available from the corresponding author upon reasonable request. SAVEX15 data are available from Lee et al. [43], IORS18 data are available at the Korea Institute of Ocean Science and Technology (KIOST; https://kors.kiost.ac.kr/en/; accessed on 5 October 2021), historical CTD data are available at NIFS (http://www.nifs.go.kr/kodc/eng/index.kodc; accessed on 5 October 2021), and MODIS satellite images are available at NASA (http://worldview.earthdata.nasa.gov; accessed on 5 October 2021).

Acknowledgments

We would like to thank Heechun Song, Sea-Moon Kim, and Byoung-Nam Kim, all individuals who participated in the SAVEX15 experiment, and Jae-Seol Shim, Jin-Young Jeong, Yong Sun Kim, In-Ki Min, Kwang-Young Jeong, and Da-Eun Yeo who participated in IORS18 experiments and provided technical support for the IORS.

Conflicts of Interest

The authors declare no conflict of interest.

References

  1. MacKinnon, J.A.; Gregg, M.C. Mixing on the late-summer new England shelf-Solibores, shear, and stratification. J. Phys. Oceanogr. 2003, 33, 1476–1492. [Google Scholar] [CrossRef] [Green Version]
  2. Alford, M.H. Redistribution of energy available for ocean mixing by long-range propagation of internal waves. Nature 2003, 423, 159–162. [Google Scholar] [CrossRef] [PubMed]
  3. D’Asaro, E.A.; Lien, R.-C.; Henyey, F. High-Frequency Internal Waves on the Oregon Continental Shelf. J. Phys. Oceanogr. 2007, 37, 1956–1967. [Google Scholar] [CrossRef]
  4. Moum, J.N.; Farmer, D.M.; Shroyer, E.L.; Smyth, W.D.; Armi, L. Dissipative Losses in Nonlinear Internal Waves Propagating across the Continental Shelf. J. Phys. Oceanogr. 2007, 37, 1989–1995. [Google Scholar] [CrossRef]
  5. Shroyer, E.L.; Moum, J.N.; Nash, J.D. Mode 2 waves on the continental shelf: Ephemeral components of the nonlinear internal wavefield. J. Geophys. Res. Space Phys. 2010, 115. [Google Scholar] [CrossRef] [Green Version]
  6. Scotti, A.; Pineda, J. Plankton accumulation and transport in propagating nonlinear internal fronts. J. Mar. Res. 2007, 65, 117–145. [Google Scholar] [CrossRef]
  7. Muacho, S.; da Silva, J.; Brotas, V.; Oliveira, P. Effect of internal waves on near-surface chlorophyll concentration and primary production in the Nazaré Canyon (west of the Iberian Peninsula). Deep Sea Res. Part. I Oceanogr. Res. Pap. 2013, 81, 89–96. [Google Scholar] [CrossRef]
  8. Villamaña, M.; Mourino-Carballido, B.; Marañón, E.; Cermeno, P.; Chouciño, P.; da Silva, J.C.B.; Díaz, P.; Castro, B.F.; Gilcoto, M.; Graña, R.; et al. Role of internal waves on mixing, nutrient supply and phytoplankton community structure during spring and neap tides in the upwelling ecosystem of Ría de Vigo (NW Iberian Peninsula). Limnol. Oceanogr. 2017, 62, 1014–1030. [Google Scholar] [CrossRef]
  9. Li, D.; Chou, W.-C.; Shih, Y.-Y.; Chen, G.-Y.; Chang, Y.; Chow, C.H.; Lin, T.-Y.; Hung, C.-C. Elevated particulate organic carbon export flux induced by internal waves in the oligotrophic northern South China Sea. Sci. Rep. 2018, 8, 2042. [Google Scholar] [CrossRef] [Green Version]
  10. Drake, D.E.; Cacchione, D.A. Field observations of bed shear stress and sediment resuspension on continental shelves, Alaska and California. Cont. Shelf Res. 1986, 6, 415–429. [Google Scholar] [CrossRef]
  11. Bogucki, D.; Dickey, T.; Redekopp, L.G. Sediment resuspension and transport by Sediment Resuspension and Mixing by Resonantly Generated Internal Solitary Waves solitary waves. J. Phys. Oceanogr. 1997, 27, 1181–1196. [Google Scholar] [CrossRef]
  12. Klymak, J.M.; Moum, J.N. Internal solitary waves of elevation advancing on a shoaling shelf. Geophys. Res. Lett. 2003, 30. [Google Scholar] [CrossRef] [Green Version]
  13. Lynch, J.; Newhall, A. Shallow-Water Acoustics. In Applied Underwater Acoustics; Elsevier: Amsterdam, The Netherlands, 2017; pp. 403–467. [Google Scholar] [CrossRef]
  14. Apel, J.R.; Ostrovsky, L.; Stepanyants, Y.A.; Lynch, J.F. Internal solitons in the ocean and their effect on underwater sound. J. Acoust. Soc. Am. 2007, 121, 695–722. [Google Scholar] [CrossRef] [PubMed]
  15. Boegman, L.; Stastna, M. Sediment Resuspension and Transport by Internal Solitary Waves. Annu. Rev. Fluid Mech. 2019, 51, 129–154. [Google Scholar] [CrossRef]
  16. Lee, O.S. Observations on internal waves in shallow water. Limnol. Oceanogr. 1961, 6, 312–321. [Google Scholar] [CrossRef]
  17. Ramp, S.; Tang, T.Y.; Duda, T.; Lynch, J.; Liu, A.; Chiu, C.-S.; Bahr, F.; Kim, H.-R.; Yang, Y.-J. Internal Solitons in the Northeastern South China Sea Part I: Sources and Deep Water Propagation. IEEE J. Ocean. Eng. 2004, 29, 1157–1181. [Google Scholar] [CrossRef]
  18. Moum, J.N.; Nash, J.D. Seafloor Pressure Measurements of Nonlinear Internal Waves. J. Phys. Oceanogr. 2008, 38, 481–491. [Google Scholar] [CrossRef] [Green Version]
  19. Shroyer, E.L.; Moum, J.N.; Nash, J. Observations of Polarity Reversal in Shoaling Nonlinear Internal Waves. J. Phys. Oceanogr. 2009, 39, 691–701. [Google Scholar] [CrossRef] [Green Version]
  20. Alford, M.H.; Lien, R.-C.; Simmons, H.; Klymak, J.; Ramp, S.; Yang, Y.-J.; Tang, D.; Chang, M.-H. Speed and Evolution of Nonlinear Internal Waves Transiting the South China Sea. J. Phys. Oceanogr. 2010, 40, 1338–1355. [Google Scholar] [CrossRef]
  21. Journal of Geophysical Research. Nature 1955, 175, 238. [CrossRef]
  22. McSweeney, J.; Lerczak, J.A.; Barth, J.A.; Becherer, J.; Colosi, J.A.; MacKinnon, J.A.; MacMahan, J.H.; Moum, J.N.; Pierce, S.D.; Waterhouse, A.F. Observations of Shoaling Nonlinear Internal Bores across the Central California Inner Shelf. J. Phys. Oceanogr. 2020, 50, 111–132. [Google Scholar] [CrossRef]
  23. Scotti, A.; Butman, B.; Beardsley, R.C.; Alexander, P.S.; Anderson, S. A Modified Beam-to-Earth Transformation to Measure Short-Wavelength Internal Waves with an Acoustic Doppler Current Profiler. J. Atmos. Ocean. Technol. 2005, 22, 583–591. [Google Scholar] [CrossRef] [Green Version]
  24. Moum, J.N.; Smyth, W.D. The pressure disturbance of a nonlinear internal wave train. J. Fluid Mech. 2006, 558, 153–177. [Google Scholar] [CrossRef] [Green Version]
  25. Mirshak, R.; Kelley, D.E. Inferring Propagation Direction of Nonlinear Internal Waves in a Vertically Sheared Background Flow. J. Atmos. Ocean. Technol. 2009, 26, 615–625. [Google Scholar] [CrossRef]
  26. Chang, M.-H.; Lien, R.-C.; Yang, Y.J.; Tang, T.Y. Nonlinear Internal Wave Properties Estimated with Moored ADCP Measurements. J. Atmos. Ocean. Technol. 2011, 28, 802–815. [Google Scholar] [CrossRef]
  27. Zhang, S.; Alford, M.H.; Mickett, J.B. Characteristics, generation and mass transport of nonlinear internal waves on the Washington continental shelf. J. Geophys. Res. Oceans 2015, 120, 741–758. [Google Scholar] [CrossRef]
  28. Wang, J.; Huang, W.; Yang, J.; Zhang, H.; Zheng, G. Study of the propagation direction of the internal waves in the South China Sea using satellite images. Acta Oceanol. Sin. 2013, 32, 42–50. [Google Scholar] [CrossRef]
  29. Greskowiak, J. Tide-induced salt-fingering flow during submarine groundwater discharge. Geophys. Res. Lett. 2014, 41, 6413–6419. [Google Scholar] [CrossRef]
  30. Lindsey, D.T.; Nam, S.; Miller, S.D. Tracking oceanic nonlinear internal waves in the Indonesian seas from geostationary orbit. Remote. Sens. Environ. 2018, 208, 202–209. [Google Scholar] [CrossRef]
  31. Karang, I.W.G.A.; Chonnaniyah; Osawa, T. Internal solitary wave observations in the Flores Sea using the Himawari-8 geostationary satellite. Int. J. Remote. Sens. 2019, 41, 5726–5742. [Google Scholar] [CrossRef]
  32. Tensubam, C.M.; Raju, N.J.; Dash, M.K.; Barskar, H. Estimation of internal solitary wave propagation speed in the Andaman Sea using multi–satellite images. Remote. Sens. Environ. 2020, 252, 112123. [Google Scholar] [CrossRef]
  33. Lee, J.H.; Lozovatsky, I.; Jang, S.-T.; Jang, C.J.; Hong, C.S.; Fernando, H.J.S. Episodes of nonlinear internal waves in the northern East China Sea. Geophys. Res. Lett. 2006, 33. [Google Scholar] [CrossRef]
  34. Hsu, M.-K.; Liu, A.K.; Liu, C. A study of internal waves in the China Seas and Yellow Sea using SAR. Cont. Shelf Res. 2000, 20, 389–410. [Google Scholar] [CrossRef]
  35. Alpers, W.; He, M.-X.; Zeng, K.; Guo, L.-F.; Li, X.-M. The distribution of internal waves in the East China Sea and the Yellow Sea studied by multi-sensor satellite images. In Proceedings. 2005 IEEE International Geoscience and Remote Sensing Symposium, 2005. IGARSS’05; IEEE: Piscataway, NJ, USA, 2005; Volume 7, pp. 4784–4787. [Google Scholar] [CrossRef]
  36. Nam, S.; Kim, D.-J.; Lee, S.-W.; Kim, B.G.; Kang, K.-M.; Cho, Y.-K. Nonlinear internal wave spirals in the northern East China Sea. Sci. Rep. 2018, 8, 1–9. [Google Scholar] [CrossRef]
  37. Liu, Z.; Wei, H.; Lozovatsky, I.; Fernando, H. Late summer stratification, internal waves, and turbulence in the Yellow Sea. J. Mar. Syst. 2009, 77, 459–472. [Google Scholar] [CrossRef]
  38. Song, H.; Cho, C.; Hodgkiss, W.; Nam, S.; Kim, S.-M.; Kim, B.-N. Underwater sound channel in the northeastern East China Sea. Ocean. Eng. 2018, 147, 370–374. [Google Scholar] [CrossRef]
  39. Park, J.; Seong, W.; Yang, H.; Nam, S.; Lee, S.-W. Array tilt effect induced by tidal currents in the northeastern East China Sea. Ocean. Eng. 2019, 194, 106654. [Google Scholar] [CrossRef]
  40. Park, J.; Seong, W.; Yang, H.; Nam, S.; Lee, S.-W.; Choo, Y. Broadband acoustic signal variability induced by internal solitary waves and semidiurnal internal tides in the northeastern East China Sea. J. Acoust. Soc. Am. 2019, 146, 1110–1123. [Google Scholar] [CrossRef]
  41. Byun, G.; Song, H.C. Adaptive array invariant. J. Acoust. Soc. Am. 2020, 148, 925–933. [Google Scholar] [CrossRef] [PubMed]
  42. Yoon, S.; Yang, H.; Seong, W. Deep learning-based high-frequency source depth estimation using a single sensor. J. Acoust. Soc. Am. 2021, 149, 1454–1465. [Google Scholar] [CrossRef] [PubMed]
  43. Lee, S.-W.; Nam, S.; Song, H. Moored and ship-based oceanographic data collected during Shallow-water Acoustic Variability EXperiment (SAVEX15). SEANOE 2020. [Google Scholar] [CrossRef]
  44. Ha, K.-J.; Nam, S.; Jeong, J.-Y.; Moon, I.-J.; Lee, M.; Yun, J.; Jang, C.J.; Kim, Y.S.; Byun, D.-S.; Heo, K.-Y.; et al. Observations Utilizing Korea Ocean Research Stations and their Applications for Process Studies. Bull. Am. Meteorol. Soc. 2019, 100, 2061–2075. [Google Scholar] [CrossRef]
  45. Akima, H. A New Method of Interpolation and Smooth Curve Fitting Based on Local Procedures. J. ACM 1970, 17, 589–602. [Google Scholar] [CrossRef]
  46. Ullman, D.S.; Hebert, D. Processing of Underway CTD Data. J. Atmospheric Ocean. Technol. 2014, 31, 984–998. [Google Scholar] [CrossRef] [Green Version]
  47. Cho, C.; Nam, S.; Song, H. Seasonal variation of speed and width from kinematic parameters of mode-1 nonlinear internal waves in the northeastern East China Sea. J. Geophys. Res. Oceans 2016, 121, 5942–5958. [Google Scholar] [CrossRef]
  48. Jackson, C. Internal wave detection using the Moderate Resolution Imaging Spectroradiometer (MODIS). J. Geophys. Res. Space Phys. 2007, 112. [Google Scholar] [CrossRef] [Green Version]
  49. Korteweg, D.J.; de Vries, G. XLI: On the change of form of long waves advancing in a rectangular canal, and on a new type of long stationary waves. Lond. Edinb. Dublin Philos. Mag. J. Sci. 1895, 39, 422–443. [Google Scholar] [CrossRef]
  50. Apel, J.R. A New Analytical Model for Internal Solitons in the Ocean. J. Phys. Oceanogr. 2003, 33, 2247–2269. [Google Scholar] [CrossRef]
  51. Helfrich, K.R.; Melville, W.K. Long Nonlinear Internal Waves. Annu. Rev. Fluid Mech. 2006, 38, 395–425. [Google Scholar] [CrossRef]
  52. Kinsler, L.E.; Frey, A.R.; Coppens, A.B.; Sanders, J.V. Fundamentals of Acoustics; John Wiley & Sons: Hoboken, NJ, USA, 1999. [Google Scholar]
  53. Cai, S.; Xie, J.; Xu, J.; Wang, N.; Chen, Z.; Deng, X.; Long, X. Monthly variation of some parameters about internal solitary waves in the South China sea. Deep Sea Res. Part I Oceanogr. Res. Pap. 2013, 84, 73–85. [Google Scholar] [CrossRef]
  54. Craig, W.; Guyenne, P.; Sulem, C. The surface signature of internal waves. J. Fluid Mech. 2012, 710, 277–303. [Google Scholar] [CrossRef]
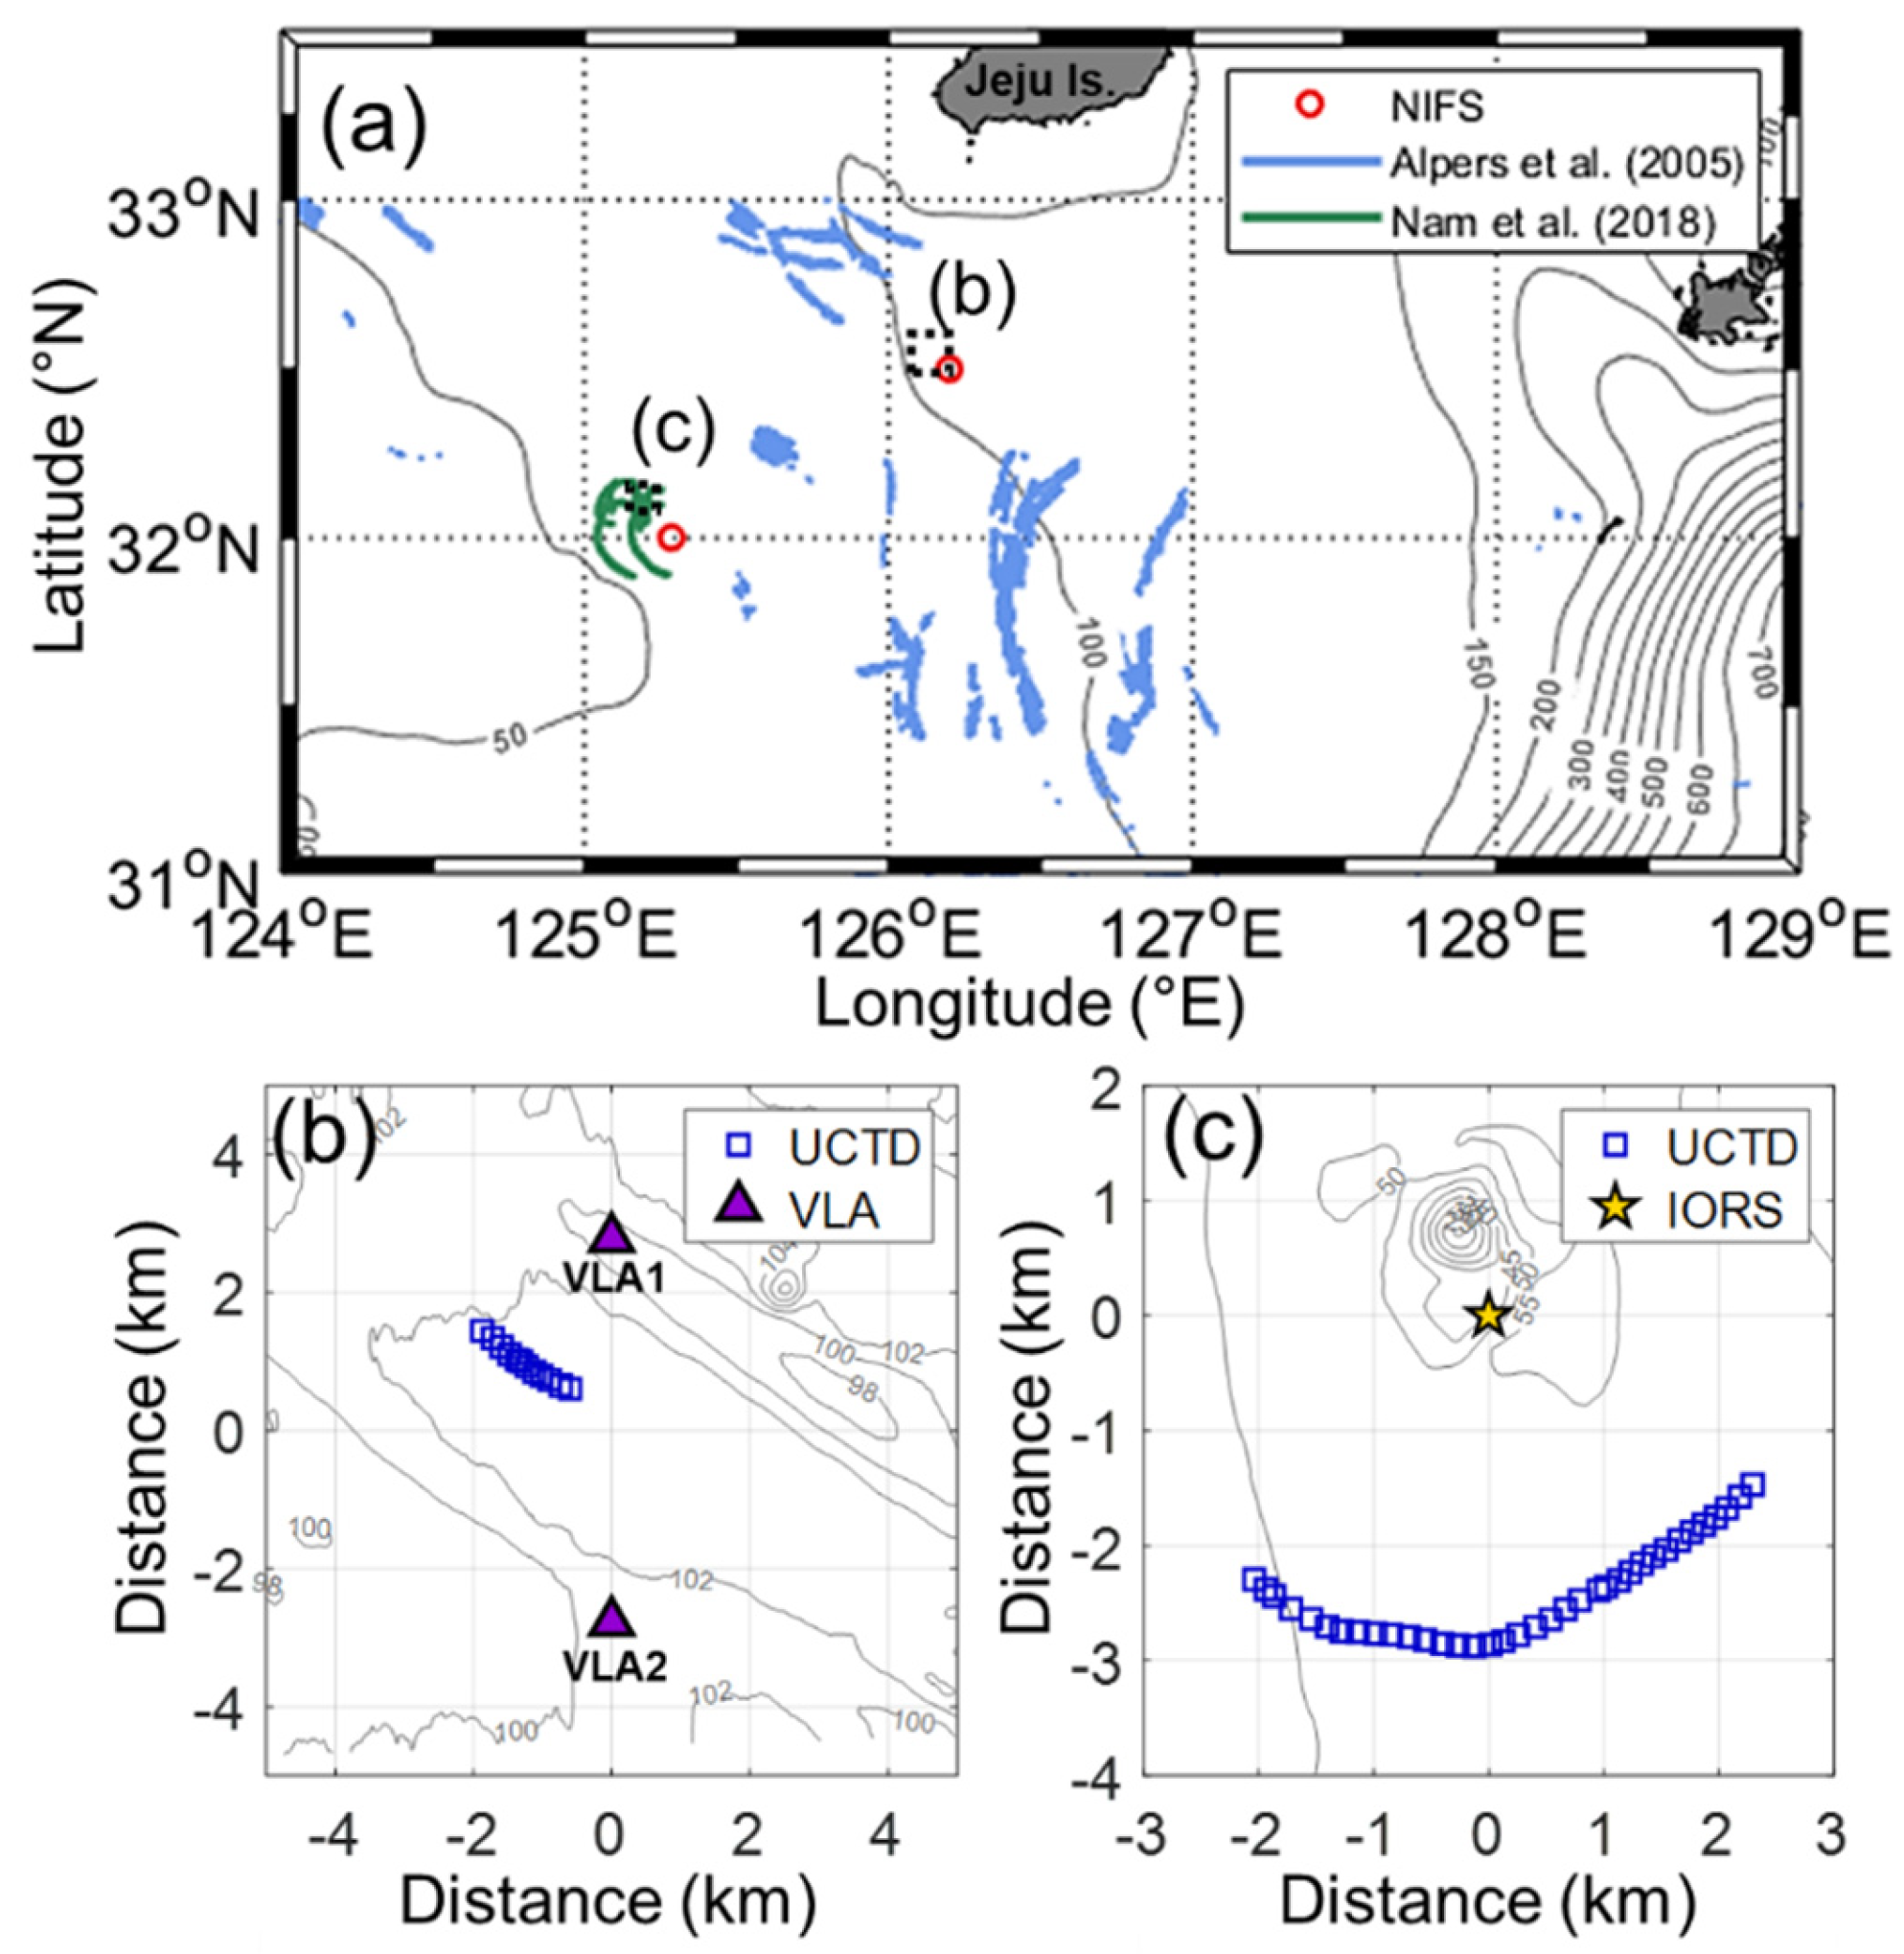
Figure 1. (a) Map showing the geographic region of this study for two areas of experiments (black dashed boxes), bathymetry (grey lines), and distribution of surface manifestation of NLIWs described by Alpers et al. [35] (blue lines) and Nam et al. [36] (green lines). Two stations conducting historical hydrographic data sampling for the National Institute of Fisheries Science (NIFS) used in this study are marked by red open circles. Zoomed-in maps of the two areas of (b) Shallow-water Acoustic Variability EXperiment 2015 (SAVEX15) and (c) Ieodo Ocean Research Station 2018 (IORS18). Locations of underway conductivity–temperature–depth (UCTD) data collection, moored observations (VLA1 and VLA2), and Ieodo Ocean Research Station (IORS) are marked by blue open squares in (b,c), purple triangles in (b), and yellow stars in (c).
Jmse 09 01089 g001
Figure 2. Schematic description of (a) the definition of parameters and estimation of the NLIW propagating direction based on the (b) Doppler shift and (c) time lag.
Jmse 09 01089 g002
Figure 3. (a,b) Two satellite images where (c,d) surface manifestations of NLIWs (orange lines) are confirmed, from MODIS Terra at 02:50 UTC on 02 August 2015, and MODIS Aqua at 04:44 UTC on 30 July 2018. The blue box is the example of the propagation direction calculation. The SAVEX15 and IORS are marked by a red box and yellow star, respectively.
Jmse 09 01089 g003
Figure 4. Time-depth pattern of water temperature observed from (a) northern mooring (VLA1) and (b) UCTD during the SAVEX15. The contour interval is 0.5 °C. The 13 °C isotherm is denoted by a thick black line. The times of NLIW observations at the VLA1 and UCTD are denoted by vertical grey and red dashed lines, respectively. Depths of thermistors attached to the VLA1 are denoted by black squares on the left axes.
Jmse 09 01089 g004
Figure 5. (a) Time-series of 13 °C isotherm depth observed at the VLA1 (red) and UCTD (blue), and (b) vertical profiles of density obtained from the UCTD measurements (grey) at 15:10–16:14 UTC on 23 May 2015. In (b), the average profile is marked in blue, and minimum and maximum densities at the upper and lower layers (corresponding to ρ 1 and ρ 2 ), respectively, are shown with red dashed lines.
Jmse 09 01089 g005
Figure 6. Propagation direction of NLIW observed during the SAVEX15, estimated from (a) Doppler shift method and (b) time lag method. The ϕ s h , ϕ o b s , θ d s , and θ t l are labelled in the plots. Date and times of the corresponding events are noted in the right bottom corner.
Jmse 09 01089 g006
Figure 7. Time-depth pattern of water temperature observed at the (a) IORS and (b) UCTD during IORS18. The contour interval is 2 °C. The 18 °C isotherm is denoted by a thick black line. Time of NLIW observations at the IORS and UCTD are denoted by vertical grey and red dashed lines, respectively. Depths of thermistors attached to the IORS are denoted by black squares on the left axes.
Jmse 09 01089 g007
Figure 8. Information related to NLIWs observed at the IORS and UCTD during IORS18. (a) Time-series of the depth of the 18 °C isotherm observed at the IORS (red) and UCTD (blue), and (b) vertical profiles of density obtained from the UCTD measurements (grey) at 11:02–11:59 UTC on 30 August 2018. In (b), the average profile is marked in blue, and minimum and maximum densities at the upper and lower layers (corresponding to ρ 1 and ρ 2 ), respectively, are shown with red dashed lines.
Jmse 09 01089 g008
Figure 9. Propagation direction of NLIW observed during IORS18, estimated from (a) Doppler shift method and (b) time lag method. The ϕ s h , ϕ o b s , θ d s , and θ t l are labeled in the plots. Dates and times of the corresponding events are noted in the right bottom corner.
Jmse 09 01089 g009
Figure 10. (a) Time series of propagation speed estimated from the method proposed in this study (colored squares; red for SAVEX15 and blue for IORS18) and KdV theory (open squares, open circles, and colored lines). KdV theory was applied using the NIFS historical hydrographic data for May (red line and open circle) and August (blue line and open circle), and hydrographic data obtained during SAVEX15 and IORS18 (open squares). The propagation speed of NLIWs observed in the northern ECS in August 2005 [33] is denoted by a blue diamond. Time series of (b) thickness ( h 1 and h 2 ) and (c) density ( ρ 1 and ρ 2 ) of the upper (solid lines) and lower (dashed lines) layers derived from the NIFS historical hydrographic data for May (red) and August (blue), and hydrographic data obtained during SAVEX15 and IORS18 (open squares and circles for upper and lower layers, respectively). Long-term trends of (a) propagation speed, (b) layer thickness, and (c) layer density from 1994 to 2019 are remarked with dotted lines.
Jmse 09 01089 g010
Table 1. Nonlinear internal wave parameters for the two cases observed, with calculated and estimated values.
ParametersSAVEX15IORS18
Observation
ρ 1   ( kg · m 3 ) Upper layer density1023.351018.18
ρ 2   ( kg · m 3 ) Lower layer density1025.171024.99
h 1   ( m ) Upper layer thickness34.824.0
h 2   ( m ) Lower layer thickness65.228.0
η 0   ( m ) Wave amplitude6.17.0
T a p   ( sec ) Wave apparent period1695237
Ship course148334
v s h   ( m · s 1 ) Ship speed0.471.38
T o b s   ( sec ) Time lag between two different observations32392370
D o b s   ( m ) Distance between two different observations22333045
C o b s   ( m · s 1 ) Speed between two different observations0.691.29
ϕ o b s   ( ° ) Angle between two different observations230243
Estimation base on KdV and eKdV theory
α   ( s 1 ) Nonlinear parameter−0.0127−0.0041
α 1   ( s 1 · m 1 ) Cubic nonlinear parameter−0.0009−0.0011
β   ( m 3   · s 1 ) Dispersion parameter238104
c K d V . l   ( m · s 1 ) Linear phase speed0.630.92
c K d V . i w   ( m · s 1 ) Propagating speed based on KdV theory0.650.93
c e K d V . i w   ( m · s 1 ) Propagating speed based on eKdV theory0.650.92
Δ K d V . i w   ( m ) Characteristic width based on KdV theory384416
Δ e K d V . i w   ( m ) Characteristic width based on eKdV theory4321182
λ K d V . i w   ( m ) Wavelength based on KdV theory712772
λ e K d V . i w   ( m ) Wavelength based on eKdV theory8022192
Estimation based on proposed methods (KdV theory)
θ d s   ( ° ) Angle   between   ϕ d s   and   ϕ s h 60126
ϕ d s   ( ° ) NLIW propagating direction from Doppler shift208208
θ t l   ( ° ) Angle   between   ϕ t l   and   ϕ o b s 1945
ϕ t l   ( ° ) NLIW propagating direction from time lag211198
c i w   ( ° ) Optimal NLIW propagating speed0.641.06
ϕ i w   ( ° ) Optimal NLIW propagating direction210205
Estimation based on proposed methods (eKdV theory)
θ d s   ( ° ) Angle   between   ϕ d s   and   ϕ s h 68100
ϕ d s   ( ° ) NLIW propagating direction from Doppler shift215235
θ t l   ( ° ) Angle   between   ϕ t l   and   ϕ o b s 1846
ϕ t l   ( ° ) NLIW propagating direction from time lag212197
c i w   ( ° ) Optimal NLIW propagating speed0.661.30
ϕ i w   ( ° ) Optimal NLIW propagating direction213234
Publisher’s Note: MDPI stays neutral with regard to jurisdictional claims in published maps and institutional affiliations.