Article

Pull-Out Mechanism of Horizontal and Inclined Plate Anchors in Normally Consolidated Clay

1
Research Institute of Tsinghua University in Shenzhen, High-Tech Industrial Park, Shenzhen 518057, China
2
Faculty of Engineering, National University of Singapore, 21 Lower Kent Ridge Road, Singapore 119077, Singapore
3
Offshore Wind Project Group, Clean Energy Branch, CNOOC Energy Technology & Services Limited, 688 Bohai Petroleum Road, Tianjin 300452, China
*
Author to whom correspondence should be addressed.
J. Mar. Sci. Eng. 2021, 9(10), 1103; https://doi.org/10.3390/jmse9101103
Submission received: 4 August 2021 / Revised: 28 September 2021 / Accepted: 29 September 2021 / Published: 11 October 2021
(This article belongs to the Topic Marine Renewable Energy)

Abstract

:
As most existing experimental studies on plate anchors were carried out in uniform clay, a centrifuge model study is presented in this paper to investigate the pull-out behaviour of plate anchors in normally consolidated clay, which is not uncommon in offshore seabed. Horizontal and inclined anchors with different embedment depths and aspect ratios (length to width) are considered. The soil movement pattern around the plate anchor is evaluated from high-resolution photographs taken during the tests employing the Particle Image Velocimetry technique. The separation mechanism at the plate-soil interface is hence identified. The significant contribution of suction towards the ultimate pull-out capacity of a plate anchor is quantified by monitoring the soil resistance and the pore pressure beneath the anchor base under undrained condition. By comparing the pull-out responses of horizontal and inclined anchors, the effect of anchor inclination on the anchor capacity and failure mechanism is evaluated.

1. Introduction

Owing to ease of fabrication and emplacement, plate anchors are attractive mooring solutions in deep-water applications in both the conventional oil and gas industry and renewable energy industry, such as offshore wind turbines. Figure 1 shows a sketch of the plate anchor model with width B and length L placed at an embedment depth H considered in this study.
Conventional laboratory and centrifuge model studies have been conducted by various researchers [1,2,3,4] to investigate the vertical monotonic pull-out capacity of horizontal plate anchors in various types of soils. In addition, theoretical studies employing limit equilibrium method and numerical studies [5,6,7,8,9,10,11,12,13] were also carried out to evaluate the pull-out capacity of plate anchors.
Based on the results of a centrifuge model study on the extraction of mobile jack-up spudcan foundation in clay, Purwana et al. [14] reported that the suction between the spudcan base and underlying soil is the key contributor for the breakout resistance of the spudcan. As all the existing experimental studies on anchor pull-out resistance were conducted at 1× g in uniform clay, there is a need to examine the anchor behaviour in normally consolidated (NC) clay, which is also common in offshore. The suction between the anchor base and underlying soil could not be simulated in 1× g tests because of the low soil overburden stress, such that separation would occur immediately upon uplift. In essence, the development of negative pore pressure at the anchor base and in the adjacent soil would result in suction that might significantly affect the anchor pull-out capacity. As such, the contribution of suction at the anchor base to the anchor capacity in clay needs to be clearly quantified.
To investigate the separation between the anchor base and the underlying soil, many numerical analyses assumed two extreme conditions at the anchor-soil interface: immediate breakaway and no breakaway. Under the immediate breakaway or vented conditions, tension cannot be sustained at the anchor base and separation takes place as soon as the uplift load is imposed. As this assumption eliminates any contribution of suction at the anchor base, many researchers established that the no breakaway or bonding conditions between the soil and anchor base have great influence on the ultimate anchor capacity [8,9,10,15]. Centrifuge tests have also been conducted by Han et al. [16,17] to investigate the soil flow mechanism and anchor–soil separation condition under sustained uplift loading with different ratios of sustained loading to ultimate monotonic capacity. In reality, the actual interface state falls somewhere between the two extreme conditions. A better understanding of the bonding conditions during the anchor pull-out process and the failure mechanism is thus necessary.
In view of the gaps identified from existing studies, centrifuge model tests are carried out in the present study to investigate the pull-out behaviour of plate anchors in NC clay. The particle image velocimetry (PIV) technique [18] was employed to identify bonding between the anchor base and the underlying soil. The pore water pressure beneath the anchor was monitored to quantify the suction developed at the anchor base. The experimental results and findings are presented in this paper.

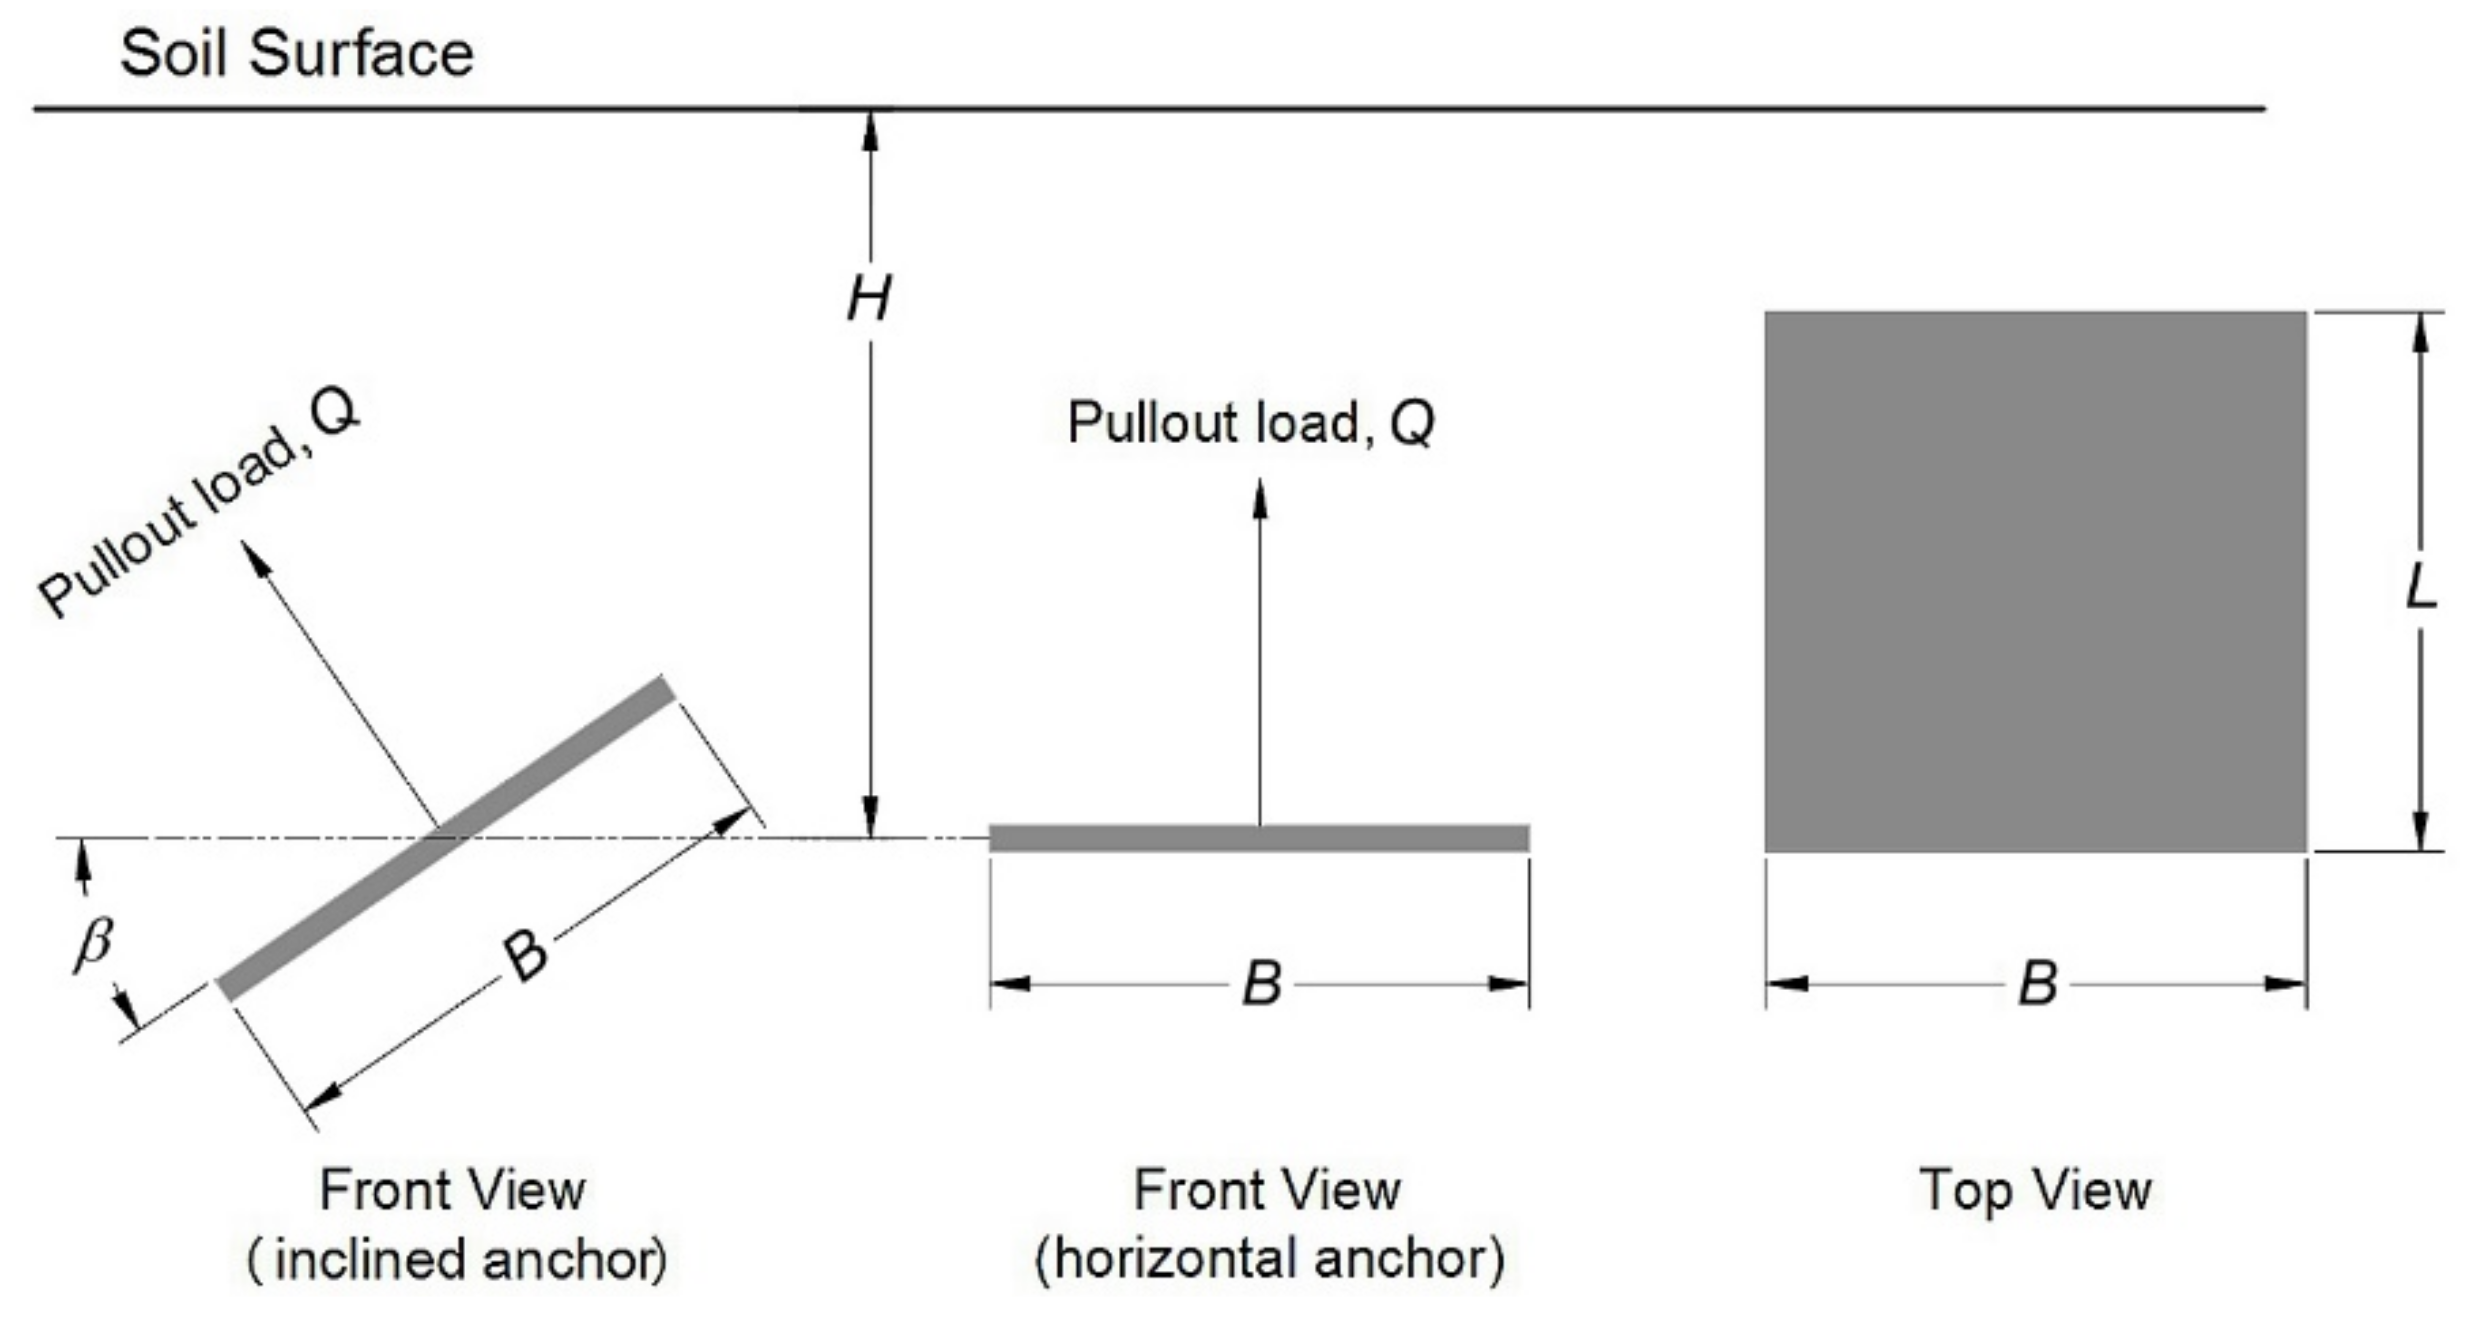
2. Anchor Shape and Inclination

In practice, the dimensions of offshore plate anchors are typically rectangular and deeply embedded. Several research studies [7,10,19] have been conducted to quantify the effect of anchor shape (circular, square, rectangular and strip anchors) on its pull-out capacity by numerical simulations or conventional laboratory (1g) tests. In general, there are two existing approaches to estimate the effect of anchor aspect (L/B) ratio on anchor capacity in non-homogeneous clay. The first approach was introduced by Merifield et al. [7], whereby the dimensionless capacity factor (Ncu*) of plate anchors with different aspect ratios in uniform clay using numerical limit analyses were presented. The capacity factor for non-homogeneous clay (Nck*) can hence be estimated by applying the non-homogeneity factor N c k * = N c u * 1 + k H / s u 0 , where k is the increase in soil strength per m depth and su0 is the undrained strength of soil at the seabed elevation. However, in NC clay with su0 = zero, this method leads to indeterminate results.
For the second approach [20], the dimensionless capacity factor Nc of a rectangular plate anchor was based on that of a strip anchor Nc,strip multiplied by an empirical shape factor s c = 1 + 0.2 B / L . However, Gourvenec et al. [21] pointed out that the shape factor given by Skempton [22] is not conservative for rectangular and square surface footings in uniform clay. Hence, the capability of estimating the capacity of an embedded rectangular anchor in NC clay also needs further examination.
It is desirable to achieve a truly horizontal position of a plate anchor in practice, as such horizontal anchors would provide the most effective vertical pull-out resistance. However, plate anchors may become inclined after installation with a certain angle of inclination between the anchor and the horizontal axis due to difficulties encountered during installation by suction caisson as an example. As far as the authors are aware, there is no centrifuge model study conducted on inclined anchors in NC clay. As such, the behaviour of inclined anchors is not well understood.
In view of the above, the present centrifuge model study also investigates the effect of anchor inclination on the failure mechanism and pull-out capacity. In addition, anchors with aspect (L/B) ratio ranging from 1 to 6 are examined to investigate the magnitude of shape factor for various anchor shapes.

3. Experimental Set-Up and Procedure

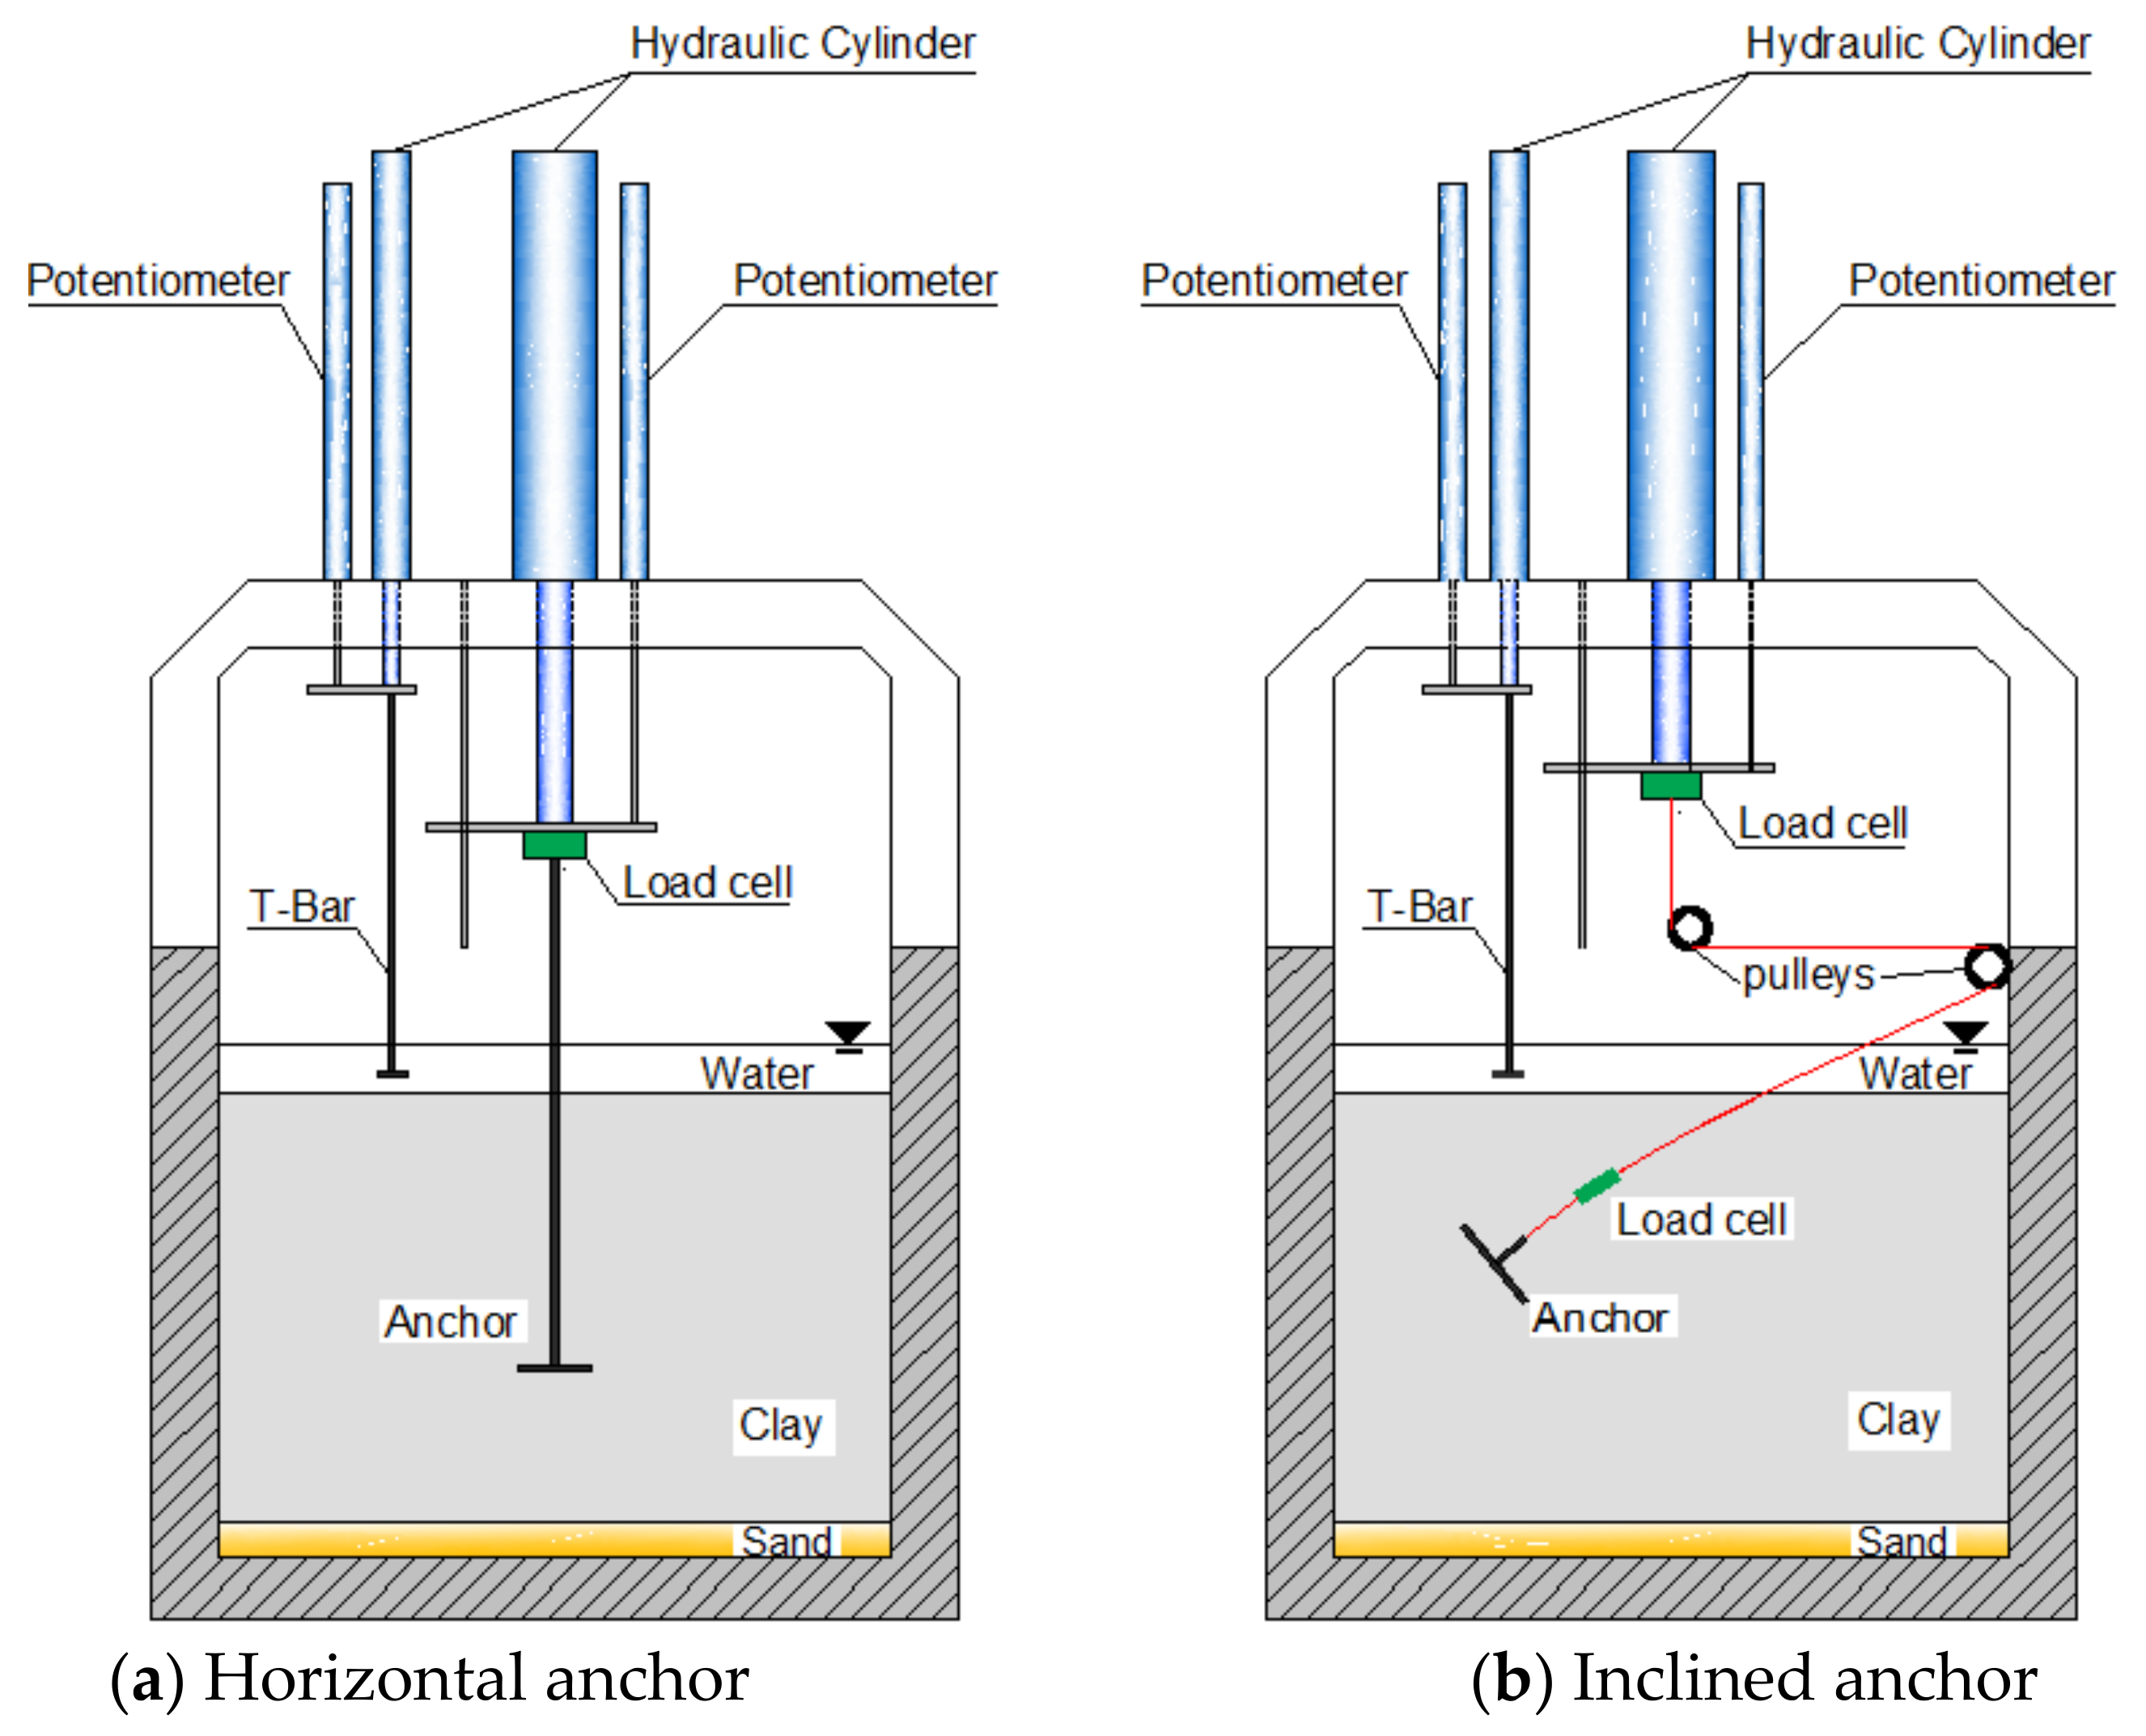
3.1. Centrifuge Model Set-Up

The experimental setup (Figure 2) consists of a model container, a half anchor model (having anchor length of L/2 by taking advantage of symmetry), a loading configuration, a hydraulic control system, sensors for measuring displacement, forces and pore water pressures, and a camera mounting frame. The front face of the container is a transparent Perspex window, and the other three sides are made of stainless steel. The container has inner dimensions of 550 mm (length) × 220 mm (width) × 500 mm (height). A loading frame is mounted on the container, supporting two actuators which are used for anchor extraction and T-Bar penetration. A load cell is employed to measure the anchor pull-out resistance. The imaging system comprises a camera placed in front of the transparent window and an on-board computer. The anchor model is shown in Figure 1. A miniature pore pressure transducer is embedded in the centre of the model plate anchor to monitor the change in pore pressure beneath the anchor during the tests.
The prototype width B of all the anchors is 4 m, with a thickness-to-width ratio of 0.05 and various lengths. Three L/B ratios were investigated, namely 1 (square), 2 (rectangular), and 6 (close to plane-strain condition). Taking advantage of symmetry, half anchor models were employed and placed right behind the transparent window of the container.
By normalising the ultimate pull-out resistance, Qu, by the anchor plane area, A, and the undrained shear strength of the soil at the anchor initial embedment depth, suh, the dimensionless anchor capacity factor, Nc, is defined as
N c = Q u A s u h

3.2. Sample Preparation

Before the placement of clay, a thin sand layer was first placed at the base of the model container, see Figure 2. The clay used in the test is Kaolin clay which is suitable for imaging processing, as its white colour and non-texture contrast clearly with the dark marking flocks scattered on the soil. The properties of the clay are given in Table 1. During sample preparation, dry clay powder was mixed thoroughly with de-air water at about 1.5 times the liquid limit. The slurry was then poured into the model container and allowed to consolidate under a small pressure of 4 kPa. Thereafter, the container with the soil sample was placed on the centrifuge and subjected to self-weight consolidation under the desired acceleration field (50× g or 100× g depending on test condition) to achieve over 90% degree of consolidation.

3.3. Anchor Loading Configuration

For horizontal anchors, a rod with the diameter of 5 mm in model scale was used for extracting the anchor. For inclined anchors, a configuration consisting of pulleys and a thin chain was employed for pulling. A small rod with the length same as anchor width was fixed to the anchor centre in order to keep the anchor nearly perpendicular to loading direction. The thin chain was connected to the other end of the small rod.
With the concern of the frictions in the pulley-chain configuration, an additional small strain gauge was connected in the chain to directly measure the pull-out force. Additional tests were conducted to separately measure the pull-out resistance of the small load cell and rod, which was deducted in the final results of anchor capacity.

3.4. Test Procedure Step (1): Anchor Installation and Soil Re-Consolidation

The experimental procedure includes soil consolidation, anchor installation, soil reconsolidation and pull-out test. After self-weight consolidation in the centrifuge, the soil had gained sufficient strength to enable the Perspex window to be removed at 1g without causing excessive deformation of the soil sample after the centrifuge spun down. The model anchor was then inserted into the soil horizontally or inclined at the desired angle at the targeted depth. The test program for horizontal and inclined anchors are listed in Table 2 and Table 3, respectively. Dark flocks were then scattered on the soil face around the anchor in order to track the soil flow pattern during anchor pull-out.
After installation, the soil with the embedded plate anchor was re-consolidated in spinning centrifuge for over 10 h. Owing to soil re-consolidation, the soil including those beneath the anchor is expected to settle further. As the anchor was connected to the anchor loading rod via a sliding system, the anchor would follow the settling soil such that the anchor base would always be in touch with the soil during soil consolidation. The magnitudes of H/B listed in Table 2 and Table 3 refer to the elevation of the anchor just prior to the anchor pull-out tests.

3.5. Test Procedure Step (2): Pull-Out Test

After completion of soil reconsolidation, without spinning down the centrifuge, the T-bar test was conducted to obtain the su of soil. Right after the T-bar test was finished, the anchor pull-out test commenced with a displacement control mode at a velocity of 3 mm/s. The non-dimensional velocity V = v B / c v proposed by Finnie [24] for T-bar testing in NC clay was adopted to evaluate the drainage condition of the test, where v is the anchor uplift velocity, B is the anchor width and cv is the coefficient of soil consolidation. When V 100 , the soil response is undrained according to Finnie [24]. In the present study, V is far larger than 100, implying undrained condition for the pull-out tests.
The centrifuge tests were conducted at 50× g or 100× g. To facilitate clearer observation on the soil flow at relatively low embedment ratios, 50× g gravitational field was employed. For those with relatively high embedment ratios, the tests were conducted under 100× g due to limitation of the container size. Verification tests were also conducted to compare the anchor resistance for the same prototype anchor simulated at 2 different g levels.

4. Verification Tests
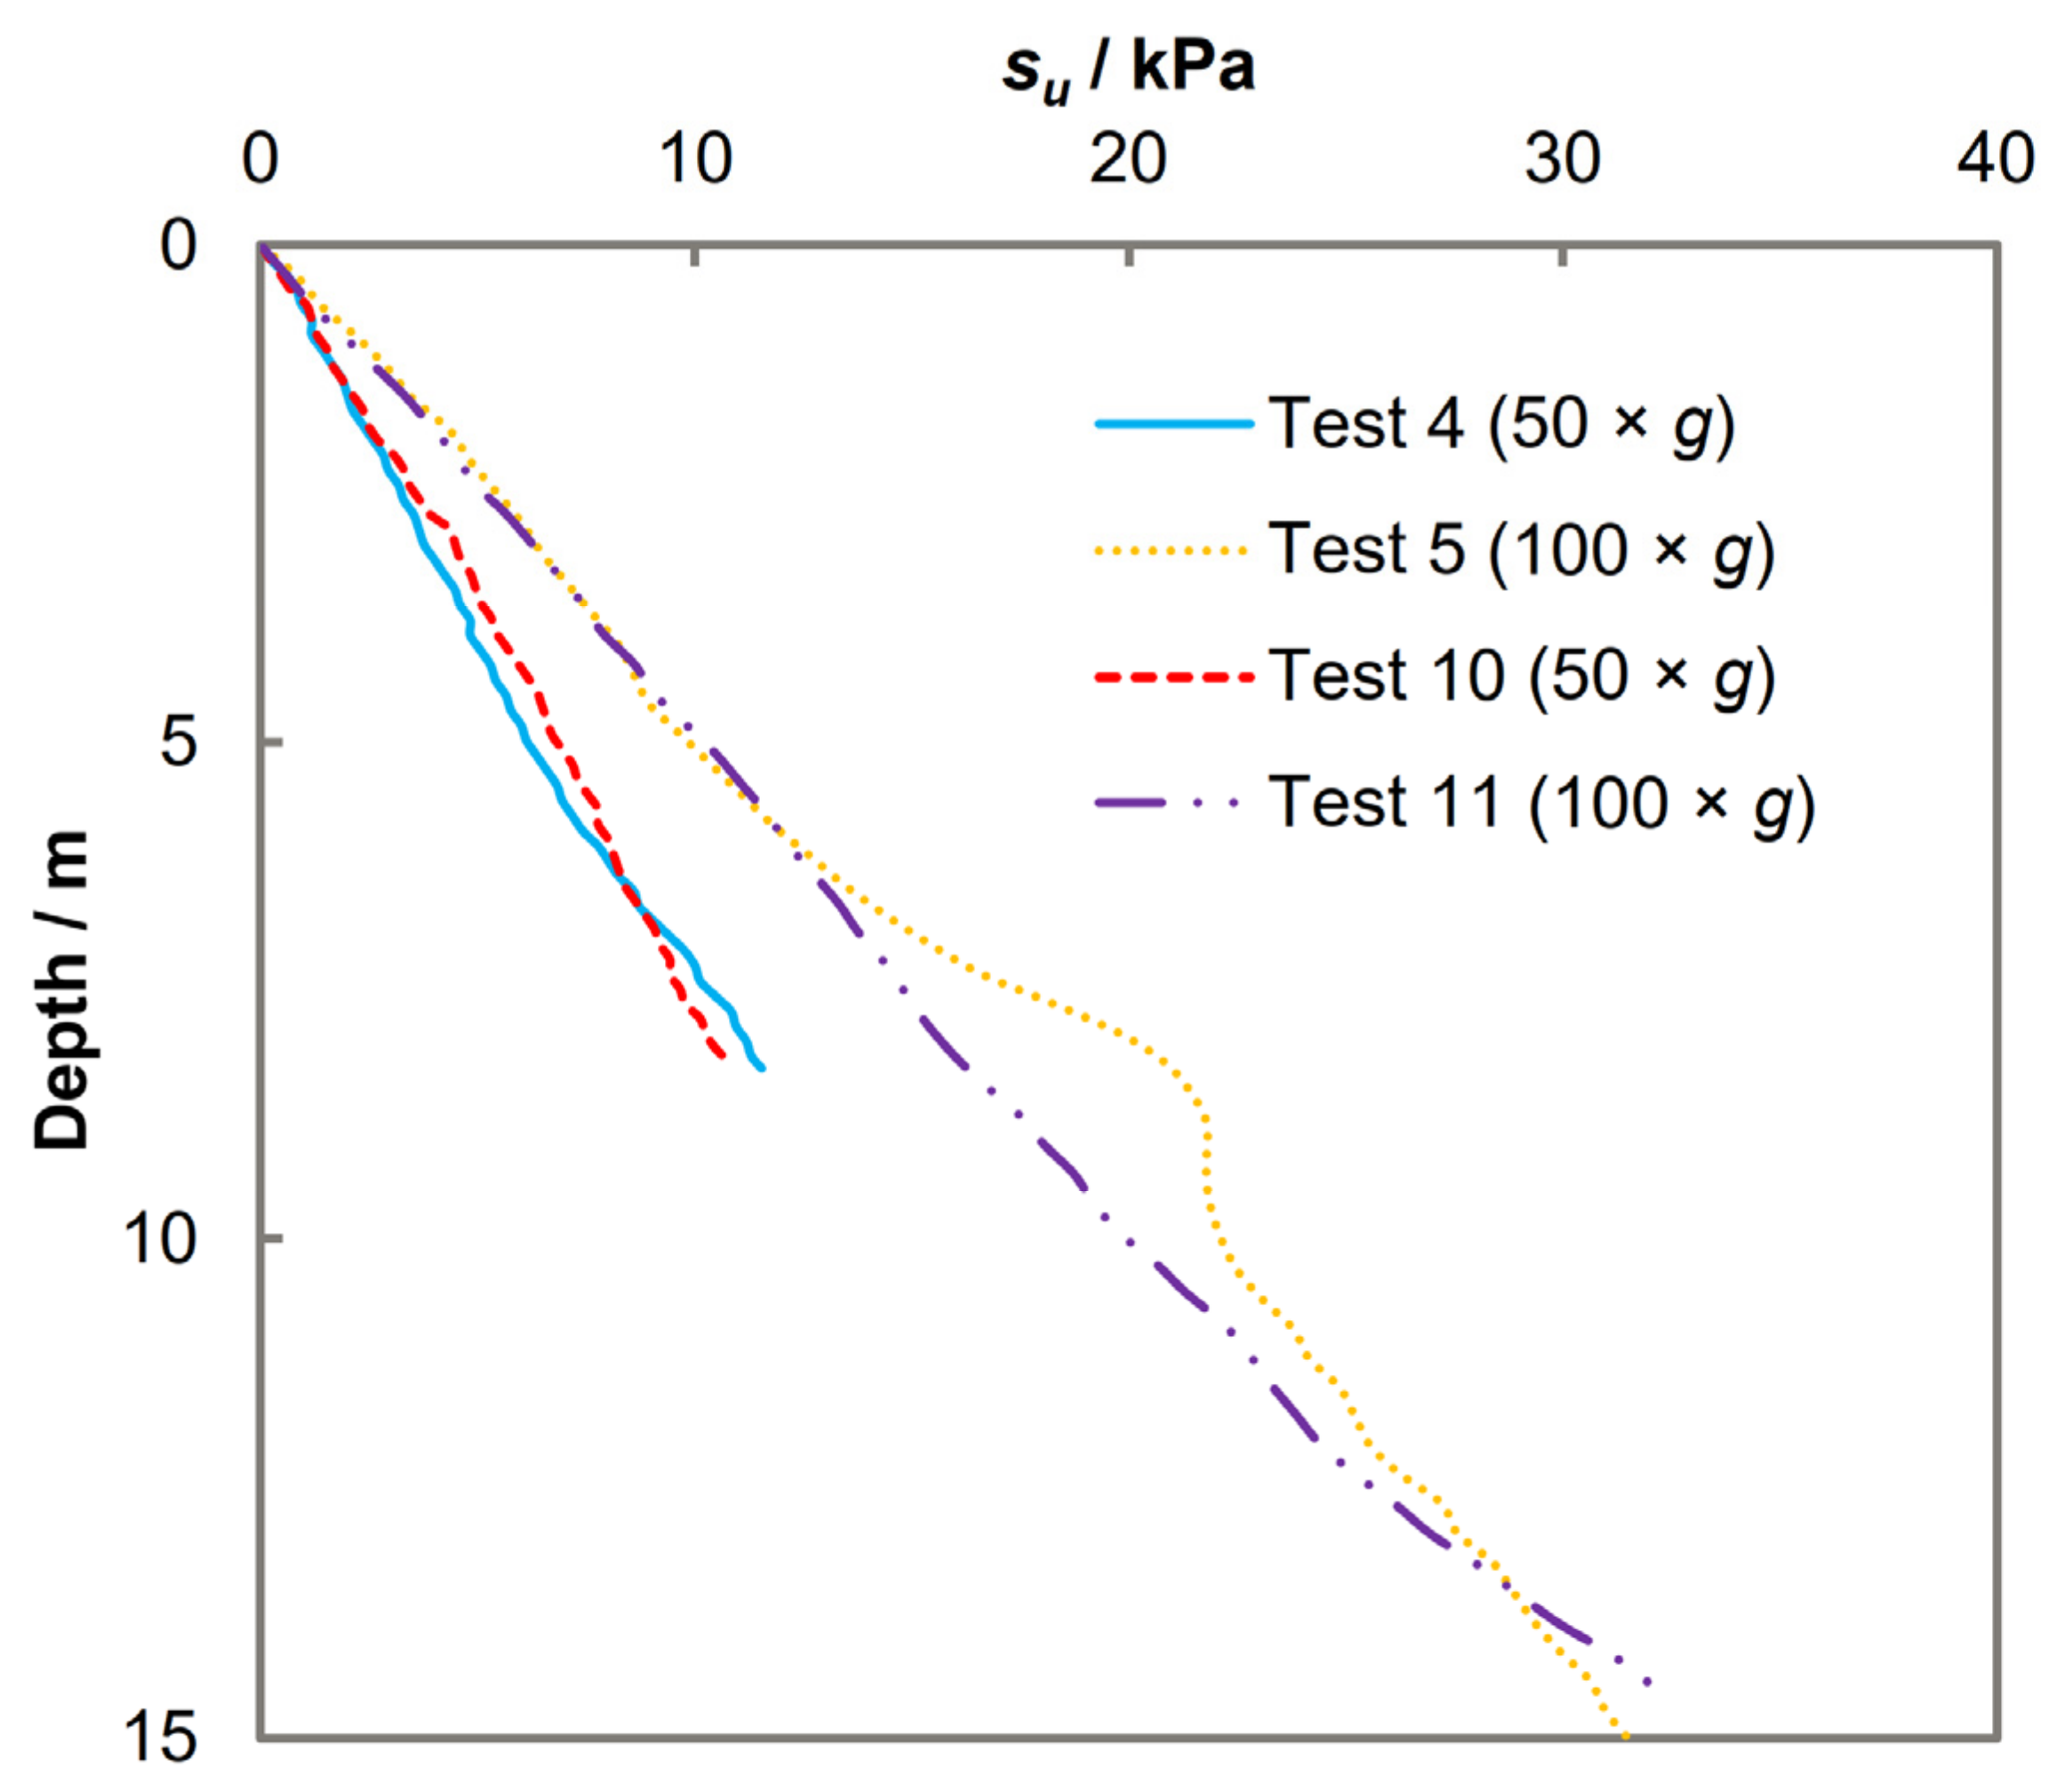
In this section, the results of two pairs of verification tests are reported. One is to verify that the anchor was moving downward uniformly with adjacent soil during soil re-consolidation, while the other is for verification of the results for the same prototype anchor size simulated at two different g levels.

4.1. Soil Profiles

The soil strength profiles in the tests were measured by a T-bar penetrometer, which consists of a cylindrical cross-bar with 25 mm in length and 5 mm in diameter. As recommended by Stewart and Randolph [25], a T-Bar factor of 10.5 was adopted to correlate the resistance measured by the T-Bar with the undrained shear strength of soil.
Figure 3 shows the strength su profiles obtained from the verification tests. As the shear strength profiles obtained from Tests 4 and 10 at 50× g and those obtained from Tests 5 and 11 at 100× g are similar, it can be deduced that the method for preparing the soil sample is repetitive.

4.2. Verification of Anchor Uniform Settlement with Adjacent Soil during Re-Consolidation

As stated above, the model anchors were inserted into the clay when the centrifuge was spun down, after which the centrifuge was spun up again to enable the soil to re-consolidate. During soil re-consolidation, the anchor would follow the settling soil by employing the sliding configuration as explained earlier. As the sliding configuration was only for the one-way downward direction, the anchor could later be pulled out together with the loading rod in an upward direction with the anchor resistance measured by a load cell.
Photographs were taken at the beginning and end of the soil re-consolidation process in the tests. By comparing the anchor elevation shown in Figure 4a (before soil re-consolidation) with that in Figure 4b (after soil re-consolidation), it is evident that the anchor indeed moved downward together with the soil from elevation A to elevation A’. From the soil flow shown in Figure 4c, it can be observed that the soil settles uniformly following a 1-dimensional consolidation condition.

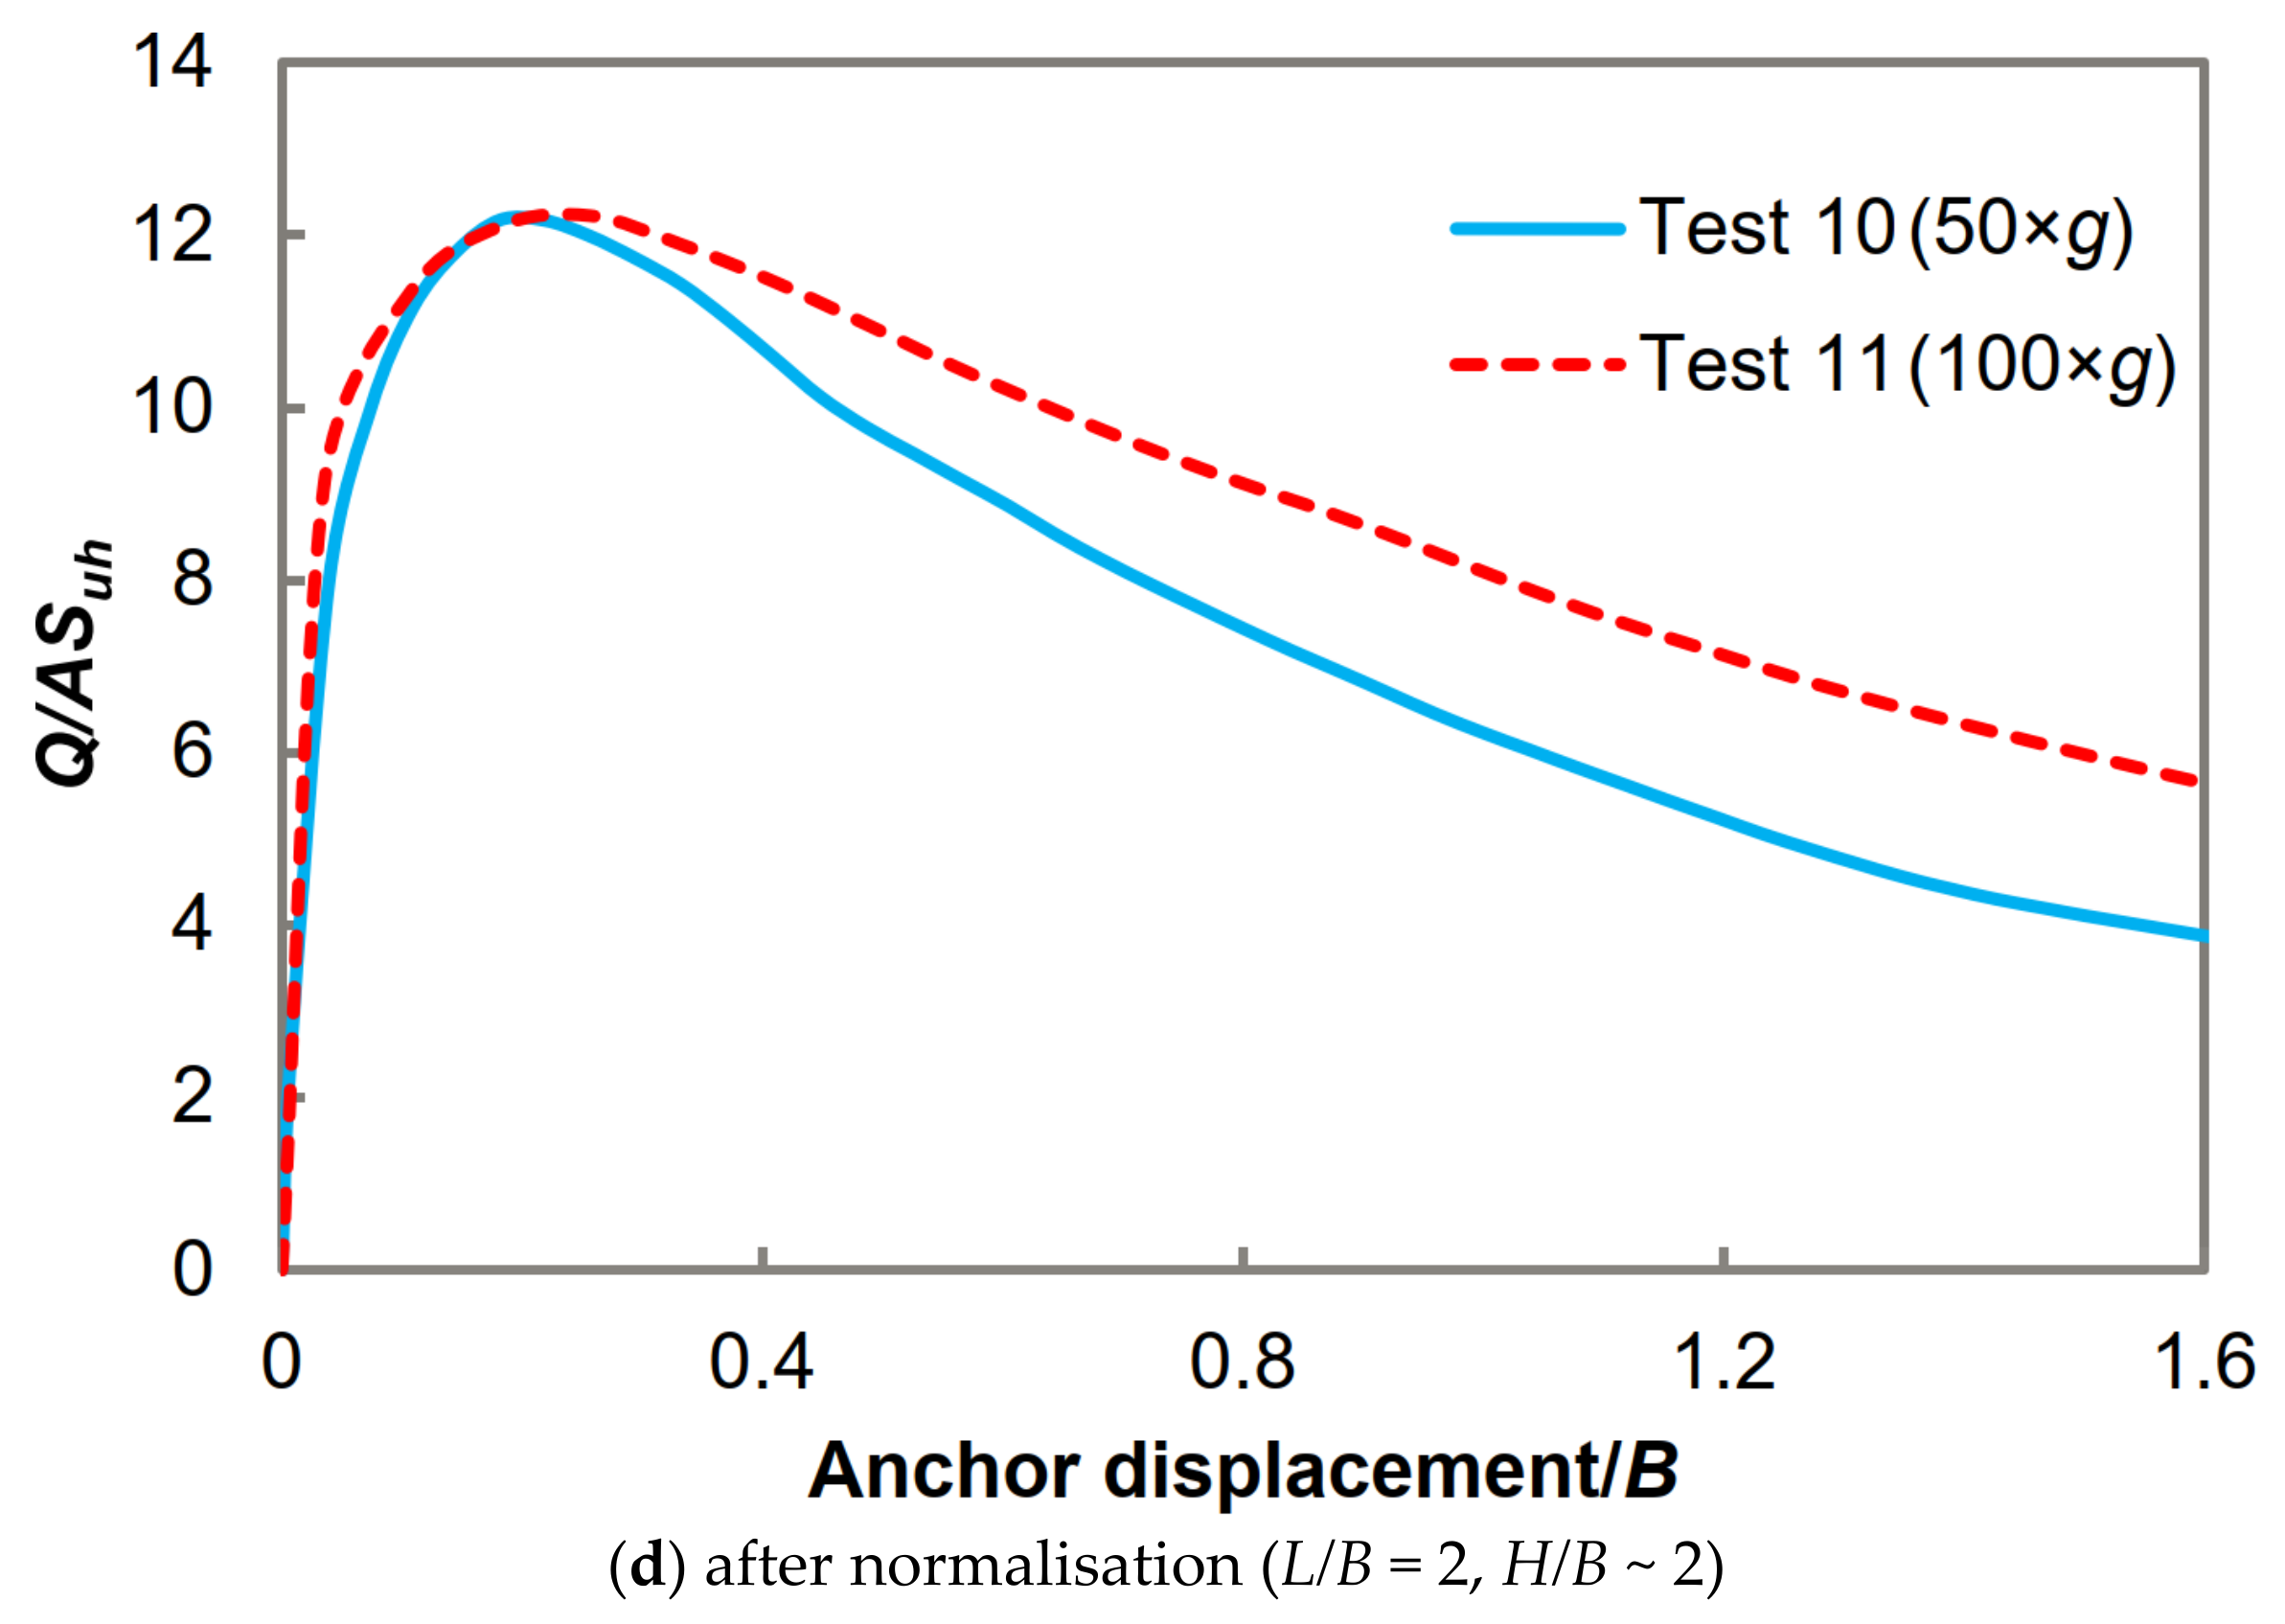
4.3. Verification for the Same Prototype Conditions at Different g Levels

Tests 4 and 5 involve square anchors with the same prototype width and very similar embedment ratios of around 3 conducted at 2 different g levels. Similarly, Tests 10 and 11 involve rectangular anchors with a very similar embedment ratio of around 2. Figure 5a,b show the anchor load-displacement responses for the above tests. The anchor resistance under 100× g was found to be higher than that under 50× g due to the different soil strength profiles (Figure 3). However, after normalisation using Equation (1), the same anchor capacity factor was obtained, see Figure 5c,d. Despite the difference in the soil strength profiles, the reliability of the modelling and the test results was hence verified using the modelling of the model technique [26].
It can also be seen from Figure 5 that there is a “softening” response during the pull-out, which exists in both unnormalised and normalised curves, where the load starts to decrease right after the peak value is reached. This response is partially due to the loss of suction force between anchor base and the underlying soil, which will be discussed in Section 7.1.

5. Results on Horizontal Anchors

Three series of tests on square, rectangular, and strip horizontal anchors with shallow to deep embedment were investigated, see Table 2. Hereinafter, all test results are presented in prototype scale.

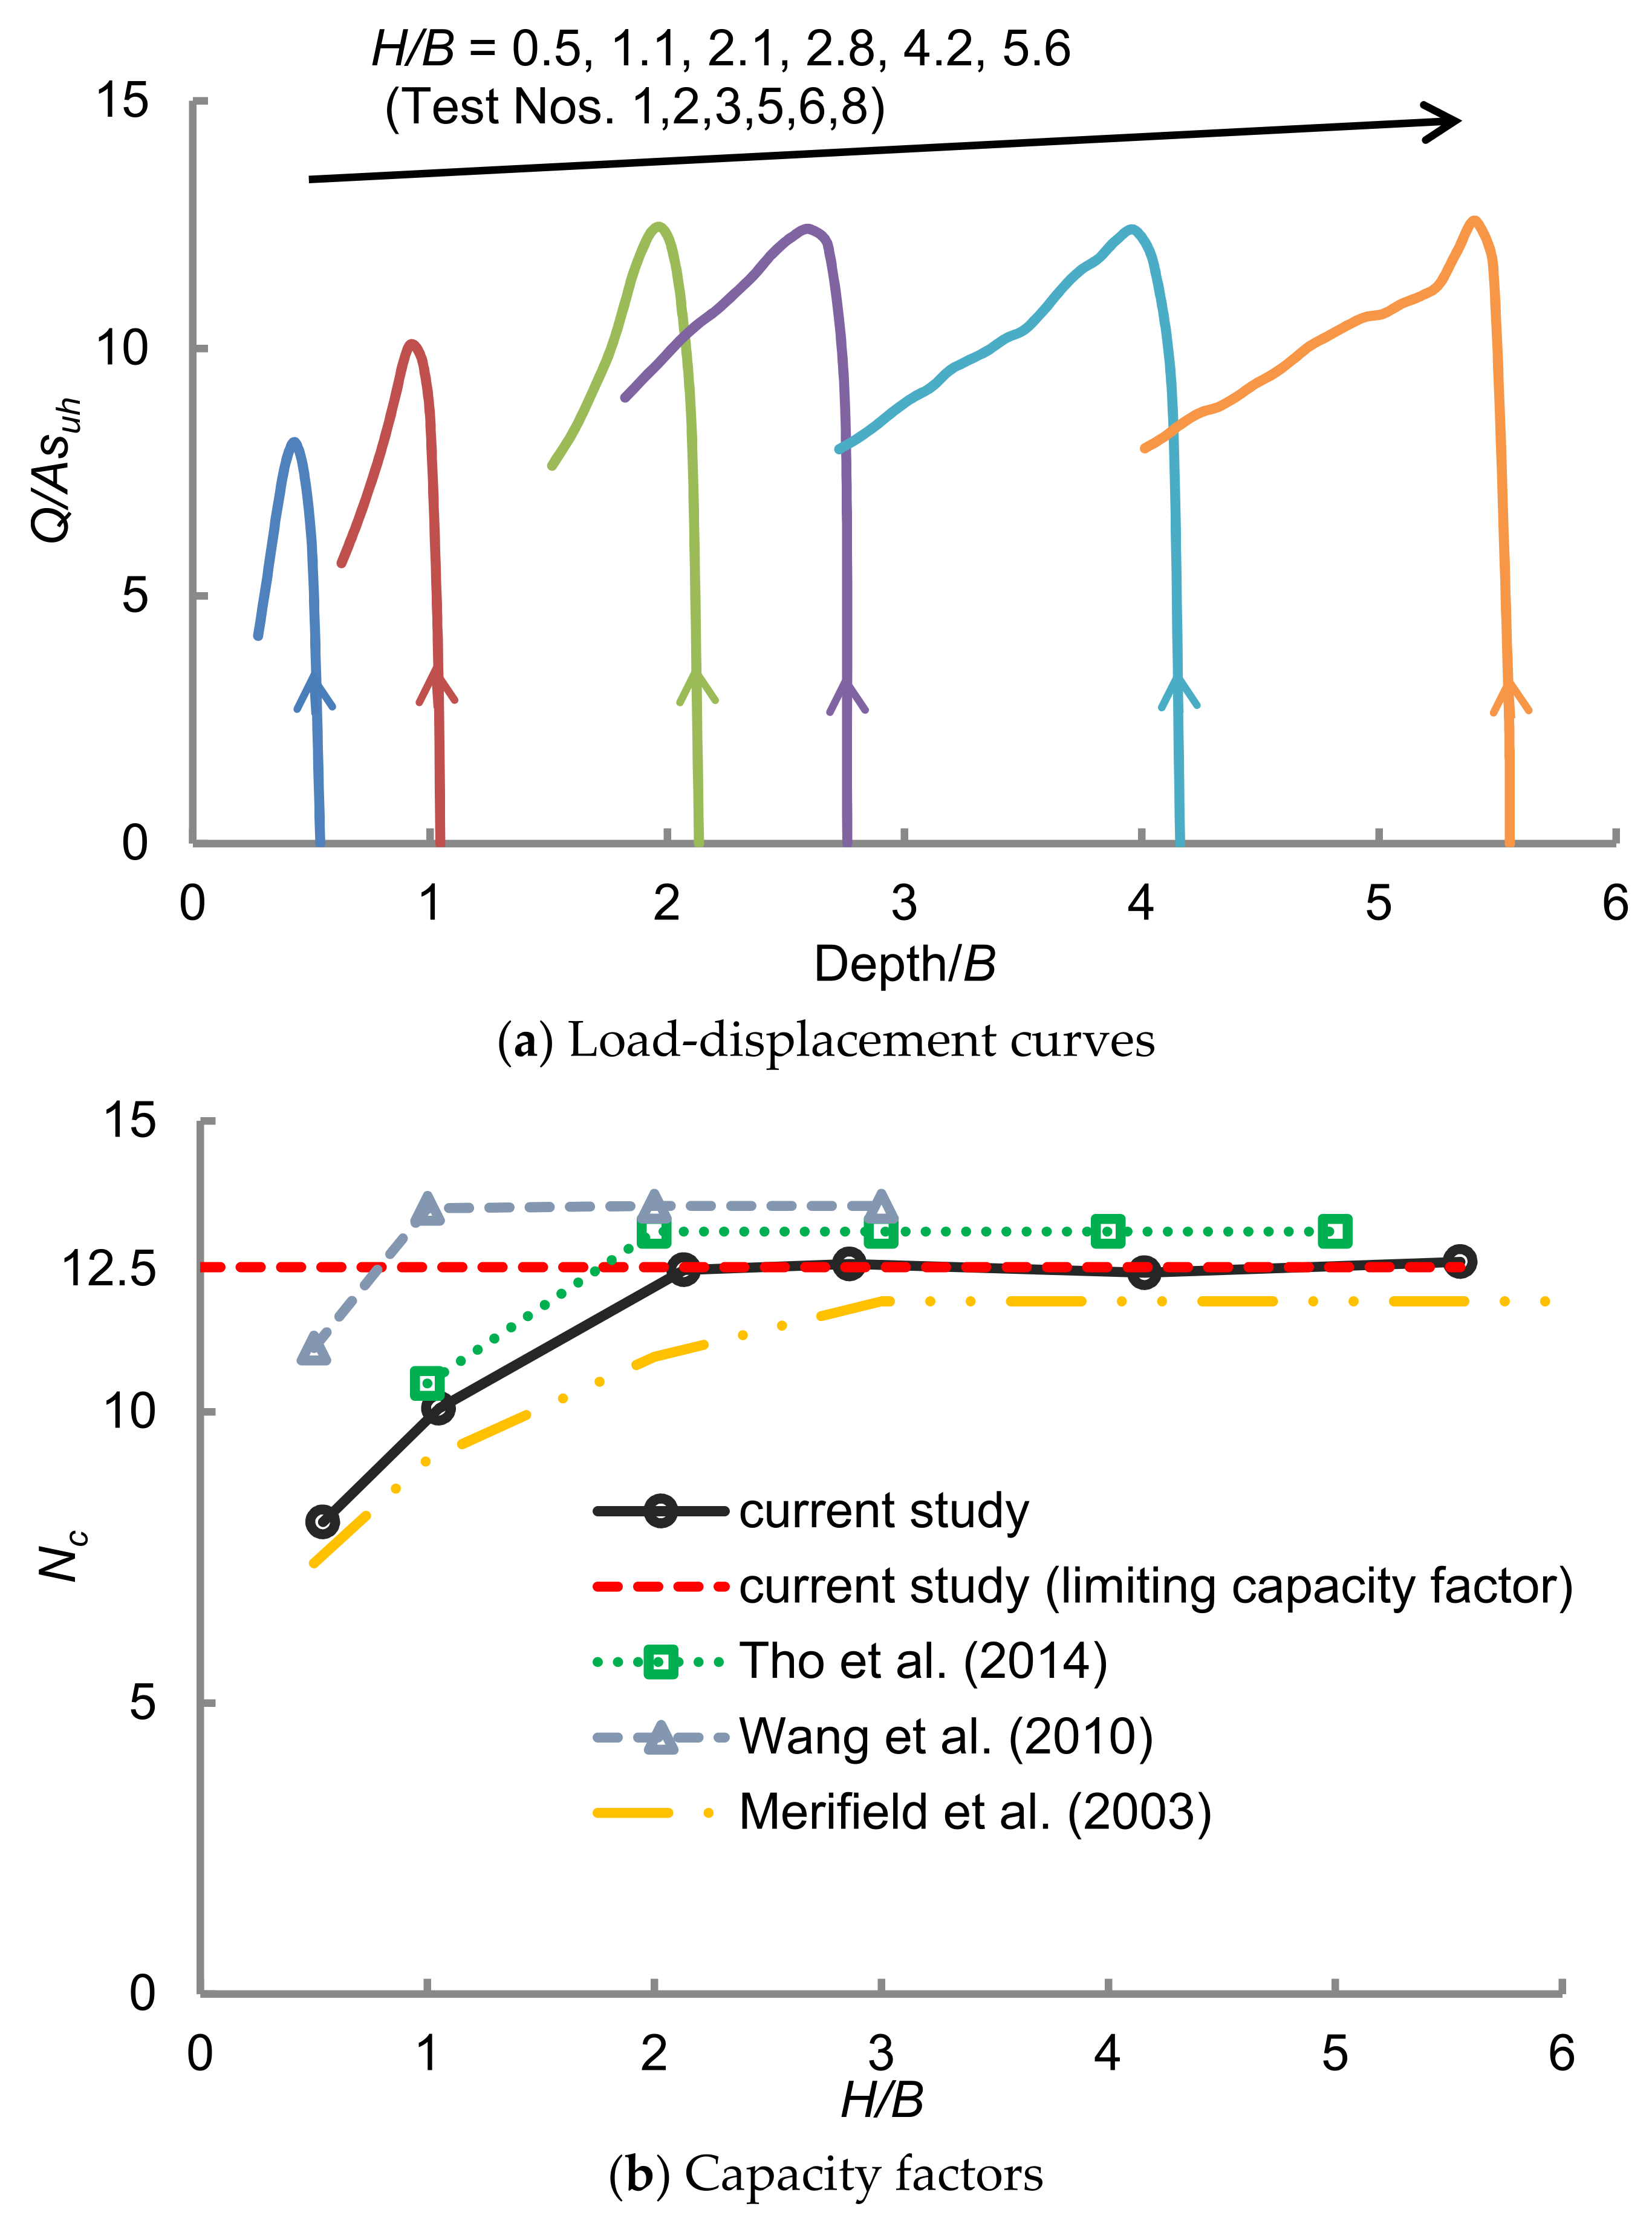
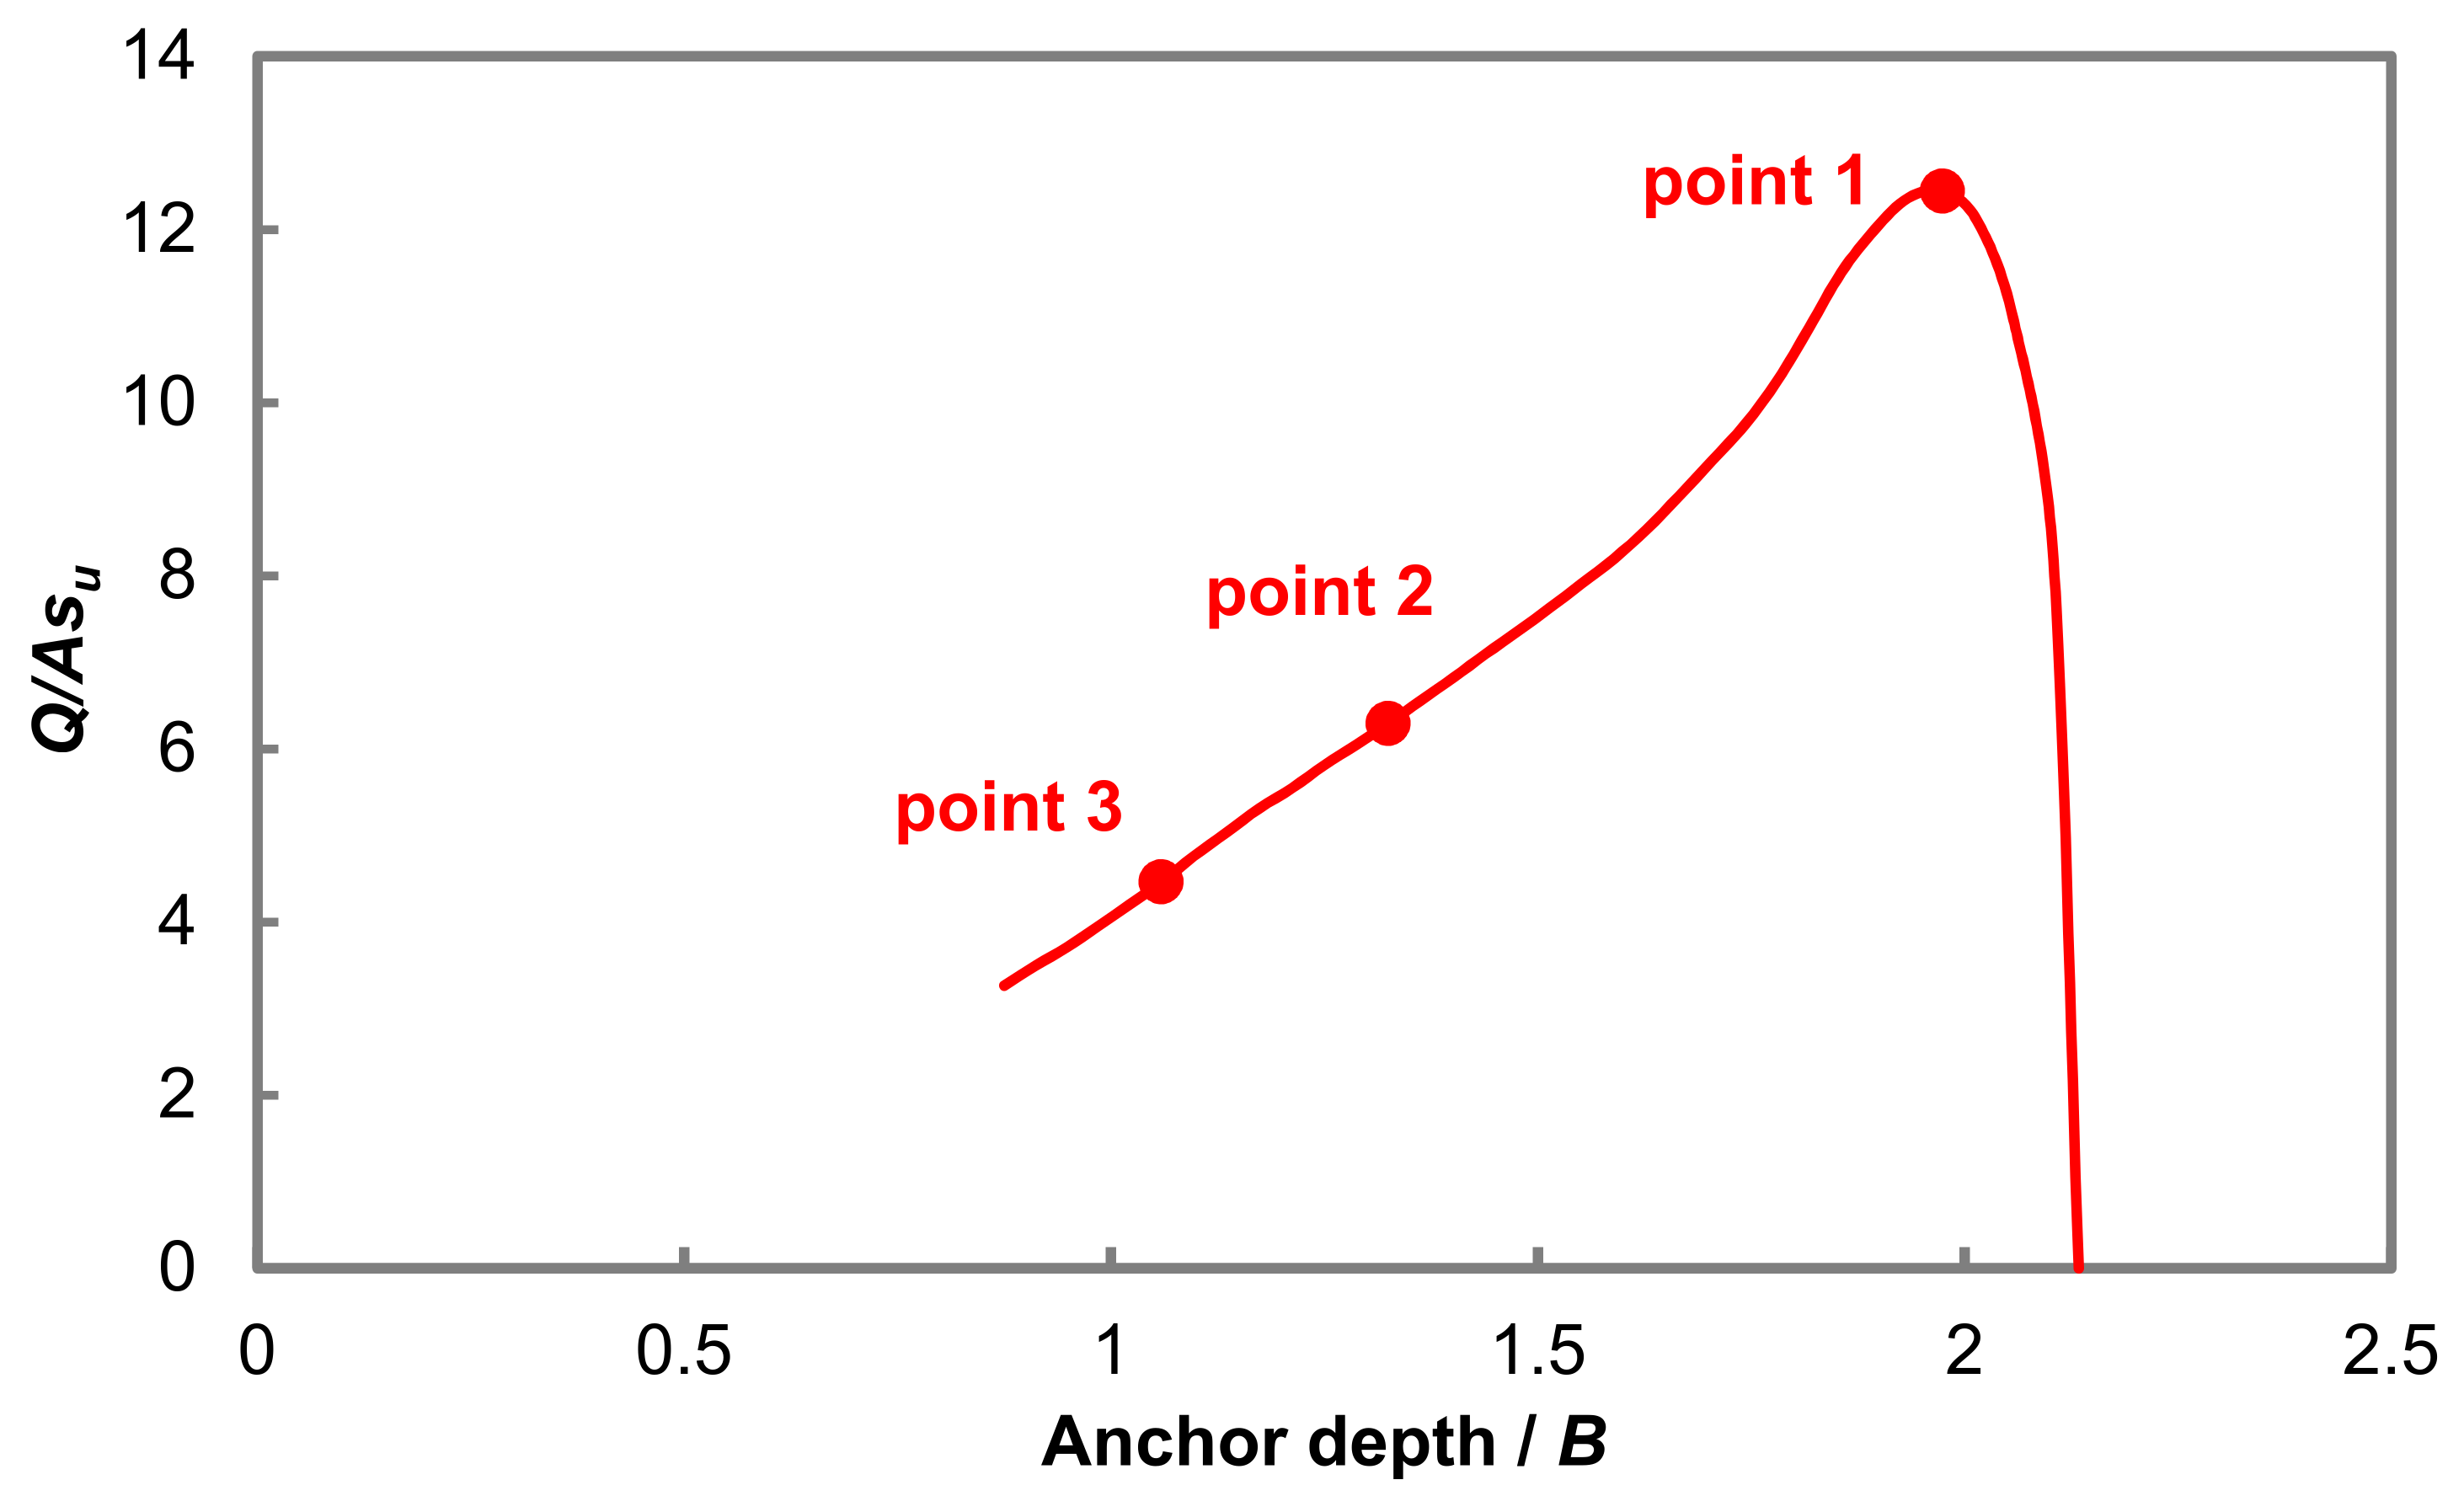
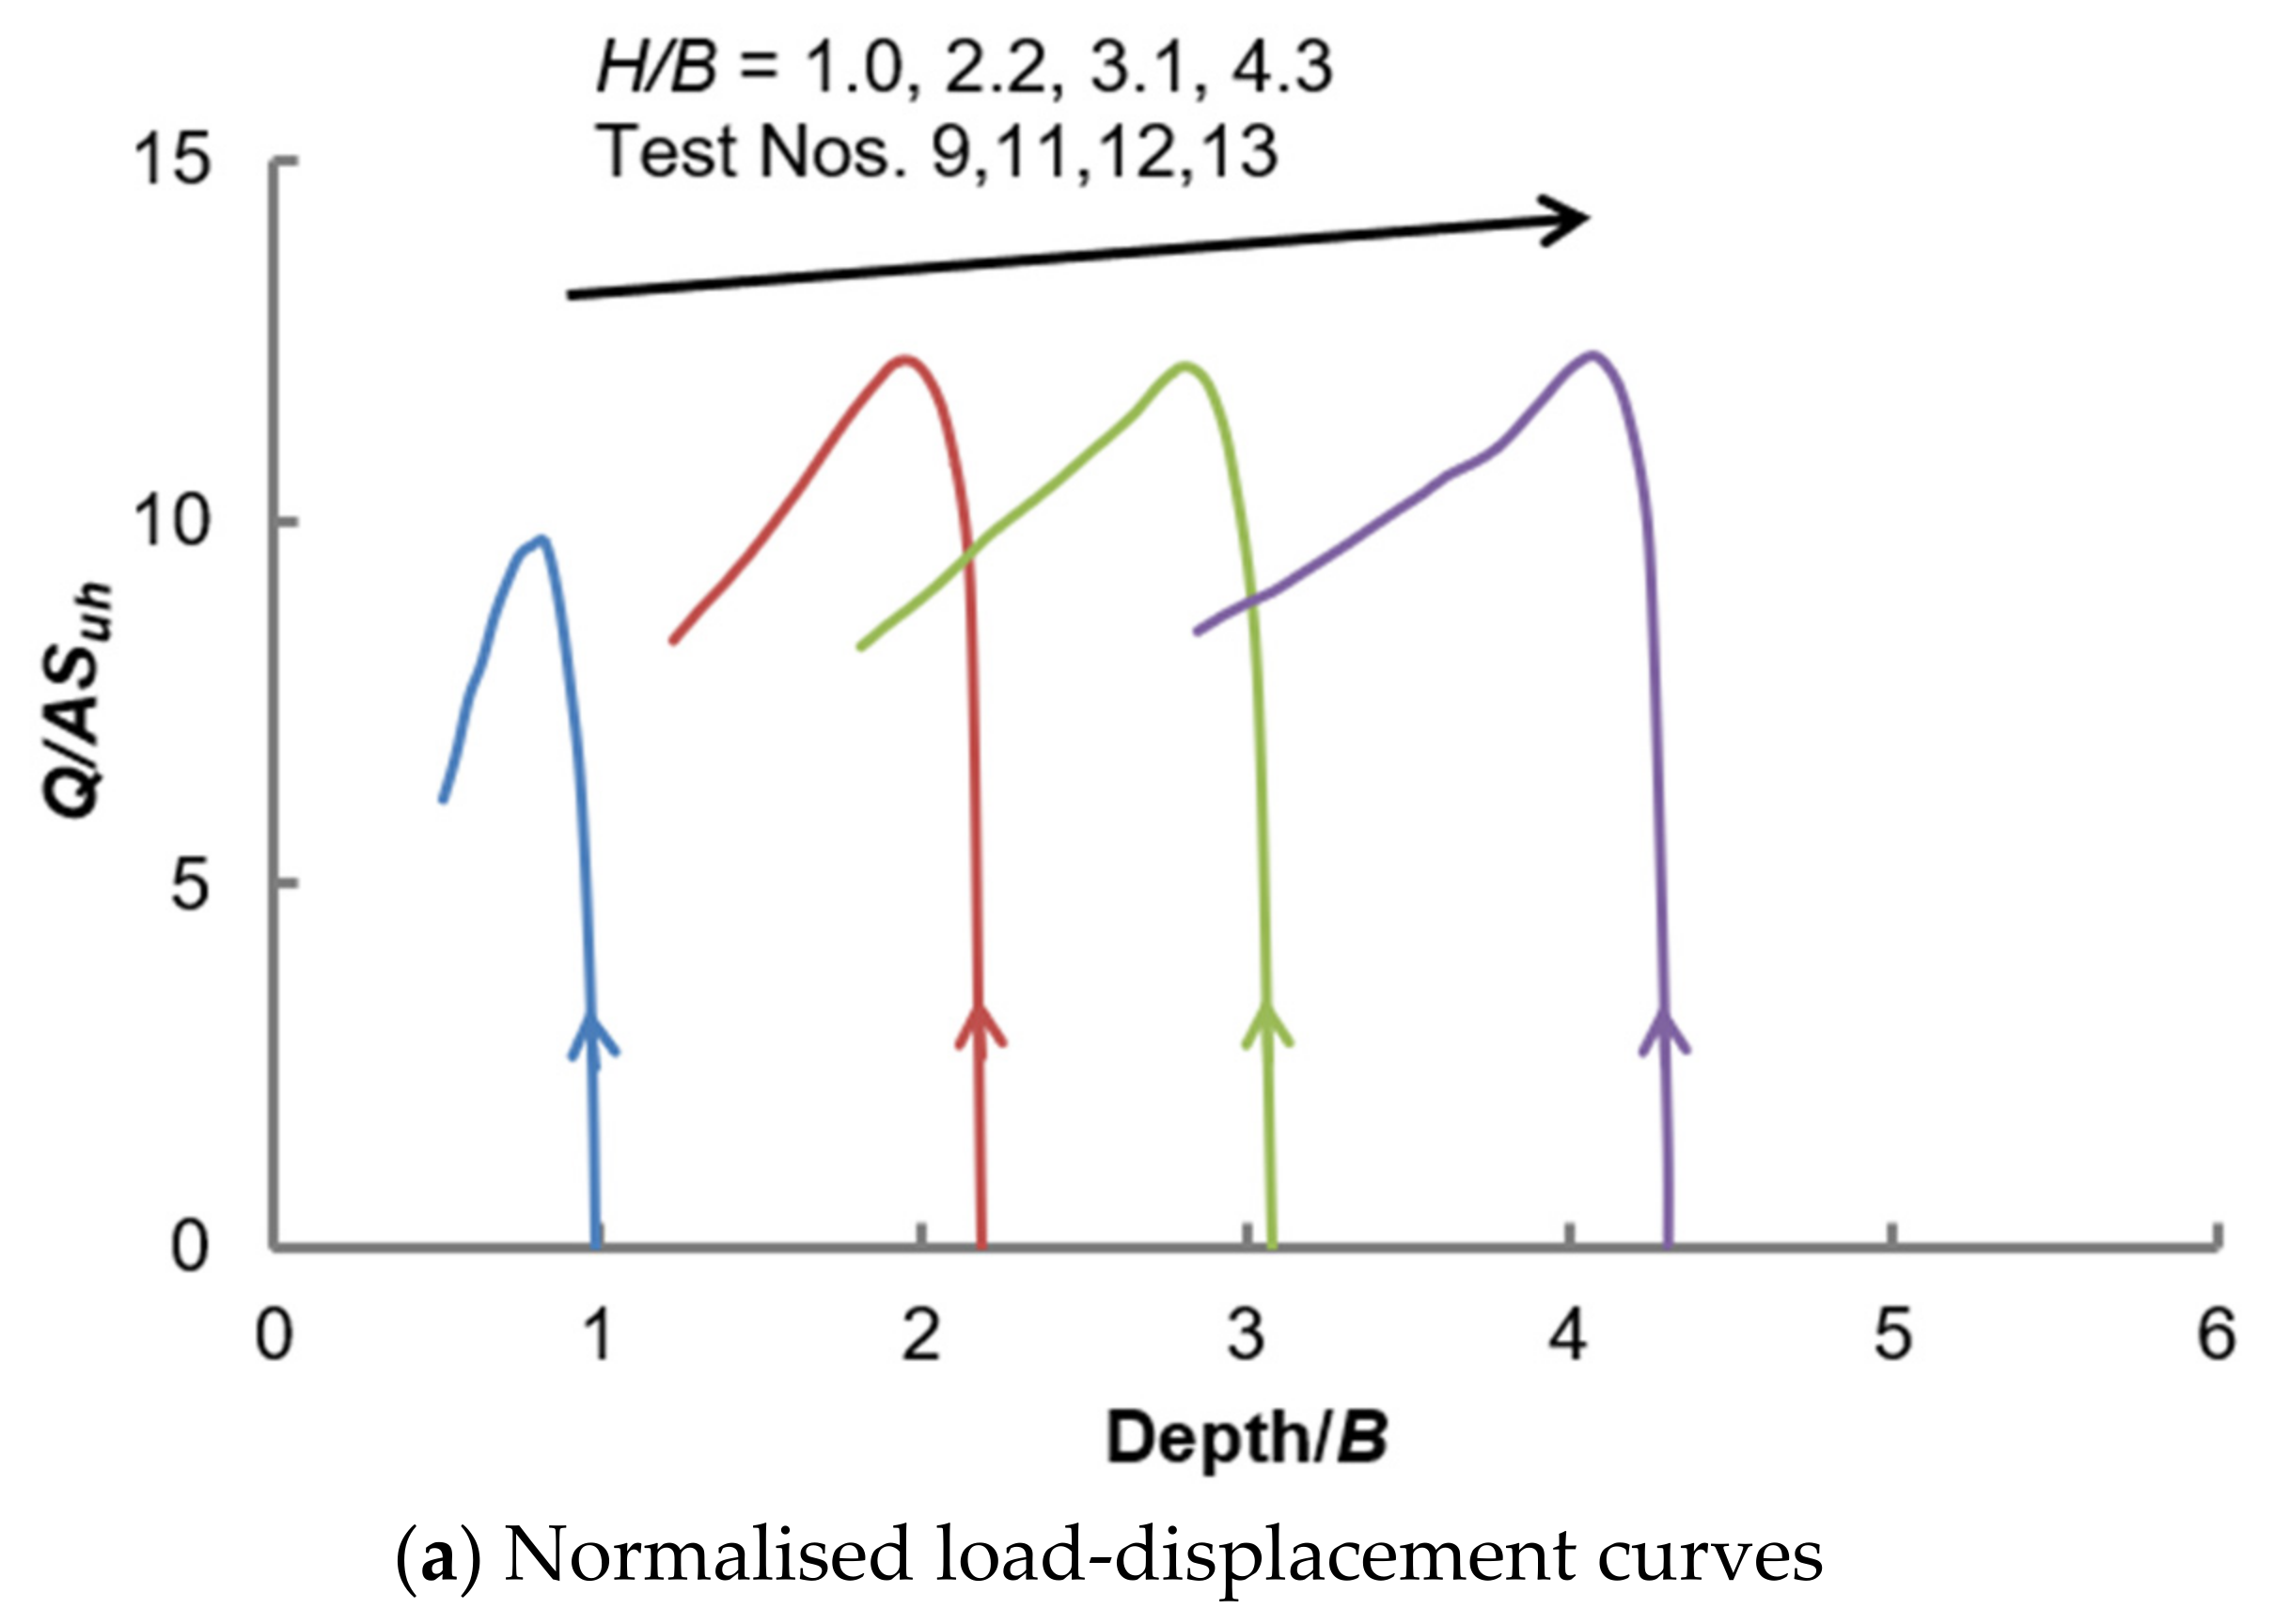
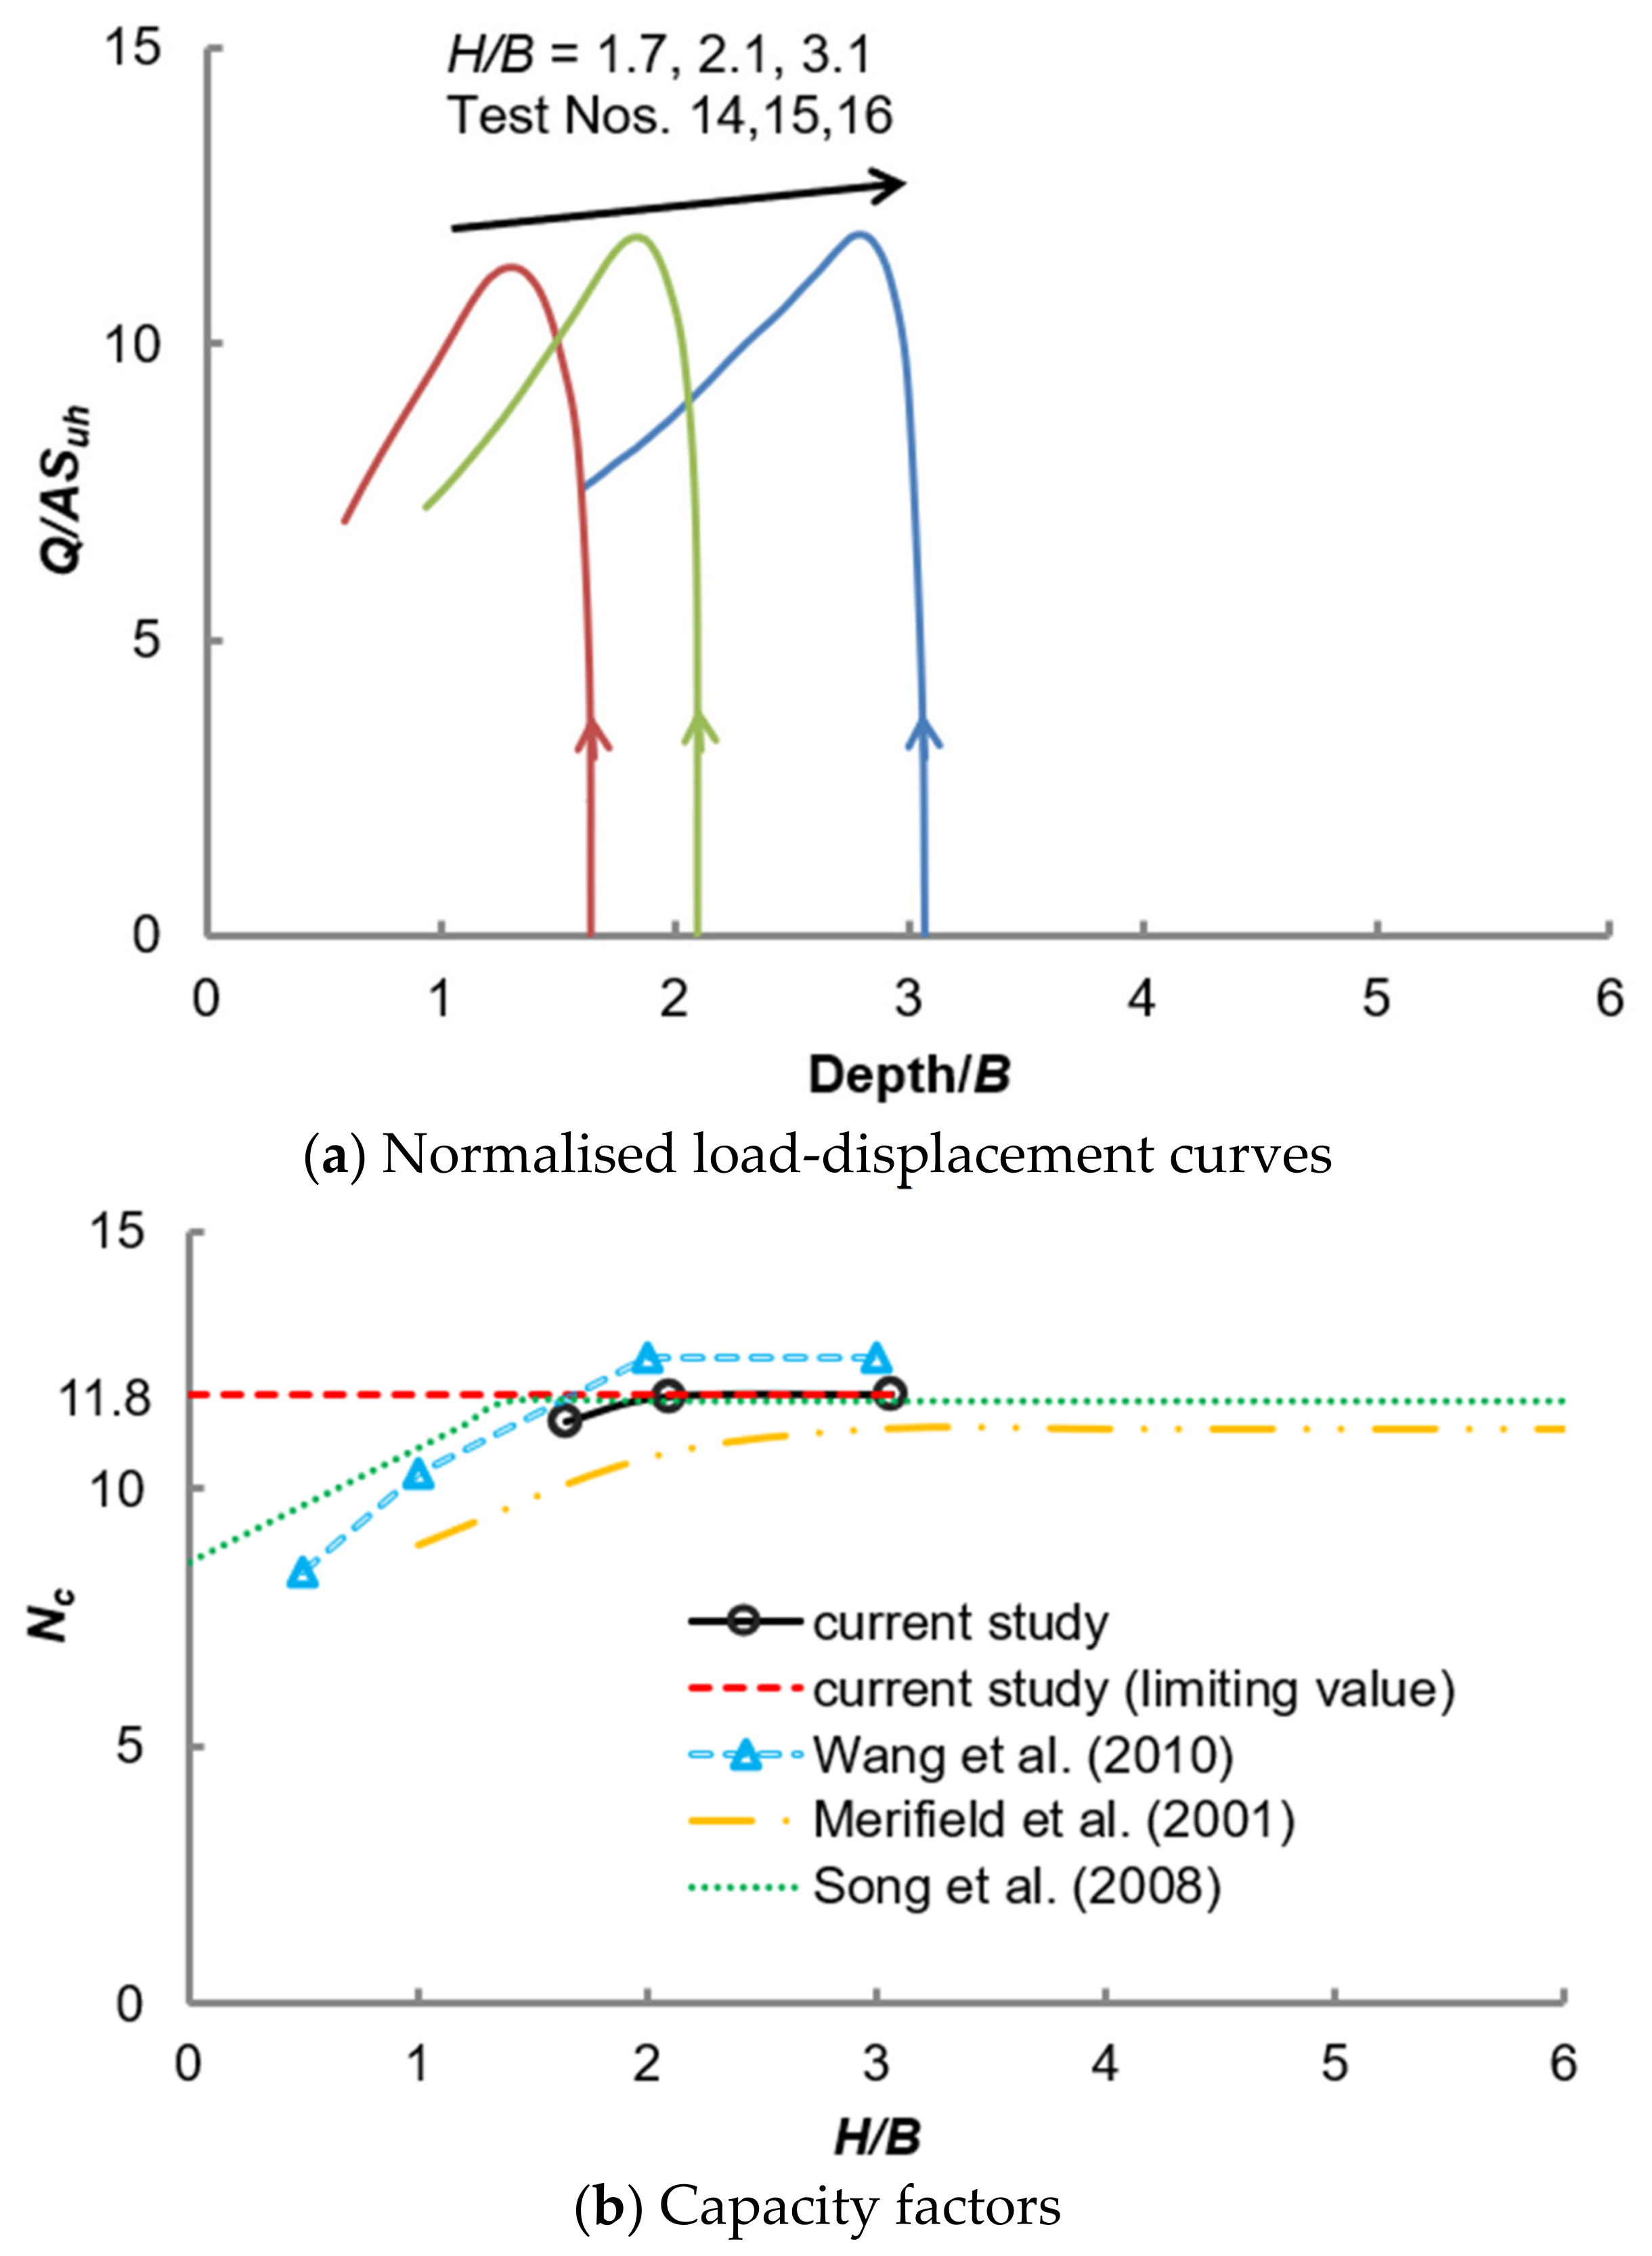
5.1. Normalised Load–Displacement Curve

Figure 6a shows the anchor load-displacement responses of the horizontal square anchors at different embedment depths. In the figure, the vertical axis represents the anchor resistance Q normalised by the anchor plan area A and the undrained soil strength at the initial anchor elevation, suh. The horizontal axis of Figure 6a denotes the ratio of the depth beneath the seabed over the anchor width B. As such, the starting point of each curve denotes the anchor embedment ratio H/B. For all tests, it is evident that there is a rapid increase in anchor resistance till the ultimate peak magnitude followed by a gradual decrease to a post-peak magnitude with no plateau observed, which has been mentioned above in Section 4.3. It is evident that the anchor capacity (the peak load points in each curve) does not increase much when H/B exceeds 2, revealing deep anchor failure mechanism beyond this anchor embedment ratio.
The test results expressed in dimensionless anchor capacity factor are presented in Figure 6b. The anchor capacity factor in NC clay has been investigated theoretically by different researchers [6,8,12]. Their factors are also shown in Figure 6b. The comparison reveals that the anchor capacity factor obtained from the present tests generally agree well with theory except that by Wang et al. [12]. This confirms that the anchor capacity factor increases with embedment depth in shallow cases and reaches a limiting value after H/B exceeds 2, revealing the critical deep embedment ratio as 2.

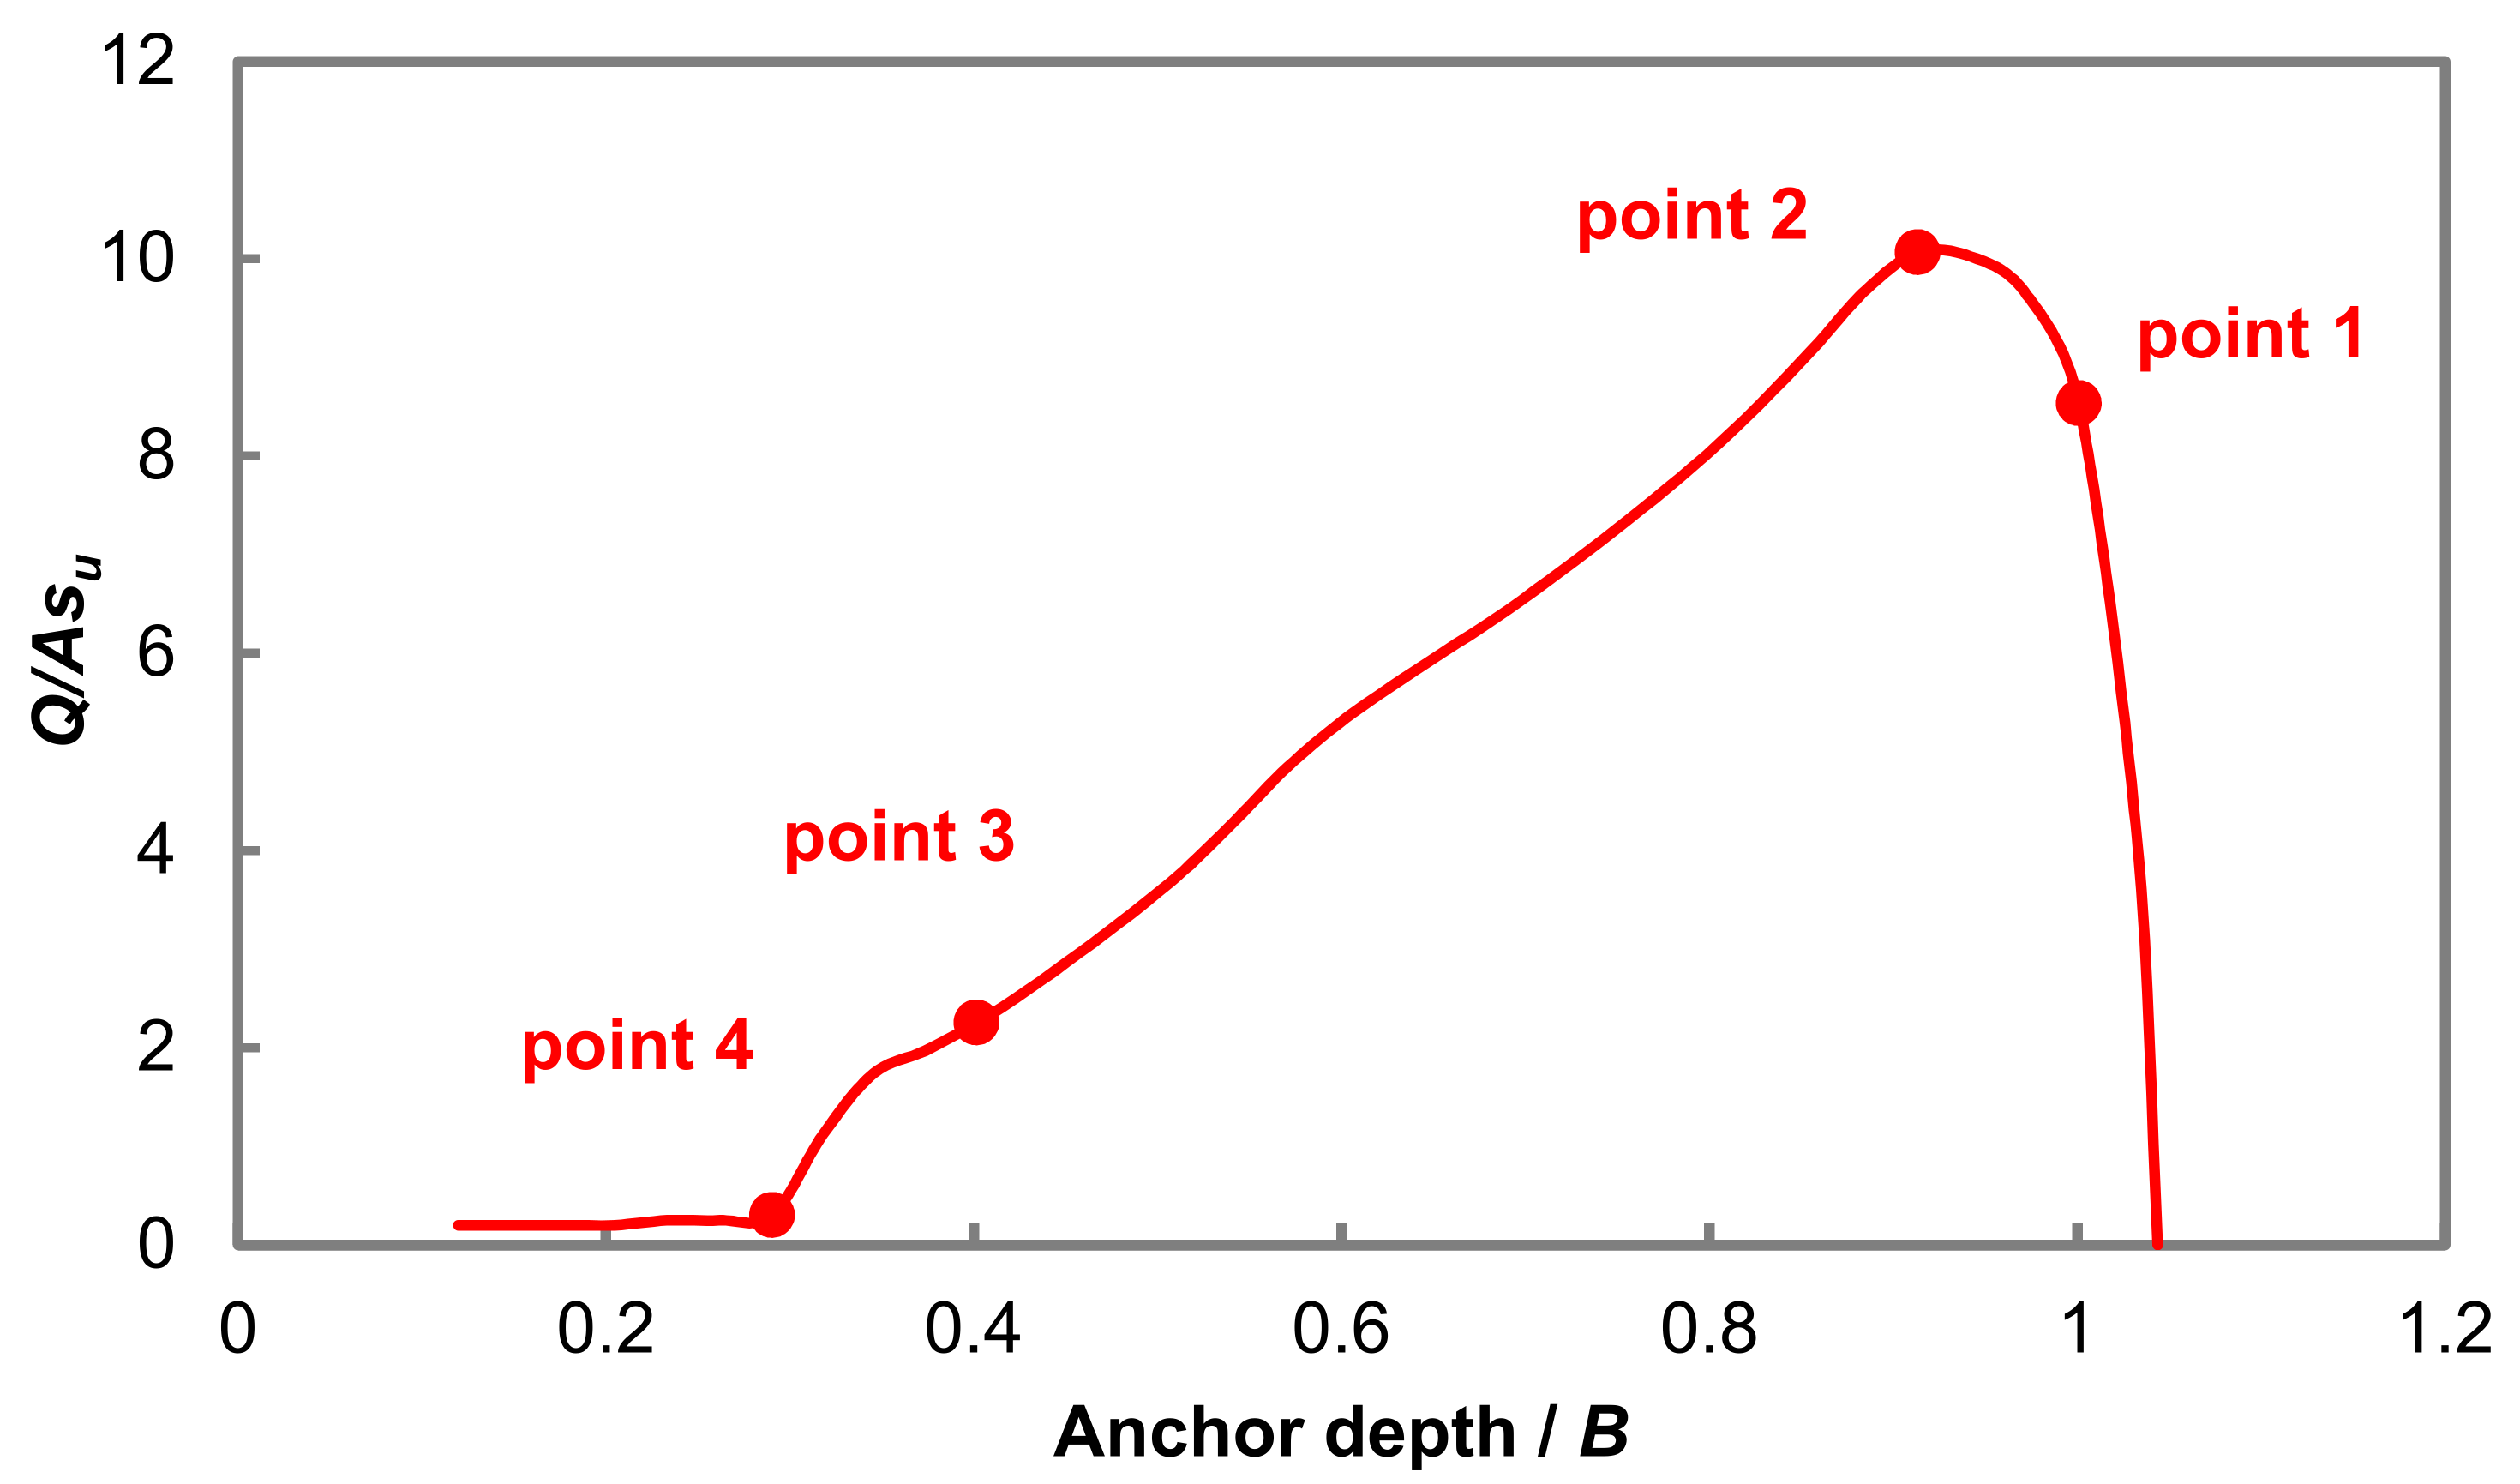
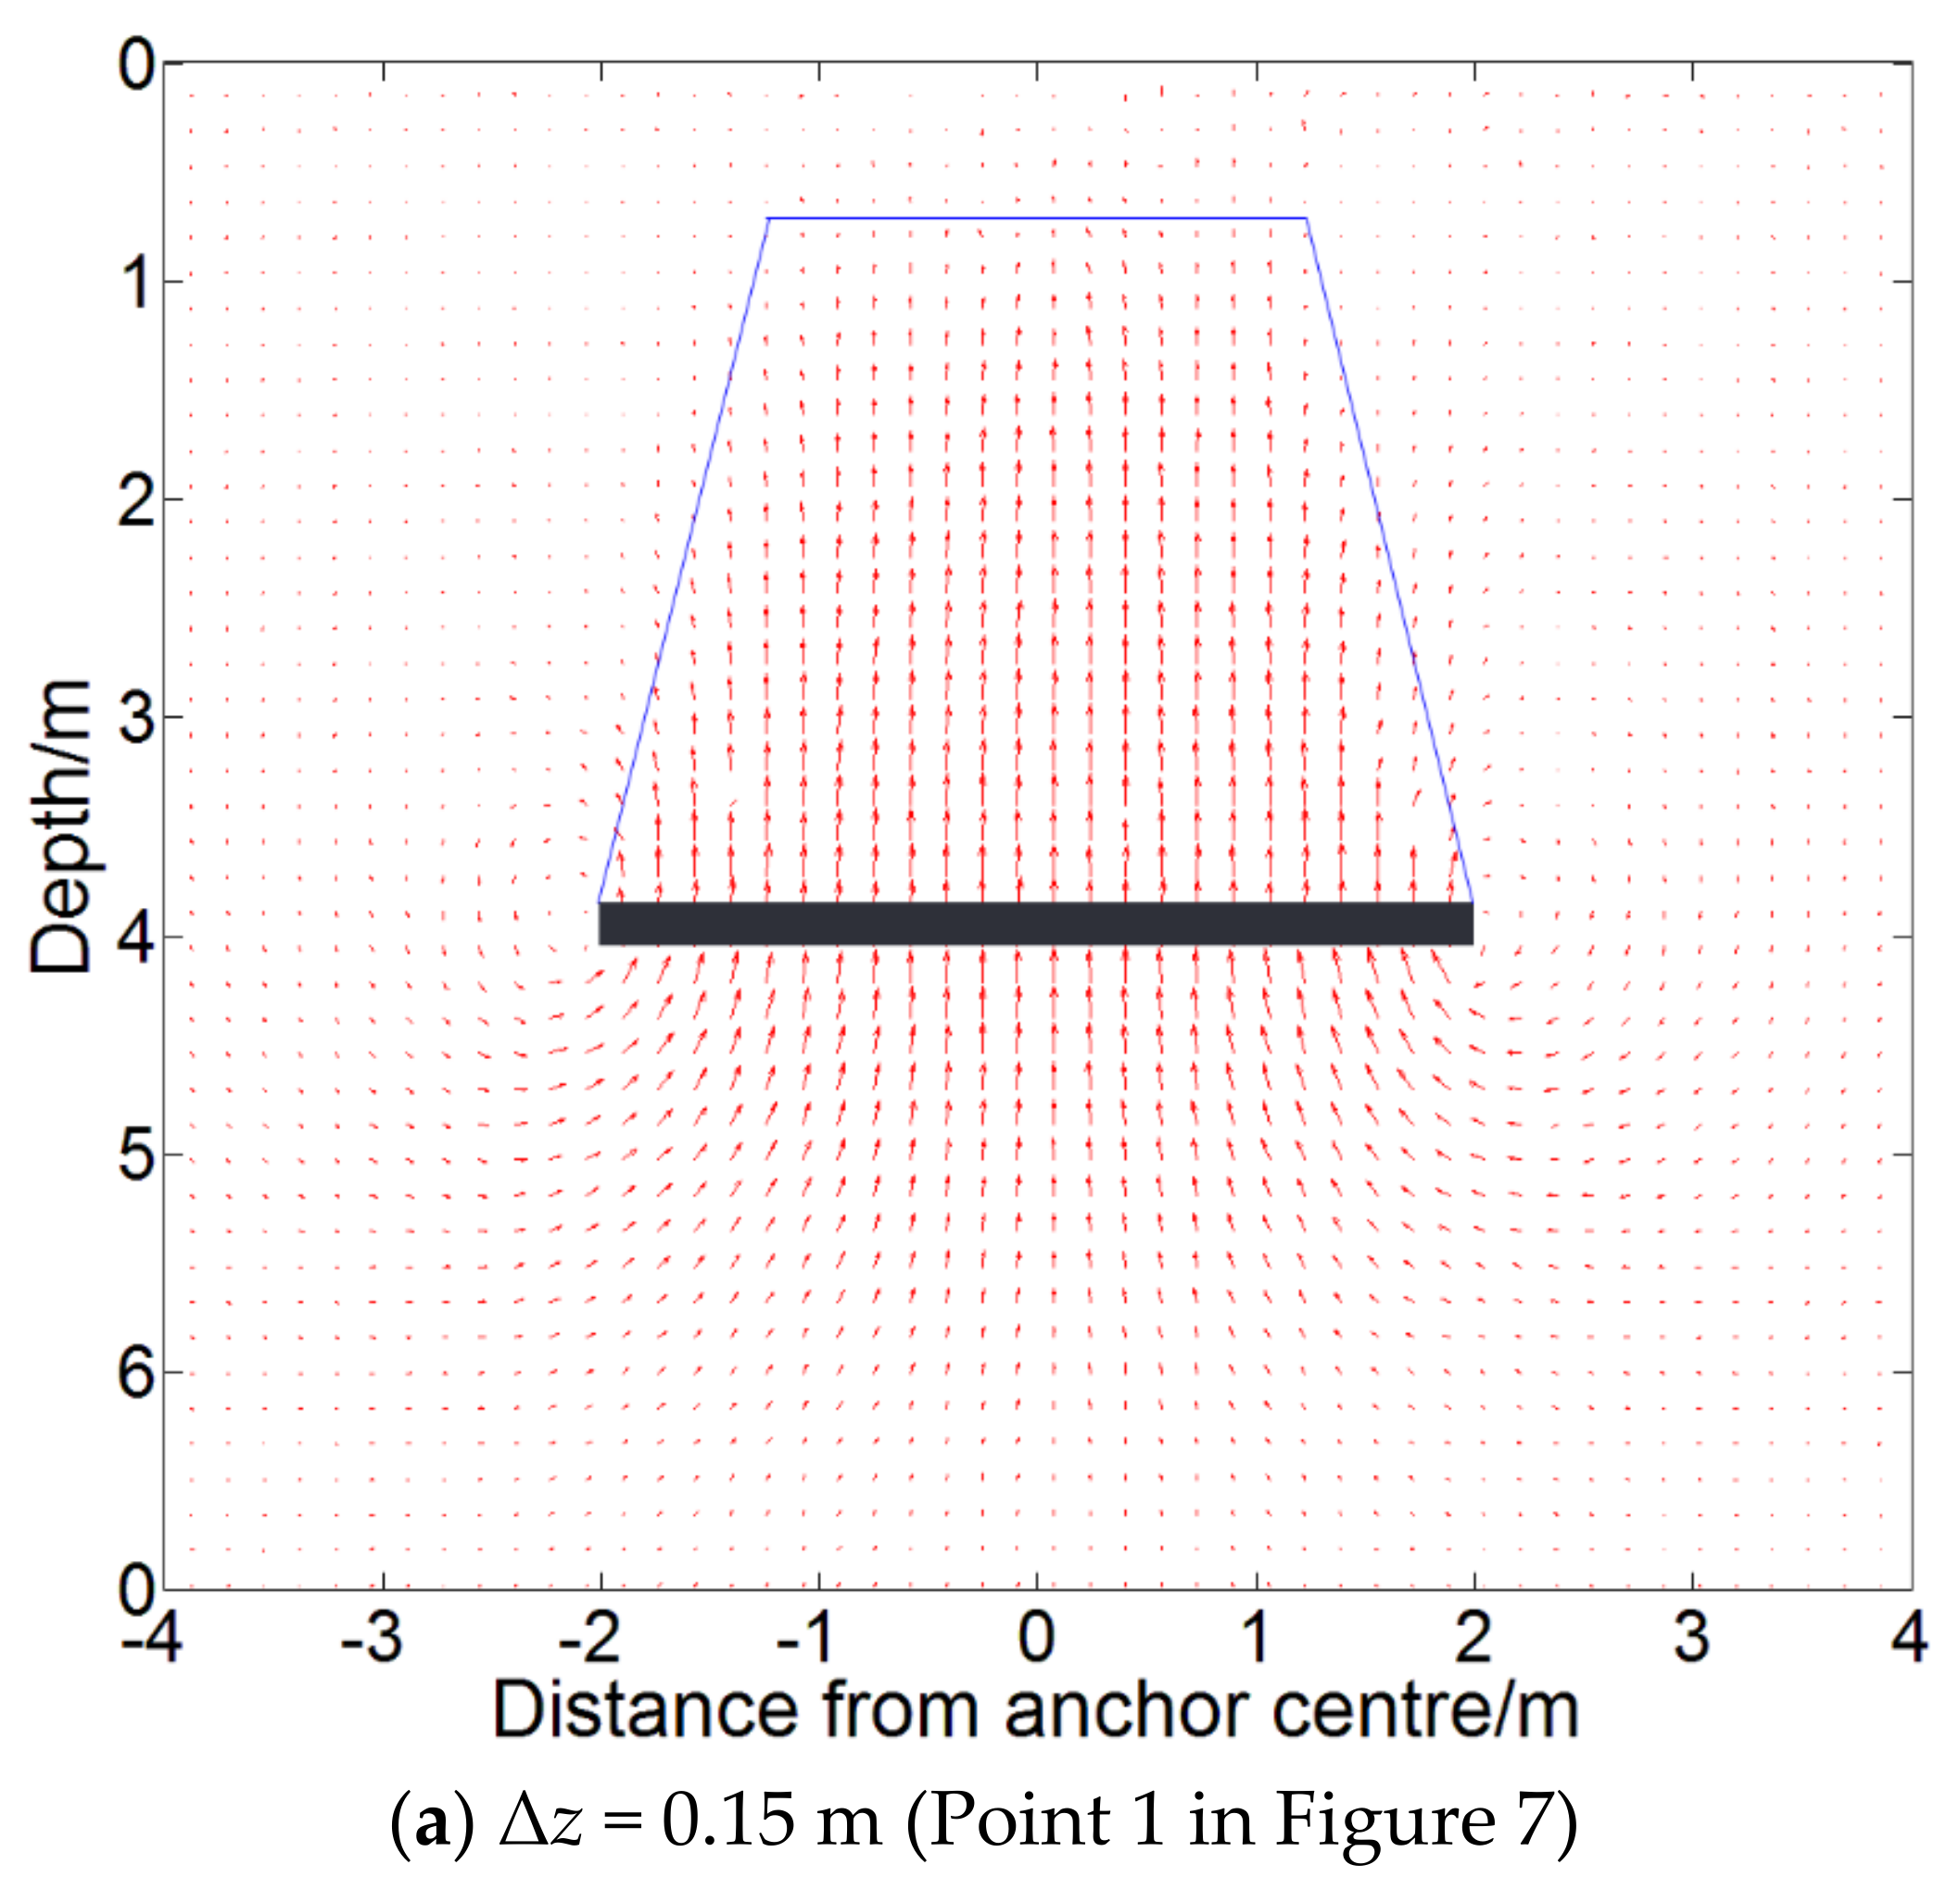
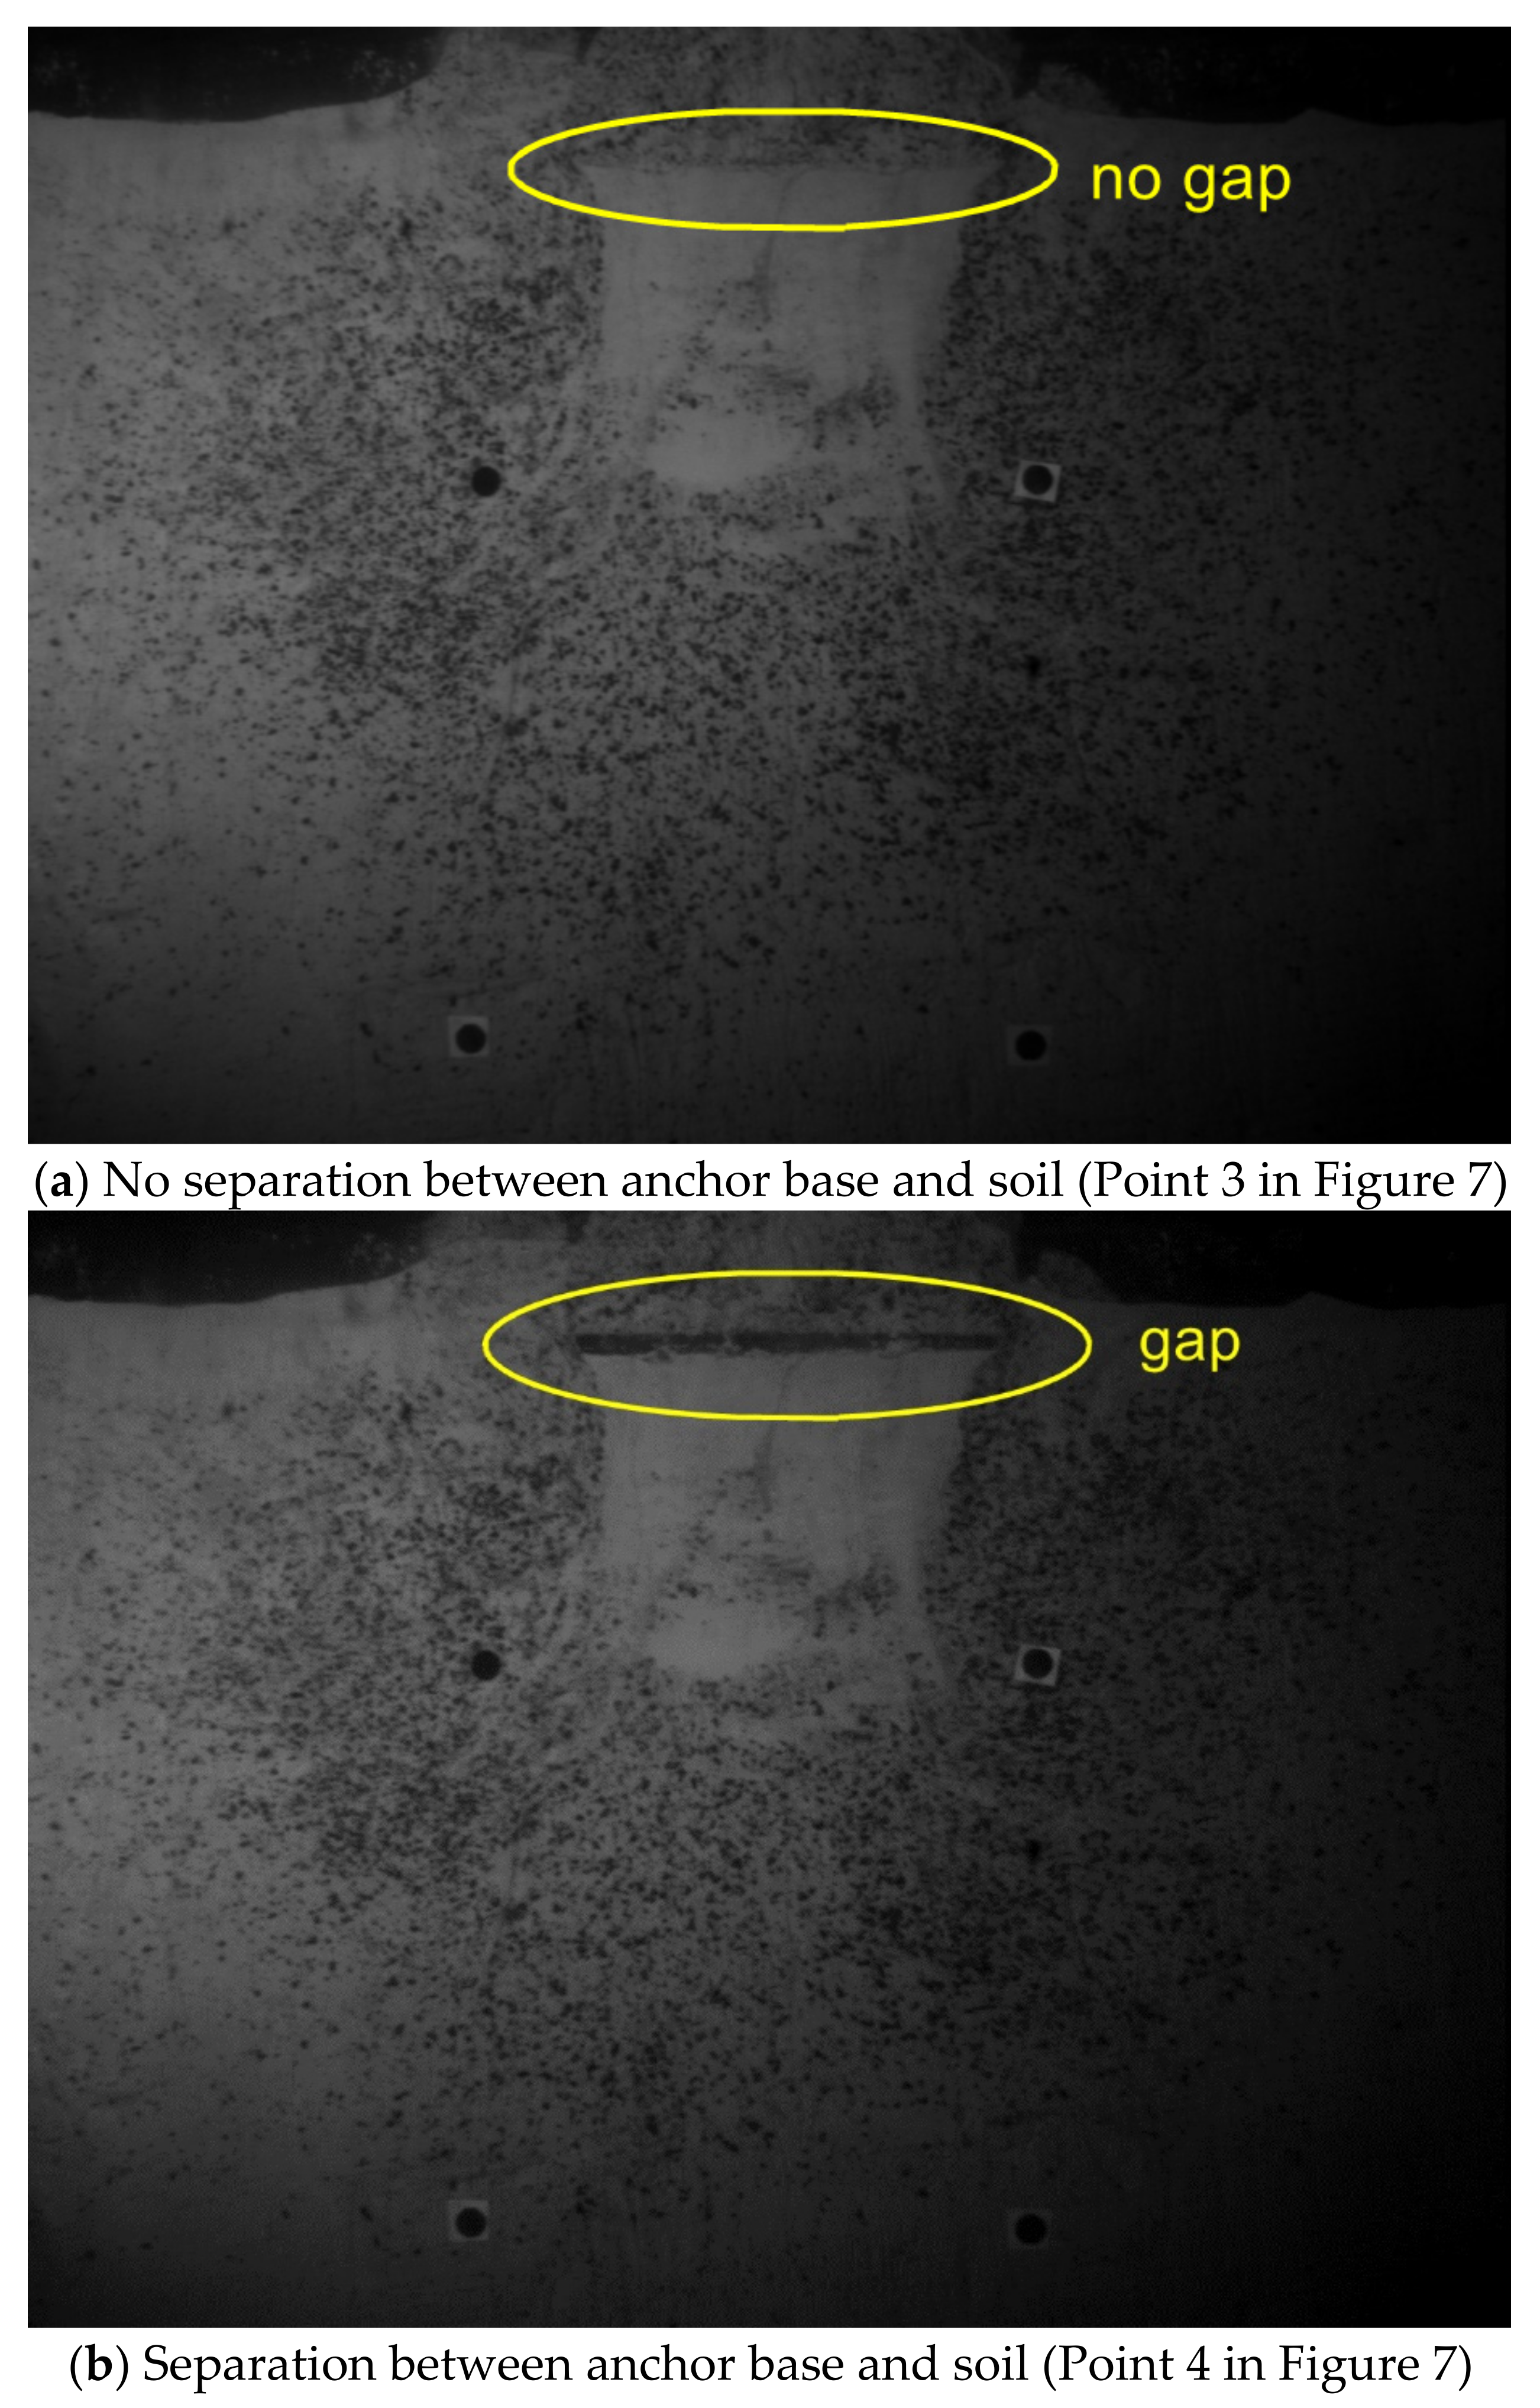
5.2. Bonding at Anchor-Soil Interface

Bonding at the anchor–soil interface is examined here based on PIV analyses obtained from high-resolution photographs taken during the tests for shallow and deep anchors.

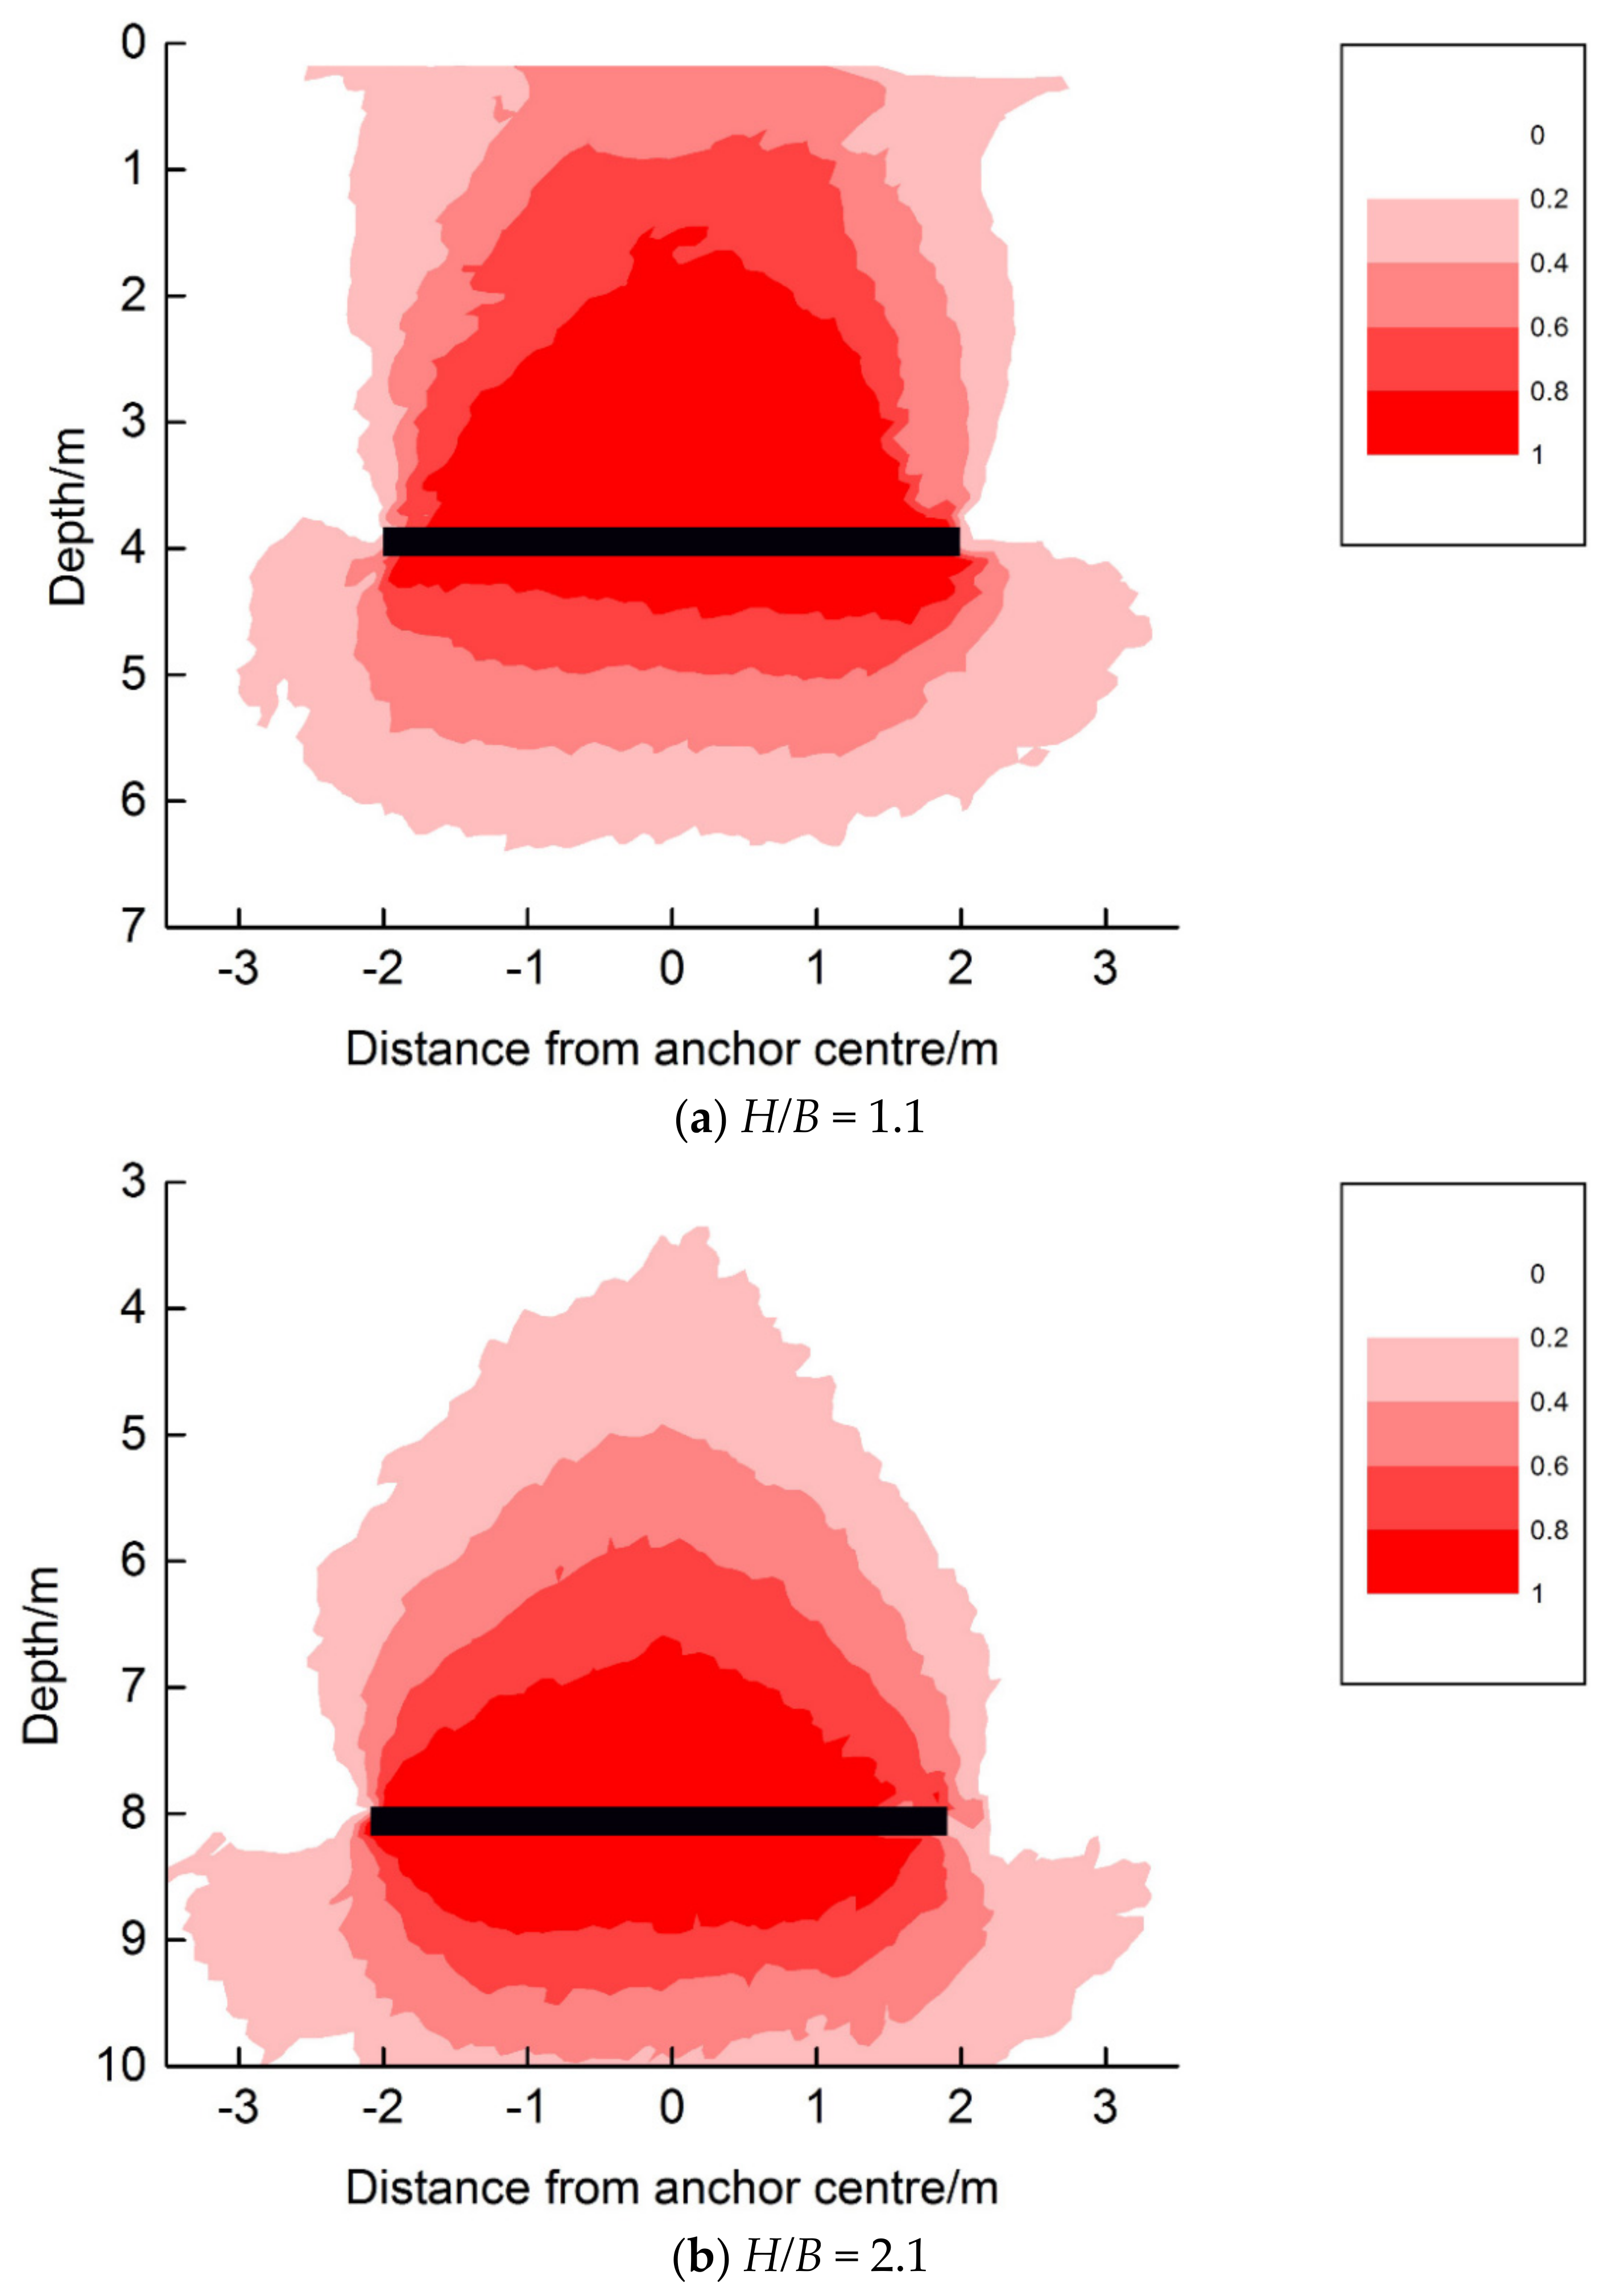
5.2.1. Shallow Anchor
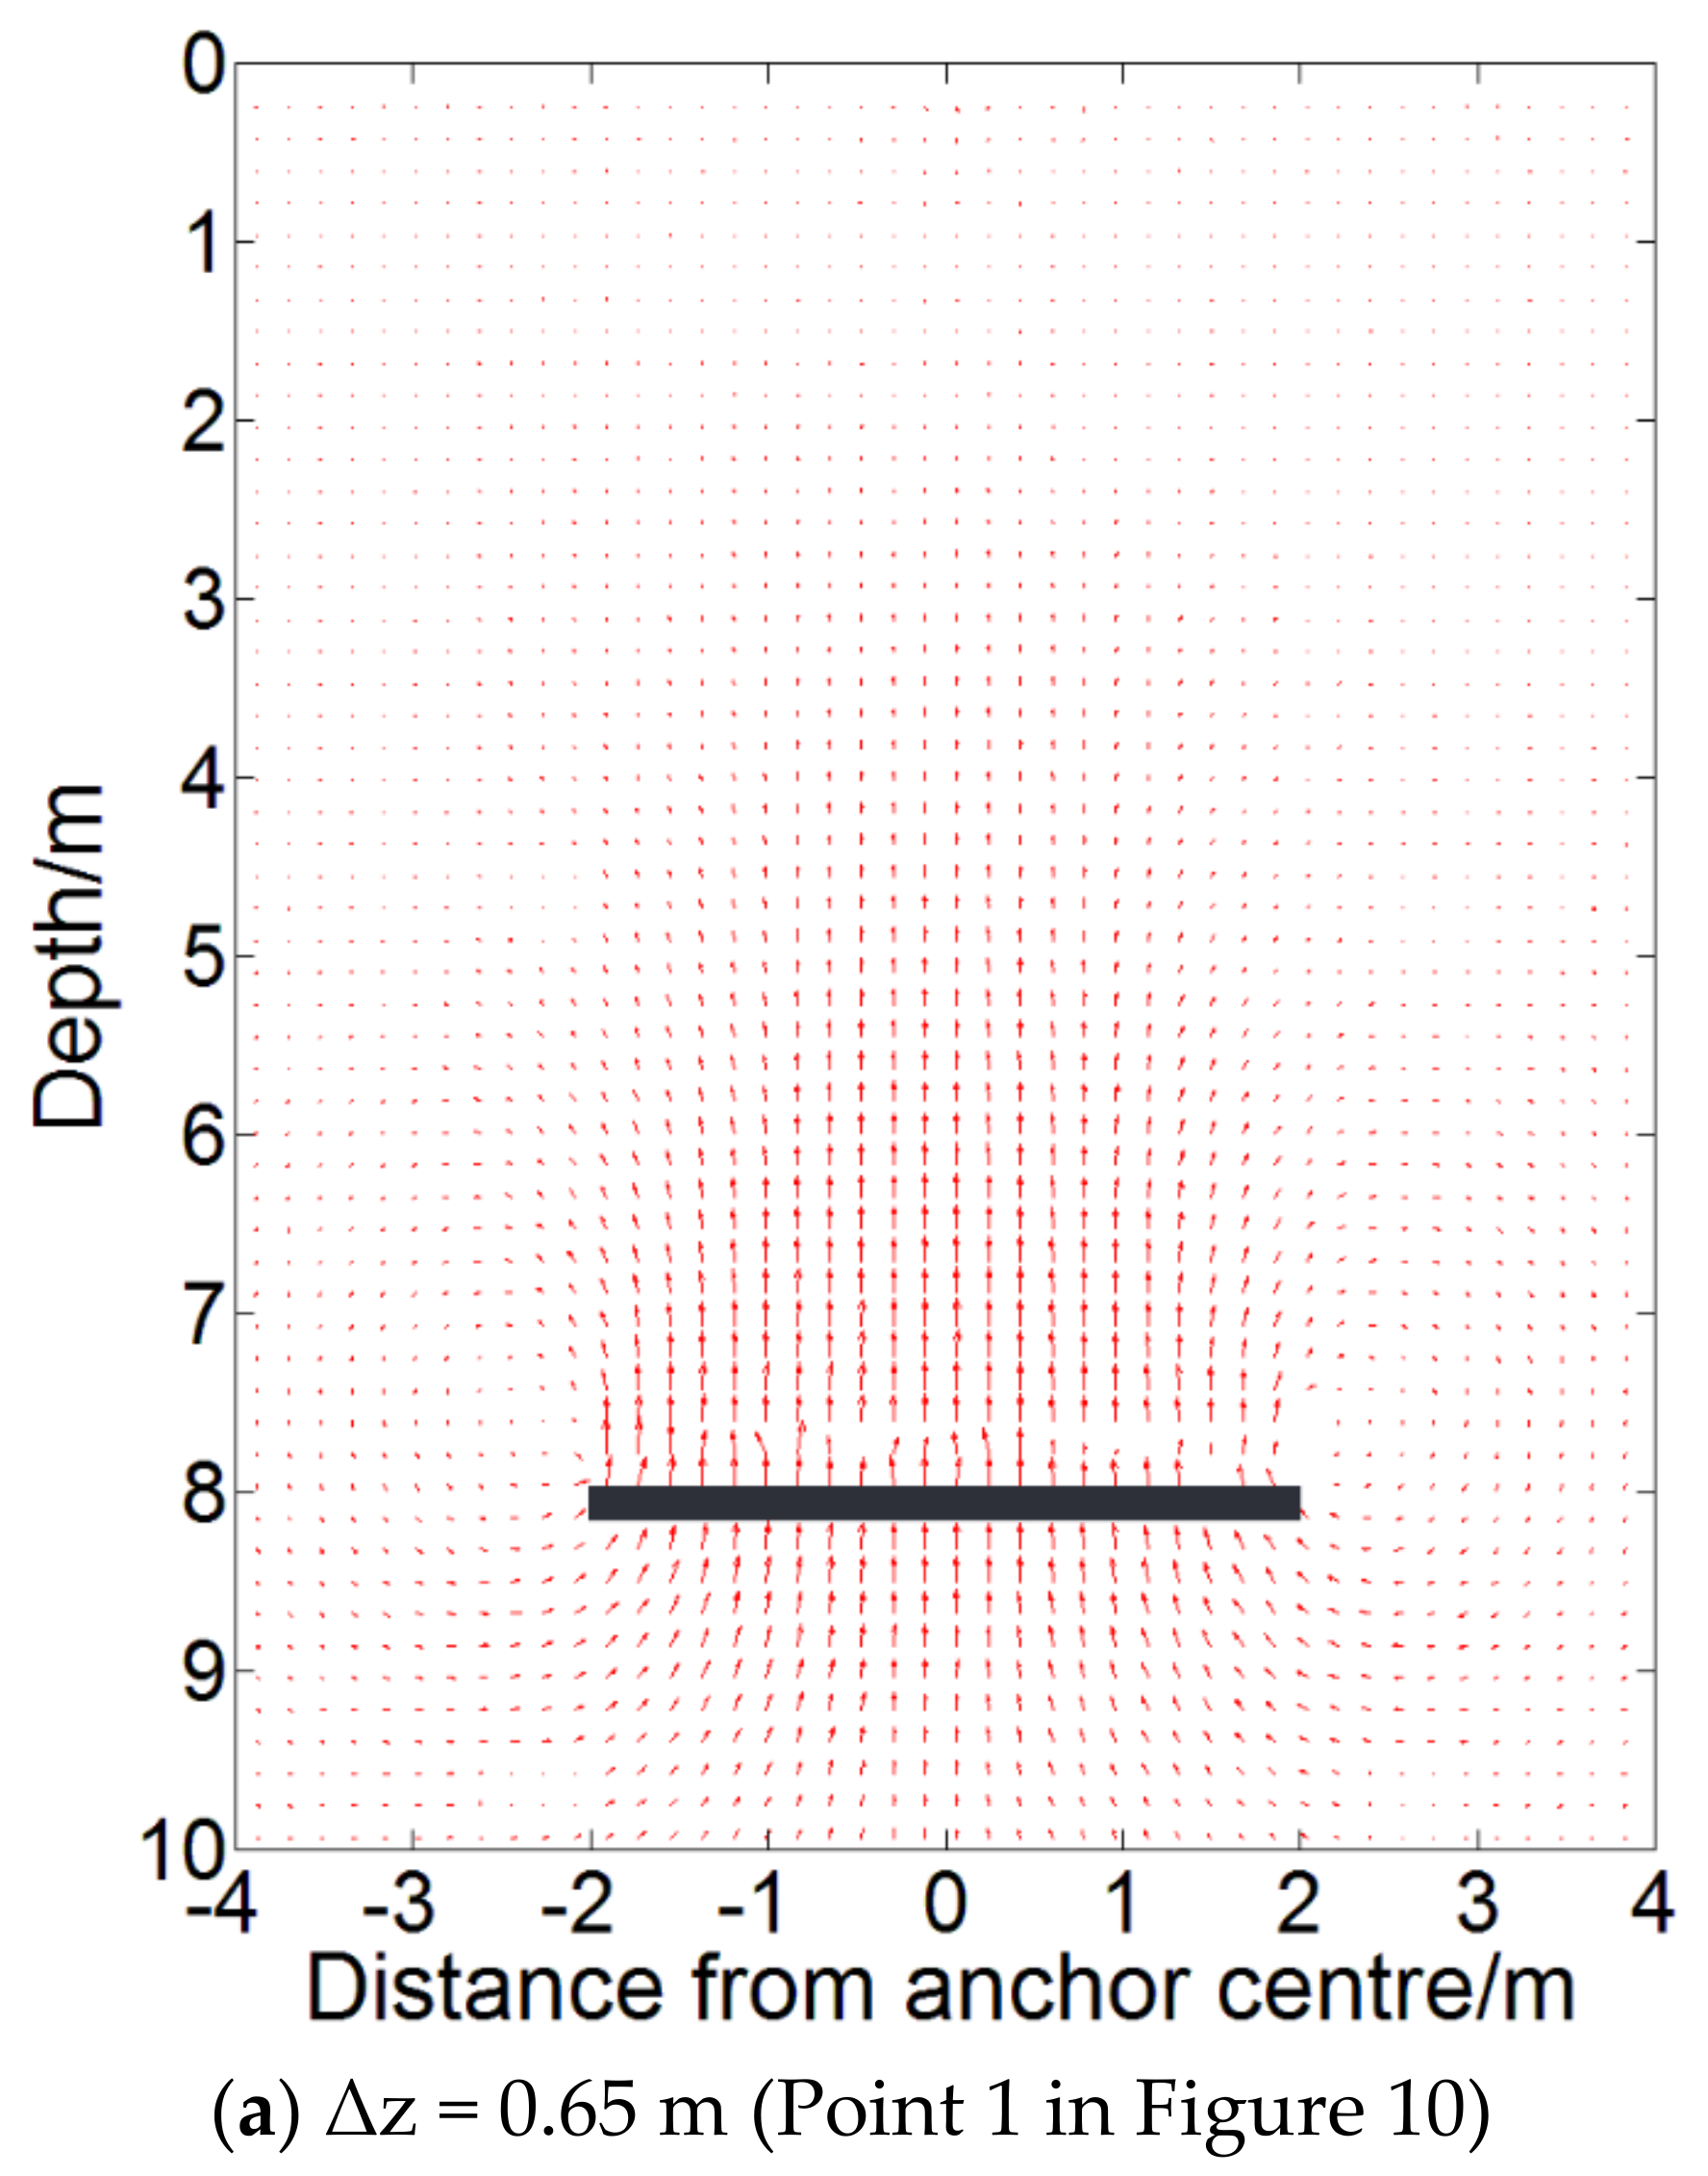
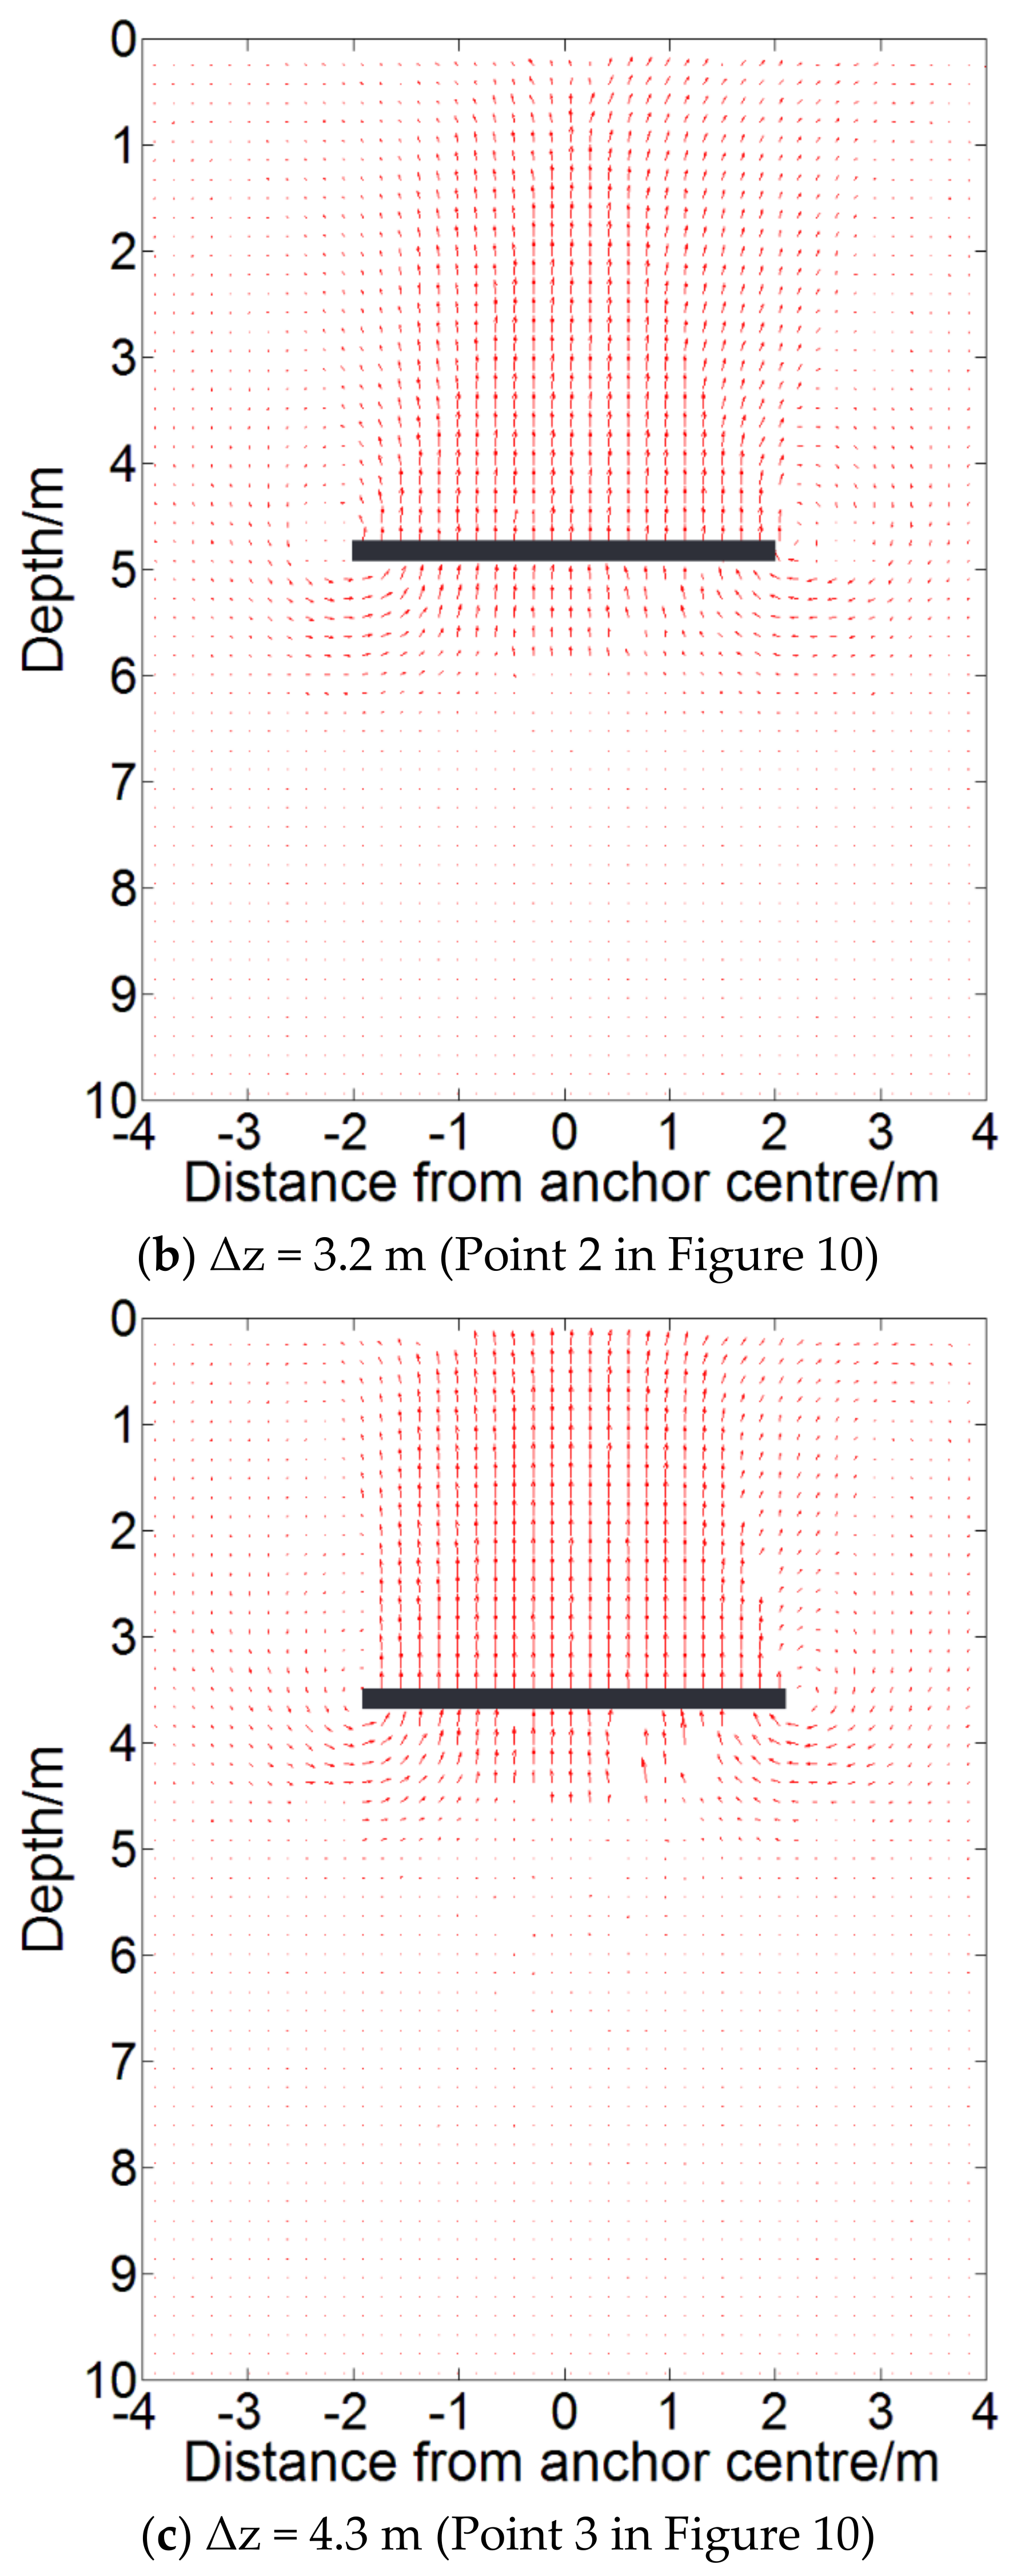
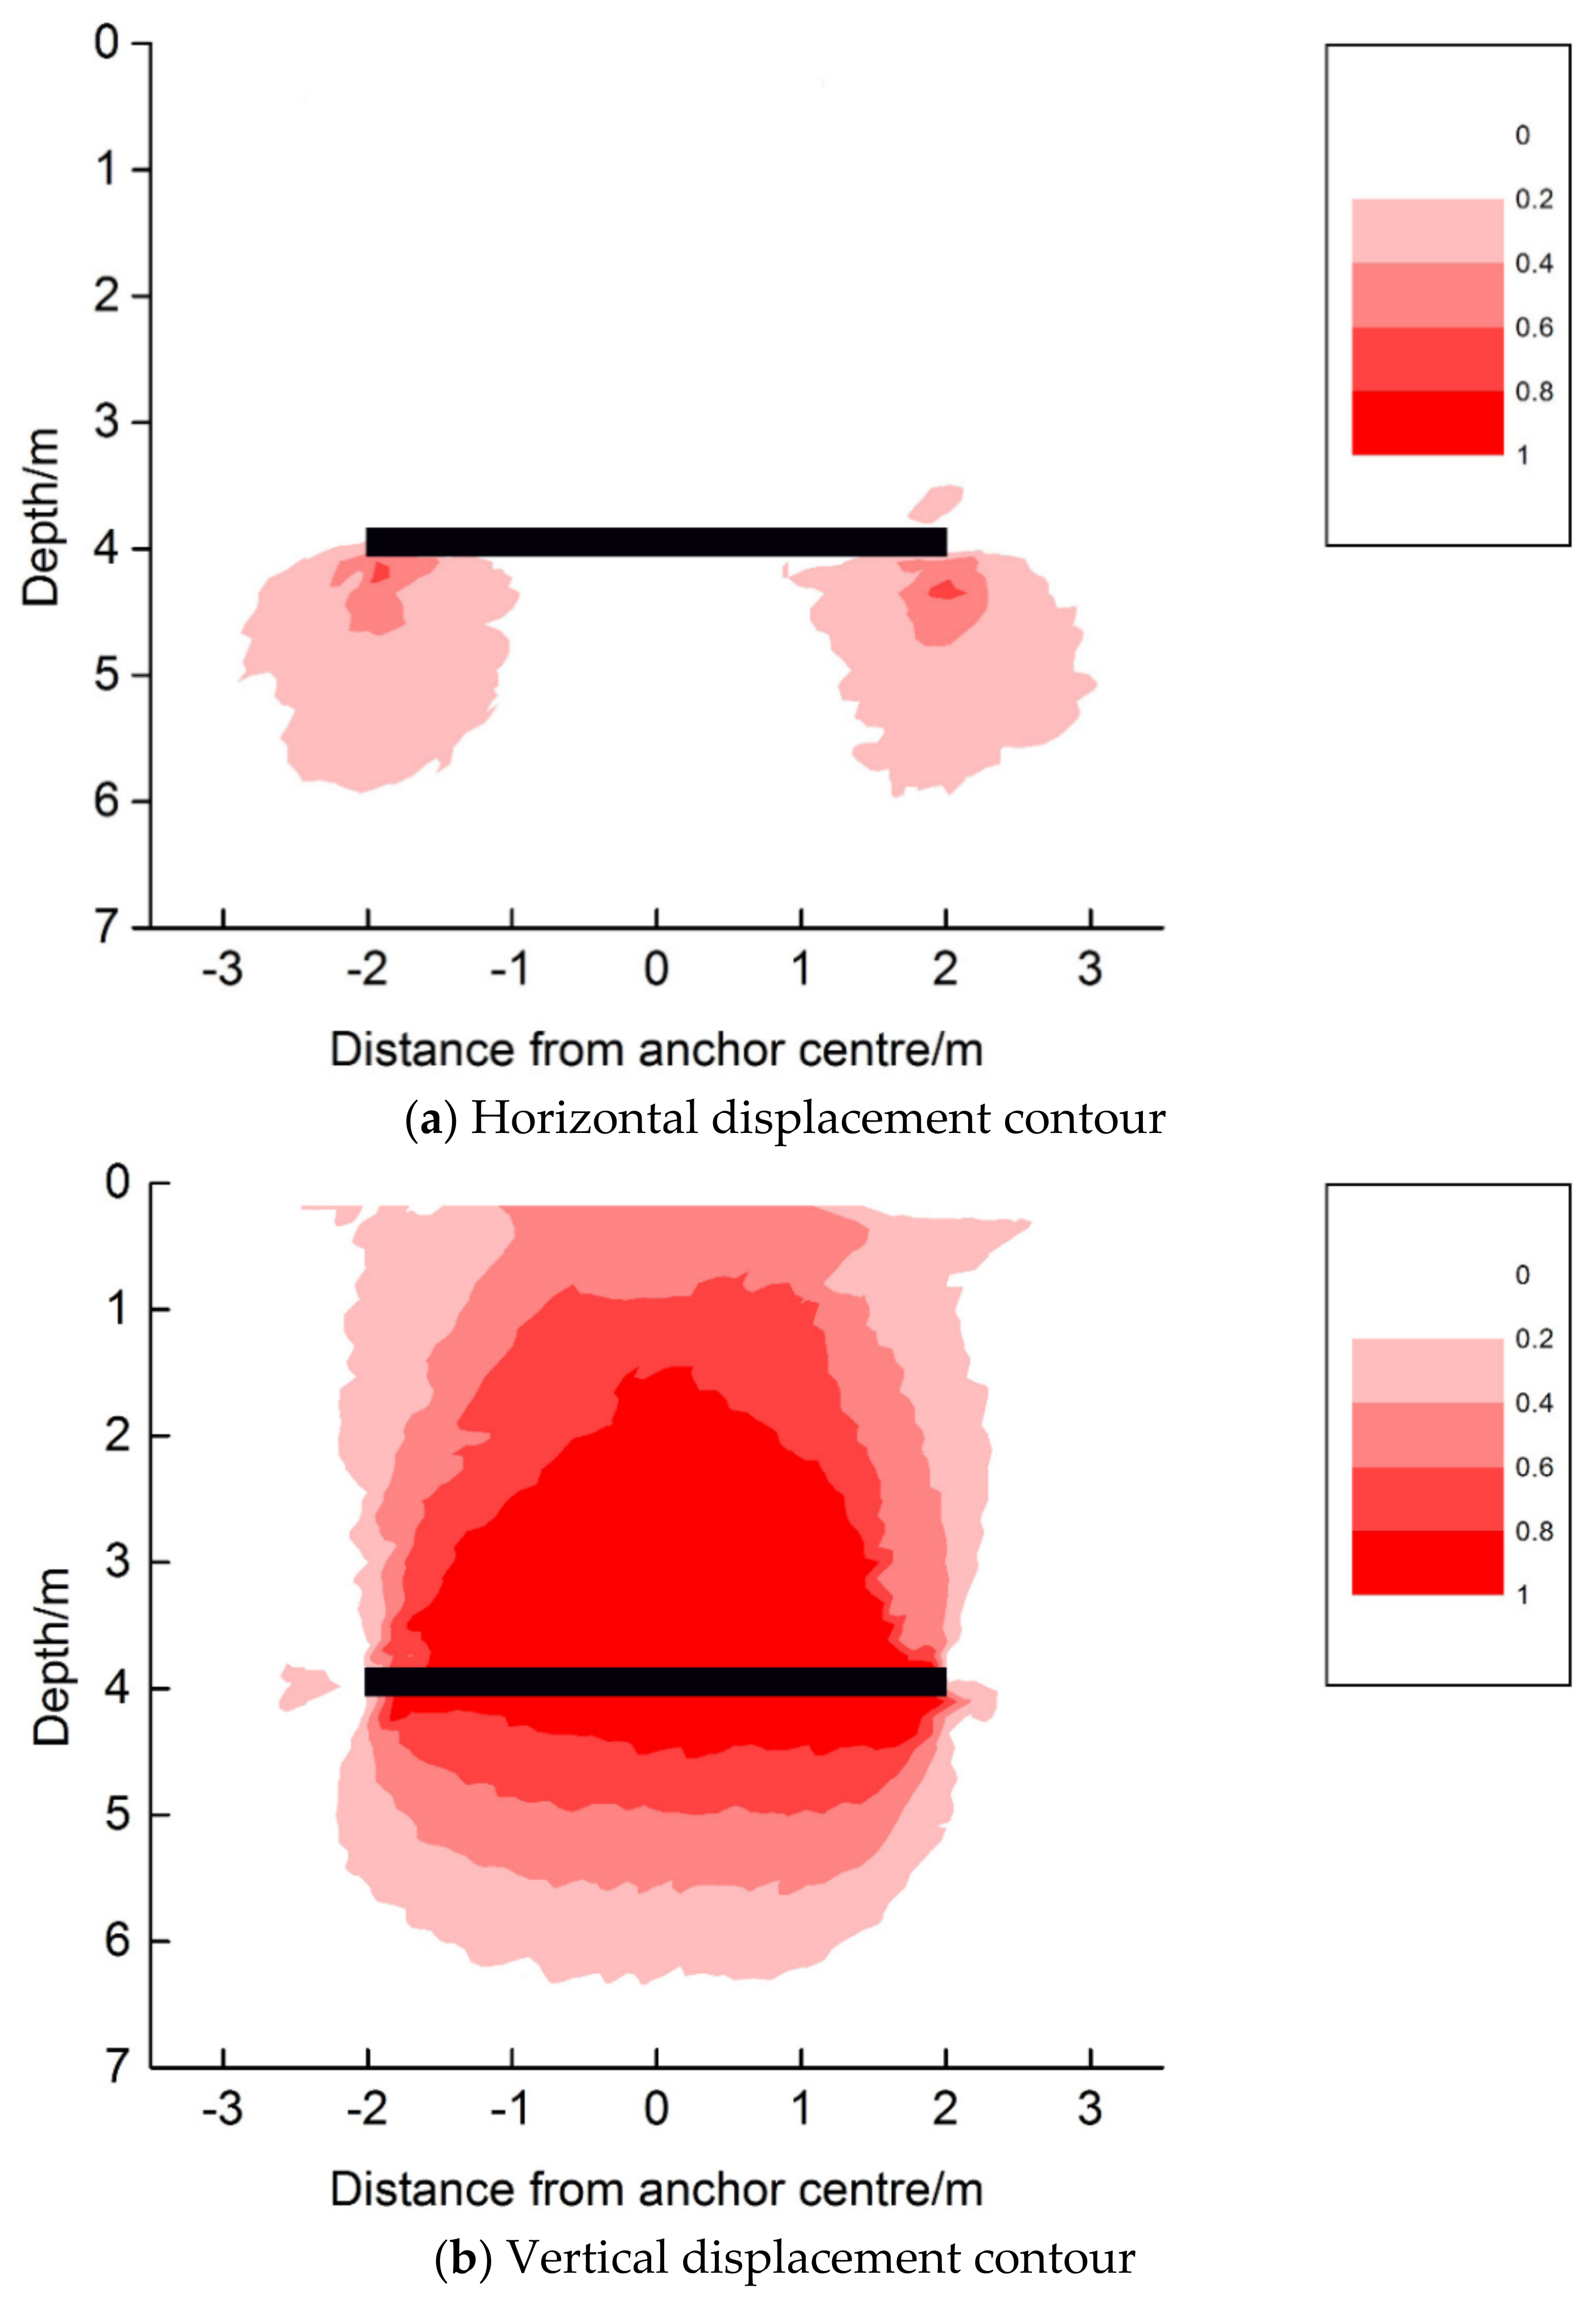
Figure 7 shows the load–displacement response of a shallow square anchor with an embedment ratio of 1.1, in which Points 1, 2, 3, 4 represent different pulling stages of the anchor. Two post-peak points were chosen to evaluate the development of post-peak soil flow in greater detail. The typical soil displacement vectors around the plate anchor at different pulling stages are presented in Figure 8. The evolvement of the interface condition at the anchor base are presented as follows.
For the anchor movement Δ z of about 0.15 m at Point 1 (before the peak resistance), a soil wedge (refer to area circled by blue line in Figure 8) is formed above the anchor and moves upward together with the anchor. It is noted that the wedge at this stage was not fully extended to the soil surface and some soil back flow could be observed around the two sides of the anchor (Figure 8a). As expected, no separation of soil beneath the anchor was observed.
For Point 2, where Δ z is 0.5 m and the peak anchor resistance is reached, the soil flow pattern was similar to that observed for Point 1. At this stage, the rigid wedge above the anchor reached the soil surface, with the soil at the surface being lifted (Figure 8b). A soil column was mobilized and its extent on the soil surface was slightly larger than the anchor width. The soil beneath the anchor was still observed to move upward together with the anchor with no sign of anchor-soil separation.
After a significant reduction from the peak anchor resistance and substantial anchor uplift movement (Point 3), no obvious anchor-soil separation could be observed, see Figure 9a. For Point 4 near the soil surface, the soil column above the anchor reduced in size and the soil was observed to move laterally outward from the soil column. The soil beneath the anchor was observed to be detached from the anchor base (Figure 8c). This can also be seen from Figure 9b, with a clear gap between the soil and the anchor base confirming the separation of soil from the anchor base.

5.2.2. Deep Anchor

Figure 10 shows the load-displacement response for a deep anchor with H/B of 2.1. Adopting a similar approach as that for shallow anchor, Points 1, 2 and 3 are marked in the figure to denote different test stages. The distributions of soil movement vectors during the pull-out process for the deep anchor are shown in in Figure 11. Upon reaching the peak load (Point 1), no anchor-soil separation was observed. When the anchor resistance started to decrease (Points 2 and 3), the soil was still moving together with the anchor. No obvious anchor-soil separation took place.
To compare the failure mechanism between shallow and deep anchors, the normalised soil displacement contours (soil displacement divided by anchor displacement) around the shallow and deep anchors at the peak load are shown in Figure 12a,b, respectively. A clear uplift movement of the soil with the anchor at the peak load can be observed. It is evident that the soil movement pattern of the deep anchor (Figure 12b) does not reach the soil surface.
Figure 13 shows a comparison of vertical and horizontal soil displacement for the case of H/B = 1.1 when the peak anchor resistance was reached. It can be seen that the soil right beneath the anchor moved upward at the same rate as the anchor. It is hence postulated that the magnitude of vertical displacement is heavily dependent on the soil suction at the anchor base. Compared with vertical soil displacements, horizontal soil displacements (Figure 13a) appear only around the anchor elevation. Considering that the horizontal displacement of soil is more related to soil back flow, this observation reveals that soil back flow is mostly around the anchor elevation. It is hence postulated that the issue of anchor-soil separation depends on both soil back flow and suction. Further discussions on soil suction will be presented in Section 7.1.
According to the findings of the numerical study by Chen et al. [5] and Tho et al. [6], the contact condition at the anchor-soil interface transits from no separation to partial attachment and finally anchor detachment. The detachment is mostly dependent on the overburden ratio γH/su. The higher the overburden ratio, the more difficult it is for separation to take place at the anchor-soil interface.
For a typical Suction Embedded Plate Anchor (SEPLA), the anchor size is 4.5 m × 10 m [27], and the embedment ratio ranges from 4 to 10 [28]. By taking the anchor width as 4.5 m and embedment ratio as 6, the overburden ratio, γH/su, is determined to be 7.4 for clay with unit weight of 16 kN/m3 and su gradient of 2.15 kPa/m depth as in the present study (thus the soil undrained strength at the initial anchor depth is about 58 kPa). Based on the study of Tho et al. [6], with such an overburden ratio, an anchor with an embedment ratio of 6 is deemed a deep anchor, which is consistent with the finding in this paper. Since the soil beneath the anchor stays attached with the anchor during the uplift process in the present study, full attachment should also be expected in the field. It is hence proposed that the attached condition (i.e., non-breakaway) at anchor-soil interface can be adopted for plate anchor design in practice under the pull-out rate similar to that in current study which can ensure an undrained condition.

6. Results on Inclined Anchors

In practice, an anchor may become inclined after installation. Figure 14 shows the normalised load-displacement curves of plate anchors with different angles of inclination from the horizontal at H/B of about 1 and 3. Note that the normalised embedment depth denotes the ratio of anchor centre depth to anchor width B. It shall also be noted that for an inclination angle of 90°, the anchor would be pulled horizontally, and its elevation would hence not change during the pulling process.
Figure 15a shows the anchor capacity factor versus anchor inclination angle for shallow and deep anchors. It is evident that the anchor capacity factor decreases with increasing anchor inclination angle. This is because a higher inclination activates a shallower disturbance zone with lower soil strength and shorter failure slip surface, as elaborated later from PIV results on photographs taken during the tests.
Figure 16 shows the soil displacement vectors of square anchors (H/B ~ 1) with angles of inclination β   of   22.5 ° ,   45 ° ,   67.5 ° ,   90 ° at peak resistance (Tests 2, M1 to M3). Similar to horizontal anchors, no anchor-soil separation was observed at the peak anchor resistance. Asymmetrical soil back flow was observed due to the difference in the undrained shear strength of soil around the upper and lower edges of the anchor. This asymmetry was found to be more obvious with higher anchor inclination. For the case with anchor inclination angle of 67.5°, soil back flow around the anchor lower edge could hardly be observed.
Figure 17 shows the soil failure mechanism of shallow anchors with angles of inclination β   of   0 ,   22.5 ° ,   45 ° ,   67.5 ° at peak resistance. The failure zone can be generally separated into two parts, where the part in front of the anchor can be regarded as the “passive” zone and the part behind the anchor as the “active” zone.
Figure 17 reveals that the size of the “passive” zone increases significantly with anchor inclination. With an anchor inclination of 22.5°, the zone extended to around 3 m away on the soil surface. This extent increased to around 3.5 m with an anchor inclination of 45° and more than 7 m with an anchor inclination of 67.5°. Comparing the displacement contours for anchor inclinations of 22.5° and 67.5° (Figure 17b,d), it can be observed that the “active” failure zone appeared in the shallower part of the soil with a higher inclination angle. In Figure 17b, the zone reached more than 1 m below the anchor base and generally concentrates within the depths between 4 to 6 m. For the case of 67.5° inclination, the zone did not develop into deeper soil below the anchor and concentrated more in the shallower soils.
The above observations help to explain the much lower capacity factor and the opposite trend of the factor changing with anchor inclination found by other researchers, as shown in Figure 15b. Firstly, the results in Figure 15b were obtained in weightless soil with “immediate breakaway” case, where there would be an absence of suction force beneath the anchor, so the pull-out resistance would be smaller. Secondly, in this weightless and “immediate breakaway” case, “active” zone would not be mobilized, and the area of “passive” zone would increase with anchor inclination, so the capacity factor increased with anchor inclination.
A similar change of soil flow mechanism can be found for deep anchors, as shown in Figure 18.
In summary, owing to the difference in the undrained shear strength of soil around the upper and lower edges of an inclined anchor, asymmetrical soil back flow was observed and found to be more evident with increasing anchor inclination to the vertical. The inclination of the plate anchor results in a shallower disturbance zone of soil, with lower soil strength and shorter failure slip surface, which would lead to lower anchor capacity.

7. Discussion

7.1. Contribution of Suction towards Ultimate Anchor Capacity

This section aims at quantifying the development of suction during the pull-out process of plate anchors. Both the anchor resistance and the pore pressure at the centre of the plate anchor were measured, providing insights in the development and dissipation of suction with time till the excess pore pressure in the clay completely dissipated. Figure 19 shows the development of negative excess pore pressure (i.e., suction) together with normalised anchor resistance in Test 5 (H/B = 2.8, a typical deep horizontal anchor case). The negative excess pore pressure confirms the development of suction in the soil beneath the anchor base. During the uplift, both the anchor resistance and the soil suction reached their corresponding maximum magnitudes at the same time, revealing that the assumed “immediate breakaway” condition at the anchor-soil interface would not occur under the pull-out rate adopted in this study.
Figure 20 reveals the contribution of suction caused by negative pore pressure towards the anchor capacity. For a deep anchor, the soil suction contributes a significant portion of around 60% towards the anchor capacity resistance.

7.2. Effect of Anchor Shape

Figure 21a and Figure 22a present the normalised load-displacement response of horizontal anchors with aspect ratios of 2 and 6 at different embedment depths. Similar to that of a square anchor, the anchor resistance increased rapidly after being pulled and dropped gradually after the ultimate resistance was reached without any plateau observed. It can be seen from Figure 21b and Figure 22b that the anchor pull-out capacity was reached after the embedment ratio of around 2. The anchor capacity factors were determined as 12.2 and 11.8 for L/B of 2 and 6, respectively. Figure 22b demonstrates that the result for the anchor with L/B of 6 is close to the prediction by Song et al. [10] with strip anchors under “attached” condition in uniform clay. Hence, the “attached” condition for the interface is again verified.
The anchor capacity factors with aspect ratios of 1, 2, and 6 obtained from the present tests are plotted in Figure 23. The anchor capacity factors obtained from DNV-RP-E302 [20], which adopts the empirical shape factors reported by Skempton [22], are also plotted in the figure. The Skempton shape factors are obtained by linear interpolation of the strip footing N c * = N c , s t r i p * 1 + 0.2 B / L . It is evident from Figure 23 that the Nc* for NC clay obtained from the centrifuge tests results are considerably lower than those by Skempton [22], revealing that the DNV approach for rectangular anchor may not be valid for NC clay. Based on the centrifuge test results, the capacity factor of a rectangular plate anchor in NC clay is given as
N c * = 11.7 1 + 0.07 B / L

8. Conclusions

Centrifuge model tests were conducted to investigate the pull-out behaviour of horizontal and inclined plate anchors in NC clay. Below is a summary of the findings.
  • It is identified that there is no separation at the anchor-soil interface when the ultimate anchor resistance was reached for horizontal and inclined plate anchors with shallow and deep embedment. As such, “attached” (no-breakaway) conditions at the interface should be adopted for the design of anchor pull-out in practice under the pull-out rate similar to the value adopted in this study which can ensure an undrained condition.
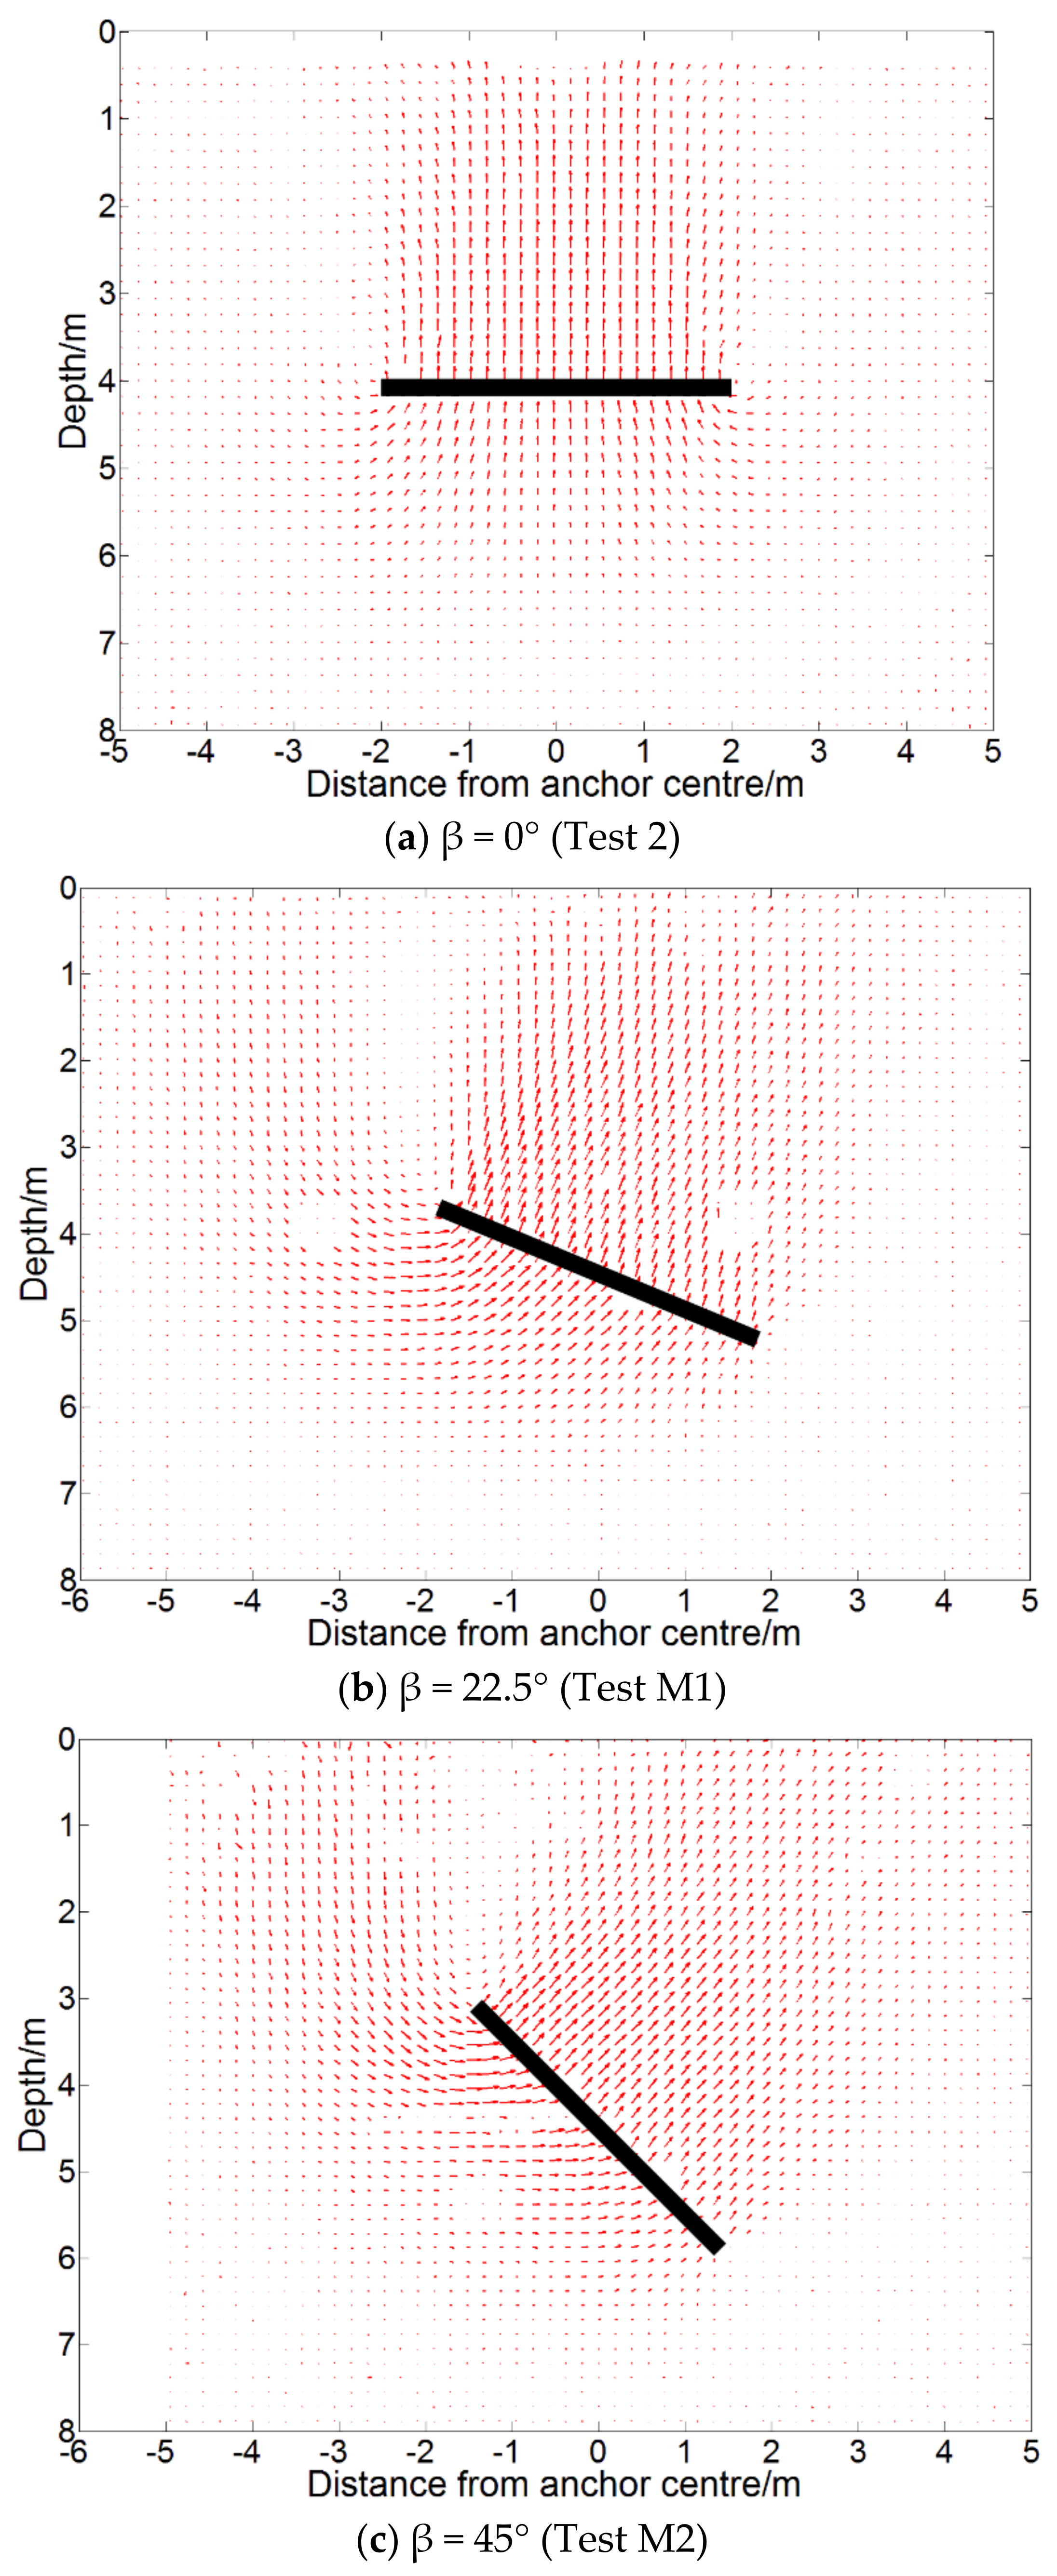
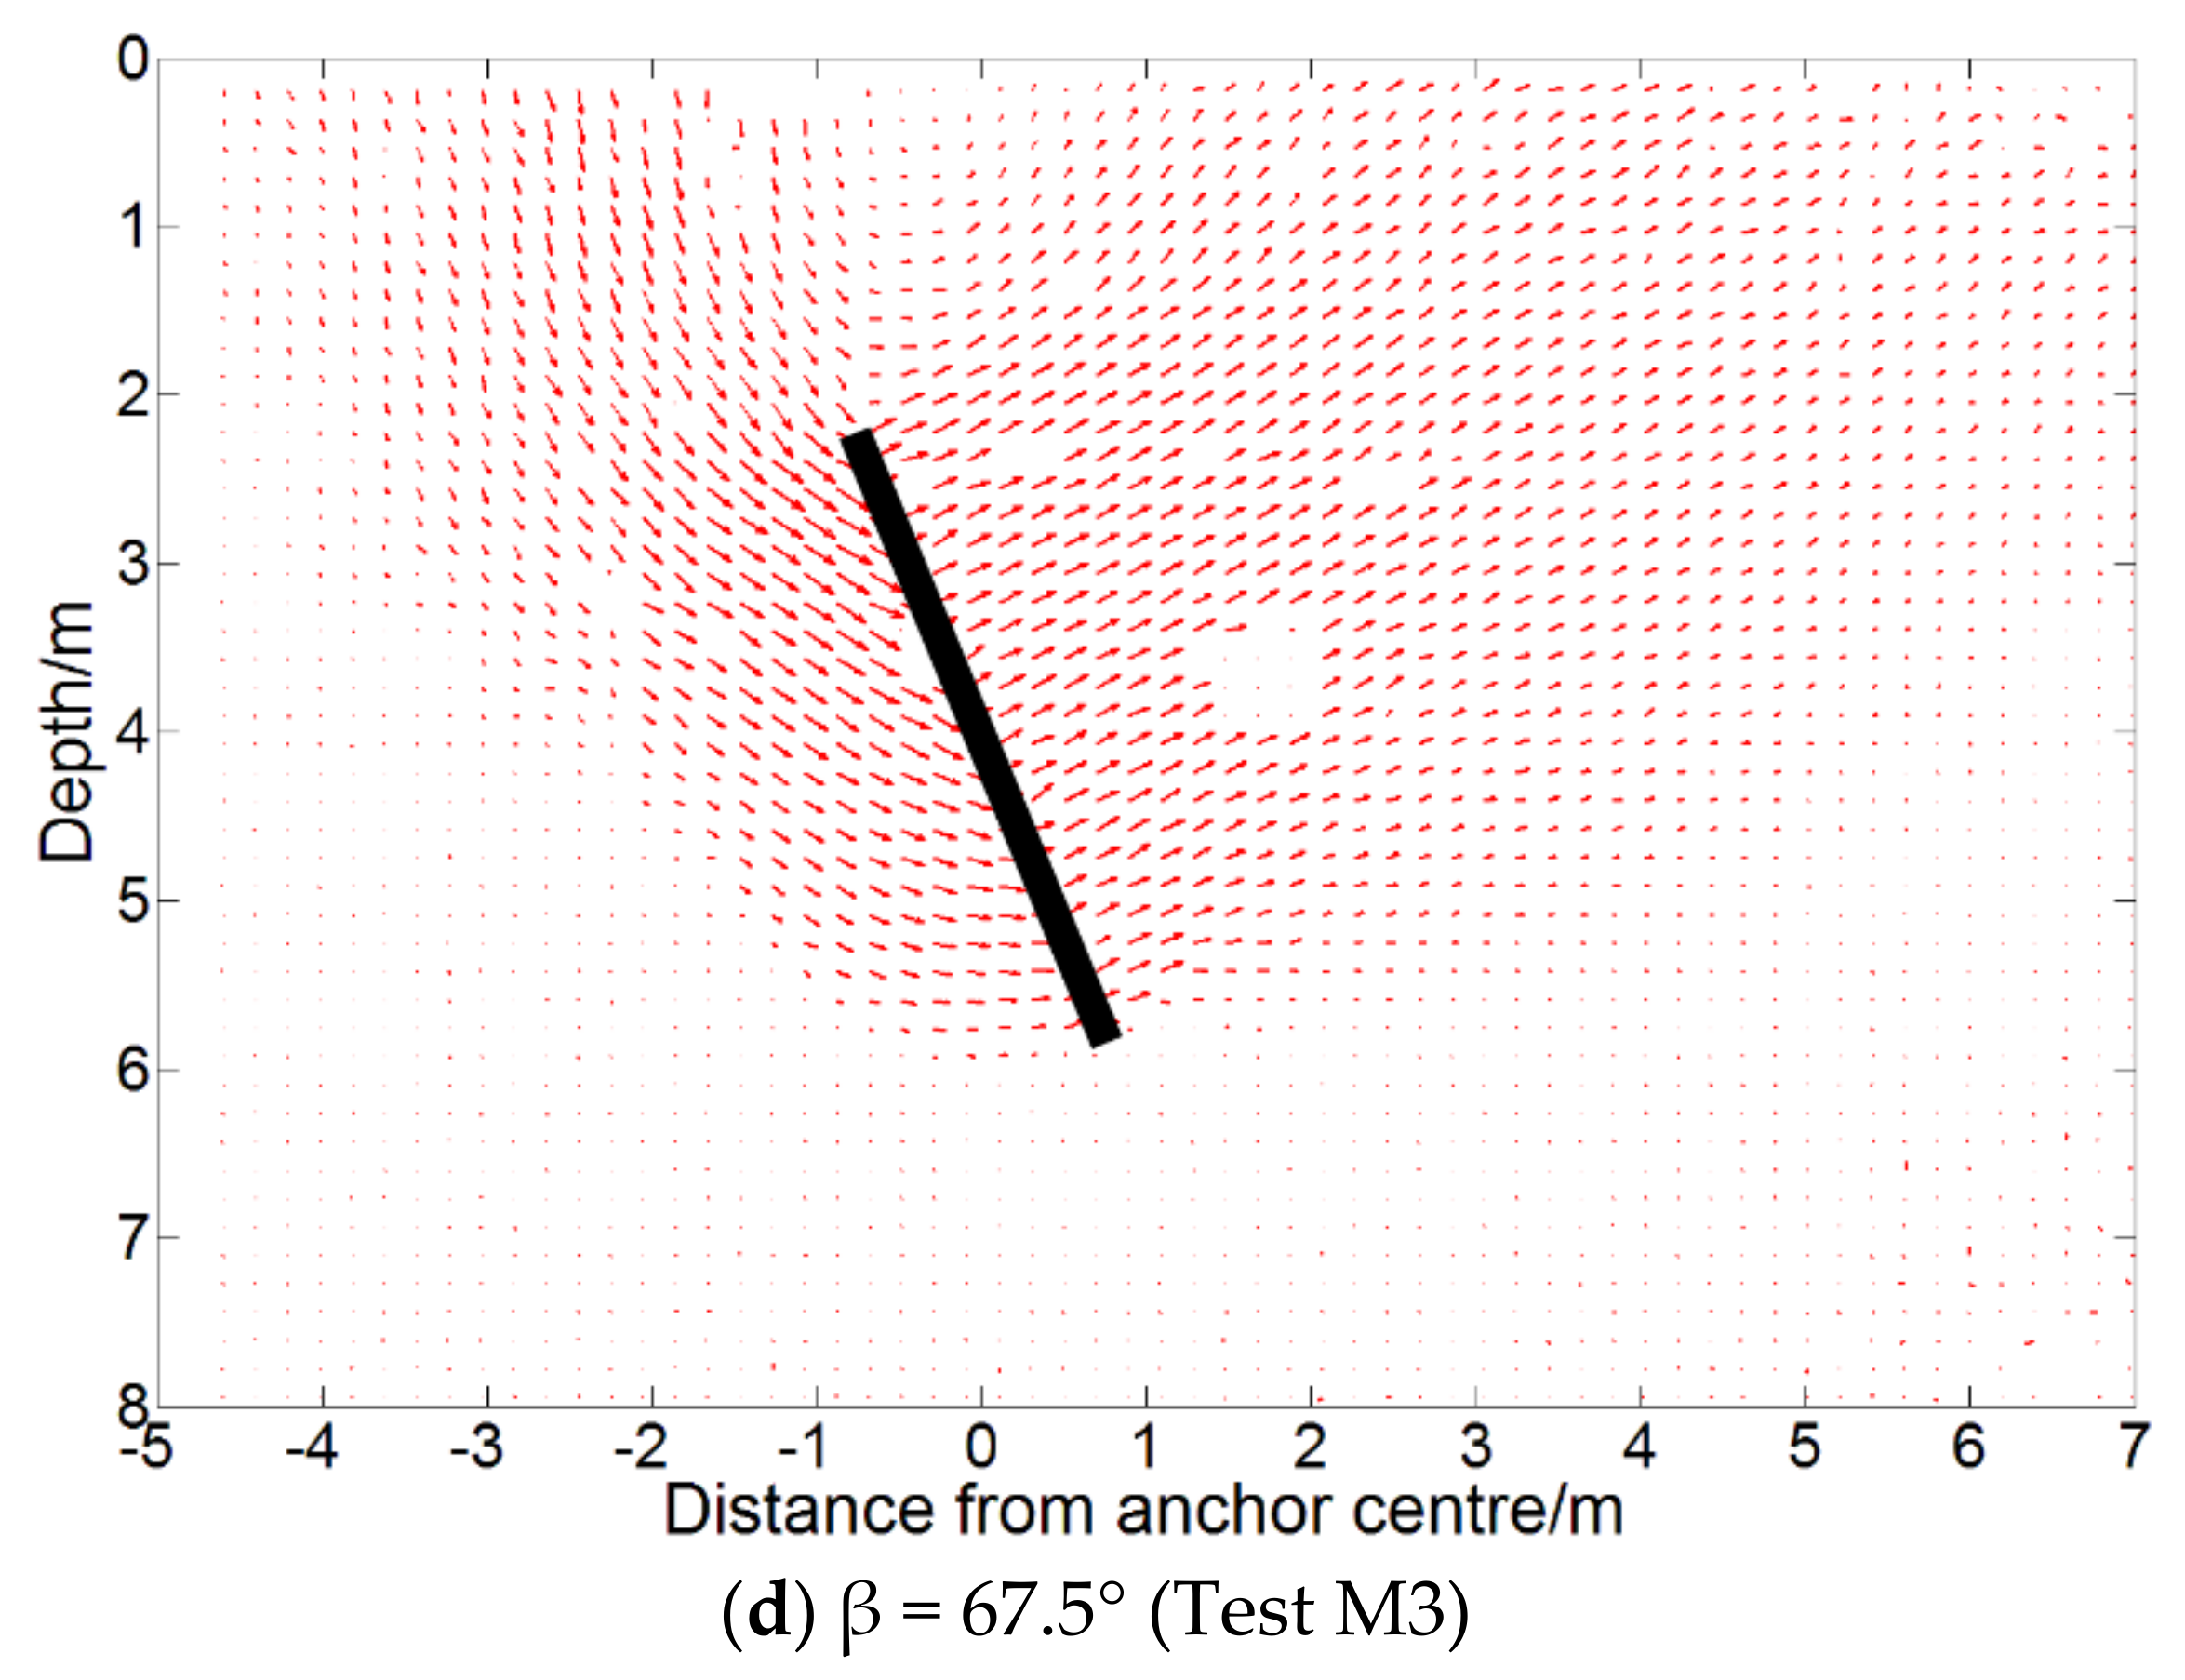
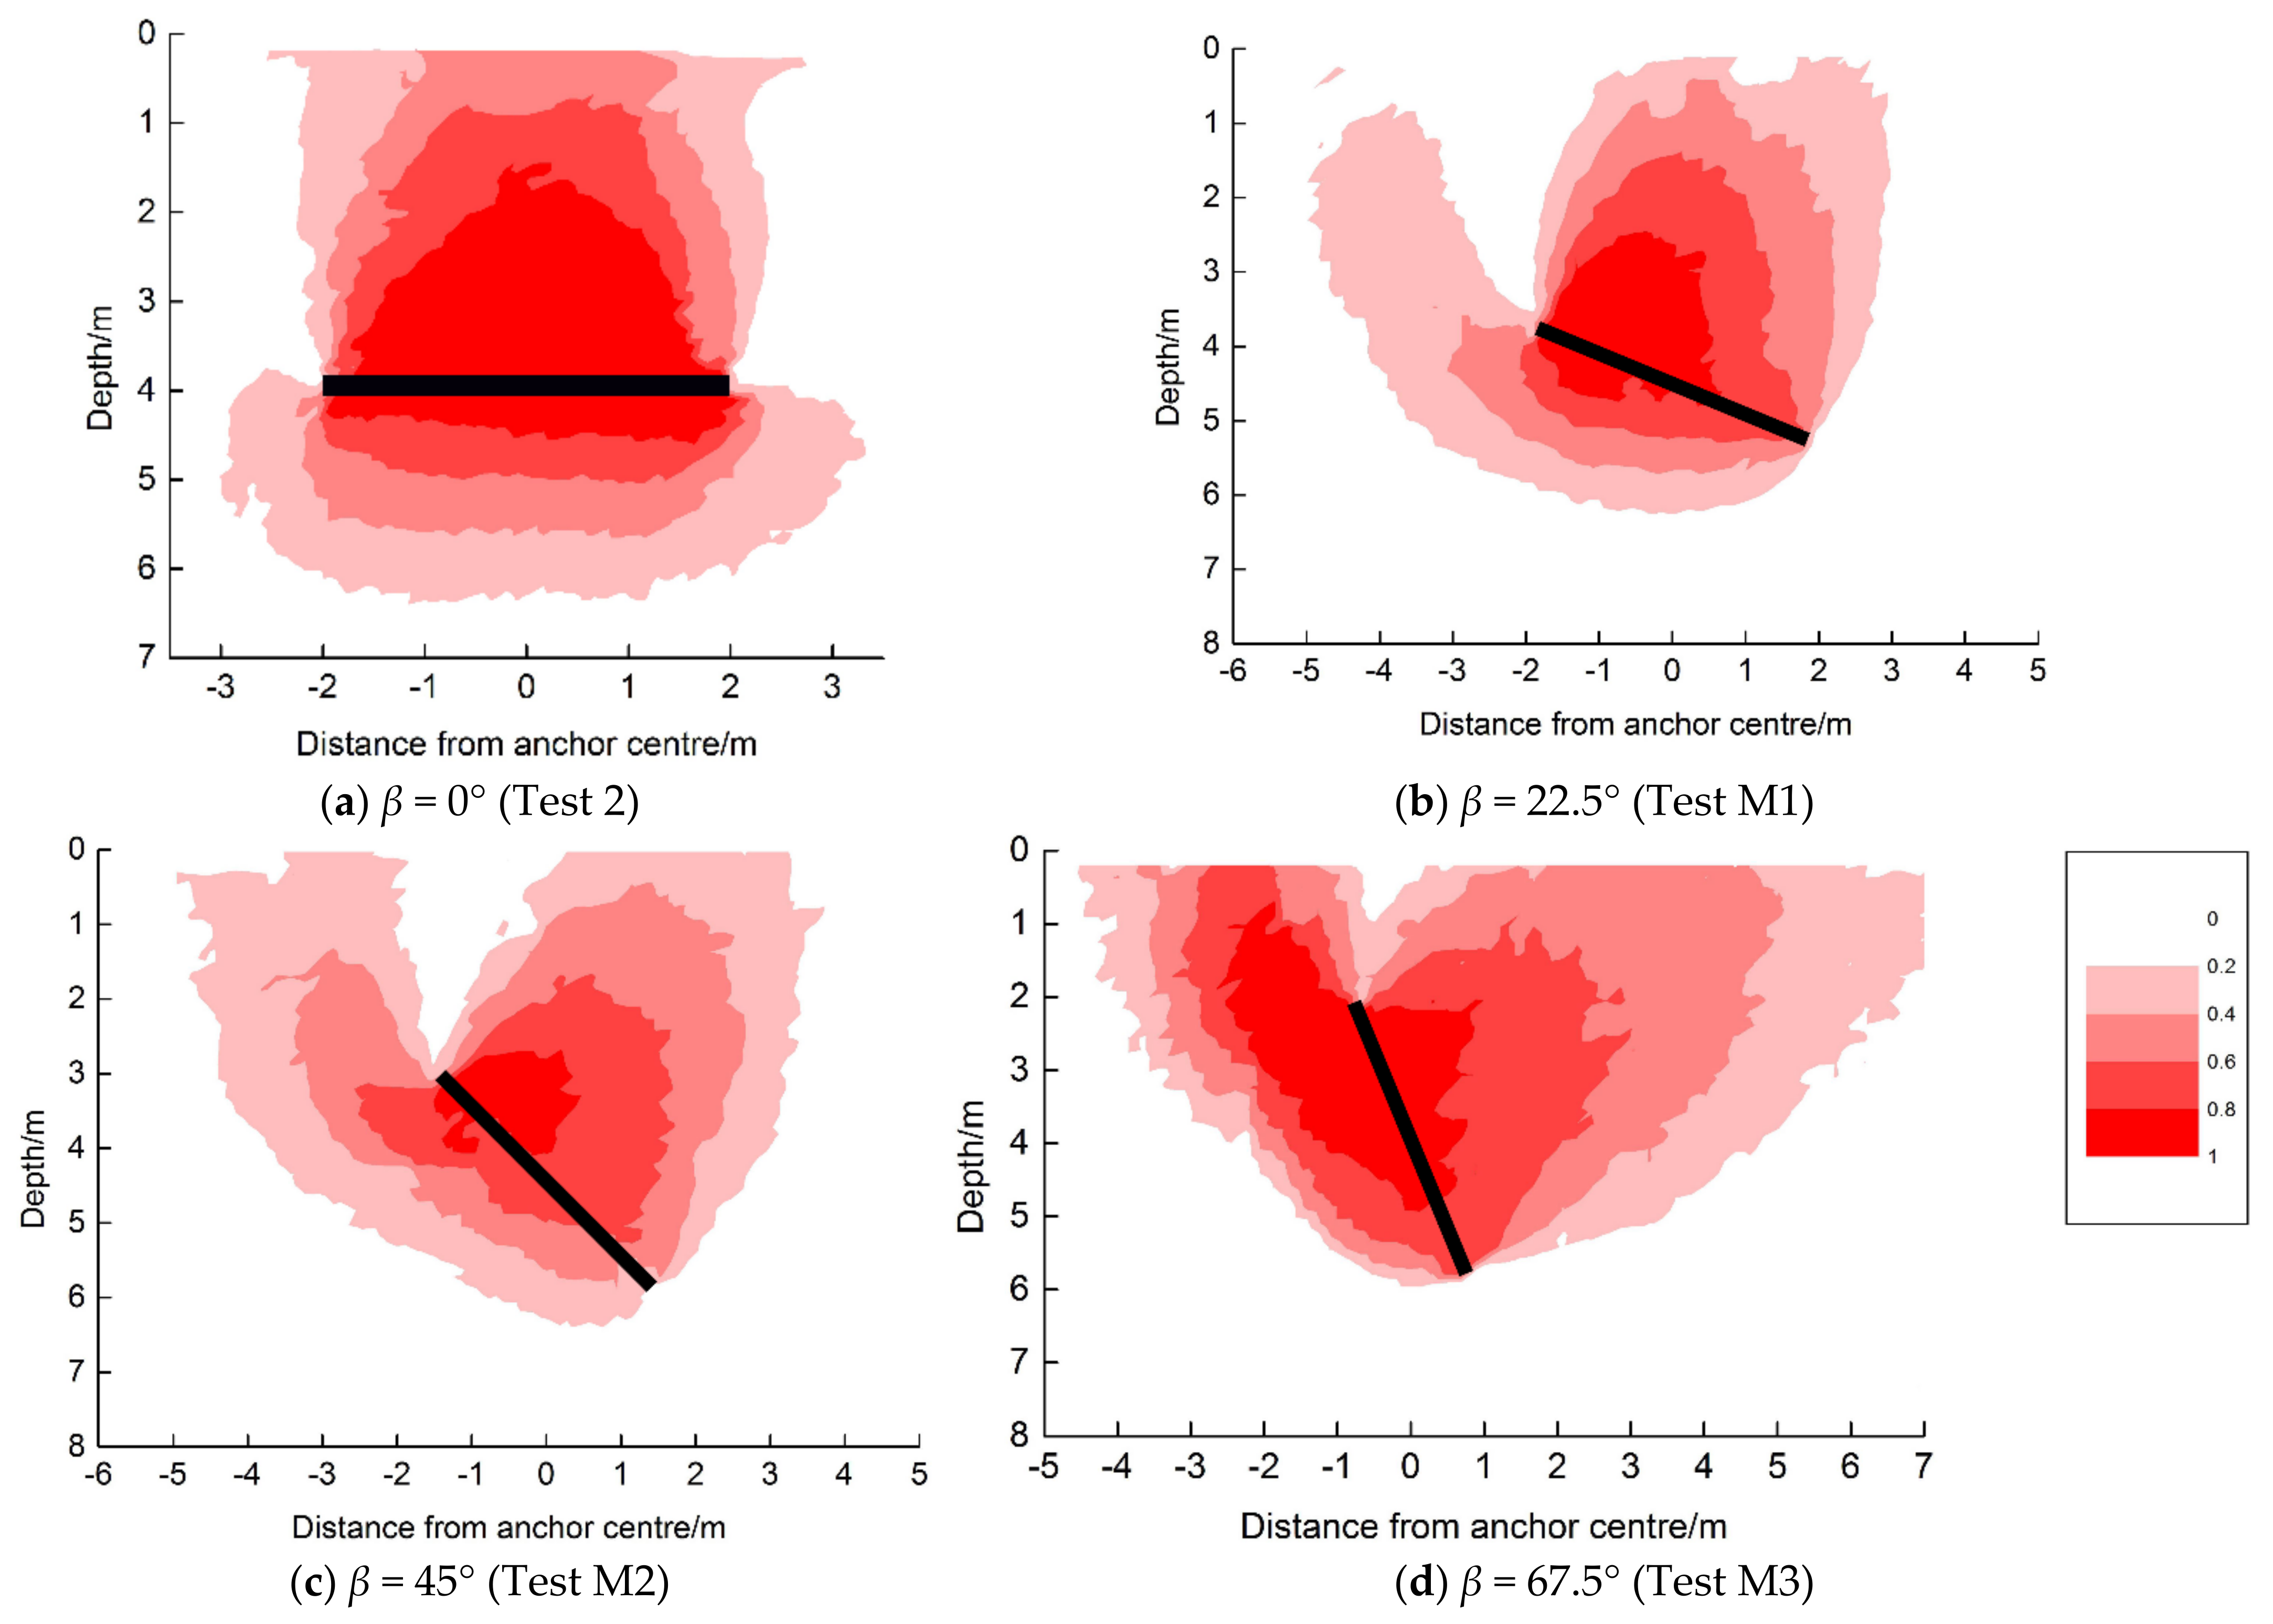
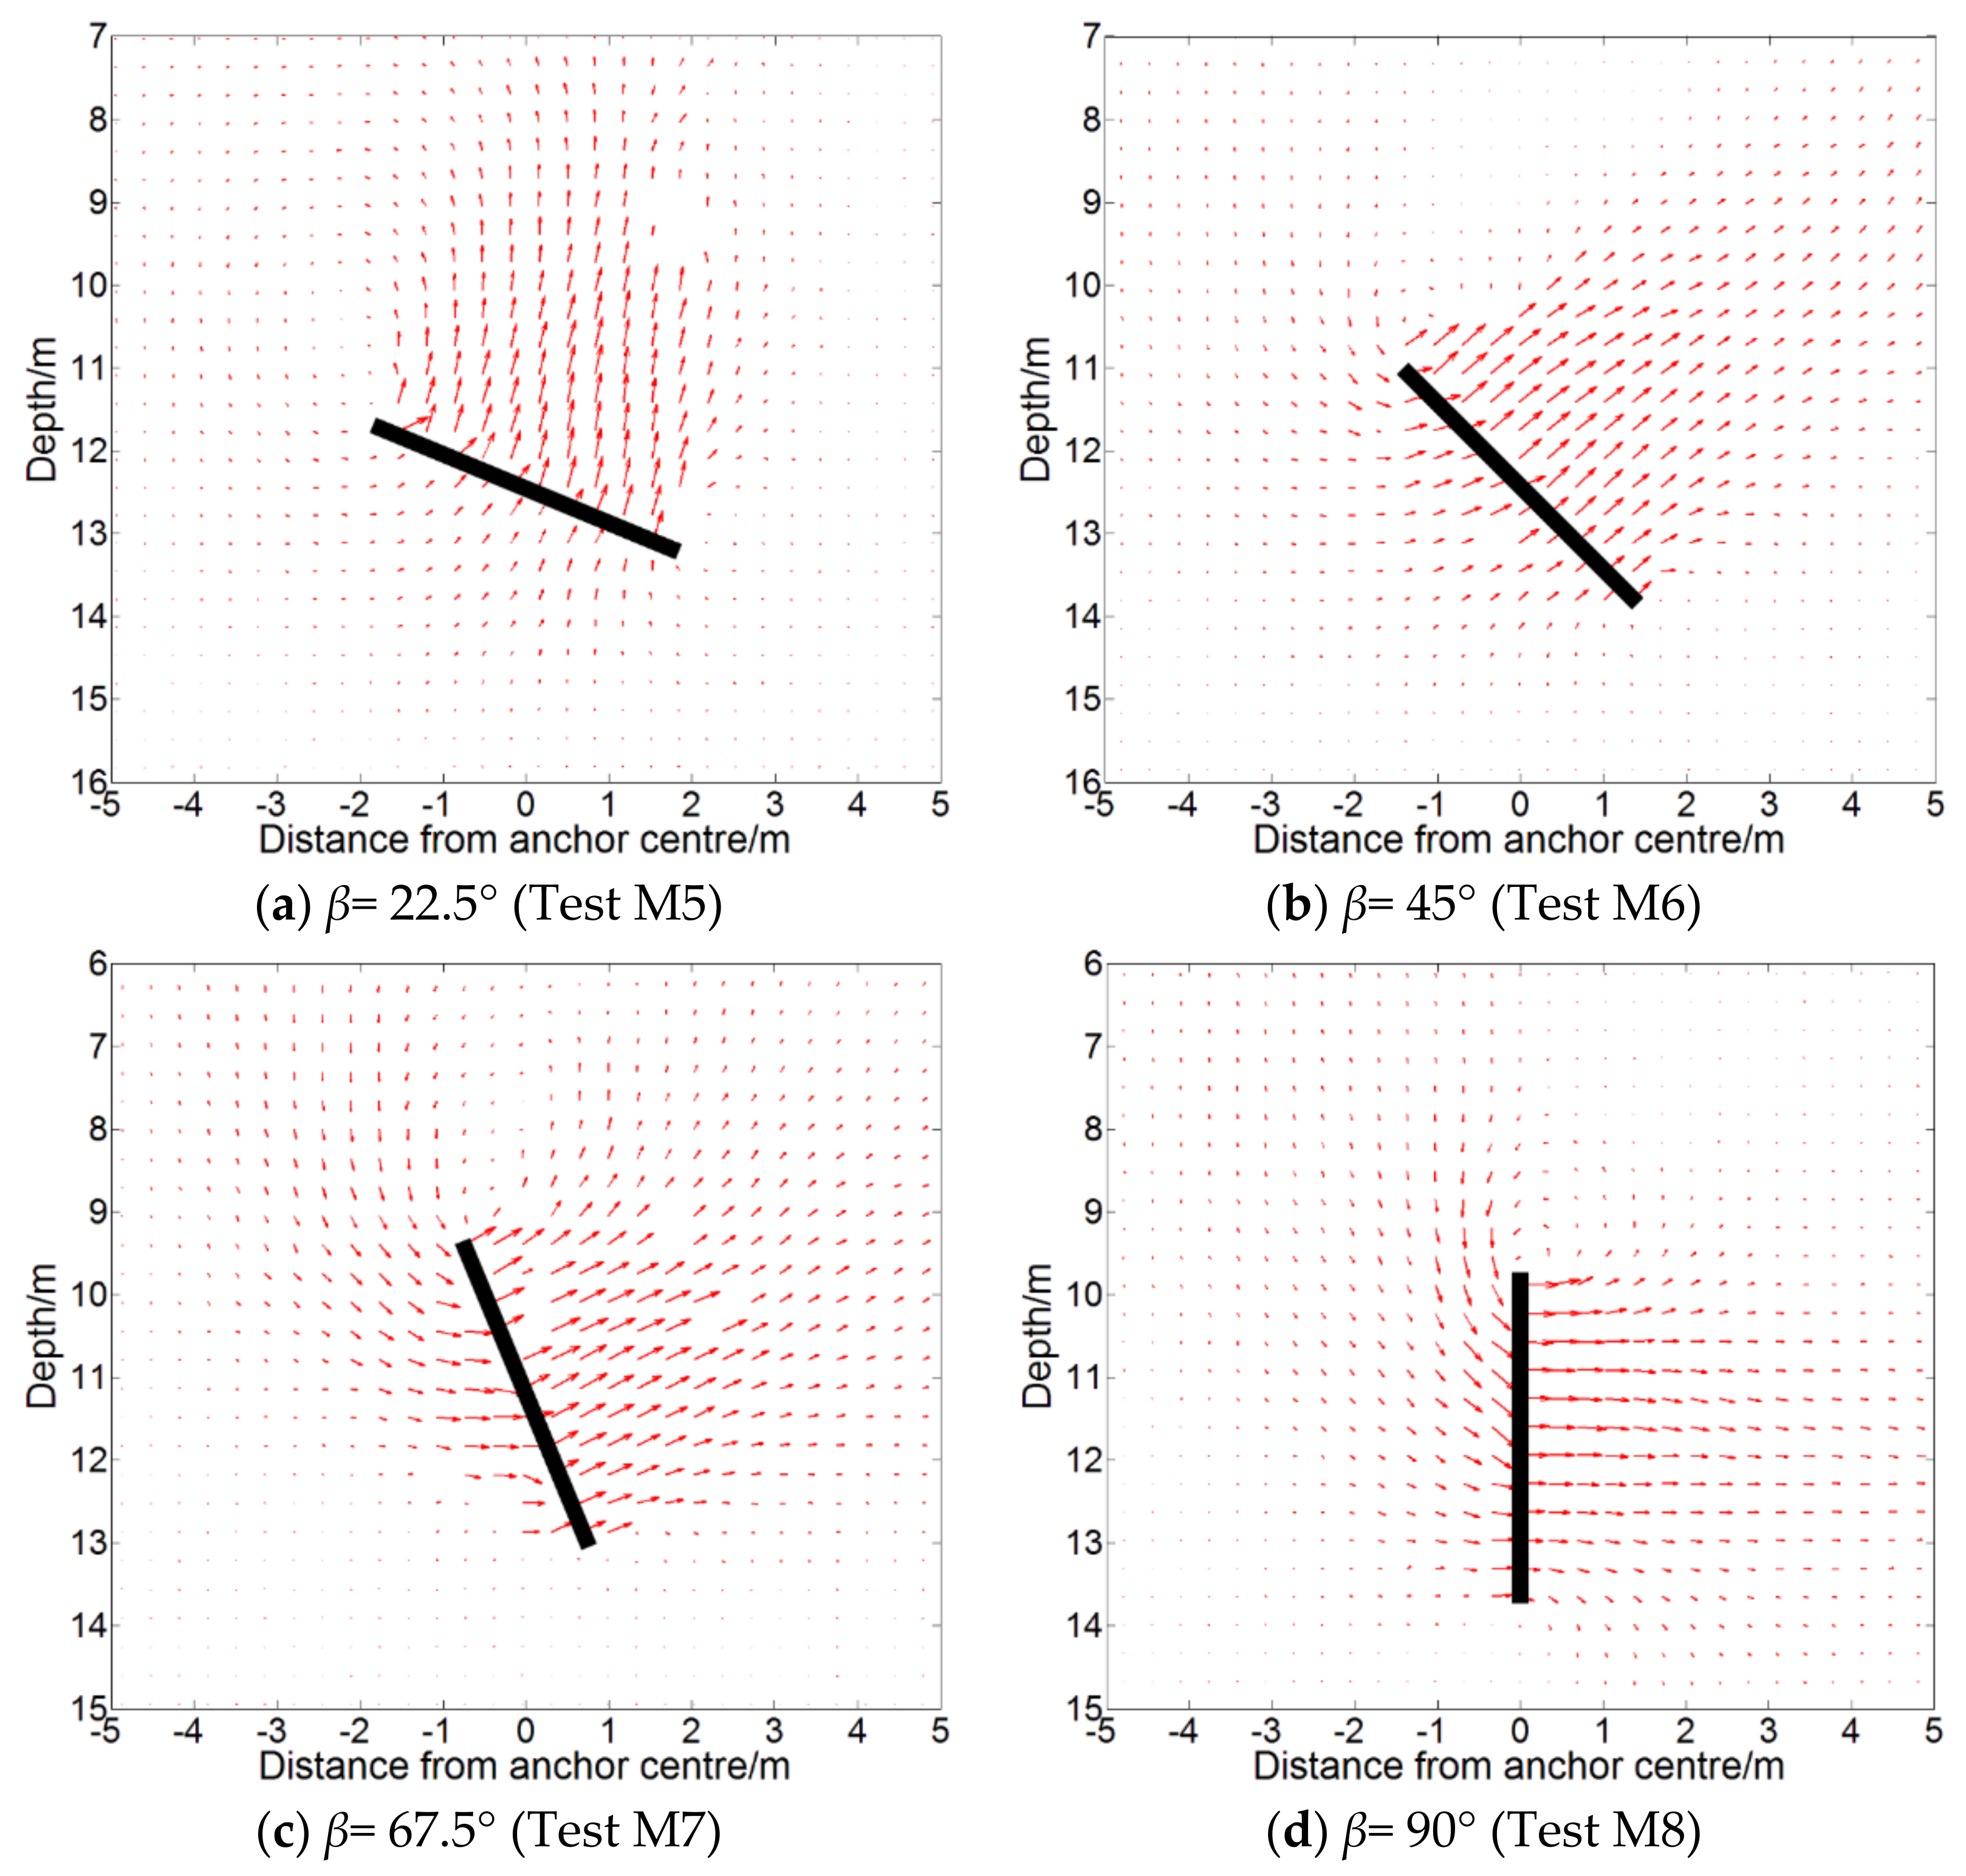
  • Owing to the difference in the undrained shear strength of soil around the upper and lower edges of an inclined anchor, asymmetrical soil back flow was observed and found to be more evident with increasing anchor inclination. The inclination of the plate anchor results in a shallower disturbance zone of soil with lower soil strength and shorter failure slip surface, which would lead to lower anchor resistance.
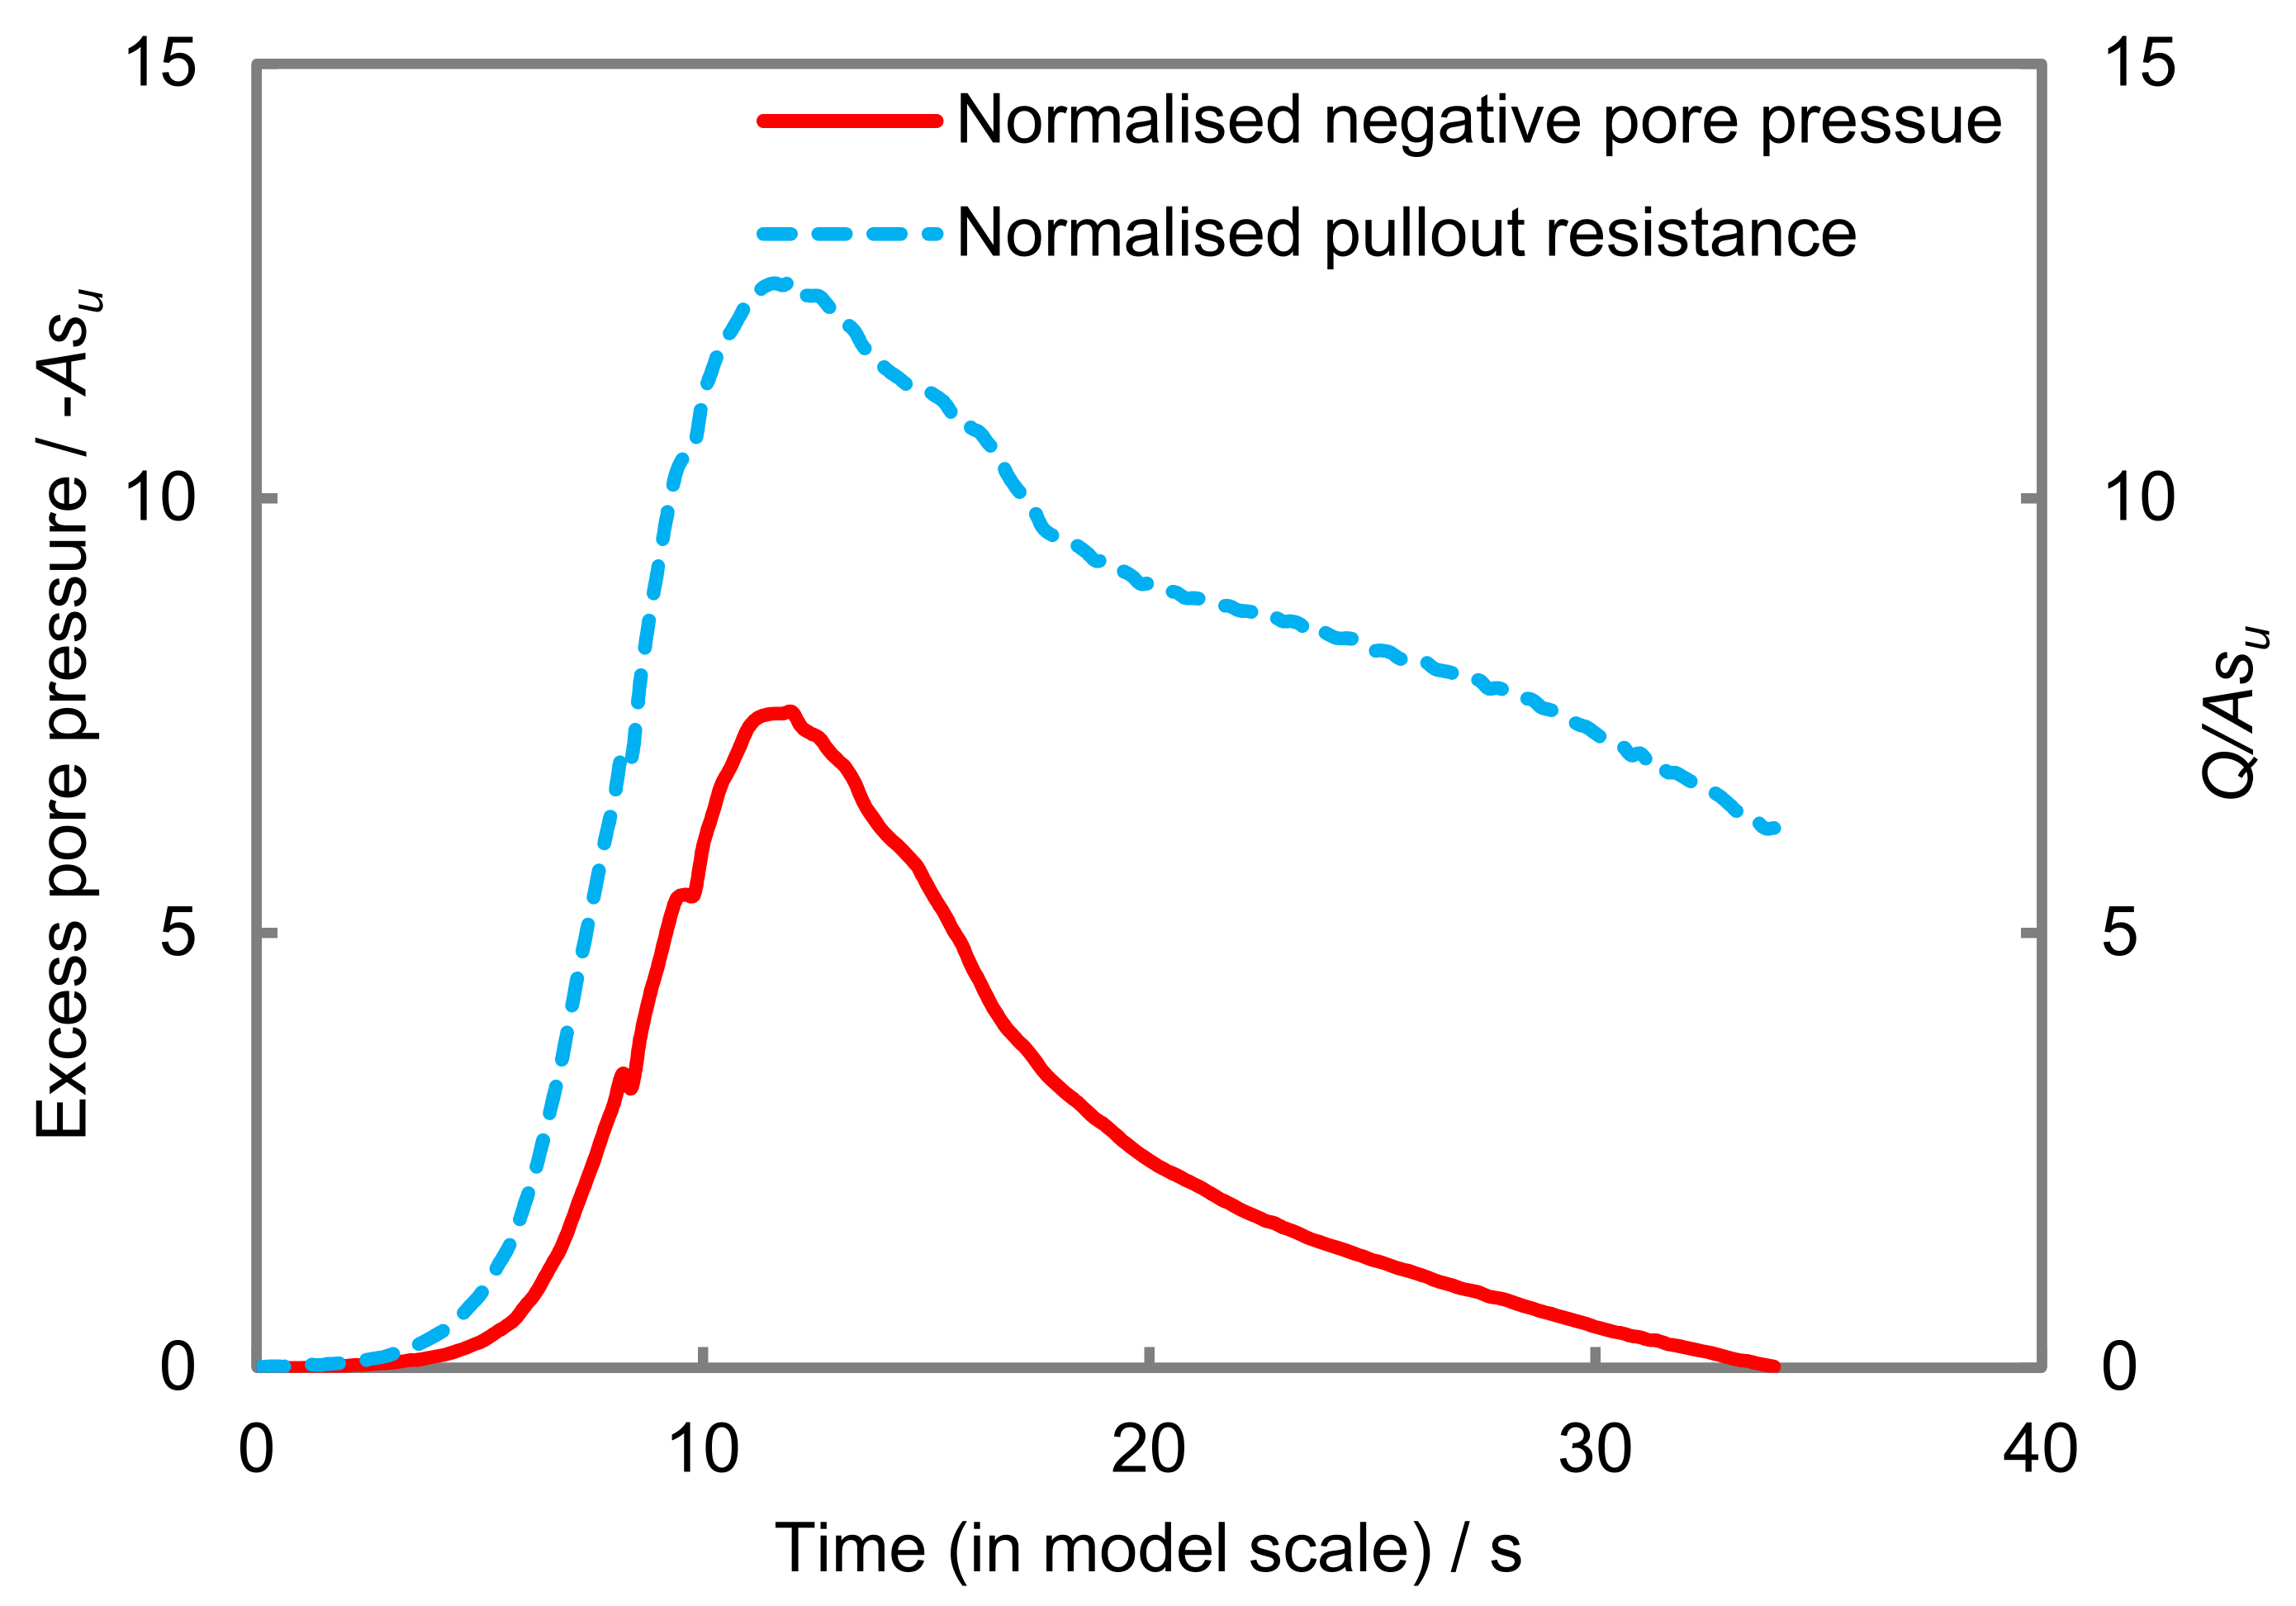
  • The contribution of soil suction beneath the anchor towards the anchor capacity is quantified by monitoring the anchor resistance and the pore pressure beneath the anchor. For a typical anchor, the suction could attribute 60% of the anchor capacity.
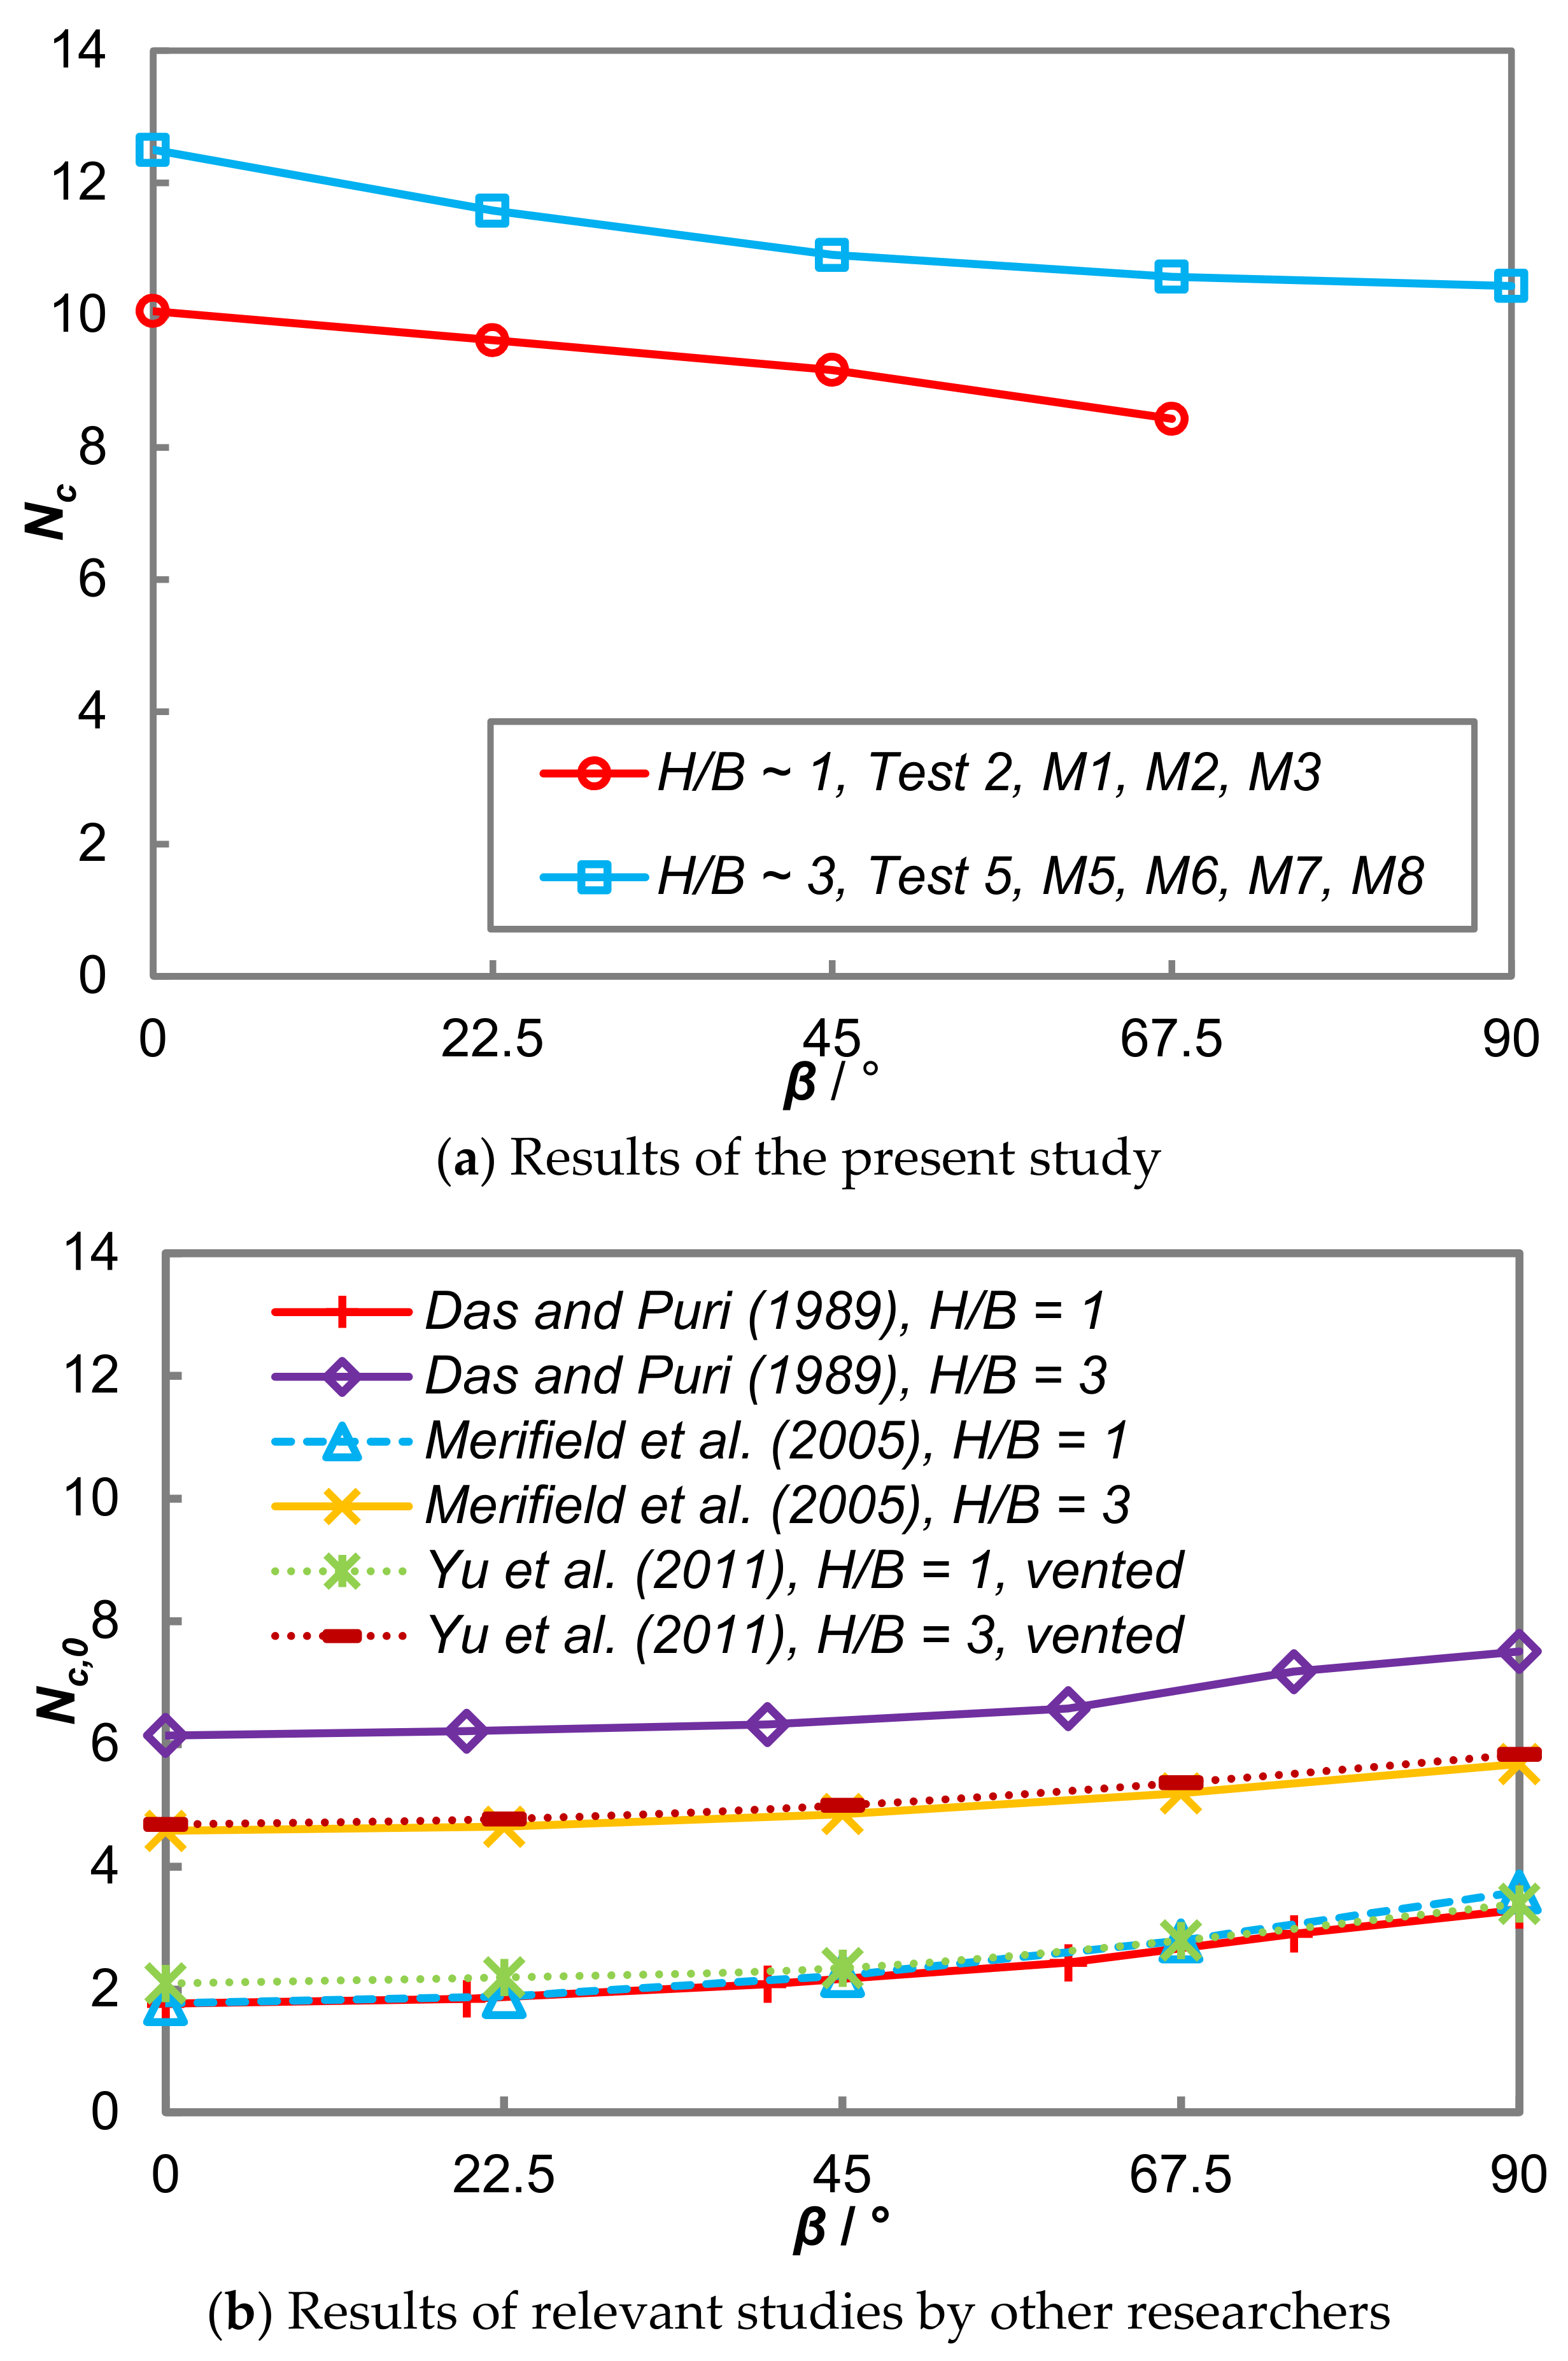
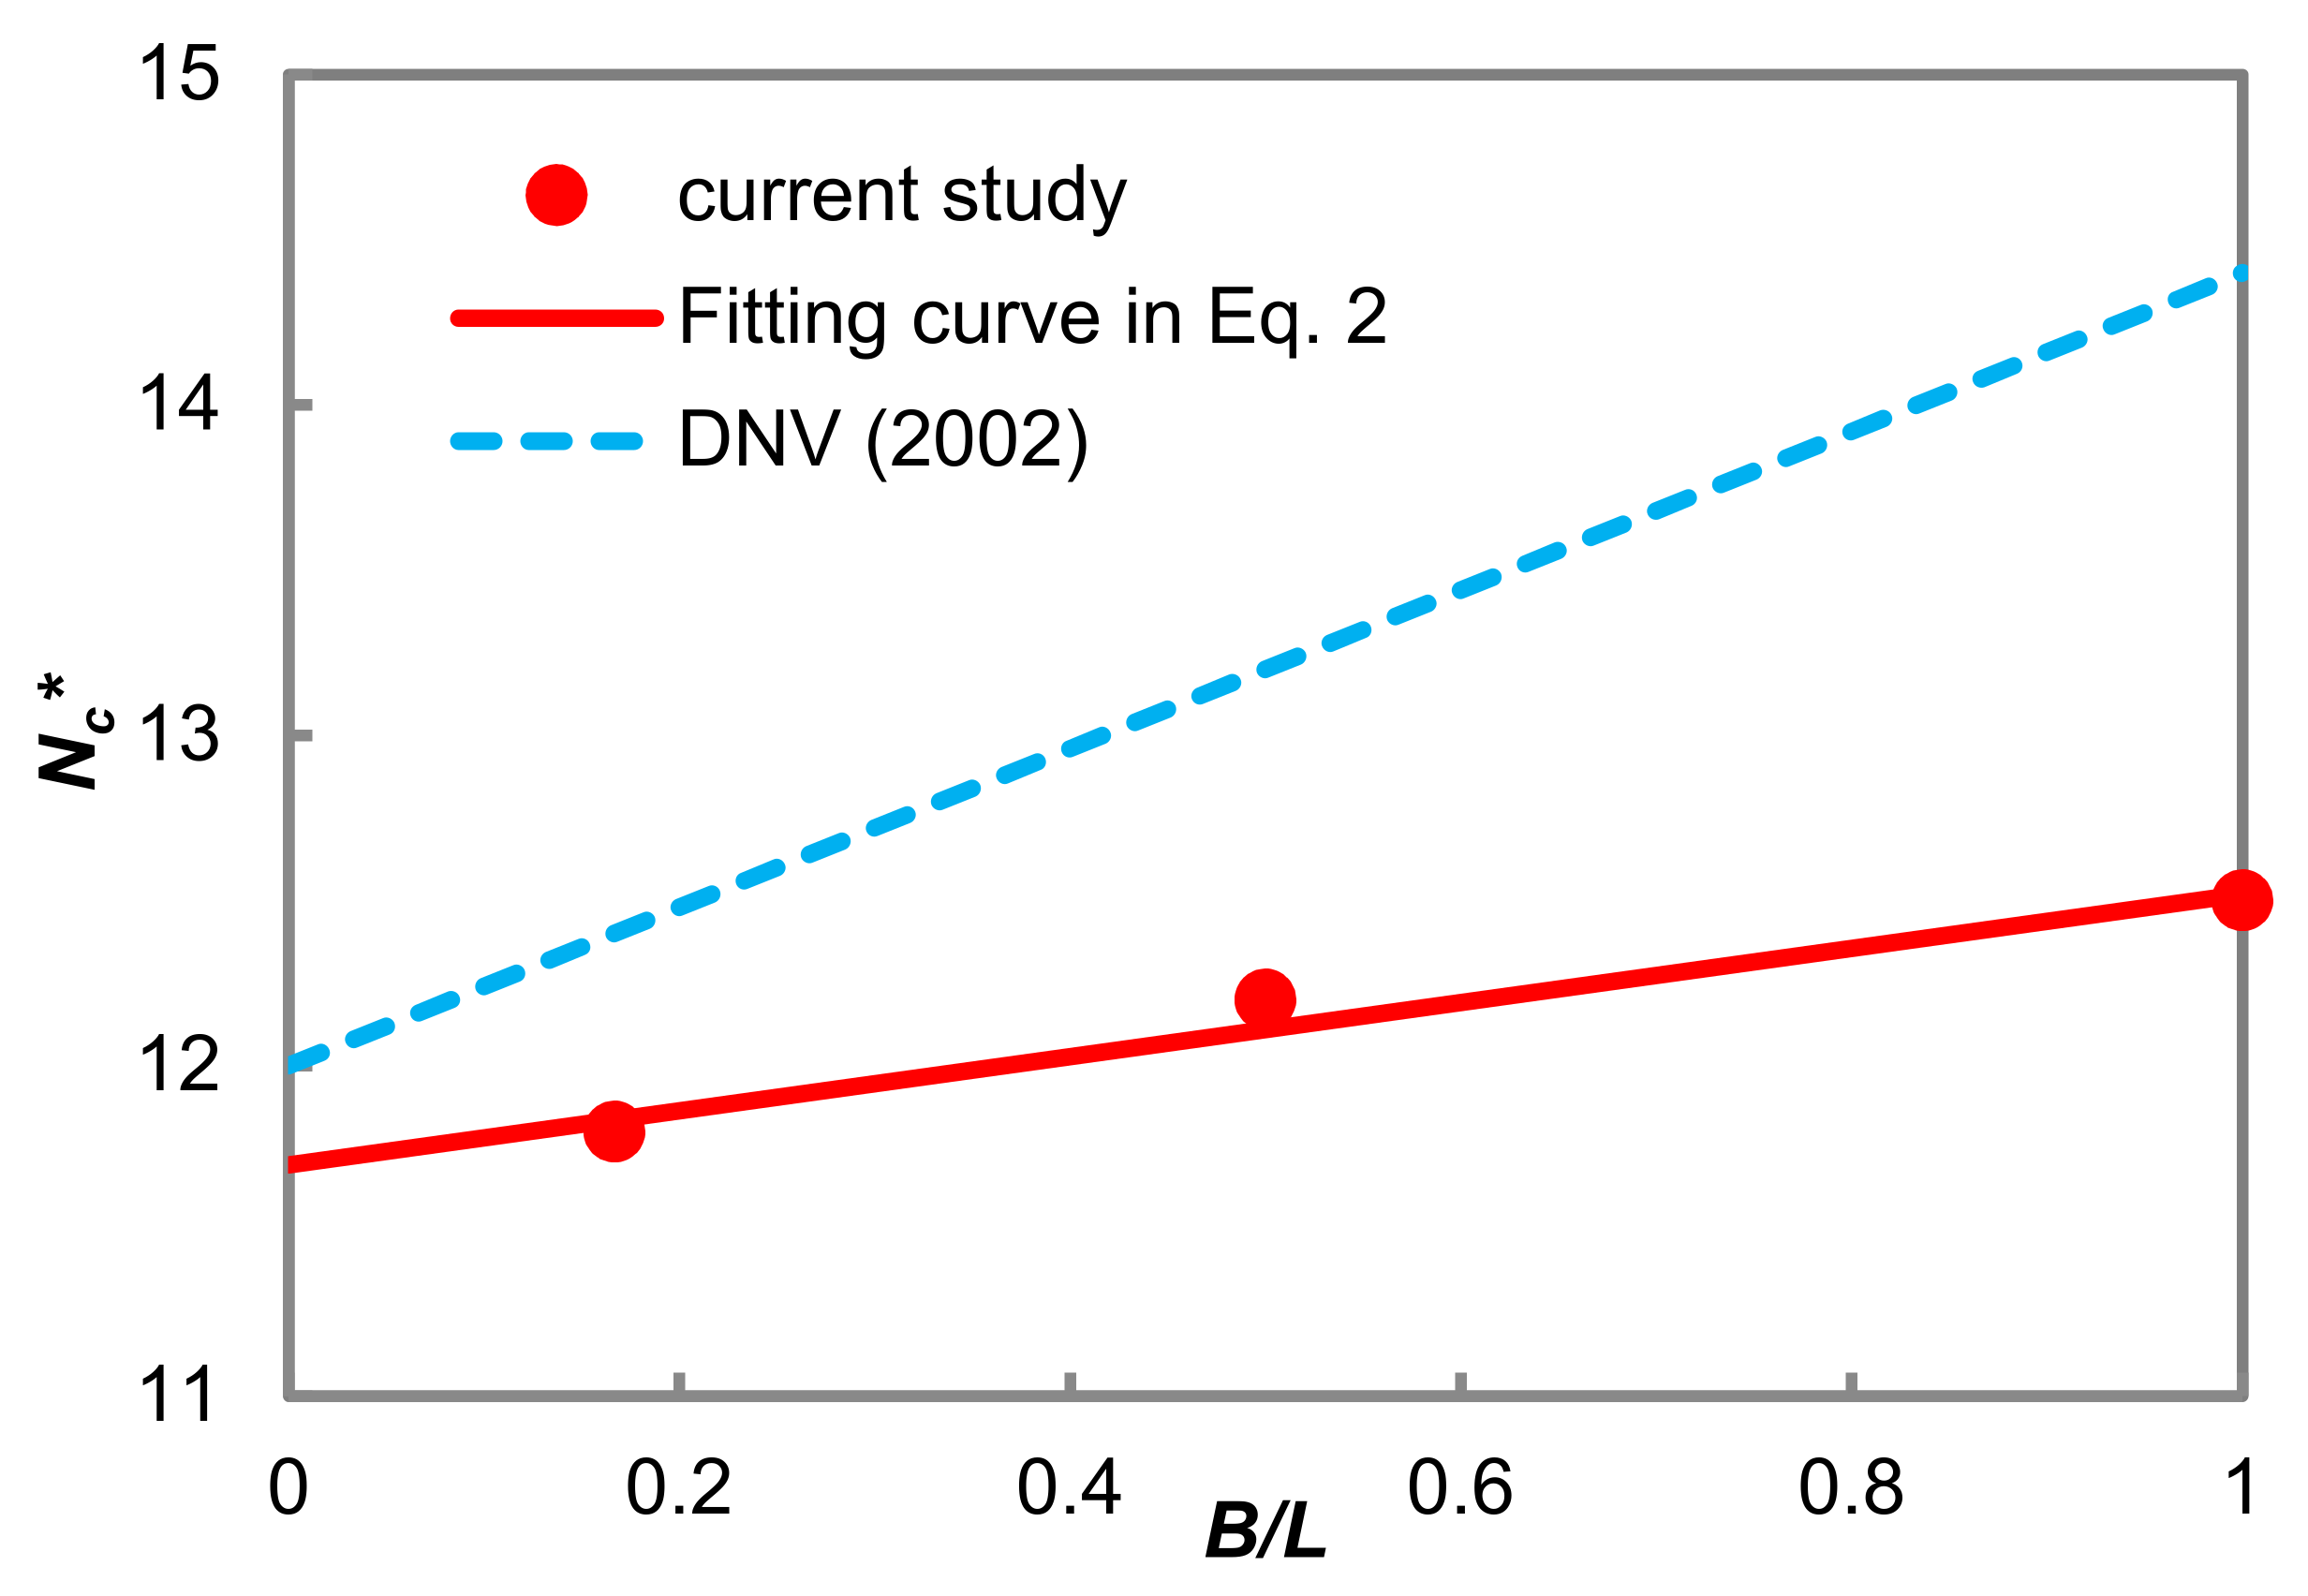
  • The shape factors for rectangular anchors in NC clay obtained from centrifuge tests are considerably lower than those stated in DNV-RP-E302. Based on the present centrifuge test results, the anchor capacity factor for horizontal rectangular anchors in NC clay is given by N c * = 11.7 1 + 0.07 B / L .

Author Contributions

Conceptualization, C.H. and J.C.; methodology, C.H. and J.C.; validation, J.C.; formal analysis, J.C.; investigation, C.H. and J.C.; resources, C.F.L. and Z.L.; data curation, J.C.; writing—original draft preparation, J.C.; writing—review and editing, C.H. and J.C.; supervision, C.F.L. and Y.K.C.; funding acquisition, C.F.L. and Z.L. All authors have read and agreed to the published version of the manuscript.

Funding

This research was funded by Shenzhen Science and Technology Program (No. KQTD20200820113011026), Singapore Ministry of National Development, National Research Foundation and JTC Corporation under L2 NIC Award (No. L2NICTDF1-2015-2) and Maritime and Port Authority of Singapore under the Offshore Technology Research Program (No. R-261-502-002-277).

Institutional Review Board Statement

Not applicable.

Informed Consent Statement

Not applicable.

Data Availability Statement

No data are made available in public. Interested parties can contact the authors.

Acknowledgments

The study is based on research/work “Multi-Purpose Floating Structures- Phase A” supported by the Singapore Ministry of National Development, National Research Foundation and JTC Corporation under L2 NIC Award No. L2NICTDF1-2015-2 and “Shenzhen Science and Technology Program” (No. KQTD20200820113011026) and “Plate anchors for permanent mooring of deep water floating production systems” (No. R-261-502-002-277) funded by Maritime and Port Authority of Singapore under the Offshore Technology Research Program. Those supports are gratefully acknowledged.

Conflicts of Interest

The authors declare no conflict of interest.

References

  1. Das, B.M. Model Tests for Uplift Capacity of Foundations in Clay. Soils Found. 1978, 18, 17–24. [Google Scholar] [CrossRef] [Green Version]
  2. Das, B.M. A Procedure for Estimation of Ultimate Uplift Capacity of Foundations in Clay. Soils Found. 1980, 20, 77–82. [Google Scholar] [CrossRef] [Green Version]
  3. Dickin, E.A. Uplift Behavior of Horizontal Anchor Plates in Sand. J. Geotech. Eng. 1988, 114, 1300–1317. [Google Scholar] [CrossRef]
  4. Vesić, A.S. Breakout Resistance of Objects Embedded in Ocean Bottom. J. Soil Mech. Found. Div. 1971, 97, 1183–1205. [Google Scholar] [CrossRef]
  5. Chen, Z.; Tho, K.K.; Leung, C.F.; Chow, Y.K. Influence of overburden pressure and soil rigidity on uplift behavior of square plate anchor in uniform clay. Comput. Geotech. 2013, 52, 71–81. [Google Scholar] [CrossRef]
  6. Tho, K.K.; Chen, Z.; Leung, C.F.; Chow, Y.K. Pull-out behaviour of plate anchor in clay with linearly increasing strength. Can. Geotech. J. 2014, 51, 92–102. [Google Scholar] [CrossRef]
  7. Merifield, R.S.; Sloan, S.W.; Yu, H.S. Stability of plate anchors in undrained clay. Géotechnique 2001, 51, 141–154. [Google Scholar] [CrossRef]
  8. Merifield, R.S.; Lyamin, A.; Sloan, S.; Yu, H.S. Three-Dimensional Lower Bound Solutions for Stability of Plate Anchors in Clay. J. Geotech. Geoenviron. Eng. 2003, 129, 243–253. [Google Scholar] [CrossRef] [Green Version]
  9. Rowe, R.K.; Davis, E.H. The behaviour of anchor plates in clay. Géotechnique 1982, 32, 9–23. [Google Scholar] [CrossRef] [Green Version]
  10. Song, Z.; Hu, Y.; Randolph, M.F. Numerical simulation of vertical pull-out of plate anchors in clay. J. Geotech. Geoenviron. Eng. 2008, 134, 866–875. [Google Scholar] [CrossRef]
  11. Thorne, C.P.; Wang, C.X.; Carter, J.P. Uplift capacity of rapidly loaded strip anchors in uniform strength clay. Géotechnique 2004, 54, 507–517. [Google Scholar] [CrossRef]
  12. Wang, D.; Hu, Y.; Randolph, M.F. Three-Dimensional Large Deformation Finite-Element Analysis of Plate Anchors in Uniform Clay. J. Geotech. Geoenviron. Eng. 2010, 136, 355–365. [Google Scholar] [CrossRef]
  13. Yu, L.; Liu, J.; Kong, X.-J.; Hu, Y. Numerical study on plate anchor stability in clay. Géotechnique 2011, 61, 235–246. [Google Scholar] [CrossRef]
  14. Purwana, O.A.; Leung, C.F.; Chow, Y.K.; Foo, K.S. Influence of base suction on extraction of jack-up spudcans. Géotechnique 2005, 55, 741–753. [Google Scholar] [CrossRef]
  15. Meyerhof, G.G. Uplift Resistance of Inclined Anchors and Piles. In Proceedings of the 8th International Conference on Soil Mechanics and Foundation Engineering, Moscow, Russia, 6–11 August 1973; pp. 167–172. [Google Scholar]
  16. Han, C.; Wang, D.; Gaudin, C.; O’Loughlin, C.; Cassidy, M.J. Behaviour of vertically loaded plate anchors under sustained uplift. Géotechnique 2016, 66, 681–693. [Google Scholar] [CrossRef] [Green Version]
  17. Han, C.; Wang, D.; Gaudin, C.; O’Loughlin, C.; Cassidy, M.J. Capacity of plate anchors in clay under sustained uplift. Ocean Eng. 2021, 226, 108799. [Google Scholar] [CrossRef]
  18. White, D.J.; Take, W.A.; Bolton, M.D. Measuring soil deformation in geotechnical models using digital images and PIV analysis. In Proceedings of the 10th International Conference on Computer Methods and Advances in Geomechanics, Tucson, AZ, USA, 7–12 January 2001; pp. 997–1002. [Google Scholar]
  19. Singh, S.P.; Ramaswamy, S.V. Effect of shape on holding capacity of plate anchors buried in soft soil. Géoméch. Geoengin. 2008, 3, 145–154. [Google Scholar] [CrossRef]
  20. DNV. Design and Installation of Plate Anchors in Clay; Recommended practice DNV-RP-E302; Det Norske Veritas: Oslo, Norway, 2002. [Google Scholar]
  21. Gourvenec, S.; Randolph, M.; Kingsnorth, O. Undrained Bearing Capacity of Square and Rectangular Footings. Int. J. Géoméch. 2006, 6, 147–157. [Google Scholar] [CrossRef]
  22. Skempton, A.W. The Bearing Capacity of Clays. In Proceeding of the Building Research Congress, London, UK, 11–20 September 1951; pp. 180–189. [Google Scholar]
  23. Chen, J. Centrifuge Model Study on Pull-Out Behaviour of Suction Embedded Plate Anchor. Ph.D. Thesis, National University of Singapore, Singapore, 2017. [Google Scholar]
  24. Finnie, I.W.S. Performance of Shallow Foundations in Calcareous Soils. Ph.D. Thesis, University of Western Australia, Perth, Australia, 1993. [Google Scholar]
  25. Stewart, D.P.; Randolph, M.F. A new site investigation tool for the centrifuge. Proc. Int. Conf. Cent. 1991, 91, 531–533. [Google Scholar]
  26. Taylor, R.N. Centrifuges modeling: Principles and scale effects. In Geotechnical Centrifuge Technology; Blackie Academic and Professional: London, UK, 1995; pp. 19–33. [Google Scholar]
  27. Wilde, B.; Treu, H.; Fulton, T. Field testing of suction embedded plate anchors. In Proceedings of the 11th International Offshore and Polar Engineering Conference, Stavanger, Norway, 17–22 June 2001; pp. 544–551. [Google Scholar]
  28. Gaudin, C.; O’Loughlin, C.D.; Randolph, M.F.; Lowmass, A.C. Influence of the installation process on the performance of suction embedded plate anchors. Géotechnique 2006, 56, 381–391. [Google Scholar] [CrossRef]
Figure 1. Model and geometry of horizontal and inclined plate anchors (only half the length of the anchor (L/2) is modelled in the centrifuge model test owing to symmetry).
Jmse 09 01103 g001
Figure 2. Centrifuge model set-up.
Jmse 09 01103 g002
Figure 3. Undrained soil strength su profiles under 50× g and 100× g.
Jmse 09 01103 g003
Figure 4. Soil flow during soil re-consolidation.
Jmse 09 01103 g004
Figure 5. Load-displacement curves obtained in verification tests.
Jmse 09 01103 g005aJmse 09 01103 g005b
Figure 6. Pull-out responses of horizontal square anchors with different embedment ratios.
Jmse 09 01103 g006
Figure 7. Load-displacement response of square anchor (H/B = 1.1).
Jmse 09 01103 g007
Figure 8. Soil movement pattern of horizontal square anchor (H/B = 1.1).
Jmse 09 01103 g008aJmse 09 01103 g008b
Figure 9. Photographs taken from the test on horizontal square anchor (H/B = 1.1).
Jmse 09 01103 g009
Figure 10. Load-displacement response of horizontal square anchor (H/B = 2.1).
Jmse 09 01103 g010
Figure 11. Soil movement pattern of horizontal square anchor (H/B = 2.1).
Jmse 09 01103 g011aJmse 09 01103 g011b
Figure 12. Soil failure mechanism for horizontal shallow and deep square anchors (soil movement contours normalised by anchor displacement).
Jmse 09 01103 g012
Figure 13. Soil horizontal and vertical displacements for horizontal shallow square anchor (normalised by anchor displacement).
Jmse 09 01103 g013
Figure 14. Normalised load-displacement curves of anchors with different inclinations.
Jmse 09 01103 g014
Figure 15. Variation of square anchor capacity factor with anchor inclination.
Jmse 09 01103 g015
Figure 16. Soil movement pattern for shallow square anchors with different inclination.
Jmse 09 01103 g016aJmse 09 01103 g016b
Figure 17. Soil failure mechanisms for shallow square anchors with different inclination.
Jmse 09 01103 g017
Figure 18. Soil movement pattern for deep square anchors with different inclination.
Jmse 09 01103 g018
Figure 19. Pore pressure at anchor base and normalised pull-out resistance during anchor extraction (H/B = 2.8).
Jmse 09 01103 g019
Figure 20. Normalised suction force and pull-out resistance during extraction (H/B = 2.8).
Jmse 09 01103 g020
Figure 21. Normalised load-displacement curves and capacity factors for horizontal anchors (L/B = 2).
Jmse 09 01103 g021aJmse 09 01103 g021b
Figure 22. Normalised load-displacement curves and capacity factors for horizontal anchors (L/B = 6).
Jmse 09 01103 g022
Figure 23. Limiting capacity factors of horizontal anchors versus B/L.
Jmse 09 01103 g023
Table 1. Properties of kaolin clay (data from Chen, J., 2017, Ph. D. Thesis, National University of Singapore [23]).
ParameterMagnitude
Liquid limit74%
Plastic limit35%
Specific gravity, Gs2.60
Compression index
Coefficient of consolidation
0.473
15 m2/year
Coefficient of permeability at 100 kPa1.0 × 10−9 m/s
Table 2. Test programs for horizontal anchors.
Aspect Ratio (L/B)Test Numberg LevelH/BHalf Anchor Model Dimension
mm
1 (square)1500.580 × 40 × 4
2501.180 × 40 × 4
3502.180 × 40 × 4
4502.980 × 40 × 4
51002.840 × 20 × 2
61004.240 × 20 × 2
71004.640 × 20 × 2
81005.640 × 20 × 2
2 (rectangular)9501.080 × 80 × 4
10502.180 × 80 × 4
111002.240 × 40 × 2
121003.140 × 40 × 2
131004.340 × 40 × 2
6 (close to strip)141001.740 × 120 × 2
151002.140 × 120 × 2
161003.140 × 120 × 2
Table 3. Test programs for inclined square anchors.
Test Numberg LevelH/BAnchor Inclination, β°Half Anchor Model Dimension
mm
M1501.222.580 × 40 × 4
M2501.24580 × 40 × 4
M3501.267.580 × 40 × 4
M4503.04580 × 40 × 4
M51003.122.540 × 20 × 2
M61003.24540 × 20 × 2
M71003.067.540 × 20 × 2
M81003.09040 × 20 × 2
Publisher’s Note: MDPI stays neutral with regard to jurisdictional claims in published maps and institutional affiliations.

