Abstract
In this study, physical model tests are used to investigate the effects of a varying number of wave and current parameters, the gap ratios between the pipeline and seabed, the spacing ratios between the two pipelines and the diameter ratios on the hydrodynamic coefficients of the large, small pipeline and pipeline system (bundle) in a piggyback configuration under the combined action of waves and current. The results show that, compared with the pure wave field, the existence of the steady current will lead to a decrease in hydrodynamic coefficients. In addition, the results indicate clear differences between the hydrodynamic coefficients of the large pipeline, small pipeline and piggyback pipeline system. The experimental results on hydrodynamic coefficients can be used as an important basis for the safety design of a submarine piggyback pipeline.
1. Introduction
With the wide application of submarine pipelines, marine technicians have been dedicated to the study of new technologies to reduce the submarine pipeline design and construction cost, thus to improve the economic benefits of marine oil and gas field development. One common technique is the use of a pipeline bundle structure, in which two or more pipelines are bundled together, thus reducing pipeline laying time and cost [1]. At present, the most popular pipeline bundle structure is composed of two parallel and unequal-diameter pipelines bound together. The large pipeline is used to transport crude oil, and the small pipeline is located just above the large one, and often used to transport some replacement medium (diesel oil, seawater), or send control signals. This pipeline bundle structure is called “piggyback pipeline”, as shown in Figure 1. The diameter ratio d/D (small pipeline diameter is d, large pipeline diameter is D) generally ranges from 0.1 to 0.5. According to the design and installation requirements of the pipeline, there may be a certain gap G between the large and small pipeline, or they may contact each other (G = 0). There is a certain gap e between the bottom of the large pipeline and the seabed due to the unflatness of the seabed and the erosion of the bottom of the pipeline. The piggyback pipeline configuration has the advantages of low cost and a short time limit, which is suitable for the development requirements of offshore marginal oil and gas fields, thus greatly solving the development problems of most marginal oil and gas fields that have been proved but not yet developed offshore, and also plays a crucial role in the stable growth of offshore oil and gas production. At present, this pipeline configuration has been put into production and normal operation in the BZ34–3/5 marginal oil field in the Bohai Sea, China [2]. Compared with the single pipeline, the flow field and hydrodynamic characteristics around the piggyback pipeline are more complex, so it is very important to pay attention to the hydrodynamic characteristics of this pipeline configuration.
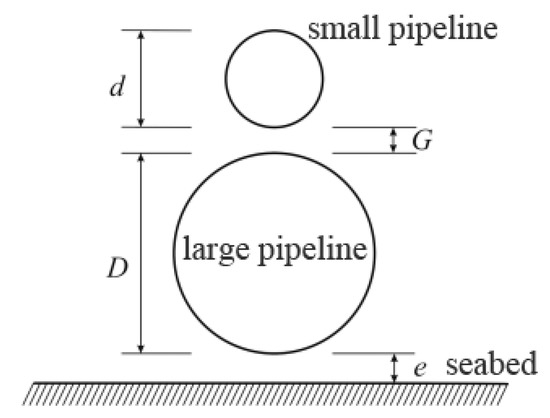
Figure 1.
Submarine piggyback pipeline configuration.
Many scholars at home and abroad have performed some research on the submarine piggyback pipeline. For example, Kalghatgi et al. [3] focused on the experimental study of the load imposed on the piggyback configuration by the uniform incident flow, in which the variations of drag and lift coefficients with Reynolds number (Re) and gap ratios (e/D) were investigated. Kamarudin et al. [4] and Zhao et al. [5] numerically simulated the hydrodynamic characteristics of the piggyback pipeline under the condition of steady flow, and obtained the pressure distribution, hydrodynamic coefficient and vortex shedding modes around the pipeline with different Re numbers. Yang et al. [6] studied the influence of different piggyback configurations on local seabed scour patterns under the action of steady flow through laboratory tests and numerical simulation. Asrari Sahar et al. [7] studied the effect of the pipeline diameter ratio and the gap ratio between pipelines on the scour below the piggyback pipeline under the action of steady flow through numerical simulation and experimental testing. Janocha Marek Jan et al. [8] studied the vortex-induced vibrations of the piggyback pipeline near the horizontal wall in the upper transition zone. Jiang et al. [9] used the high precision immersion boundary method to simulate the two-degree-of-freedom vortex-induced vibration phenomenon of the piggyback pipeline at a low Reynolds number (Re = 150). Cheng et al. [10,11] studied the hydrodynamic characteristics of the submarine piggyback configuration under the action of regular and irregular waves by physical model experiment and numerical simulation, respectively.
The above studies mainly focused on the case of a single steady current or a single wave. However, in the actual marine environment, the tidal current will cause a strong current in the vicinity of the shore or some islands and reefs affected by the topography. In addition, under the influence of storm surge, there will also be a lot of waves, as well as the influence of ocean internal waves, so it is important to carry out the hydrodynamic analysis of the submarine piggyback pipeline under the combined action of waves and current for the safety design of pipelines. At present, there are few studies on the combined action of waves and current on the submarine piggyback pipeline. Ma et al. [12] and Li et al. [13] experimentally studied the influence of the Keulegan–Carpenter (KC) number on the hydrodynamic force of the piggyback pipeline system (bundle) in the wave–current flume. Branković et al. [14] carried out extensive physical model experiments to study the hydrodynamic forces of piggyback configurations placed on and raised from the seabed under the combined action of waves (simulated by oscillating flows) and currents, respectively. The research results of the above studies are limited to the effect of the KC number on the hydrodynamic forces of the piggyback pipeline system.
In the case of regular wave plus current, the KC number is defined as follows [15]:
where, , is the velocity of water flow at the elevation of the large pipeline axis, is the maximum horizontal velocity of the wave water particle at the axial position of the large pipeline and T is the wave period.
In the case of irregular wave plus current, the definition of the KC number is similar to that in the case of regular wave plus current, but and T in Formula (2) should be replaced by significant wave velocity and peak spectral period .
In this paper, the effects of different wave and current factors (KC number), the velocity ratio , the gap ratio between the large pipeline and seabed , the spacing ratio between pipelines and the diameter ratio on the hydrodynamic coefficients of the large, small pipeline and piggyback pipeline system under the action of regular (irregular) wave and current are systematically investigated by physical model tests. The experimental setup and procedure are described in Section 2. Experimental results are verified by comparison with other studies in Section 3. Experimental results and analysis are described in Section 4.
2. Experimental Section
2.1. Experimental Arrangement
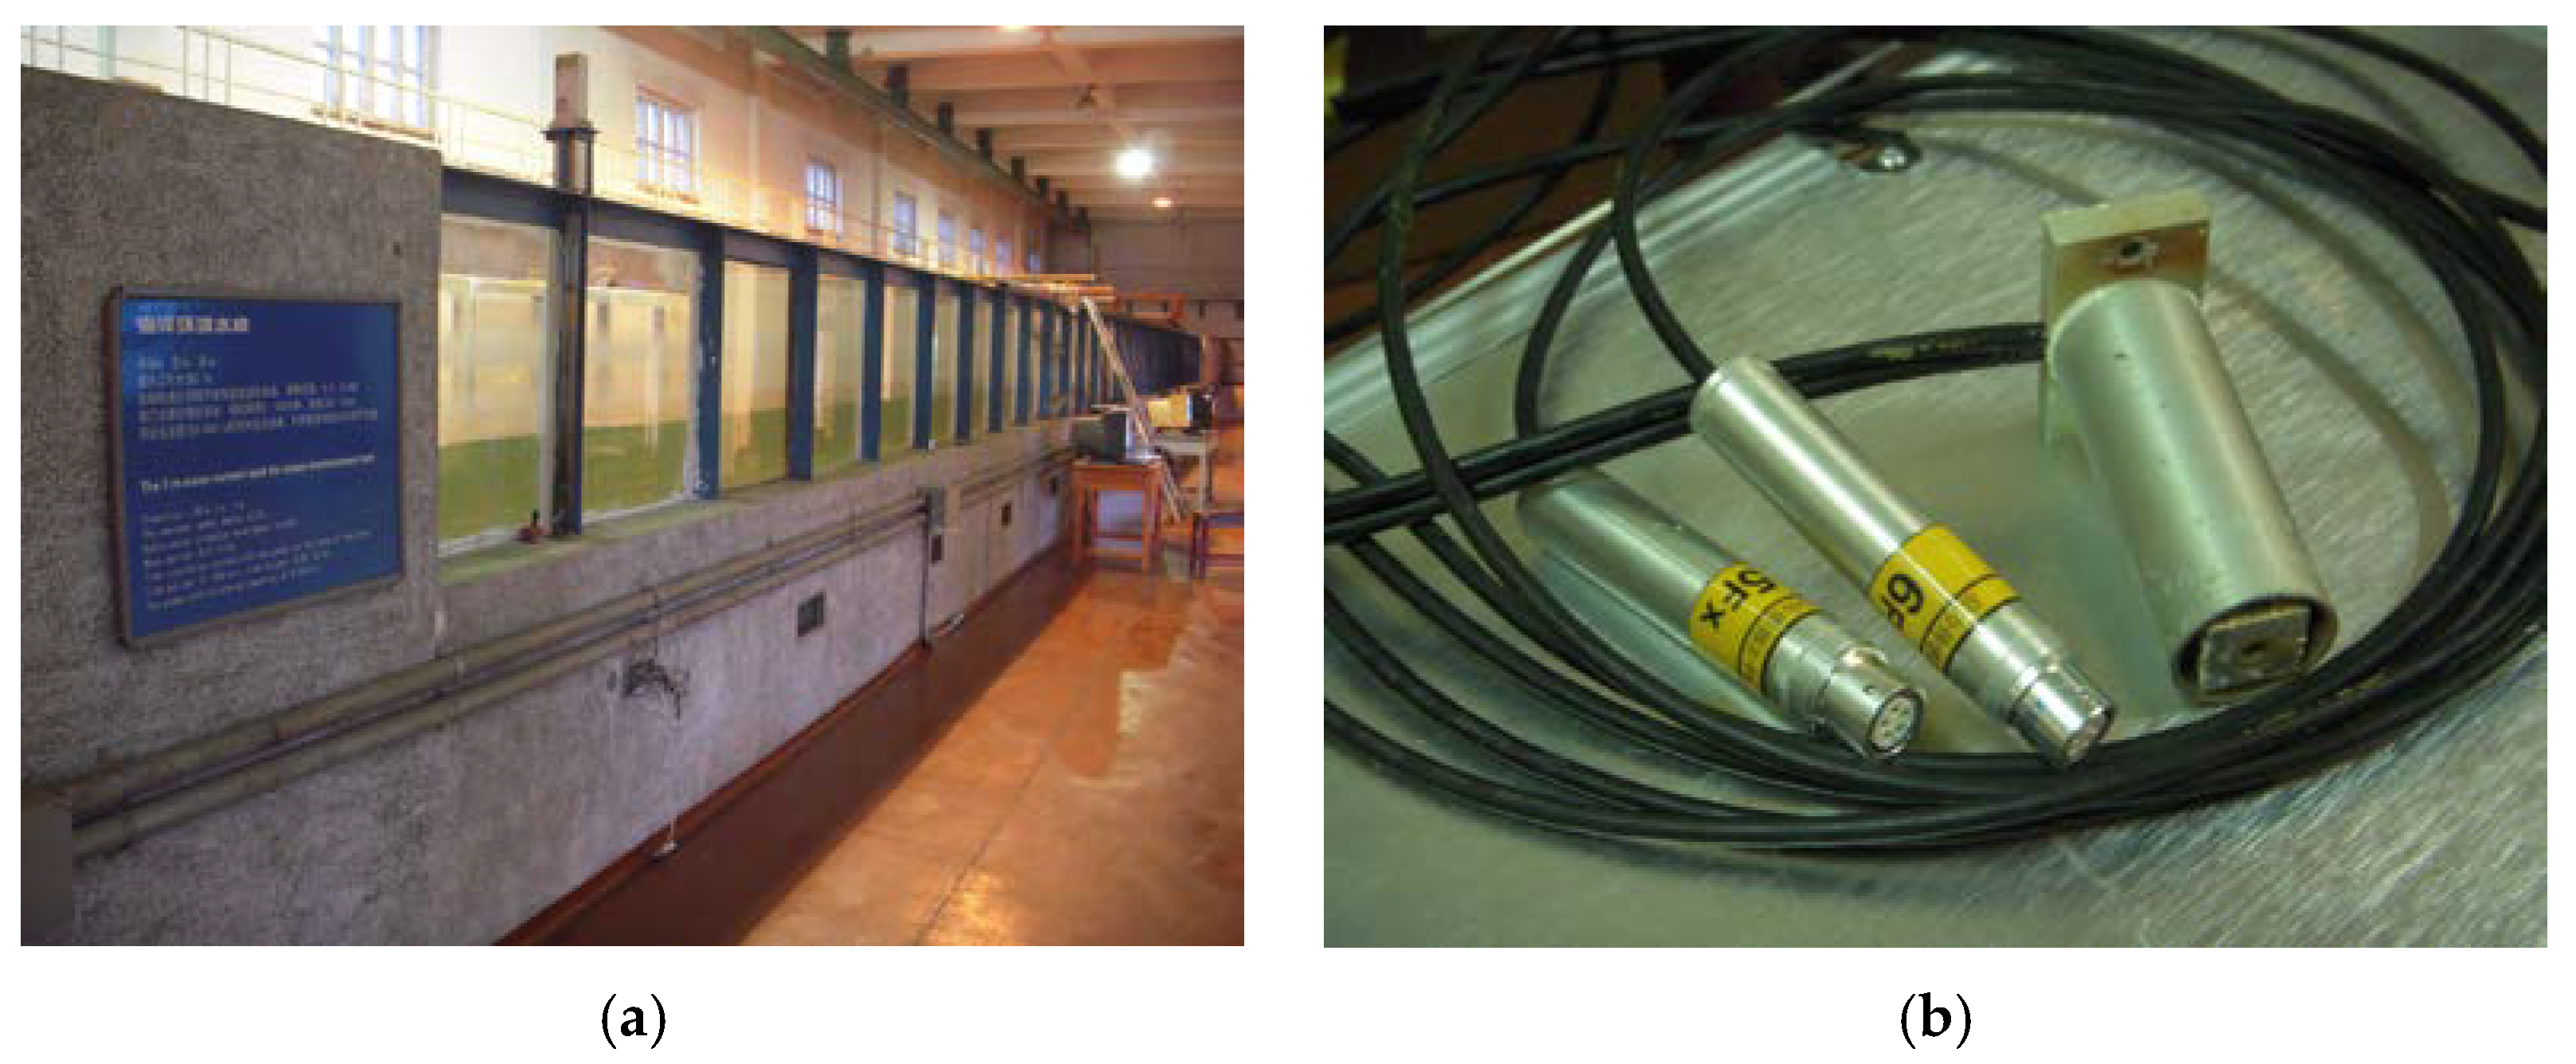
Physical model experiments were carried out in the marine environment flume of the State Key Laboratory of Coastal and Offshore Engineering, Dalian University of Technology, as shown in Figure 2a. The tank was 50 m long, 3 m wide and 1 m deep, with a maximum working water depth of 0.7 m. The tank was equipped with a servo electrohydraulic irregular wave generator system with a cycle range of 0.5~5.0 s. At the same time, there were two two-way flow-making pumps with a total flow rate of 0.65 m3/s, and the velocity was adjusted by frequency conversion. The experimental water depth was 0.3 m, the maximum height of the regular wave generated by the wave generator could reach 0.136 m, and the maximum stable flow velocity that could be achieved in practice was 0.45 m/s. The wave height was measured by the resistance wave height meter, the water flow velocity was measured by the little veyron point current meter, and the wave elements and velocity were collected and processed by a microcomputer system. A DS30 underwater bidirectional force sensor was used to measure the horizontal force and lift force of pipelines at the same time, as shown in Figure 2b. The measuring range of the sensor was 9.8 N, which had the advantages of good waterproof performance, stable test and good linearity, etc.

Figure 2.
(a) The experiment tank; (b) force sensors.
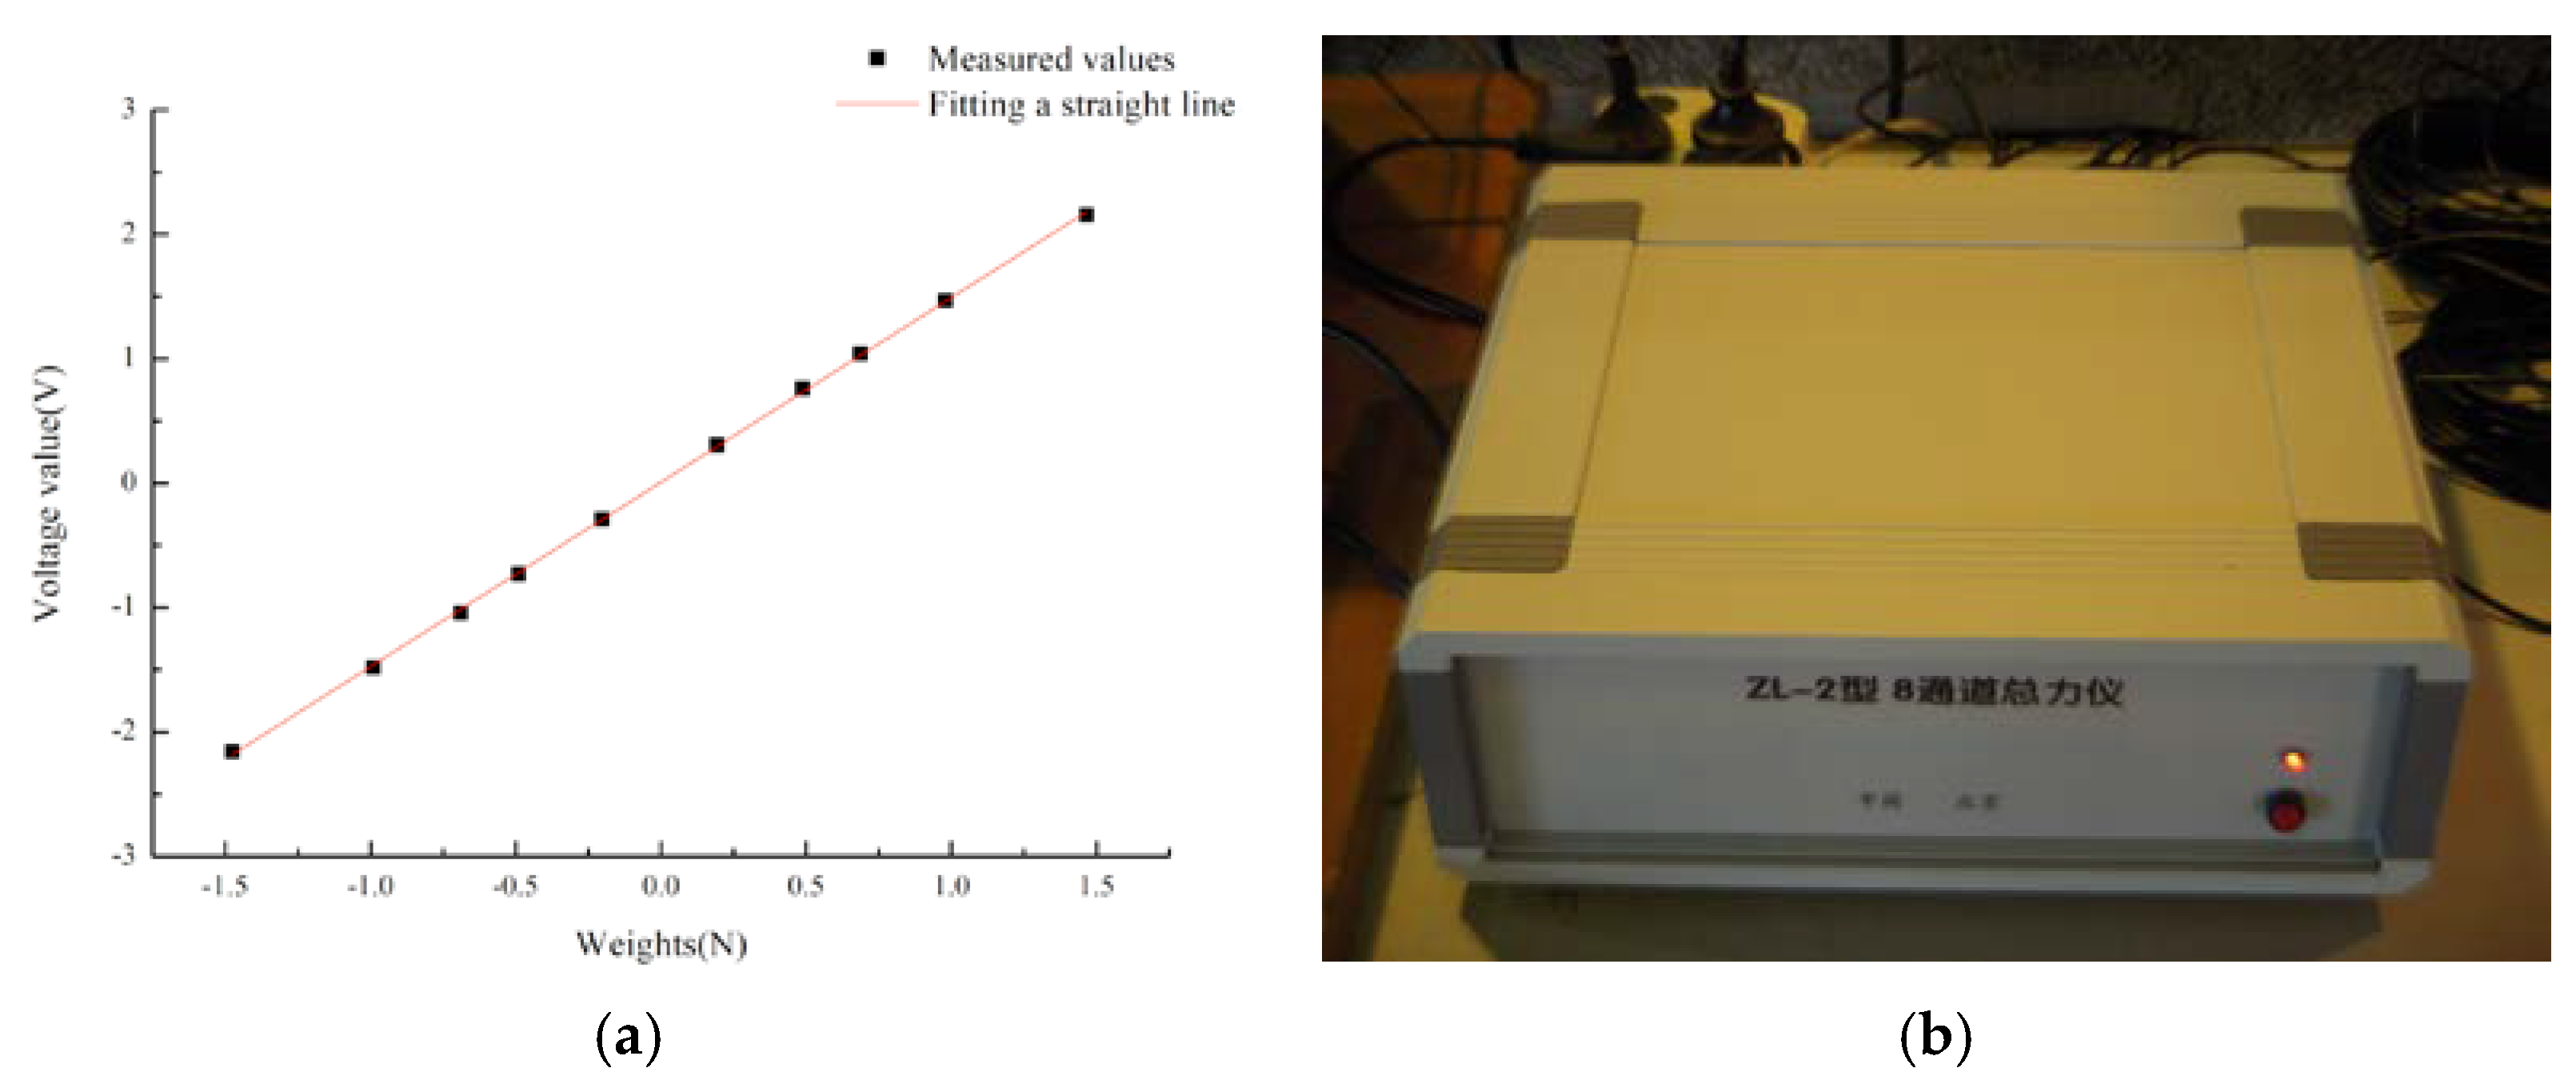
Each force sensor was calibrated before it was used. The horizontal and vertical directions of each sensor were demarcated by increasing or decreasing weights. Figure 3a shows the horizontal calibration curve of the No. 1 (1#) force sensor. It can be seen from the figure that there was a linear relationship between the weight (N) and the induced voltage value (V), and its calibration coefficient was obtained to be 1.495 V/N. The error was 0.3% with the calibration coefficient of 1.5 V/N delivered by the sensor, which met the measurement accuracy. In addition, through the calibration, it was found that the horizontal and vertical loads had little interference with each other, and the interference degree was less than 1.5%. The force signal was collected by a ZL-2 8-channel total force meter, as shown in Figure 3b. This acquisition instrument can be connected to 4 force sensors (each sensor corresponds to 2 channels) at the same time, and the horizontal force and lift force corresponding to the 4 sensors can be measured in the same step. The other end of the total force meter is connected to a computer to output and process force signals.

Figure 3.
(a) Rating curve of No. 1 (1#) force sensor; (b) ZL-2 8-channel total force meter.
The piggyback pipeline studied in this paper is a small-scale object (the ratio of pipeline diameter to incident wavelength D/L ≤ 2.0), and the existence of the piggyback pipeline has no significant influence on the wave motion. In addition, the pipeline studied in this paper is a rigid structure, without considering the deformation and the influence of roughness on the hydrodynamic force of the pipeline. At the same time, the difference between the natural frequency and the wave frequency should be ensured to avoid resonance. The selection of model pipeline materials requires small density, high hardness, large stiffness and good corrosion resistance. Based on the above restrictions on pipeline model design, the model design parameters of the large pipeline and small pipeline are shown in Table 1. The total length of the pipeline was 100 cm, the large pipe was made of hollow aluminum pipe, the outer diameter was 20 mm, the wall thickness was 2 mm, the pipe was filled with water to increase the proportion of the pipeline and the two ends were blocked with wooden plugs. Since this paper needed to study the influence of the diameter ratios on hydrodynamic coefficients, the diameter of the large pipeline was set unchanged in the experiment, and the small pipelines with different diameters were investigated. See Table 1 for related parameters.

Table 1.
Designing parameters of pipeline models.
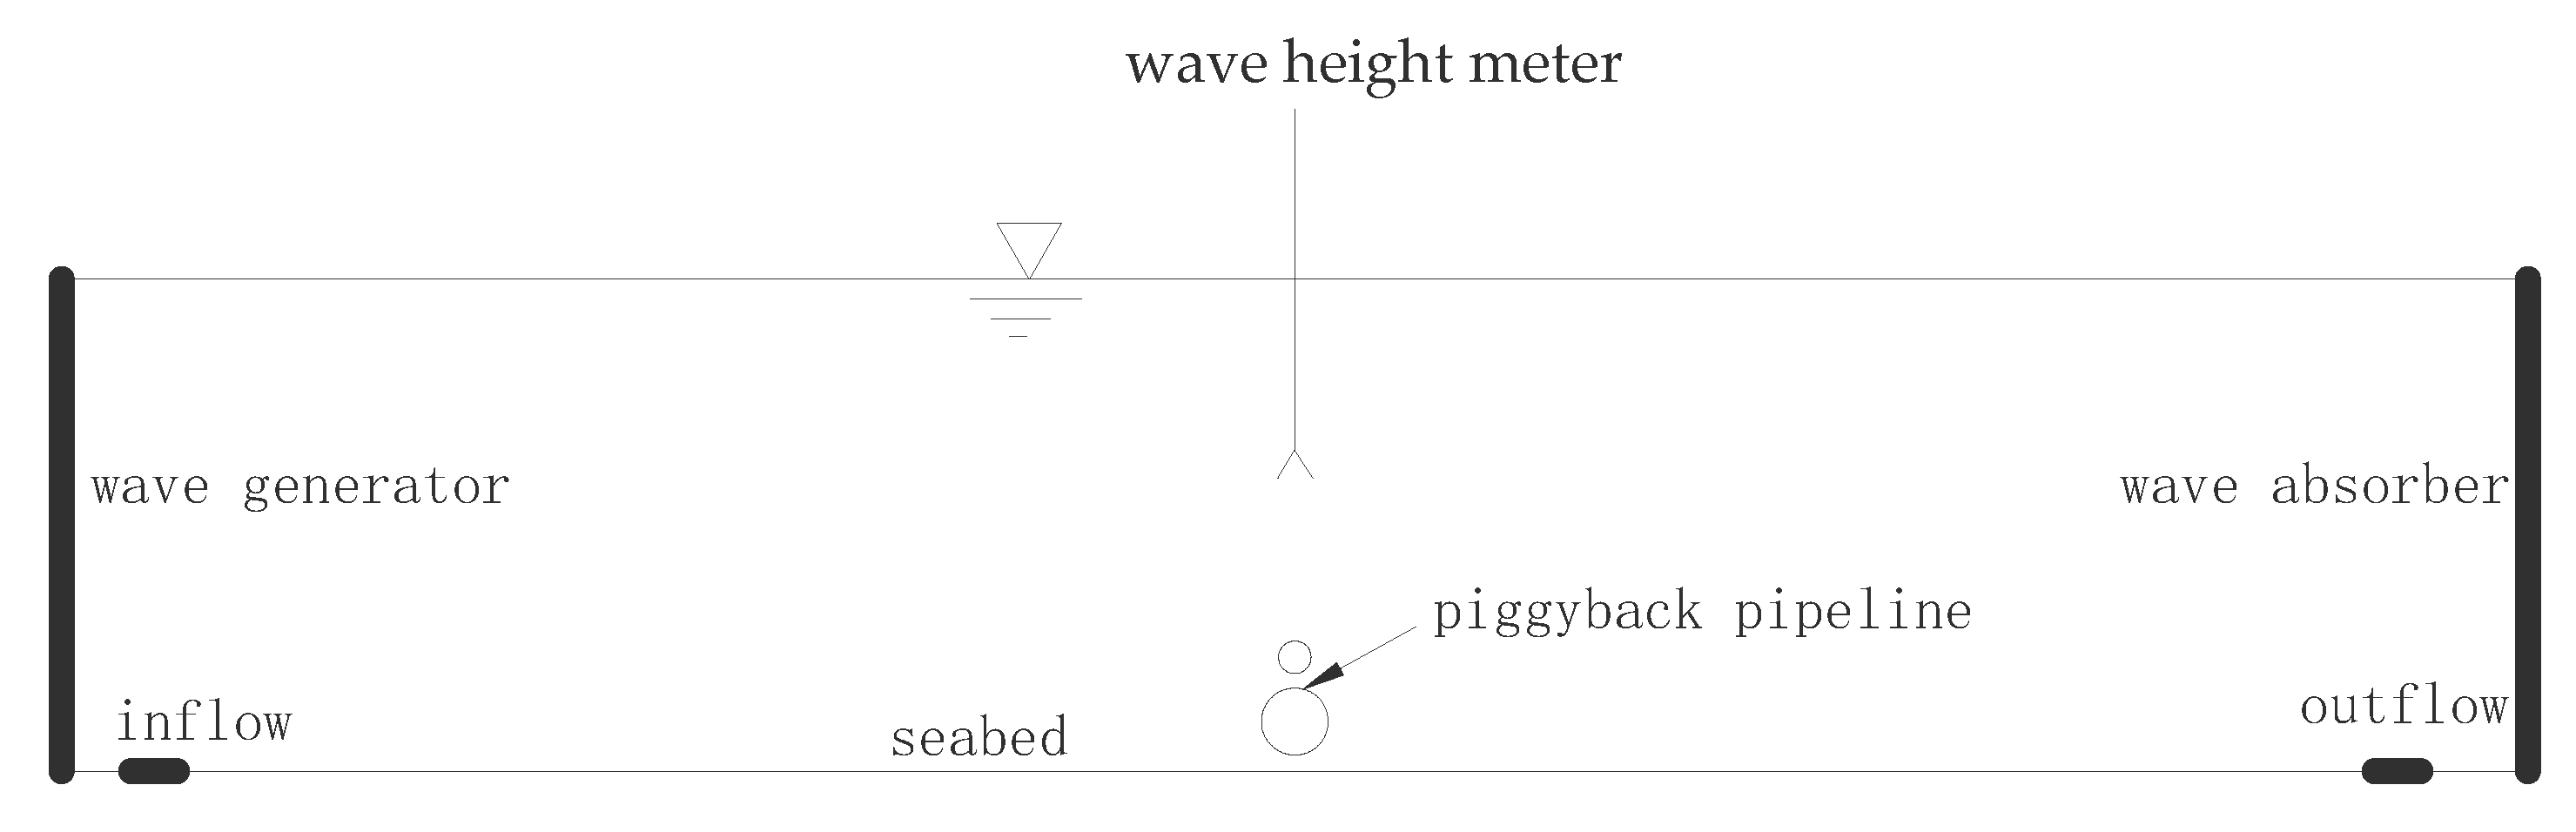
The whole pipeline model was placed in the center of the flume, as shown in Figure 4. A wave height meter was placed directly above the pipeline axis and its end was 13 cm below the water surface, which was used to record the measured wave surface process at the pipeline position synchronously. For each group of experimental conditions, the microcomputer system controlled the acquisition of the dynamometer and wave height meter at the same time, so that the horizontal and lift force of pipelines and the wave surface process at the pipeline position were recorded synchronously in each group of working conditions. The sampling length was 2048 points in the regular wave and current acting condition and 8192 points in the irregular wave and current acting condition, and the sampling interval was 0.02 s. Each group of working conditions was repeated at least three times.

Figure 4.
Sketch of the experimental layout.
In the experiment, three different pipeline configurations were investigated, namely the pipeline configuration to measure the forces acting on a single large pipeline (Case 1), the pipeline configuration to measure the forces acting on the piggyback pipeline system (bundle) (Case 2) and the pipeline configuration to separately measure the forces acting on the large and small pipeline in the piggyback configuration (Case 3).
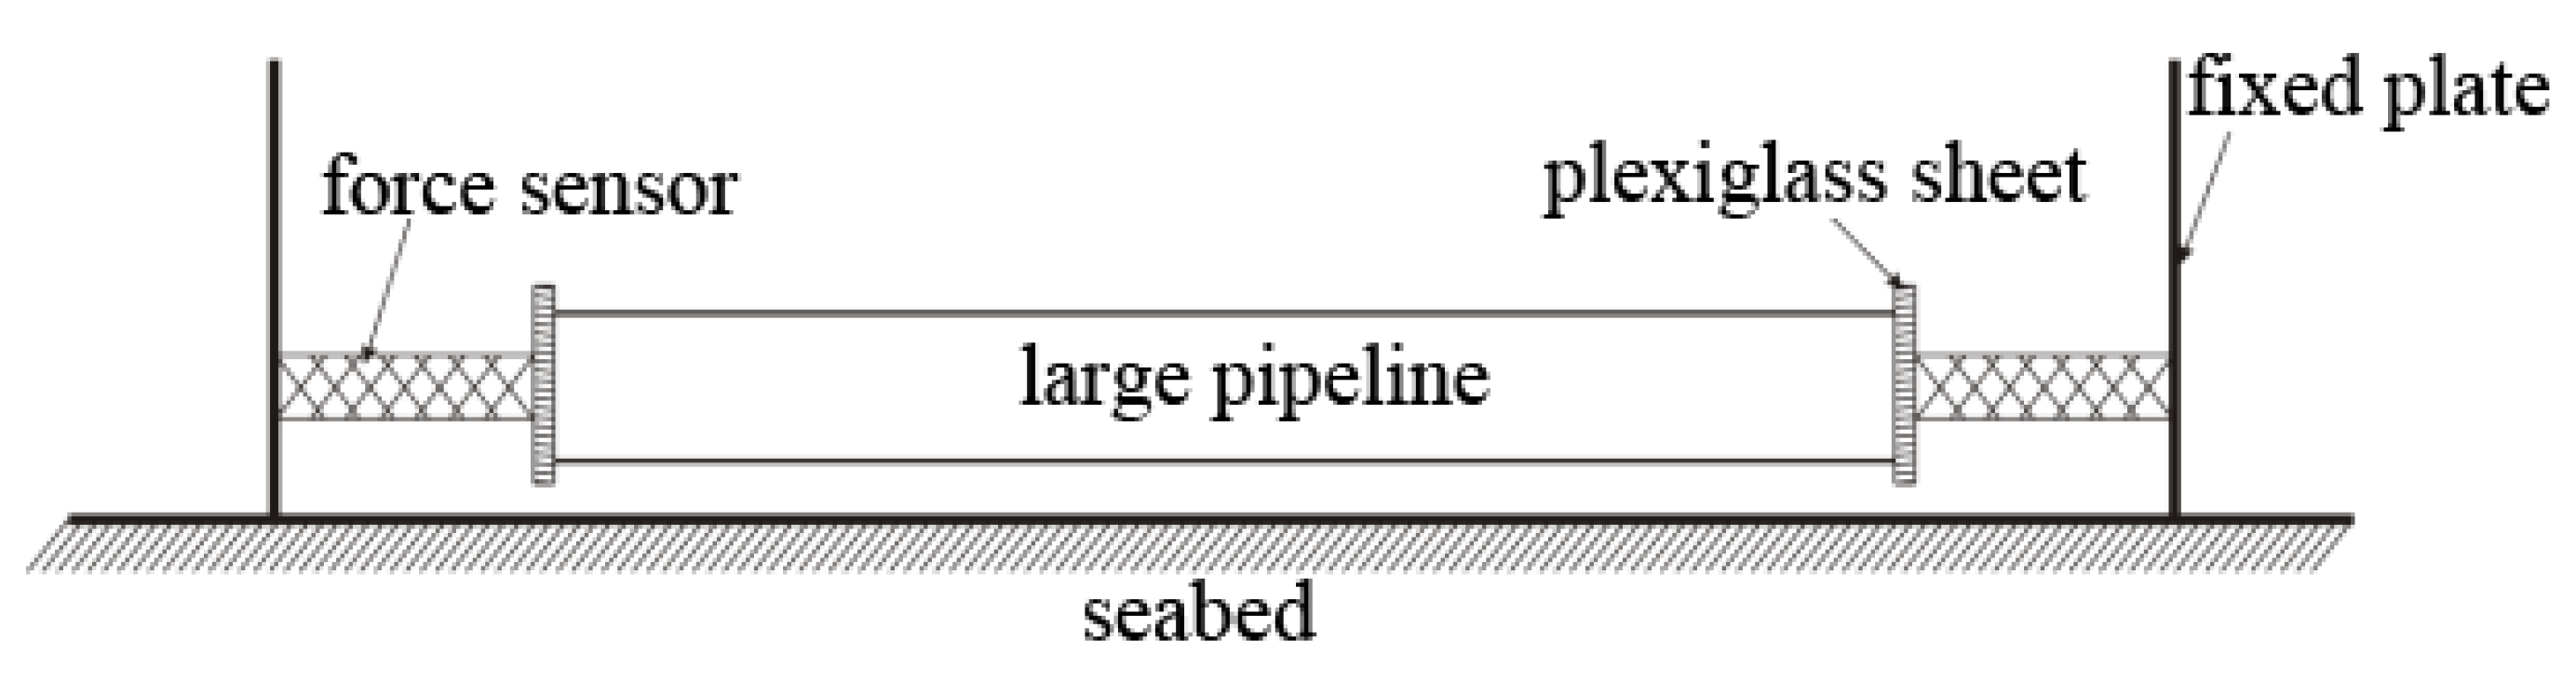
Case 1: The pipeline configuration is shown in Figure 5. In the experiment, the bottom of the tank was used to simulate the fixed seabed. Firstly, two rectangular plexiglass sheets of 3 mm thickness were attached to both ends of the large pipeline (D = 20 mm) to eliminate the effect of pipeline end diffraction. Then, they were connected to one end of the two underwater bidirectional force sensors, respectively. The other end of the sensor was connected to a vertical steel plate fixed at the bottom of the seabed, so as to ensure that the whole pipeline model was fixed.
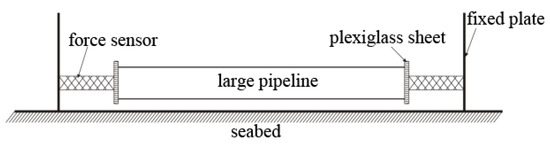
Figure 5.
Sketch of the pipeline configuration for measuring forces acting on the single large pipeline.
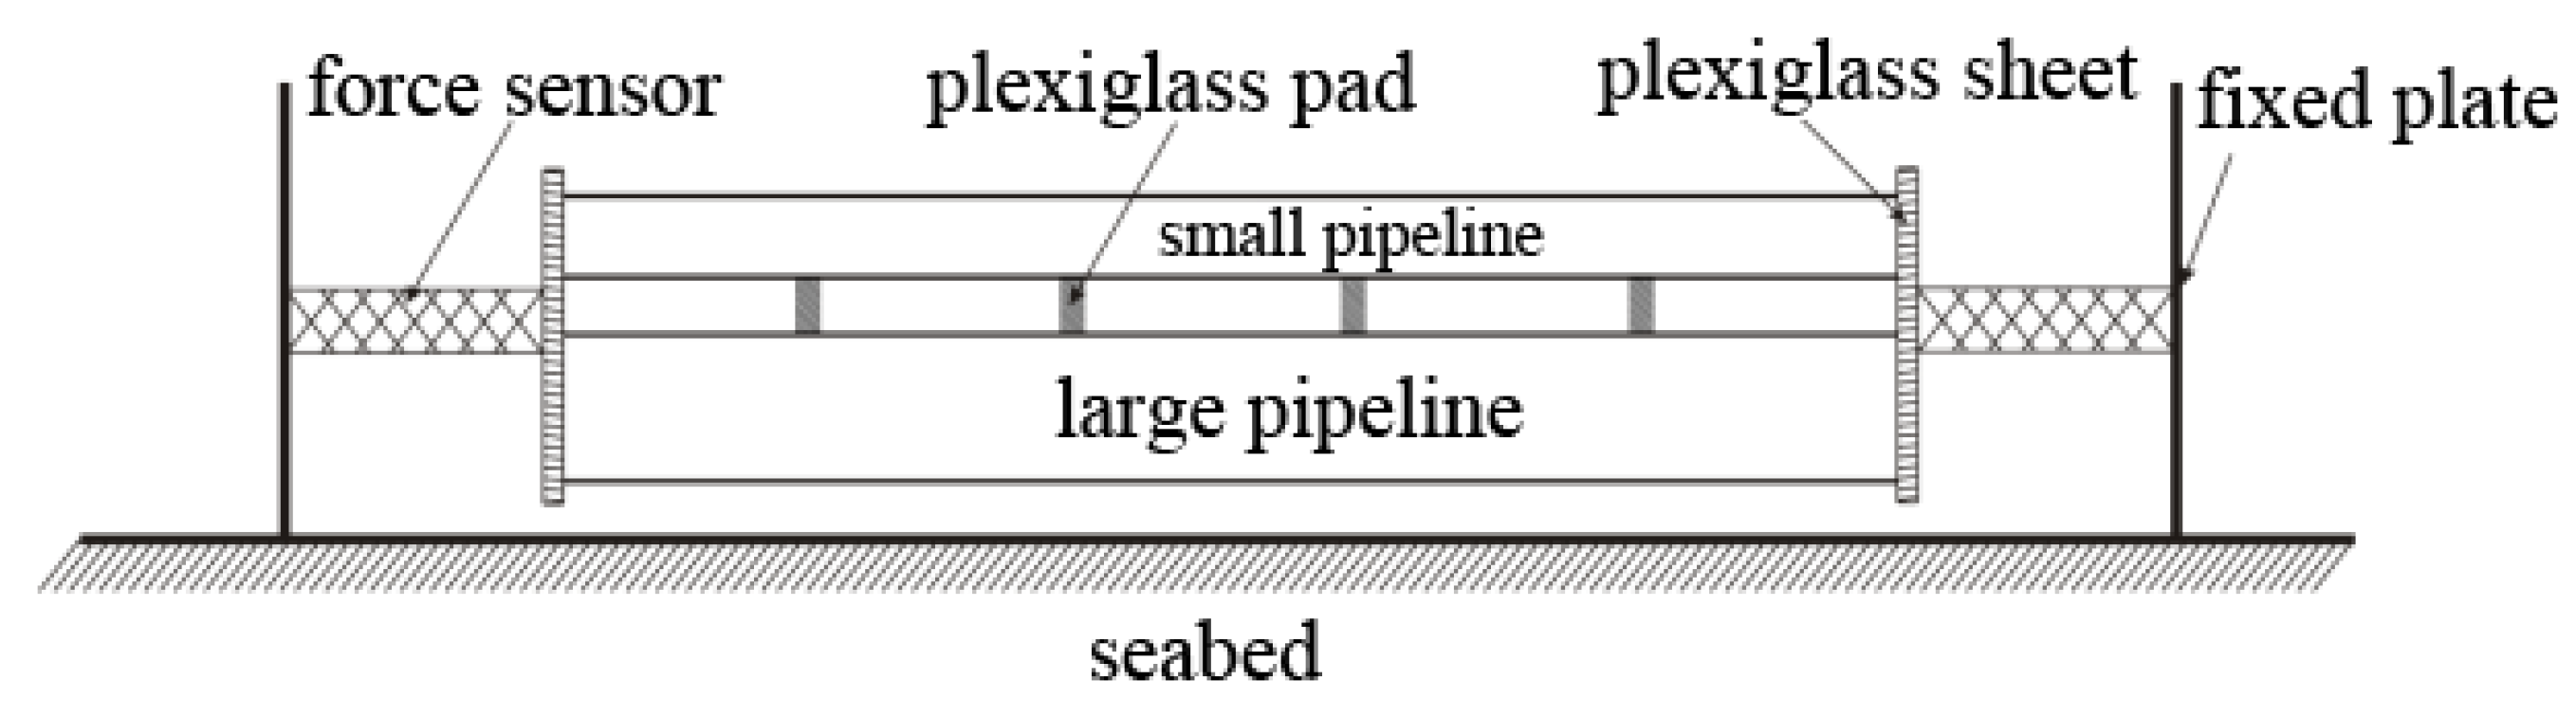
Case 2: The pipeline configuration is shown in Figure 6. A plexiglass pad between the small and the large pipeline was used to bundle them every 200 mm, it was given by the ties highlighted in gray in Figure 6, and it had little effect on blocking the flow between the two pipelines. A plexiglass sheet was connected at each end of the pipelines in order to connect with the force sensor, which was fixed on the vertical steel plate, thus forming an experimental device for measuring the forces acting on the piggyback pipeline system.
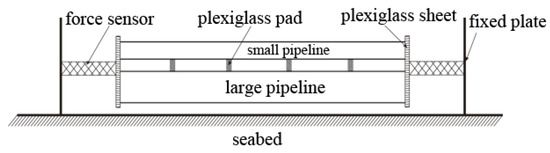
Figure 6.
Sketch of the pipeline configuration for measuring forces acting on the piggyback pipeline system.
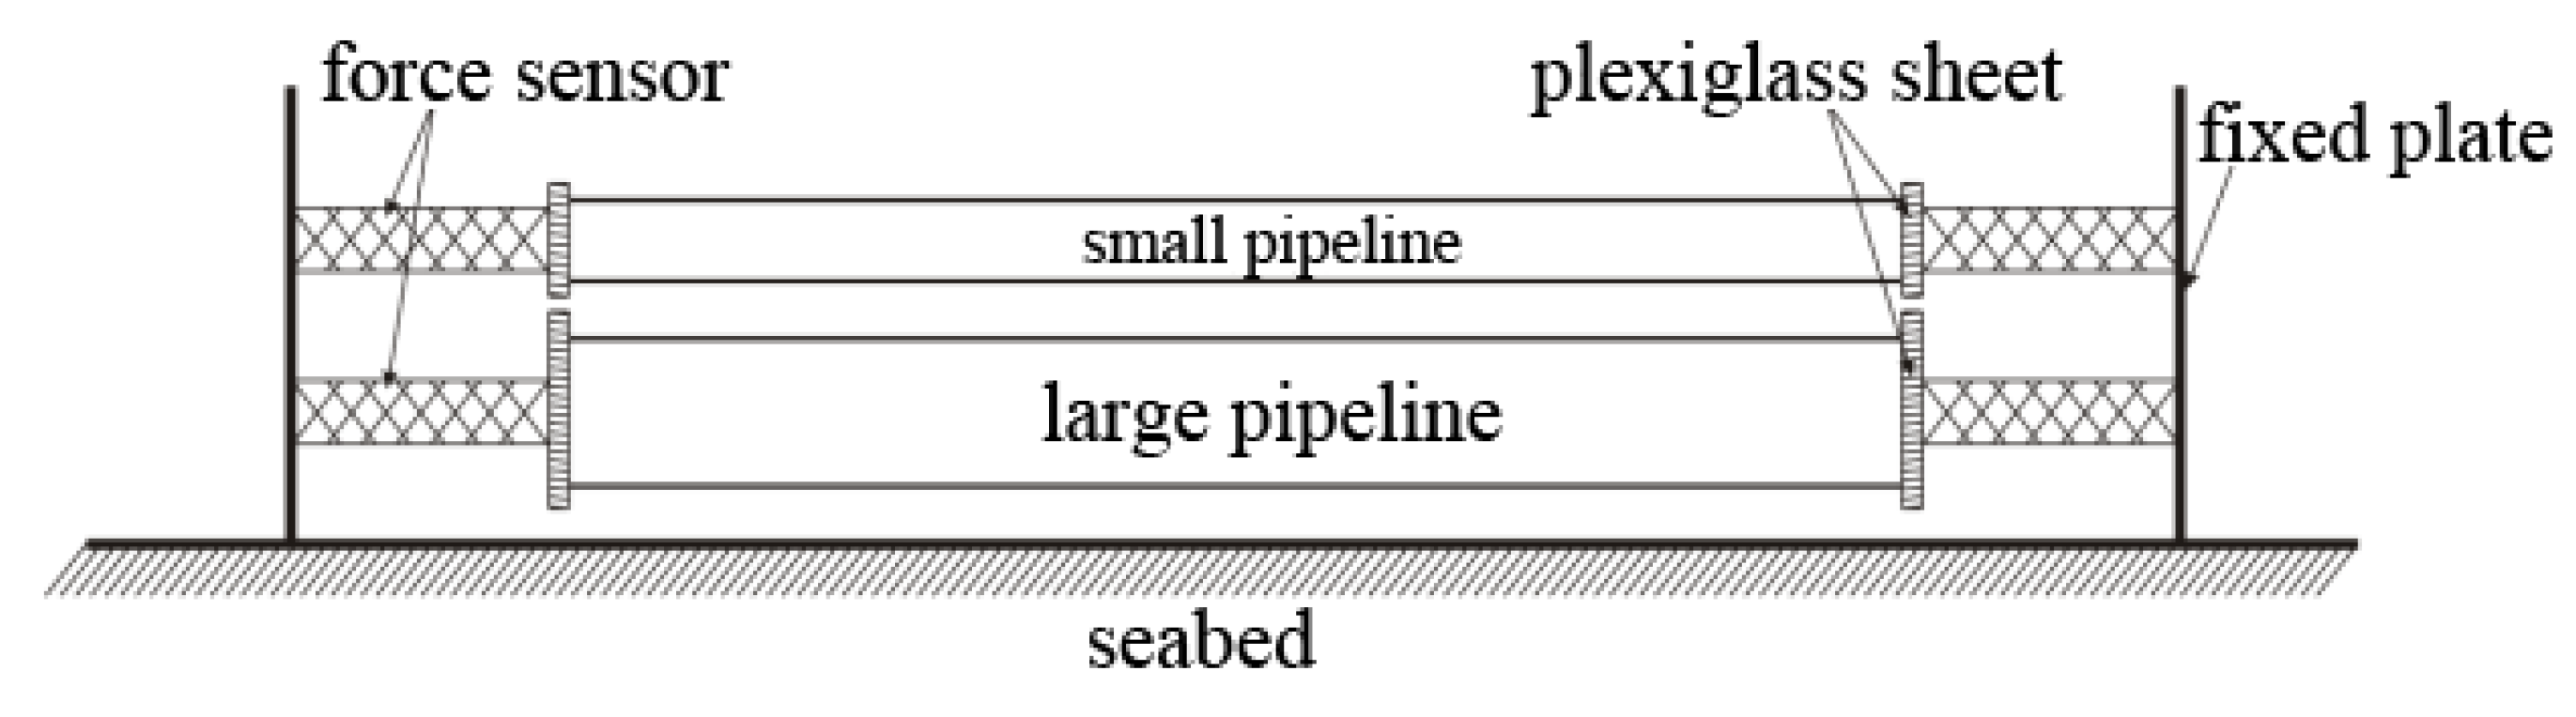
Case 3: The pipeline configuration is shown in Figure 7. Two 3 mm thick plexiglass sheets were connected at each end of the large pipeline. The small pipeline was arranged horizontally above the large pipeline, and there was a certain gap between the pipelines, and both ends were connected with two pieces of 3 mm thick plexiglass sheet. Four underwater bidirectional force sensors were used to measure the horizontal and lift forces acting on the large and small pipelines synchronously.
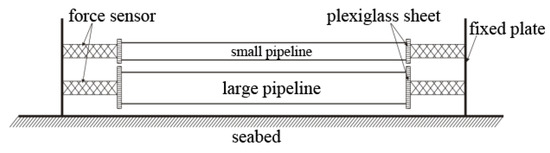
Figure 7.
Sketch of the pipeline configuration for measuring forces acting on large and small pipelines.
2.2. Experimental Wave and Current Parameters
The experimental water depth h was 0.3 m. During the experiment, regular waves and current or irregular waves and current were generated. Firstly, a steady flow was generated by a pump, and then the corresponding regular or irregular wave was generated by a wave-making machine. The experimental wave and current parameters are shown in Table 2, from which it can be seen that the experimental KC number ranges from 5.1 to 88.0 under the action of waves and current.
Table 2.
Experimental wave and current parameters for regular wave–current and irregular wave–current.
2.3. Data Processing Methods
2.3.1. Velocity and Acceleration of Water Paricles in Wave–Current Coexisting Field
The effect of wave–current coexistence field on structures is different from that of a pure wave field or pure current field. The combined effect of wave and current will affect their respective propagation characteristics, and the velocity distribution of the current and wave parameters will change. Li [16] has made a detailed analysis of the characteristics of wave–current coexistence field based on the principle of conservation of wave–current energy. Thus, the following Formulas (3) and (4) can be used to calculate the wave height and wavelength values in the wave–current coexistence field after being affected by the flow. Similarly, water flow is also affected by waves. Without considering the influence of the near wall, the flow velocity distribution changes from logarithmic distribution to uniform distribution in the pure water flow field. At this time, the velocity value at any depth of water is the surface velocity value of pure water flow multiplied by 0.875. As for the submarine piggyback pipeline studied in this paper, it is close to the seabed and its influence on the flow velocity near the wall cannot be ignored. Therefore, the measured flow velocity at the axial center of the large pipeline is taken as .
In the above Formulas (3) and (4), , , the subscript s represents the quantity related in pure waves, h is water depth, k is wave number, C is wave velocity, L is wavelength and H is wave height.
In conclusion, the wave–current coexistence field can be regarded as a linear superposition of the wave field influenced by the flow and the flow field influenced by the wave, and the corresponding velocity and acceleration of water particles can be expressed as follows:
where, , and are, respectively, the velocity of wave water particle, the velocity of water flow and the acceleration of wave water particle at the axial position of the large pipeline in the wave–current coexistence field. Among them, the velocity and acceleration of wave water particle in the wave–current coexistence field can be calculated using Stokes’ second-order wave theory, but L and H in the formulas are calculated from the Formulas (3) and (4) after being affected by water flow.
2.3.2. Hydrodynamic Coefficient Analysis Method
In the previous section, the calculation of the velocity and acceleration of water particles in the wave–current coexistence field has been introduced. Based on Morrison equation [17], the drag coefficient and inertia coefficient of the pipeline can be calculated by using the least square method. Let be the instantaneous measured value of horizontal force on the pipeline per unit length, and be the calculated value of horizontal force based on Morrison equation. The time history of the recorded force and the amount of motion of water particles is discretized with an appropriate time increment , then each point has:
where, ,, is the fluid density, D is the diameter of the large pipeline (for the small pipeline and piggyback pipeline system, d and the equivalent diameter are replaced, respectively), n is the number of recorded samples and n is the total sampling length.
According to the least square method, let the total error be:
From , and the Equation (8), it can be solved as follows:
where, , , , , , and take the velocity and acceleration of the fluid water particle at the axial position of the large pipeline.
In this paper, the peak value method [18] is adopted to analyze and calculate the lift coefficient , and its expression is as follows:
where, the superlabel ‘+’ indicates that the direction of lift force deviates from the seabed, the superlabel ‘−’ indicates that the direction of lift force points to the seabed, is the measured peak value of the lift force per unit length of the pipeline, is the maximum velocity of the fluid water particle at the axis of the large pipeline, D is the diameter of the large pipeline, the lift coefficients of the small pipeline and the piggyback pipeline system can be calculated by substituting d and DE into Equations (11) and (12), respectively.
3. Experimental Model Verification
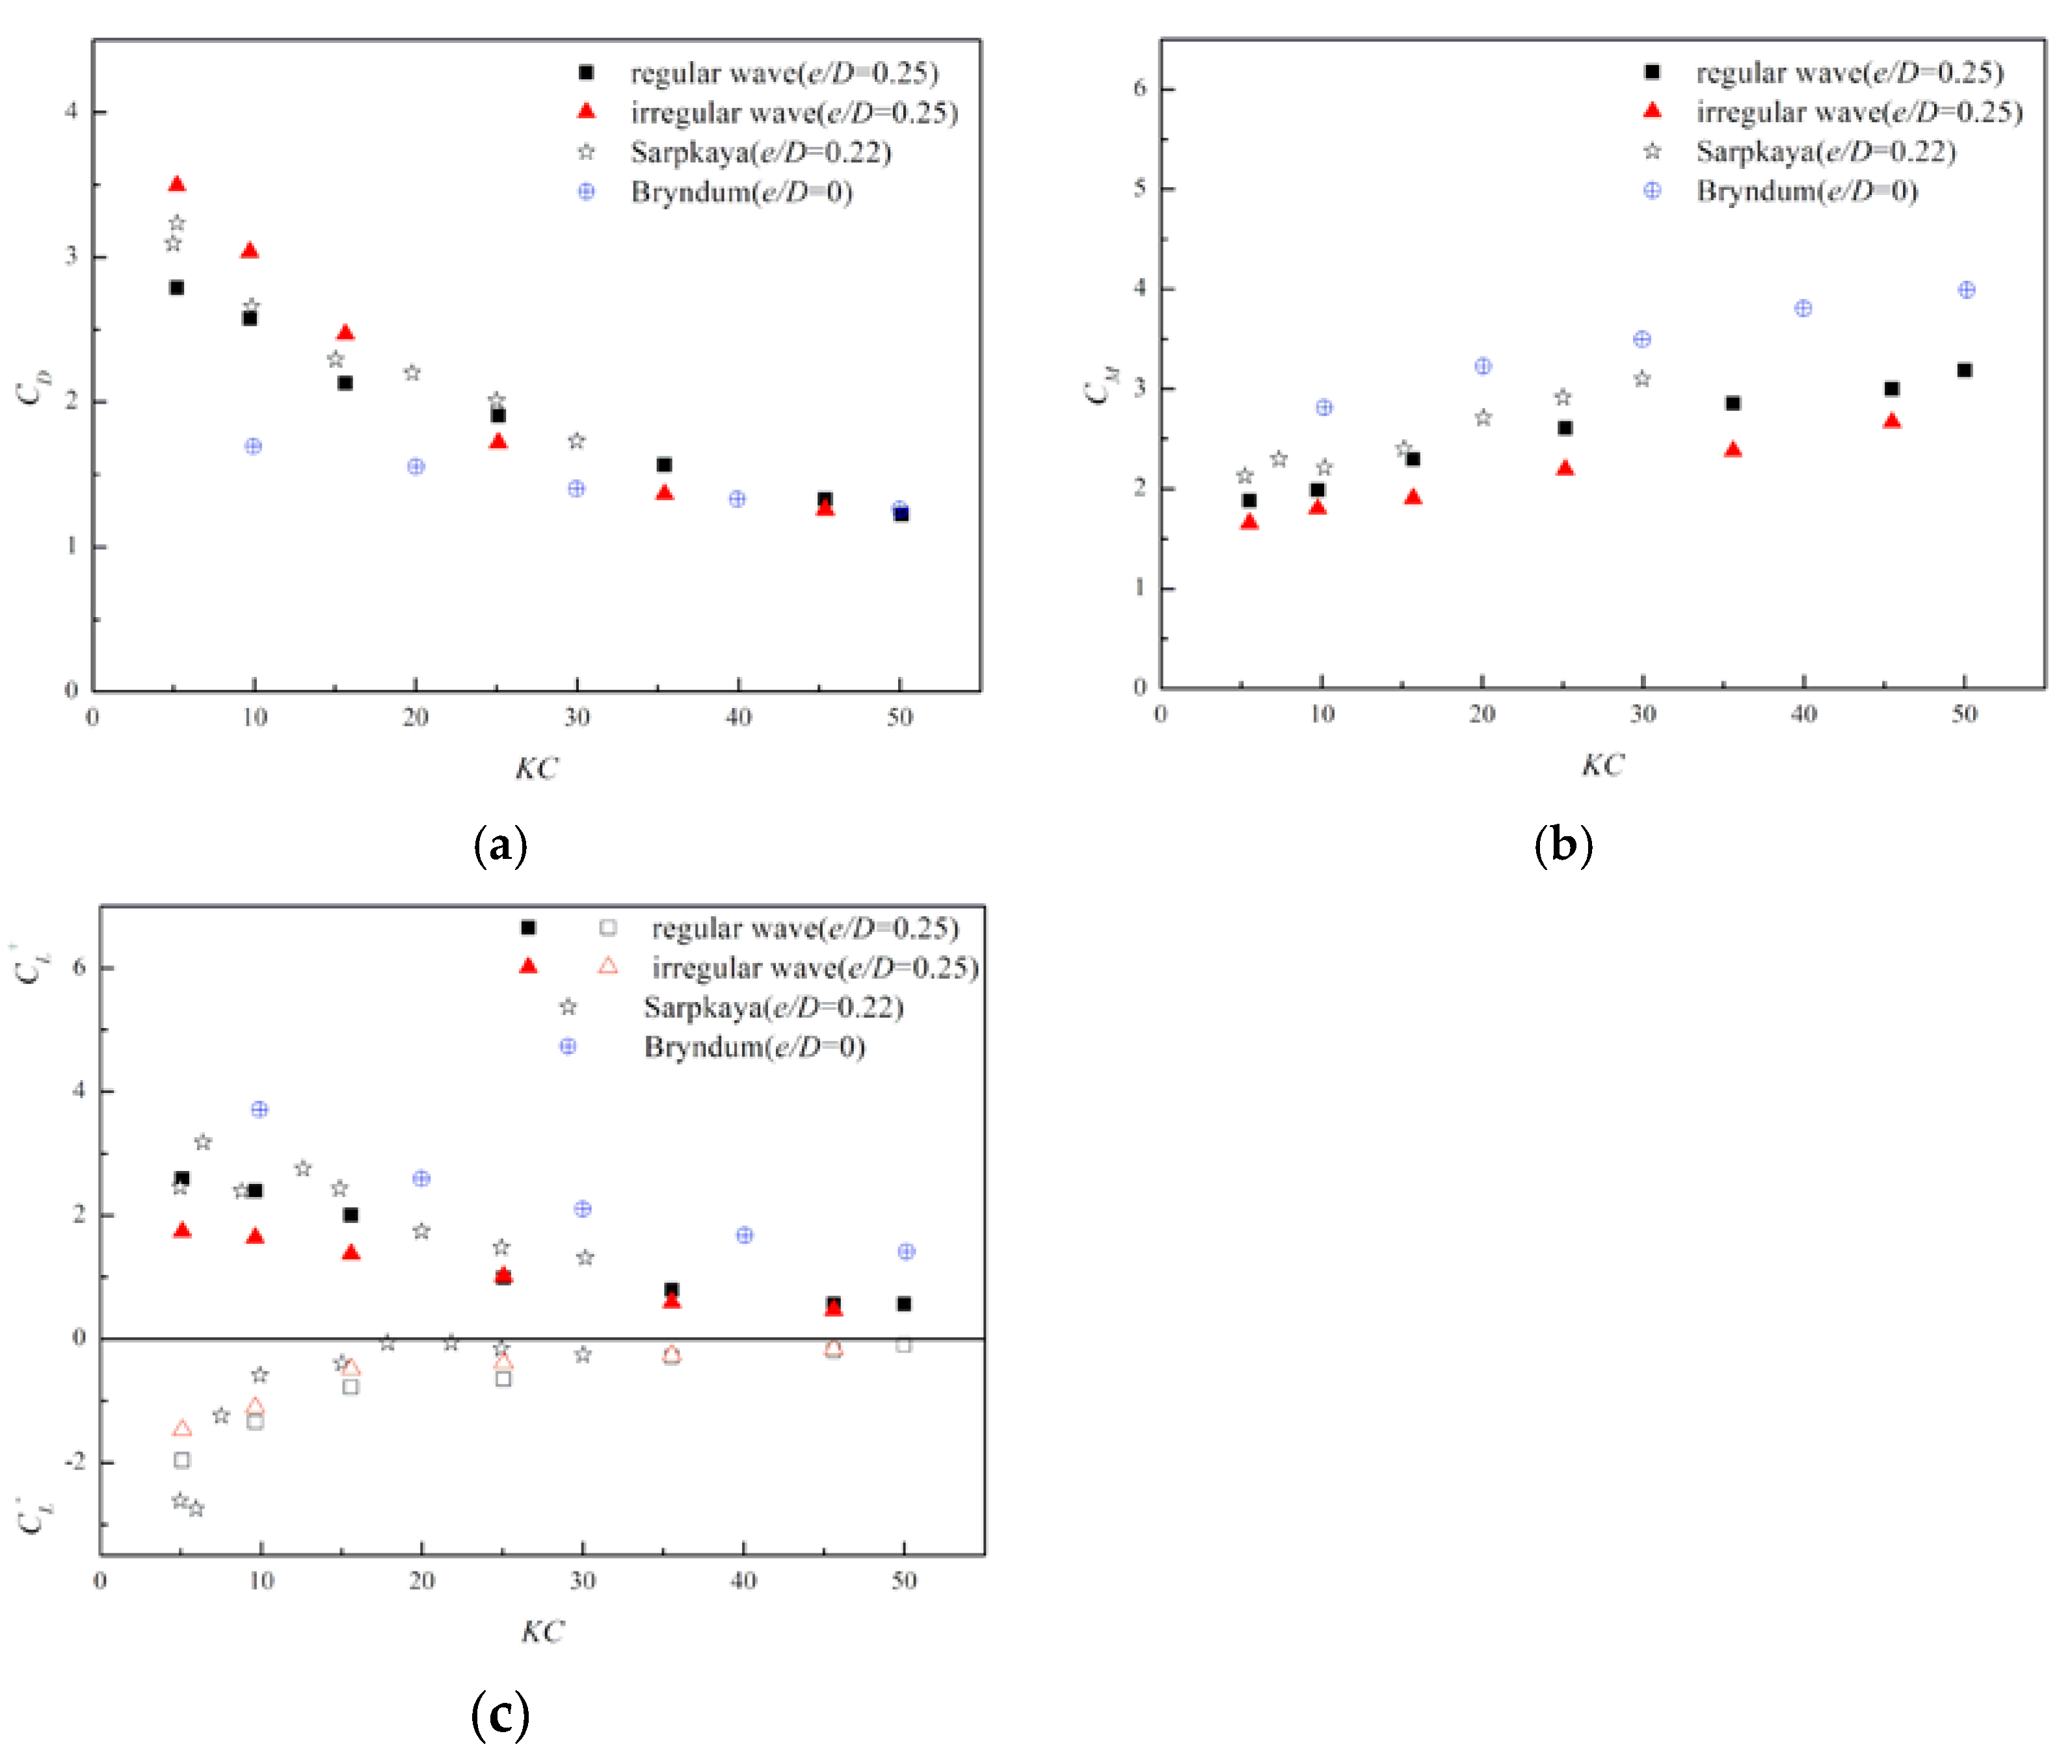
In order to verify the reliability of the experimental results, the effects of different wave parameters on the hydrodynamic coefficients of the submarine single pipeline under the action of regular and irregular waves were first investigated. Figure 8 shows the variation law of the hydrodynamic coefficients , and of the single large pipeline (D = 20 mm) with the KC number (KC = 5.2–50.0) under the action of regular and irregular waves when the gap ratio of the pipeline and seabed e/D is 0.25, which was compared with the previous experimental results. Figure 8 shows that the variation trend of the hydrodynamic coefficients is roughly the same with the KC number. With the increase in the KC number, and (, ) decrease, but increases.
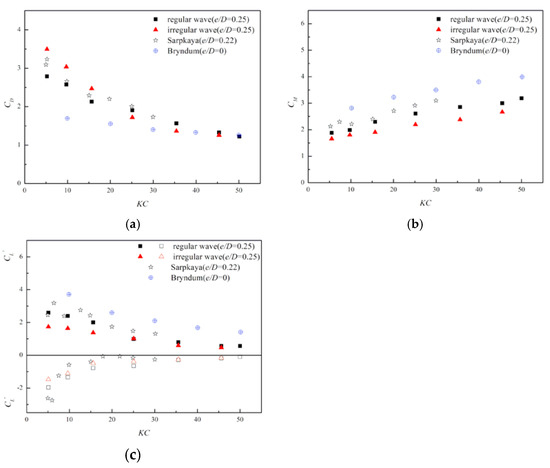
Figure 8.
Hydrodynamic coefficients of the submarine single pipeline. (a) Variation of the drag coefficient with KC, (b) Variation of the inertia coefficient with KC, (c) Variation of the lift coefficient with KC.
Sarpkaya et al. [19] carried out a sinusoidal oscillation flow experiment through a u-shaped tank, and obtained the values of , and of a single pipeline under the condition that e/D = 0.22, KC = 1–34 and Re = . Bryndum et al. [20] used trailer technology to simulate regular waves and obtained hydrodynamic coefficients of the near-wall single pipeline under the conditions of e/D = 0, KC = 3–160 and Re = . The single pipeline results obtained in this experiment were compared with those of Sarpkaya et al. and Bryndum et al. As can be seen from Figure 8, the variation trend of hydrodynamic coefficients with the KC number obtained in this paper is roughly consistent with that of Sarpkaya and Bryndum. However, in terms of magnitude, the experimental results in this paper are closer to those of Sarpkaya, while there is a certain error with those of Bryndum. This is related to the difference in the degree of influence near the wall between the two. The gap ratio e/D of Sarpkaya is 0.22, which is closer to the gap ratio e/D = 0.25 in this paper than that of Bryndum. The above analysis shows that the experimental model built in this paper is reasonable, and verifies the reliability of the experimental setup and data processing method in this paper.
4. Experimental Results and Analysis
The hydrodynamic coefficients of the large, small pipeline and piggyback pipeline system under the action of regular (irregular) wave and current are investigated experimentally. The effects of different wave and current parameters (KC number), the velocity ratio (), the gap ratio between the large pipeline and the seabed e/D, the spacing ratio between the two pipelines G/D and the diameter ratio d/D on the hydrodynamic coefficients of the large, small pipeline and piggyback pipeline system are emphatically discussed.
4.1. Effect of the KC Number
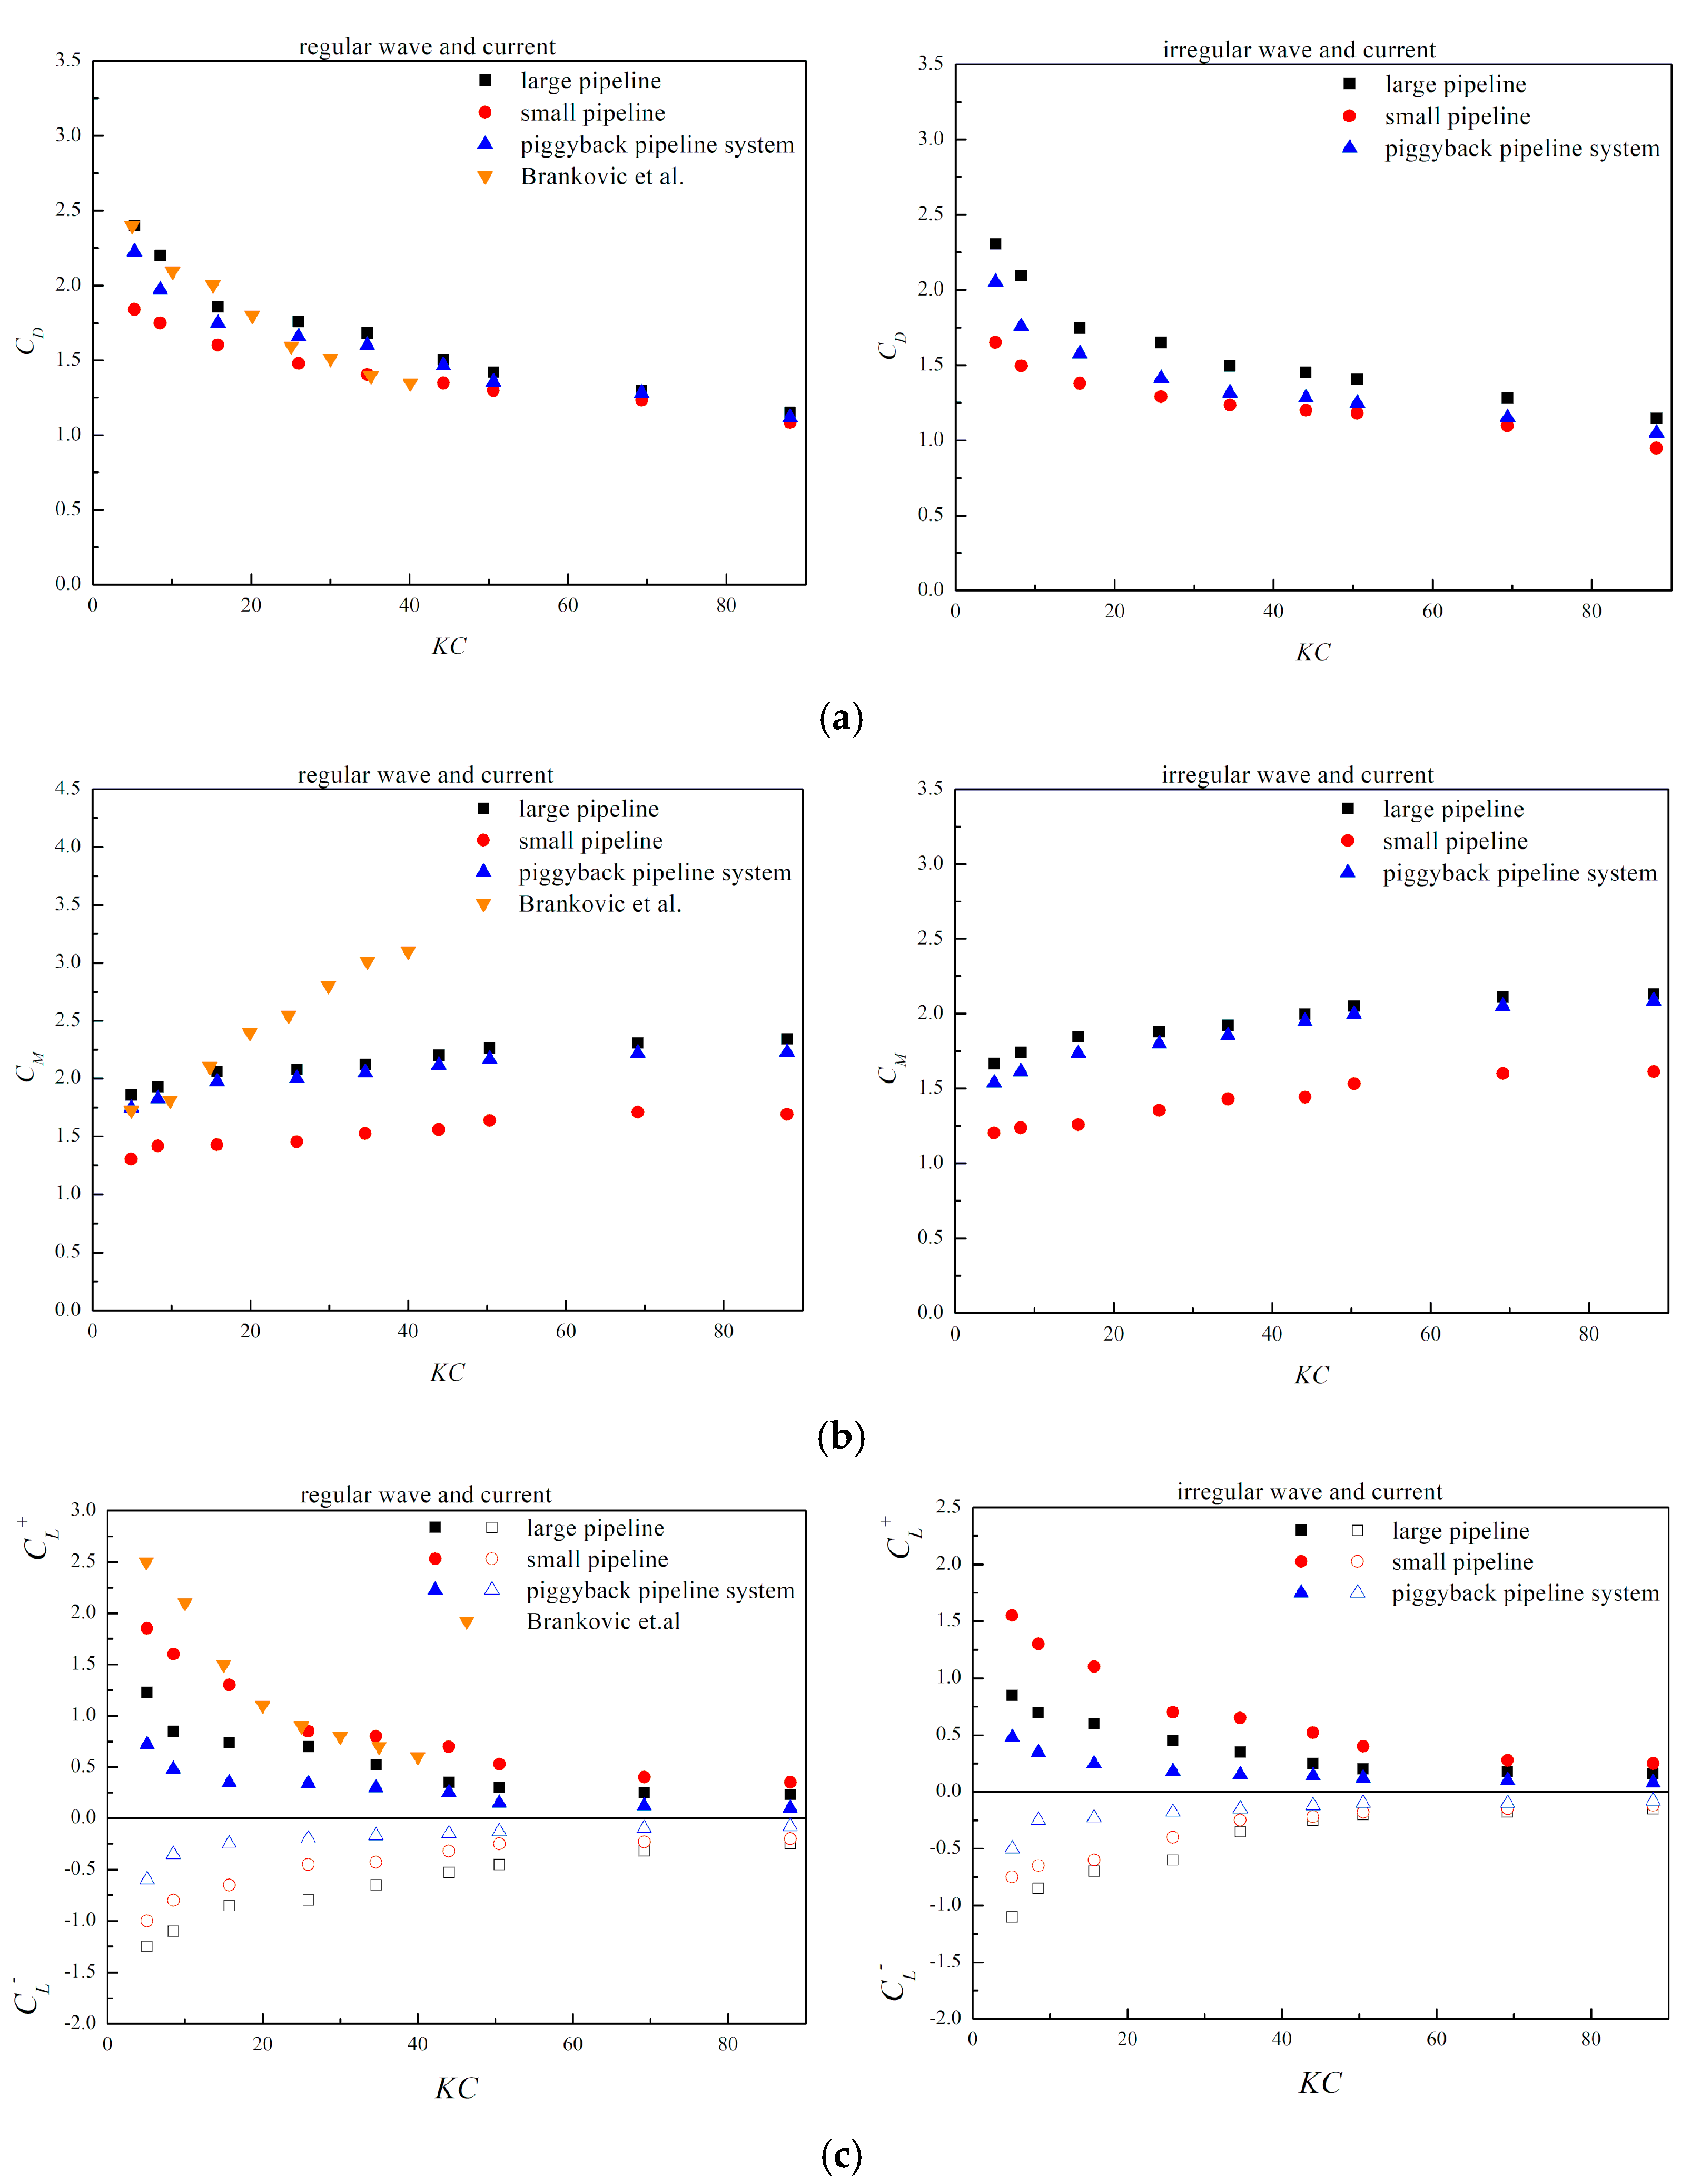
Figure 9 shows the influence of the KC number (5.1~88.0) on the hydrodynamic coefficients of the large, small pipeline and piggyback pipeline system when e/D = G/D = 0.25, and compares it with the experimental results of Branković et al. [14]. The experiment of Branković et al. obtained the variation rule of the hydrodynamic coefficients of the piggyback pipeline system with the KC number when G = 15 mm, e = 0 and KC = 5–40 under the action of regular wave and current. The comparison shows that the variation rules of hydrodynamic coefficients are roughly the same, but the former is slightly smaller than the latter in terms of magnitude, mainly because of the difference of hydrodynamic loads caused by different piggyback configurations of the two, which further verifies the reliability of the experimental results in this paper.
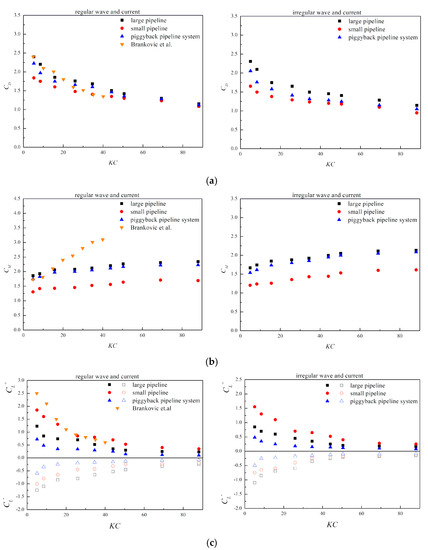
Figure 9.
Effect of the KC number on hydrodynamic coefficients of the submarine piggyback pipeline under the wave–current action. (a) Variation of the drag coefficient with KC, (b) Variation of the inertia coefficient with KC, (c) Variation of the lift coefficient with KC.
As can be seen from Figure 9, the hydrodynamic coefficients of the large, small pipeline and piggyback pipeline system vary with the KC number according to the same rule, no matter the action of regular wave and current or irregular wave and current, but there are differences in magnitude.
Figure 9a shows that the drag coefficient decreases gradually with the increase in KC number. In terms of magnitude, of the small pipeline is smaller than of the large one and the piggyback pipeline system, and the difference decreases with the increase in KC number. When KC > 50, of the large, small pipeline and piggyback pipeline system are all close to each other.
Figure 9b shows that the inertia coefficient increases slowly with the increase in the KC number. In terms of magnitude, of the piggyback pipeline system is close to of the large pipeline, and of the small pipeline is significantly smaller than that of the large one, with its value about 70% of that of the large pipeline.
Figure 9c shows that the lift coefficients and decrease with the increase in KC number, and the magnitude difference between the large, small pipeline and piggyback pipeline system gradually decreases. In addition, the results of the action of regular waves and current are compared with those of irregular waves and current. It is found that they have the same variation trend, but the former is slightly larger than the latter in terms of magnitude.
4.2. Effect of the Velocity Ratio
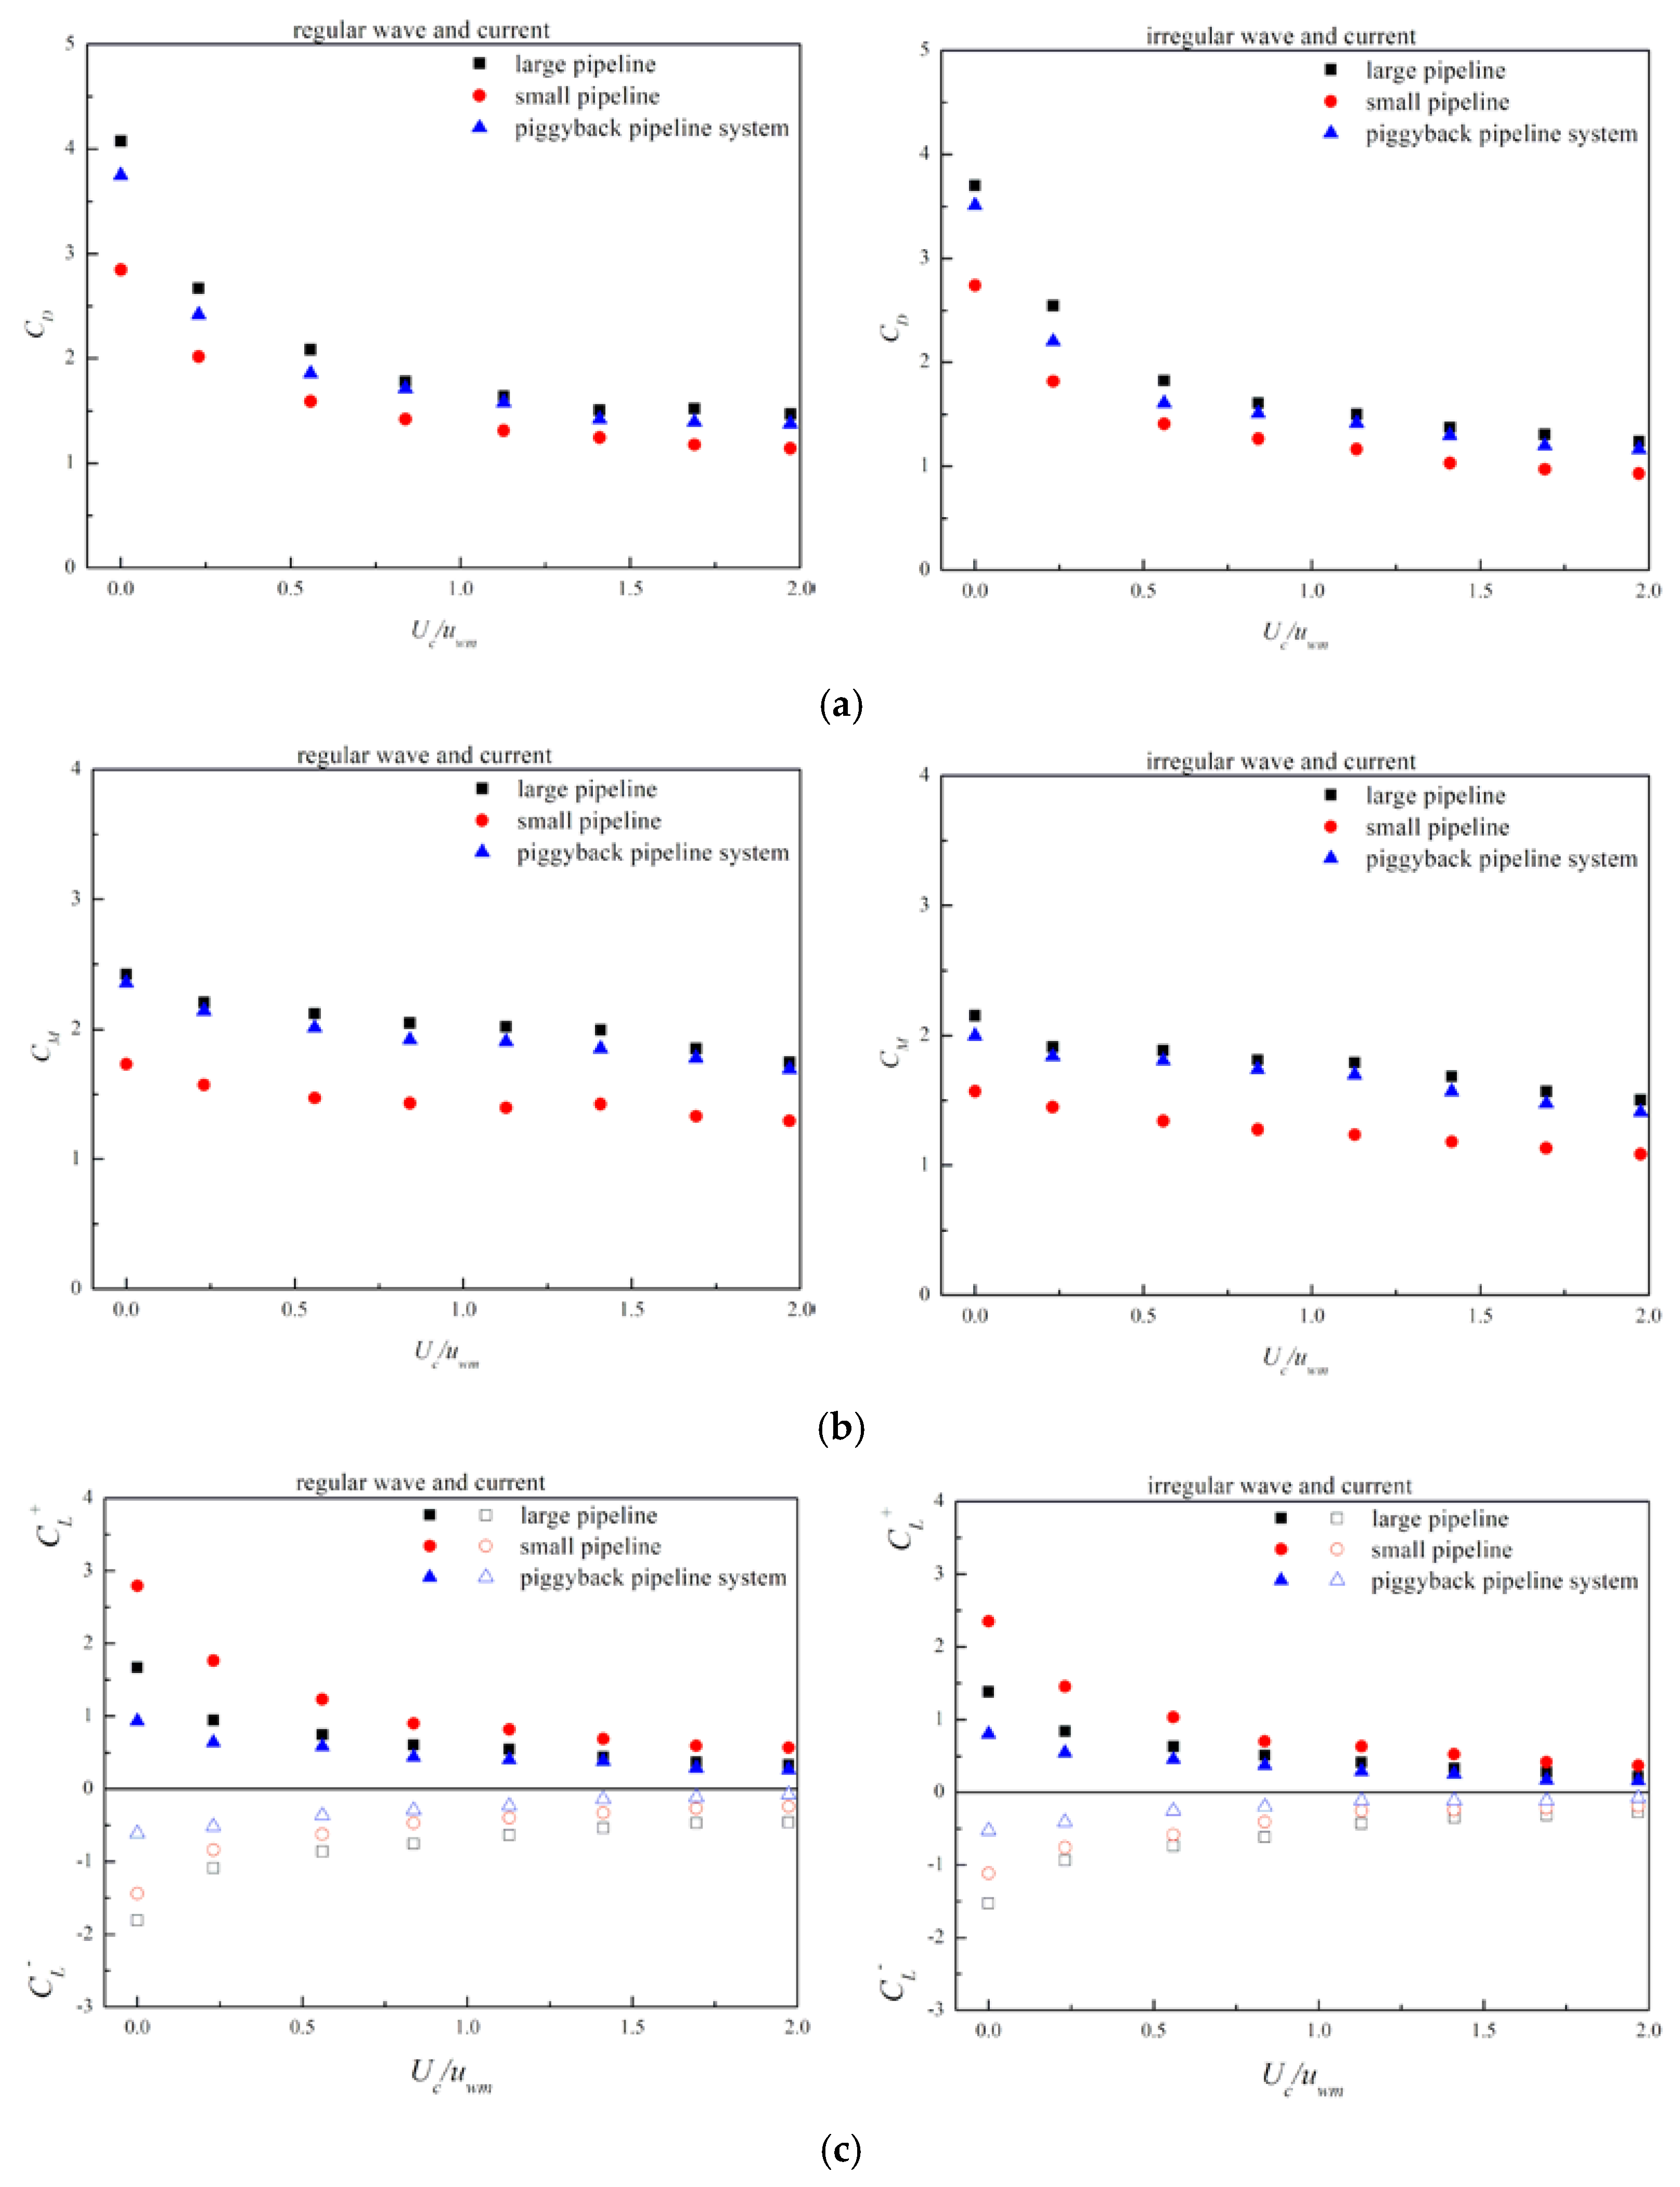
In order to study the effect of the change in steady flow velocity on the hydrodynamic coefficients of the submarine piggyback pipeline in the wave–current coexistence field, different velocity ratios in the regular wave and current and in the irregular wave and current are investigated, respectively, where is the steady flow velocity and is the maximum horizontal velocity of pure wave water particle. When the influence of the velocity ratio is considered, the pure wave condition remains unchanged, that is, the remains unchanged, and the velocity of steady flow varies with 0.05 m/s intervals in the range of 0~0.45 m/s.
Figure 10 shows the influence of the velocity ratio (0~2.0) on the hydrodynamic coefficients of the submarine piggyback pipeline when the gap ratio e/D = 0.25, the spacing ratio G/D = 0.25, KC = 9.8 (where KC is the value defined by pure wave). As can be seen from Figure 10, relative to the pure wave field ( = 0, i.e., = 0), the existence of steady flow (i.e., > 0) will lead to a decrease in the hydrodynamic coefficients, that is, under the same wave condition, when a certain stable flow is added, the hydrodynamic coefficients of the piggyback pipeline under the combined action of waves and current are smaller than that under the action of pure wave. With increasing, the hydrodynamic coefficients of the large, small pipeline and piggyback pipeline system have the same variation trend, , , and all decrease, and the variation amplitudes of them gradually tend to flatten out.
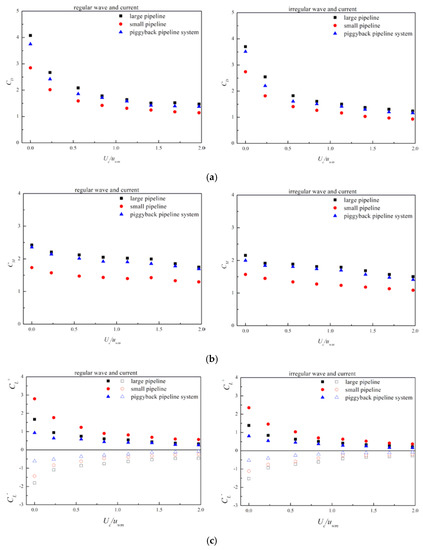
Figure 10.
Effect of the velocity ratio on hydrodynamic coefficients of the submarine piggyback pipeline under the wave–current action. (a) Variation of the drag coefficient with Uc/uwm, (b) Variation of the inertia coefficient with Uc/uwm, (c) Variation of the lift coefficient with Uc/uwm.
4.3. Effect of the Gap Ratio
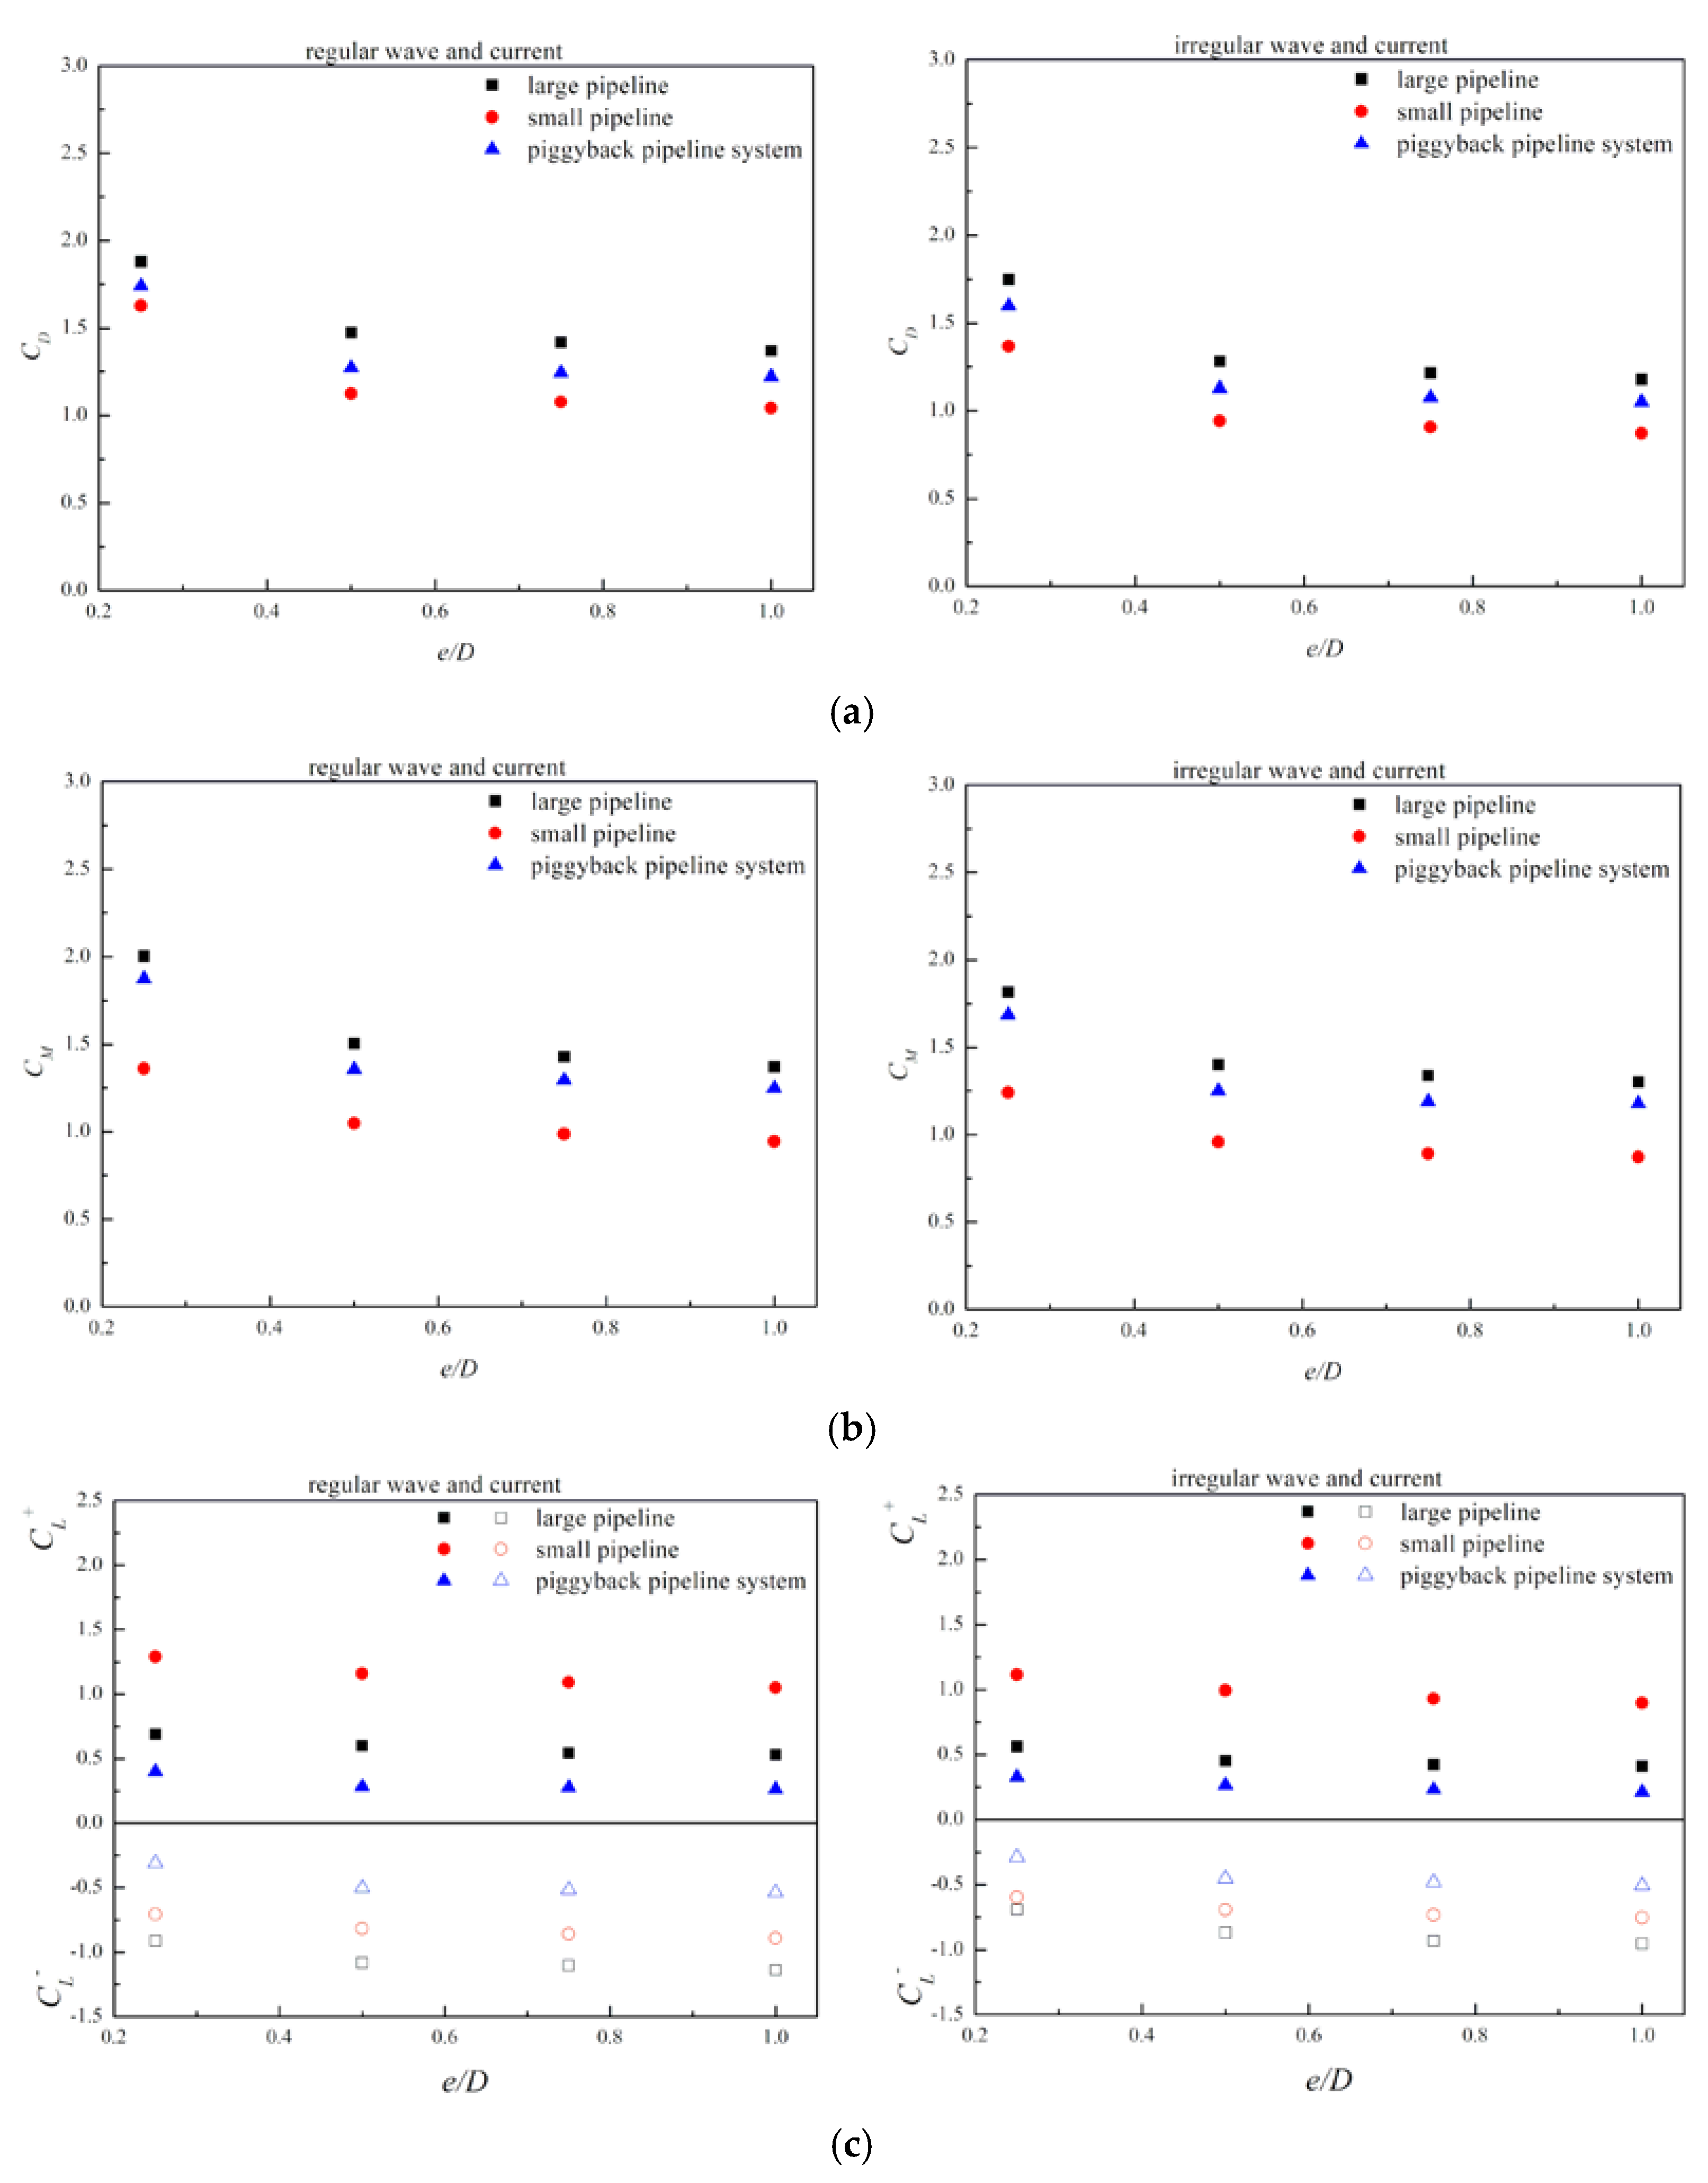
The influence of the gap ratio between the large pipeline and seabed e/D on hydrodynamic coefficients of the submarine piggyback pipeline under the action of waves and current is investigated. The gap e between the large pipeline and seabed is 5, 10, 15 and 20 mm, respectively, and the spacing ratio between the large pipeline and the small one G/D is fixed at 0.25. Figure 11 shows the influence of the gap ratio (e/D = 0.25–1.0) on the hydrodynamic coefficients of the submarine piggyback pipeline in the case of KC = 15.7.
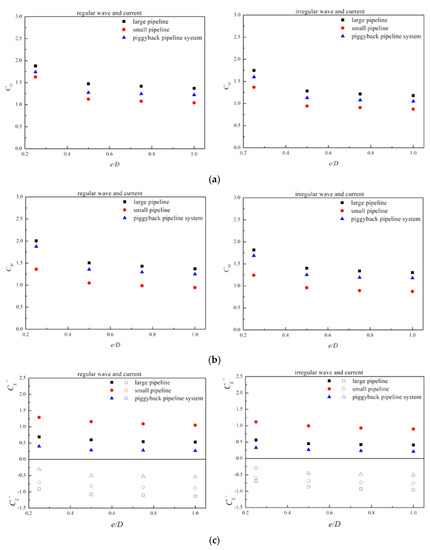
Figure 11.
Effect of the gap ratio on hydrodynamic coefficients of the submarine piggyback pipeline under the wave–current action. (a) Variation of the drag coefficient with e/D, (b) Variation of the inertia coefficient with e/D, (c) Variation of the lift coefficient with e/D.
As can be seen from the figure, with the increase in e/D, the hydrodynamic coefficients of the large, small pipeline and the piggyback pipeline system have the same trend of change: , and all decrease, but increases. When e/D > 0.5, the hydrodynamic coefficients tend to be stable with the increase in e/D, which also means that the influence of the seabed on the near wall of the piggyback pipeline gradually weakens or even disappears.
4.4. Effect of the Spacing Ratio
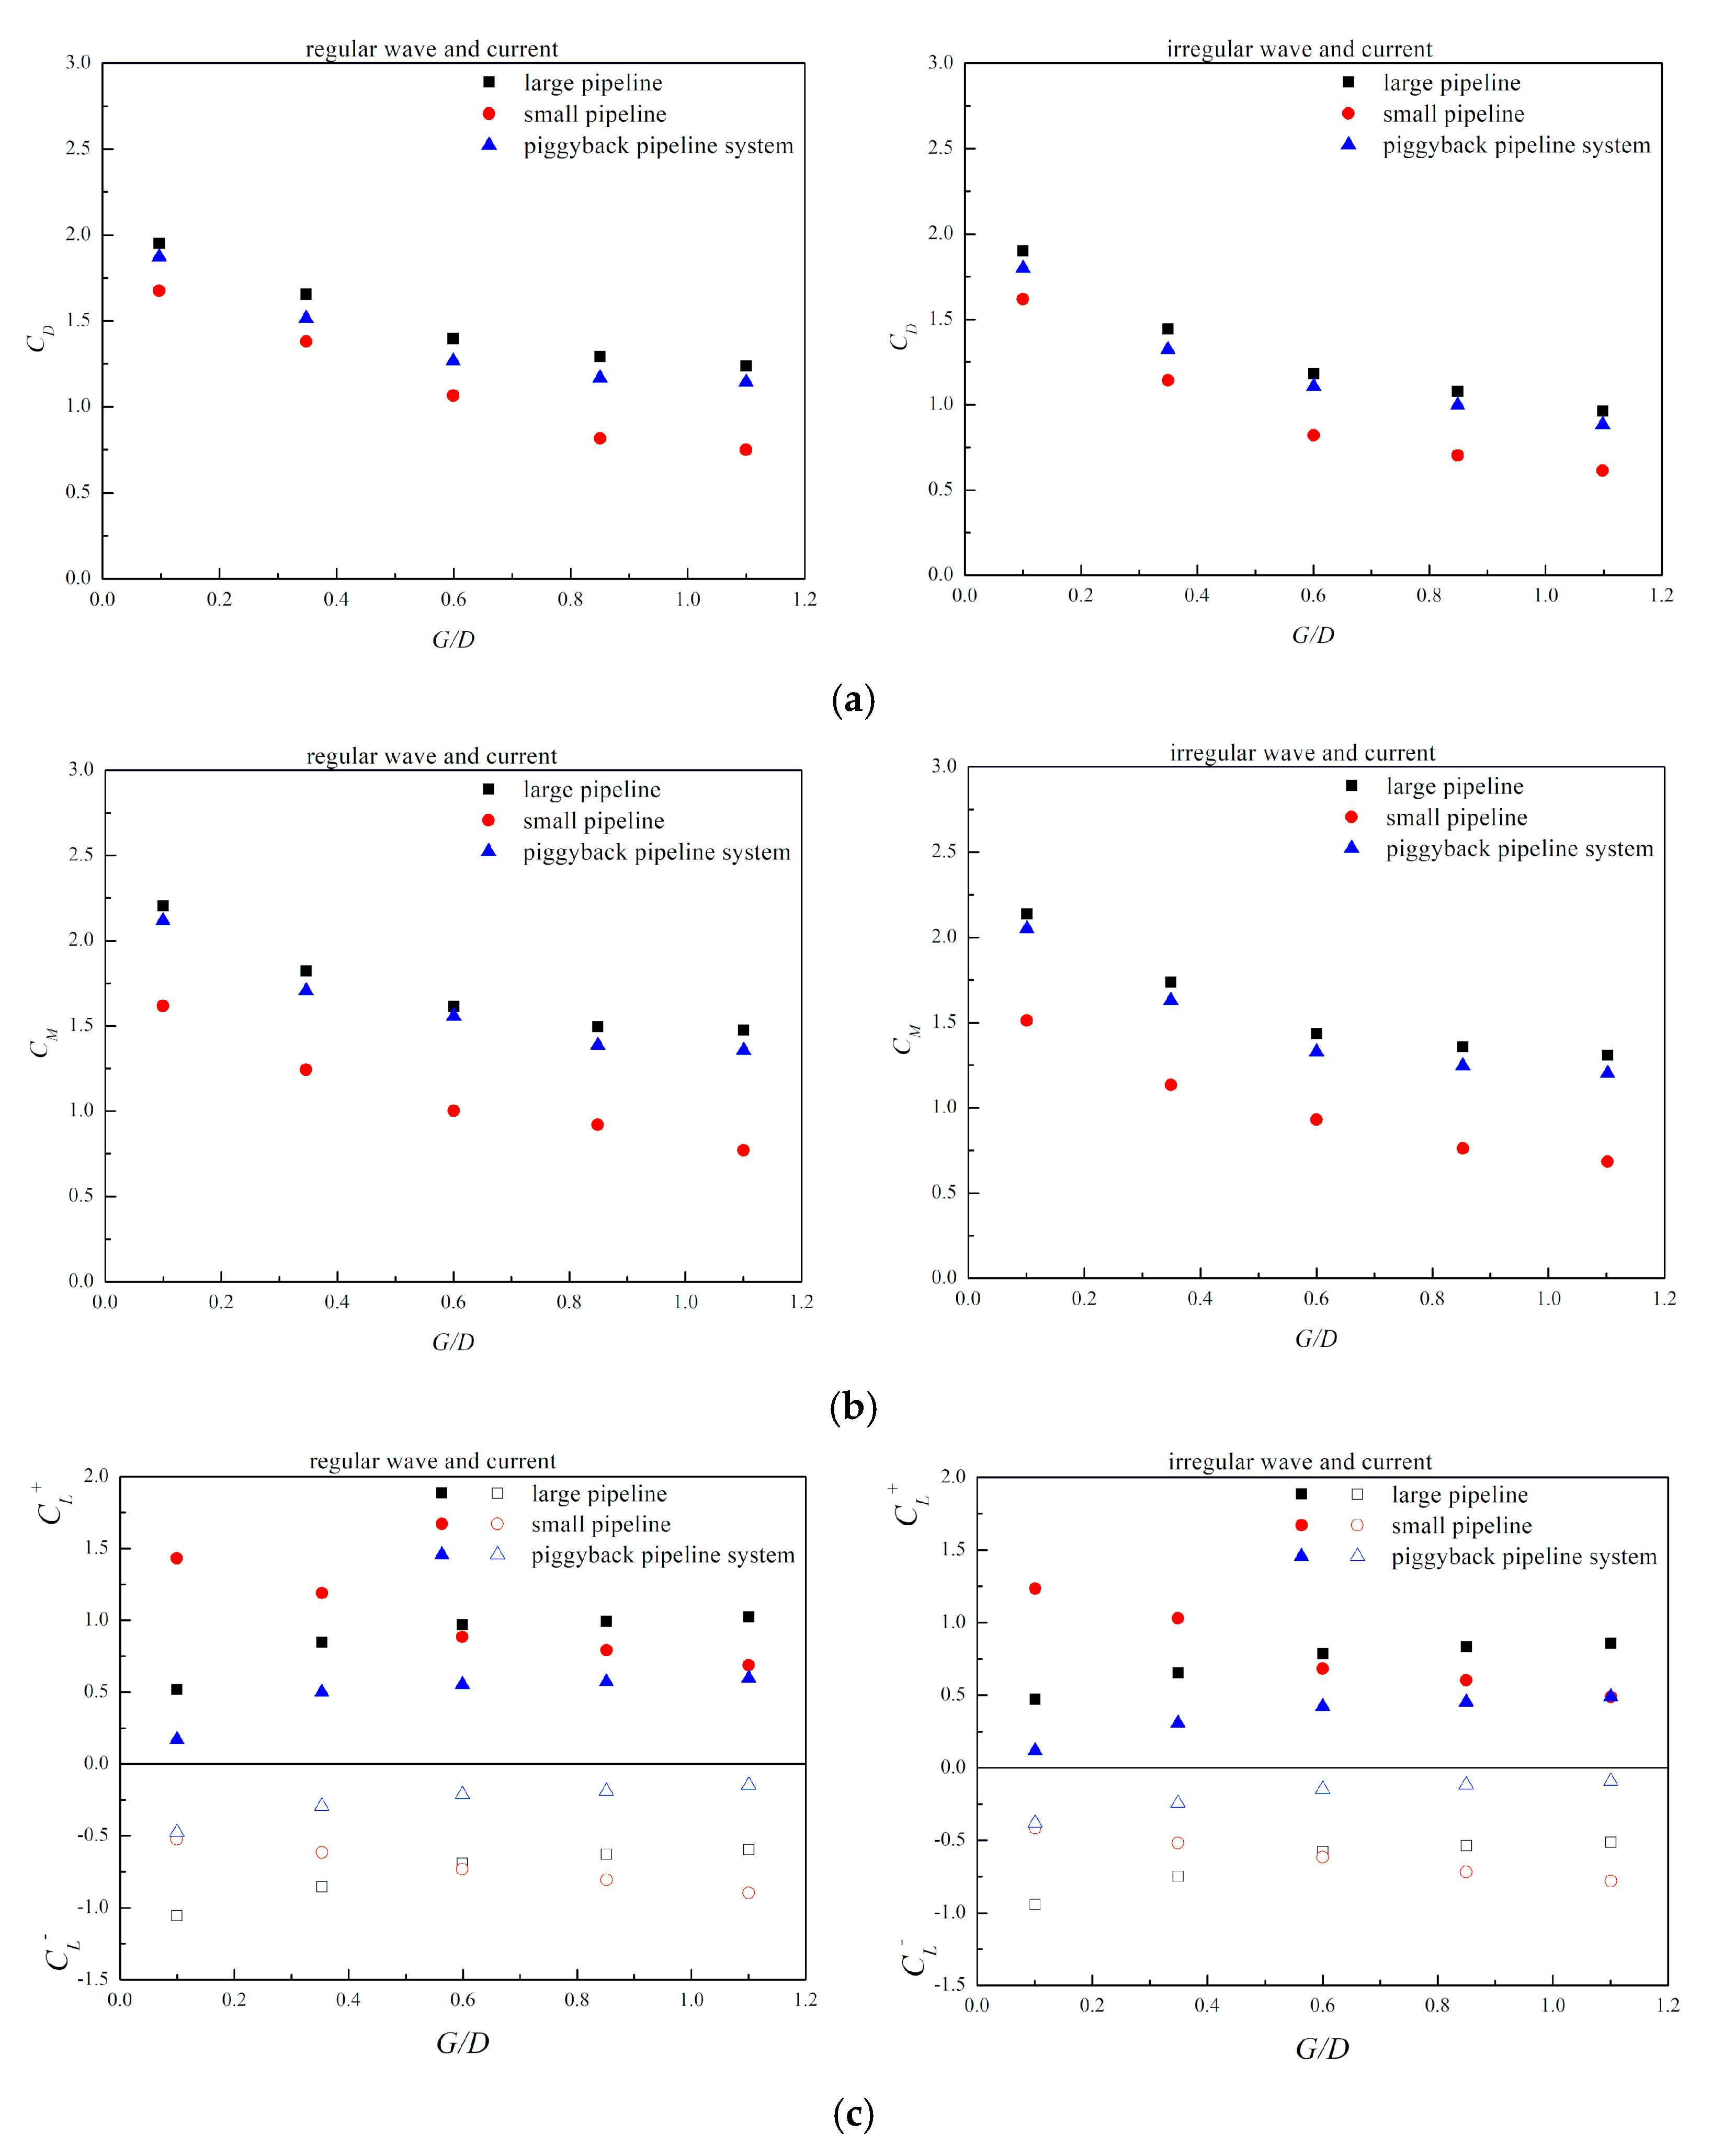
The influence of the spacing ratio between the large pipeline and the small one G/D on the hydrodynamic coefficients of the submarine piggyback pipeline under the action of waves and current is studied when the gap ratio e/D remains unchanged at 0.25. The spacing between the two pipelines varies with 5 mm interval in the range of 2–22 mm. Figure 12 shows the influence of the spacing ratio (G/D = 0.1~1.1) on the hydrodynamic coefficients of the piggyback pipeline in the case of KC = 15.7.
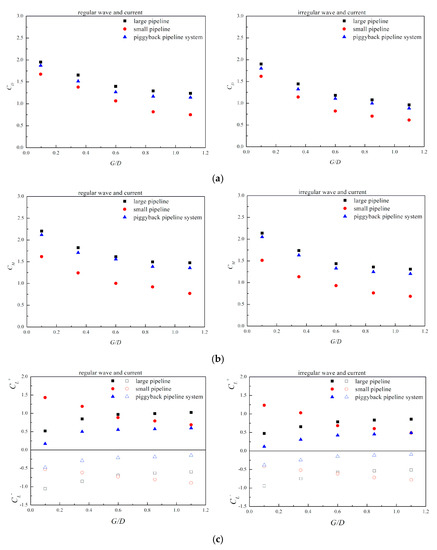
Figure 12.
Effect of the spacing ratio on hydrodynamic coefficients of the submarine piggyback pipeline under the wave–current action. (a) Variation of the drag coefficient with G/D, (b) Variation of the inertia coefficient with G/D, (c) Variation of the lift coefficient with G/D.
As can be seen from Figure 12, the hydrodynamic coefficients of the large, small pipeline and piggyback pipeline system vary with G/D in roughly the same way. Figure 12a,b indicate that and decrease with the increase in G/D, and and of the piggyback pipeline system are close to those of the large pipeline, while and of the small pipeline are smaller than those of the large one. When G/D = 0.1, and of the small pipeline are about 20 and 30% smaller than those of the large one, respectively, and the differences gradually increase with the increase in G/D. When G/D > 0.6, the influence of G/D on the large pipeline is gradually weakened, and the hydrodynamic coefficients of the large pipeline are gradually approaching the results of the single pipeline under the coexistence of wave and current.
Figure 12c shows that the lift coefficients of the large and small pipeline have an opposite trend with G/D. With the increase in G/D, of the large pipeline increases, while of the small one decreases, of the large pipeline decreases, while that of the small one increases. The lift coefficient of the piggyback pipeline system varies with G/D in the same way as that of the large pipeline, but is smaller than that of the large and small pipeline in terms of magnitude, which is related to the mutually repulsive lift between two pipelines under the coexistence of wave and current.
4.5. Effect of the Diameter Ratio
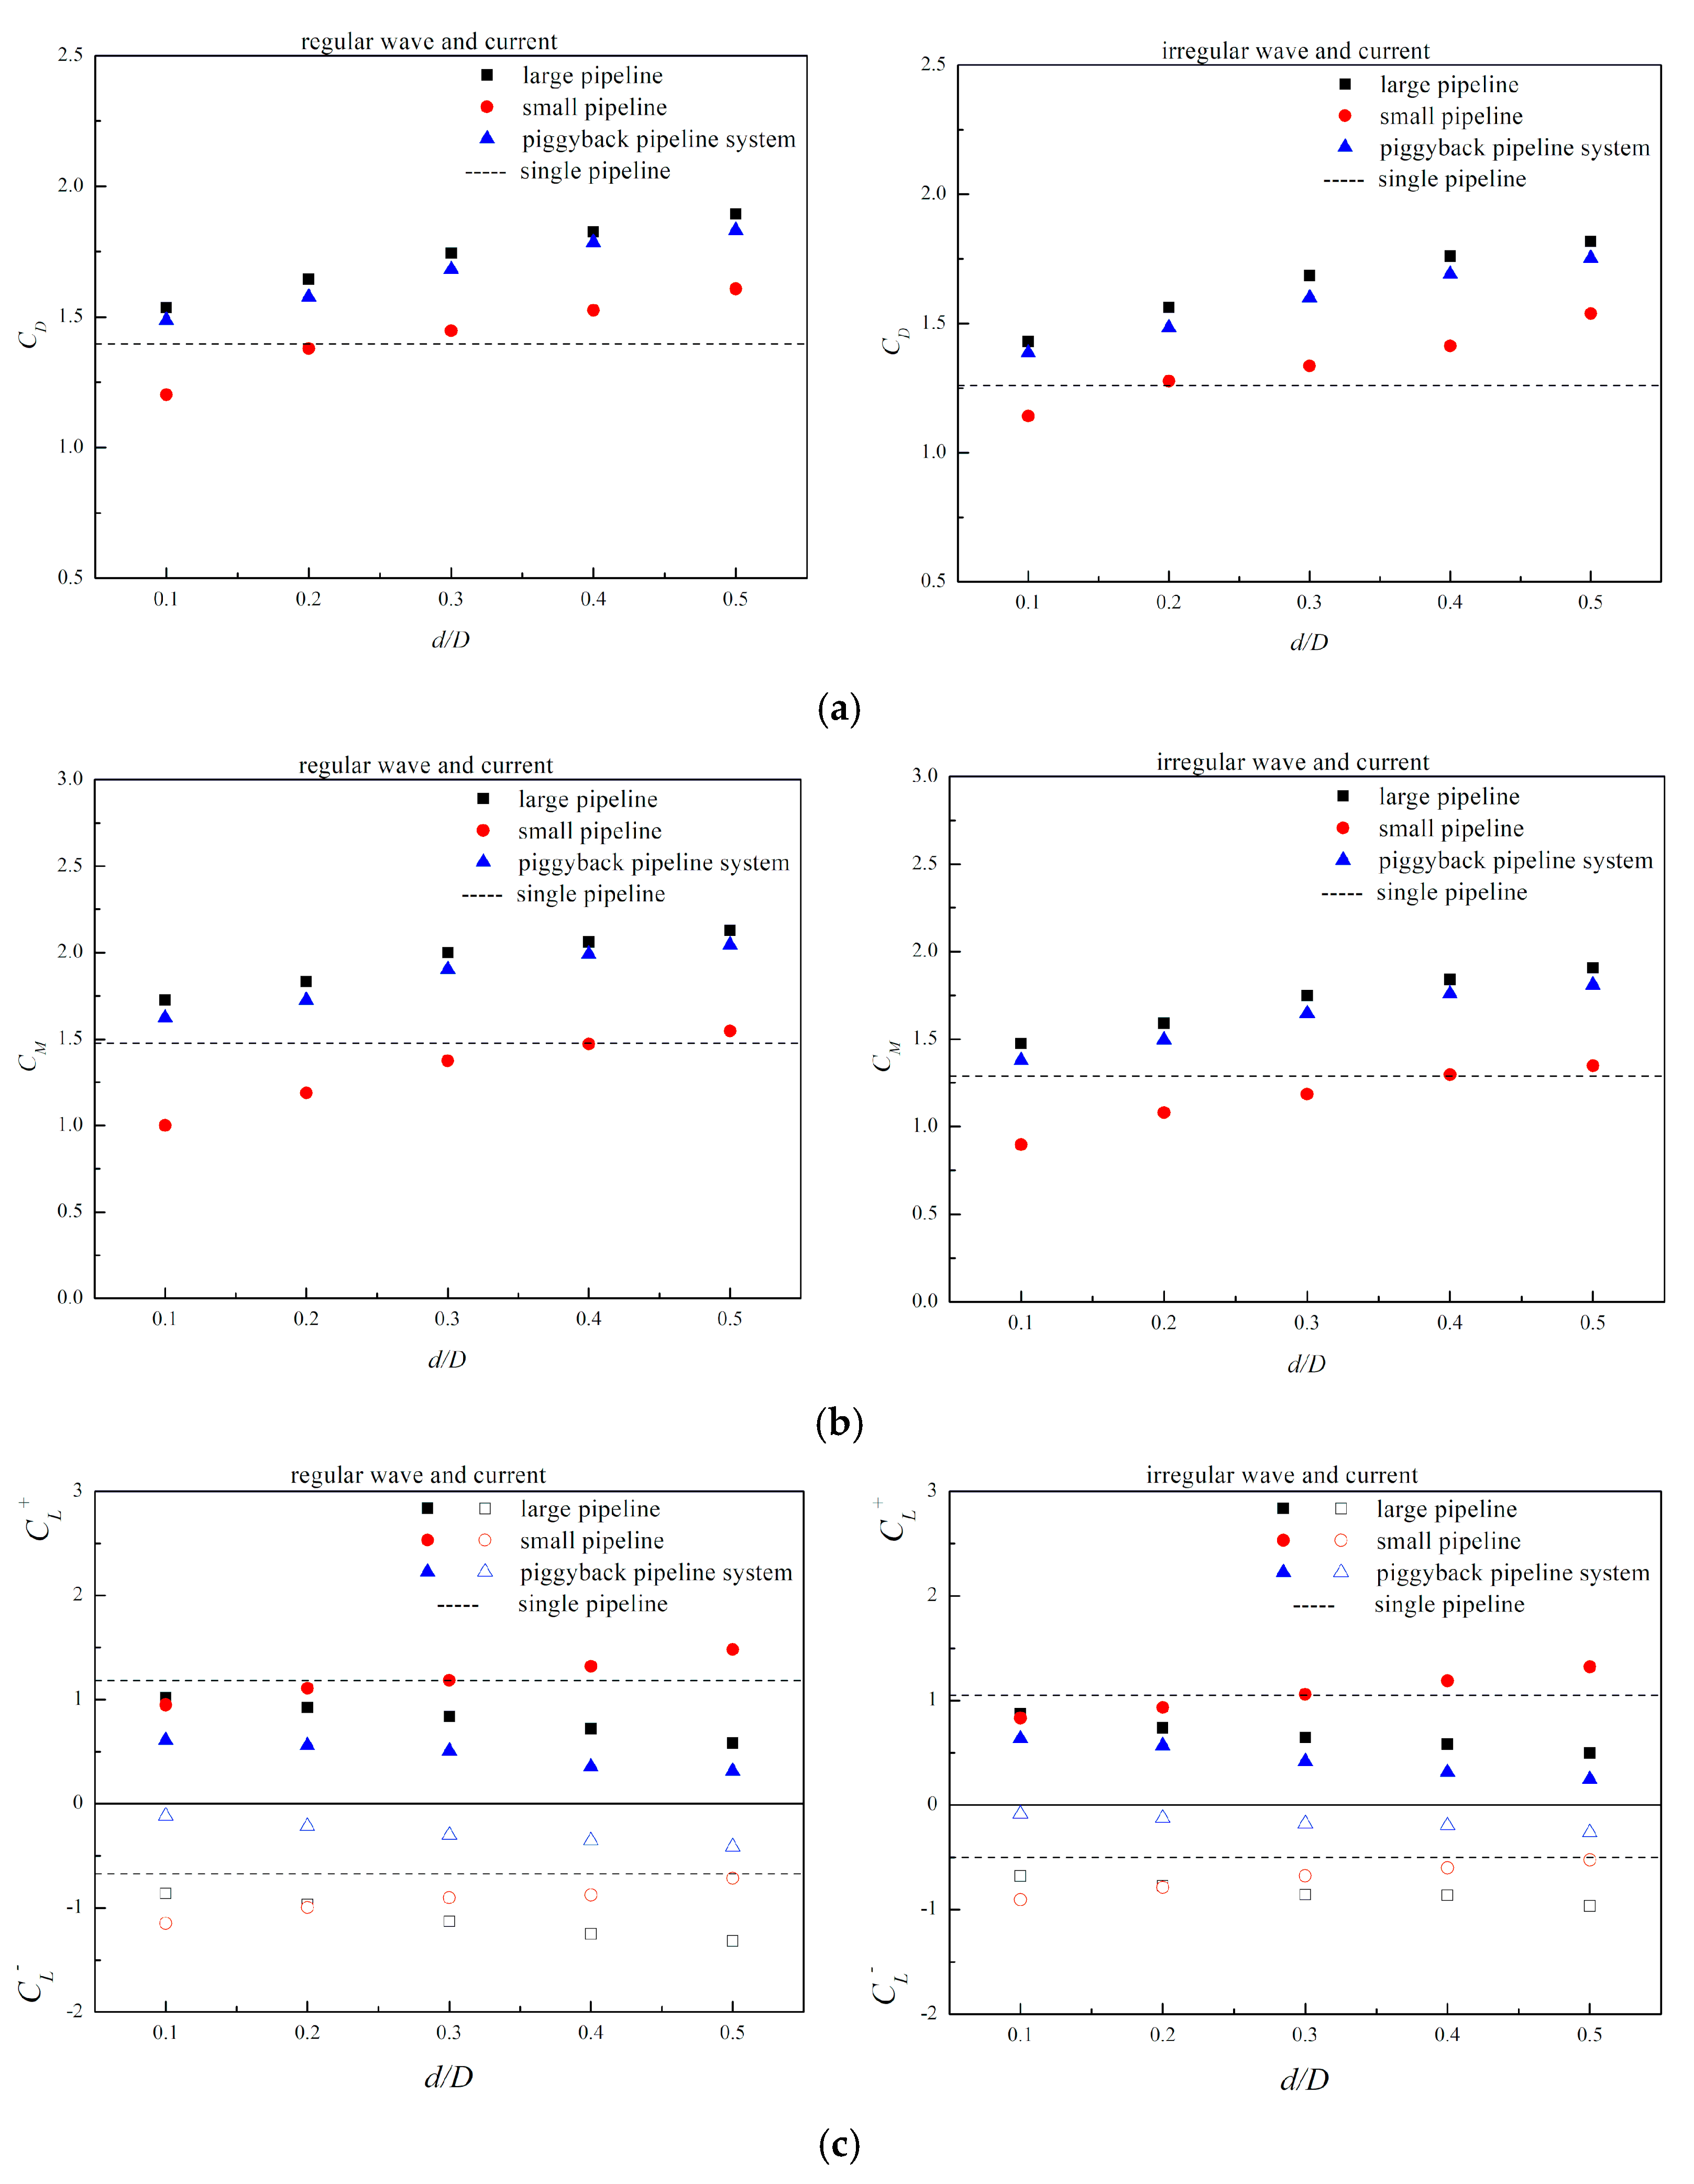
The influence of the diameter ratio of two pipelines (d/D = 0.1–0.5) on the hydrodynamic coefficients of the piggyback pipeline under the action of waves and current is investigated experimentally while e/D = G/D = 0.25. Figure 13 shows the variation law of hydrodynamic coefficients of the submarine piggyback pipeline with the diameter ratio d/D under KC = 15.7.
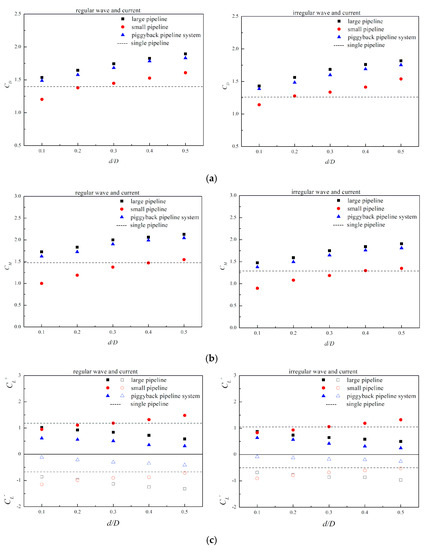
Figure 13.
Effect of the diameter ratio on hydrodynamic coefficients of the submarine piggyback pipeline under the wave–current action. (a) Variation of the drag coefficient with d/D, (b) Variation of the inertia coefficient with d/D, (c) Variation of the lift coefficient with d/D.
As can be seen from Figure 13a,b, and of the large, small pipeline and piggyback pipeline system vary with d/D in roughly the same way, and both and increase with the increase in d/D. Since the diameter of the large pipeline remains the same during the experiment, only the diameter of the small pipeline changes; the above results also show that the increase in the small pipeline diameter will lead to the increase in and of the large, small pipeline and piggyback pipeline system. In terms of magnitude, the and of the piggyback pipeline system are close to those of the large pipeline, and and of the small pipeline are relatively small, where is about 0.8 times of the large pipeline, and is about 0.6 times of the large one.
As shown in Figure 13c, with d/D increasing, of the large pipeline and piggyback pipeline system gradually decreases and gradually increases; on the contrary, of the small pipeline gradually increases and gradually decreases. It can also be seen from Figure 13c that when d/D = 0.1, the lift coefficients of the large pipeline are close to those of the small one in magnitude. However, as d/D increases, the difference between the two pipelines gradually increases. When d/D = 0.5, the of the small pipeline is about 2–3 times that of the large one, while is about 0.5 times that of the large one.
Figure 13 also shows the hydrodynamic coefficients of the single large pipeline at KC = 15.7 under the action of waves and current. By comparing the hydrodynamic coefficients with those of the large pipeline in the piggyback configuration, it is found that both and of the large pipeline are greater than the coefficients of the single pipeline, of the large pipeline is smaller than of the single one, and is greater than the latter. This shows that the presence of the small pipeline will cause and of the large one to increase, while the lift coefficient will decrease and will increase.
5. Conclusions
This paper presents the experimental results of the hydrodynamic coefficients of the submarine piggyback pipeline under the action of regular (irregular) waves and current. The effects of the KC number, the velocity ratio , the gap ratio between the large pipeline and seabed e/D, the spacing ratio between the two pipelines G/D and the diameter ratio d/D on the hydrodynamic coefficients of the piggyback pipeline configuration were systematically analyzed. The results indicate clear differences between the hydrodynamic coefficients of the large pipeline, small pipeline and piggyback pipeline system. Conclusions are summarized as follows:
- (1)
- No matter whether they are under the action of regular wave and current or irregular wave and current, the hydrodynamic coefficients of the submarine piggyback pipeline change with KC in the same way. With the increase in KC, , and decrease gradually, but increases slowly. In terms of magnitude, of the small pipeline is smaller than that of the large one and the pipeline system, and the difference decreases with the increase in KC, of the small pipeline is about 70% of that of the large one or the pipeline system, and the lift coefficient difference between the large, small pipeline and pipeline system gradually decreases as KC increases.
- (2)
- Relative to the pure wave field, the existence of steady flow will lead to a decrease in the hydrodynamic coefficients. Under the action of waves and current, the hydrodynamic coefficients of the large, small pipeline and piggyback pipeline system have the same variation trend with , , , and all decreasing as increases, and the variation amplitude gradually tends to flatten out.
- (3)
- The hydrodynamic coefficients of the large, small pipeline and piggyback pipeline system have the same trend of change with e/D. With the increase in e/D, , and decrease, but increases. When e/D > 0.5, the influence of the seabed on the near wall of the piggyback pipeline gradually weakens or even disappears.
- (4)
- With the increase in G/D, and of the large, small pipeline and piggyback pipeline system all decrease, of the large pipeline increases, decreases, while those of the small pipeline are the opposite. When G/D > 0.6, the influence of G/D on the large pipeline is gradually weakened, and the hydrodynamic coefficients of the large pipeline gradually approach the results of the single pipeline.
- (5)
- With the increase in d/D, and of the piggyback pipeline all increase, of the large pipeline and the pipeline system gradually decreases and gradually increases; on the contrary, of the small pipeline increases and decreases. In terms of magnitude, with the increase in d/D, the lift coefficient difference between the large and small pipelines gradually increases. When d/D = 0.5, the of the small pipeline is about 2–3 times that of the large one, while is about 0.5 times that of the large pipeline.
- (6)
- In practical engineering, the Morrison equation is widely used in hydrodynamic analysis and calculation of submarine pipelines, and the value of hydrodynamic coefficient is the most important one. The stability and safety evaluation of the submarine piggyback pipeline should not only investigate the overall stability of the pipeline system, but also investigate the stability of the large and small pipeline, respectively. Therefore, the above experimental results on hydrodynamic coefficients can be used as an important basis for the safety design of submarine piggyback pipeline.
Author Contributions
Conceptualization, X.C.; methodology, T.X.; software, J.Y.; validation, X.C. and T.X.; formal analysis, X.C.; investigation, Q.X.; resources, J.Y.; data curation, Q.X.; writing—original draft preparation, X.C.; writing—review and editing, T.X.; visualization, X.C.; supervision, J.Y.; project administration, Q.X.; funding acquisition, X.C. All authors have read and agreed to the published version of the manuscript.
Funding
This research was funded by the Natural Science Foundation of the Jiangsu Higher Education Institutions of China (20KJB416006).
Institutional Review Board Statement
Not applicable.
Informed Consent Statement
Not applicable.
Data Availability Statement
Not applicable.
Conflicts of Interest
The authors declare no conflict of interest.
References
- Brockbank, J. Bundled pipes speed offshore laying. Oil Gas J. 1990, 88, 78–84. [Google Scholar]
- Yang, H.; Ni, H.; Zhu, X.H. An applicable replacement bundled pipeline structure for offshore marginal oilfield development. Shipbuild. China 2007, 48, 563–570. [Google Scholar]
- Kalghatgi, S.G.; Sayer, P.G. Hydrodynamic forces on piggyback pipeline configurations. J. Waterw. Port Coast. Ocean Eng. 1997, 123, 16–22. [Google Scholar] [CrossRef]
- Kamarudin, M.H.; Thiagarajan, K.P.; Czajko, A. Analysis of current-induced forces on offshore pipeline bundles. In Proceedings of the 5th International Conference on CFD in the Process Industries, Melbourne, Australia, 13–15 December 2006; Volume 1, pp. 1–6. [Google Scholar]
- Zhao, M.; Cheng, L.; Teng, B. Numerical modeling of flow and hydrodynamic forces around a piggyback pipeline near the seabed. J. Waterw. Port Coast. Ocean Eng. 2007, 133, 286–295. [Google Scholar] [CrossRef]
- Yang, S.P.; Shi, B.; Guo, Y.K.; Yang, L.P. Investigation on scour protection of submarine piggyback pipeline. Ocean. Eng. 2019, 182, 442–450. [Google Scholar] [CrossRef]
- Asrari, S.; Hakimzadeh, H.; Kardan, N. Investigation on the local scour beneath piggyback pipelines under clear-water conditions. China Ocean. Eng. 2021, 35, 422–431. [Google Scholar] [CrossRef]
- Janocha, M.J.; Ong, M.C. Vortex-induced vibrations of piggyback pipelines near the horizontal plane wall in the upper transition regime. Mar. Struct. 2021, 75, 102872. [Google Scholar] [CrossRef]
- Jiang, C.B.; Xu, J.; Qu, K. Numerical investigation on vortex-induced vibration in two-degree-of-freedom piggyback pipeline. J. Harbin Eng. Univ. 2021, 42, 729–737. [Google Scholar]
- Cheng, X.F.; Wang, Y.X.; Wang, G.Y. Hydrodynamic forces on large pipeline and small pipeline in piggyback configuration under wave action. J. Waterw. Port Coast. Ocean Eng. 2012, 138, 394–405. [Google Scholar] [CrossRef]
- Cheng, X.F.; Wang, Y.X.; Wang, G.Y. Influence of proximity of the seabed on hydrodynamic forces on a submarine piggyback pipeline under wave action. J. Offshore Mech. Arct. Eng. 2013, 135, 021701. [Google Scholar] [CrossRef]
- Ma, L.; Wang, J.Y.; Sun, S.S.; Xing, Z.Z. Experimental study of hydrodynamic force loading under the action of wave current on submarine composite pipelines. J. Dalian Univ. 1993, 3, 54–63. [Google Scholar]
- Li, Y.C.; Zhang, N.C.; Sun, Y. The hydrodynamic characteristic of submarine composite pipeline in wave-current coexisting field. J. Hydrodyn. 1994, 9, 51–59. [Google Scholar]
- Branković, M.; Zeitoun, H.; Sutherland, J.; Pearce, A.; Willcocks, J. Physical modelling of hydrodynamic loads on piggyback pipelines in combined wave and current conditions. In Proceedings of the 29th International Conference on Ocean, Offshore and Arctic Engineering, Shanghai, China, 6–11 June 2010; Volume 5, pp. 933–942. [Google Scholar]
- Li, Y.C. Aspect of the normalization of hydrodynamic coefficients in Morison Equation. J. Hydrodyn. 1998, 13, 329–337. [Google Scholar]
- Li, Y.C. Effect of wave-current interaction on the wave parameter. J. Dalian Univ. Technol. 1982, 21, 81–91. [Google Scholar]
- Morison, J.R.; O’Brien, M.P.; Johnson, J.W.; Schaaf, S.A. The force exerted by surface waves on piles. J. Pet. Technol. 1950, 2, 149–154. [Google Scholar] [CrossRef]
- Zhao, D.T. Study on the transverse wave force coefficient CL(n) of submarine horizontal circular pipe. China Offshore Platf. 1993, 8, 137–141. [Google Scholar]
- Sarpkaya, T. Forces on cylinders near a plane boundary in a sinusoidally oscillating fluid. J. Fluids Eng. 1976, 98, 499–503. [Google Scholar] [CrossRef]
- Bryndum, M.B.; Jacobsen, V.; Tsahalis, D.T. Hydrodynamic forces on pipelines: Model tests. J. Offshore Mech. Arct. Eng. 1992, 114, 231–241. [Google Scholar] [CrossRef]

Publisher’s Note: MDPI stays neutral with regard to jurisdictional claims in published maps and institutional affiliations. |
© 2021 by the authors. Licensee MDPI, Basel, Switzerland. This article is an open access article distributed under the terms and conditions of the Creative Commons Attribution (CC BY) license (https://creativecommons.org/licenses/by/4.0/).