Article

Seasonal Sources and Cycling of Nitrogen Revealed by Stable Isotopes in the Northeastern Beibu Gulf, China

1
Key Laboratory of Environment Change and Resources Use in Beibu Gulf, Nanning Normal University, Ministry of Education, Nanning 530001, China
2
College of Ocean and Meteorology, Guangdong Ocean University, Zhanjiang 524088, China
3
Marine Environmental Monitoring Centre of Beihai, State Oceanic Administration, Beihai 536000, China
*
Author to whom correspondence should be addressed.
J. Mar. Sci. Eng. 2021, 9(10), 1123; https://doi.org/10.3390/jmse9101123
Submission received: 12 September 2021 / Revised: 9 October 2021 / Accepted: 12 October 2021 / Published: 14 October 2021
(This article belongs to the Section Chemical Oceanography)

Abstract

:
Isotope measurements were performed on dissolved nitrate (NO3) and ammonium (NH4+) in the coastal waters of the northeastern Beibu Gulf, China, to investigate the seasonal nitrate sources and their biogeochemical processes, which are due to the rapid development of local industrialisation and urbanisation. The high N/P ratio observed in the coastal bay during both fall and spring suggests that P is a limiting nutrient, which in turn indicates that increasing P causes conditions favourable for algal blooms. Higher nutrient concentrations and δ15N-NO3 and δ15N-NH4+ values were found in the nearshore area in the fall, suggesting that nutrients originated mainly from land-based pollution. A Bayesian isotope mixing model was used to calculate the contribution of potential NO3 sources and the results showed that in the nearshore area, NO3 originated mainly from manure and sewage (58%). In the spring, however, in addition to the impact of urban sewage effluents, the exchange of sediment and water was another important factor causing higher nutrient concentrations and positive NO3 isotopes in the nearshore area. There were lower concentrations of nutrients and an increase in δ15N-NO3 and δ15N-NH4+ values in the offshore area in the fall, and the NO3 loss in the surface water was mainly caused by the process of assimilation. However, the exchange of sediment and water was the dominant factor causing higher nutrient concentrations (except for NO3) and positive dual nitrate isotopes but lower NO3 concentration in the offshore area during the spring. Overall, isotope analysis of NO3 and NH4+ helps to illustrate the major sources of the former and their biological transformation in the northeastern Beibu Gulf.

1. Introduction

Coastal systems globally often receive various nutrient sources, which are primarily driven by anthropogenic activities, resulting in serious nutrient load in coastal waters [1,2,3,4,5,6]. Moreover, coastal areas play a significant role in the biogeochemical processing of nutrients [4]. Nitrogen is an important element in the regulation of marine primary productivity and climate change [7]. However, the global discharge of dissolved inorganic nitrogen (DIN) is predicted to increase to 47 × 106 tons per year in 2050, which is over double the estimated discharge rate in 1990 [4,8]). Increasing N loads in coastal systems have caused several environmental problems including eutrophication, hypoxia, and harmful algal blooms [3,9,10,11,12,13,14]; therefore, they have become a focus of increasing public concern. Thus, tracing N sources and N recycling processes are important to designing effective management practices to protect coastal ecosystems.
The traditional methods for the determination of the nitrate contamination source are to identify by investigating the land use type of the contaminant area, combined with the analysis of hydrochemical characteristics. However, because of the diversity of the potential sources, which mixed the point and non-point sources, and the complex chemical, physical and biological transformation processes in the nitrate cycle, the results obtained by this traditional method are relatively rough [15]. Among the many methods available, the stable nitrogen isotope δ15N-NO3 from various N pools and the oxygen isotope of nitrate (δ18O-NO3) are powerful “tracers” and/or “integrators” in N cycle processes and have been used successfully to reveal N sources and their biogeochemical processes in aquatic systems [9,16,17,18,19]. Various N sources can generally be distinguished by the range of δ15N-NO3 and δ18O-NO3 values they contain [20]. For example, nitrate from manure and sewage is characterised by relatively high δ15N-NO3 values compared to that from fertiliser and atmospheric deposition; this is because of the volatilisation of 15N-depleted ammonia [3,21]. Furthermore, the δ18O-NO3 values from atmospheric nitrates are generally high (>50‰) relative to those from other sources (<25‰) [9,22]. A Bayesian isotope mixing model has previously been applied successfully to quantify the relative proportion of various N sources in a sample by using different isotopic signals from the former [23,24,25,26]. In addition, isotopic signals in nitrates also reflect biogeochemical N processes in aquatic systems, including nitrate assimilation, nitrification, denitrification, and N2 fixation [18,27,28]. However, biological processes of N often cause isotopic fractionation due to the preferential transformation or assimilation of lighter isotopes (14N and 16O) [9,20]. For example, nitrification can cause the formation of 15N-depleted nitrate while denitrification can cause the enrichment of δ15N and δ18O by a ratio of 1:1 [18,28,29]. Similarly, assimilation can cause an increase in δ15N and δ18O in a residual nitrate pool [27], but the remineralisation of sinking organic N increases the percentage of light N in water [30]. The processes that occur in marine environments make it more complicated to determine N sources; therefore, a better understanding of N sources and the processes they undergo in marine ecosystems could be achieved by combining the variations in and distribution of the δ15N (and δ18O) of various N.
The Beibu Gulf (17.0–22.0° N, 105.5–110.0° E), located in the north-western part of the South China Sea (SCS), is a developing industrial area in southern China. Its high productivity and rich biological diversity have also made the Beibu Gulf a key fishing ground and source of fisheries products for that area [31,32]. However, the increasing population, intensification of agricultural activity, and rapid industrialisation and urbanisation that took place along the coast of Guangxi Province in recent decades have greatly increased N loading to this gulf [33,34,35,36,37,38,39,40]. Eutrophication fuelled by anthropogenic nutrient inputs is now a serious problem along the coast [33,34,38], which have led to many harmful algae bloom events in the coastal gulf and port [41]. Moreover, the index of nutritional status increased significantly over past decades, which was caused by the increased inputs of nutrients from the coastal Guangxi Beibu Gulf [37,38]. Particularly in the northeast of the gulf, the pollution level in that region is higher than that in the northwest due to the rapid development of industrialisation and urbanisation [34,42,43]. However, despite this, information on nitrate sources and biogeochemical transformations in the area is very limited.
To provide a comprehensive overview of nitrate sources and cycles in the northeastern Beibu Gulf, we investigated the concentrations of the nutrients NO3, NO2, NH4+, and PO43− and the isotopes δ15N-NO3, δ18O-NO3, and δ15N-NH4+ in the seawater during different seasons (fall and spring). These data enable us to qualitatively characterise the main N sources in the coastal area and understand the factors controlling the distribution of the nutrients studied.

2. Materials and Methods

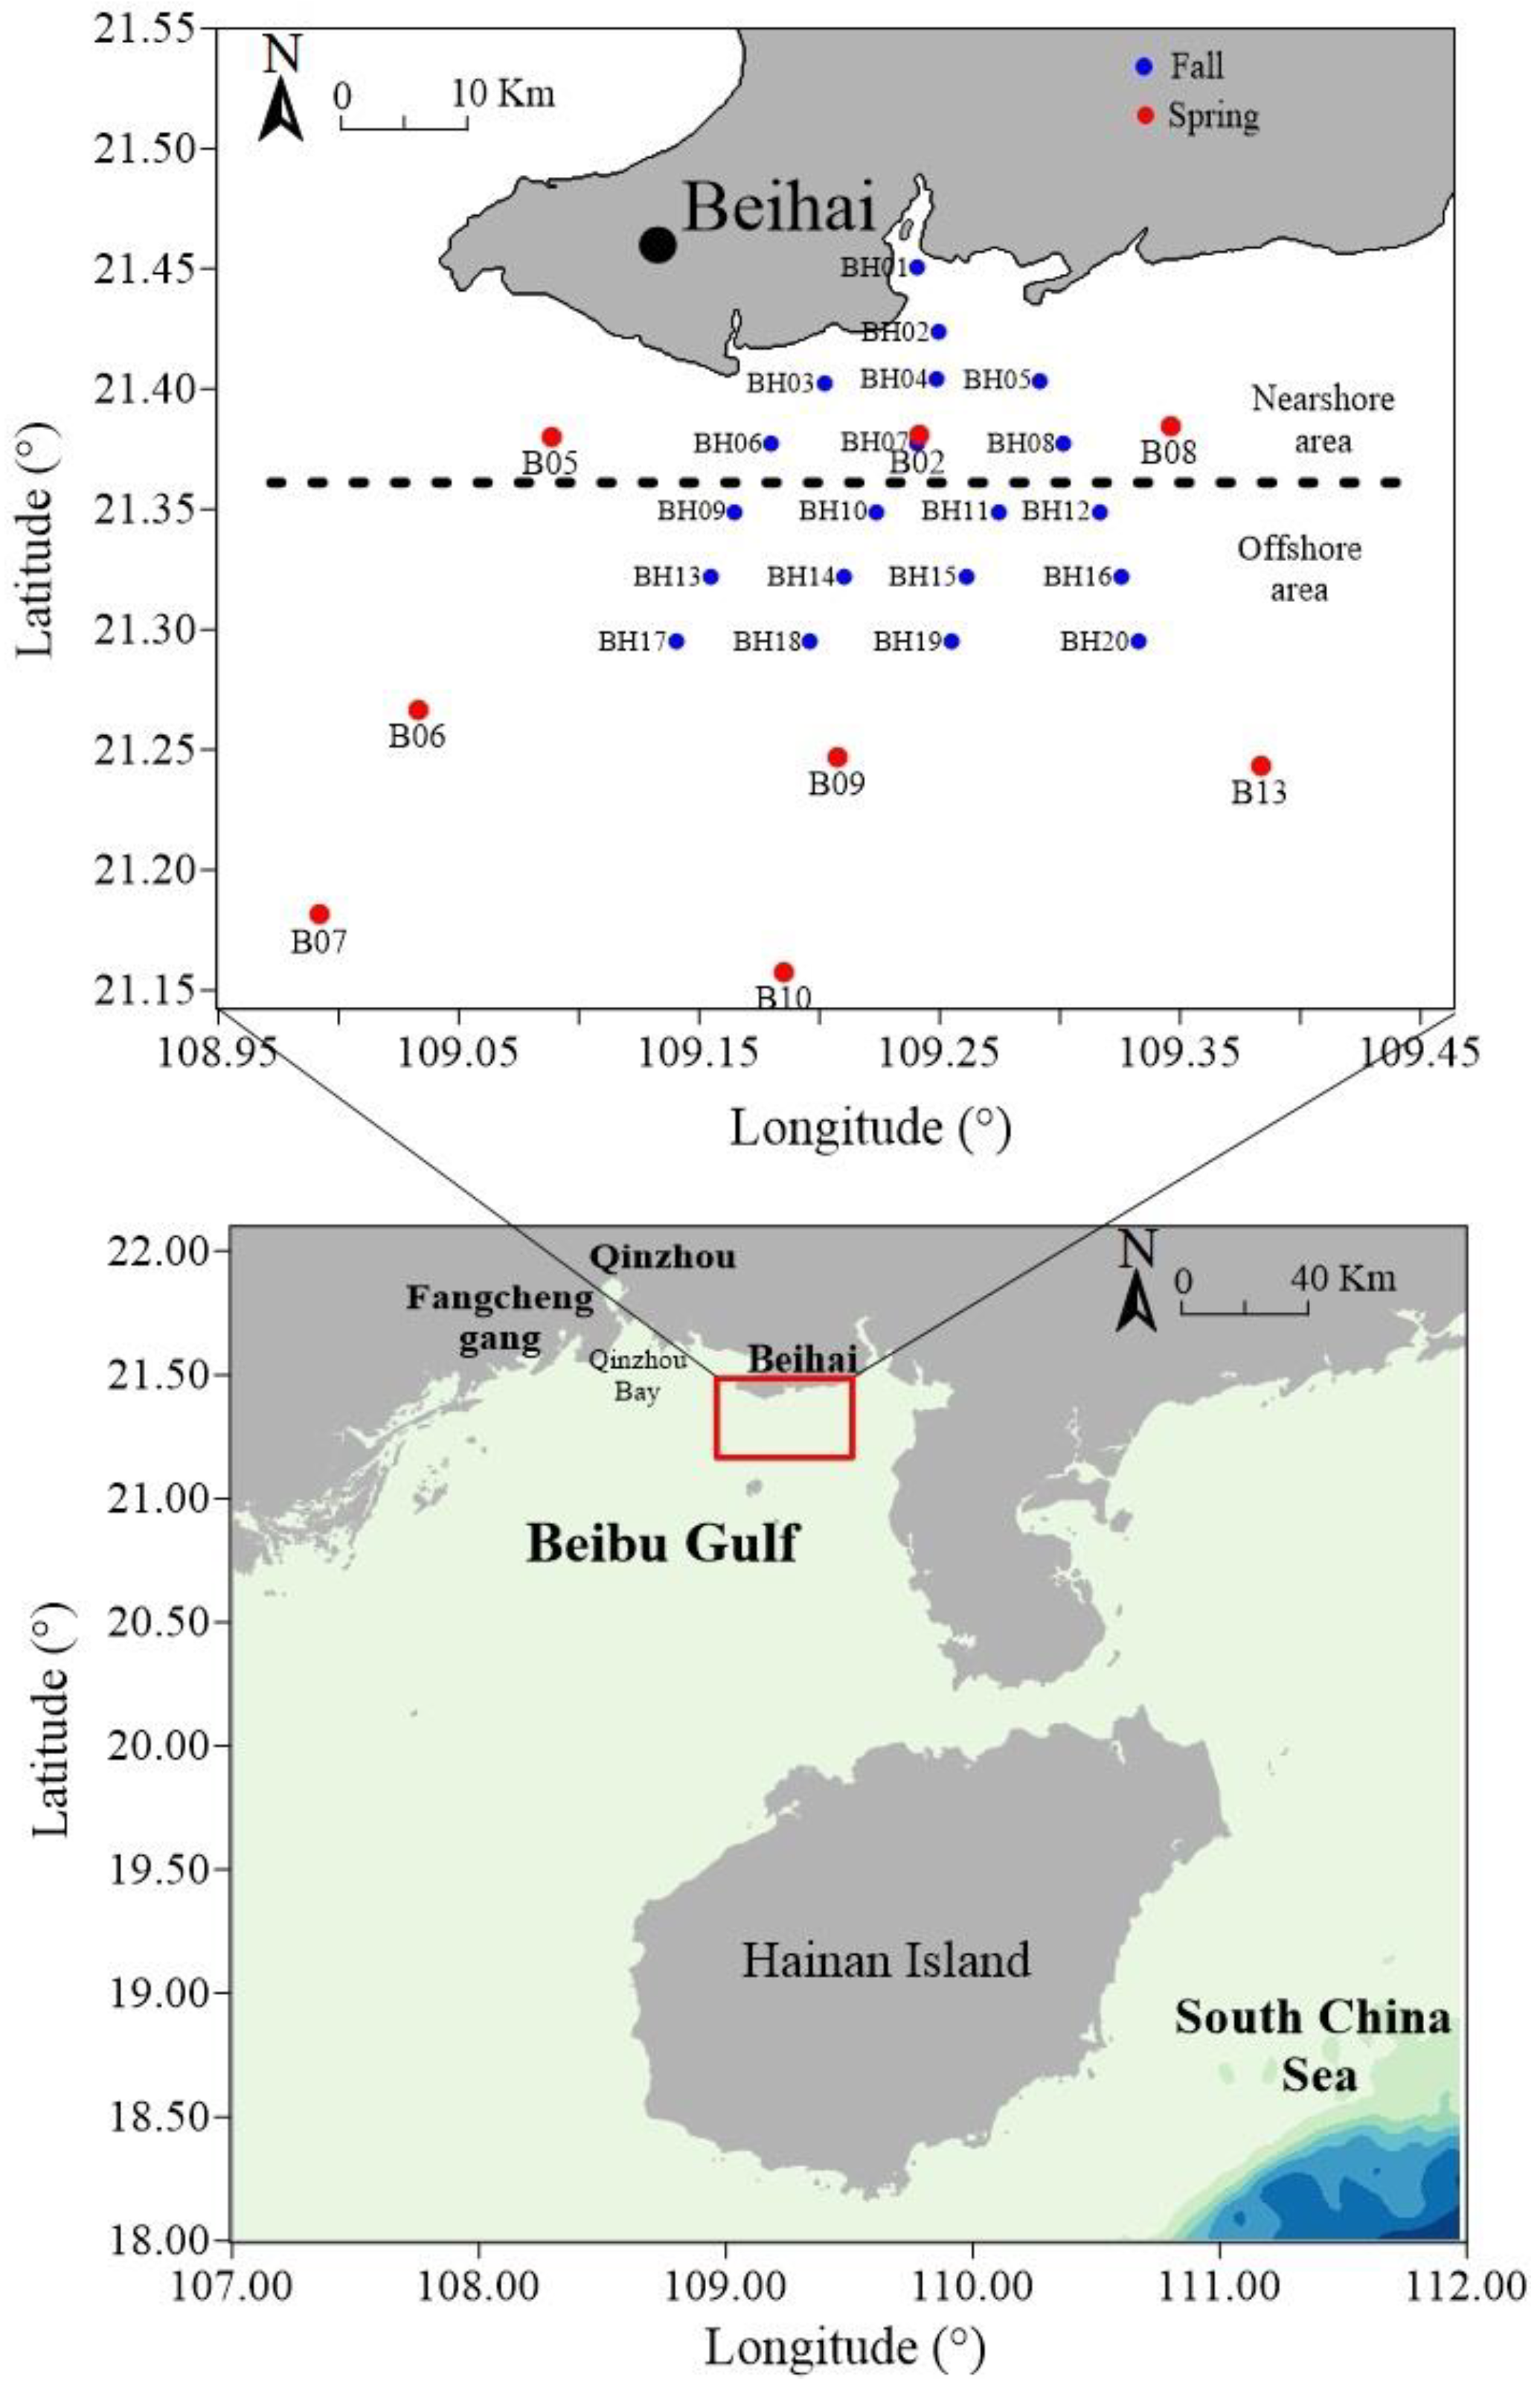
2.1. Study Area and Sampling

The Beibu Gulf is a semi-enclosed gulf with an area of approximately 130 × 103 km2 and is located in the tropical and sub-tropical areas of southern China. It is influenced by the East Asian monsoon, which in turn is influenced by cold air from mainland China during the winter-spring season, with wind rising from the tropical ocean during the summer–autumn period. Freshwater discharged from coastal cities carry large quantities of anthropogenic pollutants to coastal waters [32,33,44]. For this study, two cruises were conducted in the north-eastern part of the Beibu Gulf, along the coast of Beihai City, in November (autumn) 2018 and March (spring) 2019 (Figure 1). Samples were collected from the surface of the seawater (0.5 m) at 20 stations using a rosette sampler fitted with 10 L Niskin bottles (Figure 1).

2.2. Chemical Analysis

Temperature, salinity (S), and dissolved oxygen (DO) were measured on-site, with DO being measured using the Winkler titration method. The seawater samples were filtered through glass–fibre filters (Whatman, 0.7 μm, GF/F) to determine their chlorophyll a (Chl a) levels, and the filtered samples were stored at −20 °C before further processing and analysis. Measurements of nutrients concentrations and isotope ratios were conducted after the seawater samples were pre-filtered through pre-combustion (450 °C, 4 h) GF/F membranes (47 mm diameter, Whatman). The filtered samples were stored at −20 °C until analysis.
Chl a levels were determined using a spectrophotometer. NO3, NO2, and PO43− concentrations were determined using a San++ continuous flow analyser (Skalar, Breda, the Netherlands) and NH4+ concentrations were determined using spectrophotometry. The detection limits for NO3, NO2, and NH4+, were 0.1 μmol L−1 each while that for PO43− was 0.02 μmol L−1. For isotopic analysis, sulfamic acid was added to the samples to remove NO2, and the method used to determine the levels of nitrogen and oxygen isotopes of nitrate (δ15N-NO3 and δ18O-NO3) was modified from Mcilvin et al. [45]. Briefly, NO3 was reduced to NO2 by the addition of Cd and then reduced to N2O with the addition of NaN3 in an acetic buffer of pH 4–5. For isotopes of NH4+, the NH4+ was first quantitatively oxidised to NO2 with the addition of BrO at pH 12. Following this, excess BrO was consumed by NaAsO2 and the yield was verified via colorimetric NO2 determination. Afterwards, the NO2 was further reduced to N2O by the addition of a buffer solution of 1:1 NaN3 and acetic acid [46]. Finally, the N2O was purified and separated using TraceGas (Isoprime) and the isotope was determined using a GasBench II-MAT 253 (MAT 253 Plus, Thermo Scientific, United states). The IAEA-N3 international standard was utilised to calibrate the isotope values for δ15N-NO3 and δ18O-NO3, and the international standards IAEA-N1, USGS 25, and USGS 26 were used to calibrate δ15N-NH4+. The deviations from the standard in the δ15N-NO3, δ18O-NO3, and δ15N-NH4+ analyses were less than 0.2‰, 0.5‰, and 0.2‰, respectively. The reproducibility of duplicate samples for the δ15N-NO3, δ18O-NO3, and δ15N-NH4+ analyses were, respectively, less than 0.3‰ (average ± 0.1‰), 0.6‰ (average ± 0.3‰), and 0.3‰ for δ15N (average ± 0.1‰).

2.3. Mixing Model

A conservative salinity-based mixing model was used to calculate the mixing of NO3 concentrations and dual nitrate isotopic values resulting from simple physical mixing of two endmembers [3,9,47,48]. The equations used are as follows:
f 1 + f 2 = 1
f 1 S 1 + f 2 S 2 = S Mix
f 1 N 1 + f 2 N 2 = N Mix
f 1 N 1 δ 1 + f 2 N 2 δ 2 = N Mix δ Mix
where f denotes the proportion of two-endmember water masses (with the subscripts 1 and 2 representing the two endmembers); S, N, and δ denote salinity, NO3 concentration, and dual nitrate isotopic value (i.e., the parameters being mixed); and SMix, NMix, and δMix denote the measured values in a mixed water sample. Using the above equations, the following results are obtained.
f 1 = S Mix S 2 S 1 S 2
N Mix = N 2 + ( N 1 N 2 ) f 1
δ Mix = [ f 1 ( δ 1 N 1 δ 2 N 2 ) + δ 2 N 2 ] / N Mix
These expressions show that NO3 concentrations change in a linear manner along the mixing gradient under steady-state conditions, whereas salinity-based isotope mixing shows curvilinear behaviour (Equation (7)) that reflects the NO3 concentration-based weighting of the isotopic proportions of endmembers. In this study, the salinity at station BH01 was the lowest measured although it was still high (S = 27.98) relative to freshwater, suggesting that these waters originated mainly from coastal water inputs. The highest salinity was recorded at station BH20, which is a reflection of the water from further out to sea being mixing with coastal waters as an input. Thus, the endmember parameters from stations BH01 and BH20 were chosen as the two endmembers for this study, as shown in Table 1.

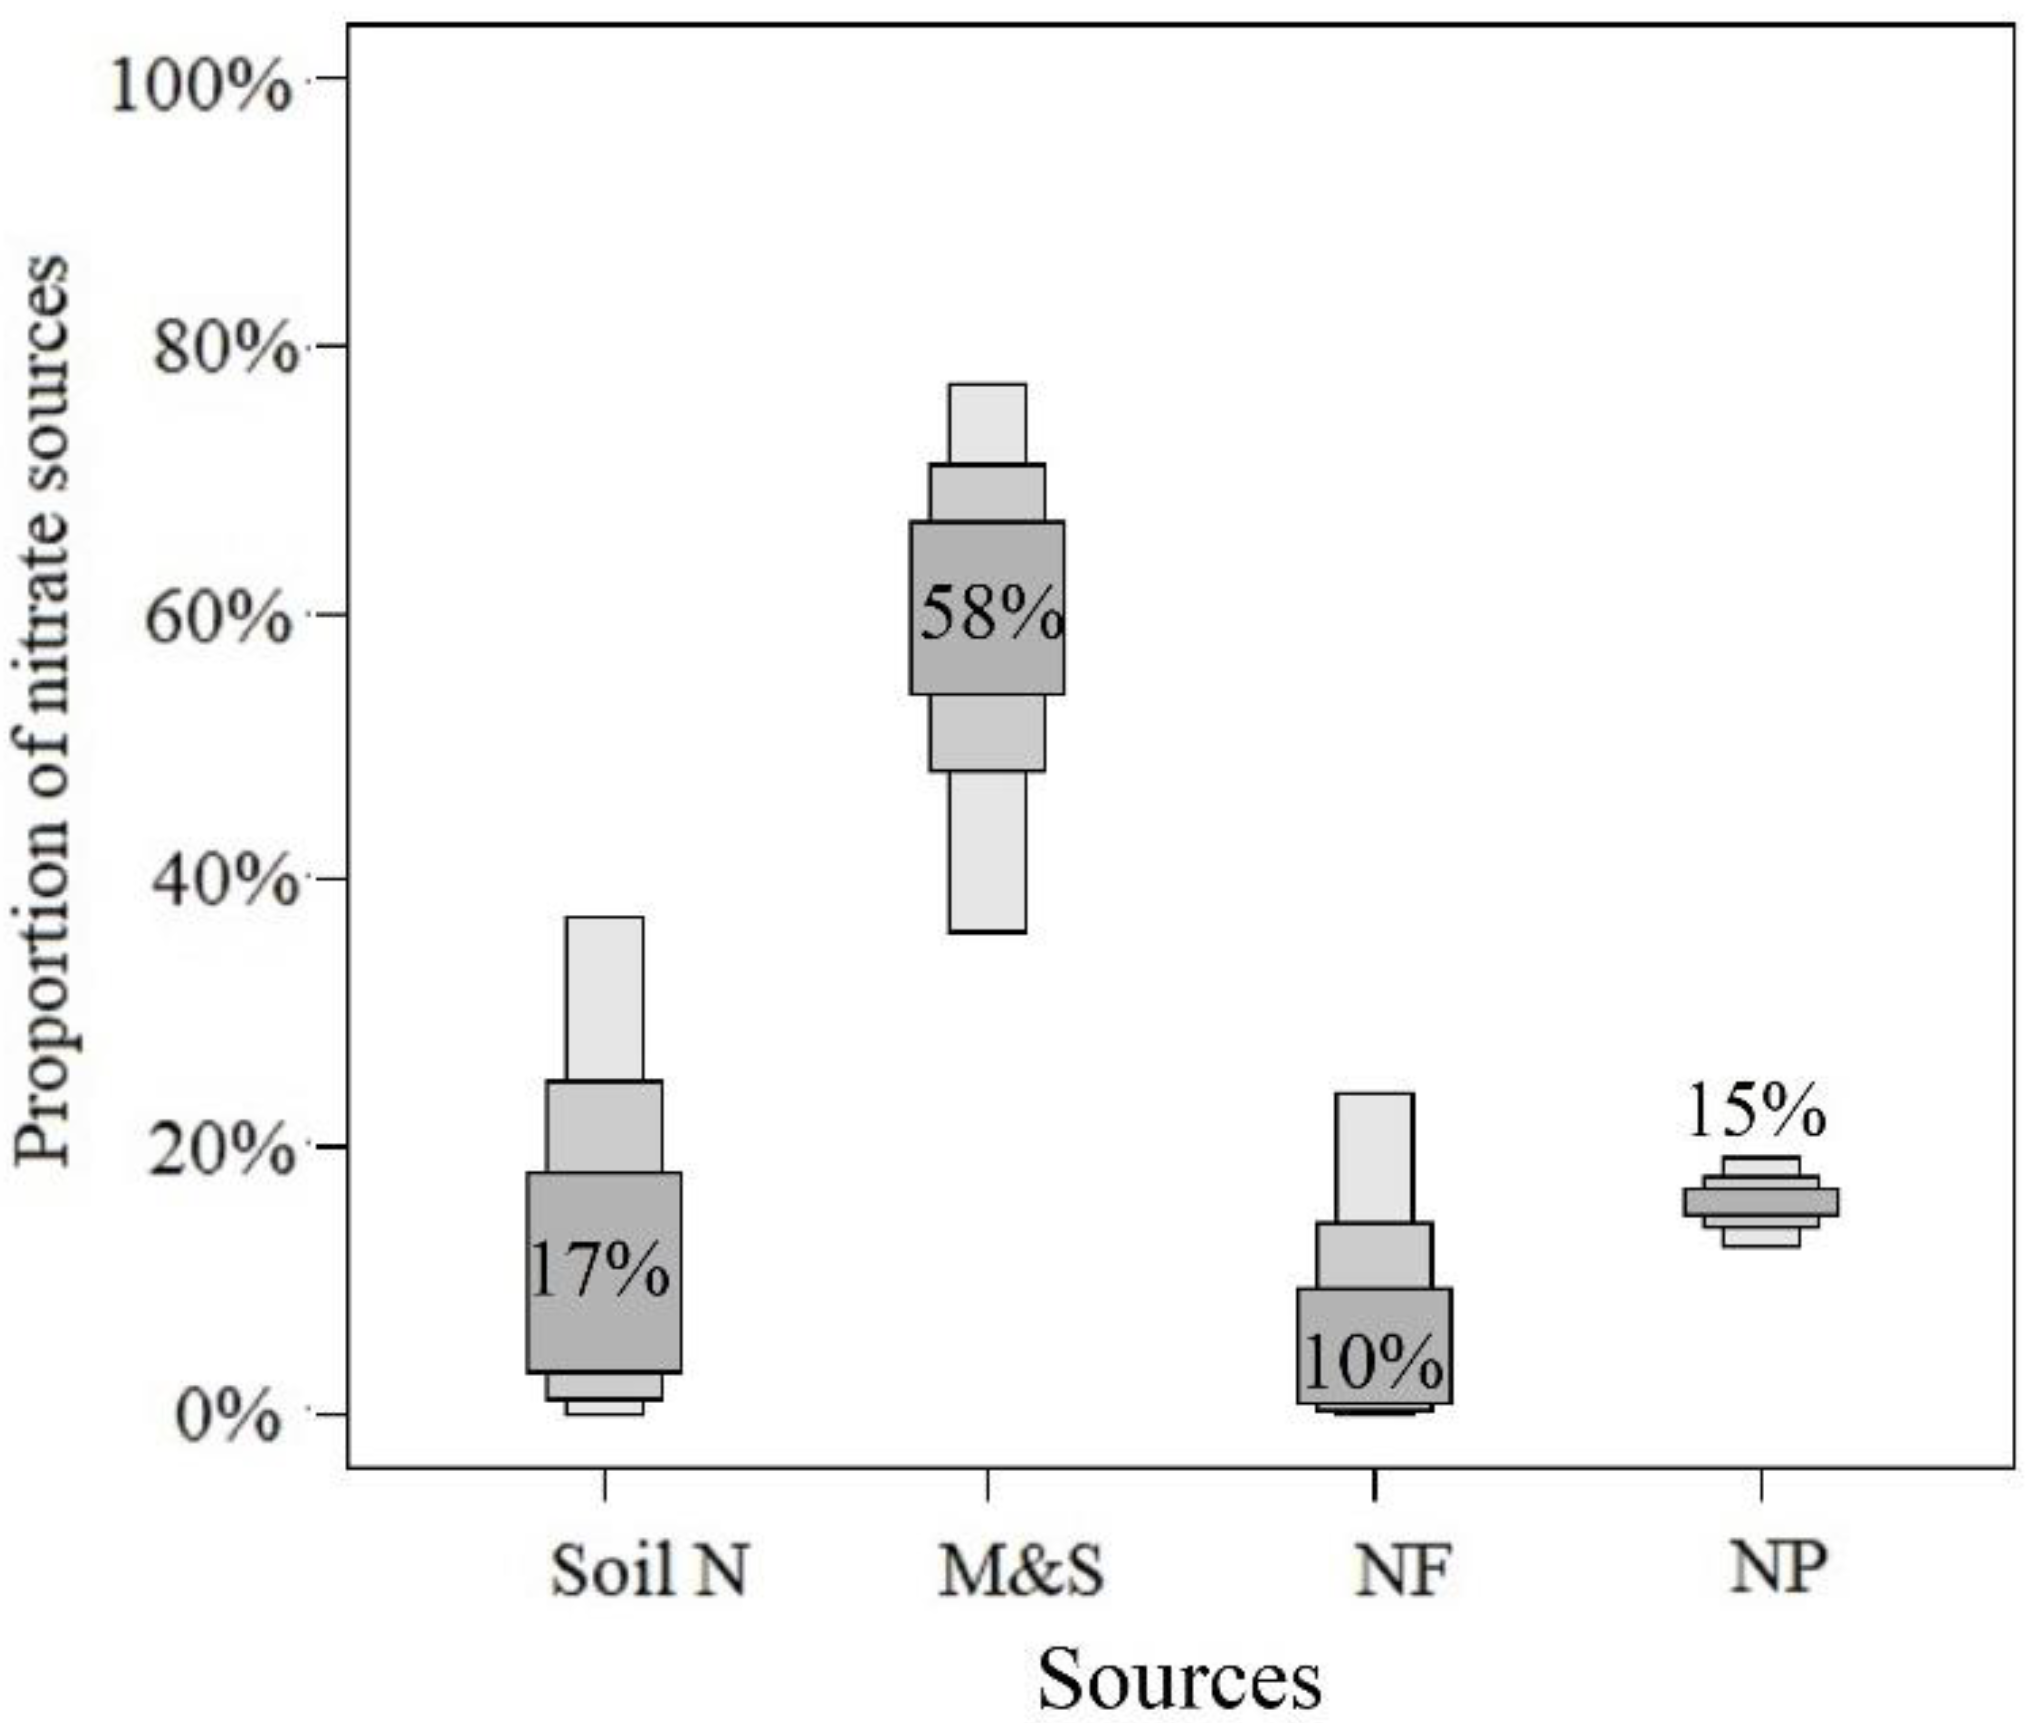
2.4. Quantification of the Mixing Model

A Bayesian stable isotope mixing model was used to quantify the proportional contributions of each nitrate source along the coastal area. The model was run in the stable isotope analysis in the R (SIAR) software package. The framework of the model is as follows:
X i j = k = 1 k P k ( S j k + c j k ) + ε i j S j k ~     ( μ j k   ω j k 2 ) c j k ~     ( λ j k   τ j k 2 ) ε j k ~     ( 0 ,   σ j 2 )
where Xij and Sjk are the dual-isotope value of nitrate (δ15N-NO3 and δ18O-NO3) of a mixed sample and the isotope value of NO3 sources, respectively; Sjk is normally distributed with mean μjk and standard deviation ωjk; Pk denotes the contribution of NO3 sources; cjk is the factor of fractionation for δ15N-NO3 and δ18O-NO3 in NO3 sources, normally distributed with mean λjk and standard deviation τjk; and εjk denotes the residual error of the additional unquantified change between samples, normally distributed with mean 0 and standard deviation σj. A detailed description of this model was reported by Blake et al. [16], Moore and Semmens [24], Xue et al. [25], and Zhang et al. [26]. However, it is difficult to quantify the source of nitrate by using this model if the nitrate biogeochemical process occurs, because the biological processes can cause isotope fractionation. Thus, this model is only used in the absence of nitrate biological processes.

3. Results

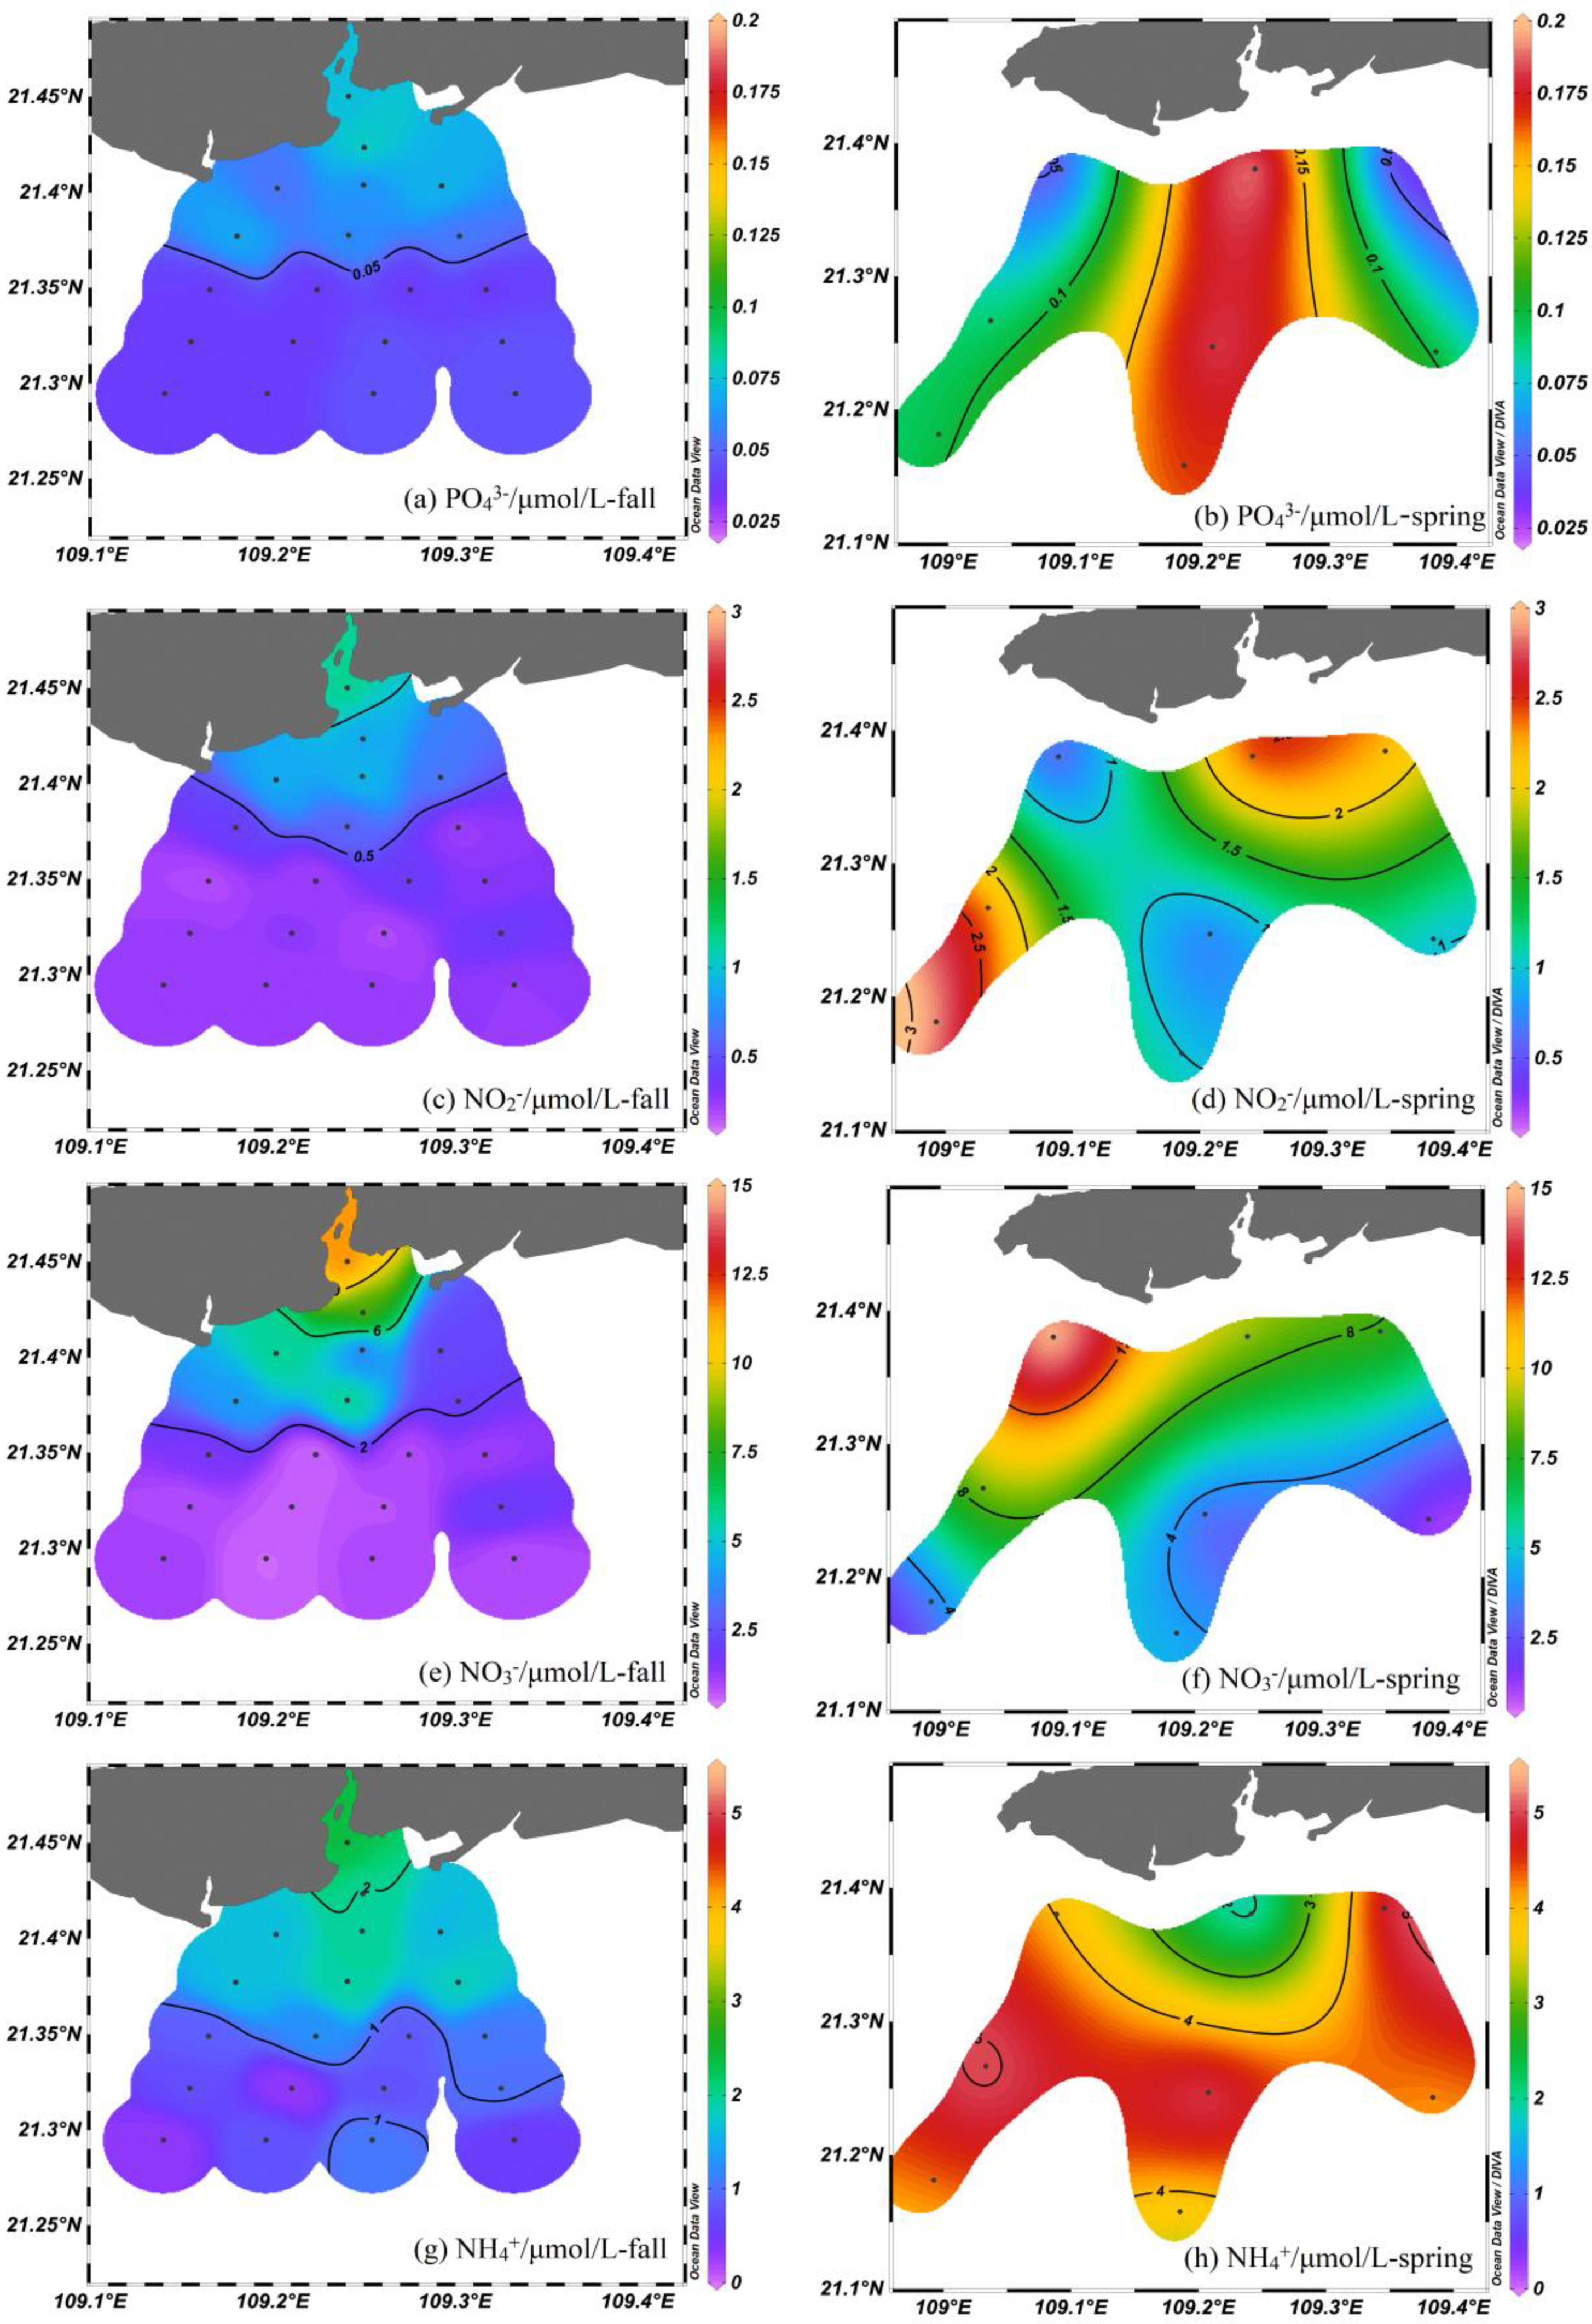
3.1. Chemical Parameters

The seasonal distribution characteristic of physicochemical parameters were presented in Figure 2. Salinity and temperature increased seaward, i.e., from the nearshore to the offshore areas, ranging overall from 27.98 to 31.45 and 23.8 to 26.00 °C during the fall, and from 29.31 to 32.32 and 20.8 to 24.7 °C during the spring, respectively; the minimum values were at the nearshore area during both two seasons (Figure 2a–d). A slightly higher Chl a level was found in the spring (average of 1.43 μg L−1) compared to that in the fall (average of 1.31μg L−1). A relatively low Chl a level was found in the nearshore area whereas a higher Chl a level was found in the offshore area during both two seasons (Figure 2e,f). The DO level during the spring (ranged from 7.22 to 8.18, average of 7.45 mg L−1) was higher than that during the fall (ranged from 5.94 to 7.73 mg L−1, average of 6.71 mg L−1). The minimum DO (5.94 mg L−1) was recorded at the nearshore area at the top of the gulf during the fall, while the DO level was relatively uniform during the spring. The level of total suspended particulate matter (TSPM) during the spring (average of 24.29 mg L−1) was obviously higher than that in the fall (average of 16.05 mg L−1), particularly in the offshore area (Figure 2i,j). Moreover, a higher TSPM level was found in the nearshore area during the spring (Figure 2j).
Figure 3 shows that, in contrast to the distributions of physiochemical parameters, the concentrations of NO3, NO2, NH4+, and PO43− decreased seaward–with high concentrations in the nearshore area and low concentrations in the offshore area. Generally, the concentrations of NO3 (average of 6.59 μmol L−1), NO2 (average of 1.66 μmol L−1), NH4+ (average of 4.12 μmol L−1), and PO43− (average of 0.11 μmol L−1) in the spring were higher than that in the fall (average of 2.80 μmol L−1, 0.45 μmol L−1, 1.24 μmol L−1 and 0.05 μmol L−1 for NO3, NO2, NH4+, and PO43−, respectively). Among the types of dissolved inorganic nitrogen (DIN), the concentration of NO3 was the highest, followed by NH4+, and the lowest by NO2. The ratio of N/P (([NO3] + [NO2] + [NH4+])/[PO43−]) ranged from 34 to 206 (with an average of 79) during the fall and from 50 to 374 (average of 152) during the spring throughout the coastal area, and they were significantly higher than the Redfield ratio (i.e., the ratio of these nutrients utilised by marine phytoplankton) of 16. This suggested that P could be largely limited to producing phytoplankton along the coastal areas; this is consistent with the results of a previous study [34,38].

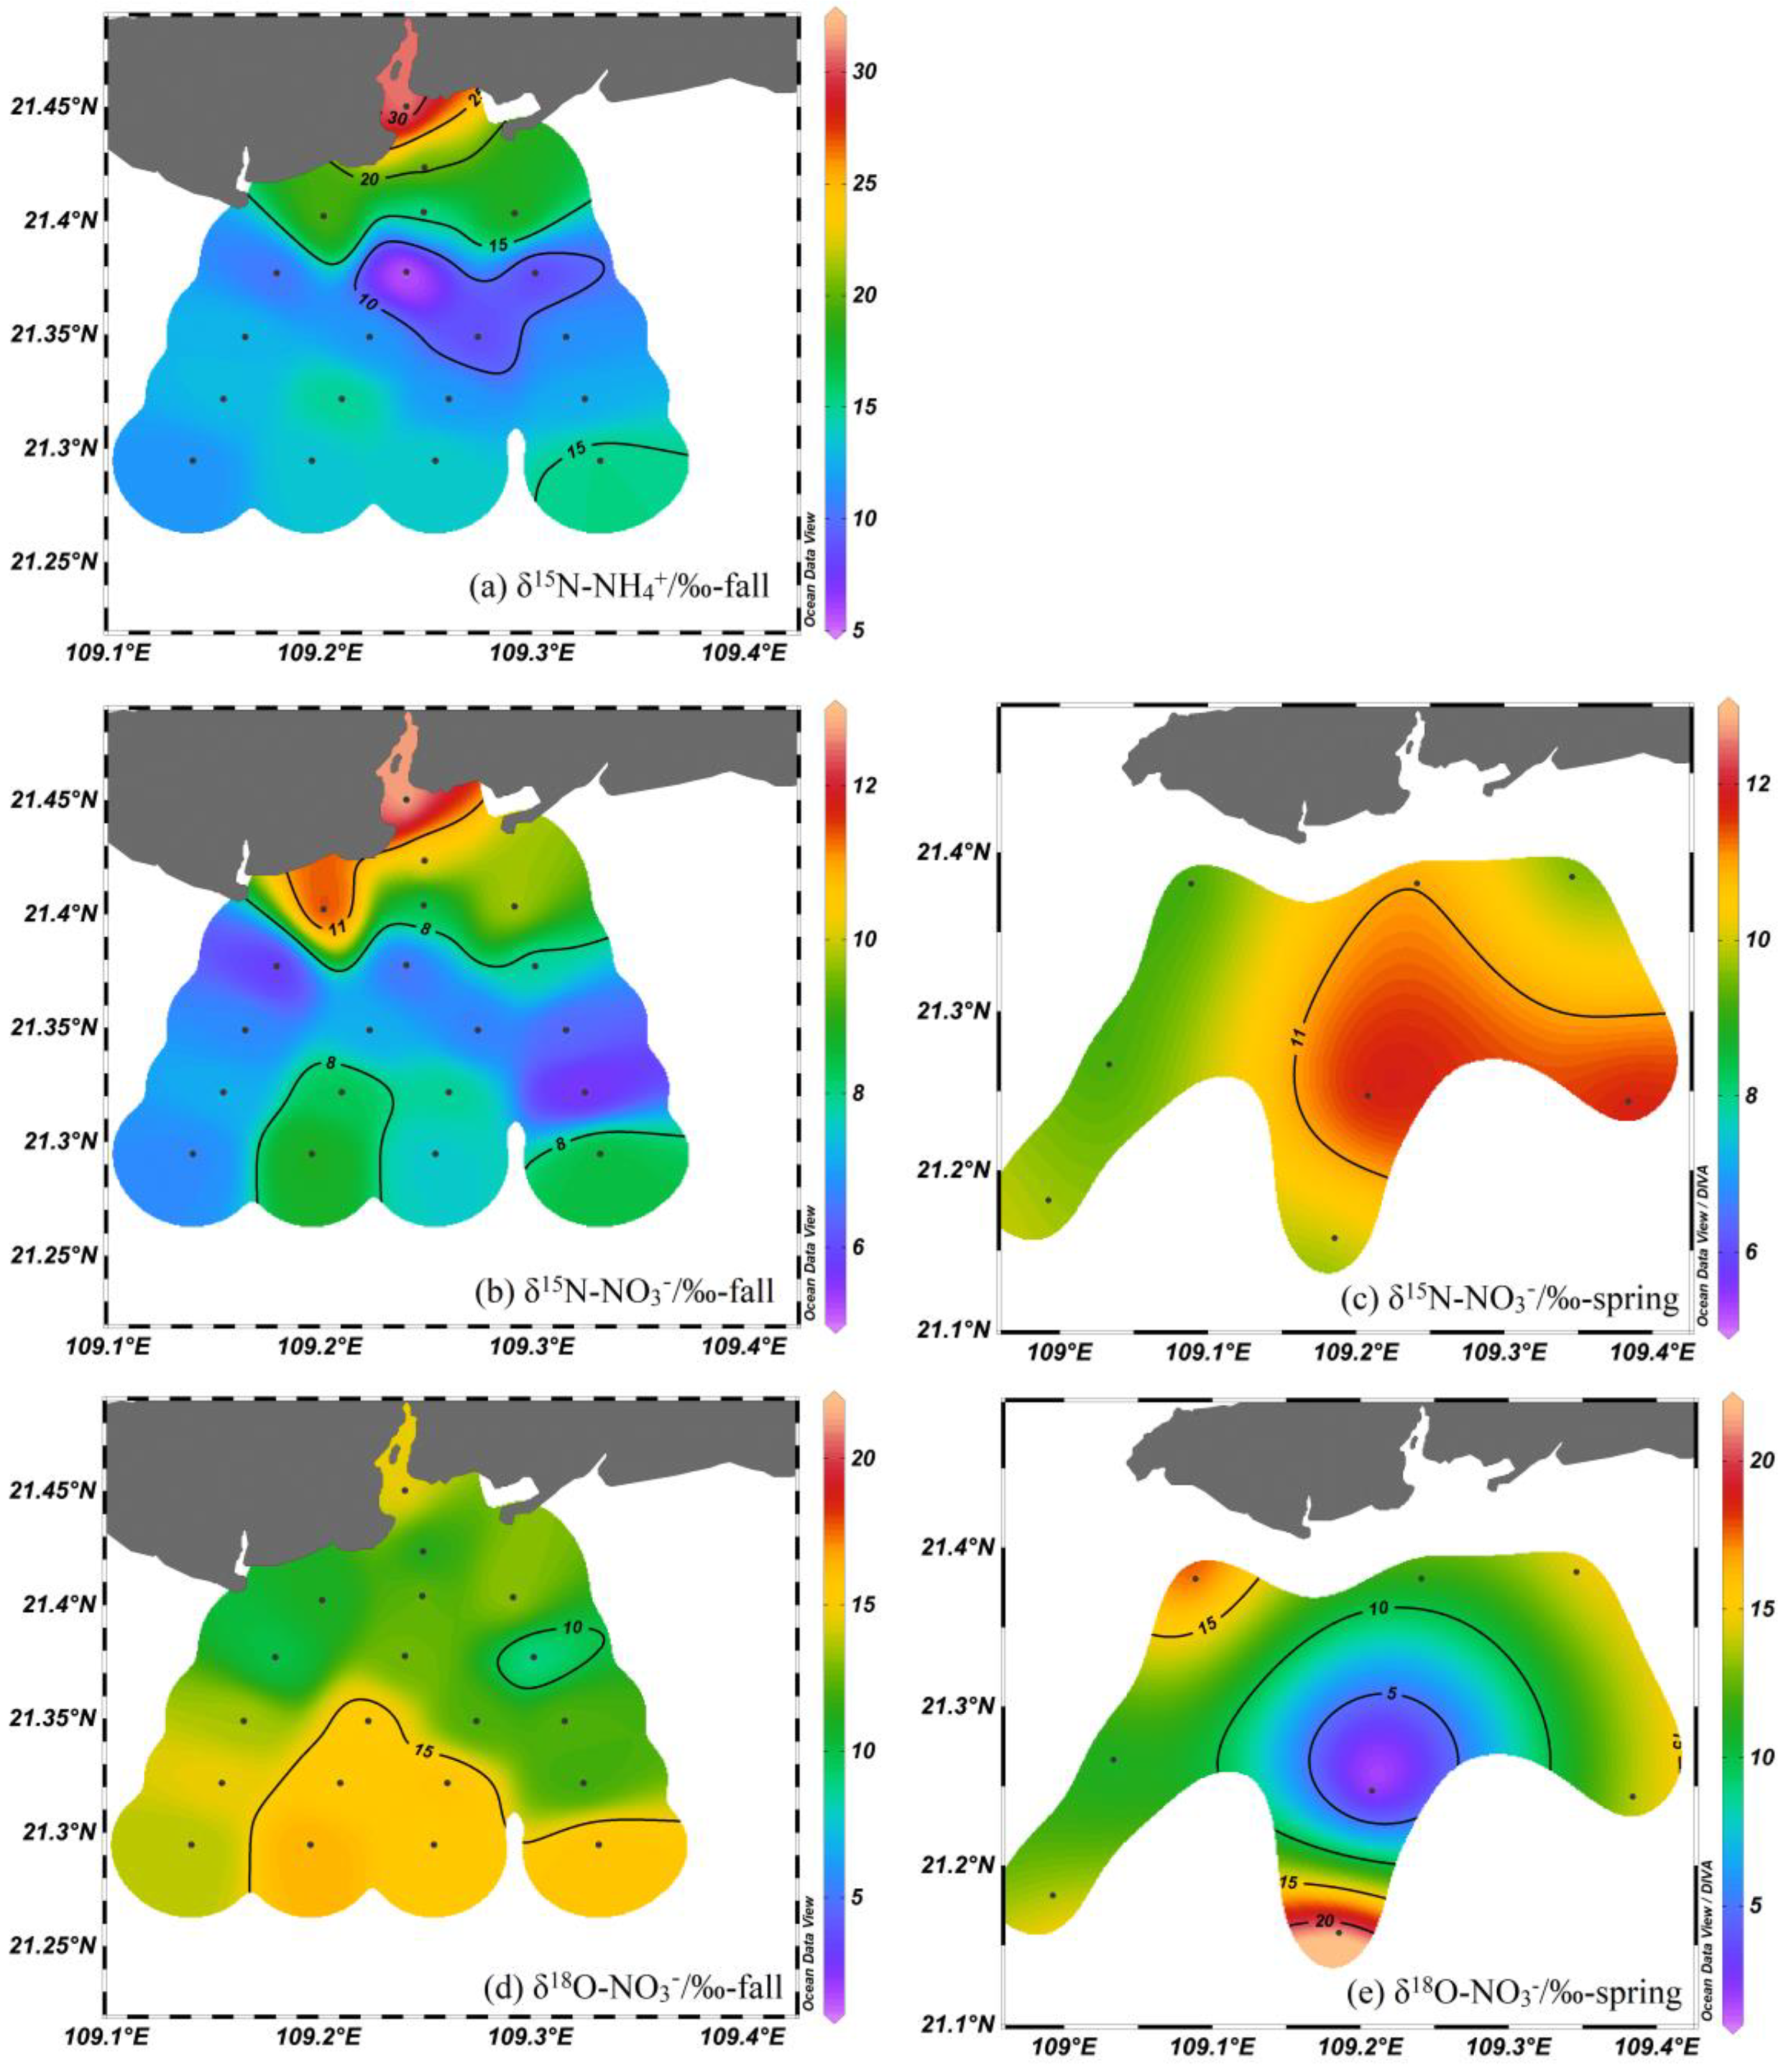
3.2. Isotopic Composition

During the fall, the δ15N-NO3, δ18O-NO3, and δ15N-NH4+ values ranged from 5.6‰ to 12.9‰ (with an average of 8.0‰), 8.8‰ to 16.4‰ (with an average of 13.3‰), and 5.3% to 31.5‰ (with an average of 14.0‰), respectively. As with the distributions of the nutrients, the highest δ15N-NO3 and δ15N-NH4+ values were found in the nearshore area, particularly at the top of the gulf, whereas relatively low values were recorded in the offshore area (Figure 4a,b). However, some relatively high δ15N-NO3 and δ15N-NH4+ values were recorded at a few stations in the offshore area. In contrast, the δ18O-NO3 values observed in the offshore area were relatively high (Figure 4d). The δ15N-NO3 values ranged from 9.21 to 11.72‰, and δ18O-NO3 values ranged from 11.07 to 21.48‰ during the spring. The variations of δ15N-NO3 from the nearshore to the offshore area are not obvious in the spring, and the values (average of 10.28‰) were higher than those in the fall (Figure 4). The values of δ18O-NO3 (average of 13.17‰) were similar to the fall.

4. Discussion

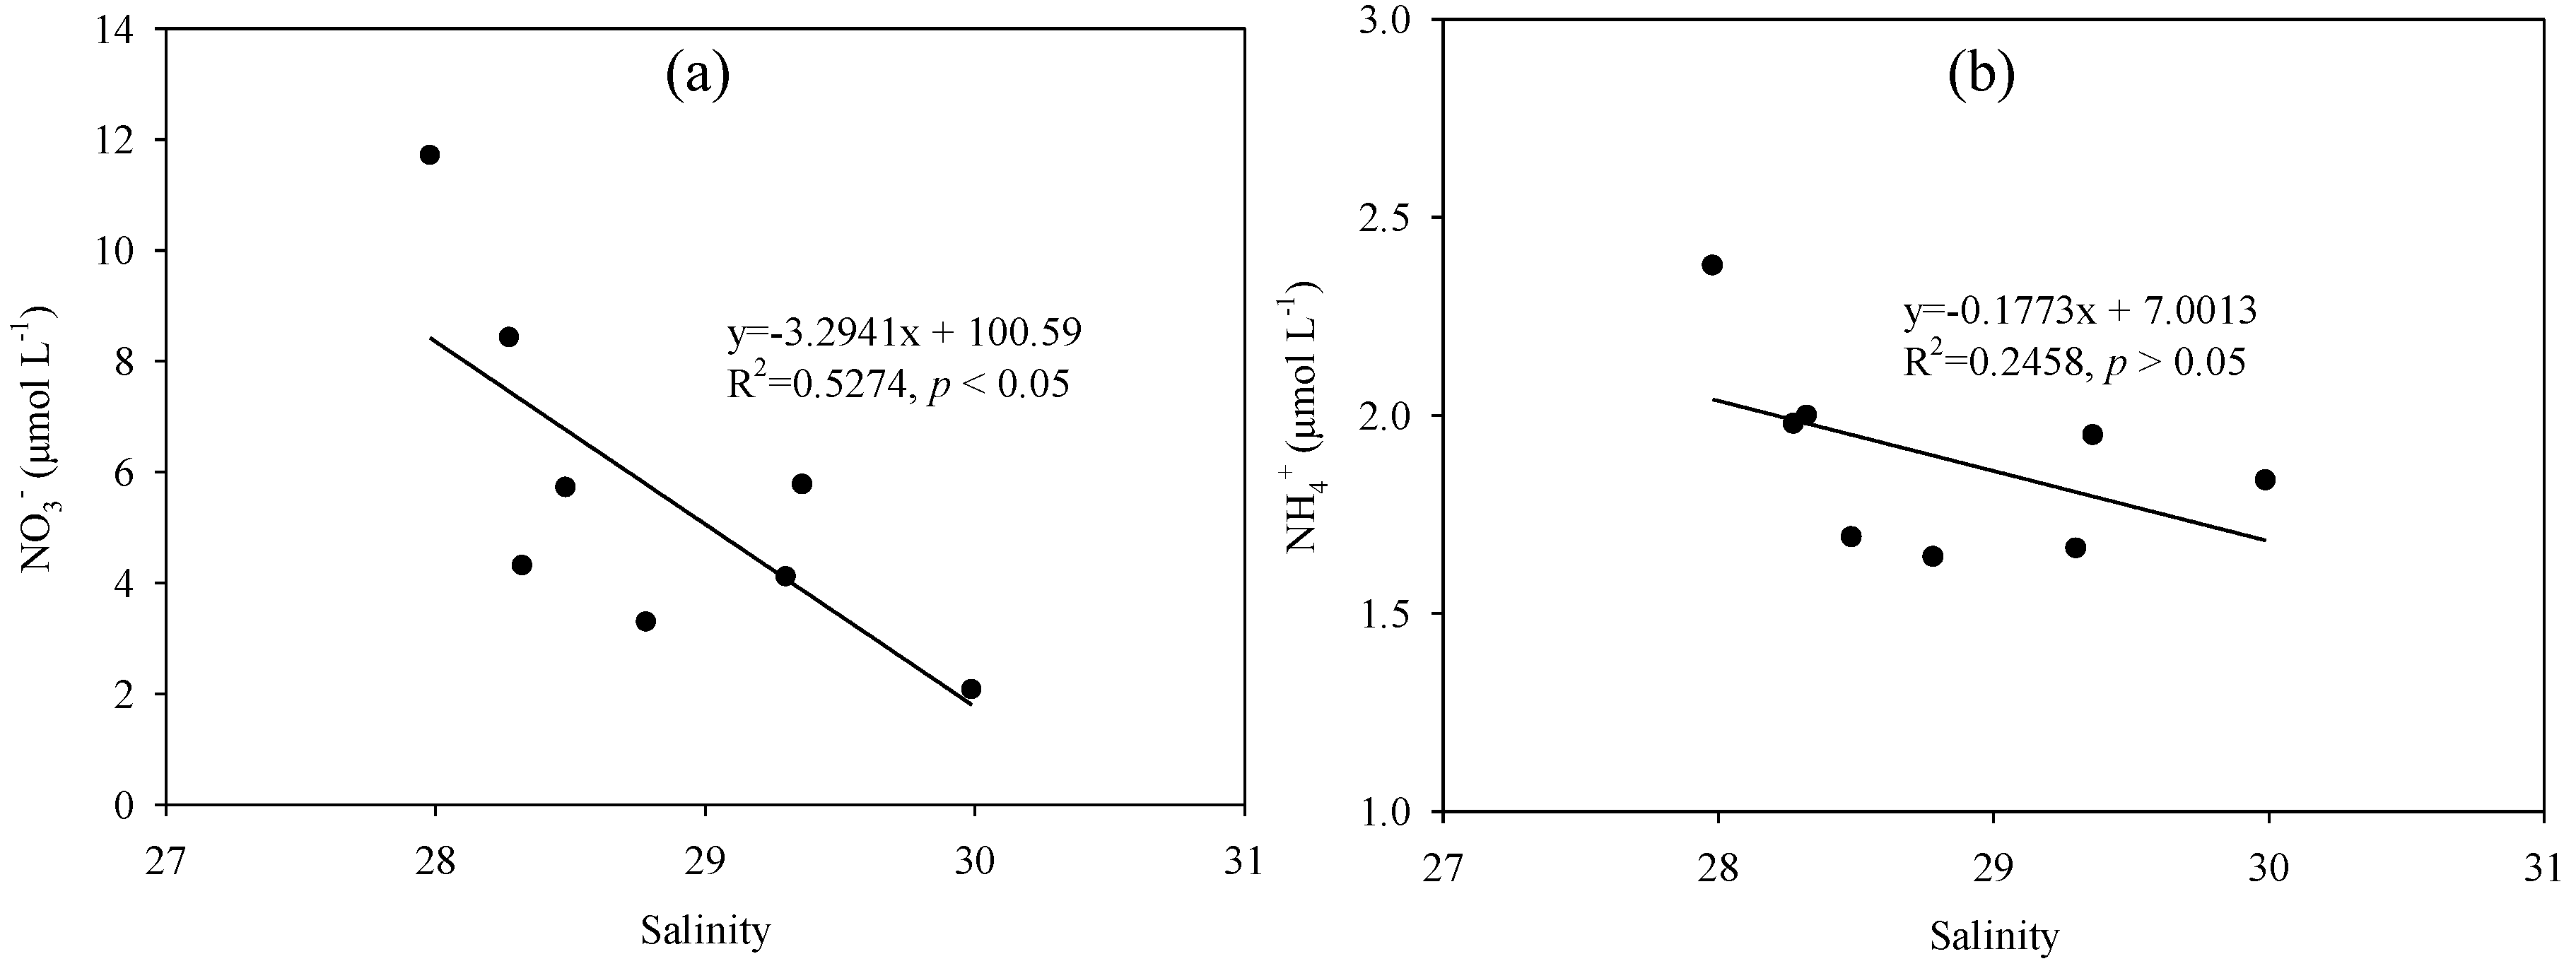
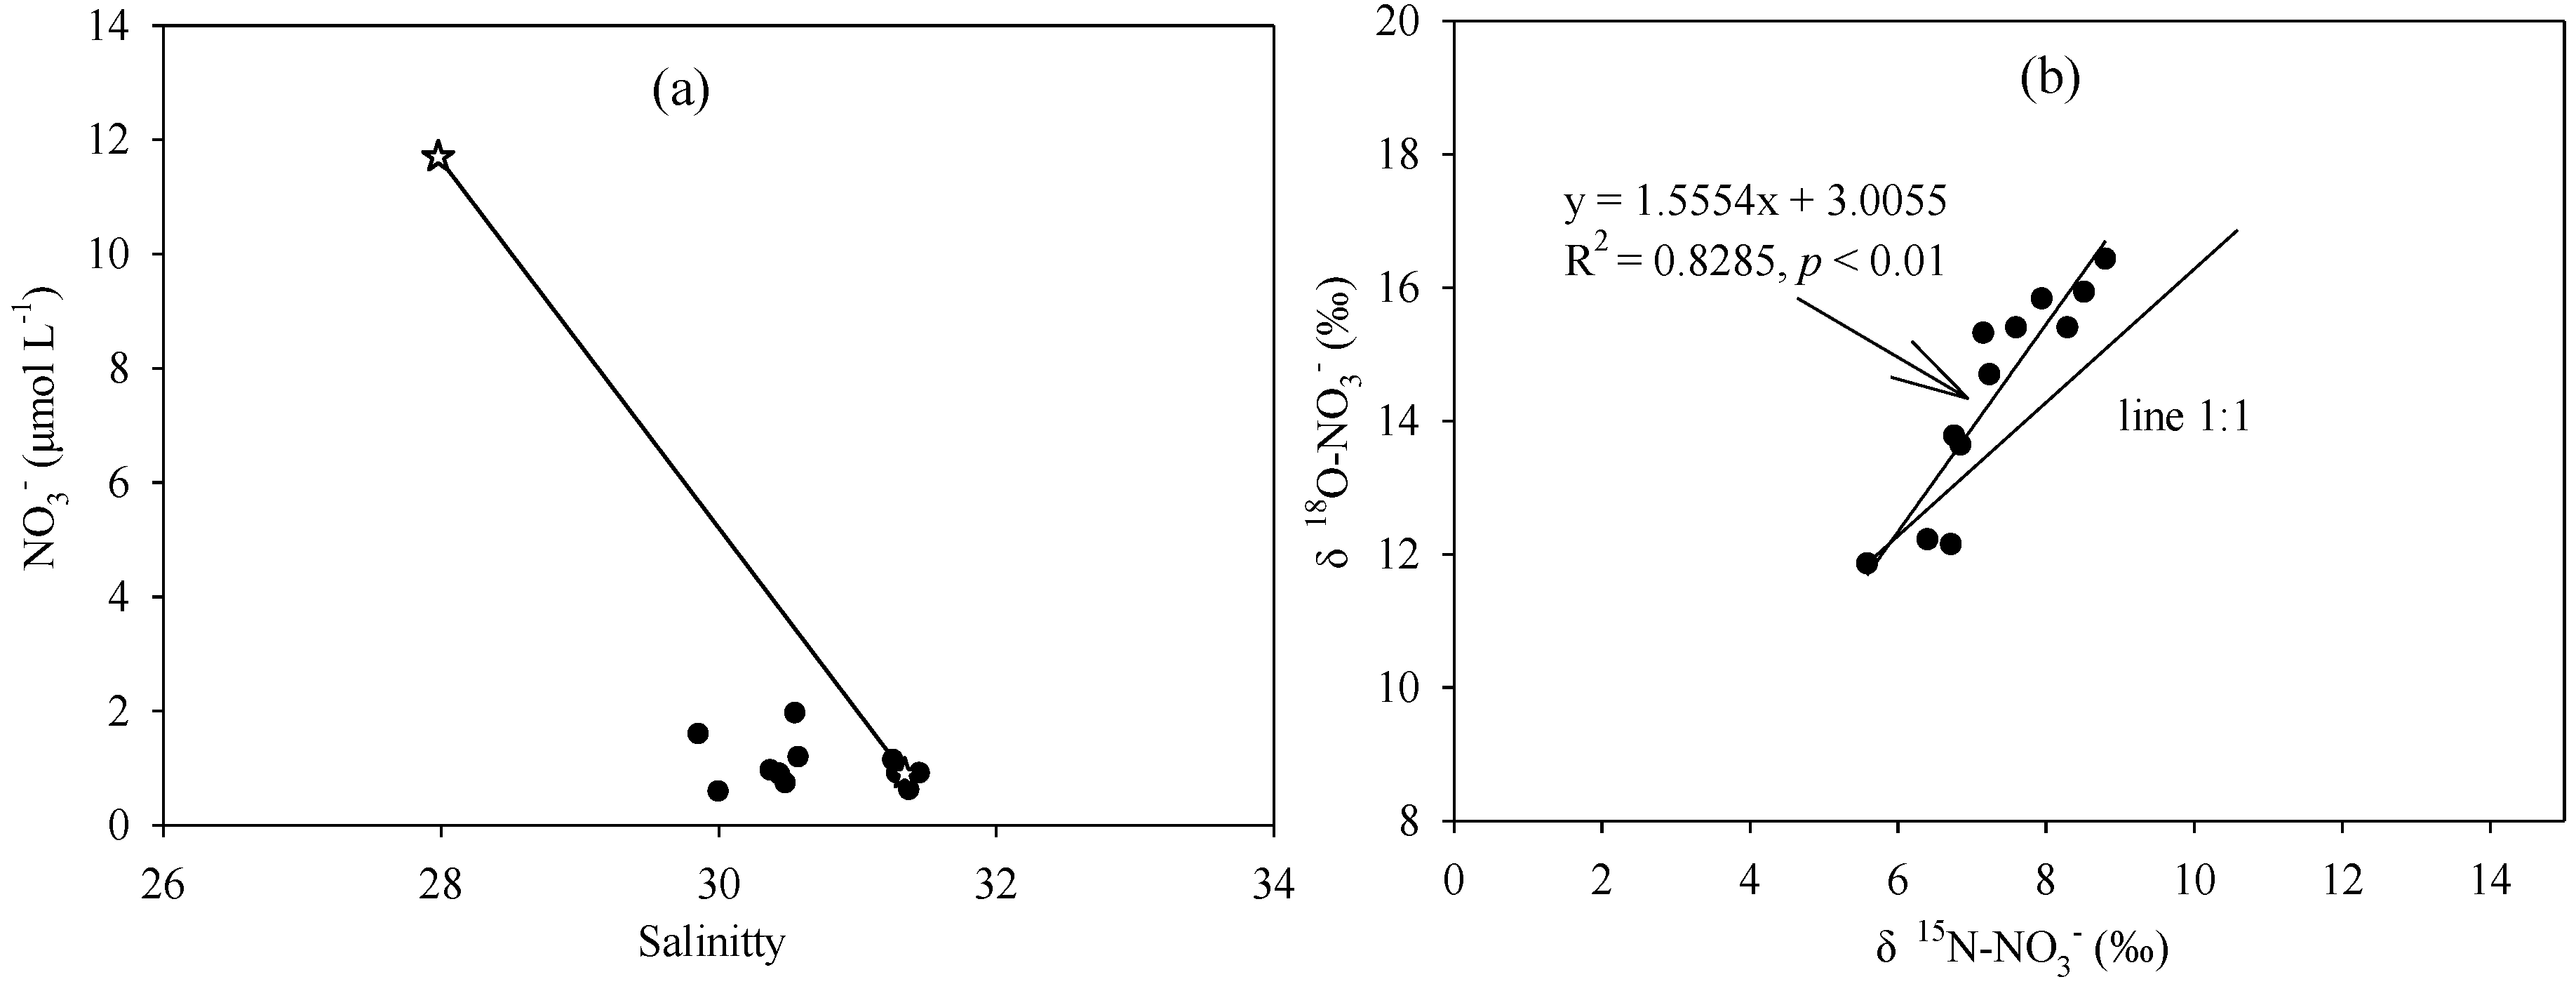
4.1. Hydrographic Characteristics

Figure 2 and Figure 3 show that there are clear differences in the hydrographic characteristics of the nearshore and offshore areas; the former had lower temperatures and salinity levels with higher nutrient concentrations, while higher temperatures and salinity and lower nutrient concentrations were recorded in the latter during both fall and spring. We believe that these water conditions in the nearshore area are mainly influenced by the diluted freshwater inputs from a nearby city. The distribution pattern seen in our study is similar to one seen in a previous study of that coastal city; the latter found that there were high nutrient concentrations in estuaries and coastal waters but low concentrations of the same further offshore [34,38]. We classified the sample sites into two zones, based on the distribution of hydrographic characteristics of the coastal area, to enable discussion of nutrient sources and dynamics. Figure 1 shows that zone 1, the nearshore area that included stations BH01 to BH08, B05, B02 and B08, was characterised by the influence of low temperature and salinity level and high nutrient concentrations from local terrestrial water discharge. The same figure shows that zone 2, the offshore area that included stations from BH09 to BH20, was characterised by high salinity and low nutrient concentrations.

4.2. Nutrient Sources in the Nearshore Area

In the nearshore area, the concentrations of DIN (8.1 μmol L−1 in the fall and 15.82 μmol L−1 in the spring) and PO43− (0.07 μmol L−1 in the fall and 0.11 μmol L−1 in the spring) were lower than those in other coastal areas of northern Beibu gulf, such as Qinzhou (19.3 μmol L−1 DIN, 0.41 μmol L−1 PO43−) and Fangchenggang (11.6 μmol L−1 DIN, 0.61 μmol L−1 PO43−) but were similar to conditions in Lianzhou Bay, Beihai (8.2 μmol L−1 DIN, 0.51 μmol L−1 PO43−) [34]. The dominant proportion of NO3-N in DIN varied from 50% to 71% (average of 64%) in the fall and from 53% to 76% (average of 65%) in the spring; followed by NH4-N, which varied from 16% to 44% (average of 27%) in the fall and from 15% to 32 (average of 22%) in the spring, and NO2-N, which varied from 7% to 15% (average of 9%) in the fall and from 3% to 18% (average of 12%) in the spring. Significantly low PO43− concentrations and high N/P ratios were recorded in the coastal area during both two seasons. However, the same measurements were significantly higher along the entirety of the coast of the Beibu Gulf (0.40 μmol L−1 PO43−, N/P ratio of 11) during the same period [34], suggesting that P acted as a limiting nutrient in this ecosystem and that the increase in P would be favourable for the proliferation of phytoplankton. In addition, there is a counter-wind current (a northeastward current) in the bottom layer in the Beibu Gulf during the winter boreal, and there will be an upwelling when it comes to the coastal Beibu Gulf [49]. Moreover, influenced by the southwestward current off the western coast of Guangdong, the high concentration of nutrients from the Pearl River Estuary may be brought into the Beibu Gulf via the westward current in the Qiongzhou Strait [23,50]. These processes may carry high concentrations of PO43, resulting in algal blooms due to P limits. Many red tides and phytoplankton bloom events, which are mainly caused by seasonal eutrophication, have been reported on the coast of Beihai City [51,52]. Moreover, the index of the nutritional status of those waters has increased significantly in recent years, and this was caused by the increased amounts of inorganic N and P present along the coastal area of the Beibu Gulf [34,37,38]. As both the highest nutrient levels and lowest salinity values all appeared in the nearshore area, we speculated that land-based pollution discharge from coastal cities may have been responsible for the former. This shows why it is important to trace nutrient biological processes and their sources in coastal areas.
Positive δ15N-NO3 and δ15N-NH4+ values and higher nutrient concentrations were observed in the nearshore area during the fall, while higher nutrient concentrations and higher δ15N-NO3 values were found during the spring (Figure 3 and Figure 4). Among the biological processes, the nitrification of NH4+ could increase NO3 concentrations and generate high δ15N-NH4+ values [9]. During the process of nitrification, the microorganisms preferentially used light N in the presence of excess NH4+, which would lead to heavier δ15N-NH4+ values in the residual NH4+ pool and add δ15N-NO3 depleted N to the NO3 pool [17,18], which contrasted with our results in the fall. This difference suggests that nitrification is unlikely to have caused the significantly positive δ15N-NO3 values during the fall in the nearshore area and that other processes or sources may therefore exist. Such high δ15N-NO3 can be caused by denitrification and/or assimilation in which the lighter isotope δ14N is preferentially consumed [18,29]. Denitrification generally leads to losses of N to the atmosphere as N2 or N2O [53]. Previous studies have reported evidence for significant nitrate loss in the water in the study area, and this loss could be directly influenced by denitrification in the sediments and pore water [9,17,54]. However, high DO values (which ranged from 5.94 to 6.96 mg L−1 with an average of 6.37 mg L−1) were observed throughout the nearshore area during the sampling period; such values do not favour the process of denitrification in the water column [9,17]. The process of elimination thus suggests that the assimilation of phytoplankton seems to be a likely explanation for the observations. Furthermore, a relatively high Chl a level (which ranged from 3.66 to 5.36 μg L−1) was observed in the nearshore area (Figure 2d), and an increase in phytoplankton would have resulted in a large quantity of nutrients being consumed. If assimilation was the major control on isotopic composition, the assimilative uptake along would cause δ15N-NO3 and δ18O-NO3 to increase at a rate of 1 [3,27]; however, the observed increase in the dual nitrate isotope is defined by a slope < 1 and a lack of correlation between these isotopes in the nearshore area (Figure 5). Such deviations suggest that phytoplankton assimilation is unlikely to be the dominant process increasing the isotopic composition of NO3, although the high δ15N-NH4+ values could likely have been caused by this process. Given sufficient NH4+ in the water along the coast, phytoplankton usually preferentially uptake this nutrient over nitrate due to the overall lower energy cost of the former process [9]. In this study, a relatively high NH4+ concentration was recorded in the nearshore area and residual NH4+ in the seawater was still not completely consumed by the phytoplankton. This suggested that the phytoplankton continued to assimilate NH4+ but not NO3 in the nearshore area, causing the elevated δ15N-NH4+ levels therein. Moreover, the relationship between NO3, NH4+, and salinity could further confirm that NO3 was a mixture of coastal discharge water and seawater although this was not true for NH4+ in the nearshore area (Figure 6). Therefore, biological processes may be responsible for the weaker relationship between NH4+ and salinity in the nearshore area, suggesting that the high δ15N-NO3 value may not have been caused by assimilation during the fall, although a high Chl a level was recorded in the nearshore area.
In the spring, higher nutrients were found in the nearshore area compared with that in the fall (Figure 3), which was similar to the distribution pattern of the coastal Beibu Gulf [34]. This suggested that there may be additional nutrients input in the nearshore area during spring. Land input may be an important factor causing the increase of nutrients in spring [34]. However, the rainfall in the spring (March and April, 251.9 mm) was relatively higher than that in the fall (October and November, 55.1 mm), and heavy rainfall could bring land-based pollutants into the nearshore environment. In addition, wind forcing can induce resuspension of sediments [33]. The surface water temperature in the spring (average of 22.9 °C) was lower than that in the fall (average of 25.1 °C), indicating that the water mixing was more uniform in the spring, which could re-suspend the bottom matter to the surface water. These processes increased the TSPM level, resulting in the TSPM and nutrient levels in the spring being higher than that in the fall. Similar to the fall, the isotope values (average of 9.94‰ for δ15N-NO3 and 14.48‰ for δ18O-NO3) were still high in the nearshore area during the spring. There could be several factors for higher dual nitrate isotope patterns observed, including assimilation, denitrification and intense physical sediment–water interaction, or other sources [55]. However, the influence of water denitrification could be ruled out as the factor of the higher dual nitrate isotope due to the high DO level (average of 7.42 mg L−1) in the nearshore area during spring. In addition, DIN assimilation by phytoplankton is unlikely to be the cause of the positive nitrate isotope in the spring, because a significantly low Chl a level (most below 1 μg L−1) was observed in the nearshore area. Thus, the physical sediment–water interaction may be responsible for the positive dual nitrate isotope in the nearshore area during spring. Previous studies suggested that the advection flux returning nitrate from the sediment to the overlying water, the δ15N-NO3 and δ18O-NO3 values of pore water are substantially high, which reflects more closely the enzyme level nitrate isotopic fractionation by denitrification [56,57]. Such a dynamic environment was previously reported in the Pearl River Estuary, particularly during the winter monsoon with severe mixing of water columns, and this nitrate exchange between sediments and water would finally lead to elevated dual nitrate isotope values but decreased nitrate concentration in the water column because of denitrification-induced isotopic enrichment in sediments [55]. However, nitrate concentrations were still high in the nearshore, indicating that other sources may occur in spring. The positive dual nitrate isotope and high nutrient levels in the nearshore area during the spring are possibly associated with municipal sewage effluents from Beihai City. Since nitrate from sewage is characterised by relatively high δ15N-NO3 (7‰ to 25‰) because of the volatilisation of depleted δ15N ammonia produced from human and animal waste, and this process leaves the residual nitrate enriched in isotope [3,21].
As NO3 was less affected by the biological processes in the fall, the isotopic characteristics may provide fingerprint information on the various sources that contributed to the mixture. As shown in Figure 5, the overall ranges of δ15N-NO3 and δ18O-NO3 in the nearshore area (which ranged from 5.8 to 12.9‰ for δ15N-NO3 and from 8.8 to 14.8‰ for δ18O-NO3) would seem to suggest–according to a classical dual nitrate isotope approach [21]–that manure and sewage (M&S) and soil N might be the dominant nitrate sources in this reach. Previous studies have proposed sewage effluent as a significant nitrate source in coastal areas [9,16,55,58]. Furthermore, in addition to the sources from M&S and soil N, the high δ18O-NO3 values could be partly influenced by atmospheric deposition and synthetic nitrate fertiliser (SNF) sources. However, the contribution from SNF can be eliminated readily as it only accounts for <2% of all fertiliser applied in China [17]. Moreover, the nitrogen fertiliser (NF) that is heavily applied as part of coastal agriculture may be running off into the water in that area [33]. Therefore, a Bayesian mixing model was applied to quantify the proportional contribution of the nitrate sources in the nearshore area. The δ15N-NO3 and δ18O-NO3 values of the potential sources are presented in Table 2. The results from the application of the model are presented in Figure 7; M&S was the predominant source of nitrate in the nearshore area (58%); it was followed by soil N (17%), NP (15%), and NF (10%). Thus, the high contribution of M&S may be responsible for the high δ15N-NO3 and δ15N-NH4+ values in the water of nearshore areas. This is because the isotope fingerprint of M&S is characterised by high values due to the volatilisation of 15N-depleted NH3 produced from human and animal waste [3,9]. This result is similar to that from the western coast of Guangdong Province, where nitrate sources originated mainly from local sewage inputs (53%) due to the rapid development of the local economy [16]. However, although NF is heavily applied in the agricultural practices of coastal cities [33], its contribution only accounts for 10% of the total used in the coastal area; this may be due to a lack of river input in the latter. The NF applied in catchment-based agriculture is transported to coastal waters by rivers [9,17].

4.3. Nitrate Biogeochemical Process in the Offshore Area

In the fall, the chemical compositions were characterised by high salinity values and significantly low nutrient concentrations in the offshore area (Figure 2 and Figure 3). The δ15N-NO3 and δ15N-NH4+ values ranged from 5.6‰ to 8.8‰ and 8.8‰ to 15.3‰ in the fall, respectively, and showed an increasing trend in the offshore area; however, these values were generally lower than those in the nearshore area (Figure 4). In addition, the distribution of NO3 concentrations in the offshore area was not conservative, their deviations from the calculated mixing line (Figure 8a). The highest NO3 concentrations fell below the mixing line, suggesting that NO3 loss or consumption occurred in the surface water in the offshore area and that the processes of denitrification and/or assimilation may be responsible. However, denitrification can be ruled out due to the significantly high levels of DO in the waters of the offshore area (Figure 2c). Thus, the increase in δ15N-NO3 and δ15N-NH4+ values could likely be caused by assimilation. DIN assimilation by phytoplankton could cause isotopic enrichment of residual NO3 and NH4+ [9], while the parallel increase in δ15N-NO3 and δ18O-NO3 values further confirm that assimilation occurred in the surface waters of the offshore area (Figure 8). Therefore, because assimilation could lead to an increase in δ15N-NO3 and δ18O-NO3 in the residual nitrate pool, the 18 ε:15 ε for this process is ~1 [27]. However, the slope of their linear relationship is ~1.56, and most of the δ15N-NO3 and δ18O-NO3 values are above the assimilation line (1:1 line) (Figure 8). This means that there may be other sources simultaneously contributing to nutrient levels in the offshore area. Atmospheric deposition may be the source of nitrate responsible for values above the assimilation line, considering that the extremely high δ18O-NO3 values were also observed in the surface waters of the offshore area (Figure 4d). Neither phytoplankton assimilation nor mixing with other water masses from surrounding water would be significant enough to cause δ18O-NO3 values greater than 10‰ [9,55]. Thus, such high δ18O-NO3 values are likely to be sourced from atmospheric deposition because the δ18O-NO3 values measured from atmospheric deposition in the South China Sea is >50‰ on average [22,60].
A simple steady-state isotope mass balance model was used to quantify the contribution of NO3 from atmospheric deposition in the offshore area. This model is based on nitrate anomalies and thus deviates from conservative mixing. Therefore, because of this, we assumed that the processes of assimilation and atmospheric deposition are responsible for the nitrate isotope anomalies. The equations used in our calculations are as follows:
△δ15N = δ15Natmosphere × Natmosphere/(Natmosphere + Nmixing) + 15εassimilation × fNO3,
△δ18O = δ18Oatmosphere × Natmosphere/(Natmosphere + Nmixing) + 18εassmilation × fNO3,
where △δ15N and △δ18O denote the dual nitrate isotope anomalies relative to the expected mixing values. Assimilation increases in δ15N-NO3 and δ18O-NO3 values (15ε = 18ε) [27]. Therefore, according to Equations (9) and (10):
△δ15N − △δ18O = (δ15Natmosphere − δ18Oatmosphere) × Natmosphere/(Natmosphere + Nmixing)
where we define Natmosphere/(Natmosphere + Nmixing) as fatmosphere, and obtained
fatmosphere = (△δ15N − △δ18O)/(δ15Natmosphere − δ18Oatmosphere)
where fatmosphere denotes the proportion of nitrate contributed by atmospheric deposition. More detailed information on this model can be found in Ye et al. [9]. In this model, the δ15N-NO3 and δ18O-NO3 values of atmospheric deposition (0.8 for δ15N-NO3 and 52.4 for δ18O-NO3 values) observed in the neighbourhood of the city in Zhanjiang were used [60]. Our estimates suggest that the proportion of nitrate from atmospheric deposition in the offshore area ranged from 1% to 11% with an average of 6%. The importance of atmospheric NO3 deposition for new production in the SCS has been suggested previously [9,16,22,23]. The nitrate source from atmospheric deposition in the nearshore area of the gulf was lower than that in the high-salinity waters in the outer area of PRE (17%) during winter [9]. This would occur particularly during the dry seasons (autumn and winter) when prevailing northern winds can carry anthropogenic pollutants such as those from industrial activities and fossil fuel combustion from mainland China to the SCS [9,60]. However, during transport, some atmospheric nutrients would gradually be deposited out of the air; this may be responsible for the slightly low contribution of atmospheric NO3 deposition in the offshore area (6%) compared to in the nearshore area (15%).
In the spring, higher concentrations (except for NO3) and positive δ15N-NO3 and δ18O-NO3 were still found in the offshore area (Figure 3 and Figure 4). Denitrification in the water column can also be ruled out as high DO levels (average of 7.46 mg L−1) were observed in the offshore area. Phytoplankton assimilation is also unlikely responsible for the elevated δ15N-NO3 and δ18O-NO3 values since there was no relationship between δ15N-NO3 and δ18O-NO3 values (y = −2.7586x + 41.321, R2 = 0.2093, p > 0.05) in the offshore area during the spring. In addition, higher NH4+ concentrations were found in the offshore area, and phytoplankton would preferentially uptake NH4+ over NO3 under sufficient NH4+ in the water column [9]. Since the terrestrial input has relatively little effect on the nutrients in the offshore area, the positive dual nitrate isotopes may be caused by the intense interaction between sediments and seawater. In this season, with wind-induced mixing and tidal pumping, tending to uniform mixing of the offshore seawater, which accelerated the exchange of sediment and water. This also resulted in the increase of TSPM concentration in the offshore area (average of 21.12 mg L−1 in spring, and higher than that of 15.59 mg L−1 in fall). Such a dynamic process would cause bidirectional exchange of solutes, including nitrate, between sediment pore water and the overlying water column, and causing elevated dual nitrate isotope values while decreased nitrate concentration in the water column because isotopic enrichment caused by denitrification in sediments [9]. Thus, the intense exchange of sediments and water in the offshore area was responsible for the higher concentration of other nutrients and the lower concentration of NO3.

5. Conclusions

Our study on stable isotopes of dissolved NO3 and NH4+ provided detailed information on seasonal nitrate sources and their biogeochemistry in the coastal area of the northeast Beibu Gulf. A high N/P ratio was recorded in the coastal bay during both fall and spring, suggesting that P was a limiting nutrient and indicating that increasing P would be favourable for algal blooms. In the nearshore area, the high concentrations of nutrients and δ15N-NO3 and δ15N-NH4+ values in the fall suggested that the former originated mainly from terrestrial pollution. A sufficient amount of NH4+ that could support biological processes was observed in the nearshore area owing to intensive human activities in that region. Therefore, the weak effect of biological processes on nitrate, and the characteristics of its isotopes, may provide fingerprint information in water mixed from various sources in the fall. The contributions of various potential NO3 sources were calculated using a Bayesian isotope mixing model, and its results showed that manure and sewage (58%) were the predominant sources of nitrate in the nearshore area in the fall, followed by soil N (17%), nitrogen in precipitation (15%), and nitrogen fertiliser (10%). In the spring, however, in addition to the impact of urban sewage effluents, the exchange of sediment and water was also responsible for causing higher nutrient concentrations and dual nitrate isotope values in the nearshore area. The lower nutrient concentrations and increased δ15N-NO3 and δ15N-NH4+ values observed in the offshore area in fall, suggested that the process of assimilation was responsible for the NO3 loss; however, the greater enrichment of δ18O-NO3 than δ15N-NO3 during the sampling period suggests that atmospheric deposition may also contribute to NO3 concentrations. In the spring, the exchange of sediment and water was the dominant factor causing higher other nutrient concentrations and positive dual nitrate isotope but lower NO3 concentration in the offshore area.

Author Contributions

Q.L. analyzed the data, and wrote the manuscript; J.G. conceived and designed the study, and collaborated in discussing the manuscript and modified the manuscript; G.L., Y.S., Q.S. and C.C. performed sample collection and contributed to the experiment and participated in the taking of measurements; F.C. helped perform the statistical analysis. All authors have read and agreed to the published version of the manuscript.

Funding

This research was funded by the National Natural Science Foundation of China (NO. 41966001), Guangxi Natural Science Foundation of China (NO. 2018GXNSFDA281031, 2020GXNSFBA297065), Opening Foundation of Key Laboratory of Environment Change and Resources Use in Beibu Gulf Ministry of Education (Nanning Normal University) and Guangxi Key Laboratory of Earth Surface Processes and Intelligent Simulation (Nanning Normal University) (NO. NNNu-KLoP-K1920), National Key Research and Development Plan (2016YFC1401403), Guangxi Science and Technology Major Project (Guike AA18118025), the China National Key Research and Development Plan Project (2016YFC1401403).

Institutional Review Board Statement

Not applicable.

Informed Consent Statement

Not applicable.

Data Availability Statement

The study did not report any data.

Acknowledgments

All authors thank the anonymous reviewers for constructive comments that helped improve this manuscript.

Conflicts of Interest

The authors declare no conflict of interest.

References

  1. Galloway, J.N. An earth-system perspective of the global nitrogen cycle. Nature 2008, 451, 293–296. [Google Scholar]
  2. Sharples, J.; Middelburg, J.J.; Fennel, K.; Jickells, T.D. What proportion of riverine nutrients reaches the open ocean? Glob. Biogeochem. Cycles 2017, 31, 39–58. [Google Scholar] [CrossRef] [Green Version]
  3. Yang, Z.; Chen, J.; Li, H.; Jin, H.; Gao, S.; Ji, Z.; Zhu, Y.; Ran, L.; Zhang, J.; Liao, Y. Sources of nitrate in xiangshan bay (China), as identified using nitrogen and oxygen isotopes. Estuar. Coast. Shelf Sci. 2018, 207, 109–118. [Google Scholar] [CrossRef]
  4. Wong, W.W.; Cartwright, I.; Chee Poh, S.; Cook, P. Sources and cycling of nitrogen revealed by stable isotopes in a highly populated large temperate coastal embayment. Sci. Total. Environ. 2022, 806, 150408. [Google Scholar] [CrossRef] [PubMed]
  5. Chen, F.; Lao, Q.; Zhang, S.; Bian, P.; Jin, G.; Zhu, Q.; Chen, C. Nitrate sources and biogeochemical processes identified using nitrogen and oxygen isotopes on the eastern coast of Hainan Island. Cont. Shelf Res. 2020, 207, 104209. [Google Scholar] [CrossRef]
  6. Howe, S.; Miranda, C.; Hayes, C.T.; Letscher, R.T.; Knapp, A.N. The Dual Isotopic Composition of Nitrate in the Gulf of Mexico and Florida Straits. J. Geophys. Res. Ocean. 2020, 125, e2020JC016047. [Google Scholar] [CrossRef]
  7. Moore, C.M.; Mills, M.M.; Arrigo, K.R.; Bermanfrank, I.; Bopp, L.; Boyd, P.W.; Galbraith, E.D.; Geider, R.J.; Guieu, C.; Jaccard, S.L. Processes and patterns of oceanic nutrient limitation. Nat. Geosci. 2013, 6, 701–710. [Google Scholar] [CrossRef] [Green Version]
  8. Seitzinger, S.P.; Kroeze, C.; Bouwman, A.F.; Caraco, N.; Dentener, F.; Styles, R.V. Global patterns of dissolved inorganic and particulate nitrogen inputs to coastal systems: Recent conditions and future projections. Estuaries 2002, 25, 640–655. [Google Scholar] [CrossRef]
  9. Ye, F.; Jia, G.; Xie, L.; Wei, G.; Xu, J. Isotope constraints on seasonal dynamics of dissolved and particulate n in the pearl river estuary, south china. J. Geophys. Res. Ocean. 2016, 121, 8689–8705. [Google Scholar]
  10. Yan, X.; Xu, M.N.; Wan, X.S.; Yang, J.Y.T.; Trull, T.W.; Dai, M.; Kao, S.J. Dual isotope measurements reveal zoning of nitrate processing in the summer Changjiang (Yangtze) River Plume. Geophys. Res. Lett. 2017, 44, 289–297. [Google Scholar] [CrossRef] [Green Version]
  11. Diaz, R.J.; Rosenberg, R. Spreading dead zones and consequences for marine ecosystems. Science 2008, 321, 926–929. [Google Scholar] [CrossRef] [PubMed]
  12. Guo, X.; Morimoto, A.; Zhou, F.; Yoshie, N.; Damar, A.; Takikawa, T. Coastal ecosystem change in Asia: Hypoxia, eutrophication, and nutrient conditions. J. Oceanogr. 2021, 90. [Google Scholar] [CrossRef]
  13. Geeraert, N.; Archana, A.; Xu, M.N.; Kao, S.J.; Bake, D.M.; Thibodeau, B. Investigating the link between Pearl River-induced eutrophication and hypoxia in Hong Kong shallow coastal waters. Sci. Total. Environ. 2021, 772, 145007. [Google Scholar] [CrossRef]
  14. Liu, X.; Stock, C.A.; Dunne, J.P.; Lee, M.; Shevliakova, E.; Malyshev, S.; Milly, P.C.D. Simulated Global Coastal Ecosystem Responses to a Half-Century Increase in River Nitrogen Loads. Geophys. Res. Lett. 2021, 48, e2021GL094367. [Google Scholar] [CrossRef]
  15. Li, J.; Cao, R.; Lao, Q.; Chen, F.; Chen, C.; Zhou, X.; Meng, Y.; Zhu, Q. Assessing seasonal nitrate contamination by nitrate dual isotopes in a monsoon-controlled bay with intensive human activities in South China. Int. J. Environ. Res. Public Health 2020, 17, 1921. [Google Scholar] [CrossRef] [PubMed] [Green Version]
  16. Blake, R.E.; O’Neil, J.R.; Surkov, A.V. Biogeochemical cycling of phosphorus: Insights from oxygen isotope effects of phosphoenzymes. Am. J. Sci. 2005, 305, 596–620. [Google Scholar] [CrossRef]
  17. Chen, F.J.; Jia, G.D.; Chen, J.Y. Nitrate sources and watershed denitrification inferred from nitrate dual isotopes in the Beijiang River, South China. Biogeochemistry 2009, 94, 163–174. [Google Scholar] [CrossRef]
  18. Sigman, D.M.; Granger, J.; Difiore, P.J.; Lehmann, M.F.; Ho, R.; Cane, G.; Geen, A.V. Coupled nitrogen and oxygen isotope measurements of nitrate along the eastern North Pacific margin. Glob. Biogeochem. Cycles 2005, 19, GB4022. [Google Scholar] [CrossRef]
  19. Wankel, S.D.; Kendall, C.; Pennington, J.T.; Chavez, F.P.; Paytan, A. Nitrification in the euphotic zone as evidenced by nitrate dual isotopic composition: Observations from monterey bay, california. Glob. Biogeochem. Cycles 2007, 21, GB2009. [Google Scholar] [CrossRef] [Green Version]
  20. Kendall, C. Tracing nitrogen sources and cycling in catchments. In Isotope Tracers in Catchment Hydrology; Kendall, C., McDonnel, J.J., Eds.; Elsevier: New York, NY, USA, 1998; pp. 519–576. [Google Scholar]
  21. Xue, D.; Botte, J.; Baets, B.D.; Accoe, F.; Nestler, A.; Taylor, P.; Cleemput, O.V.; Berglund, M.; Boeckx, P. Present limitations and future prospects of stable isotope methods for nitrate source identification in surface- and groundwater. Water Res. 2009, 43, 1159–1170. [Google Scholar] [CrossRef] [PubMed]
  22. Yang, J.Y.T.; Hsu, S.C.; Dai, M.; Hsiao, S.S.Y.; Kao, S.J. Isotopic composition of water-soluble nitrate in bulk atmospheric deposition at dongsha island: Sources and implications of external n supply to the northern south china sea. Biogeosciences 2014, 11, 9661–9695. [Google Scholar] [CrossRef] [Green Version]
  23. Lao, Q.; Chen, F.; Liu, G.; Chen, C.; Jin, G.; Zhu, Q.; Wei, C.; Zhang, C. Isotopic evidence for the shift of nitrate sources and active biological transformation on the western coast of guangdong province, south china. Mar. Pollut. Bull. 2019, 142, 603–612. [Google Scholar] [CrossRef] [PubMed]
  24. Moore, J.W.; Semmens, B.X. Incorporating uncertainty and prior information into stable isotope mixing models. Ecol. Lett. 2008, 11, 470–480. [Google Scholar] [CrossRef] [PubMed]
  25. Xue, D.; De Baets, B.; Van Cleemput, O.; Hennessy, C.; Berglund, M.; Boeckx, P. Use of a Bayesian isotope mixing model to estimate proportional contributions of multiple nitrate sources in surface water. Environ. Pollut. 2012, 161, 43–49. [Google Scholar] [CrossRef] [PubMed]
  26. Zhang, M.; Zhi, Y.; Shi, J.; Wu, L. Apportionment and uncertainty analysis of nitrate sources based on the dual isotope approach and a bayesian isotope mixing model at the watershed scale. Sci. Total. Environ. 2018, 639, 1175–1187. [Google Scholar] [CrossRef] [PubMed]
  27. Granger, J.; Sigman, D.M.; Needoba, J.A.; Harrison, P.J. Coupled nitrogen and oxygen isotope fractionation of nitrate during assimilation by cultures of marine phytoplankton. Limnol. Oceanogr. 2004, 49, 1763–1773. [Google Scholar] [CrossRef] [Green Version]
  28. Sigman, D.M.; Robinson, R.; Knapp, A.N.; Geen, A.V.; Mccorkle, D.C.; Brandes, J.A.; Thunell, R.C. Distinguishing between water column and sedimentary denitrification in the santa barbara basin using the stable isotopes of nitrate. Geochem. Geophys. 2003, 4, 1–20. [Google Scholar] [CrossRef] [Green Version]
  29. Granger, J.; Sigman, D.M.; Lehmann, M.F.; Tortell, P.D. Nitrogen and oxygen isotope fractionation during dissimilatory nitrate reduction by denitrifying bacteria. Limnol. Oceanogr. 2008, 53, 2533–2545. [Google Scholar] [CrossRef]
  30. Chen, F.; Chen, J.; Jia, G.; Jin, H.; Jie, X.; Zhi, Y.; Zhuang, Y.; Liu, X.; Zhang, H. Nitrate δ 15N and δ 18 O evidence for active biological transformation in the changjiang estuary and the adjacent east china sea. Acta Oceanol. Sin. 2013, 32, 11–17. [Google Scholar]
  31. Chen, F.; Lin, J.; Qian, B.; Wu, Z.; Huang, P.; Chen, K.; Li, T.; Cai, M. Geochemical assessment and spatial analysis of heavy metals in the surface sediments in the eastern beibu gulf: A reflection on the industrial development of the south china coast. Int. J. Environ. Res. Public Health 2018, 15, 496. [Google Scholar] [CrossRef] [PubMed] [Green Version]
  32. Gan, H.; Lin, J.; Liang, K.; Xia, Z. Selected trace metals (as, cd and hg) distribution and contamination in the coastal wetland sediment of the northern Beibu Gulf, South China Sea. Mar. Pollut. Bull. 2013, 66, 252–258. [Google Scholar] [CrossRef]
  33. Kaiser, D.; Unger, D.; Qiu, G. Particulate organic matter dynamics in coastal systems of the northern beibu gulf. Cont. Shelf Res. 2014, 82, 99–118. [Google Scholar] [CrossRef]
  34. Lai, J.; Jiang, F.; Ke, K.; Xu, M.; Lei, F.; Chen, B. Nutrients distribution and trophic status assessment in the northern beibu gulf, China. Chin. J. Oceanol. Limnol. 2014, 32, 1128–1144. [Google Scholar] [CrossRef]
  35. Lao, Q.; Su, Q.; Liu, G.; Shen, Y.; Chen, F.; Lei, X.; Qing, S.; Wei, C.; Zhang, C.; Gao, J. Spatial distribution of and historical changes in heavy metals in the surface seawater and sediments of the beibu gulf, China. Mar. Pollut. Bull. 2019, 146, 427–434. [Google Scholar] [CrossRef] [PubMed]
  36. Yang, J.; Wang, W.; Zhao, M.; Chen, B.; Dada, O.A.; Chu, Z. Spatial distribution and historical trends of heavy metals in the sediments of petroleum producing regions of the beibu gulf, China. Mar. Pollut. Bull. 2015, 91, 87–95. [Google Scholar] [PubMed]
  37. Yang, J.; Zhang, R.; Zhao, Z.; Weng, S.; Fenghua, L.I. Temporal and spatial distribution characteristics of nutrients in the coastal seawater of guangxi beibu gulf during the past 25 years. Ecol. Environ. Sci. 2015, 24, 1493–1498. (In Chinese) [Google Scholar]
  38. Lao, Q.; Liu, G.; Shen, Y.; Su, Q.; Lei, X. Biogeochemical processes and eutrophication status of nutrients in the northern Beibu Gulf, South China. J. Earth Syst. Sci. 2021, 130, 199. [Google Scholar] [CrossRef]
  39. Li, N.; Chen, X.; Zhao, H.; Tang, J.; Jiang, G.; Li, Z.; Li, X.; Chen, S.; Zou, S.; Dong, K.; et al. Spatial distribution and functional profile of the bacterial community in response to eutrophication in the subtropical Beibu Gulf, China. Mar. Pollut. Bull. 2020, 161, 111742. [Google Scholar]
  40. Zeng, J.; Chen, M.; Zheng, M.; Qiu, Y.; He, W.; He, Y.; Liu, X. Effects of particles on potential denitrification in the coastal waters of the Beibu Gulf in China. Sci. Total. Environ. 2018, 624, 1274–1286. [Google Scholar] [CrossRef] [PubMed]
  41. Xu, Y.; Zhang, T.; Zhou, J. Historical occurrence of algal blooms in the northern Beibu Gulf of china and implications for future trends. Front. Microbiol. 2019, 10, 451. [Google Scholar]
  42. Chen, B.; Dong, D.; Qin, X.; Xu, M.; Chen, X.; Shi, M. Relationship between the occurrence of red tides and the dynamic response mechanisms in the northern Beibu Gulf. J. Coast. Res. 2019, 93, 185–193. [Google Scholar] [CrossRef]
  43. Lao, Q.; Liu, G.; Zhou, X.; Chen, F.; Zhang, S. Sources of polychlorinated biphenyls (pcbs) and dichlorodiphenyltrichloroethanes (DDTs) found in surface sediment from coastal areas of Beibu Gulf: A reflection on shipping activities and coastal industries. Mar. Pollut. Bull. 2021, 167, 112318. [Google Scholar] [CrossRef]
  44. Lao, Q.; Liu, G.; Shen, Y.; Su, Q.; Gao, J.; Chen, F. Distribution characteristics and fluxes of nutrients in the rivers of the Beibu Gulf. Haiyang Xuebao 2020, 42, 93–100. (In Chinese) [Google Scholar]
  45. McIlvin, M.R.; Altabet, M.A. Chemical conversion of nitrate and nitrite to nitrous oxide for nitrogen and oxygen isotopic analysis in freshwater and seawater. Anal. Chem. 2005, 77, 5589–5595. [Google Scholar] [CrossRef]
  46. Zhang, L.; Altabet, M.A.; Wu, T.; Hadas, O. Sensitive measurement of nh4+ 15n/14n (delta 15nh4+) at natural abundance levels in fresh and saltwaters. Anal. Chem. 2007, 79, 5297–5303. [Google Scholar] [CrossRef] [PubMed]
  47. Fry, B. Conservative mixing of stable isotopes across estuarine salinity gradients: A conceptual framework for monitoring watershed influences on downstream fisheries production. Estuaries 2002, 25, 264–271. [Google Scholar] [CrossRef]
  48. Dähnke, K.; Bahlmann, E.; Emeis, K. A nitrate sink in estuaries? An assessment by means of stable nitrate isotopes in the elbe estuary. Limnol. Oceanogr. 2008, 53, 1504–1511. [Google Scholar] [CrossRef] [Green Version]
  49. Gao, J.; Wu, G.; Nguyen, K.-C.; Shi, M. Counter-wind deep current in the northern beibu gulf in boreal winter. J. Ocean. Univ. China 2019, 18, 57–68. [Google Scholar] [CrossRef]
  50. Gao, J.; Wu, G.; Ya, H. Review of the circulation in the beibu gulf, South China Sea. Cont. Shelf Res. 2017, 138, 106–119. [Google Scholar] [CrossRef]
  51. Li, B.; Lan, W.L.; Li, T.S.; Li, M.M. Variation of environmental factors during phaeocystis globosa blooms and its implications for the bloom decay. Chin. J. Ecol. 2015, 34, 1351–1358. [Google Scholar]
  52. Li, T.-S. Analyze red tide with automatic monitoring system of water quality in Lianzhou Gulf. Environ. Monit. China 2011, 27, 35–38. [Google Scholar]
  53. Herbert, R.A. Nitrogen cycling in coastal marine ecosystems. FEMS Microbiol. Rev. 1999, 23, 563–590. [Google Scholar] [CrossRef] [PubMed]
  54. Dai, M.; Guo, X.; Zhai, W.; Yuan, L.; Wang, B.; Wang, L.; Cai, P.; Tang, T.; Cai, W.J. Oxygen depletion in the upper reach of the Pearl River estuary during a winter drought. Mar. Chem. 2006, 102, 159–169. [Google Scholar] [CrossRef]
  55. Ye, F.; Ni, Z.; Xie, L.; Wei, G.; Jia, G. Isotopic evidence for the turnover of biological reactive nitrogen in the pearl river estuary, South China. J. Geophys. Res. Biogeosciences 2015, 120, 661–672. [Google Scholar] [CrossRef]
  56. Wankel, S.D.; Kendall, C.; Paytan, A. Using nitrate dual isotopic composition (δ15n and δ18o) as a tool for exploring sources and cycling of nitrate in an estuarine system: Elkhorn slough, california. J. Geophys. Res. Biogeosci. 2015, 114, 315–327. [Google Scholar]
  57. Lehmann, M.F.; Sigman, D.M.; Mccorkle, D.C.; Granger, J.; Hoffmann, S.; Cane, G.; Brunelle, B.G. The distribution of nitrate 15n/14n in marine sediments and the impact of benthic nitrogen loss on the isotopic composition of oceanic nitrate. Geochim. Et Cosmochim. Acta 2007, 71, 5384–5404. [Google Scholar] [CrossRef]
  58. Dai, M.; Wang, L.; Guo, X.; Zhai, W.; Li, Q.; He, B.; Kao, S.J. Nitrification and inorganic nitrogen distribution in a large perturbed river/estuarine system: The Pearl River Estuary, China. Biogeosciences 2008, 5, 1227–1244. [Google Scholar] [CrossRef] [Green Version]
  59. Silva, S.R.; Ging, P.B.; Lee, R.W.; Ebbert, J.C.; Tesoriero, A.J.; Inkpen, E.L. Forensic applications of nitrogen and oxygen isotopes in tracing nitrate sources in urban environments. Environ. Forensics 2002, 3, 125–130. [Google Scholar] [CrossRef]
  60. Chen, F.; Lao, Q.; Jia, G.; Chen, C.; Zhu, Q.; Zhou, X. Seasonal variations of nitrate dual isotopes in wet deposition in a tropical city in China. Atmos. Environ. 2019, 196, 1–9. [Google Scholar] [CrossRef]
Figure 1. Location of the Beibu Gulf and sampling stations. The dashed black line in the upper figure separates the coastal area from the outer area.
Jmse 09 01123 g001
Figure 2. Spatial distributions of (a,b) salinity, (c,d) temperature, (e,f) Chl a, (g,h) DO, and (i,j) TSPM during the different seasons in the north-east Beibu Gulf, China.
Jmse 09 01123 g002
Figure 3. Spatial distributions of (a,b) PO43−, (c,d) NO2, (e,f) NO3, and (g,h) NH4+, during the different seasons in the north-eastern Beibu Gulf, China.
Jmse 09 01123 g003
Figure 4. Spatial distributions of (a) δ15N-NH4+, (b,c) δ15N-NO3, and (d,e) δ18O-NO3 during the different seasons in the north-eastern Beibu Gulf, China.
Jmse 09 01123 g004
Figure 5. Range of δ15N-NO3 and δ18O-NO3 values present in seawater samples from the nearshore area of the north-eastern Beibu Gulf in the fall and various nitrate source reservoirs (a). The isotopic data of potential sources of nitrate including N fertiliser (NF), manure and sewage (M&S), and soil N are from Xue et al. [21]; and data on N in precipitation (NP) in northern South China Sea and synthetic N fertiliser (SNF) are from Yang et al. [22] and Silva et al. [59], respectively. The inset in the upper-hand right corner shows the relationship between δ15N-NO3 and δ18O-NO3 values in the nearshore area. Denitrification and/or N assimilation would cause the δ15N and δ18O values of nitrate to increase along a curve with a slope of 1:1 (b).
Jmse 09 01123 g005
Figure 6. Linear relationship of NO3-salinity (a) and NH4+-salinity (b) in the nearshore area during the fall.
Jmse 09 01123 g006
Figure 7. The proportional contribution of potential sources of nitrate in the water of the nearshore area in the fall, including soil N, manure and sewage (M&S), nitrogen fertiliser (NF) and nitrate in precipitation (NP).
Jmse 09 01123 g007
Figure 8. (a) NO3concentrations as a function of salinity in the offshore area. The solid line is the mixing line calculated for endmembers defined by stations BH01 and BH20; (b) the relationship between δ15N-NO3 and δ18O-NO3 values in the offshore area. The slope of the line = 1.
Jmse 09 01123 g008
Table 1. Endmember parameters, including salinity, nutrient concentrations and dual nitrate isotope values, used in the two-endmember mixing model in Equations (5)–(7). Station BH01 represents water at the head of nearshore areas and station BH20 represents water carried into coastal areas from the water further out to sea.
StationSalinityPO43− [μmol L−1]NH4+ [μmol L−1]NO2 [μmol L−1]NO3 [μmol L−1]δ15N-NO3 [‰]δ18O-NO3 [‰]
BH0127.980.072.41.211.712.914.8
BH2031.450.050.60.30.98.515.9
Table 2. The values of δ15N-NO3 and δ18O-NO3 values for potential sources of nitrate in the nearshore area.
δ15N-NO3δ18O-NO3
SourceRangeAverage ± SDReferenceRangeAverage ± SDReference
Soil N−0.05–8.254.52 ± 2.67[20,26]−5–154.08 ± 0.33[20,26]
M&S6.89–18.8812.73 ± 3.4[20,26]−5–154.08 ± 0.33[20,26]
NF−1.87–2.960.04 ± 1.87[20,26]−5–154.08 ± 0.33[20,26]
NP−1.8– 4.10.8 ± 1.5[60]42.7–61.652.4 ± 5.1[60]
Publisher’s Note: MDPI stays neutral with regard to jurisdictional claims in published maps and institutional affiliations.

