Article

Factors Influencing Dietary Changes of Walleye Pollock, Gadus chalcogrammus, Inhabiting the East Sea off the Korean Coast

1
Dokdo Research Center, East Sea Research Institute, Korea Institute of Ocean Science & Technology, Uljin 36315, Korea
2
Fisheries Resources and Environment Research Division, East Sea Fisheries Research Institute, National Institute of Fisheries Science, Gangeneung 25435, Korea
3
Department of Marine Bioscience, Gangneung-Wonju National University, Gangneung 25457, Korea
*
Author to whom correspondence should be addressed.
J. Mar. Sci. Eng. 2021, 9(11), 1154; https://doi.org/10.3390/jmse9111154
Submission received: 16 September 2021 / Revised: 16 October 2021 / Accepted: 17 October 2021 / Published: 20 October 2021

Abstract

:
This study examined the dietary patterns of walleye pollock, Gadus chalcogrammus, off the middle eastern coast of Korea between January 2016 and December 2017 to determine the influences of various predictors on dietary changes. Based on stomach content analyses, walleye pollock was found to be a demersal carnivore that mainly consumes carid shrimps, euphausiids, mysids, teleosts, and cephalopods. The main prey species identified in the diets of walleye pollock were Euphausia pacifica (euphausiids), Themisto japonicus (amphipods), Neomysis spp. (mysids), Neocrangon communis, Pandalus borealis (carid shrimps), Watasenia scintillans (cephalopods), and Bothrocara hollandi (teleosts), which are hyper-benthic and bentho-pelagic organisms. Dietary analyses based on the weight contributions of different prey taxa to the diets revealed significant variations in dietary composition in terms of fish size, water depth, and season, implying intraspecific dietary segregation. Euphausiids dominate the diets of smaller individuals (<30 cm TL), whereas the contributions of carid shrimps, teleosts, and cephalopods increase as body size increases. Similarly, the latter three prey items are dominant food resources in deeper habitats. The PERMANOVA results revealed that the size-related spatial and temporal changes in dietary composition are all significant for the species, as well as their two- or three-way interactions among those factors, except for the size-depth interaction. The coupling effect of size and depth is indicative of depth-dependent differences in fish sizes, with the tendency for larger individuals to be distributed in deeper habitats. In addition, seasonal and interannual variations in water column structures are also evident in the diets, which may, in part, account for the diet seasonality observed in the stomach content analysis. The dietary analyses of walleye pollock will improve our understandings to seek functional role of the species in benthic food webs, and to predict the effects of environmental and anthropogenic perturbations.

1. Introduction

Dietary analysis is key to understanding the prey choice and niche breadth of a predator’s diet, which ultimately identifies the functional role of the predator in an ecosystem [1,2,3]. The data are also an essential component for developing management and conservation frameworks of regional fishery species [4,5]. Superjacent to temporal and spatial resource use are the ontogenetic changes in prey choice, where individuals of different sizes and/or ages within a species target different prey types, consequently reducing direct intraspecific competition that may detract from the success of subsequent cohorts [6,7,8]. In addition, trophic niche analyses are increasingly being used to reflect food web structures and quantify the impacts of environmental changes on individual species and/or populations [9,10,11,12]. Understanding how the diet structure in a population can be used to identify the niche response to environmental impacts requires concomitant quantification of individual diets as well as population niche analysis [13].
Walleye pollock (or Alaska pollock), Gadus chalcogrammus (Gadiformes: Gadidae), is a marine demersal fish that is widely found throughout the North Pacific, from Alaska to the southern East Sea (also known as the Sea of Japan) and Carmel, California [14]. In the East Sea, G. chalcogrammus (walleye pollock hereafter) show spring–summer migration from spawning grounds to foraging areas, returning to spawning grounds in winter, with water temperature mainly affecting the distribution and movement of walleye pollock [15], but the evidence for this pattern of migration is sparse in the eastern waters of Korea. In addition, walleye pollock is among the most important fishery species in the eastern waters of Korea [16] as well as throughout North Pacific countries [17]. However, walleye pollock fishery stock has dramatically decreased since the 1980s due to overfishing and climate change-induced oceanographic changes, or the interplay of those influences [18]. Due to its importance in commercial fishery, many studies on the fisheries’ ecology have been conducted globally. The results of studies on its age and growth [19,20], and reproduction [21,22] have been used for fishery conservation and management of this species.
The diets of walleye pollock have been studied worldwide [23,24,25], with interspecific partitioning of resources recorded among juvenile walleye pollock and other zooplanktivorous species [26], and predator-prey relationships between walleye pollock and its prey items [27]. Despite their economic and ecological importance in the eastern waters of Korea, only a few studies have reported on the dietary habits of the species. One study described the dietary items of walleye pollock [28] and another paper described its trophic position [29], but neither explored the factors influencing dietary changes with respect to ontogenetic, temporal, and spatial aspects. Such information is useful for defining the functional roles of fish within the community [30,31] and important for the construction of trophic-based ecosystem models [32,33,34].
In this study, the dietary patterns of walleye pollock inhabiting the East Sea off the Korean coast in relation to fish size, time, and space were assessed. Specifically, this study aimed to (1) quantify the overall diet of the species, (2) determine ontogenetic and/or spatiotemporal changes in dietary composition, and (3) link differences in dietary pattern to various influences for the species. Studies on the feeding ecology of fish species may shed light on the functional role of the species in marine ecosystems, providing additional insight for management and conservation [35]. More specifically, studies on dietary changes with fish size, time, and space may further provide management with information on ecological linkages and feeding behavior for this species, and provide support for trophic and ecosystem models that seek to quantify community interactions and more accurately predict the effect of perturbations on community structure.

2. Materials and Methods

2.1. Study Area and Sampling

Sampling was conducted in waters off the middle eastern coast of Korea (Figure 1). Samples were collected monthly from January 2016 to December 2017 at depths between 50 and 800 m primarily using bottom gill nets (75 m length, 2 m height, and 90 mm mesh) and, occasionally, bottom trawls on commercial boats. Immediately following capture, individuals were packed with ice and later transported to the laboratory. Fish were kept frozen until processing, and fish samples were dissected immediately after thawing in the laboratory within a week after collection. This method of preservation did not reduce the ability to identify prey or to estimate the weight contributions of the various prey items [8]. In the laboratory, total length (TL, ±1.0 mm) and body weight (±1.0 g) were measured, the stomach removed, and the contents preserved in 70% isopropanol until microscopic work.

2.2. Stomach Content Analyses

For each specimen, stomachs were cut open, and all prey items were identified to the lowest possible taxonomic level and quantified (by both number and weight) using a stereo microscope and electronic balance.
Dietary data are expressed as frequency of occurrence (%F = 100 × Ai × N−1), as a numerical percentage (%N = 100 × Ni × NT−1) and as a weight percentage (%W = 100 × Wi × WT−1), where Ai is the number of fish preying on prey taxa i, N is the total number of fish examined (excluding those with empty stomachs), Ni (Wi) is the number (weight) of prey taxa i, and NT (WT) is the total number (weight) of prey taxa. The index of relative importance (IRI) [36] was calculated for each prey item as follows: IRI = (%N + %W) × %F, and expressed as a percentage (%IRI). Although the values for parasites (i.e., Nematoda) and unidentified materials are shown in the dietary table (Table 1), these were not considered valid dietary items so were not included in subsequent dietary analyses.
To investigate the existence of any size-related trends in the diets of walleye pollock, gravimetric dietary data for the species were aggregated into successive 10 cm TL intervals. Temporal changes in the diet were examined over two years by aggregating the dietary data for the species according to four seasons that represent the Korean oceanographic seasons, i.e., winter (January–March), spring (April–June), summer (July–September), and autumn (October–December) [37]. Depth-related differences in available food resources were also evaluated by aggregation depths into three categories, i.e., ≤100 m (shallower), 101–300 m (intermediate), <300 m (deeper). Mean percentage contributions by weight of the various prey taxa to the diets of individuals in successive size classes, depths, and seasons were calculated for the species based on pooled data for the different length classes across all depths and seasons, or vice versa.

2.3. Multivariate Analyses of Dietary Data

Because gravimetric data are considered to most accurately represent the relative importance of prey taxa, especially when prey items of different sizes are ingested [36], subsequence analyses were performed using the gravimetric data for each prey taxon. The weight dietary data of each prey taxa were analyzed using a combination of metric multidimensional scaling (mMDS), permutational multivariate analysis of variance (PERMANOVA), canonical analysis of principal coordinate (CAP), and a distance-based linear model (DISTLM) to compare intraspecific dietary variations [38,39].
To examine the dietary differences between size classes with water depth and seasons, dietary data for the species were randomly sorted into subgroups that included between three and five individuals within each size class, water depth, and season (depending on the sample size of that group), and the averages of the percentage weight data for each prey taxon were determined for each of the resultant groups. The averages of the dietary samples within subgroups were used for all subsequent analyses. Such random grouping of gravimetric data was advantageous to reduce the number of prey items in the samples with zero values, thus increasing the effectiveness of multivariate analysis [40]. Weight dietary data were square root-transformed to avoid any tendency of the main dietary components to be excessively dominant, and Bray-Curtis similarity/dissimilarity matrices were constructed for the species [6].
The Bray-Curtis similarity matrix was visualized to assess the effects of various factors using an mMDS ordination technique. The matrix was then subjected to a series of three-way PERMANOVAs to identify any significant effects of size class (five levels), depth (five levels), or time (four seasons and two years, eight levels), as well as their two- and three-way interactions. PERMANOVA is a nonparametric distance-based analysis of variance that uses permutation procedures to test hypotheses. PERMANOVA results also include the components of variation (COV) values with magnitudes differing from the main factors and any two- or three-way interactions between combinations of main factors. A larger COV indicates a greater influence of a particular factor or interaction term on the structure of the data [39,41].
Dietary pattern analyses were further conducted to examine the relative extent of the influence of potential predictors on the dietary variability via a distance-based linear model (DISTLM) using a Bray-Curtis dissimilarity matrix [39,42]. DISTLM is nonparametric procedure that performs distance-based multivariate multiple regression to model the relationship between multivariate data and one or more predictor variables. Potential predictors were total length, maturity, month, season, year, and water depth. Total length and water depth were considered continuous variables and the other predictors were considered categorical variables. DISTLM produces a marginal test that assesses how much variation is explained by each predictor alone (ignoring all other variables). It also produces a conditional test that assesses how much variation is explained by the combination of all variables [39]. The most parsimonious model was identified using the Akaike information criterion (AIC) because R2 simply increases with an increasing number of predictors [39]. A conditional test of DISTLM was performed using a forward selection of predictor permutation tests with the R2 criterion [39,43].
All analyses were performed using routines in the PRIMER v7 multivariate statistics package (www.primer-e.com, accessed on 10 October 2021) and the PERMANOVA+ add-on module [38,39].

3. Results

3.1. Overall Dietary Compositions

In total, the diets of 1494 walleye pollock (TL = 13.0–81.5 cm) were examined. The overall percentage of empty stomachs was 16.9%. A total of 20 prey taxa were found in the remaining 1242 stomachs (Table 1). The major prey types of walleye pollock were bentho-pelagic, hyper-benthic, and epibenthic. Euphausiids accounted for the majority of the diet by %IRI (55.04%). Euphausia pacific was the most common prey species, consisting of 61.20% by number and 27.30% by weight, occurring in 35.99% of all examined stomachs. Amphipods, mysids, and carid shrimps were second in importance, comprising 12.90, 11.85, and 10.31% by IRI, respectively. Themisto (7.21% by weight) and Neomysis (5.64% by weight) species were the most common amphipods and mysids consumed, respectively, whereas both Neocrangon communis and Pandalus borealis (together constituting 7.92% by weight) were the most abundant carid prey consumed. Teleosts and cephalopods were the next most abundant prey group, accounting for 5.42 and 3.70% by IRI, respectively. Bothrocara hollandi and Watasenia scintillans were the principal teleost and cephalopod prey species, respectively. The remaining prey items accounted for <0.5% by IRI in the diets of the species.

3.2. Ontogenetic, Depth-Dependent, and Temporal Changes in Dietary Composition

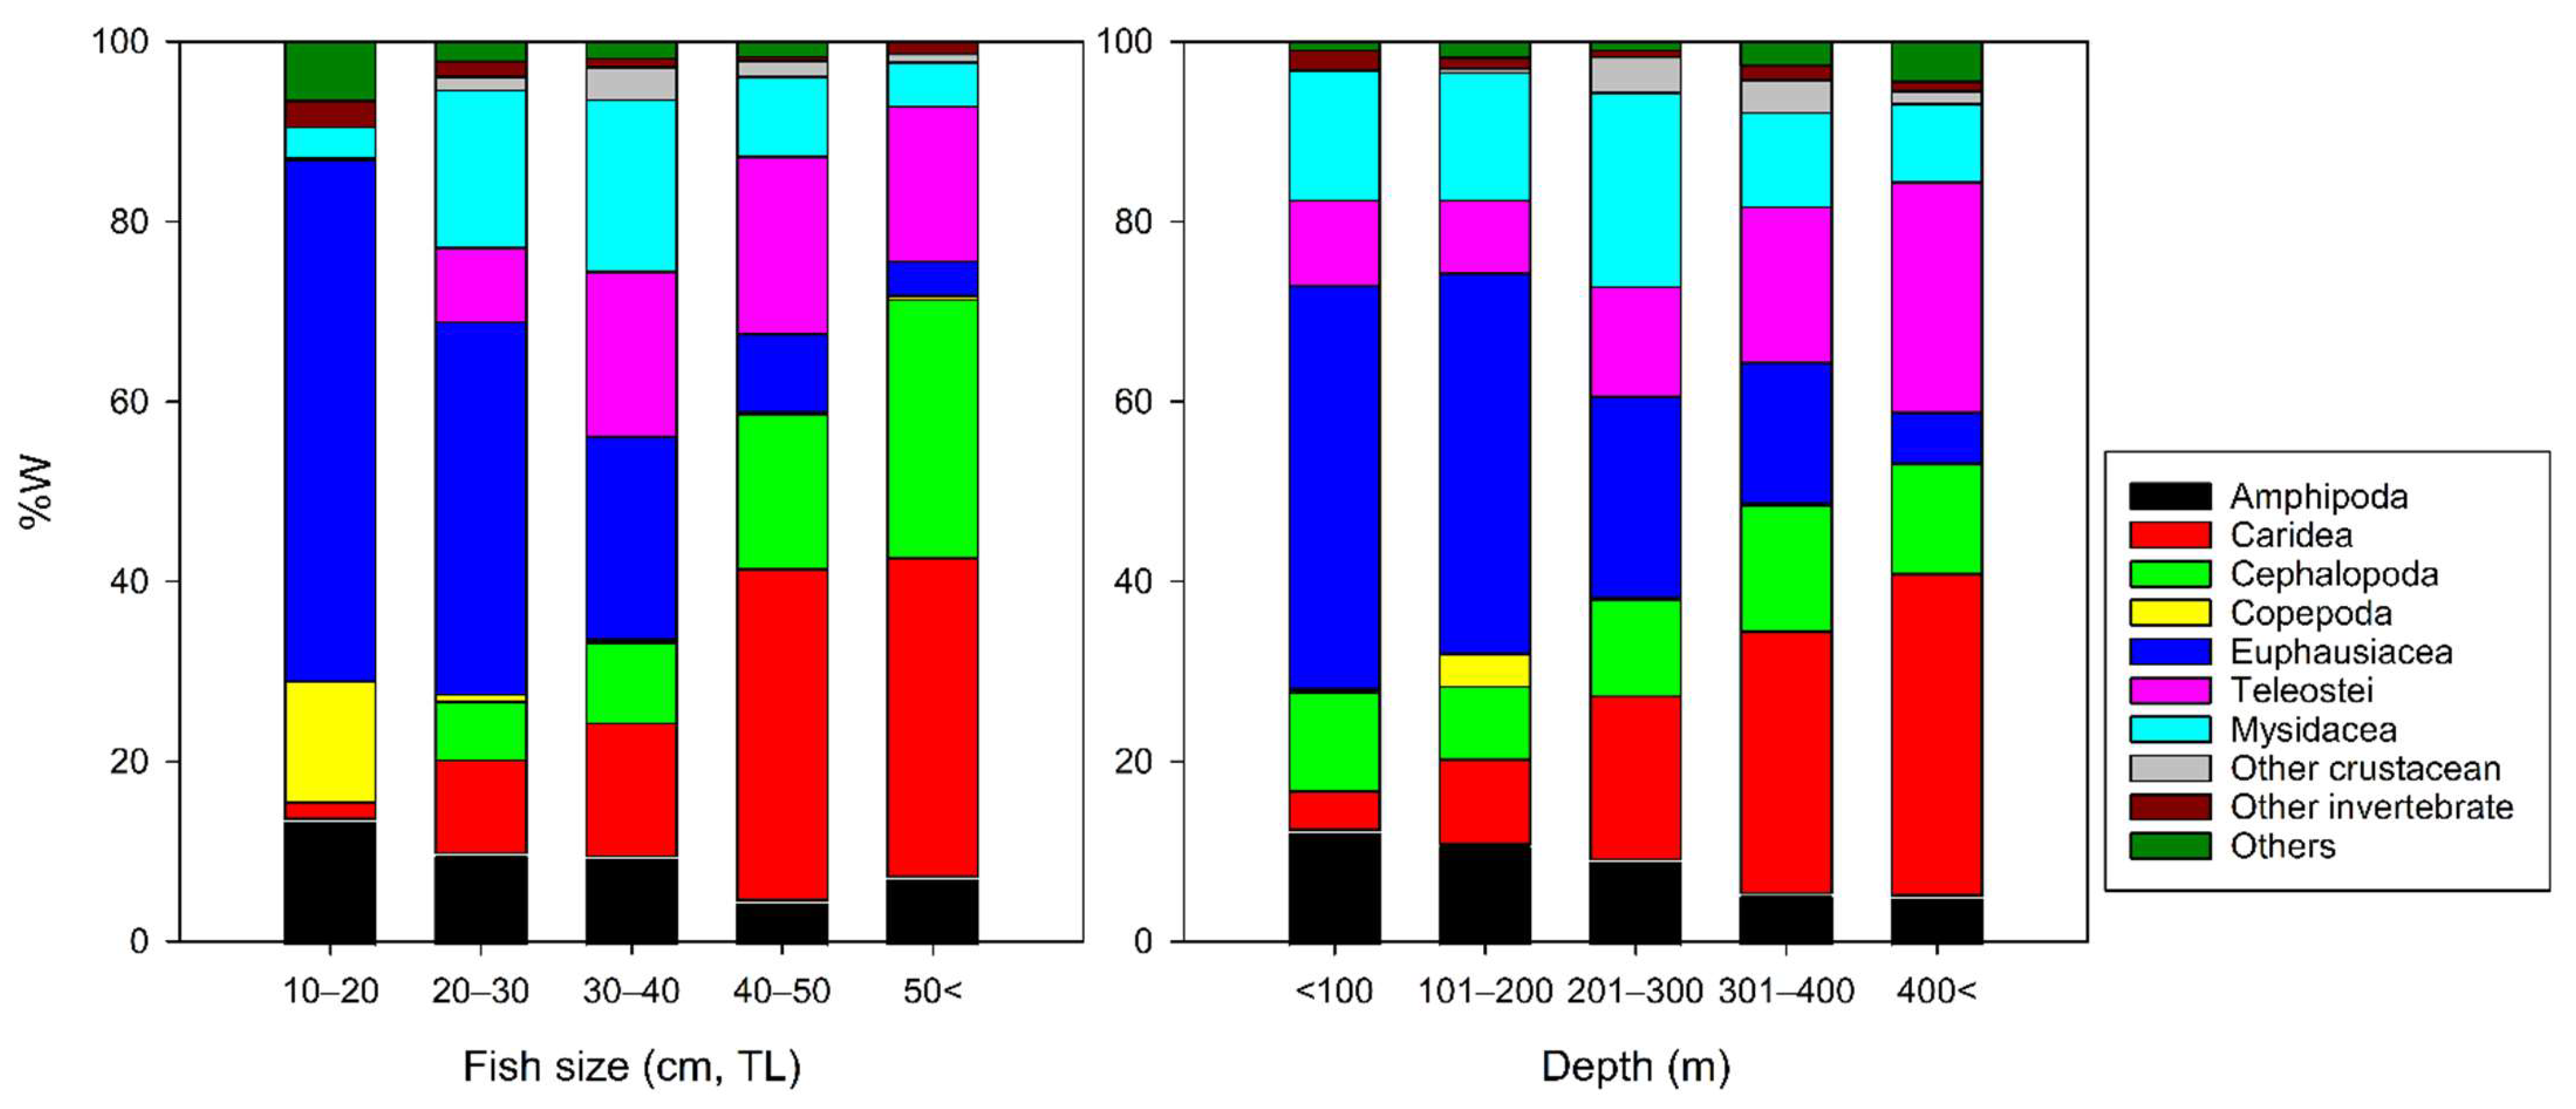
When the gravimetric dietary data were examined by length class, smaller walleye pollock (i.e., <30 cm TL) were found to have mainly fed on euphausiids, and its prevalence declined as the predator body size increased (Figure 2). By contrast, the weight of carid shrimp, cephalopods, and teleosts increased with increasing walleye pollock body size. Similar trends in dietary changes were also evident for euphausiids, carid shrimps, and teleosts, the latter two of which increased in importance with increasing water depth, whereas the weight contribution of euphausiids increased in shallower habitats (Figure 2).
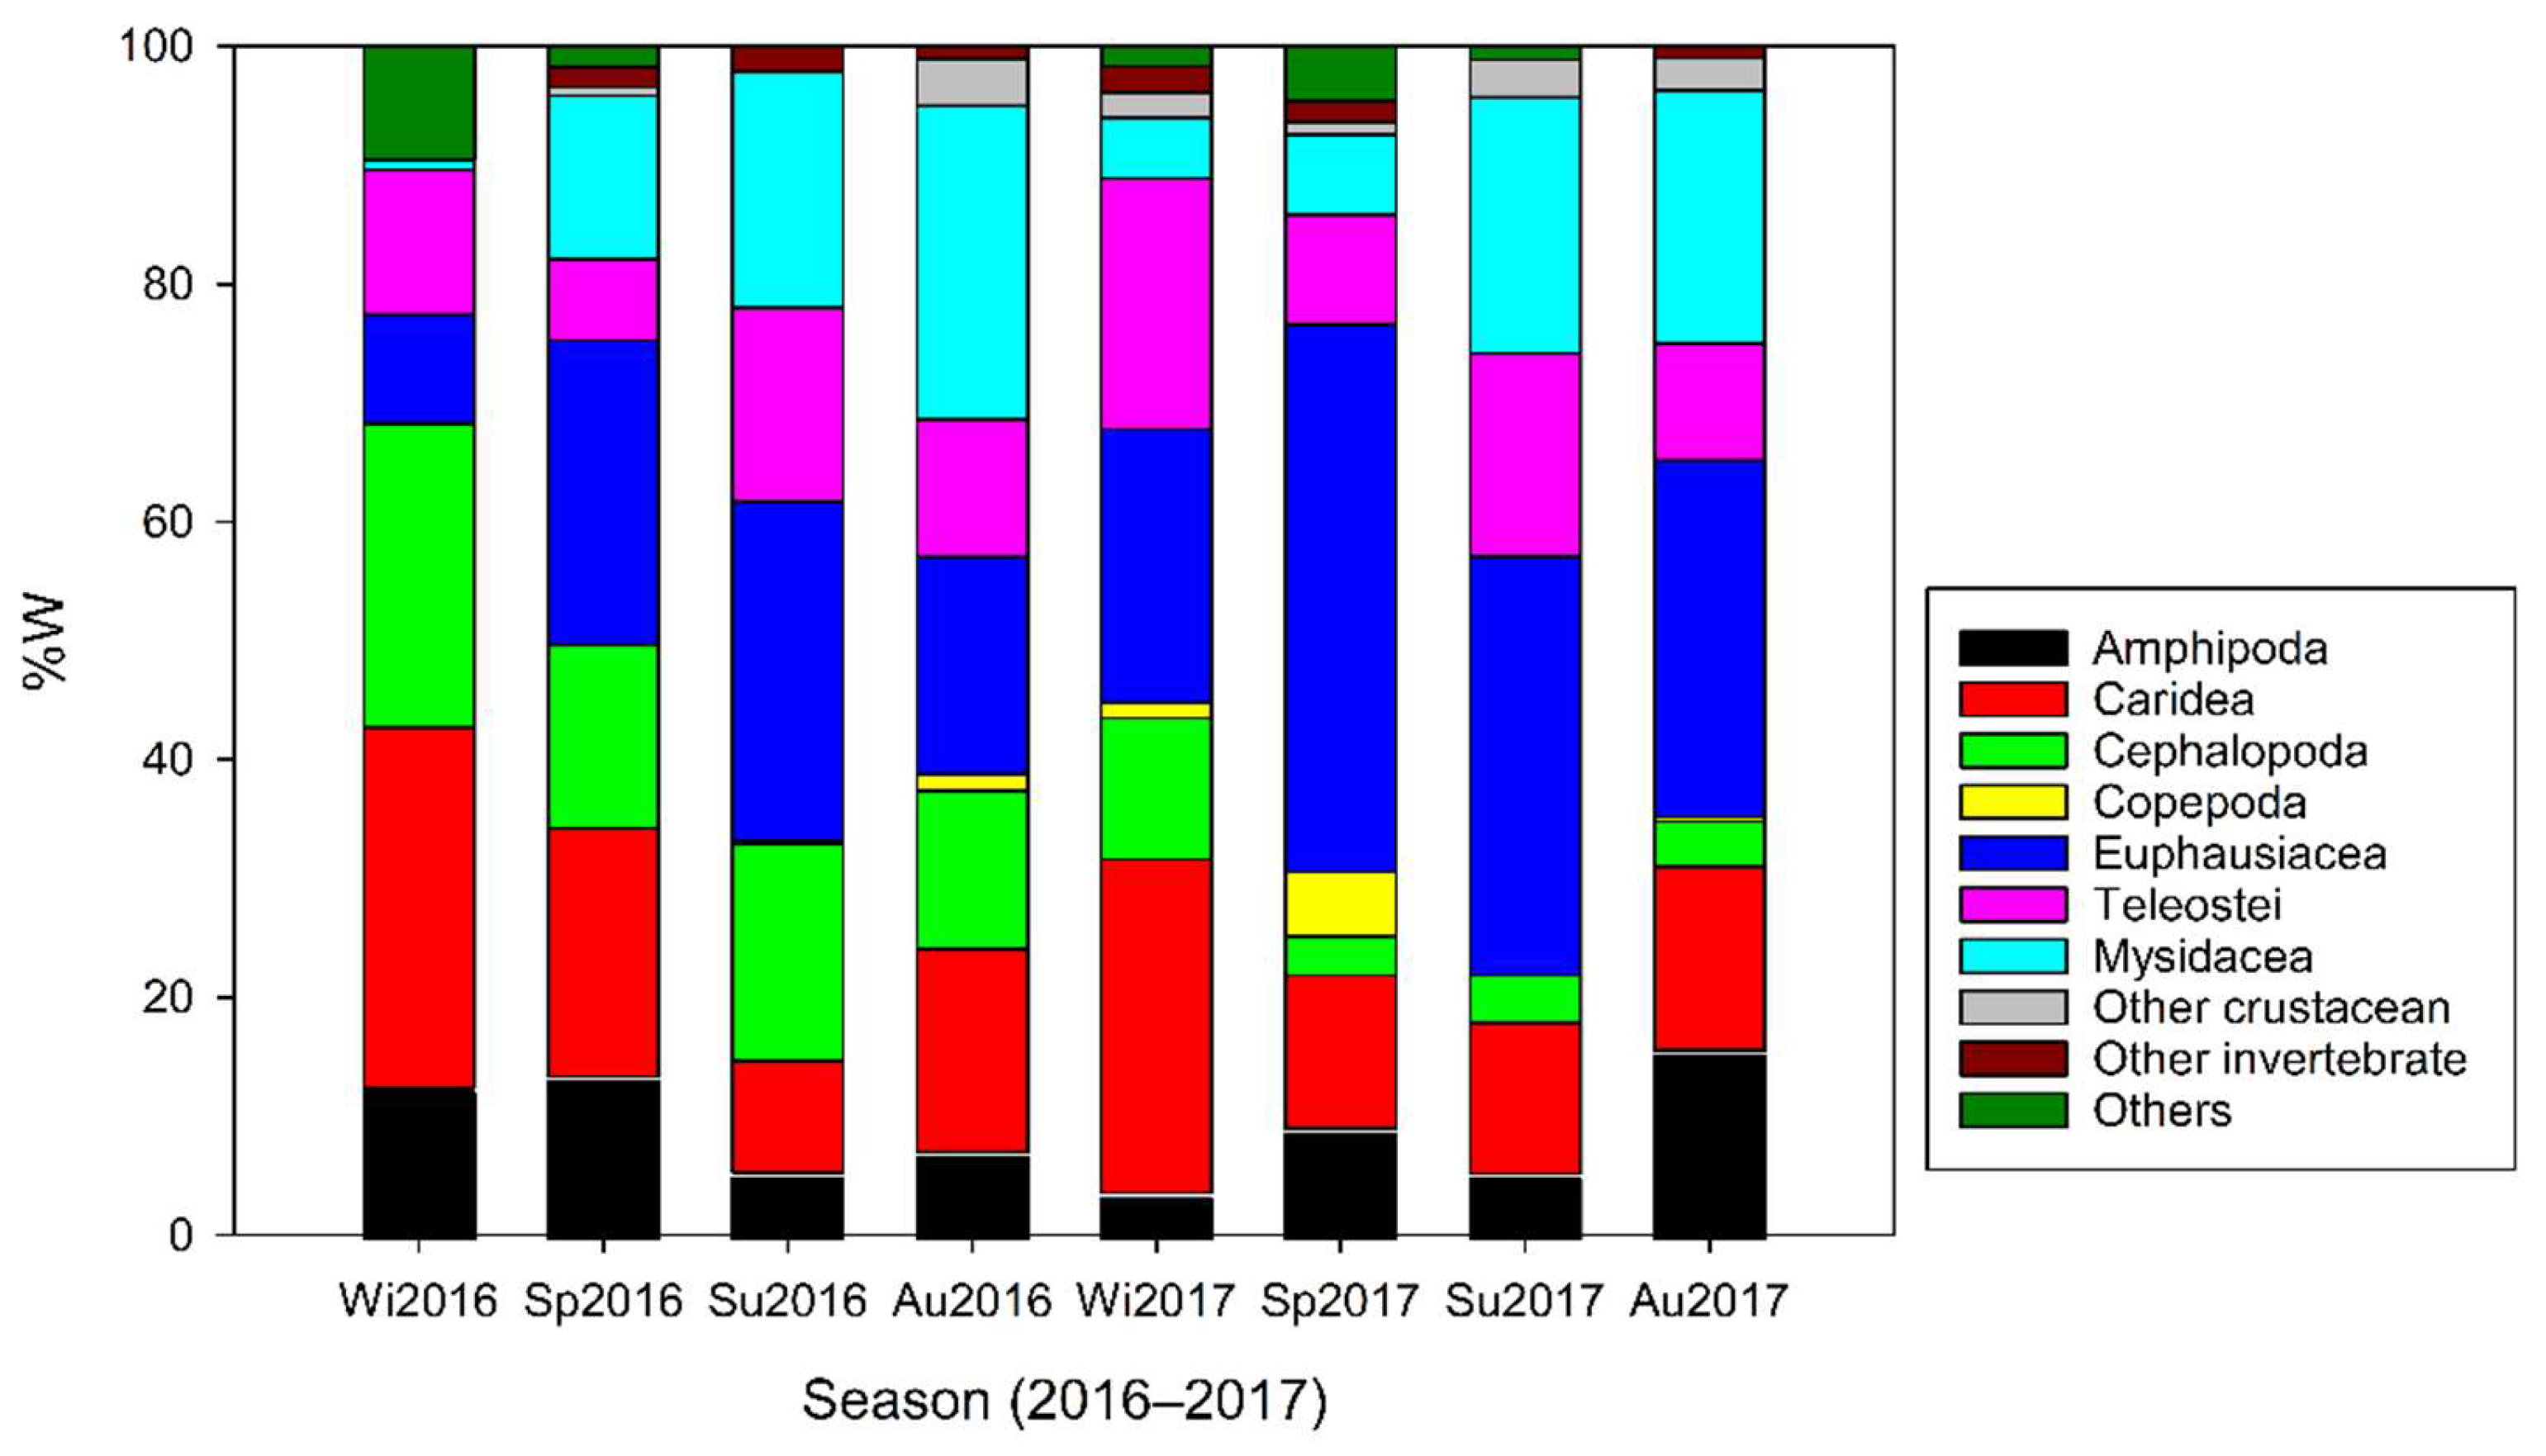
When the gravimetric dietary data were examined by season, but not length class or water depth, differences in the dietary composition among progressive seasonal categories were found in the diet of walleye pollock (Figure 3). In terms of prey weight, the diet of walleye pollock during winter and spring 2016 mainly comprised carid shrimps and cephalopods. In the autumn of 2016, mysids were the most important dietary component, whereas carid shrimps, euphausiids, and cephalopods equally contributed to the diets of walleye pollock. Euphausiids became more important from spring to autumn 2017, collectively contributing >30% to the overall dietary weight of walleye pollock (Figure 3). The contribution of cephalopods was higher in 2016 than 2017, and teleosts were a minor dietary component during all seasons and years, except winter 2017, when they constituted a moderate proportion of the walleye pollock diet.

3.3. Dietary Pattern Analyses

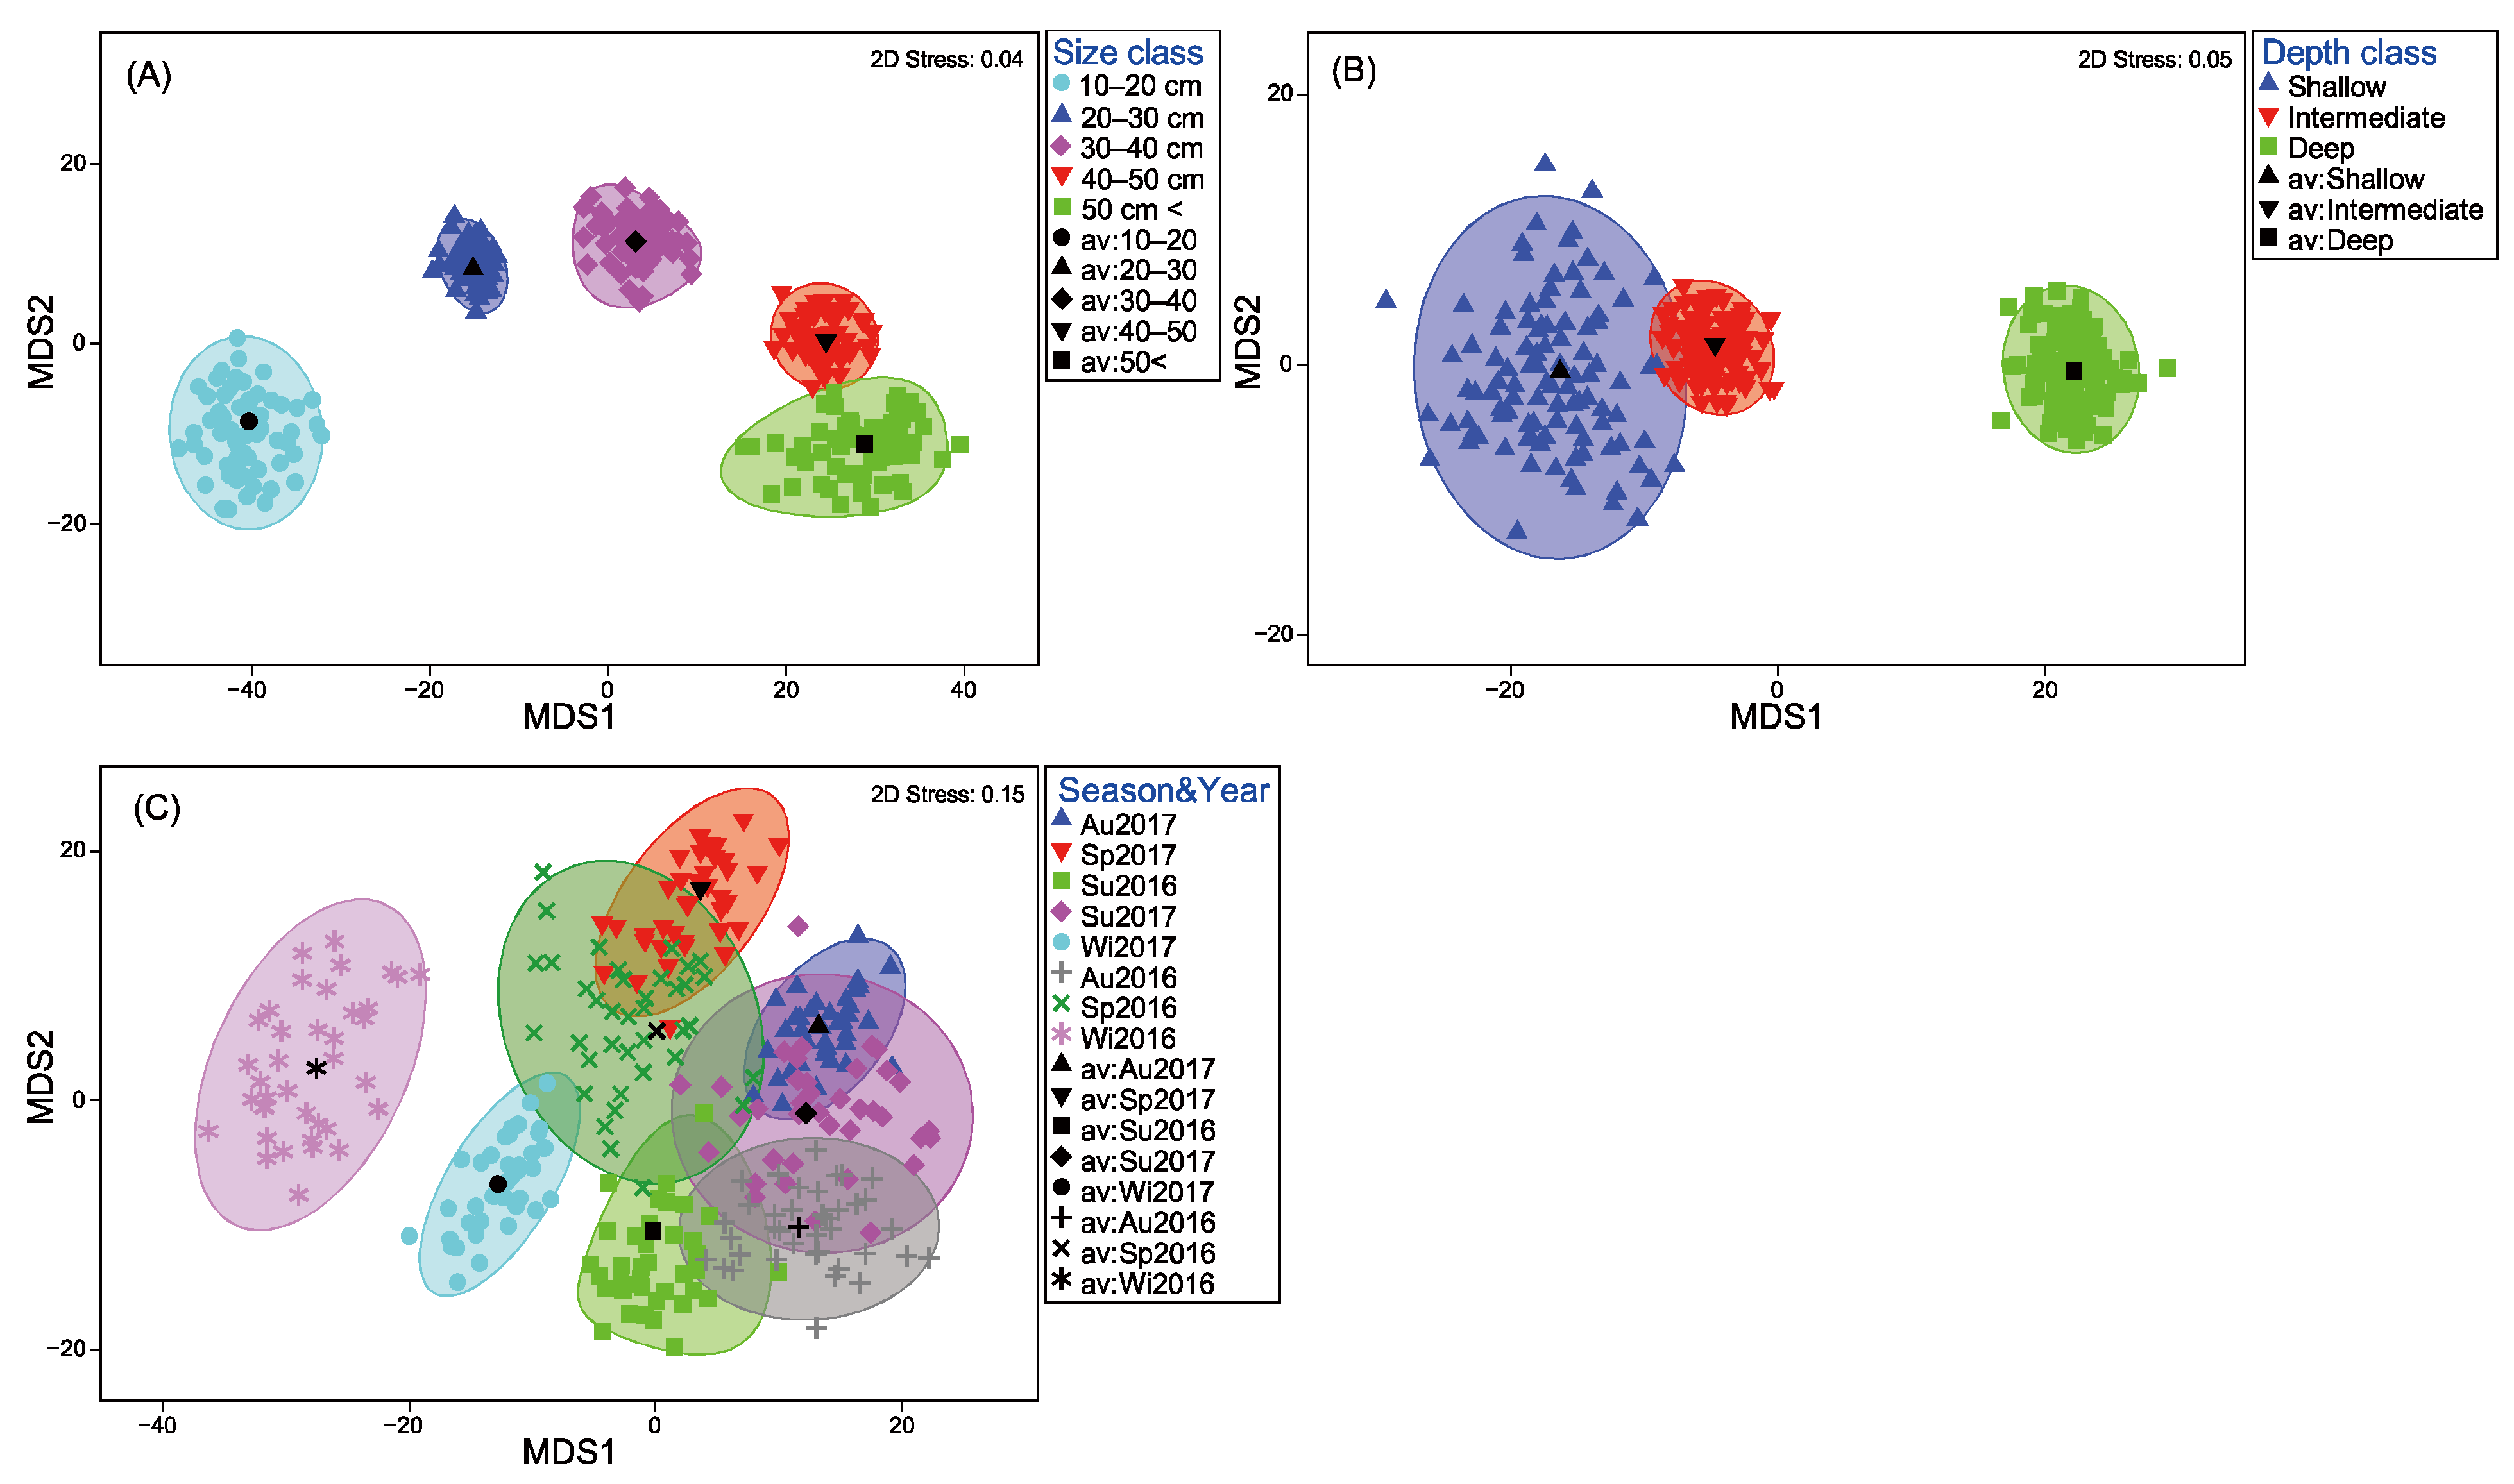
The metric MDS ordination of the similarity of the mean dietary compositions showed clear differences amongst the size class, depth, and season-year groups, with slight or no overlaps of the multivariate dispersions between size classes or depths (Figure 4). The diets from different size classes and depths show distinct clustering patterns from left to right with increasing fish size and sampling depth (Figure 4A,B). Season-year data pooled by size class and sampling depth also show clear clustering. Bootstrap averages of winter samples show clear separation along the X axis in the mMDS ordination compared with the average diets of other seasons (Figure 4C). Samples of warmer seasons (i.e., summer and autumn) are located in the lower left of mMDS ordination. In terms of the year, walleye pollock diets display no clear discrete groups between 2016 and 2017 in the ordination plot except winter of 2016 (Figure 4C).
The three-way PERMANOVA demonstrated that the dietary compositions of walleye pollock differed significantly with body size, depth, and seasonal category (all p = 0.001), with significant interactions between size and season (p = 0.006), between depth and season (p = 0.016), and the three-way interaction among the three factors (p = 0.016), but no significant two-way interaction was found in size-depth (Table 2). Although the components of variation (COVs) were greater for size than depth or season, COV values were similar for all three indicators for walleye pollock diets (Table 2).
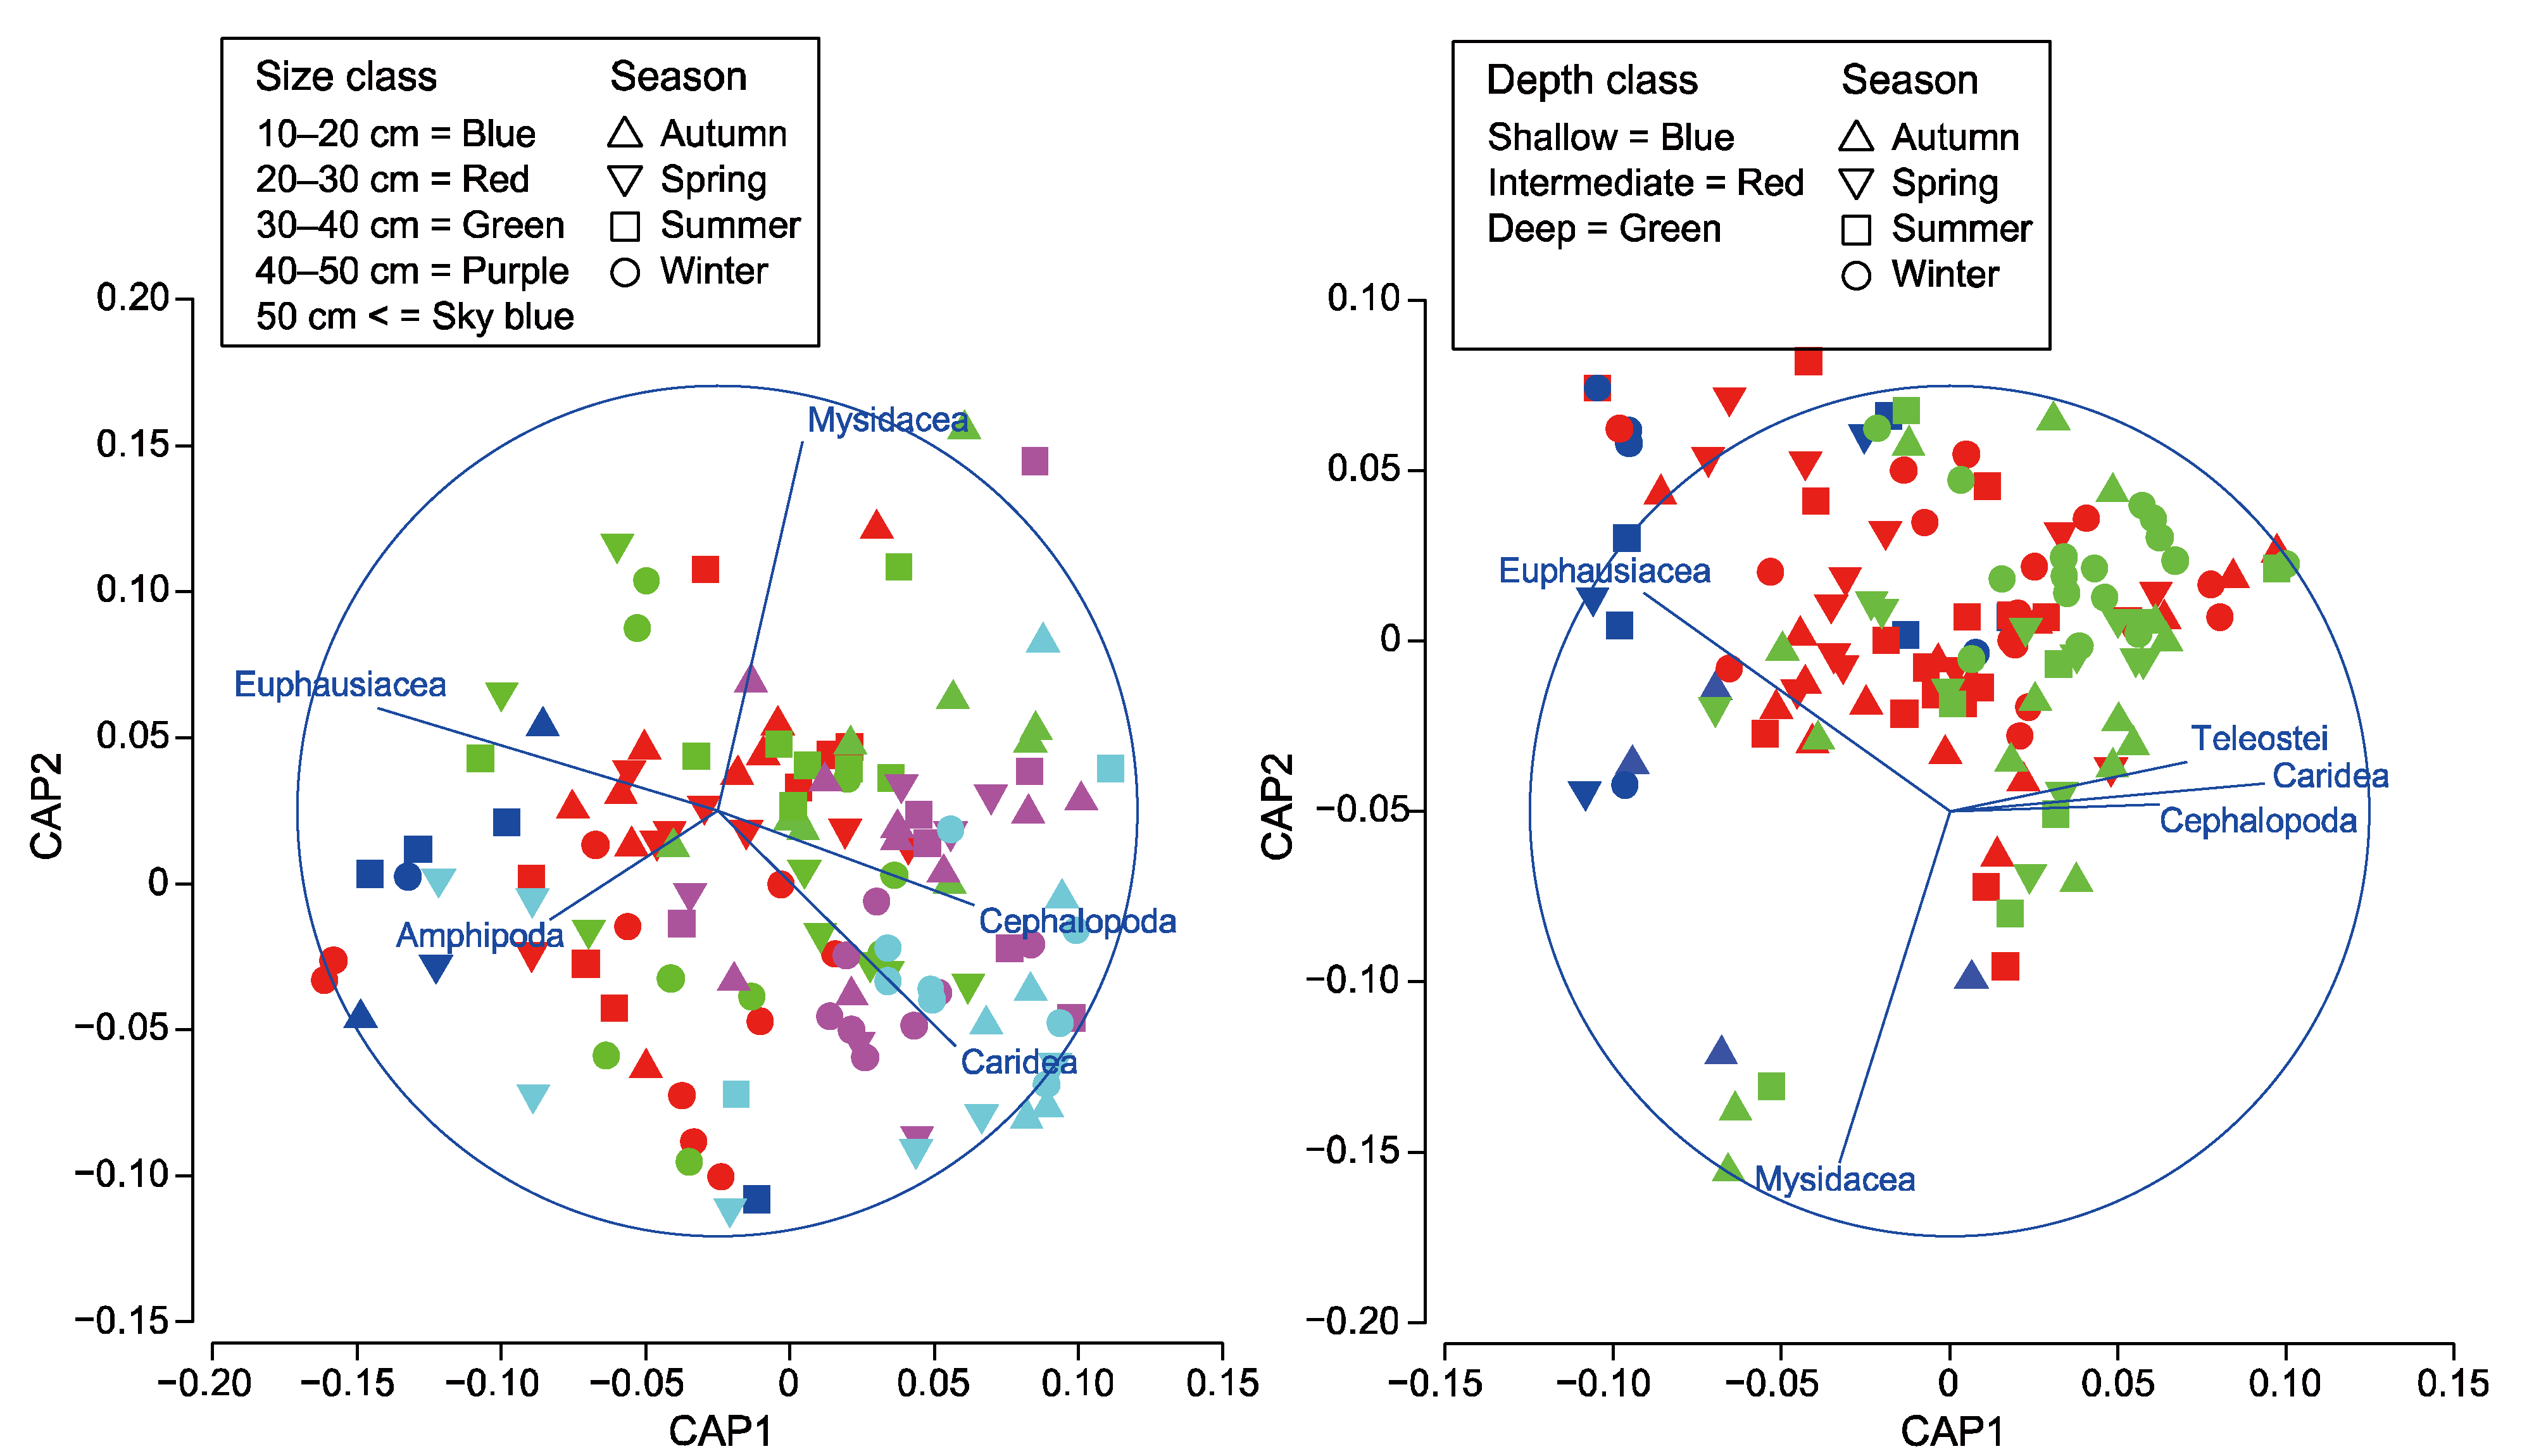
Canonical analyses of principal coordinates were performed on the significant interactions of size class-season and depth-season for a further test of PERMANOVA analyses. The CAP plot for the site-season interaction shows factor-indicating group separation between size classes, but weak separation between seasons (Figure 5). Two prey taxa (euphausiids and amphipods) were key in separating the small walleye pollock from larger specimens, and two prey taxa (carid shrimps and cephalopods) were characteristic of the diets of larger size classes (Figure 5). Similarly, a clear depth-related difference was found in the walleye pollock diets, showing a strong contribution of euphausiids at shallow depths and of three prey taxa (carid shrimps, cephalopods, and teleosts) to trends in deeper habitats. Weak seasonal classifications in dietary composition, however, were evident in both size class-season and depth-season interactions (Figure 5).
The results of the multivariate DISTLM test indicate that the diet pattern of walleye pollock is influenced by all the examined variables, and the most parsimonious conditional model for diet composition includes five individual predictors (total length, depth, month, year, and maturity; Table 3). Although effects of the variables were significant (p < 0.05), the conditional test model explained 12.9% of data variability, indicating that most of the variability in diet could not be explained by the predictors.

4. Discussion

The diets of walleye pollock inhabiting the part of the East Sea off the Korean coast were found to comprise mainly bentho-pelagic and hyper-benthic prey items (based on weight), with size-related and depth-dependent trends. The dominant type of hyper-benthic crustacean prey was carid shrimps, and bentho-pelagic prey items were euphausiids, mysids, cephalopods, and demersal teleosts. Epibenthic prey items, such as amphipods, also moderately contributed to the walleye pollock diet; the contributions of benthic or pelagic prey items were far lower than the former two prey types observed in this species. The proportions of bentho-pelagic and hyper-benthic species in the diets of walleye pollock suggest that this species forages in the water column or just above the surface of the substratum [23,25].
The diets of walleye pollock reported here are comparable to those reported for the species elsewhere. In terms of weight contribution, euphausiids, mysids, and crustacean decapods dominated the diets of walleye pollock from the Gulf of Alaska [9,24,25,44], whereas euphausiids and mysids as well as teleosts were major food items for walleye pollock from the northern Japanese waters [23]. When considering adult fish (i.e., >40 cm TL [45]), crustacean decapods and demersal teleosts were found to be the important food items in the diets of walleye pollock from the western North Pacific region [23]. Euphausiids became the principal prey items in the diets of walleye pollock inhabiting the Gulf of Alaska and the eastern Bering Sea [24,25,27]. Such regional differences may be attributed to the regional differences in the food resources available for walleye pollock populations because the dietary choices of marine predators are highly dependent on prey availability in their vicinities [46]. Generally, euphausiids are cold-water marine organisms mainly distributed toward polar regions. Therefore, the walleye pollock inhabiting eastern North Pacific may have more chance to ingest euphausiids because the latitudes of the study areas in the eastern North Pacific are closer to arctic regions than in present study area or northern Japanese waters.
Although all walleye pollock populations consumed teleosts, the relative ratios of cannibalism in the diets were different, with higher cannibalistic activities for walleye pollock from the eastern Bering Sea, northern Gulf of Alaska, and northern Japanese waters than those in the present study [23,25]. Yamamura et al. [47] indicated that most of the cannibalized prey were pollock aged one. Cannibalism of walleye pollock appears to result from the overlap of geographical (purely vertical) distribution between juvenile and adult fish [23,48]. The ratio of cannibalism was more frequent in shallow areas because the weak stratification increases encounters between adult and juvenile walleye pollock, resulting in increased incidence of cannibalism [23]. However, the ratio of cannibalism was considerably lower in this study (i.e., <0.1% of weight contribution to the diets). Jung et al. [49] indicated that there was strong stratification in the water column regardless of season, and the vertical distribution of juvenile walleye pollock was restricted to above the thermocline zone. This characteristic of the water column structure in the study area may reduce the chance of juvenile fish being ingested by adult walleye pollock because of their considerable vertical habitat segregations during ontogeny [49].
The ontogenetic shifts observed in diets of walleye pollock indicate intraspecific resource partitioning among the different size classes. These mainly include shifts from small and schooling prey (i.e., euphausiids and mysids) to larger and demersal carid shrimps, teleosts, and cephalopods with increasing predator size. Size-related dietary changes are common in fish species and are usually related to maximizing energy intake [50], and thus reducing direct intraspecific competition for food resources [43,51,52]. Size-related changes in dietary composition have previously been reported in the diets of walleye pollock elsewhere [23,25,27], but the ontogenetic trends differed between walleye pollock populations. For example, the diets of walleye pollock inhabiting the northern Gulf of Alaska showed a shift from epipelagic euphausiids to demersal shrimps and teleosts, indicating a trend of change similar to that in the present study [25]. In northern Japanese waters, small walleye pollock consumed copepods and euphausiids, but larger individuals exclusively ingested mesopelagic fish [23]. Although regional differences exist in the patterns of ontogenetic dietary changes, most results showed collective trends with a shift from small pelagic to large benthic and/or demersal prey.
The observed increases in the consumption of larger or more mobile prey may be partly explained by increases in mouth size and mobility as walleye pollock grow. As the size of a walleye pollock increases, the actual mouth size also progressively increases [53]. Mouth size is directly related to the efficiency of prey capture, with larger mouths being more efficiently able to handle and consume large prey [2], such as teleosts, cephalopods, and large crustacean decapods. The addition of mobile prey items (i.e., teleosts and cephalopods) to the diets of the largest class of walleye pollock may imply that larger individuals of this species can actively select these foods, and that body size may provide this species advantages in the pursuit, capture, and handling of those teleosts and cephalopods [54].
Walleye pollock also showed depth-dependent changes in their diets broadly similar to the ontogenetic changes, with euphausiids dominating the individuals’ diets at shallower depths and with deeper habitats having increasingly large prey items, such as carid shrimps and teleosts. This trend in dietary changes may be related to changes in the vertical distribution of the size spectrum of this species [49]. As larger specimens tend to be distributed at deeper depths, such differences in diets may partly reflect their use of different habitats, which may provide different prey resources and/or other differences in foraging behavior (see Lek et al. [7]). For example, Euphausia species mainly occur in the epipelagic zone (generally shallower than 200 m) in the western Pacific Ocean [55], whereas the main carid (Pandalus borealis), teleost (Bothrocara hollandi), and cephalopod (Watasenia scintillans) prey species are mainly distributed in the mesopelagic zone and deep ocean [56,57]. Therefore, walleye pollock specimens of different size classes might exploit different habitats containing different prey. Yamamura et al. [23] also observed that the occurrence of some prey taxa clearly differ according to depth, with mesopelagic fish being more important in the deep stratum.
In this study, both seasonal and interannual changes were assessed through the replication of seasonal samplings over two consecutive years. Marked differences were observed in the dietary composition of walleye pollock among the four seasons and between the two years. Considering the identifiable prey taxa, the consumption of carid shrimps and teleosts by walleye pollock increased in colder seasons (i.e., winter and spring), whereas the weight contribution of mysids and euphausiids increased during summer and autumn. There was also an interannual trend in dietary change, with increased foraging of euphausiids in 2017. Yamamura et al. [23] and Adams et al. [24] also reported seasonal differences in the consumption of prey items by walleye pollock. In northern Japanese waters, micronekton (euphausiids and mysids) were the most predominant prey for small walleye pollock during warmer seasons when the water column is well-stratified [23]. This may be due to the higher abundance or denser patches of micronekton encountered by walleye pollock inhabiting specific environments, especially in intermediate waters [58]. In addition, the strong stratification of the water column structure may have resulted in the ingestion of more euphausiids during 2017 [49]. Walleye pollock may have an increased chance of ingesting carid shrimp and teleost prey during colder seasons because the seasonal abundance of euphausiids is relatively low during the winter in the western Pacific region [59]. In the southeastern Bering sea, on the other hand, the diets of juvenile walleye pollock were dominated by euphausiids during the cold regime (between 2006 and 2009) because euphausiids comprised a large portion of the zooplankton community as water temperature declined on the Bering Sea shelf [44]. Such seasonal differences probably reflect changes in the abundance of available prey resources in their habitats. However, due to the lack of information on the seasonal variabilities of prey resources in this study area, possible hypotheses cannot be presented for the seasonal dietary differences of this species studied here.
The findings of this study provide important insights into the dietary patterns and factors influencing dietary choice, and thus the functional roles of walleye pollock off the middle eastern coast of Korea. The stomach contents indicate that this species is associated with the benthic food web, feeding mainly on abundant hyper-benthic and bentho-pelagic species. While euphausiids were most commonly consumed, carid shrimps and teleosts were also frequently ingested by larger specimens. Although ontogenetic, spatial, and temporal dietary changes were observed within the species studied, the lack of samples covering wider regions and/or all possible size ranges imposes limitations on describing the absolute diets of walleye pollock throughout their entire life history. Studies of the dietary habits of walleye pollock are essential for understanding prey-predator relationships in benthic ecosystems, and are important baseline studies for management and conservation efforts in eastern Korean waters. In addition, the knowledge of the relative importance of these findings need to be placed in the context of the overall community structure in this area.

Author Contributions

J.-M.P.; conceptualization, methodology, validation, formal analysis and writing—original draft, C.-I.L.; supervision, project administration and funding acquisition, H.-K.J.; data curation and visualization. All authors have read and agreed to the published version of the manuscript.

Funding

This research was parts of the project entitled “Long-term change of structure and function in marine ecosystems of Korea” funded by the Ministry of Oceans and Fisheries, Korea. This research was also supported by the Korea Institute of Ocean Science & Technology project (PN90190) and the National Research Foundation of Korea (NRF) grant funded by the Korea government (MSIT) (No. 2020R1F1A1051773).

Institutional Review Board Statement

Not applicable.

Informed Consent Statement

Not applicable.

Data Availability Statement

Not applicable.

Acknowledgments

We would like to thank to members of Fisheries Oceanography Laboratory at Ganeneung-Wonju National University for their assistance in the sample collections and measurements of the fish.

Conflicts of Interest

The authors declare no conflict of interest.

References

  1. Colwell, R.K.; Futuyma, D.J. On the measurement of niche breadth and overlap. Ecology 1971, 52, 567–576. [Google Scholar] [CrossRef]
  2. Scharf, F.S.; Juanes, F.; Rountree, R.A. Predator size-prey size relationships of marine fish predators: Interspecific variation and effects of ontogeny and body size on trophic-niche breadth. Mar. Ecol. Prog. Ser. 2000, 208, 229–248. [Google Scholar] [CrossRef]
  3. Depczynski, M.; Bellwood, D.R. The role of cryptobenthic reef fishes in coral reef trophodynamics. Mar. Ecol. Prog. Ser. 2003, 256, 183–191. [Google Scholar] [CrossRef]
  4. Zabel, R.W.; Harvey, C.J.; Katz, S.L.; Good, T.P.; Levin, P.S. Ecologically sustainable yield: Marine conservation requires a new ecosystem-based concept for fisheries management that looks beyond sustainable yield for individual fish species. Am. Sci. 2003, 91, 150–157. [Google Scholar]
  5. Bizzarro, J.J.; Yoklavich, M.M.; Wakefield, W.W. Diet composition and foraging ecology of US Pacific Coast groundfishes with applications for fisheries management. Environ. Biol. Fishes 2017, 100, 375–393. [Google Scholar] [CrossRef] [Green Version]
  6. Platell, M.; Potter, I. Partitioning of food resources amongst 18 abundant benthic carnivorous fish species in marine waters on the lower west coast of Australia. J. Exp. Mar. Biol. Ecol. 2001, 261, 31–54. [Google Scholar] [CrossRef]
  7. Lek, E.; Fairclough, D.V.; Platell, M.E.; Clarke, K.R.; Tweedley, J.R.; Potter, I.C. To what extent are the dietary compositions of three abundant, co-occurring labrid species different and related to latitude, habitat, body size and season? J. Fish Biol. 2011, 78, 1913–1943. [Google Scholar] [CrossRef] [PubMed]
  8. Park, J.M.; Gaston, T.F.; Williamson, J.E. Resource partitioning in gurnard species using trophic analyses: The importance of temporal resolution. Fish. Res. 2017, 186, 301–310. [Google Scholar] [CrossRef]
  9. Lamb, J.F.; Kimmel, D.G. The contribution of diet to the dramatic reduction of the 2013 year class of Gulf of Alaska walleye pollock (Gadus chalcogrammus). Fish. Oceanogr. 2021, 30, 1–15. [Google Scholar] [CrossRef]
  10. Kelly, D.J.; Schallenberg, M. Assessing food web structure in relation to nutrient enrichment, macrophyte collapse and lake resilience in shallow lowland lakes. N. Z. J. Mar. Freshw. Res. 2019, 53, 603–619. [Google Scholar] [CrossRef]
  11. Bowes, R.E.; Thorp, J.H.; Reuman, D.C. Multidimensional metrics of niche space for use with diverse analytical techniques. Sci. Rep. 2017, 7, 1–11. [Google Scholar] [CrossRef] [PubMed] [Green Version]
  12. Roessig, J.M.; Woodley, C.M.; Cech, J.J.; Hansen, L.J. Effects of global climate change on marine and estuarine fishes and fisheries. Rev. Fish Biol. Fish. 2004, 14, 251–275. [Google Scholar] [CrossRef]
  13. Stewart, S.D.; Kelly, D.; Biessy, L.; Laroche, O.; Wood, S.A. Individual diet specialization drives population trophic niche responses to environmental change in a predator fish population. Food Webs 2021, 27, e00193. [Google Scholar] [CrossRef]
  14. Quast, J.C.; Hall, E.L. List of Fishes of Alaska and Adjacent Waters with a Guide to Some of Their Literature; NOAA Technical Report NMFS SSRF-658; US Department of Commerce, National Oceanic and Atmospheric Administration, National Marine Fisheries Service: Seattle, WA, USA, 1972; p. 47.
  15. Kotwicki, S.; Buckley, T.W.; Honkalehto, T.; Walters, G. Variation in the distribution of walleye pollock (Theragra chalcogramma) with temperature and implications for seasonal migration. Fish. Bull. 2005, 103, 574–587. [Google Scholar]
  16. Kim, Y.; Han, K.; Kang, C.; Kim, J. Commercial Fishes of the Coastal and Offshore Waters in Korea; Hangul Press: Busan, Korea, 2004. [Google Scholar]
  17. Beamish, R.; McFarlane, G.A. A discussion of the importance of aging errors, and an application to walleye pollock: The world’s largest fishery. In Recent Developments in Fish Otolith Research; University of South Carolina Press: Columbia, SC, USA, 1995; pp. 545–565. [Google Scholar]
  18. Kang, S.; Kim, S. What caused the collapse of walleye pollock population in Korean waters? KMI Int. J. Marit. Aff. Fish. 2015, 7, 43–58. [Google Scholar] [CrossRef]
  19. Nishimura, A.; Yamada, J. Age and growth of larval and juvenile walleye pollock, Theragra chalcogramma (Pallas), as determined by otolith daily growth increments. J. Exp. Mar. Biol. Ecol. 1984, 82, 191–205. [Google Scholar] [CrossRef]
  20. Akira, N.; Yanagimoto, T.; Mito, K.; Katakura, S. Interannual variability in growth of walleye pollock, Theragra chalcogramma, in the central Bering Sea. Fish. Oceanogr. 2001, 10, 367–375. [Google Scholar] [CrossRef]
  21. Hinckley, S. The reproductive biology of walleye pollock, Theragra chalcogramma, in the Bering Sea, with reference to spawning stock structure. Fish. Bull. 1987, 85, 481–498. [Google Scholar]
  22. Hamatsu, T.; Yabuki, K.; Watanabe, K. Decadal changes in reproduction of walleye pollock (Theragra chalcogramma) off the Pacific coast of northern Japan. Fish. Oceanogr. 2004, 13, 74–83. [Google Scholar] [CrossRef]
  23. Yamamura, O.; Honda, S.; Shida, O.; Hamatsu, T. Diets of walleye pollock Theragra chalcogramma in the Doto area, northern Japan: Ontogenetic and seasonal variations. Mar. Ecol. Prog. Ser. 2002, 238, 187–198. [Google Scholar] [CrossRef] [Green Version]
  24. Adams, C.F.; Pinchuk, A.I.; Coyle, K.O. Seasonal changes in the diet composition and prey selection of walleye pollock (Theragra chalcogramma) in the northern Gulf of Alaska. Fish. Res. 2007, 84, 378–389. [Google Scholar] [CrossRef]
  25. Urban, D. Food habits of Pacific cod and walleye pollock in the northern Gulf of Alaska. Mar. Ecol. Prog. Ser. 2012, 469, 215–222. [Google Scholar] [CrossRef] [Green Version]
  26. Purcell, J.E.; Sturdevant, M.V. Prey selection and dietary overlap among zooplanktivorous jellyfish and juvenile fishes in Prince William Sound, Alaska. Mar. Ecol. Prog. Ser. 2001, 210, 67–83. [Google Scholar] [CrossRef] [Green Version]
  27. Buckley, T.W.; Ortiz, I.; Kotwicki, S.; Aydin, K. Summer diet composition of walleye pollock and predator—Prey relationships with copepods and euphausiids in the eastern Bering Sea, 1987–2011. Deep Sea Res. Part II Top. Stud. Oceanogr. 2016, 134, 302–311. [Google Scholar] [CrossRef]
  28. Ko, A.R.; Lee, S.J.; Yang, J.H.; Baeck, G.W. Diet of the walleye pollock Gadus chalcogrammus in the East Sea, Korea. Korean J. Fish. Aquat. Sci. 2020, 53, 456–463. [Google Scholar] [CrossRef]
  29. Park, H.J.; Park, T.H.; Lee, C.-I.; Kang, C.-K. Ontogenetic shifts in diet and trophic position of walleye pollock, Theragra chalcogramma, in the western East Sea (Japan Sea) revealed by stable isotope and stomach content analyses. Fish. Res. 2018, 204, 297–304. [Google Scholar] [CrossRef]
  30. Brodeur, R.D.; Pearcy, W.G. Effects of environmental variability on trophic interactions and food web structure in a pelagic upwelling ecosystem. Mar. Ecol. Prog. Ser. 1992, 84, 101–119. [Google Scholar] [CrossRef]
  31. Wootton, R.J. Ecology of Teleost Fishes; Chapman & Hall: New York, NY, USA, 1990. [Google Scholar]
  32. Ahlbeck, I.; Hansson, S.; Hjerne, O. Evaluating fish diet analysis methods by individual-based modelling. Can. J. Fish. Aquat. Sci. 2012, 69, 1184–1201. [Google Scholar] [CrossRef]
  33. Greenstreet, S.P.R.; Rogers, S.I. Indicators of the health of the North Sea fish community: Identifying reference levels for an ecosystem approach to management. ICES J. Mar. Sci. 2006, 63, 573–593. [Google Scholar] [CrossRef]
  34. Micheli, F.; Halpern, B.S. Low functional redundancy in coastal marine assemblages. Ecol. Lett. 2005, 8, 391–400. [Google Scholar] [CrossRef]
  35. Park, J.M.; Kwak, S.; Choi, H.; Jawad, L.; Riedel, R. Diet patterns of the marbled flounder, Pseudopleuronectes yokohamae, in the mid-western coast of Korea. Sci. Int. 2016, 4, 94–100. [Google Scholar]
  36. Hyslop, E. Stomach contents analysis—A review of methods and their application. J. Fish Biol. 1980, 17, 411–429. [Google Scholar] [CrossRef] [Green Version]
  37. Jung, H.K.; Rahman, S.M.; Kang, C.-K.; Park, S.-Y.; Lee, S.H.; Park, H.J.; Kim, H.-W.; Lee, C.I. The influence of climate regime shifts on the marine environment and ecosystems in the East Asian Marginal Seas and their mechanisms. Deep Sea Res. Part II Top. Stud. Oceanogr. 2017, 143, 110–120. [Google Scholar] [CrossRef]
  38. Clarke, K.; Gorley, R. PRIMER v7: User Manual/Tutorial; PRIMER-E: Plymouth, UK, 2015. [Google Scholar]
  39. Anderson, M.; Gorley, R.; Clarke, K. PERMANOVA+ for PRIMER: Guide to Software and Statistical Methods; PRIMER-E Plymouth Marine Laboratory: Plymouth, UK, 2008. [Google Scholar]
  40. White, W.; Platell, M.; Potter, I. Comparisons between the diets of four abundant species of elasmobranchs in a subtropical embayment: Implications for resource partitioning. Mar. Biol. 2004, 144, 439–448. [Google Scholar] [CrossRef]
  41. Linke, T. Trophic Interactions among Abundant Members of the Fish Fauna in a Permanently-Open and a Seasonally-Open Estuary in South-Western Australia; Murdoch University: Perth, Australia, 2011. [Google Scholar]
  42. Dunn, M.R. Feeding habits of the ommastrephid squid Nototodarus sloanii on the Chatham Rise, New Zealand. N. Z. J. Mar. Freshw. Res. 2009, 43, 1103–1113. [Google Scholar] [CrossRef]
  43. Jeong, J.M.; Kim, Y.; Song, S.-H.; Park, J.M. Feeding patterns of brown croaker, Miichthys miiuy (Basilewsky, 1855) from the south-western waters off Korea: Size-related and seasonal trends. Thalass. Int. J. Mar. Sci. 2019, 35, 413–420. [Google Scholar] [CrossRef]
  44. Coyle, K.O.; Eisner, L.B.; Mueter, F.J.; Pinchuk, A.I.; Janout, M.A.; Cieciel, K.D.; Farley, E.V.; Andrews, A.G. Climate change in the southeastern Bering Sea: Impacts on pollock stocks and implications for the oscillating control hypothesis. Fish. Oceanogr. 2011, 20, 139–156. [Google Scholar] [CrossRef]
  45. Lee, C.I.; Han, M.H.; Jung, H.K.; Park, H.J.; Park, J.M. Spawning season, and factors influencing allometric growth pattern and body condition of walleye pollock Gadus chalcogrammus in the middle East Sea, Korea. Korean J. Ichthyol. 2019, 31, 141–149. [Google Scholar] [CrossRef]
  46. Pinnegar, J.K.; Trenkel, V.M.; Tidd, A.N.; Dawson, W.A.; Du Buit, M.H. Does diet in Celtic Sea fishes reflect prey availability? J. Fish Biol. 2003, 63, 197–212. [Google Scholar] [CrossRef]
  47. Yamamura, O.; Yabuki, K.; Shida, O.; Watanabe, K.; Honda, S. Spring cannibalism on 1 year walleye pollock in the Doto area, northern Japan: Is it density dependent? J. Fish Biol. 2001, 59, 645–656. [Google Scholar] [CrossRef]
  48. Bailey, K.M. Interaction between the vertical distribution of juvenile walleye pollock Theragra chalcogramma in the eastern Bering Sea, and cannibalism. Mar. Ecol. Prog. Ser. 1989, 53, 205–213. [Google Scholar] [CrossRef]
  49. Jung, H.K.; Lee, C.I.; Park, H.J.; Park, J.M. Influences of oceanographic features on spatial and temporal distributions of size spectrum of walleye pollock, Gadus chalcogrammus inhabiting middle eastern coast of Korea. Korean J. Ichthyol. 2020, 32, 148–159. [Google Scholar] [CrossRef]
  50. Gerking, S.D. Feeding Ecology of Fish; Academic Press: San Diego, CA, USA, 1994. [Google Scholar]
  51. Langton, R. Diet overlap between Atlantic cod, Gadus morhua, silver hake, Merluccius bilinearis, and fifteen other northwest Atlantic finfish. Fish. Bull. 1982, 80, 745–759. [Google Scholar]
  52. Barnes, L.M.; Leclerc, M.; Gray, C.A.; Williamson, J.E. Dietary niche differentiation of five sympatric species of Platycephalidae. Environ. Biol. Fishes 2011, 90, 429–441. [Google Scholar] [CrossRef]
  53. Brodeur, R.D. Prey selection by age-0 walleye pollock, Theragra chalcogramma, in nearshore waters of the Gulf of Alaska. Environ. Biol. Fishes 1998, 51, 175–186. [Google Scholar] [CrossRef]
  54. Costello, J.H.; Colin, S.P. Morphology, fluid motion and predation by the scyphomedusa Aurelia aurita. Mar. Biol. 1994, 121, 327–334. [Google Scholar] [CrossRef] [Green Version]
  55. Hirota, Y.; Nemoto, T. Relationship between feeding and vertical distribution of euphausiids in the western Pacific Ocean. Bull. Plankton Soc. Jpn. 1990, 36, 127–135. [Google Scholar]
  56. Froese, R.; Pauly, D. FishBase. World Wide Web Electronic Publication. Version (06/2021). Available online: www.fishbase.org (accessed on 4 September 2021).
  57. Palomares, M.L.D.; Pauly, D. SeaLifeBase. World Wide Web Electronic Publication. Version (08/2021). Available online: www.sealifebase.org (accessed on 4 September 2021).
  58. Sogawa, S.; Sugisaki, H.; Saito, H.; Okazaki, Y.; Ono, T.; Shimode, S.; Kikuchi, T. Seasonal and regional change in vertical distribution and diel vertical migration of four euphausiid species (Euphausia pacifica, Thysanoessa inspinata, T. longipes, and Tessarabrachion oculatum) in the northwestern Pacific. Deep Sea Res. Part I Oceanogr. Res. Pap. 2016, 109, 1–9. [Google Scholar] [CrossRef]
  59. Kim, H.S.; Yamaguchi, A.; Ikeda, T. Abundance, biomass and life cycle patterns of euphausiids (Euphausia pacifica, Thysanoessa inspinata and T. longipes) in the Oyashio region, western subarctic Pacific. Plankton Benthos Res. 2009, 4, 43–52. [Google Scholar] [CrossRef] [Green Version]
Figure 1. Location of the study area in waters off the middle eastern coast of Korea. Each point indicates the sampling locations of bottom gill nets from numerous commercial vessels between January 2016 and December 2017. Bottom trawling was conducted randomly within study area.
Jmse 09 01154 g001
Figure 2. Mean percentage weight contributions of the different dietary components among sequential 10 cm length classes (left panel) and 100 m depth ranges (right panel) for Gadus chalcogrammus in waters off the middle eastern coast of Korea. Here and in Figure 3, each of the other prey groups included small prey taxa or unidentifiable prey: other crustaceans (cumaceans, isopods, ostracods, and unidentifiable crustaceans), other invertebrates (arrow worms, bivalves, gastropods, brittle stars, polychaetes, and peanut worms), and others (seaweed and unidentified materials).
Jmse 09 01154 g002
Figure 3. Mean percentage weight contributions of the different dietary components to the dietary weight during progressive seasons between 2016 and 2017 for Gadus chalcogrammus in waters off the middle eastern coast of Korea. Seasons are winter (Wi), spring (Sp), summer (Su), and autumn (Au).
Jmse 09 01154 g003
Figure 4. Metric multidimensional scaling (mMDS) ordinations for the dietary composition of Gadus chalcogrammus from the five size classes (A), three sampling depth classes (B), and eight season-year groups (C); Au = autumn, Sp = spring, Su = summer, and Wi = winter.
Jmse 09 01154 g004
Figure 5. Ordination plots for the canonical analysis of principal coordinates of Gadus chalcogrammus diets with size class-season (left panel) and depth-season interaction (right panel) terms.
Jmse 09 01154 g005
Table 1. Percentage frequency of occurrence (%F), number (%N), weight (%W), and index of relative importance (%IRI) of prey in the diets of Gadus chalcogrammus inhabiting waters off the middle eastern coast of Korea. Prey taxa, prey type, and total dietary values of each prey taxon are indicated in bold letters. Asterisks (*) indicate prey taxa for multivariate analyses.
TaxaPrey ItemsPrey Type%F%N%W%IRI
Sipuncula *UnidentifiedBenthic0.080.140.05<0.01
NematodaUnidentifiedParasite9.260.440.530.16
Polychaeta *TotalBenthic0.720.020.480.01
Nereidae 0.16<0.010.07
Polynoidae 0.08<0.010.01
Unidentified 0.480.010.40
Arrow worm *UnidentifiedPelagic0.320.050.17<0.01
Gastropoda *UnidentifiedEpibenthic0.08<0.010.08<0.01
Bivalvia *UnidentifiedEpibenthic0.320.010.03<0.01
Cephalopoda *TotalBentho-pelagic18.360.8210.863.70
Berryteuthis magister 0.810.100.71
Loliginidae 0.24<0.010.09
Loligo bleekeri 0.08<0.010.04
Octopodidae 0.320.010.31
Sepiolidae 0.08<0.010.04
Todarodes pacificus 0.24<0.010.24
Watasenia scintillans 2.580.121.54
Unidentified 14.570.567.88
Copepoda *TotalPelagic5.153.141.360.40
Calanus sinicus 0.890.750.39
Neocalanus copepodite 0.240.05<0.01
Paraeuchaeta elongata 1.771.580.52
Tortanus discaudatus 0.16<0.01<0.01
Unidentified 2.420.760.44
Cumacea *UnidentifiedEpibenthic0.16<0.01<0.01<0.01
Ostracoda *UnidentifiedEpibenthic0.08<0.01<0.01<0.01
Isopoda *UnidentifiedEpibenthic0.08<0.01<0.01<0.01
Euphausiacea *TotalBentho-pelagic35.9961.2027.3055.04
Euphausia sp. A 0.080.010.04
Euphausia sp. B 0.08<0.01<0.01
Euphausia pacifica 14.4146.9012.29
Thysanoessa spp. 2.330.450.79
Unidentified 20.2913.8314.17
Mysidacea *TotalBentho-pelagic25.0413.3614.0311.85
Neomysis spp. 10.799.235.64
Unidentified 14.654.138.39
Amphipoda *TotalEpibenthic27.7818.288.6012.90
Ampelisca sp. 0.08<0.01<0.01
Anonyx sp. 0.970.110.32
Gammeridae spp. 2.661.191.05
Primno abyssalis 0.320.02<0.01
Themisto spp.Semi-pelagic24.8816.967.21
Caridea *TotalHyper-benthic29.471.4418.8210.31
Argis lar 0.32<0.010.18
Crangon dalli 0.08<0.01<0.01
Crangonidae spp. 6.120.222.92
Hippolytidae 1.130.040.41
Lebbeus polaris 0.240.010.22
Neocrangon communis 5.960.273.17
Nephropidae 0.08<0.010.03
Pandalidae spp. 4.030.191.85
Pandalus borealis 6.600.294.75
Spirontocaris spinus 0.24<0.010.12
Unidentified 9.100.395.17
Other crustaceaUnidentifiedEpibenthic2.820.091.980.10
Ophiuroidae *UnidentifiedEpibenthic0.480.02<0.01<0.01
Teleostei *TotalBentho-pelagic21.580.8913.645.42
Arctoscopus japonicus 0.560.020.50
Bothrocara hollandi 6.920.275.04
Clupeidae 0.400.020.23
Gadus chalcogrammus 0.640.030.47
Lycodes toyamensis 0.08<0.010.01
Unidentified fish egg 0.080.030.08
Unidentified 13.370.527.32
Seaweed *UnidentifiedBenthic0.08<0.01<0.01<0.01
Other materialsUnidentified 2.660.082.080.10
Table 2. Results of PERMANOVA tests, employing a Bray-Curtis similarity matrix derived from the mean percentage weight contributions of prey taxa to the diets of Gadus chalcogrammus.
SourcedfMSPseudo-FCOVP (perm)
Size48286.86.12315.8940.001
Depth46688.34.74213.7020.001
Season74122.83.04714.1270.001
Size × Depth131321.90.9776.6980.512
Size × Season252081.41.53813.8960.006
Depth × Season262122.31.56110.5730.016
Size × Depth × Season511919.91.41916.3400.016
Residuals2211353.3 35.270
Table 3. Results of distance-based linear models (DISTLM) analyzing Gadus chalcogrammus diet with respect to total length, maturity, depth, year, season, and month individually (marginal test) and sequentially (conditional test) for a population in waters off the middle eastern coast of Korea.
Predictor VariablesPseudo-FR2pProp
Marginal test
Total length (TL)109.510 0.0010.081
Maturity96.972 0.0010.072
Depth79.843 0.0010.060
Year15.669 0.0010.012
Season19.142 0.0010.015
Month25.786 0.0010.021
Conditional Test
+TL109.5100.0810.0010.081
+Depth28.2740.1020.0010.021
+Month20.0420.1160.0010.014
+Year13.4510.1260.0010.010
+Maturity4.6210.1290.0010.003
Prop: Proportion of variance explained by each variable.
Publisher’s Note: MDPI stays neutral with regard to jurisdictional claims in published maps and institutional affiliations.