Analysis of the Spatial and Temporal Variation of Sea Ice and Connectivity in the NEP of the Arctic in Summer in Hot Years
Abstract
:1. Introduction
2. Research Area, Data and Method
2.1. Research Area
2.2. Data
2.3. Method
2.3.1. Calculation of Sea Ice Age and Sea Ice Movement
2.3.2. Calculation of Sea Ice Anomalies
2.3.3. Extraction of Sea Ice Concentration on the Northeast Passage (NEP)
3. Analysis of the NEP Ice Condition and Connectivity in Hot Years
3.1. Sea Ice Extent Analysis
3.2. Sea Ice Concentration Analysis
3.3. Sea Ice Anomaly Analysis
3.4. NEP Connectivity Analysis in Hot Years
4. Analysis on the Spatial and Temporal Causes of Sea Ice Abnormality in Hot Years
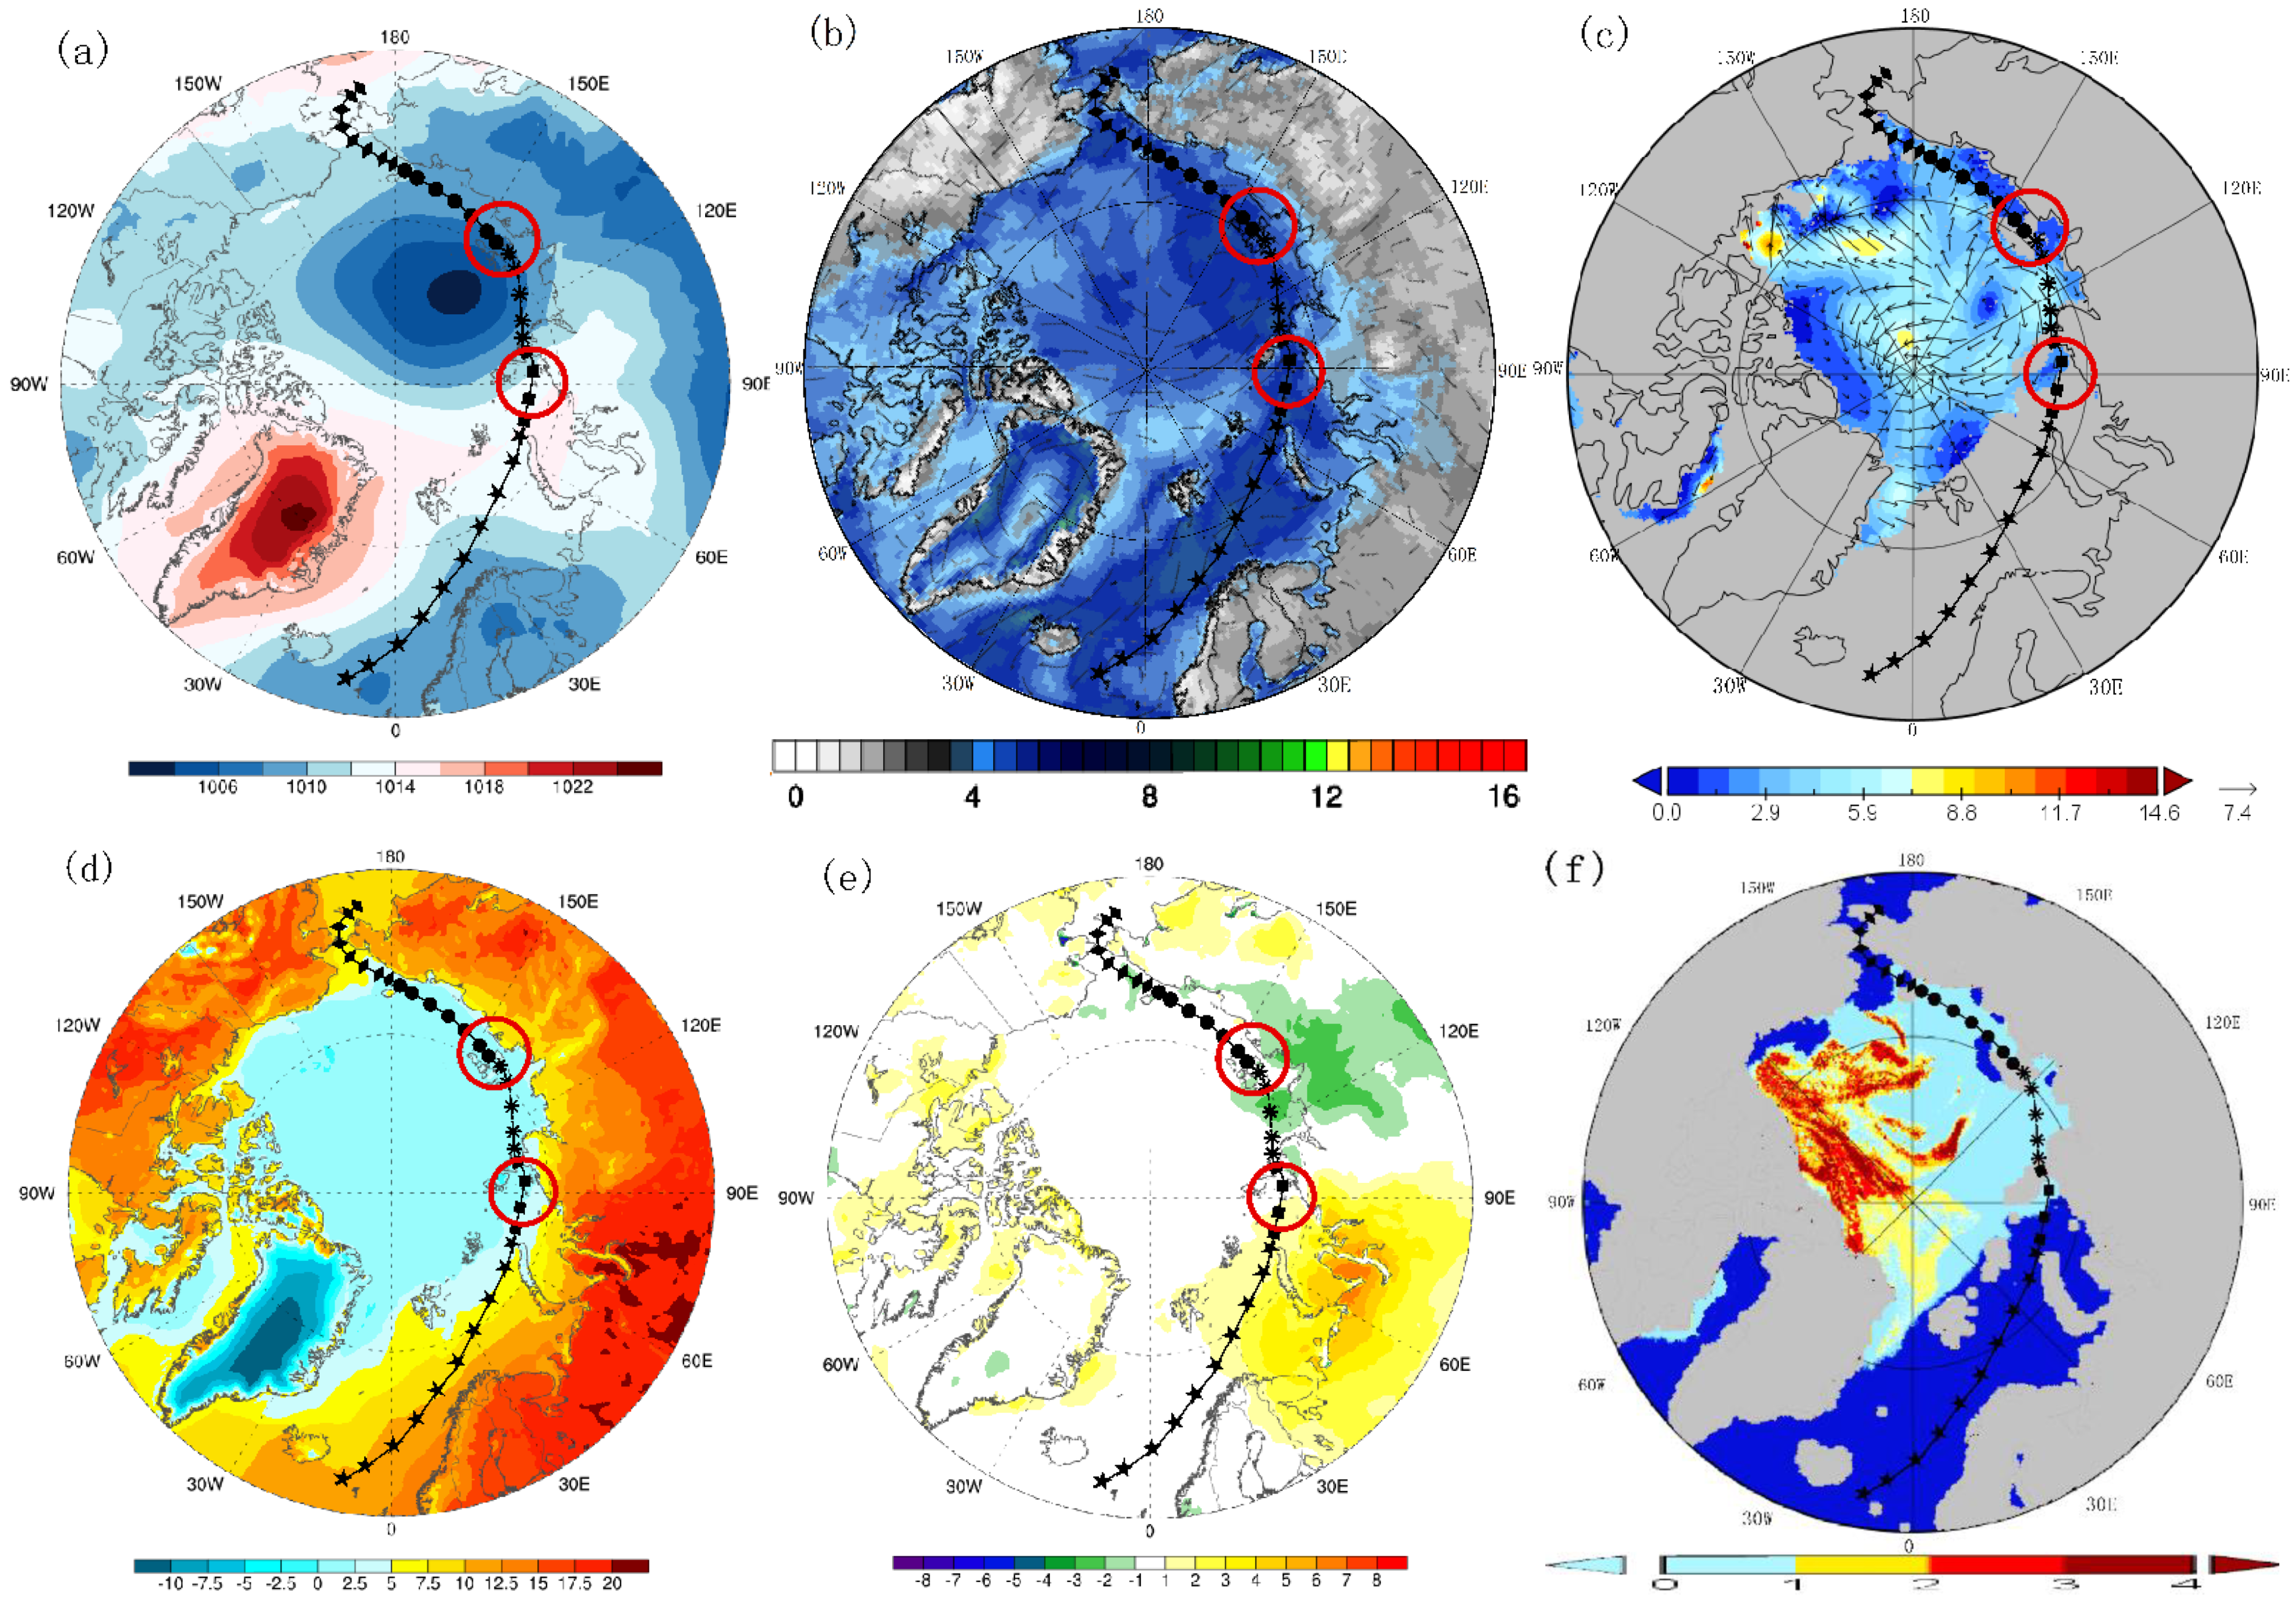
4.1. 2016
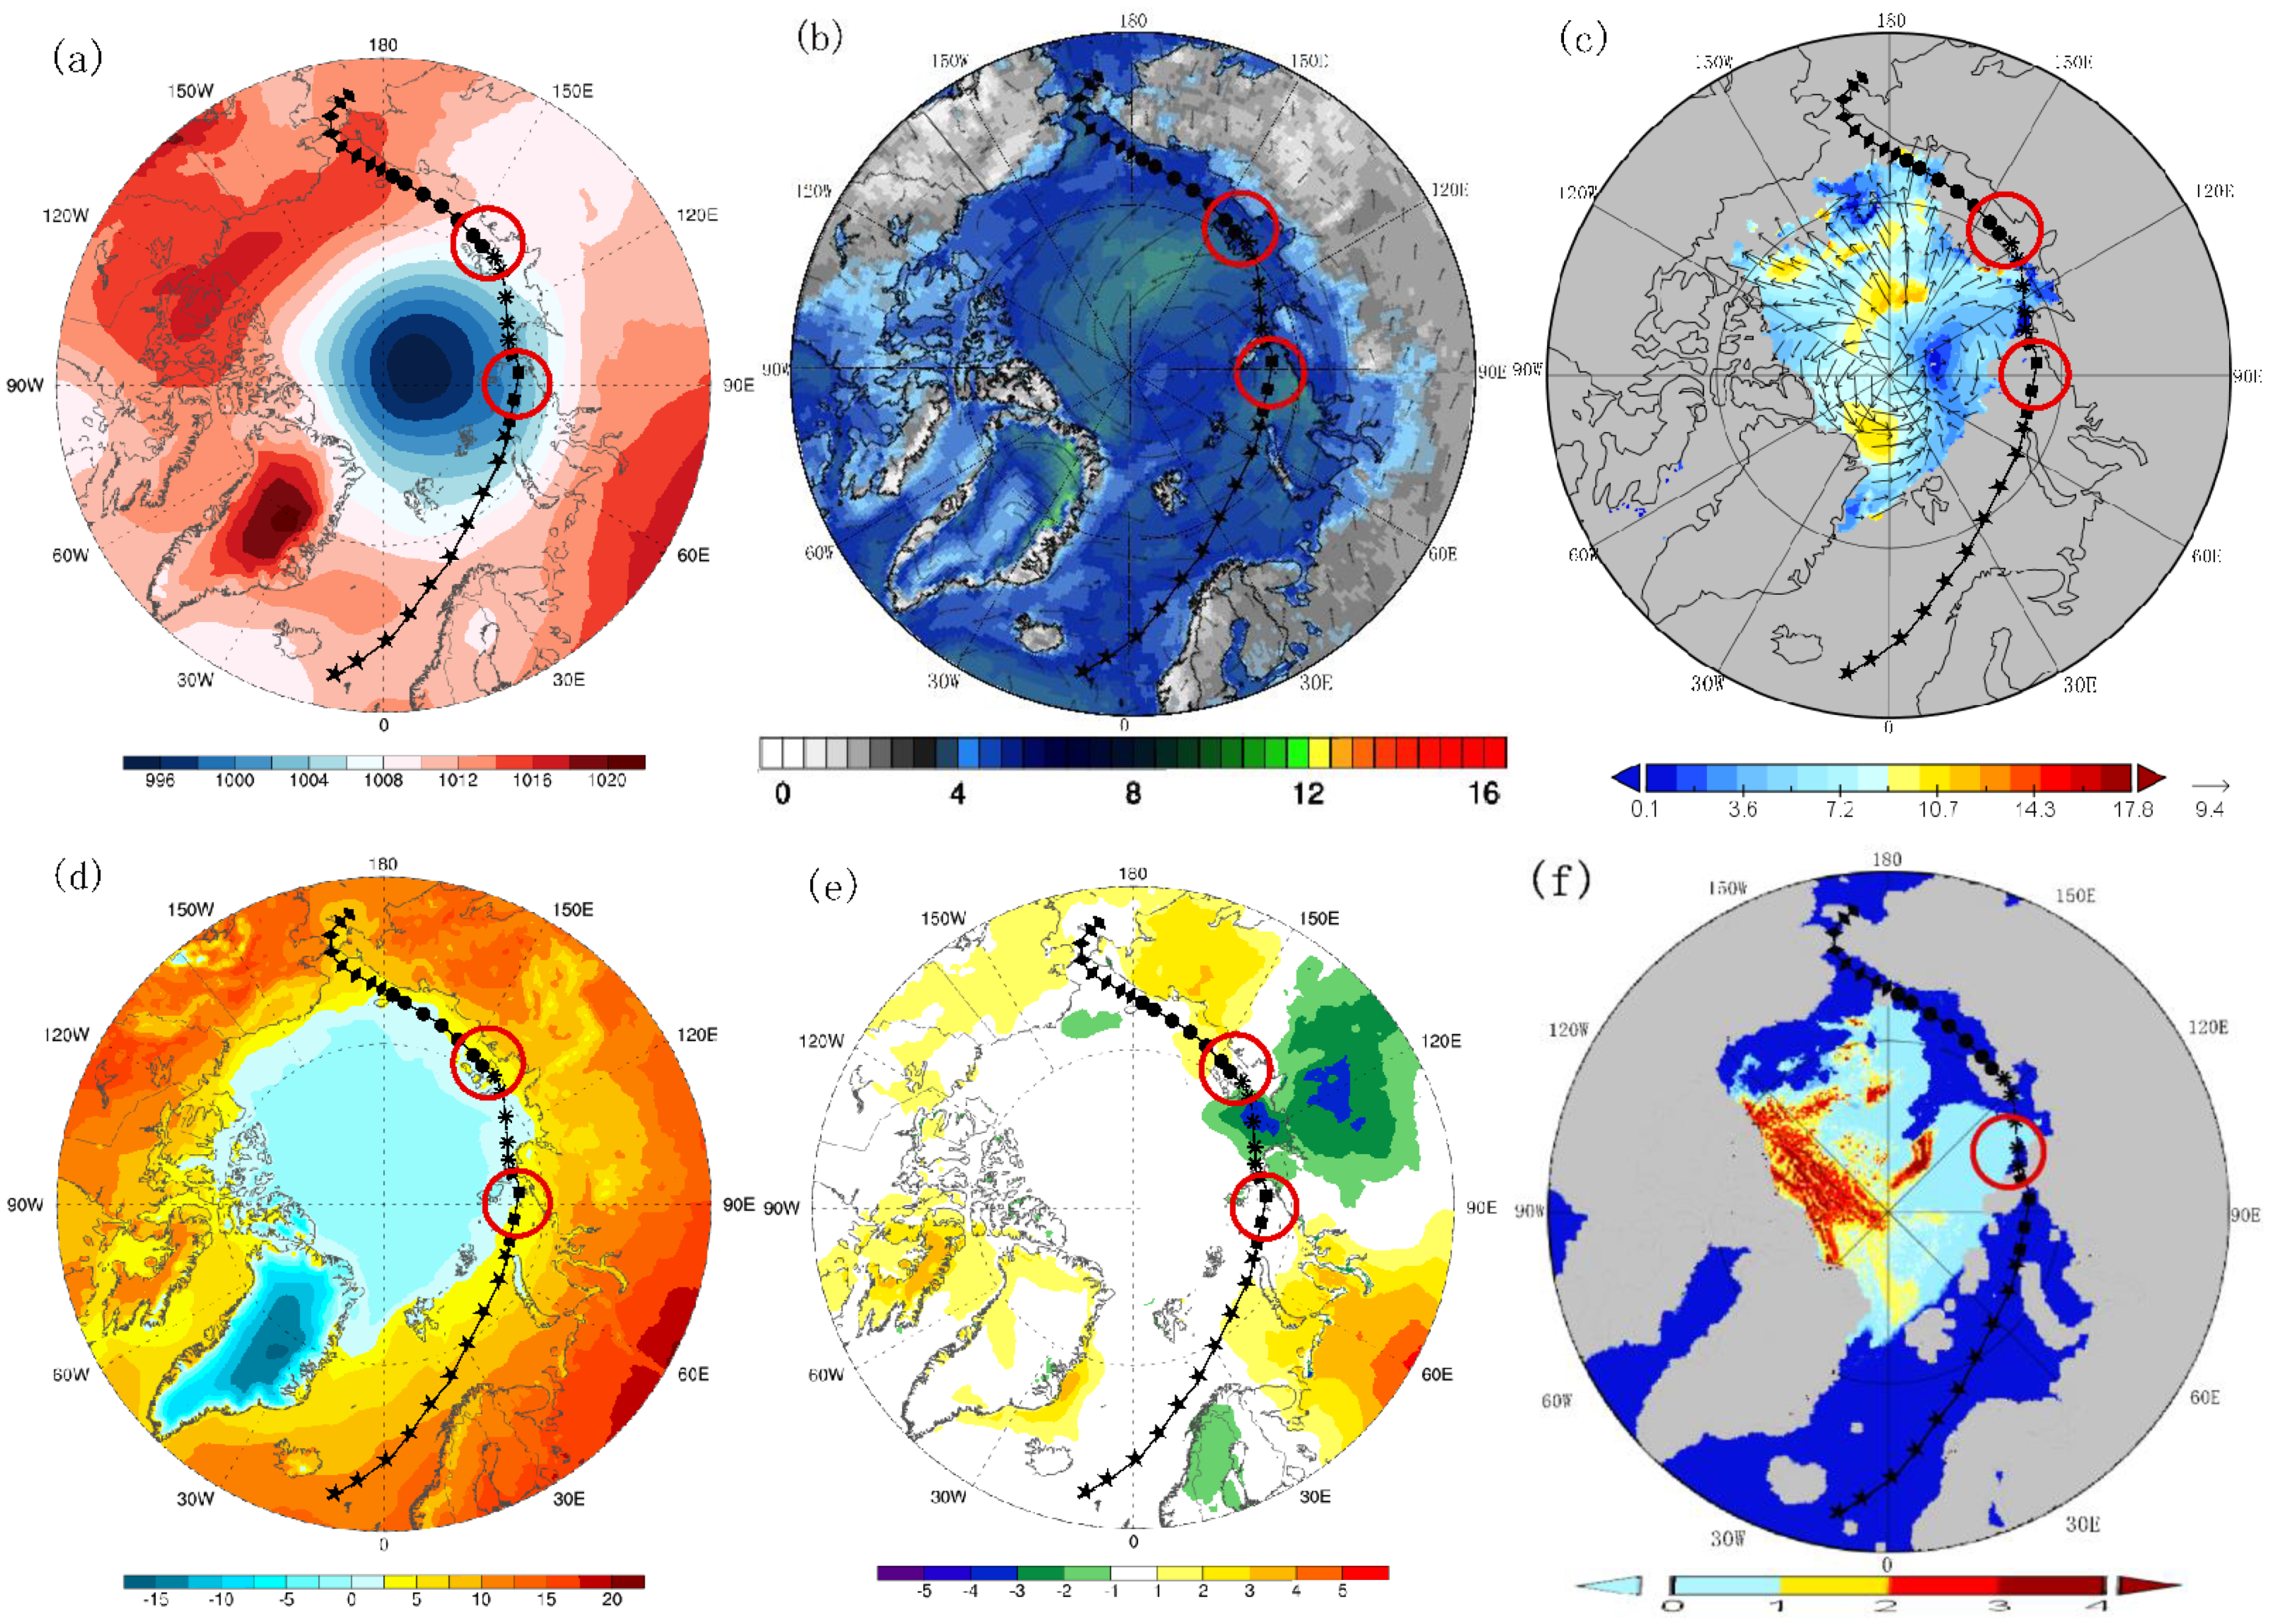
4.2. 2019
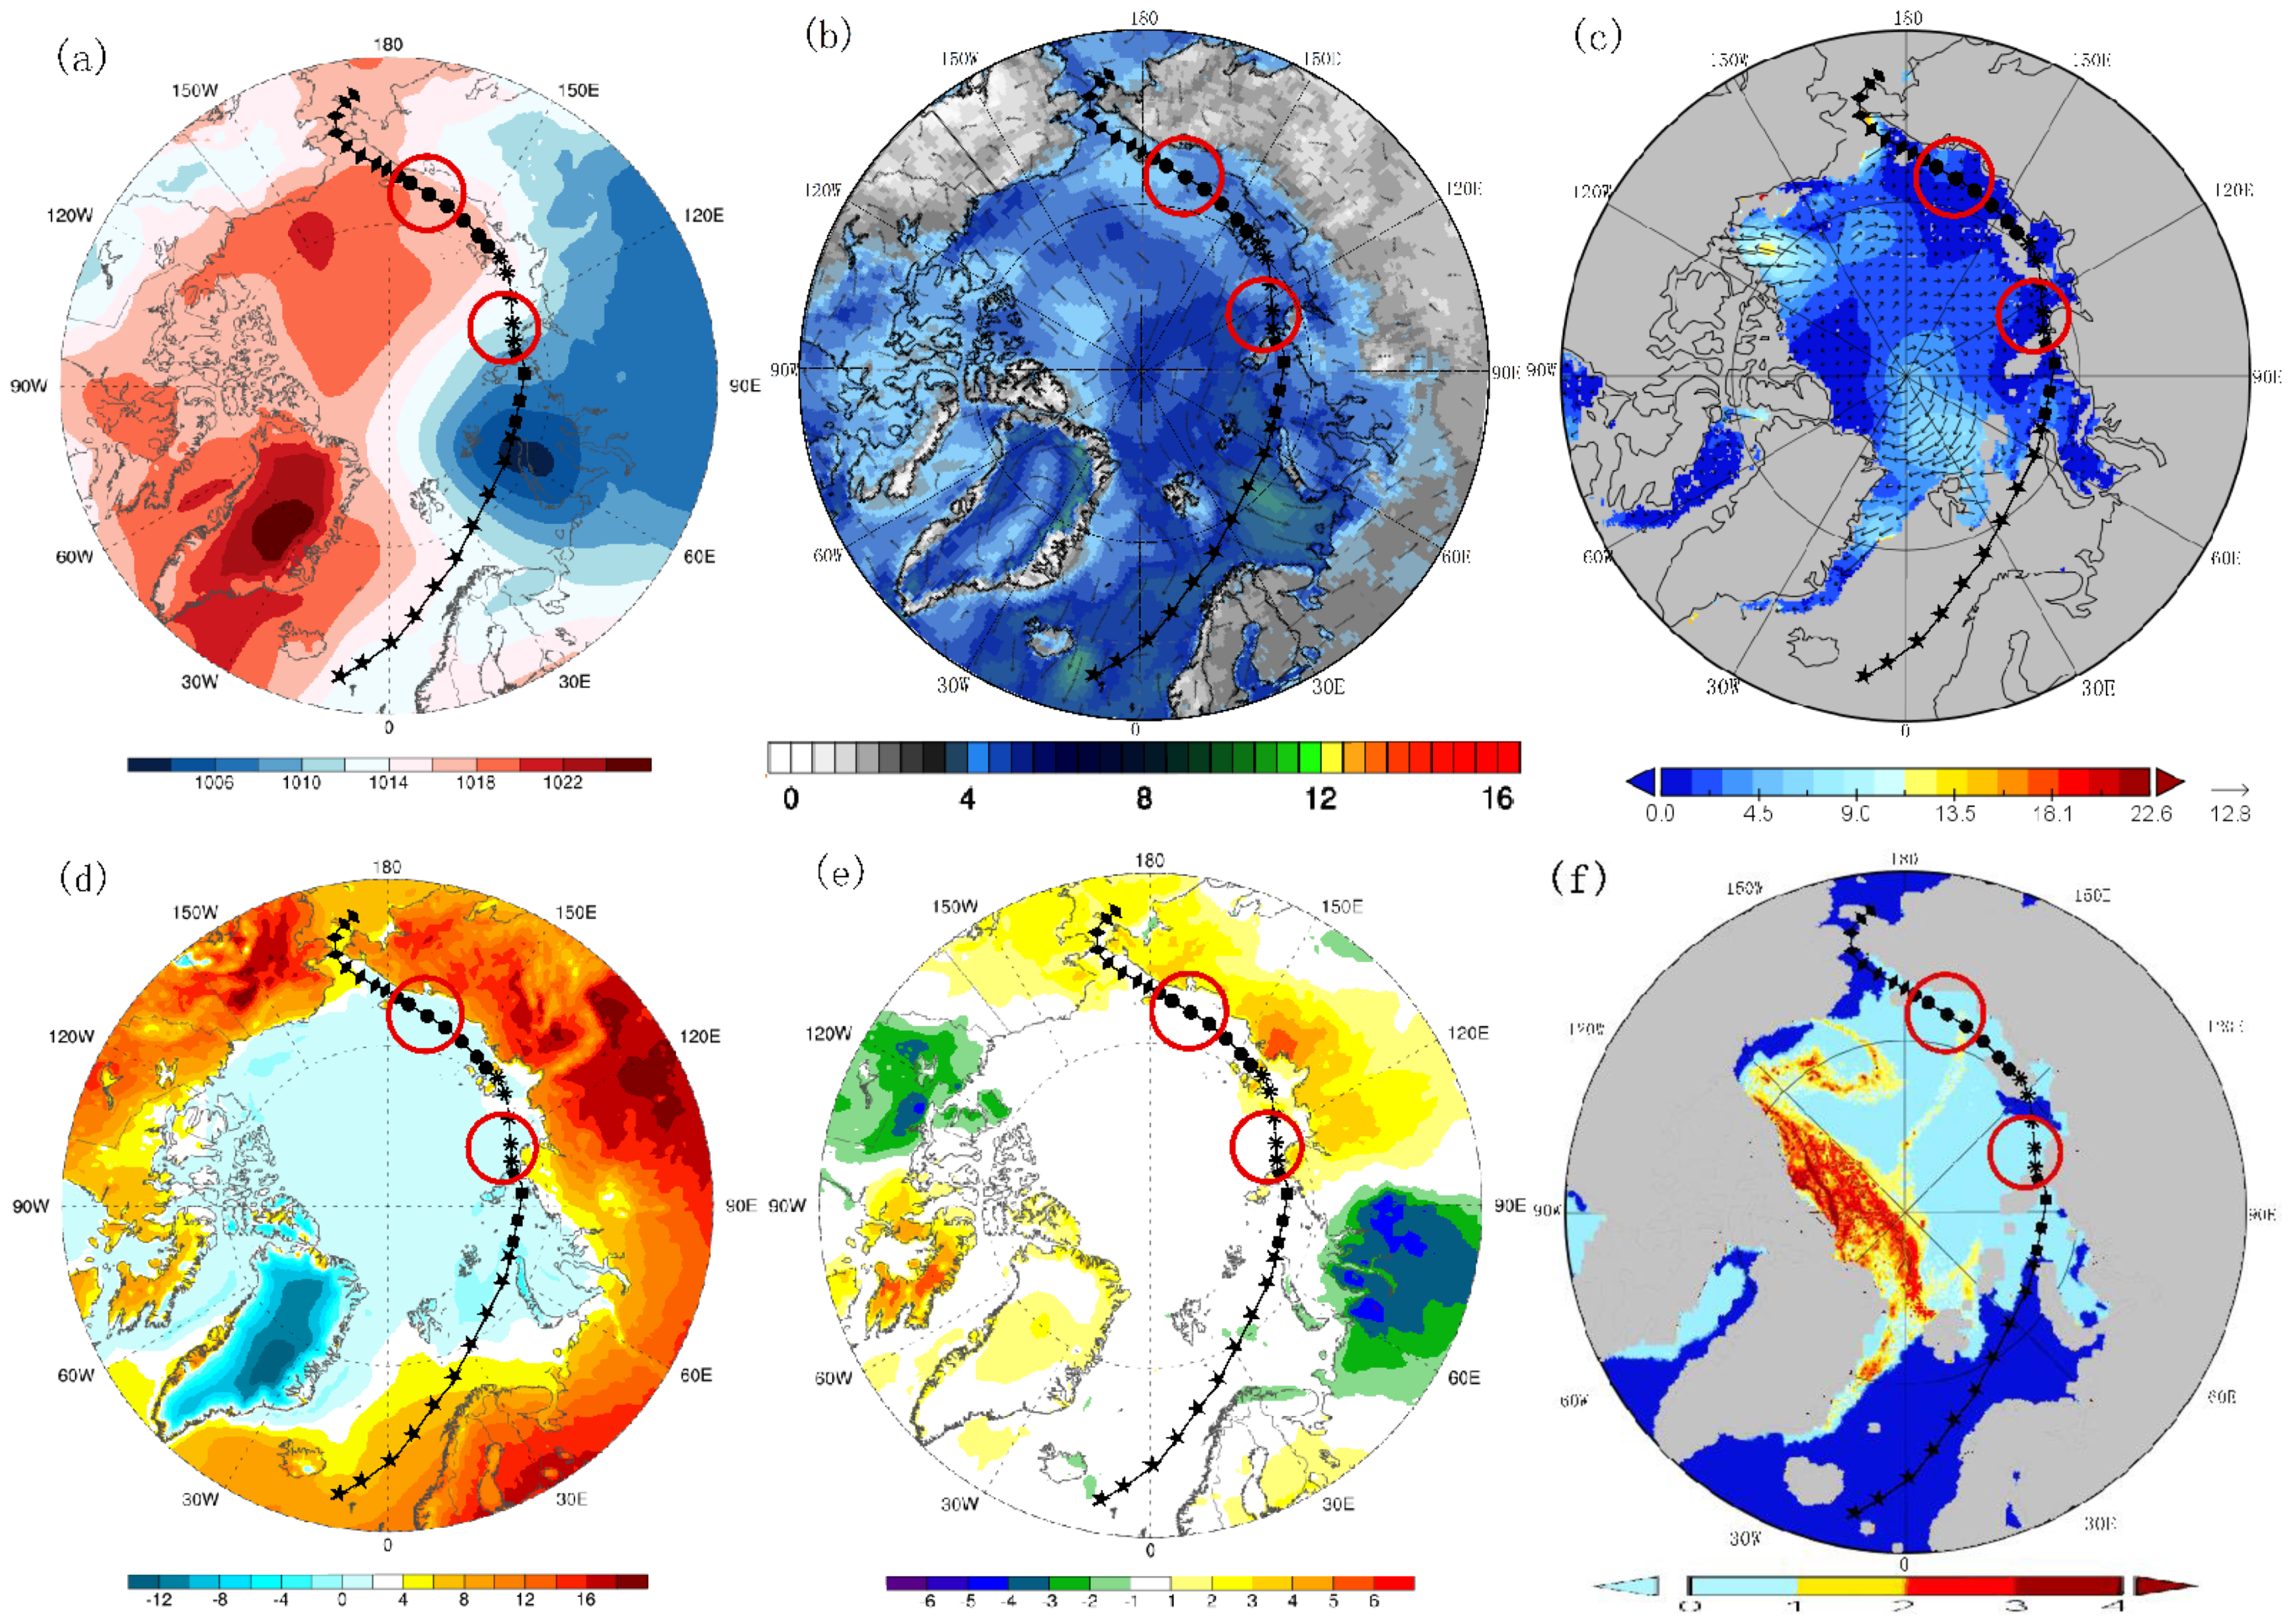
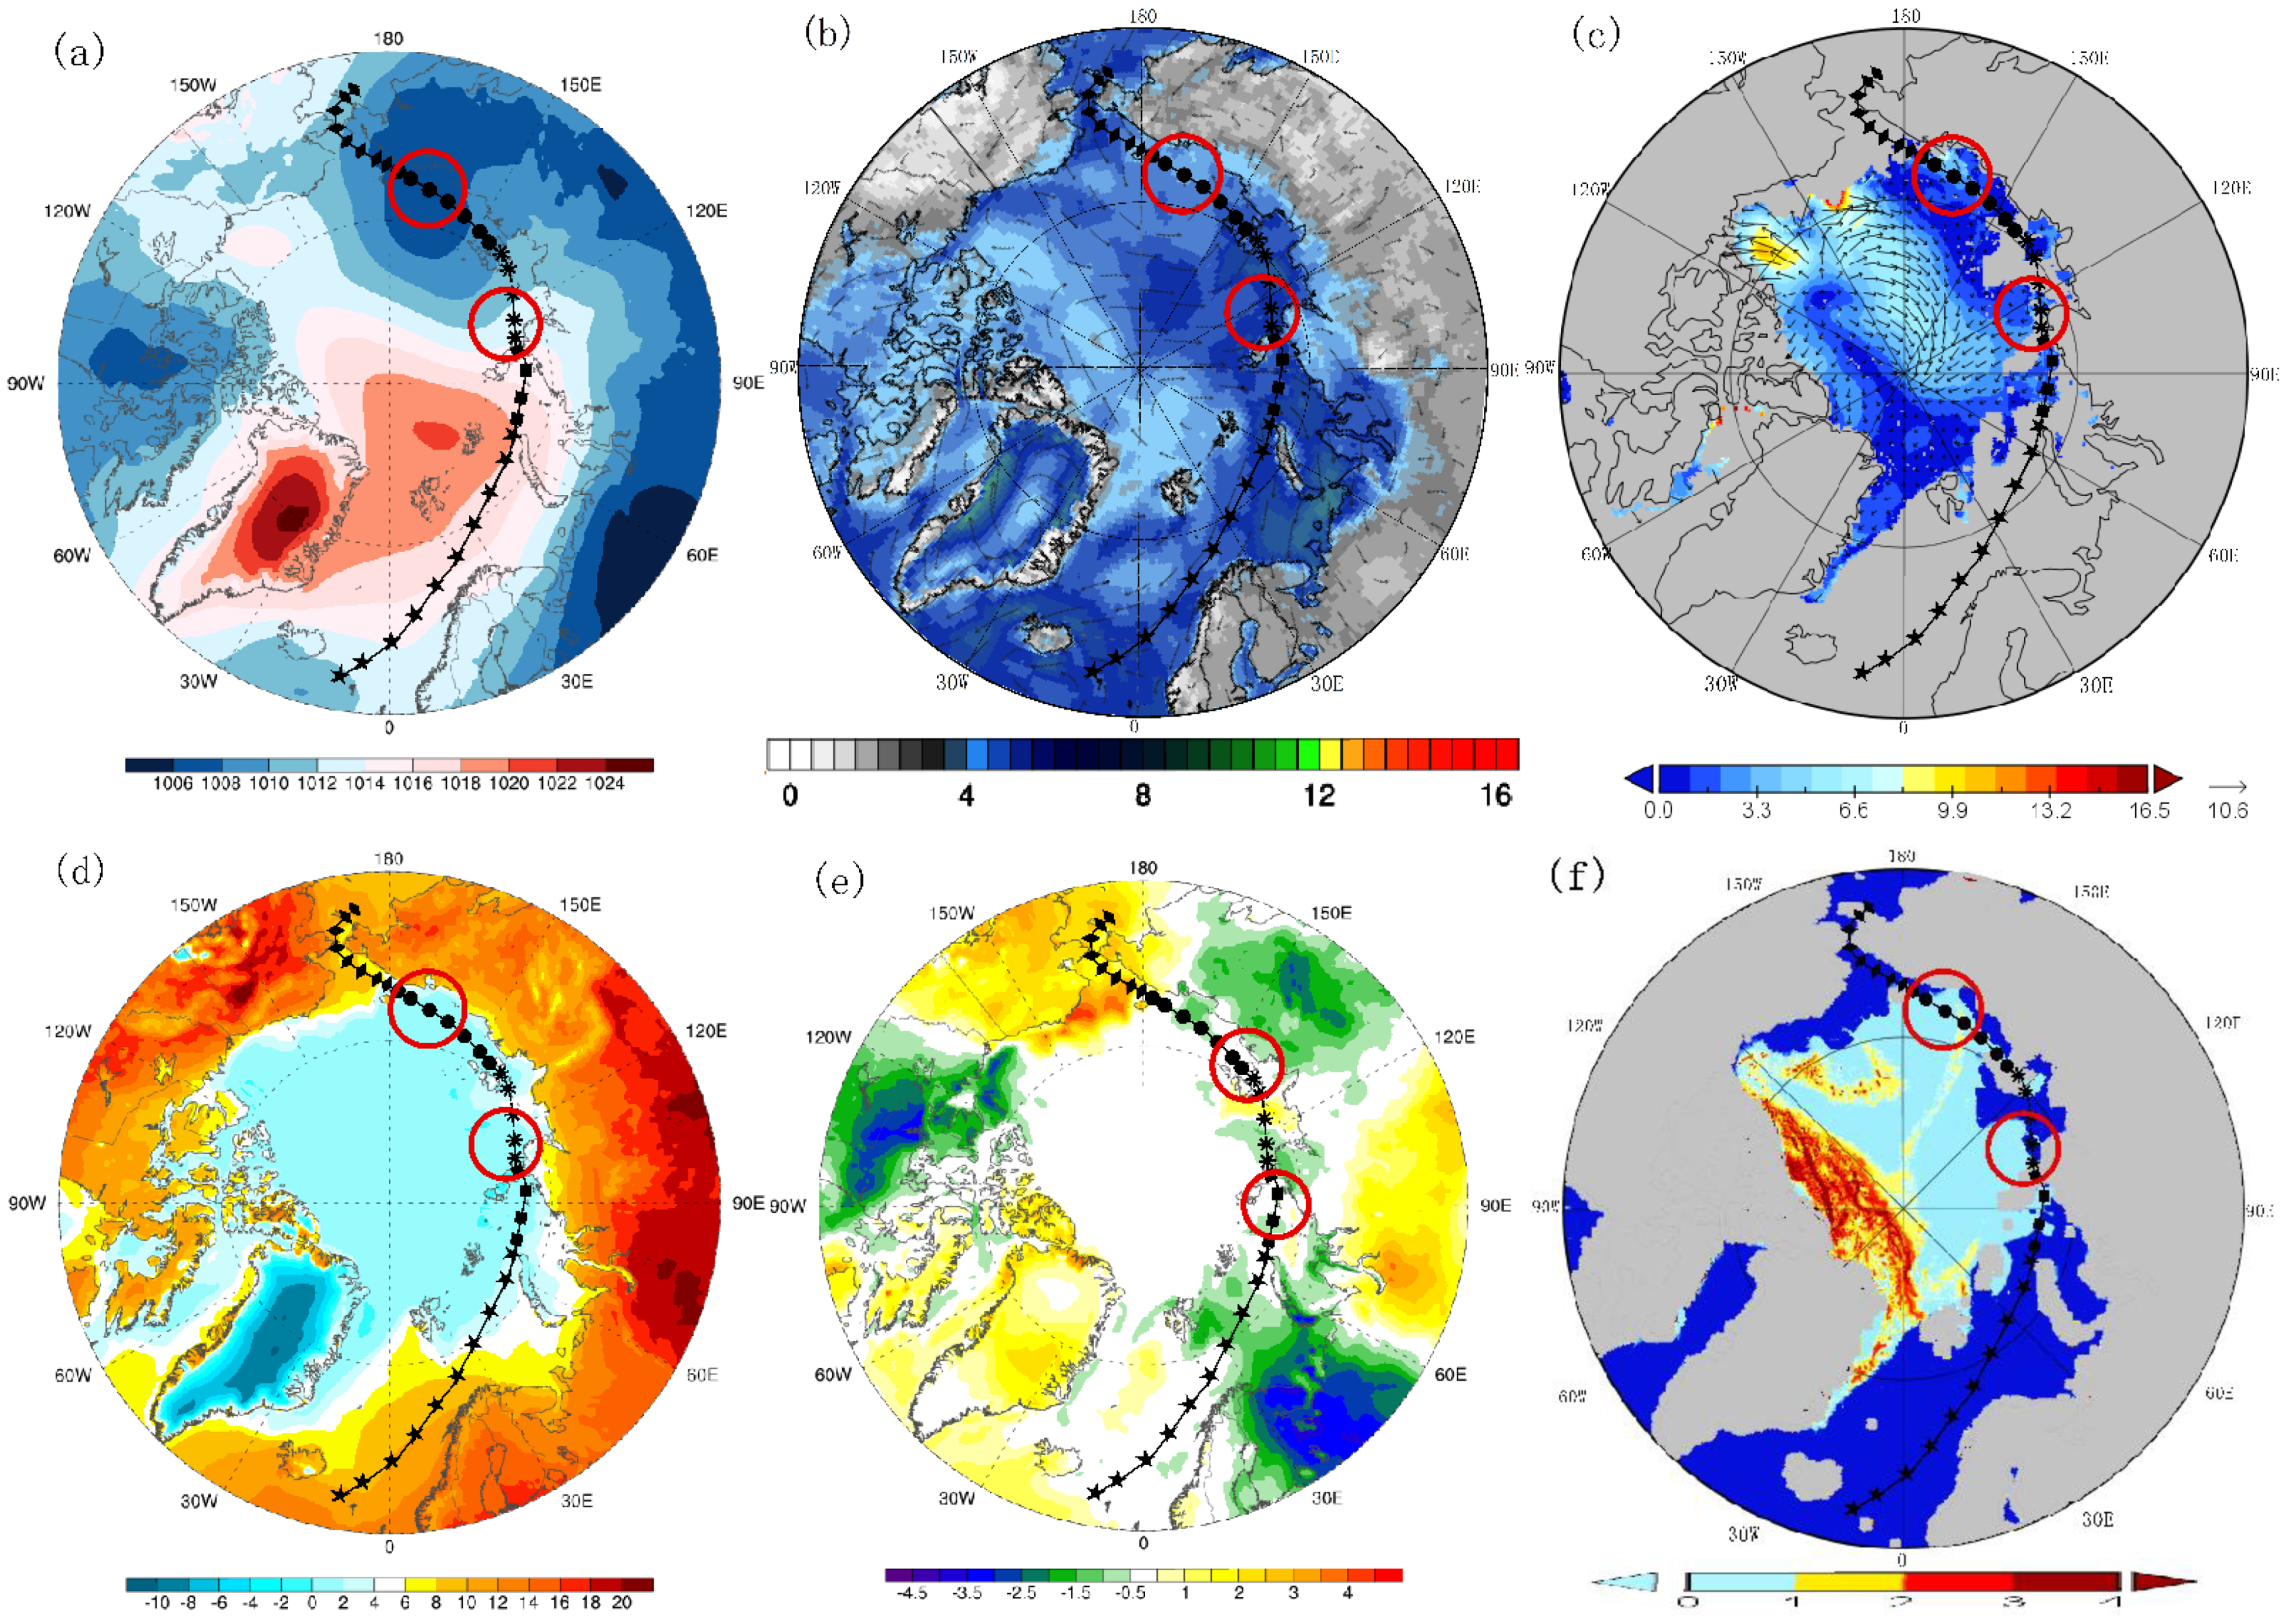
4.3. 2020
4.4. Discussion
5. Conclusions
- (1)
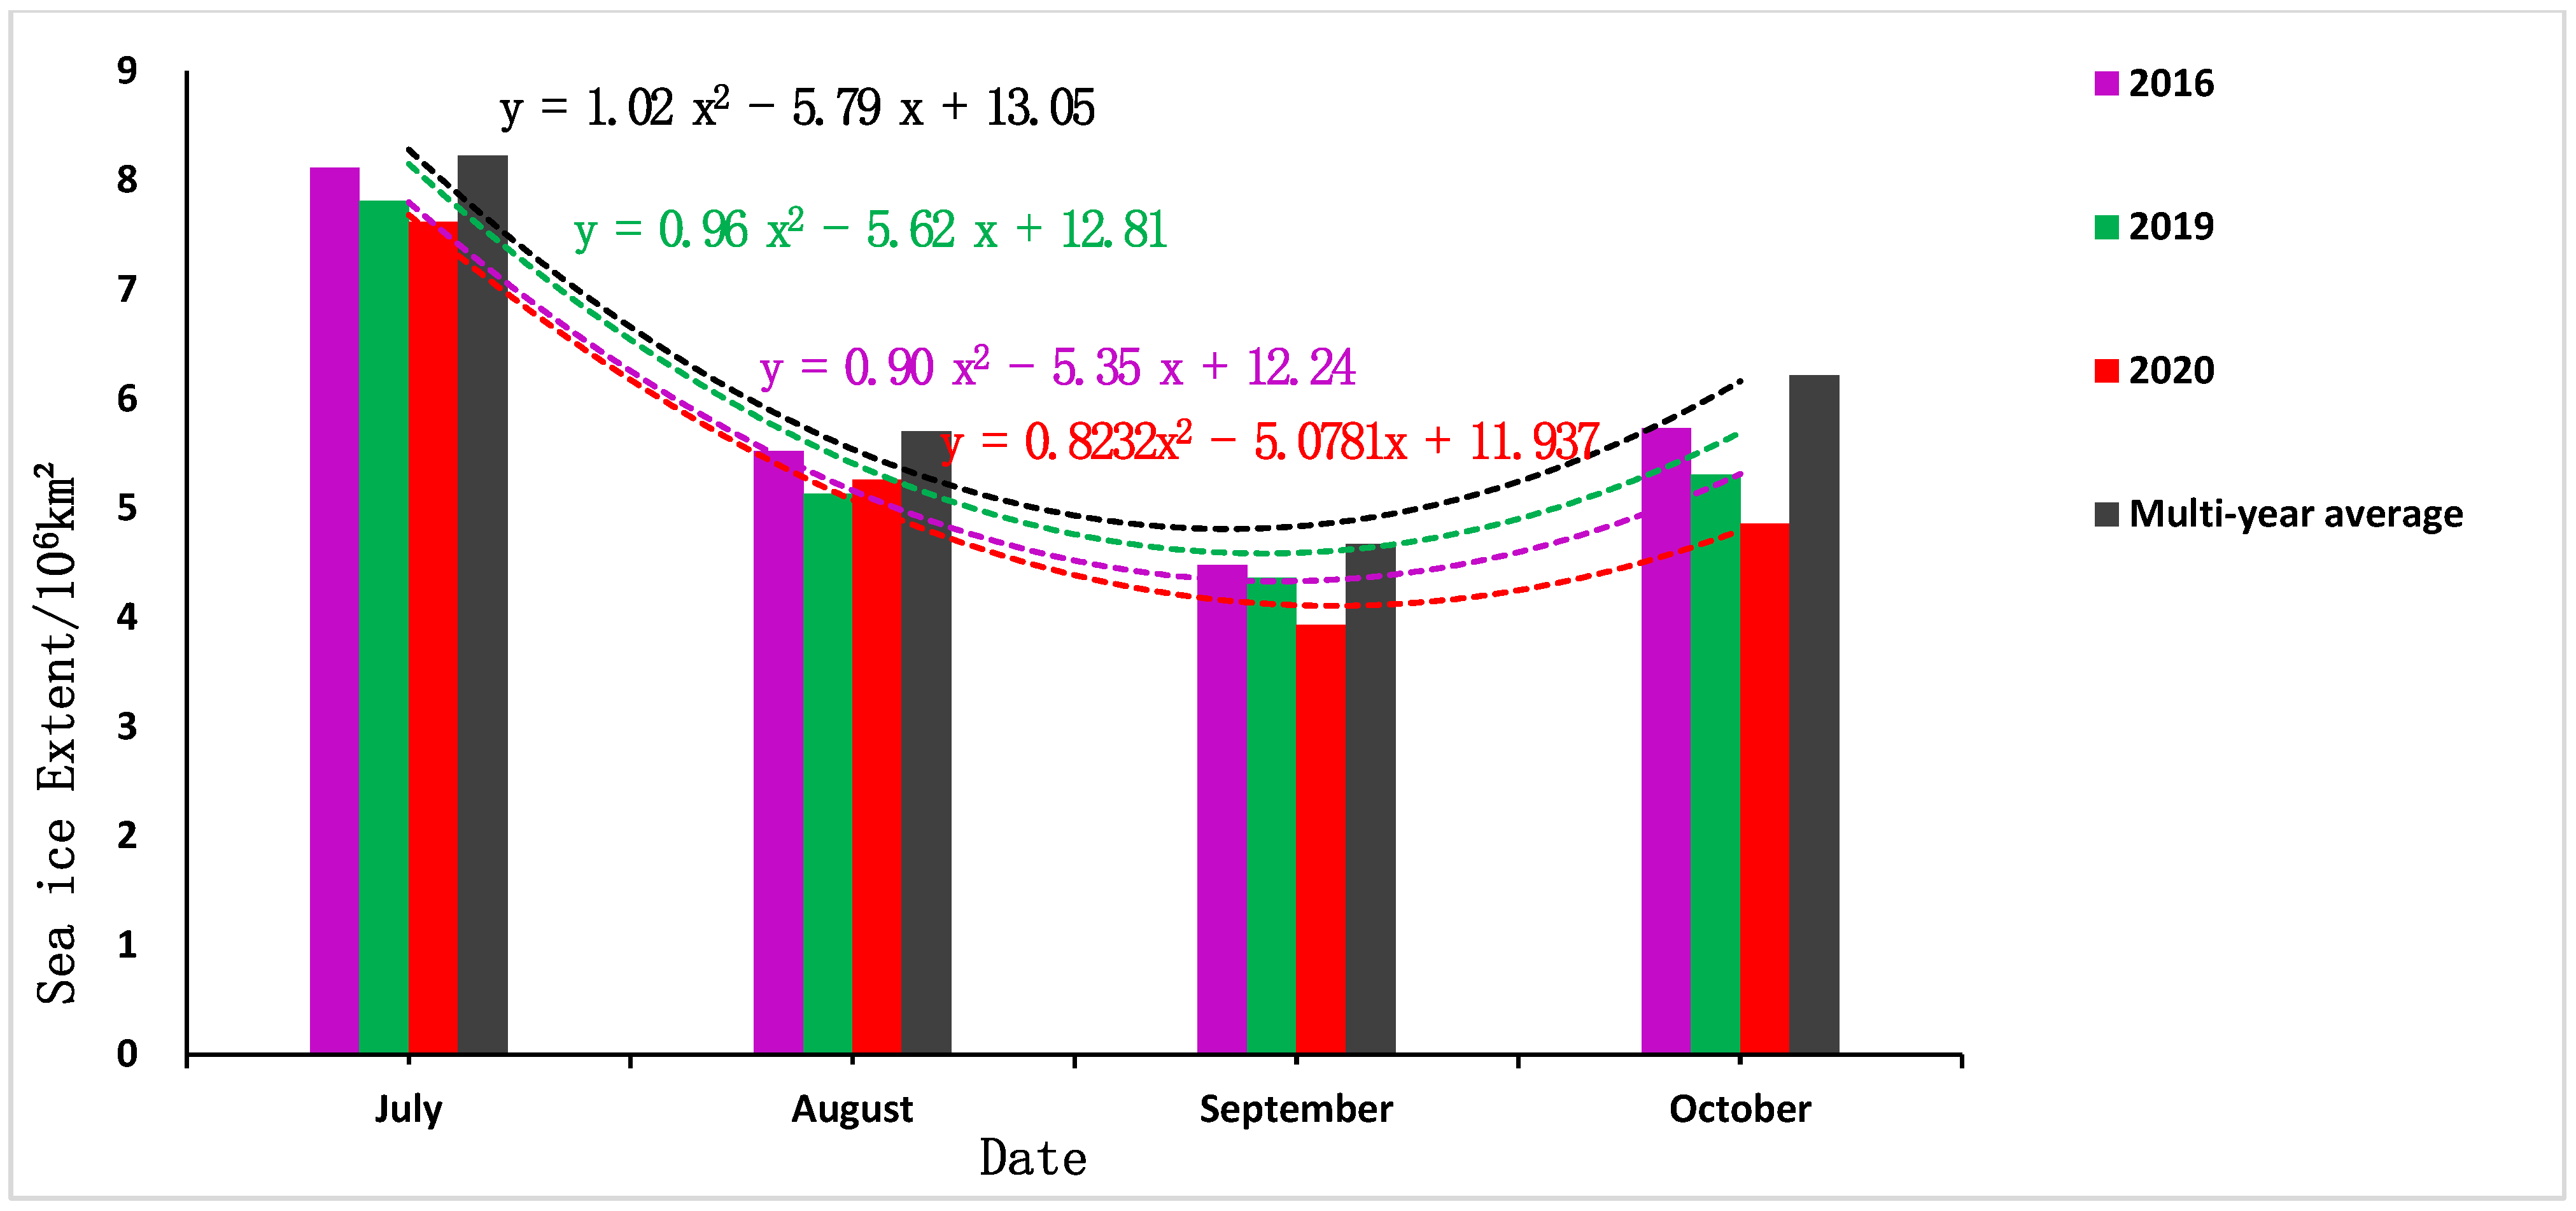
- The sea ice extent of 2016, 2019 and 2020 all reached the minimum sea ice extent of that year in mid-September. Among them, the sea ice extent in September 2020 was the smallest, 3.74 × 10⁶ km2. The sea ice extent in September 2016 and 2019 was similar. The sea ice extent in 2016 was 4.17 × 10⁶ km2, and in 2019 it was 4.2 × 10⁶ km2.
- (2)
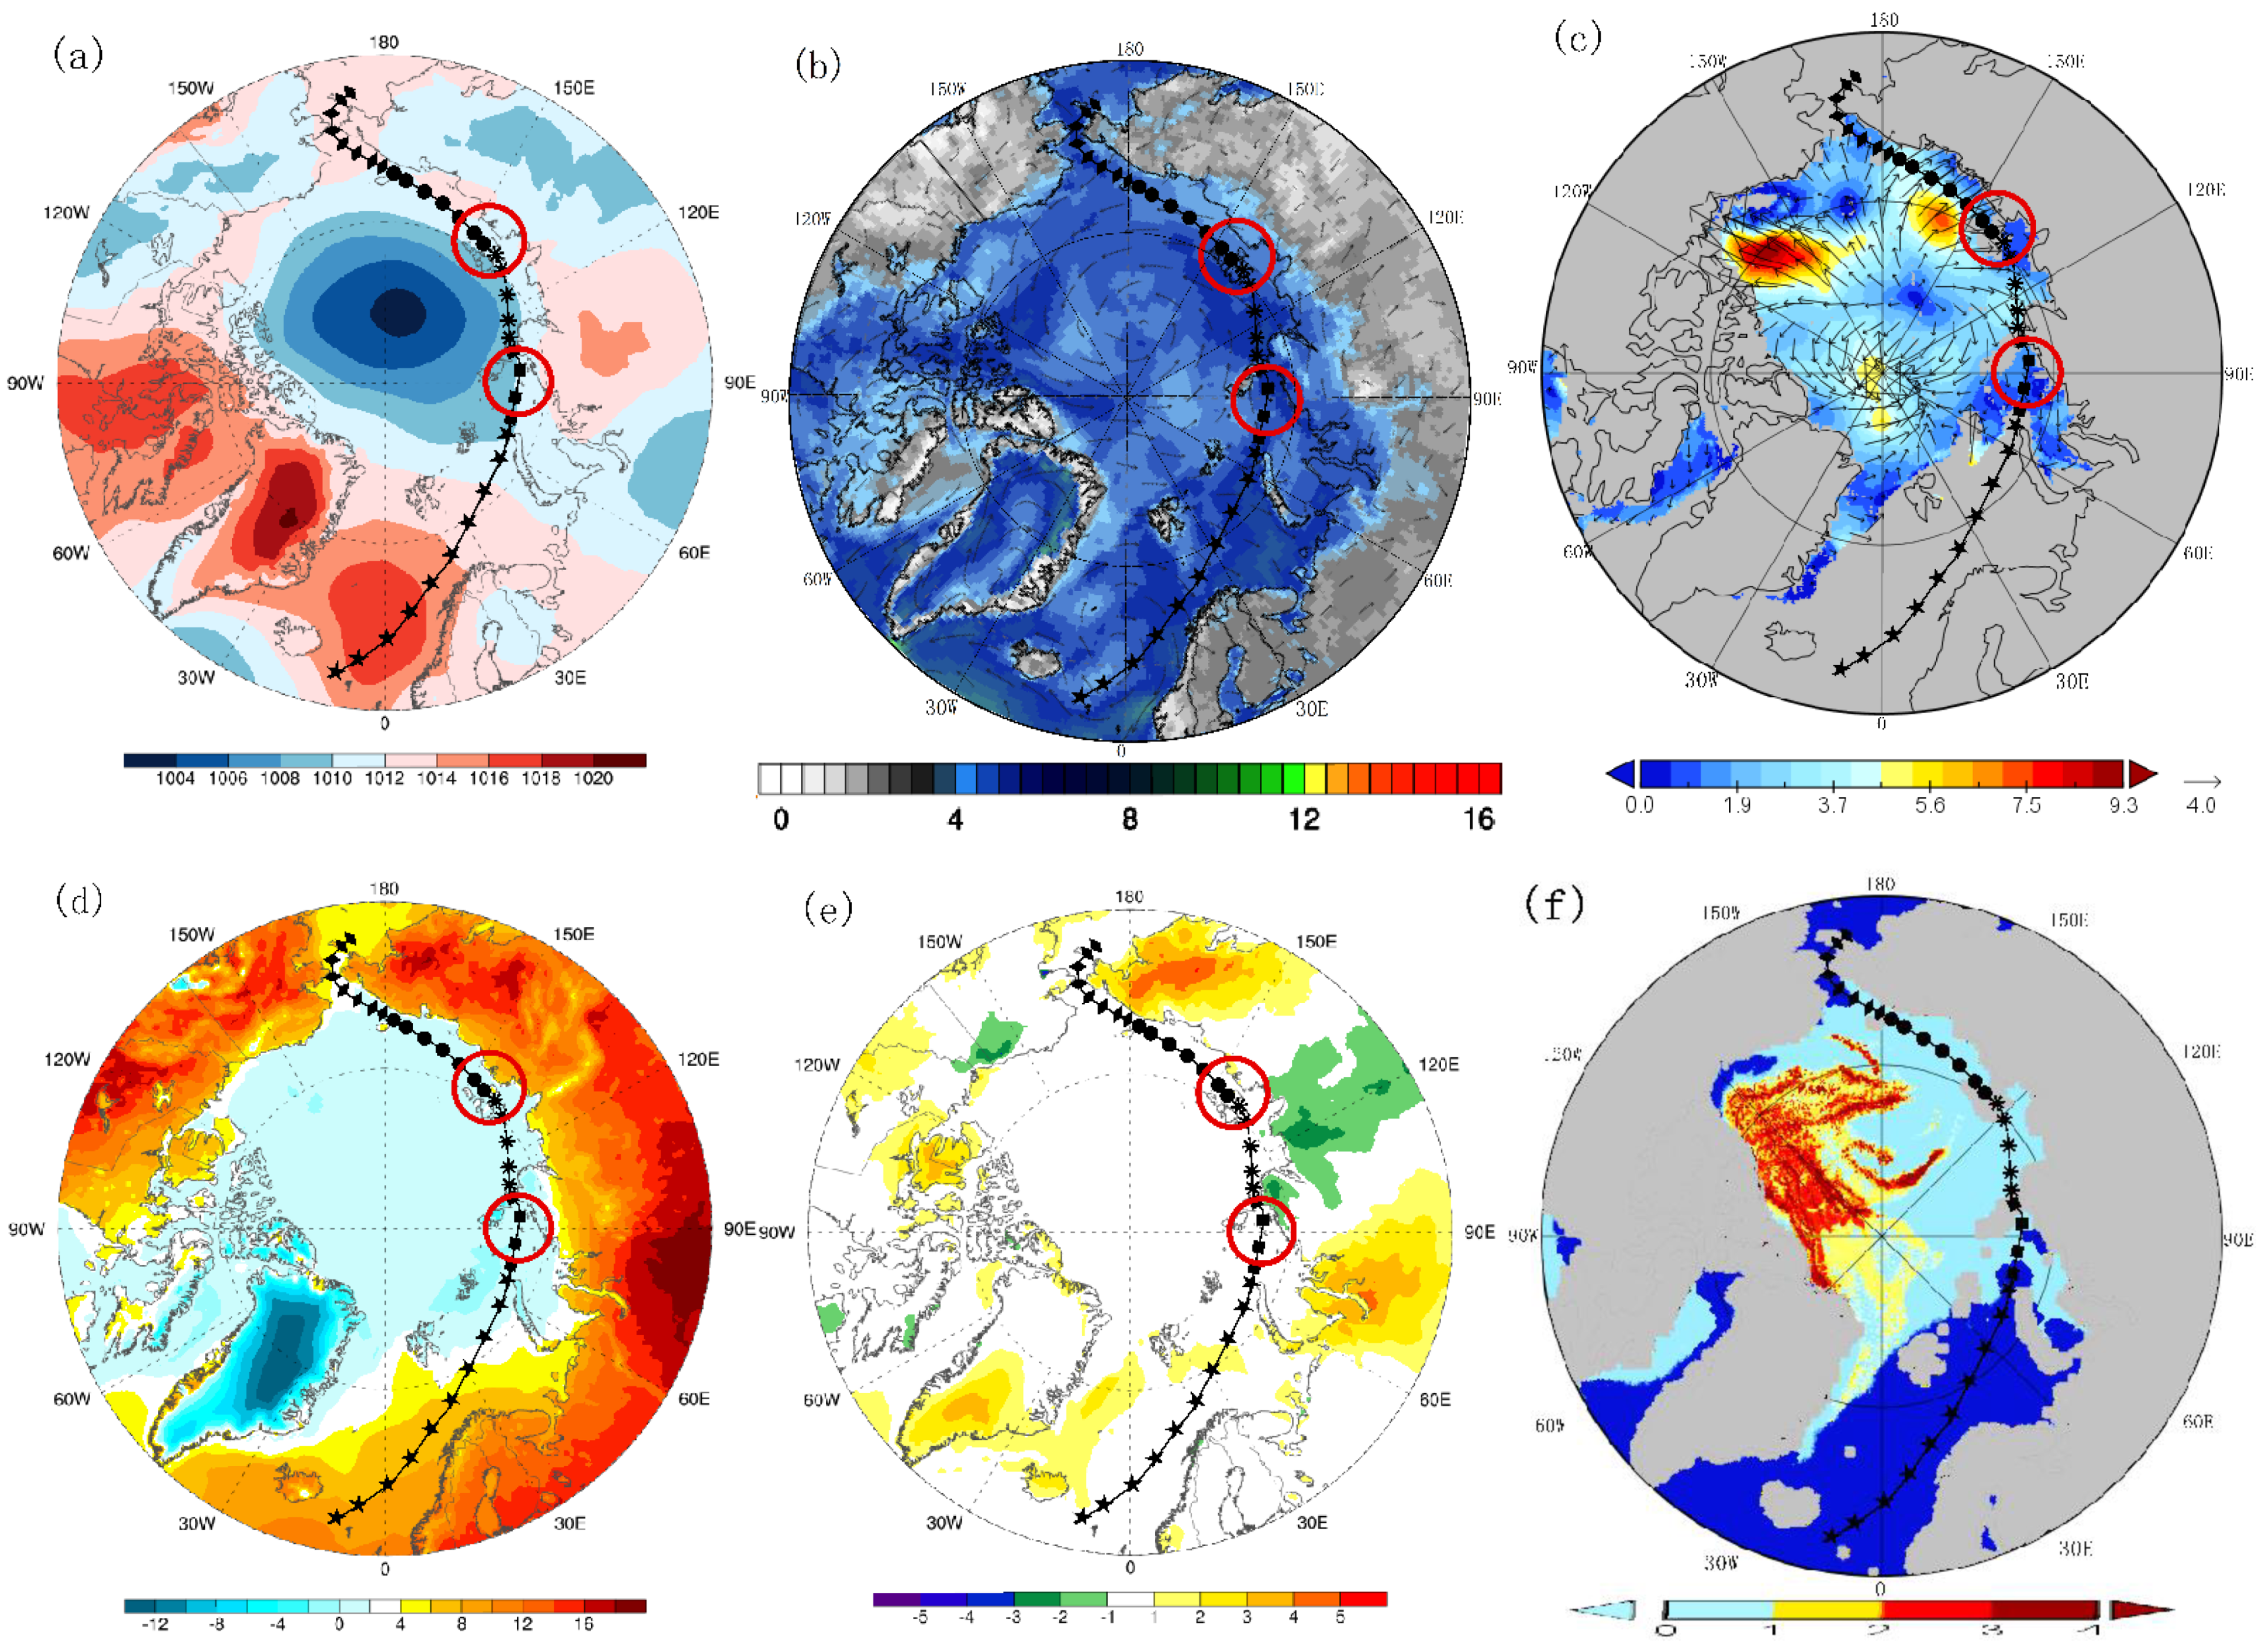
- Compared with the multi-year average sea ice extent, the monthly sea ice extent in the summer (July-October) in 2016, 2019 and 2020 were all lower than the average level, and the sea ice extent in October has the largest difference. The difference in October 2016 was 4.9 × 10⁵ km2, the difference in October 2019 was 9.1 × 10⁵ km2, and the difference in October 2020 was 1.36 × 10⁶ km2. Compared to the multi-year average, the summer of 2020 (July-October) in these three years had the largest change of sea ice extent, followed by 2016, the change trend in 2019 was relatively small.
- (3)
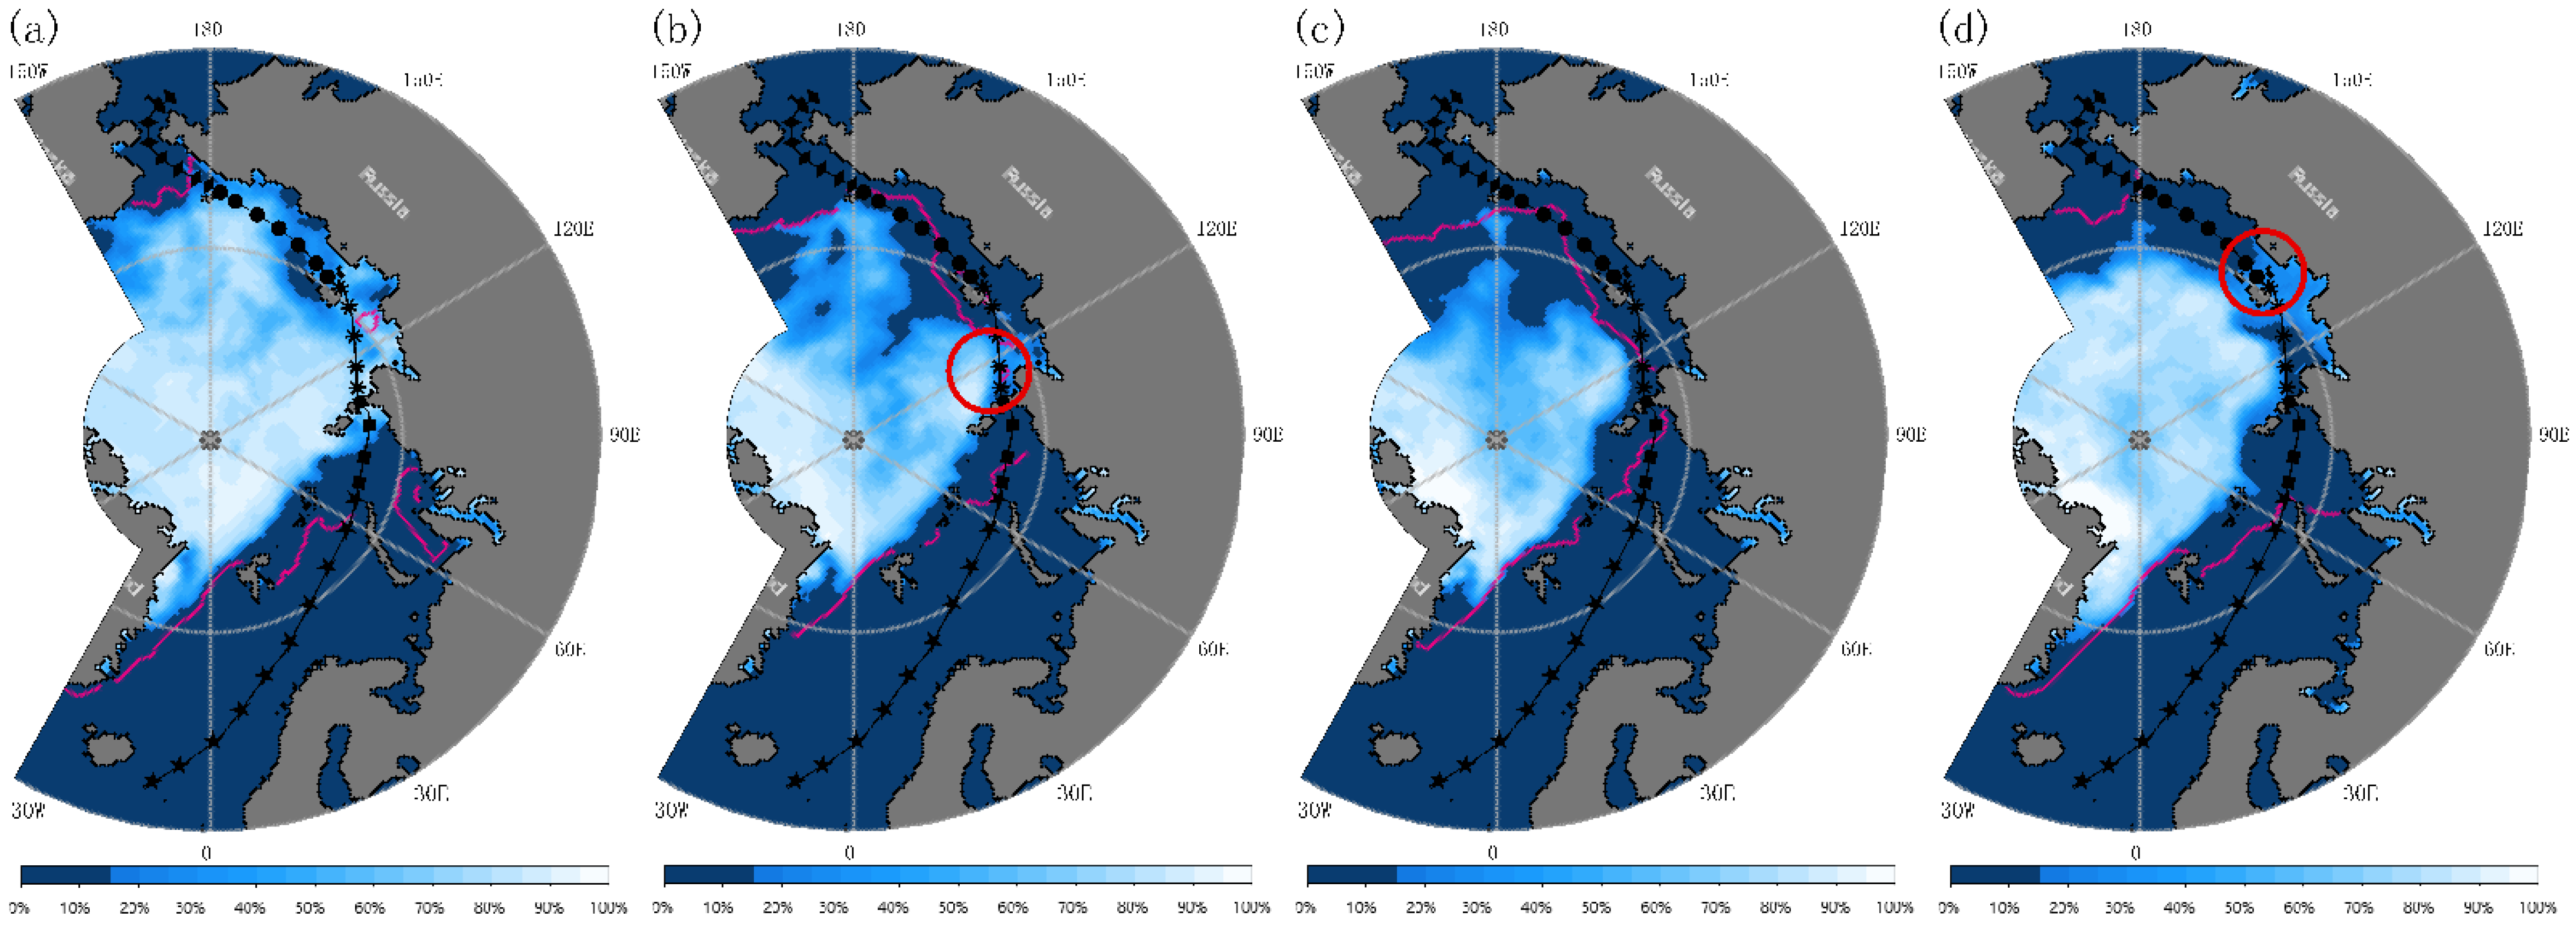
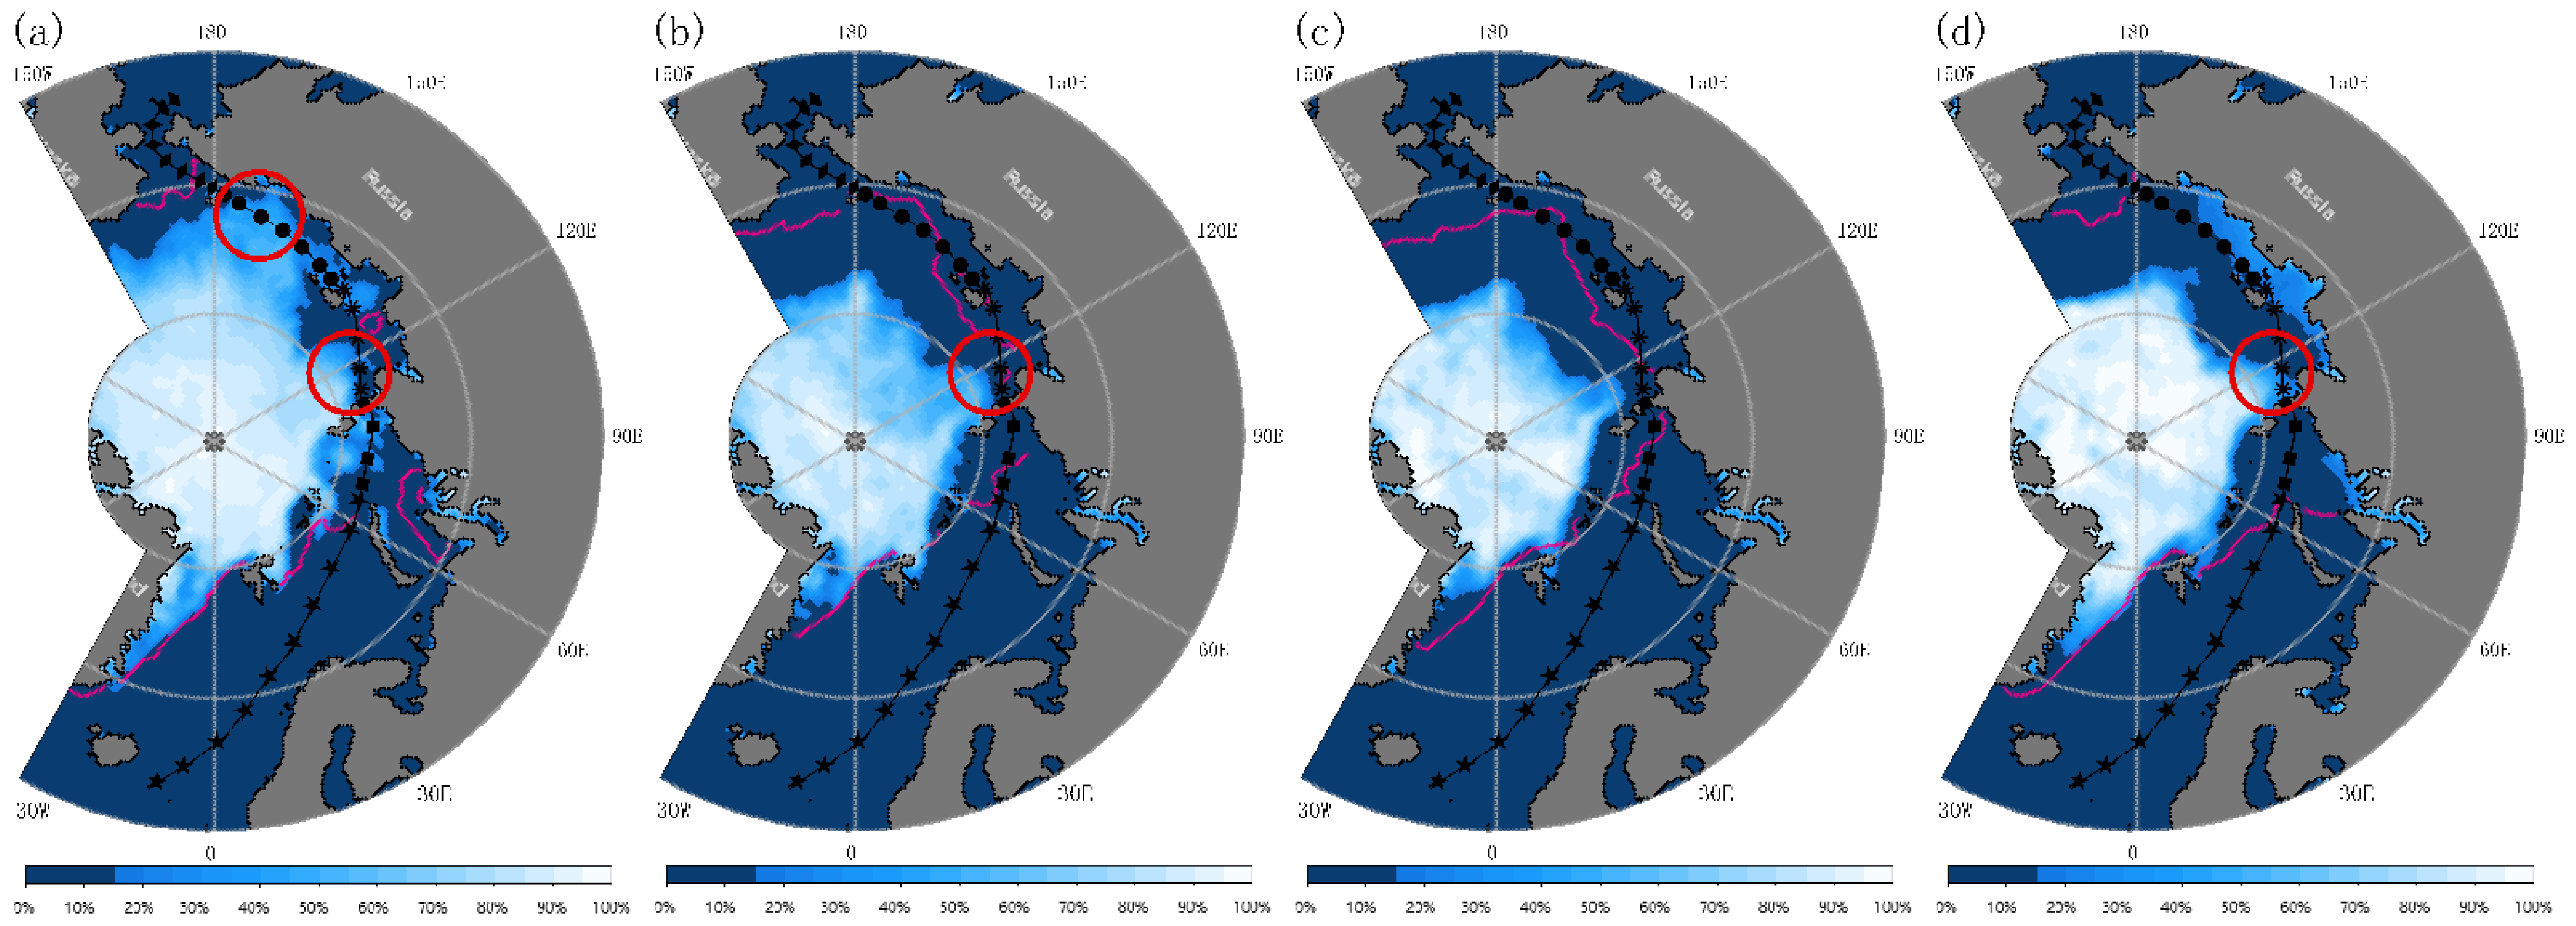
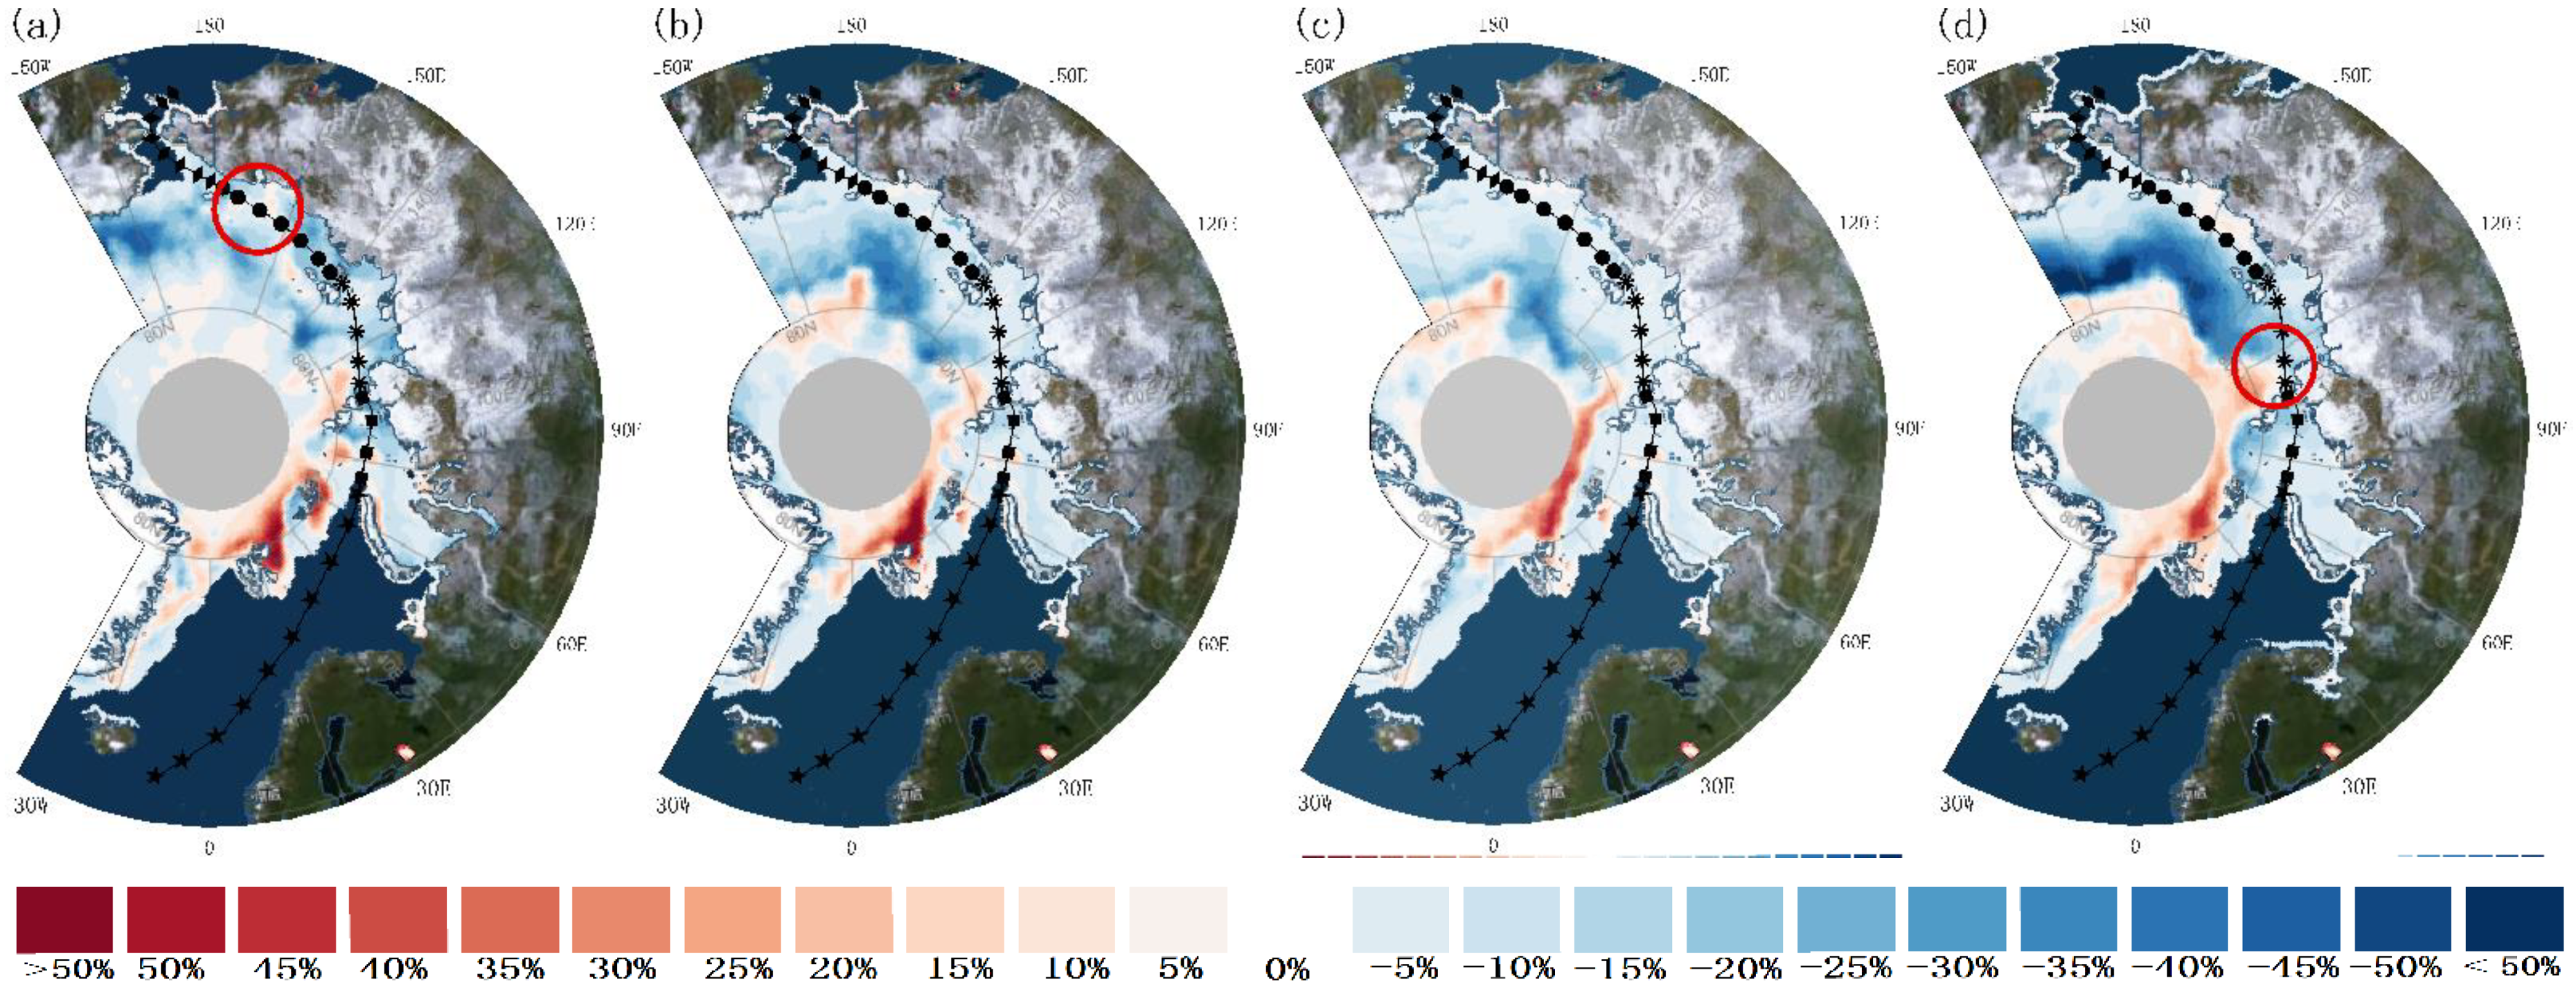
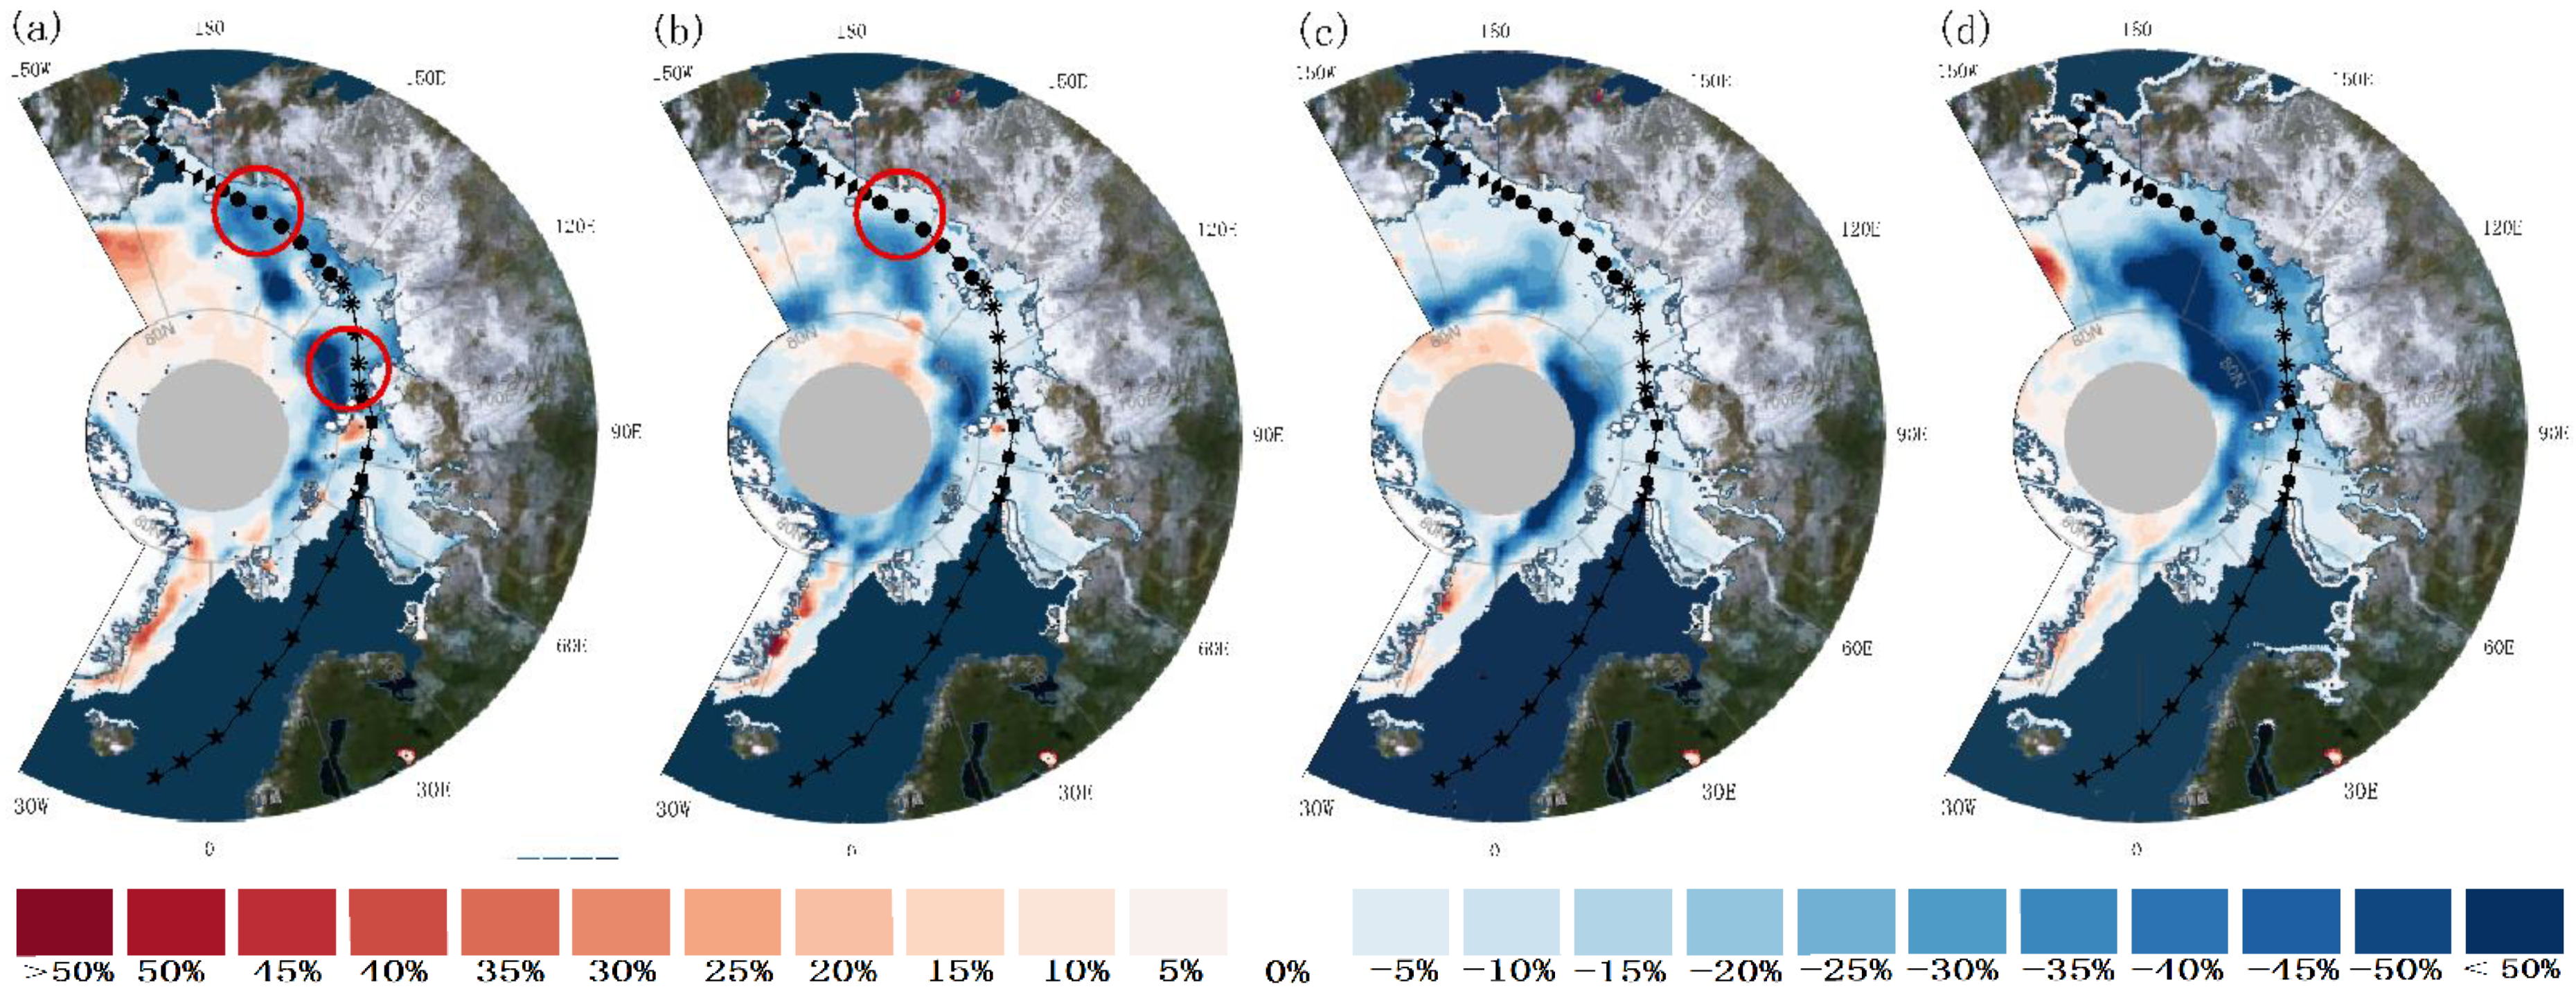
- The ice condition of the NEP in 2016 was relatively good. In July, the sea ice concentration of the East Siberian Sea and the Laptev Sea was about 60%, and the sea ice concentration of these two sea areas was abnormally higher than the multi-year average by about 30%. From August to October, the sea ice concentration in the sea area passed by the NEP was below 30%, which was little hindrance to navigation.
- (4)
- The ice conditions in 2019 were better than those in 2016. In July, 30–60% of the sea ice was distributed in the Vilkitsky Strait and the East Siberian Sea in the NEP. The sea ice concentration in the middle of the East Siberian Sea was 10% higher than the multi-year average, and navigation was more difficult. In August and September there was an ice-free area in the NEP. In October, only in the eastern part of the Vilkitsky Strait was distributed a small amount of about 30% of the sea ice in the NEP.
- (5)
- The NEP had the best ice conditions in 2020. In July, only a small amount of about 50% of the sea ice was distributed in the western part of the Vilkitsky Strait. The ice conditions in the other segments were great. The sea ice concentration along the NEP was abnormally lower than the multi-year average, which greatly promoted the opening of the NEP. From August to October, there was very little sea ice in the NEP, and the sea ice concentration was still abnormally lower than the multi-year average by 40%.
- (6)
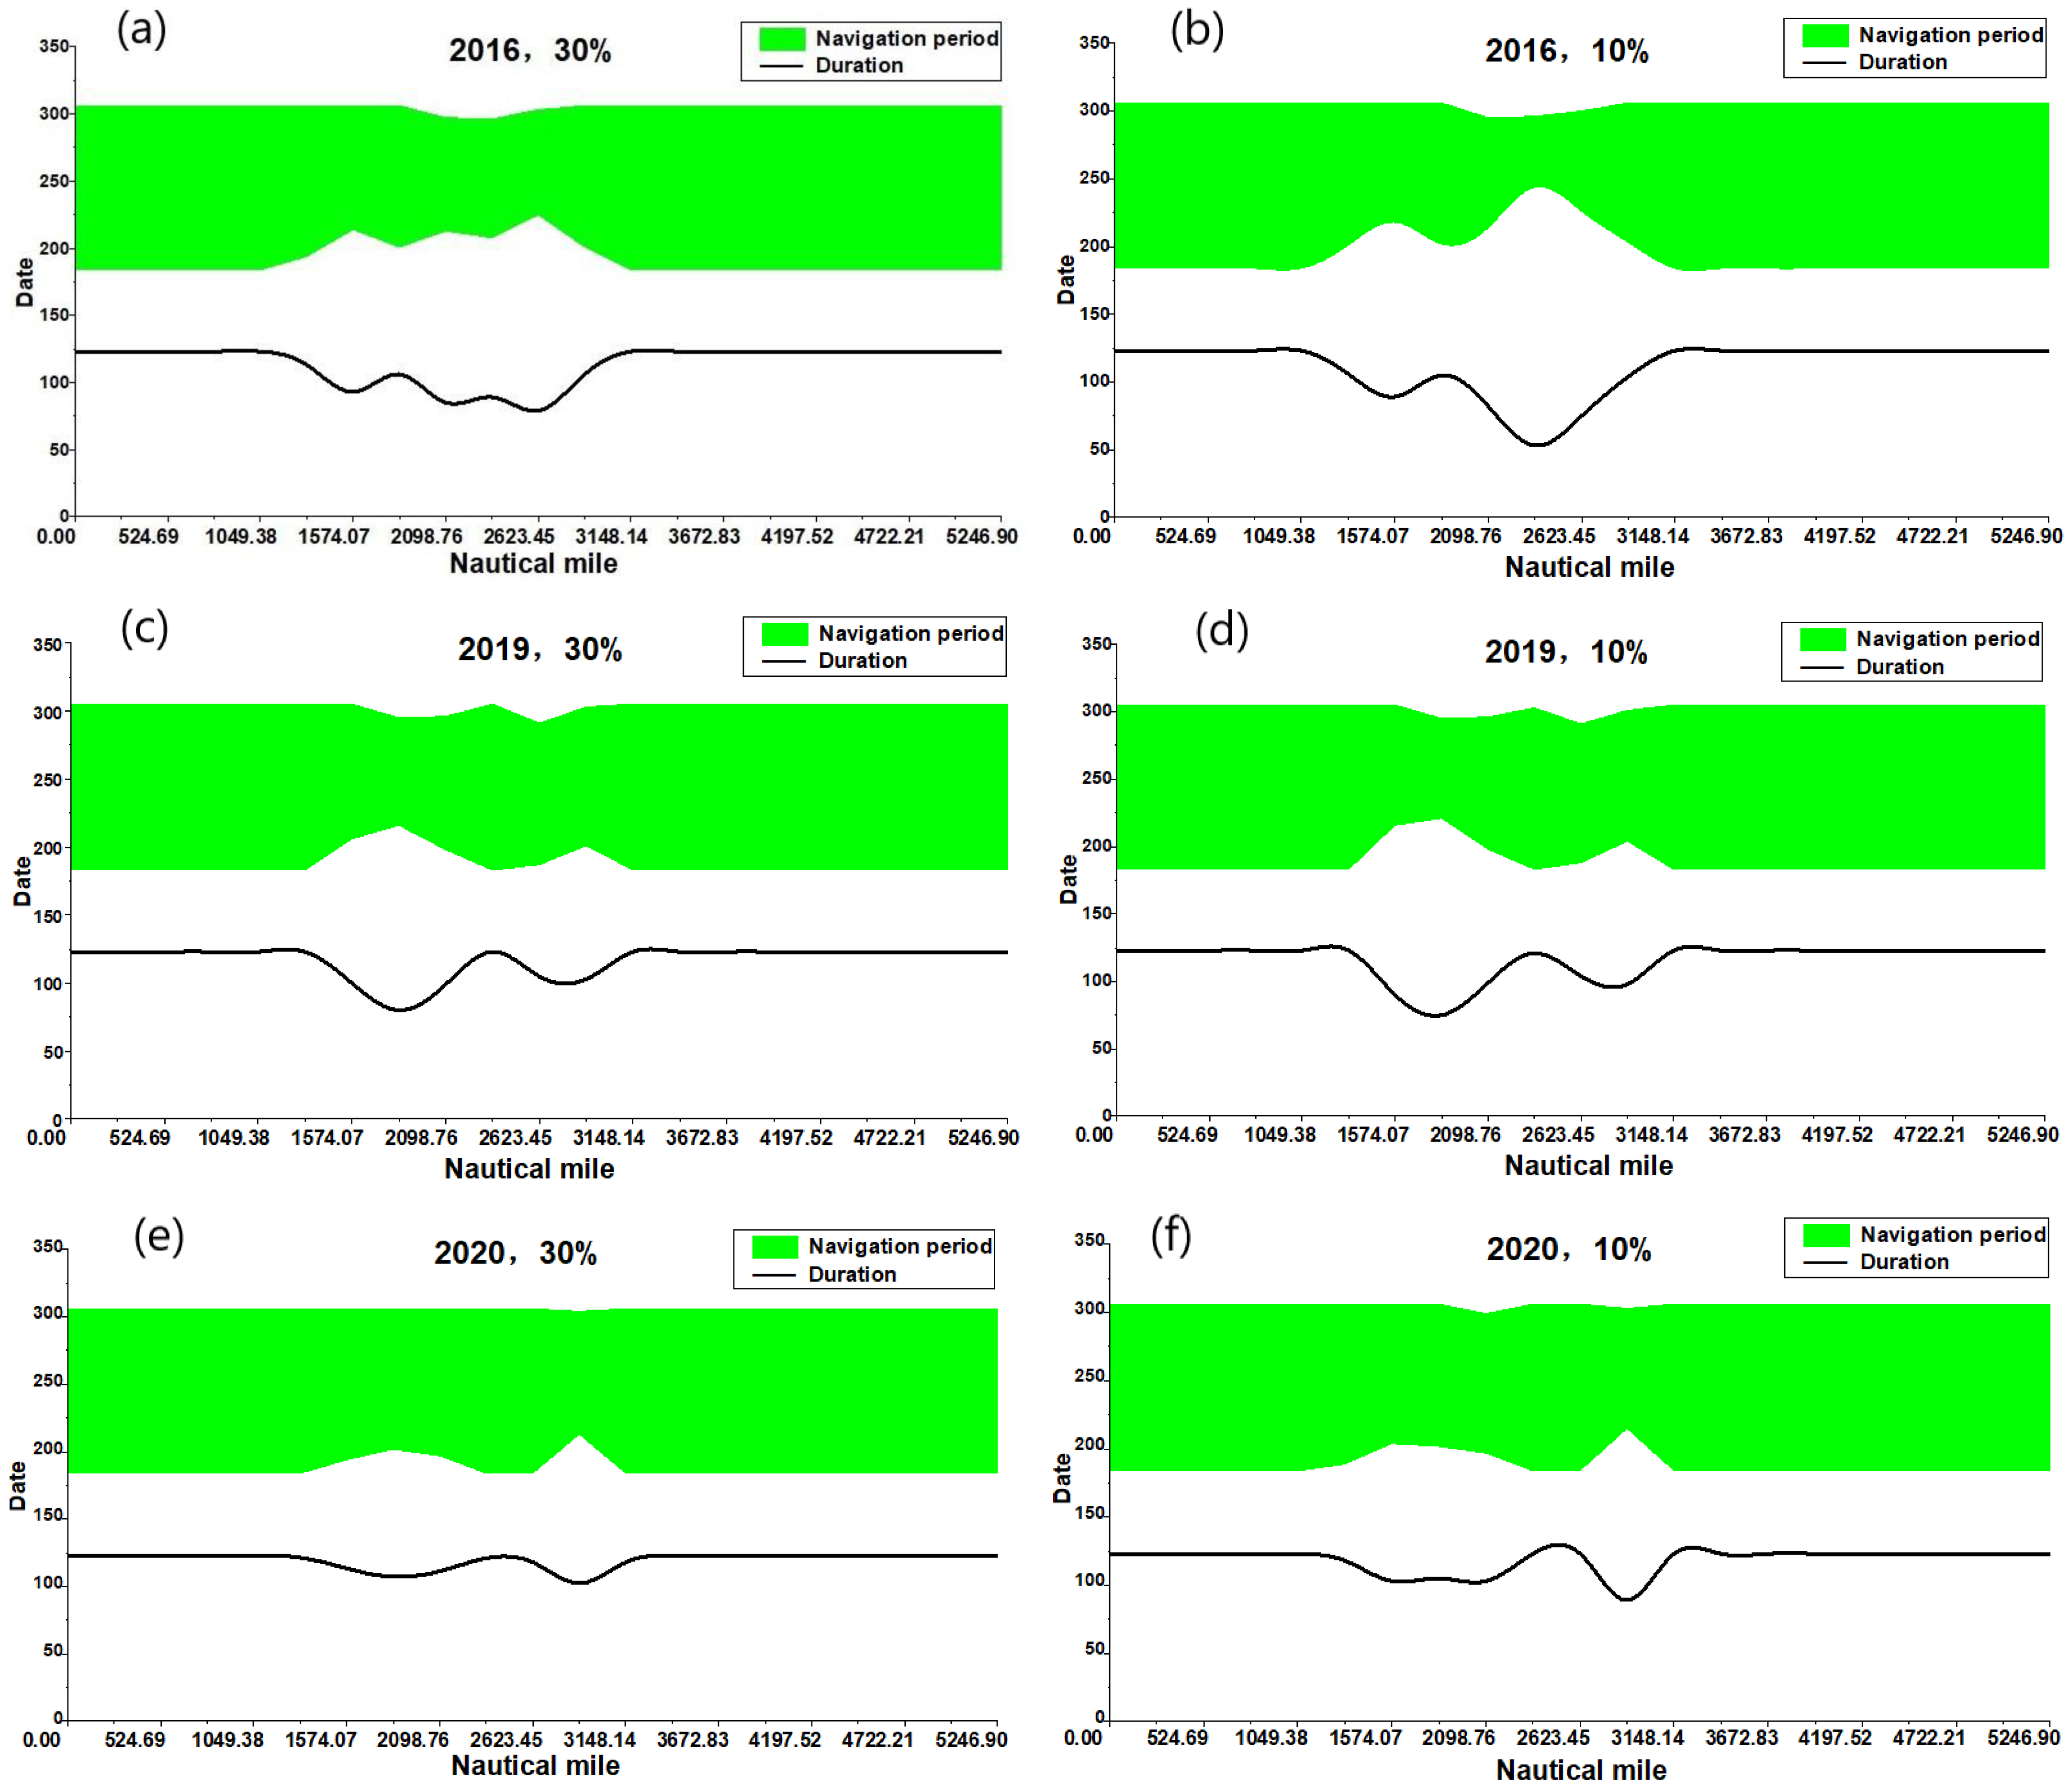
- When the sea ice concentration was 30% and 10%, respectively, as the threshold, the opening time of the NEP in 2016 was from mid-August to late October and from the end of August to late October. The navigable throat area was the New Siberian Islands. The opening time of the NEP in 2019 was from early August to mid-October and from early August to mid-October. The navigable throat areas were the Vilkitsky Strait and the central waters of the East Siberian Sea. 2020 was the longest year since the opening of the NEP. The opening times were from the end of July to the end of October and from the beginning of August to the end of October. The navigable throat area was the Vilkitsky Strait.
Author Contributions
Funding
Institutional Review Board Statement
Informed Consent Statement
Data Availability Statement
Conflicts of Interest
References
- Comiso, J.C.; Parkinson, C.L.; Gersten, R.; Stock, L. Accelerated decline in the Arctic sea ice cover. Geophys. Res. Lett. 2008, 35, 179–210. [Google Scholar] [CrossRef] [Green Version]
- Parkinson, C.L.; Cavalieri, D.J. Arctic sea ice variability and trends, 1979–2006. J. Geophys. Res. Space Phys. 2008, 113. [Google Scholar] [CrossRef]
- Zhang, L.; Zhang, Z.; Li, Q.; Wu, H. The trend of Arctic sea ice anomalies in the past 30 years. Polar Res. 2009, 21, 344–352. [Google Scholar]
- Kwok, R.; Untersteiner, N. The thinning of Arctic sea ice. Phys. Today 2011, 64, 36–41. [Google Scholar] [CrossRef] [Green Version]
- Rothrock, D.A.; Yu, Y.; Maykut, G.A. Thinning of the Arctic sea-ice cover. Geophys. Res. Lett. 1999, 26, 3469–3472. [Google Scholar] [CrossRef] [Green Version]
- National Aeronautics and Space Administration, NASA. Available online: https://www.nasa.gov (accessed on 5 May 2021).
- Rodrigues, J. The rapid decline of the sea ice in the Russian Arctic. Cold Reg. Sci. Technol. 2008, 54, 124–142. [Google Scholar] [CrossRef]
- Cavalieri, D.J.; Parkinson, C. Antarctic sea ice variability and trends, 1979–2006. J. Geophys. Res. Space Phys. 2008, 113, 881–889. [Google Scholar] [CrossRef] [Green Version]
- Smith, L.C.; Stephenson, S.R. New Trans-Arctic shipping routes navigable by midcentury. Proc. Natl. Acad. Sci. USA 2013, 110, E1191–E1195. [Google Scholar] [CrossRef] [Green Version]
- Lei, R.; Xie, H.; Wang, J.; Leppäranta, M.; Jónsdóttir, I.; Zhang, Z. Changes in sea ice conditions along the Arctic Northeast Passage from 1979 to 2012. Cold Reg. Sci. Technol. 2015, 119, 132–144. [Google Scholar] [CrossRef]
- Gui, D.; Pang, X.; Lei, R.; Zhao, X.; Wang, J. Changes in sea ice kinematics in the Arctic outflow region and their associations with Arctic Northeast Passage accessibility. Acta Oceanol. Sin. 2019, 38, 101–110. [Google Scholar] [CrossRef]
- Howell, S.E.; Yackel, J.J. A vessel transit assessment of sea ice variability in the Western Arctic, 1969–2002: Implications for ship navigation. Can. J. Remote Sens. 2004, 30, 205–215. [Google Scholar] [CrossRef]
- Li, Z.; Zhao, J.; Su, J.; Li, C.; Cheng, B.; Hui, F.; Yang, Q.; Shi, L. Spatial and Temporal Variations in the Extent and Thickness of Arctic Landfast Ice. Remote Sens. 2019, 12, 64. [Google Scholar] [CrossRef] [Green Version]
- Li, C.; Li, M.; Zhao, J.; Zhang, L.; Tian, Z. Analysis of the opening of Northeast and Northwest Passages of the Arctic in recent years. Acta Oceanol. Sin. 2014, 36, 33–47. [Google Scholar] [CrossRef]
- Xue, Y.; Guan, H.; Dong, Z.; Chen, F. Analysis on the characteristics of Arctic sea ice range changes in the past 40 years. Ocean Forecast 2014, 31, 85–91. [Google Scholar] [CrossRef]
- Li, X.; Ci, T.; Ros, H.; Hui, F.; Cheng, X. Spatial and Temporal Changes of Sea Ice in the Velikitsky Strait of the Northeast Passage of the Arctic and Analysis of Seaworthiness. Polar Res. 2015, 27, 282–288. [Google Scholar] [CrossRef]
- Li, X.; Cheng, X.; Hui, F.; Zhai, M.; Zhang, Y. Analysis of ice conditions in the Northeast Passage in the summer of 2014. Polar Res. 2016, 28, 87–94. [Google Scholar] [CrossRef]
- Ji, M.; Liu, G.; He, Y.; Li, Y.; Li, T. Analysis of Sea Ice Timing and Navigability along the Arctic Northeast Passage from 2000 to 2019. J. Mar. Sci. Eng. 2021, 9, 728. [Google Scholar] [CrossRef]
- University Bremen. Available online: https://seaice.uni-bremen.de/start/ (accessed on 5 May 2021).
- Spreen, G.; And, L.K.; Heygster, G. Sea ice remote sensing using AMSR-E 89-GHz channels. J. Geophys. Res. Oceans 2008, 113. [Google Scholar] [CrossRef] [Green Version]
- NSIDC. Available online: https://nsidc.org/data/NSIDC-0192/versions/3 (accessed on 5 May 2021).
- Earth System Research Laboratory. ESRL. Available online: https://psl.noaa.gov/repository/model/compare (accessed on 5 May 2020).
- University of Maine’s Reanalysis Plotter. Available online: https://climatereanalyzer.org/reanalysis/monthly_maps/ (accessed on 5 May 2021).
- NSIDC. Available online: https://nsidc.org/data/NSIDC-0611/versions/4 (accessed on 5 May 2021).
- NSIDC. Available online: https://nsidc.org/data/NSIDC-0116/versions/4 (accessed on 5 May 2021).
- Parkinson, C.L.; Comiso, J.C. On the 2012 record low Arctic sea ice cover: Combined impact of preconditioning and an August storm. Geophys. Res. Lett. 2013, 40, 1356–1361. [Google Scholar] [CrossRef]
- Shibata, H.; Izumiyama, K.; Tateyama, K.; Enomoto, H.; Takahashi, S. Sea-ice coverage variability on the Northern Sea Routes, 1980–2011. Ann. Glaciol. 2013, 54, 139–148. [Google Scholar] [CrossRef]
- Wang, C.; Yang, Y.; Zhang, J.; Tian, B.; Ding, M. Study on sea ice changes and navigation in the Northwest Passage of the Arctic based on remote sensing data. Polar Res. 2020, 32, 236–249. [Google Scholar]
- International Shipping Network. Available online: http://www.eworldship.com (accessed on 5 May 2021).

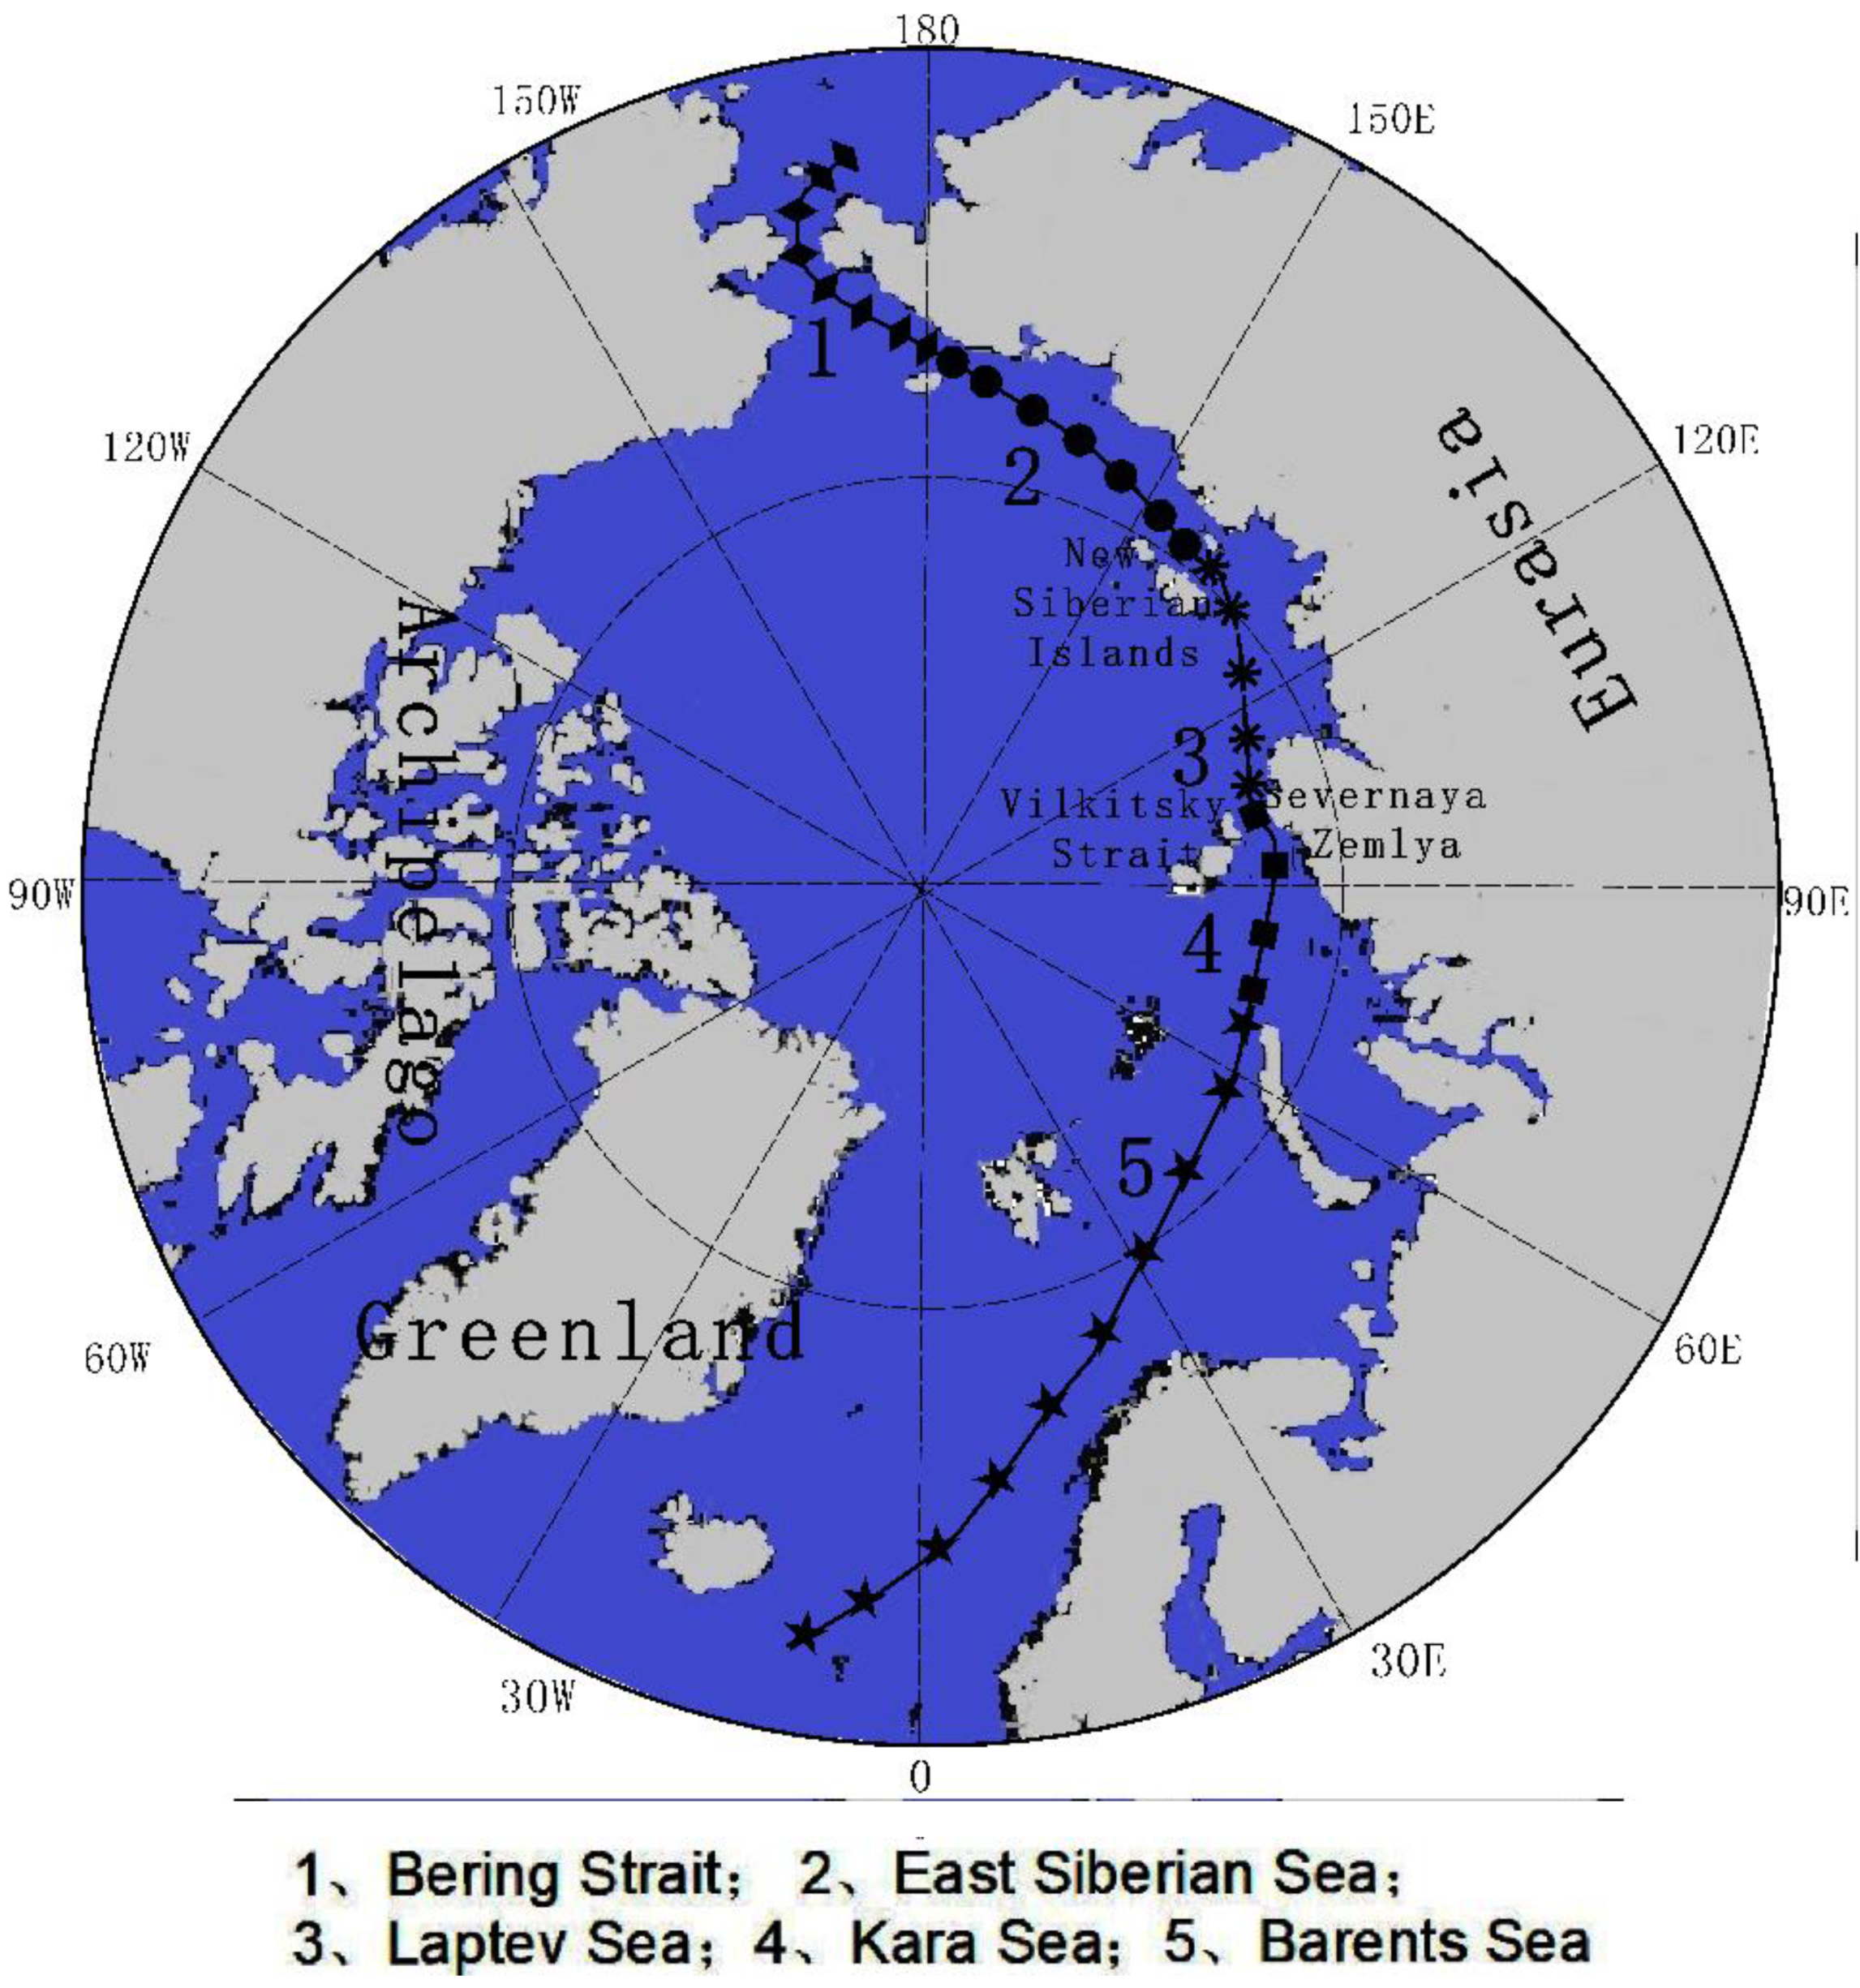





| Section | Location |
|---|---|
| Bering Strait | 0–1311.71 nautical miles |
| East Siberian Sea | 1311.71–2098.74 nautical miles |
| Laptev Sea | 2098.74–2623.43 nautical miles |
| Kara Sea | 2623.43–3410.46 nautical miles |
| Barents Sea | 3410.46–3935.14 nautical miles |
| State | Year | Ship Name | Drive-In Time | Departure Time | Duration |
|---|---|---|---|---|---|
| Independent sailing | 2016 | Yongsheng | Nordkapp/20160913 | Bering Strait/20160922 | 9 |
| 2019 | Tianxi | Nordkapp/20190826 | Bering Strait/20190905 | 10 | |
| Tianyou | Bering Strait/20190905 | Nordkapp/20190916 | 11 | ||
| Tianhui | Bering Strait/20190909 | Nordkapp/20190920 | 11 | ||
| Daxiang | Nordkapp/20190906 | Bering Strait/20190916 | 10 | ||
| Tianqi | Nordkapp/20190912 | Bering Strait/20190923 | 11 | ||
| Tianen | Nordkapp/20190921 | Bering Strait/20191001 | 10 | ||
| Datai | Nordkapp/20190924 | Bering Strait/20191005 | 11 |
Publisher’s Note: MDPI stays neutral with regard to jurisdictional claims in published maps and institutional affiliations. |
© 2021 by the authors. Licensee MDPI, Basel, Switzerland. This article is an open access article distributed under the terms and conditions of the Creative Commons Attribution (CC BY) license (https://creativecommons.org/licenses/by/4.0/).
Share and Cite
Liu, G.; Ji, M.; Jin, F.; Li, Y.; He, Y.; Li, T. Analysis of the Spatial and Temporal Variation of Sea Ice and Connectivity in the NEP of the Arctic in Summer in Hot Years. J. Mar. Sci. Eng. 2021, 9, 1177. https://doi.org/10.3390/jmse9111177
Liu G, Ji M, Jin F, Li Y, He Y, Li T. Analysis of the Spatial and Temporal Variation of Sea Ice and Connectivity in the NEP of the Arctic in Summer in Hot Years. Journal of Marine Science and Engineering. 2021; 9(11):1177. https://doi.org/10.3390/jmse9111177
Chicago/Turabian StyleLiu, Guochong, Min Ji, Fengxiang Jin, Ying Li, Yawen He, and Ting Li. 2021. "Analysis of the Spatial and Temporal Variation of Sea Ice and Connectivity in the NEP of the Arctic in Summer in Hot Years" Journal of Marine Science and Engineering 9, no. 11: 1177. https://doi.org/10.3390/jmse9111177
APA StyleLiu, G., Ji, M., Jin, F., Li, Y., He, Y., & Li, T. (2021). Analysis of the Spatial and Temporal Variation of Sea Ice and Connectivity in the NEP of the Arctic in Summer in Hot Years. Journal of Marine Science and Engineering, 9(11), 1177. https://doi.org/10.3390/jmse9111177


