Abstract
The optically stimulated luminescence (OSL) dating method promises to provide reliable ages for various Quaternary archives. Coastal sedimentation in the Bohai Sea (northeastern China) since the Middle Pleistocene has been influenced by paleoenvironmental and sea-level change, of which dating has been restricted using the OSL dating approach in multiple investigations. In this study, to establish a robust OSL chronological framework of the Bohai coastal sediments more effectively, the regional standardized dose–response curve (sDRC) was constructed for quartz OSL dating in the Bohai Coast (NE China) using two existing approaches. The sDRC-determined equivalent doses are broadly in agreement with those using the individual DRC for each sample. Data used for DRC construction of the fine-grained (FG) quartz samples are less scattered than those of the coarse-grained (CG) quartz samples, probably due to the signal-averaging effect for the FG samples, while the OSL signal of the CG quartz samples might document provenance information that yield relatively scattered distribution. The two approaches used in this study yield identical sDRCs, indicating that both the methods are applicable for sDRC construction in the Bohai Sea.
1. Introduction
Under the threat of global warming and sea-level rise, the coastal area is facing high risk due to its environmental vulnerability [1]. For better protection of the coasts and predicting changes in this critical area, it is essential to understand the process of paleoenvironmental evolution in the geological past, which has been well recorded in coastal sediments. Robust chronology of coastal sediments is fundamental to interpret the paleoenvironmental proxies accurately. The optically stimulated luminescence (OSL) dating method is a numerical dating approach to provide reliable ages for various Quaternary archives with methodological development in the past three decades [2,3]. OSL has been widely used in dating marine and coastal sediments deposited in several glacial–interglacial cycles [4,5,6,7,8,9]. Compared with radiocarbon dating, OSL is advantageous for dating coastal sediments as in situ deposited quartz and feldspar grains in clastic sediments are dated directly [10]. Moreover, the upper dating limit could be extended from ~45 ka for radiocarbon dating to several hundred ka using the OSL method [11,12].
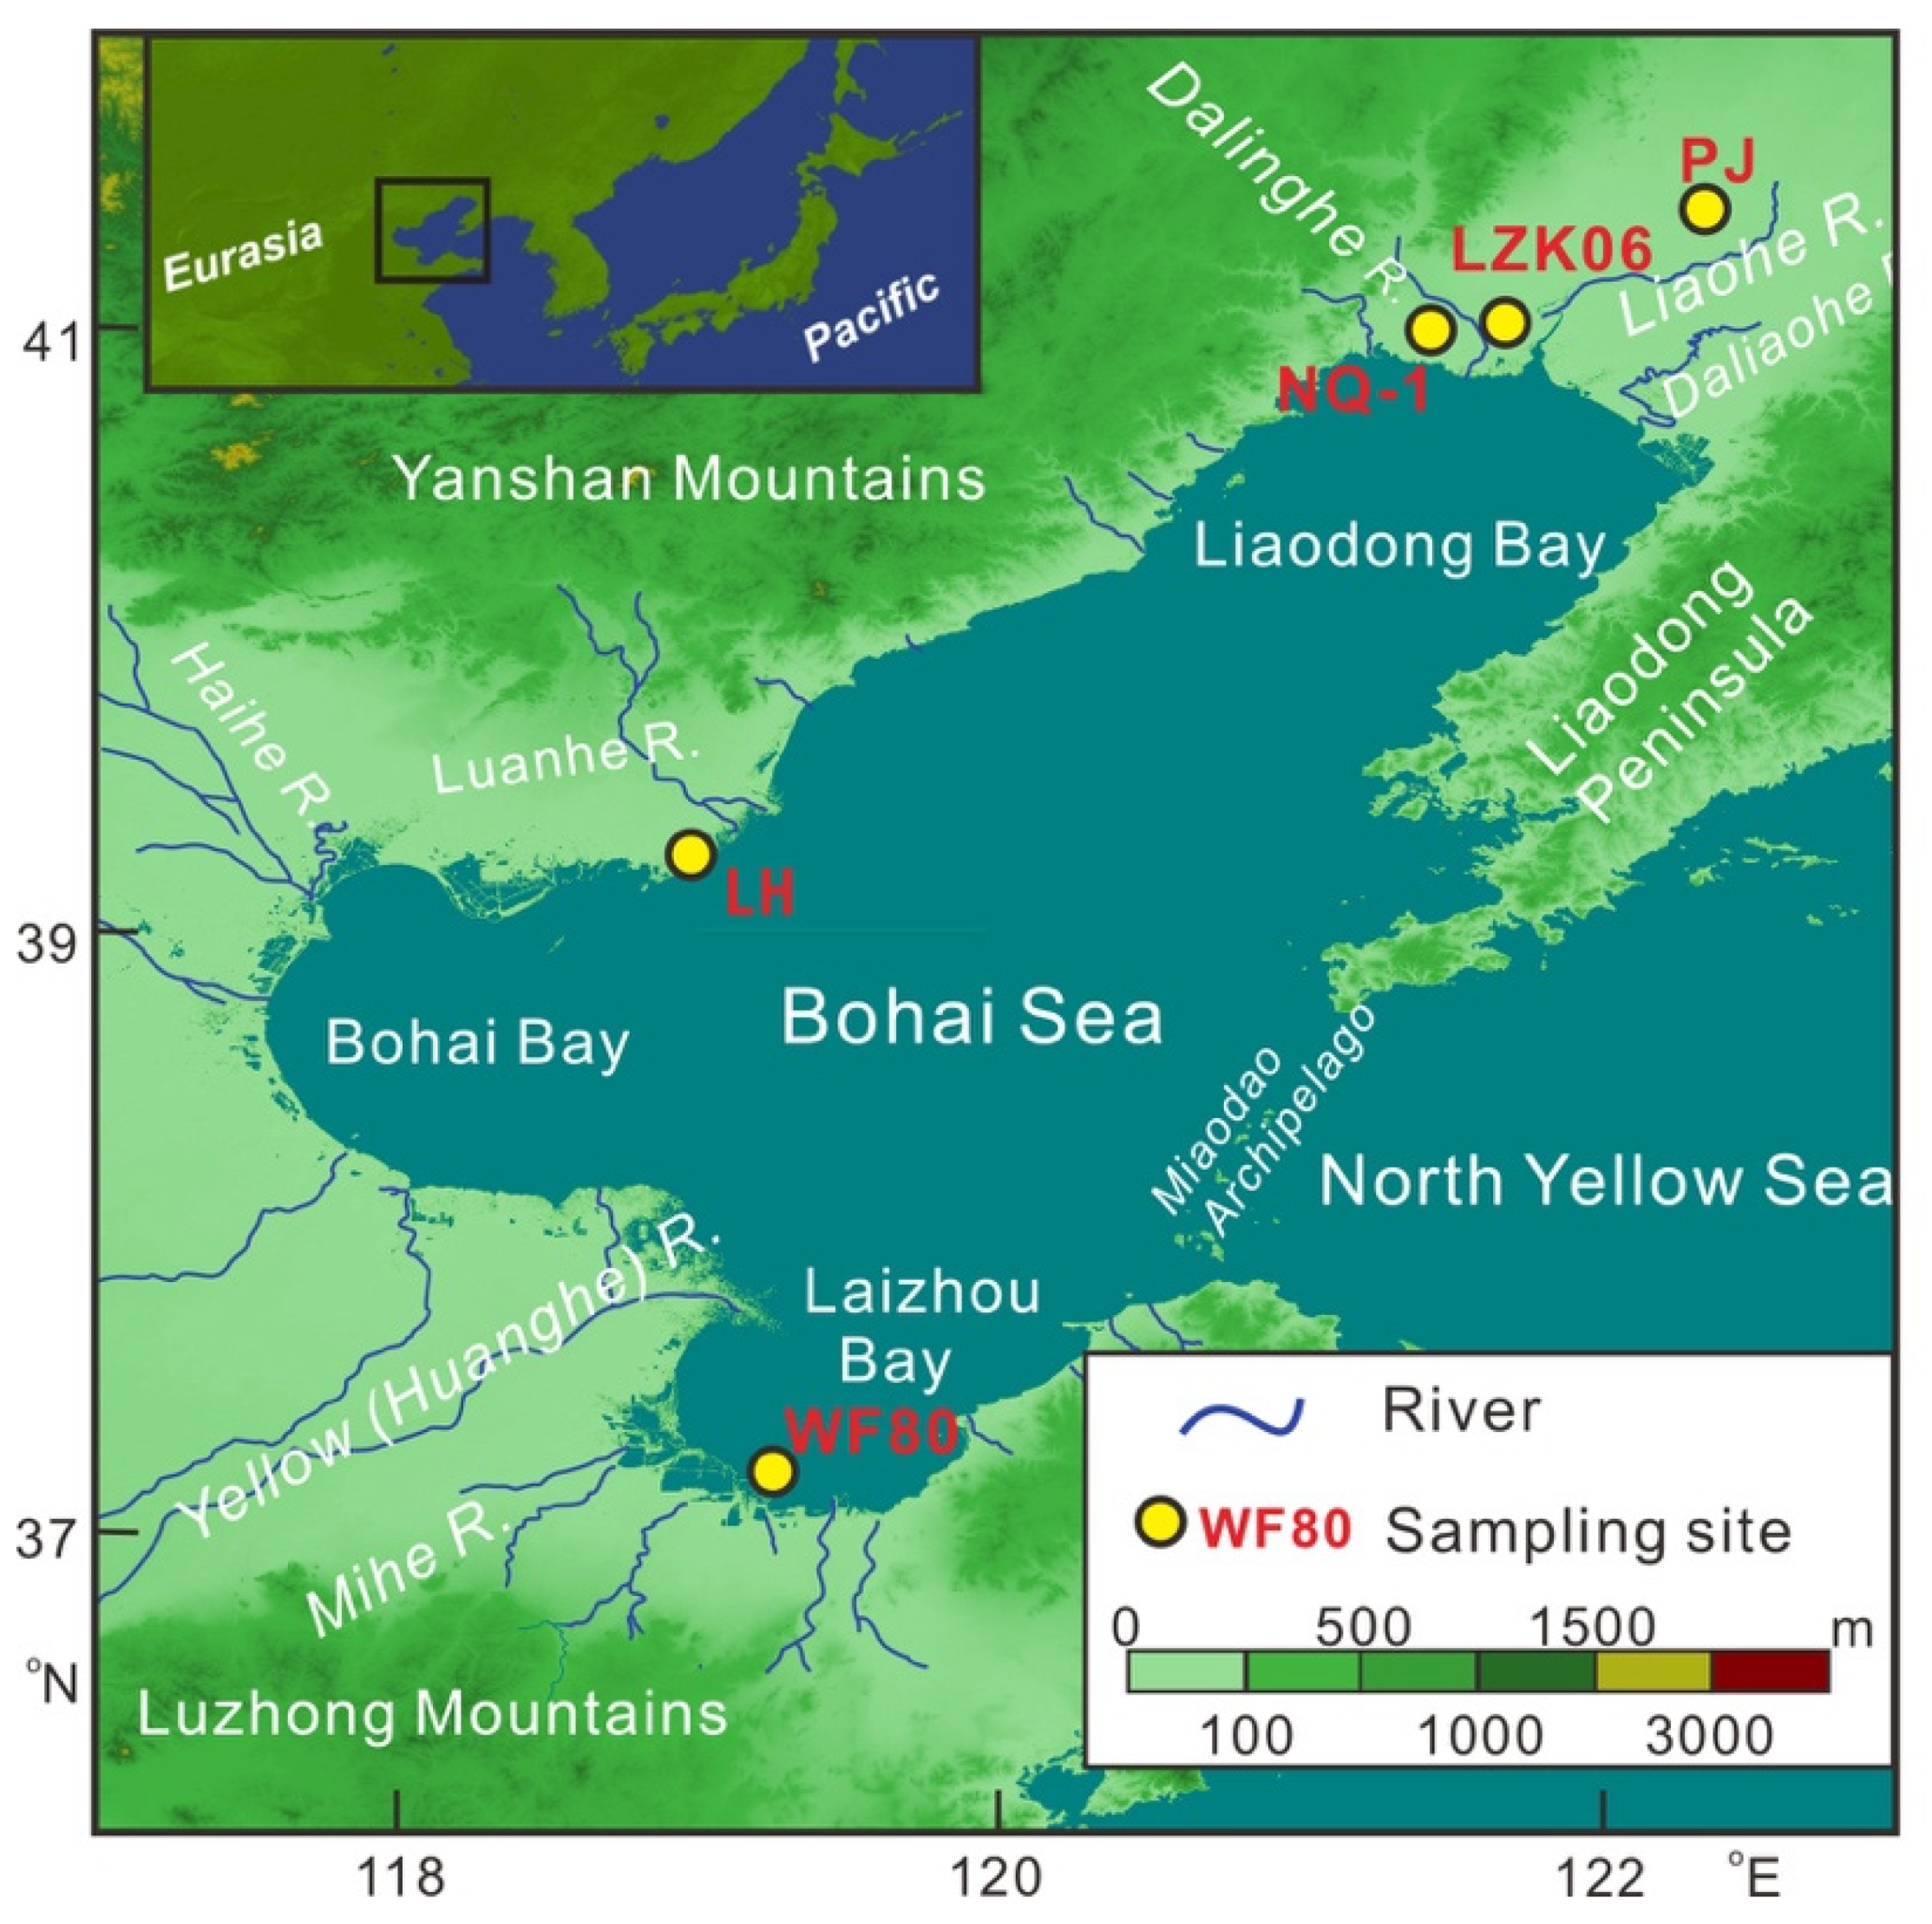
The Bohai Sea in northeastern China is shallow with an average water depth of 18 m [13]. Thick fluvial and lacustrine sediments have been deposited in the Bohai Basin since tectonic quiescence in the late Cenozoic [14]. After the subsidence of Miaodao Uplift since approximately 300 ka, seawater flowed into the Bohai Sea due to the connection to the Yellow Sea (Figure 1) [15]. Cyclic transgression–regression in the Bohai Coast resulted in marine–terrestrial deposits in cyclicity in the coastal strata [9,13,16,17]. These sediments, originating from local drainage systems including the Yellow (Huanghe), Liaohe, Dalinghe, Luanhe, Haihe, and Mihe Rivers, etc., are ideal materials to investigate climatological and environmental processes in the geological past [18,19,20,21,22]. Sediments from the Bohai coastal strata have been dated using the OSL dating approach. The timing of the three transgressive successions in the Bohai Coast has been revised to Marine Isotope Stage (MIS) 7 and 5–3 by OSL chronology [9,17,23,24]. High-resolution OSL dating of the Holocene sediments has provided a more precise chronology, which shows dramatic increase of sedimentation rate and rapid progradation in the North Bohai Coast in late Holocene [8].
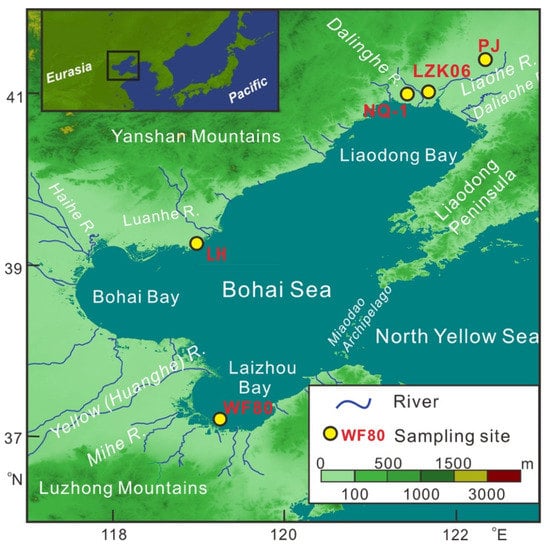
Figure 1.
Study area and sampling sites. Original quartz OSL data for the samples from coastal core LZK06 and dune PJ has been published in [8,9,25], respectively.
A high-resolution OSL chronological framework is promising to reconstruct more detailed sedimentary history, which is, however, timing consuming. It is thus reasonable to develop an effective way to reduce measurement time by constructing a regional standardized dose–response curve (sDRC) for OSL dating of quartz in the Bohai Coast. Several approaches to sDRC construction have been proposed and evaluated [26,27,28,29,30,31,32,33]. However, sDRC for OSL dating has been only investigated in the South Bohai Coast with limited OSL data [34]. Moreover, since sediments in different particle sizes might be eroded from different sources and transported in different paths, little is known about whether the accuracy of the sDRC of quartz is grain size-dependent.
In this study, we use the OSL data from 45 representative samples to construct the regional sDRC for OSL dating of quartz from the Bohai Coast following [30]. OSL data from 12 of the 45 samples were used for sDRC construction according to the approach of [28]. The objectives of this study are two-fold; first, we aim to assess reliability of the regional sDRCs for OSL dating of quartz from Bohai coastal sediments by comparing the sDRC-determined De with the corresponding individual DRC-determined De. Second, we aim to investigate whether the applied particle size of quartz grains influences the shape of the constructed sDRCs.
2. Samples, Dating Method, and Data Processing
2.1. Samples and Preparation
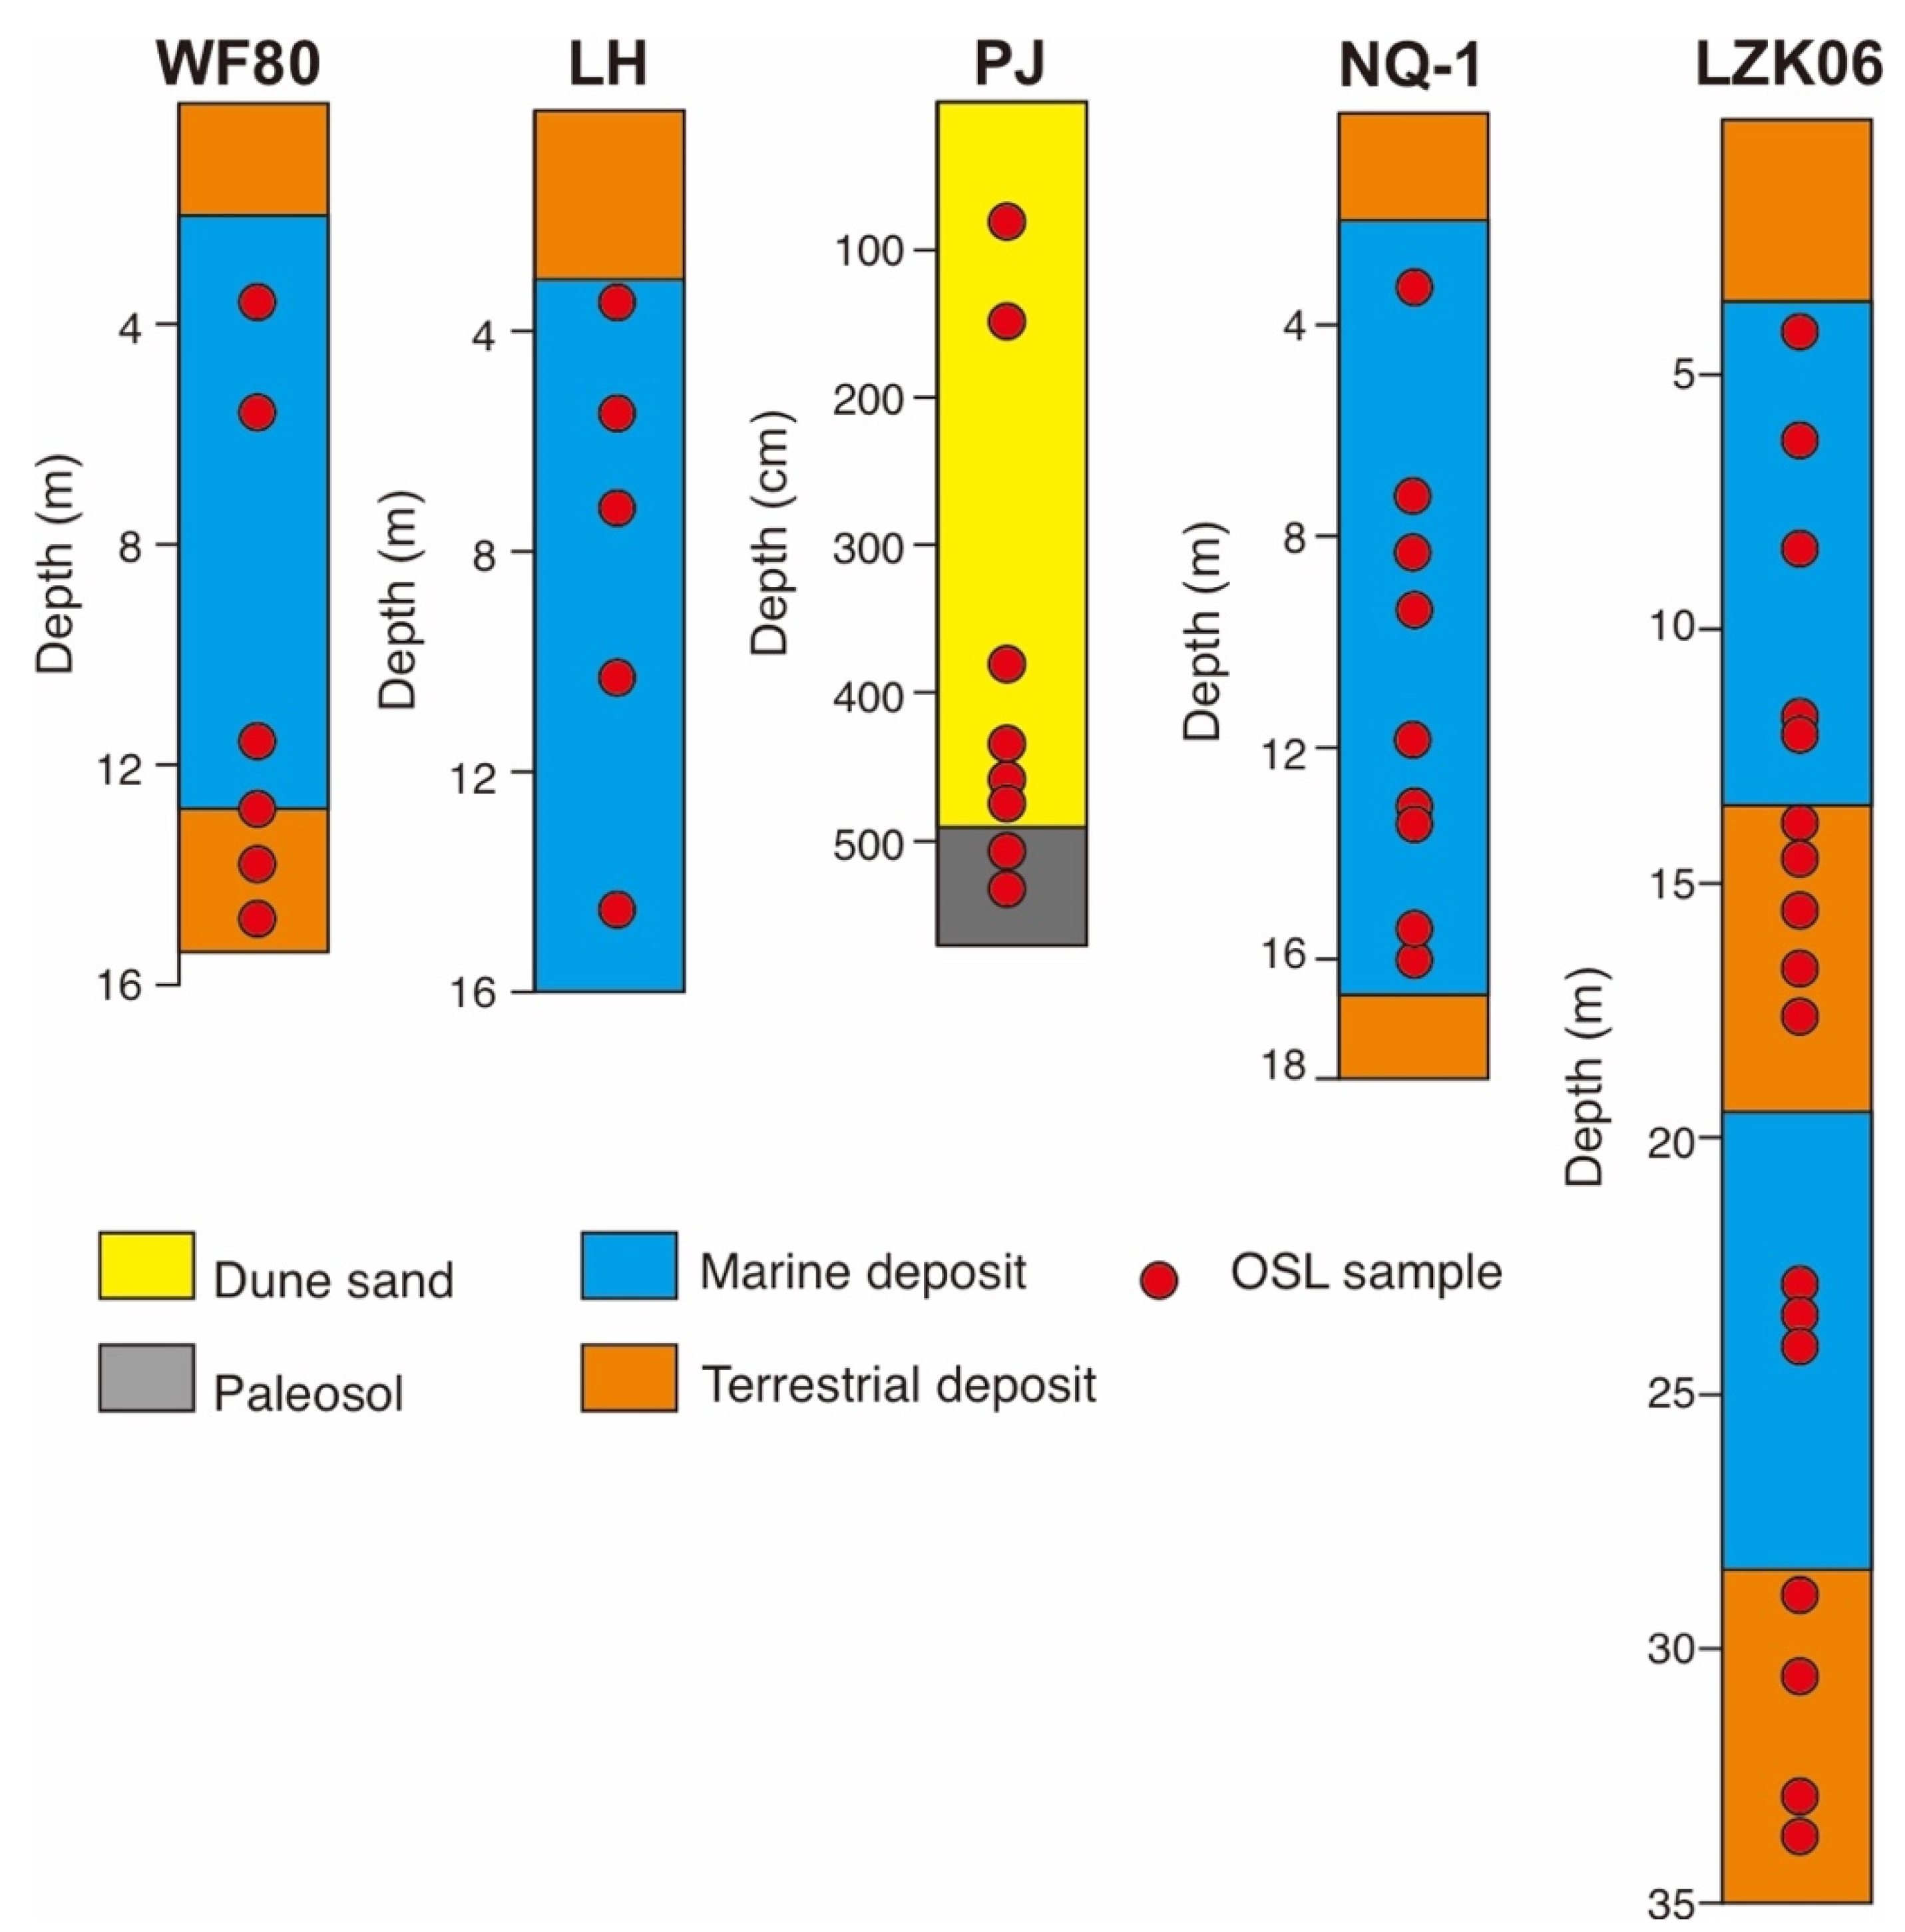
A total of 45 OSL samples collected from five sites in the region of the Bohai Coast were used in this study (Figure 1). One sampling site is a sand dune [25], while the other four are coastal cores. Sediment types include dune sand, paleosol, shallow sea, and terrestrial (fluvial and lacustrine) sediments (Figure 2). The quartz OSL ages for core LZK06 have been published in [8,9]. Depending on grain size distribution, different preparation procedures were applied for extractions of sand-size (coarse-grained—CG) and fine-silt (4–11 μm; fine-grained—FG) quartz grains. CG quartz fraction was extracted after dry-sieving, chemical treatment, heavy liquid separation (Density of 2.62–2.70 g/cm3), and etching using hydrofluoric acid. FG quartz grains were extracted after chemical treatment, settling, and etching using fluorosilicic acid. Details of sample preparation can be found in [9]. Information of the employed samples is listed in Table 1. CG quartz grains were mounted on the stainless-steel aliquots of 2.5 or 6 mm diameter using silicon oil, while FG quartz grains were settled from distilled water on the aluminum aliquots for measurement.

Figure 2.
Lithology and depths of the OSL samples.

Table 1.
Information of sampling sites and samples.
2.2. Instrumentation and Methodology
OSL measurement was conducted on the automated Risø TL/OSL DA-15/20 readers equipped with 90Y/90Sr beta sources. Dose rates of the beta sources range from 0.09 to 0.14 Gy/s. The standard single aliquot regenerative-dose protocol was applied [35]. 24–72 aliquots were measured for CG quartz samples, and 4–8 aliquots for FG quartz samples were measured due to signal-averaging effect. Preheat and cutheat temperatures in the SAR protocol were determined according to the results of preheat plateau and dose recovery tests. Acceptance of the regenerative dose-luminescence intensity and corresponding De values is based on the criteria of reliable recycling ratio (0.9–1.1), IR/OSL depletion ratio (0.9–1.1), and recuperation (<5%). Recuperation values of larger than 5% for the relatively young samples were also accepted. For those passing through the above criteria, De values were determined using the individual DRCs.
2.3. Data Processing
A total of 5863 luminescence intensity regenerative-dose data points from 913 aliquots were used for standard dose–response curve construction after reliability assessment. A standardized dose–response curve (sDRC) was constructed after the method in [30] as follows: The regenerative luminescence intensity (L/T) was multiplied by test dose (in Gy) and plotted against the corresponding regenerative dose. The sDRC for CG, FG, and all samples were constructed by fitting the Lx/Tx–regenerative-dose plot. The fitting equation was set to one single saturating exponential (1EXP) function as:
in which the parameters are saturation value (A), characteristic saturation dose (D0), and intercept (b). The normalized natural luminescence intensity (Ln/Tn × TD) was then projected onto the sDRC to yield the sDRC-De. The uncertainty of each parameter was determined by Monte Carlo method. DRC fitting and De determination was conducted using the R package numOSL [36].
L/T × TD = A × [1 − exp (− De/D0)] + b
Quartz OSL data for the samples from cores NQ-1 and WF80 were used to construct sDRC following the approach proposed in [28]. One identical regenerative dose of 13.95 Gy, regarded as the re-normalization dose, was set in the SAR protocol when the samples from these two cores were measured. All L/Ts (including regenerative and natural) for each aliquot were divided by L/T13.95 and then plotted against the corresponding doses. The De values were determined by projecting the re-normalized Ln/Tn to the sDRC fitting using 1EXP function.
3. Results and Discussion
3.1. Quartz Luminescence Characteristics
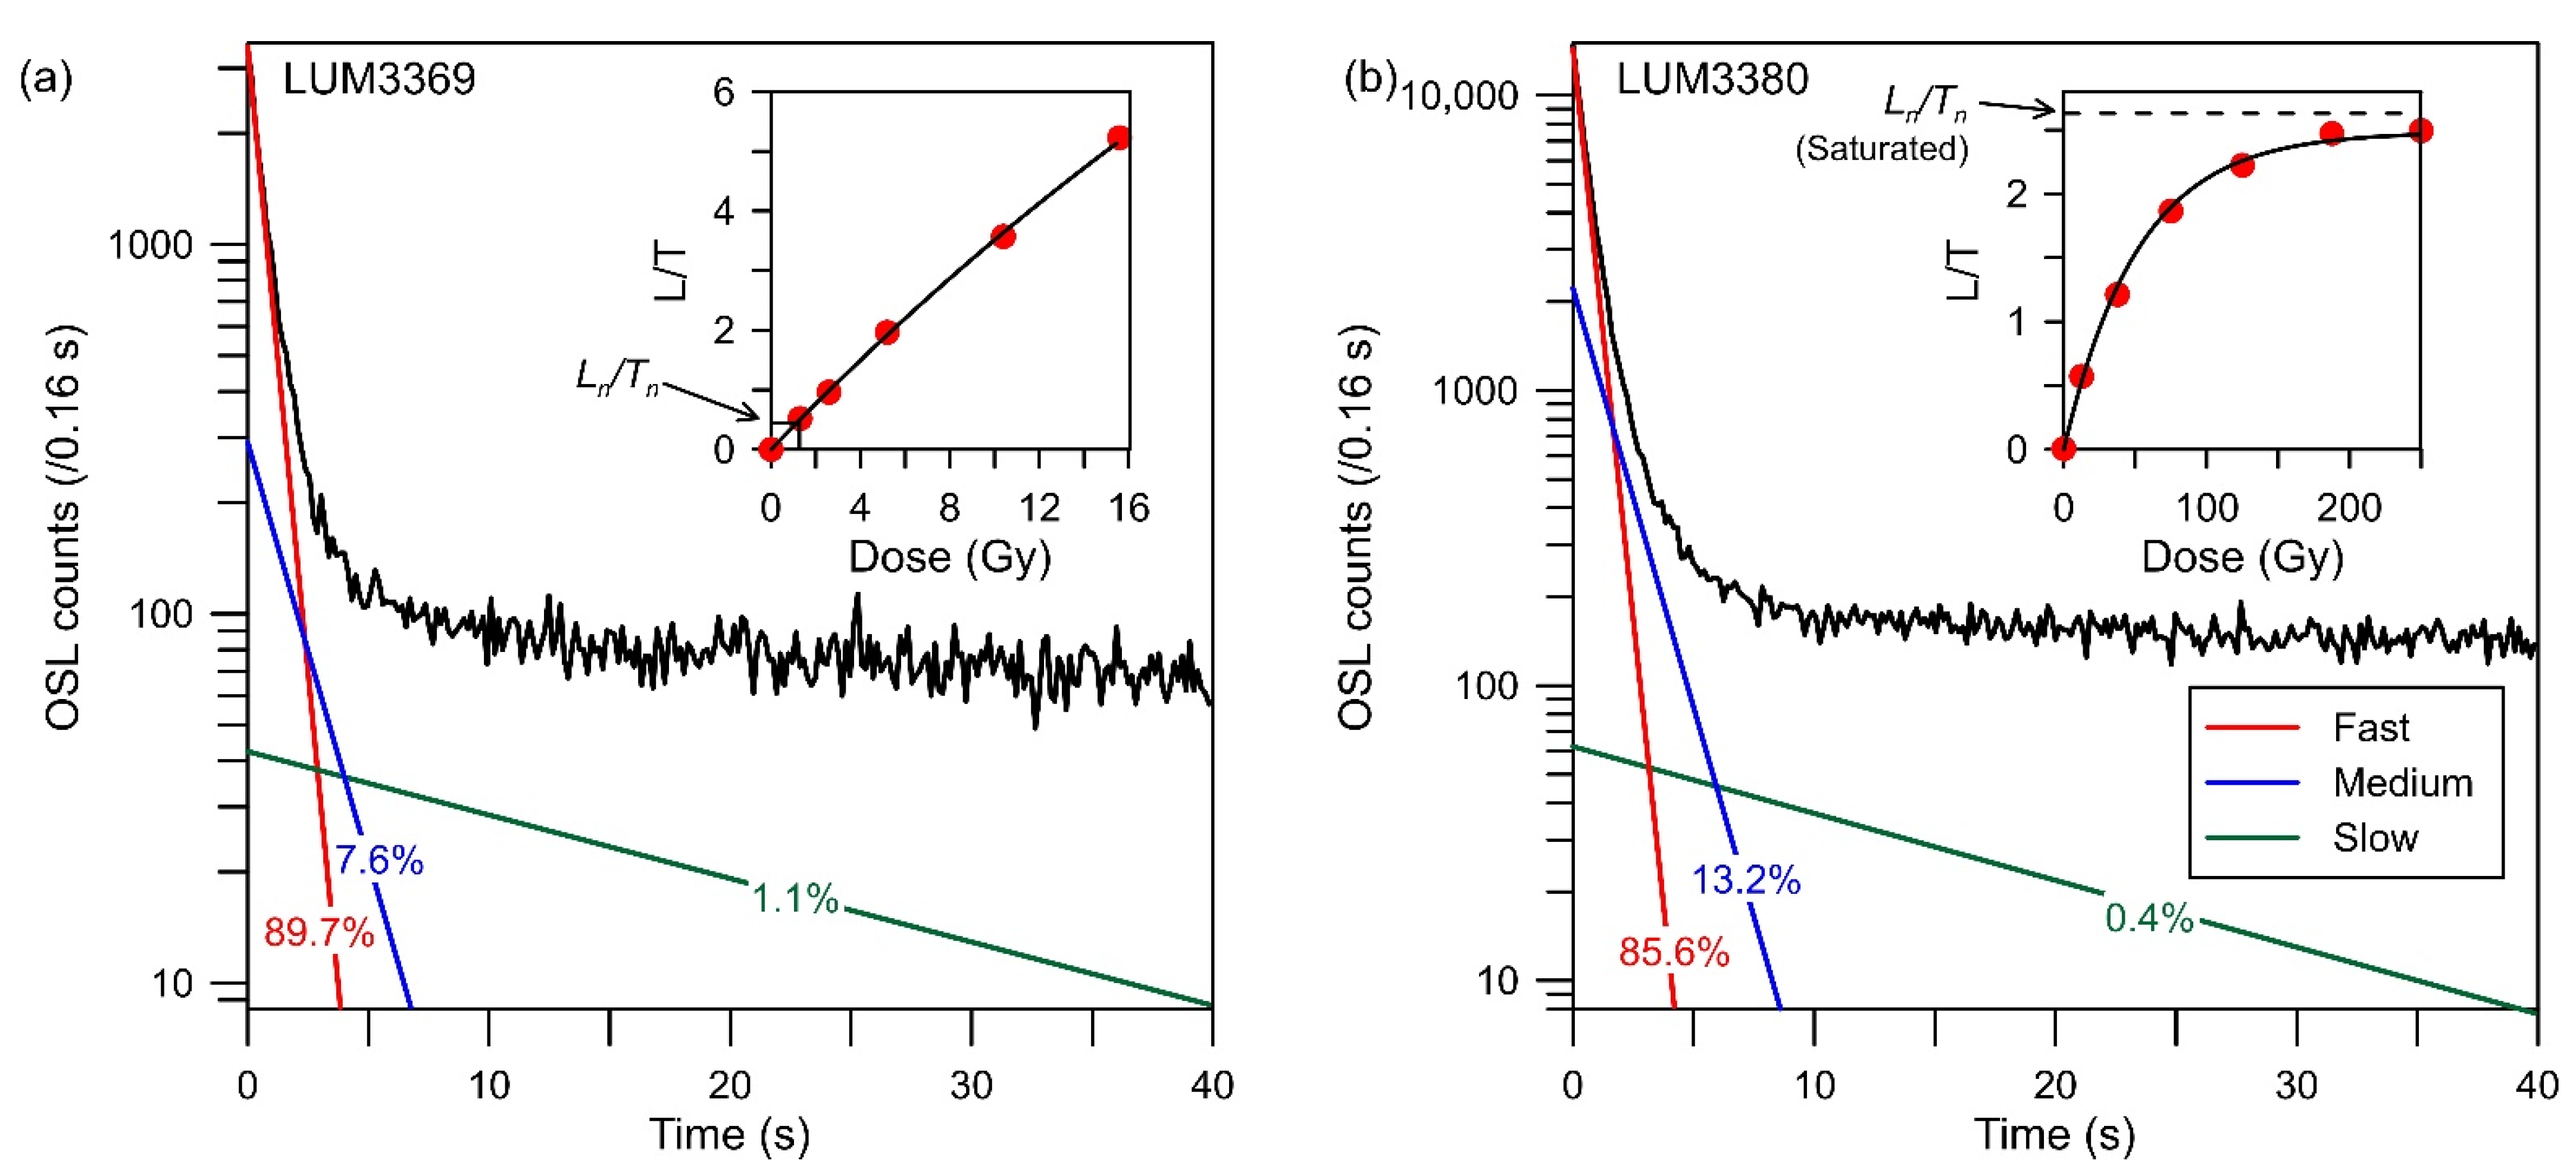
Shine-down curves for two representative samples, LUM3369 and LUM3380, are shown in Figure 3. It shows that the quartz OSL signal decayed to the background rapidly, indicating a fast bleaching process. The OSL signal is generally dominated by a fast component, which is around 90% of the quartz OSL signal after component analysis. It suggests that the quartz OSL signal for the sediments in the Bohai coastal strata could be well bleached in a relatively short period during the last depositional period. In the Bohai Sea, considerably large amounts of sediments are derived from the local rivers with small to medium drainage areas. According to the result of component analysis of the quartz OSL signal, although distance of transportation for those from the local is relatively short (Figure 1), the OSL signal for the quartz grains from the Bohai coastal strata was very likely well bleached during the last deposition.
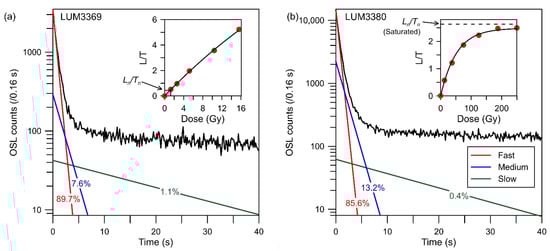
Figure 3.
Shine-down curve and dose–response curve (inset) for two representative samples, LUM3369 (a) and LUM3380 (b). Results of component analysis of the quartz OSL signal are shown.
In recent studies, the bleaching degree for the OSL signal of quartz grains from the Bohai Coast has been evaluated by comparing the quartz OSL age with radiocarbon dates and the associated K-feldspar luminescence ages. The quartz OSL ages are stratigraphically in agreement with the radiocarbon dates in sediment cores in the South Bohai Coast and in core LZK06 in the North Bohai Coast, respectively [8,17]. Meanwhile, consistency between the quartz OSL and the associated K-feldspar post-infrared (IR) infrared (pIRIR) stimulated luminescence ages have also been observed for the sediments deposited in the North Bohai Coast before the last millennium. Since the quartz OSL signal is bleached faster than the K-feldspar pIRIR signal [37,38,39], the age consistency indicates that the quartz OSL signal for the Bohai coastal sediments was generally well bleached [9,25]. The outcome of both the component analysis and age comparison implies that the OSL signal of quartz from Bohai Coast has been well bleached and is reliable for sDRC construction.
Dose–response curves for all samples were fitted using the 1EXP function. The natural luminescence intensity was projected onto the dose–response curve to yield the De value for each aliquot. The saturation of the quartz OSL signal was strictly assessed using the criteria of 2D0, which represents 86% of the saturation level. Those aliquots with luminescence intensity above 86% of the saturation level are thought to be saturated and discarded for De determination (LUM3380. Figure 3b). It shows that five samples collected from cores LZK06 and WF80 are saturated, while most of the samples yield finite De. The quartz OSL ages range from ca. 0.08 to 45.6 ka, corresponding to sedimentation since the middle MIS 3.
3.2. sDRC Construction Using the Approach of Test-Dose Standardisation
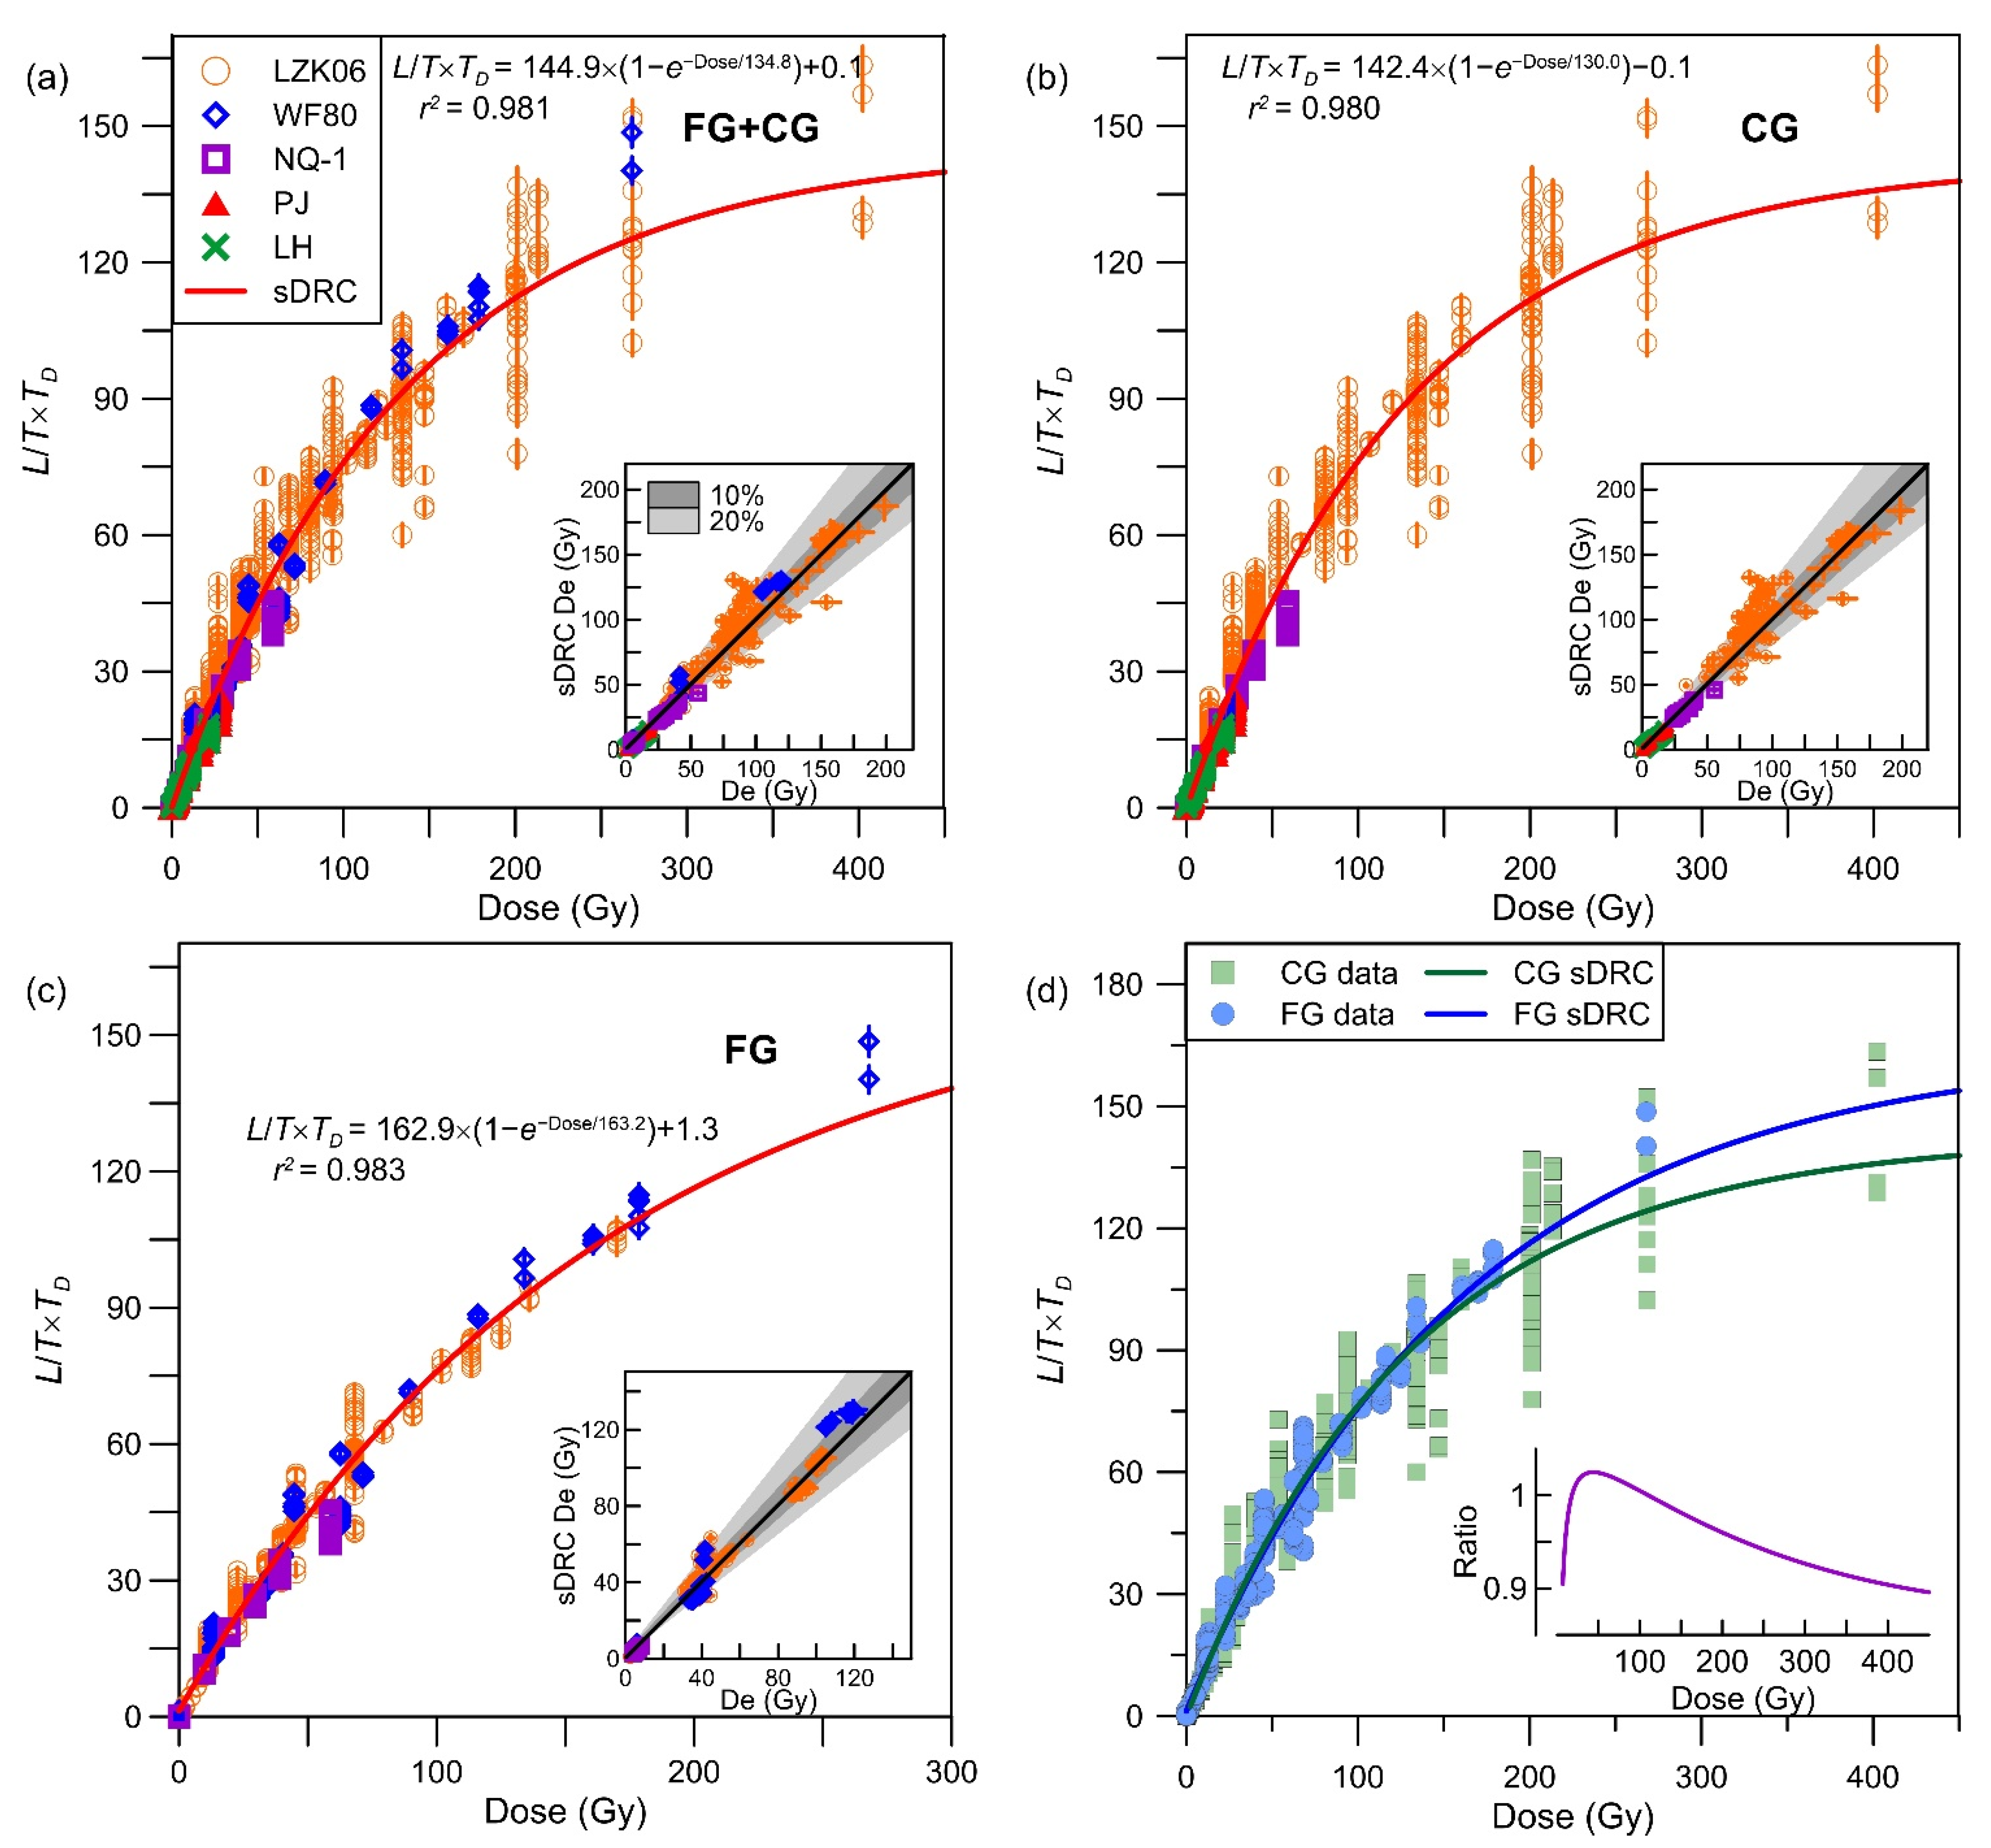
The sDRCs constructed following the approach in [30] are shown in Figure 4. The luminescence intensities of the FG quartz samples are less scattered than those of the CG quartz samples. Since the aliquots in 2.5 or 6 mm diameter were used for De measurement for CG samples, several hundreds of sand-size grains were mounted on the aliquots. The luminescence signal was derived from tens of grains (<5% of the mounted grains) which emitted light during stimulation [40]. The discrepancy of luminescence intensity between aliquots may imply the provenance information carried by the coarse grains [41]. By contrast, with smaller grain size of 4–11 μm, each FG aliquot of 9.8 mm diameter contains tens of thousands of aliquots, resulting in apparent signal-averaging during measurement. Luminescence intensities yielded from the FG aliquots are thus more identical than those determined by CG aliquots.
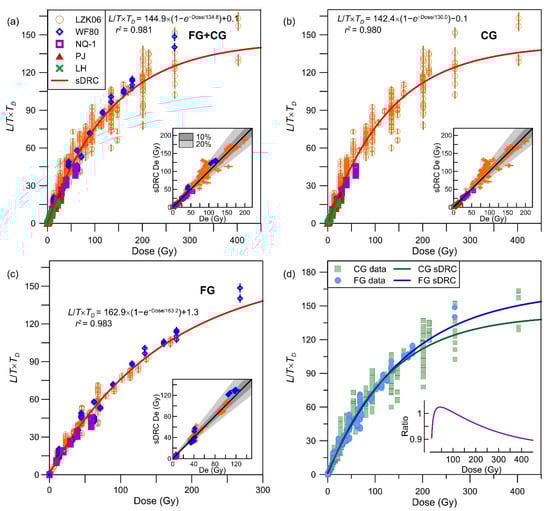
Figure 4.
sDRC construction following the approach of Roberts and Duller (2004). (a) shows the sDRC constructed using all OSL data of all the FG and CG samples. (b) shows sDRC constructed using OSL data of the CG samples. (c) shows sDRC constructed using OSL data of the FG samples. The insets show the comparison between the sDRC- and individual DRC-determined De values. The 1:1 line (solid line), 10 and 20% uncertainty (grey shadow area) are shown. (d) shows the sDRC comparison between FG and CG samples. Inset shows the L/T×TD ratio calculated using CG and FG sDRCs, respectively.
The sDRCs using different datasets were fitted using the 1EXP function. Although the D0 value of 134.8 Gy for the sDRC using all data of the FG and CG quartz samples is close to that of the CG quartz samples, the FG sDRC yields a D0 value of 163.2 Gy. The FG and CG sDRCs are broadly identical within 10% uncertainty in the low-dose range of <150 Gy, but the FG sDRC is higher than the CG sDRC in the high-dose region, indicating that the quartz OSL signal for the FG samples saturates later than the CG quartz OSL signal (Figure 4d). The similar phenomenon for FG quartz OSL signal has been reported for OSL dating of various archives. For example, dating the Romanian loess using FG quartz yielded underestimated ages over 40 ka, associated with De values of >100 Gy [42]. It is also noted that the laboratory generated DRC for FG quartz samples is much higher than that for the corresponding CG quartz samples, determined by larger D0 values for the FG quartz samples [43]. Therefore, the FG sDRC is likely inaccurate for the high-dose region, for which the reliability of yielded De should be carefully assessed.
De values determined by the standardized and individual DRCs are compared to evaluate the reliability of the sDRC (Figure 4). It demonstrates that most Des yielded using the standardized and individual DRCs are broadly in agreement within 10% uncertainty, although some of the De values distributed with 20% uncertainty. It probably results from the discrepancy in the luminescence intensities for the sand-size quartz grains. Nevertheless, sDRC constructed using the method in [30] is considered reliable to determine De for the quartz OSL samples in the Bohai Sea effectively.
3.3. sDRC Construction Following the Approach Using Re-Normalisation Dose
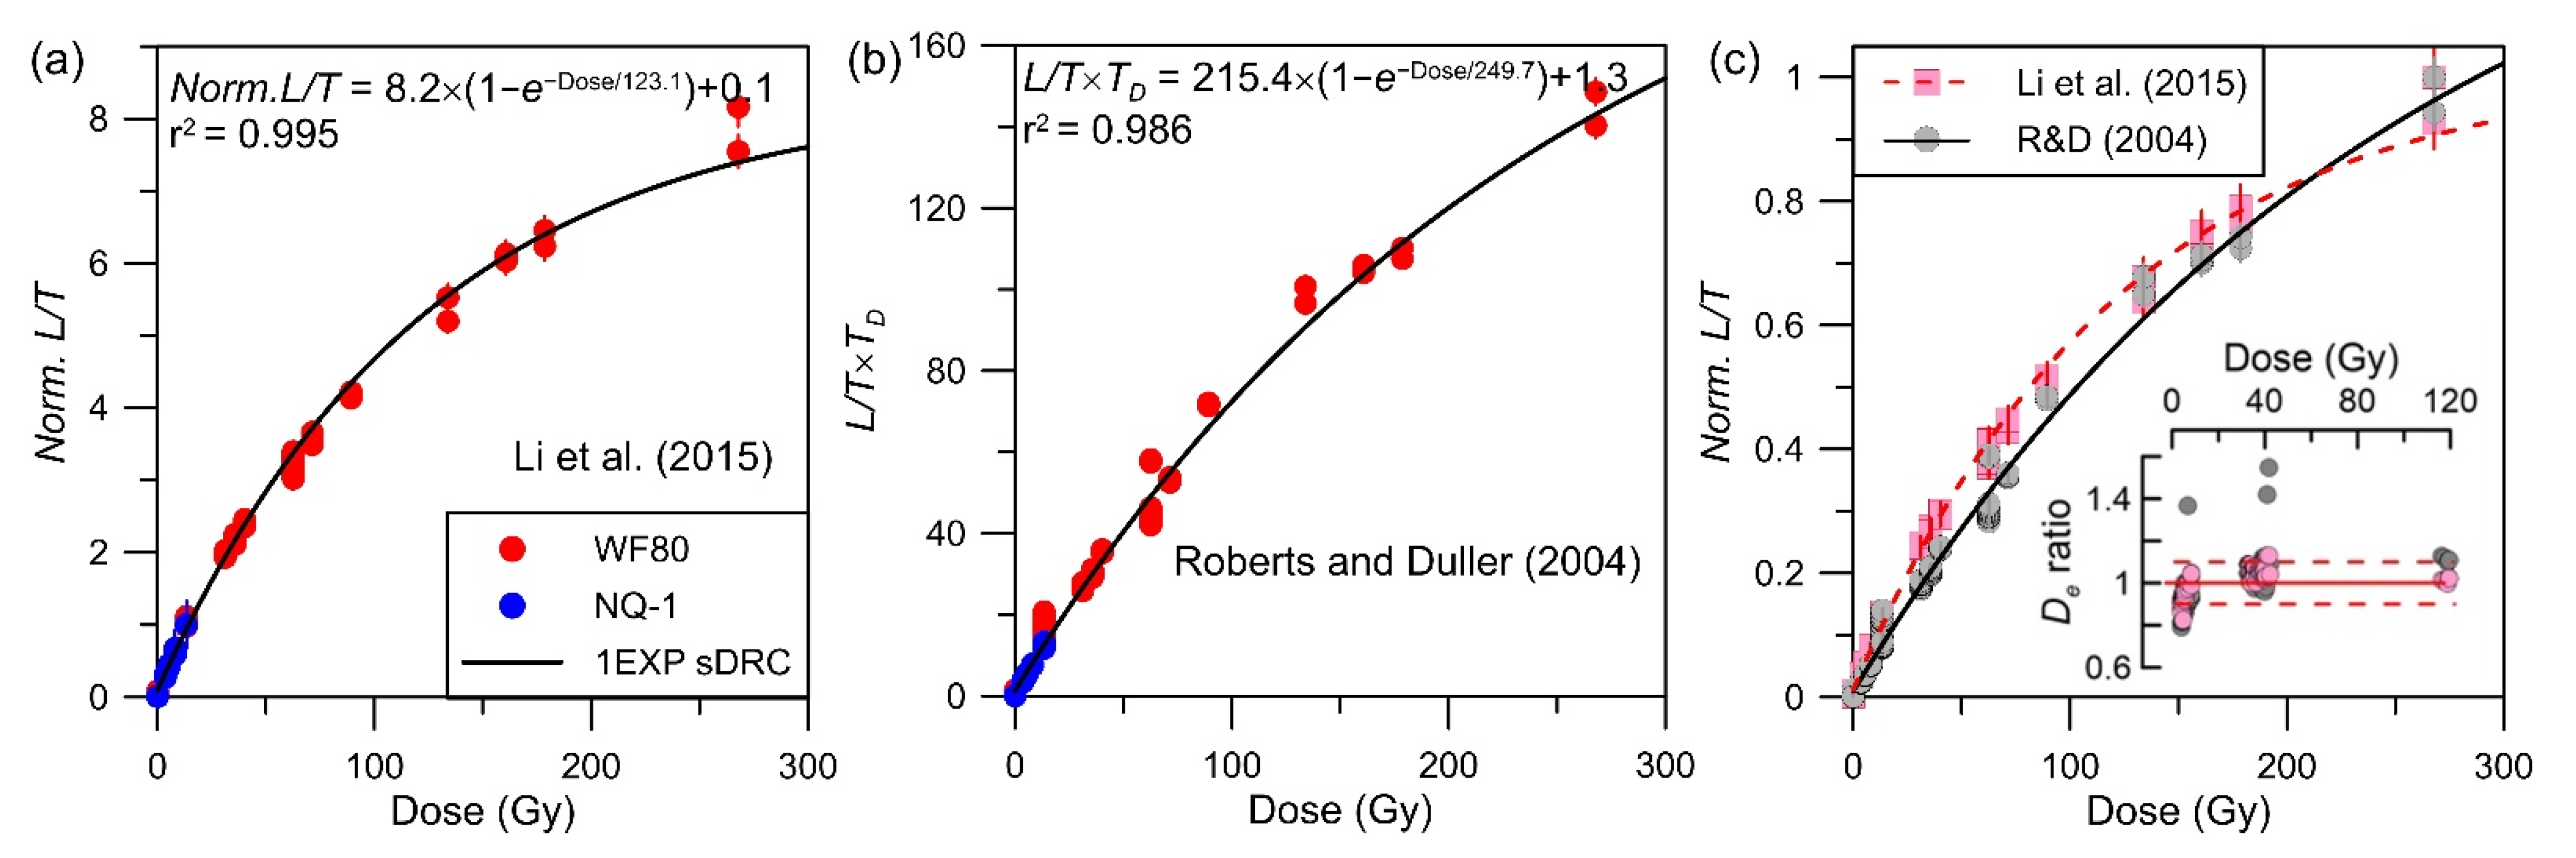
Luminescence data of the FG samples from cores WF80 and NQ-1 were used to construct sDRC after [28], shown in Figure 5a. D0 value of the sDRC is 123.1 Gy, suggesting that the upper dating limit of FG quartz using this sDRC is approximately 70–80 ka with the typical environmental dose rate of 3–3.5 Gy/ka for FG quartz. Figure 5b shows the sDRC constructed following the method of [31] using the same dataset. The D0 value of 249.7 Gy is much larger than that of sDRC following the approach in [28]. The normalized L/Ts by re-normalization dose (L/T13.95) are more concentrated and are better fitted than that of [30]. De values determined by the two sDRCs are compared with those of the individual DRCs using the De ratio (Figure 5c). De values determined by sDRC of [29] generally agree with those by individual DRCs for the clusters of 3–8, 34–47, and 117–122 Gy. Most of the De values of [30] are also accepted within 10% uncertainty, but it tends to underestimate the De values for the dose range of approximately 100 Gy. Outliers are also observed for the low-dose regions. Therefore, sDRC of [28] could probably yield more reliable De values. It should be noted that an identical regenerative dose as the re-normalization dose should be given in the SAR protocol for the possibility of sDRC construction.
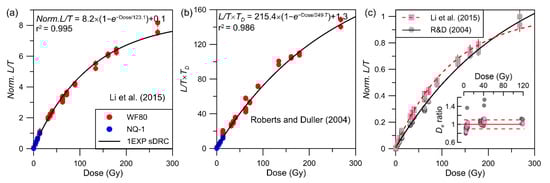
Figure 5.
sDRC construction for FG samples from cores WF80 and NQ-1 using the method of [28] (a) and [30] (b). (c) shows the comparison of the two sDRCs. Inset shows the sDRC-De over individual DRC-De ratio.
OSL chronology suggests that the dated sediments in the Bohai Coast were deposited under the influence of sea-level fluctuation since the Late Pleistocene [8,9,25]. With the sDRC constructed in this study, a more detailed OSL chronology of coastal sediments in the Bohai Coast would be hopefully established in the further studies.
4. Conclusions
In this study, the regional standardized dose–response curve (sDRC) for OSL dating of quartz in the Bohai Coast (NE China) was constructed using OSL data from five representative sampling sites. Two approaches to sDRC construction were used in this study [28,30]. Reliability of the sDRCs was assessed by comparing the standardized- and individual-DRC-determined De values. sDRC constructed using quartz in different grain sizes were also compared. The main conclusions are as follows:
- The quartz OSL signal in the Bohai Coast is generally dominated by the fast component, suggesting a well-bleaching process before the last depositional event.
- Luminescence intensities of the FG quartz samples are less scattered than those of CG quartz samples, which is likely related to the signal-averaging effect of the FG aliquots. FG sDRC tends to overestimate the high-dose range.
- The De values determined by sDRCs constructed following both methods are broadly consistent with the individual DRC yielded Des, while the sDRC and corresponding Des using the method of [28] are relatively satisfactory compared to those following [30].
Author Contributions
Conceptualization and methodology, Y.L. and L.X.; formal analysis, L.X., Y.L., G.C., L.Y., Y.W. and Y.C.; original draft preparation, L.X., Y.C., K.H. and Y.L.; review and editing, K.H., Y.L., G.C. and L.Y. All authors have read and agreed to the published version of the manuscript.
Funding
This research was funded by the National Natural Science Foundation of China, grant numbers 41907376 and 41706067, the Beijing Natural Science Foundation, grant number 8204070 and the 111 project, grant number B20011.
Institutional Review Board Statement
Not applicable.
Informed Consent Statement
Not applicable.
Data Availability Statement
Data are available on request the corresponding author (yan.li@cugb.edu.cn).
Acknowledgments
We thank Sonja Riemenschneider at Leibniz Institute for Applied Geophysics (LIAG) and Na Wang at Tianjin Geological Survey for laboratory assistance. Y.L. is financially supported by the Excellent Chinese and Foreign Young Scientist Exchange Program of China Association of Science and Technology (CAST).
Conflicts of Interest
The authors declare no conflict of interest.
References
- IPCC. Climate Change 2014: Impacts, Adaptation, and Vulnerability; Cambridge University Press: Cambridge, UK, 2014. [Google Scholar]
- Roberts, R.; Lian, O.B. Illuminating the past. Nat. Cell Biol. 2015, 520, 438–439. [Google Scholar] [CrossRef] [Green Version]
- Huntley, D.J.; Godfrey-Smith, D.I.; Thewalt, M.L.W. Optical dating of sediments. Nature 1985, 313, 105–107. [Google Scholar] [CrossRef]
- Tamura, T. Beach ridges and prograded beach deposits as palaeoenvironment records. Earth-Sci. Rev. 2012, 114, 279–297. [Google Scholar] [CrossRef]
- Bateman, M.D.; Murton, J.B. The chronostratigraphy of Late Pleistocene glacial and periglacial aeolian activity in the Tuktoyaktuk Coastlands, NWT, Canada. Quat. Sci. Rev. 2006, 25, 2552–2568. [Google Scholar] [CrossRef] [Green Version]
- Gao, L.; Long, H.; Shen, J.; Yu, G.; Liao, M.; Yin, Y. Optical dating of Holocene tidal deposits from the southwestern coast of the South Yellow Sea using different grain-size quartz fractions. J. Asian Earth Sci. 2016, 135, 155–165. [Google Scholar] [CrossRef]
- Lamothe, M. Luminescence dating of interglacial coastal depositional systems: Recent developments and future avenues of research. Quat. Sci. Rev. 2016, 146, 1–27. [Google Scholar] [CrossRef]
- Li, Y.; Shang, Z.; Tsukamoto, S.; Tamura, T.; Yi, L.; Wang, H.; Frechen, M.; Li, J.; Jiang, X. Quartz and K-feldspar luminescence dating of sedimentation in the North Bohai coastal area (NE China) since the late pleistocene. J. Asian Earth Sci. 2018, 152, 103–115. [Google Scholar] [CrossRef]
- Li, Y.; Tsukamoto, S.; Shang, Z.; Tamura, T.; Wang, H.; Frechen, M. Constraining the transgression history in the Bohai Coast China since the Middle Pleistocene by luminescence dating. Mar. Geol. 2019, 416, 105980. [Google Scholar] [CrossRef]
- Preusser, F.; Degering, D.; Fuchs, M.; Hilgers, A.; Kadereit, A.; Klasen, N.; Krbetschek, M.; Richter, D.; Spencer, J. Luminescence dating: Basics, methods and applications. E&G Quat. Sci. J. 2008, 57, 95–149. [Google Scholar] [CrossRef] [Green Version]
- Quarta, G.; Maruccio, L.; D’Elia, M.; Calcagnile, L. Radiocarbon Dating of Marine Samples: Methodological Aspects, Applications and Case Studies. Water 2021, 13, 986. [Google Scholar] [CrossRef]
- Stuiver, M.; A Polach, H. Discussion Reporting of 14C Data. Radiocarbon 1977, 19, 355–363. [Google Scholar] [CrossRef] [Green Version]
- IOCAS. Geology of the Bohai Bea; Science Press: Beijing, China, 1985. [Google Scholar]
- Allen, M.; Macdonald, D.; Xun, Z.; Vincent, S.; Brouet-Menzies, C. Early Cenozoic two-phase extension and late Cenozoic thermal subsidence and inversion of the Bohai Basin, northern China. Mar. Pet. Geol. 1997, 14, 951–972. [Google Scholar] [CrossRef]
- Yi, L.; Deng, C.; Tian, L.; Xu, X.; Jiang, X.; Qiang, X.; Qin, H.; Ge, J.; Chen, G.; Su, Q.; et al. Plio-Pleistocene evolution of Bohai Basin (East Asia): Demise of Bohai Paleolake and transition to marine environment. Sci. Rep. 2016, 6, 29403. [Google Scholar] [CrossRef] [Green Version]
- Shi, X.; Yao, Z.; Liu, Q.; Larrasoaña, J.C.; Bai, Y.; Liu, Y.; Liu, J.; Cao, P.; Li, X.; Qiao, S.; et al. Sedimentary architecture of the Bohai Sea China over the last 1 Ma and implications for sea-level changes. Earth Planet. Sci. Lett. 2016, 451, 10–21. [Google Scholar] [CrossRef]
- Yi, L.; Lai, Z.; Yu, H.; Xu, X.; Su, Q.; Yao, J.; Wang, X.; Shi, X. Chronologies of sedimentary changes in the south Bohai Sea, China: Constraints from luminescence and radiocarbon dating. Boreas 2012, 42, 267–284. [Google Scholar] [CrossRef]
- He, L.; Xue, C.; Ye, S.; Laws, E.A.; Yuan, H.; Yang, S.; Du, X. Holocene evolution of the Liaohe Delta, a tide-dominated delta formed by multiple rivers in Northeast China. J. Asian Earth Sci. 2018, 152, 52–68. [Google Scholar] [CrossRef]
- Xue, C. Missing evidence for stepwise postglacial sea level rise and an approach to more precise determination of former sea levels on East China Sea Shelf. Mar. Geol. 2014, 348, 52–62. [Google Scholar] [CrossRef]
- Yao, Z.; Shi, X.; Liu, Q.; Liu, Y.; Larrasoaña, J.C.; Liu, J.; Ge, S.; Wang, K.; Qiao, S.; Li, X.; et al. Paleomagnetic and astronomical dating of sediment core BH08 from the Bohai Sea, China: Implications for glacial–interglacial sedimentation. Palaeogeogr. Palaeoclim. Palaeoecol. 2013, 393, 90–101. [Google Scholar] [CrossRef] [Green Version]
- Yi, L.; Yu, H.; Ortiz, J.D.; Xu, X.; Qiang, X.; Huang, H.; Shi, X.; Deng, C. A reconstruction of late Pleistocene relative sea level in the south Bohai Sea, China, based on sediment grain-size analysis. Sediment. Geol. 2012, 281, 88–100. [Google Scholar] [CrossRef]
- Li, J.; Shang, Z.; Wang, F.; Chen, Y.; Tian, L.; Jiang, X.; Yu, Q.; Wang, H. Holocene sea level trend on the west coast of Bohai Bay, China: Reanalysis and standardization. Acta Oceanol. Sin. 2021, 40, 198–248. [Google Scholar] [CrossRef]
- Chen, Y.; Li, Z.; Shao, Y.; Wang, Z.; Gao, W.; Yang, X. Study on the Quaternary chronostratigraphic section in Tianjin area. Seismol. Gelology 2008, 30, 383–399. [Google Scholar]
- Chen, Y.; Wang, H.; Pei, Y.; Tian, L.; Li, J.; Shang, Z. Division and its geological significance of the Late Quaternary marine sedimentary beds in the west coast of Bohai Bay, China. J. Jilin Univ. (Earth Sci. Ed.) 2012, 42, 747–759. [Google Scholar]
- Li, Y.; Tsukamoto, S.; Hu, K.; Frechen, M. Quartz OSL and K-feldspar post-IR IRSL dating of sand accumulation in the Lower Liao Plain (Liaoning, NE China). Geochronometria 2017, 44, 1–15. [Google Scholar] [CrossRef] [Green Version]
- Lai, Z. Testing the use of an OSL standardised growth curve (SGC) for determination on quartz from the Chinese Loess Plateau. Radiat. Meas. 2006, 41, 9–16. [Google Scholar] [CrossRef]
- Li, B.; Jacobs, Z.; Roberts, R. Investigation of the applicability of standardised growth curves for OSL dating of quartz from Haua Fteah cave, Libya. Quat. Geochronol. 2016, 35, 1–15. [Google Scholar] [CrossRef] [Green Version]
- Li, B.; Roberts, R.; Jacobs, Z.; Li, S.-H. Potential of establishing a ‘global standardised growth curve’ (gSGC) for optical dating of quartz from sediments. Quat. Geochronol. 2015, 27, 94–104. [Google Scholar] [CrossRef] [Green Version]
- Long, H.; Lai, Z.; Fan, Q.; Sun, Y.; Liu, X. Applicability of a quartz OSL standardised growth curve for De determination up to 400Gy for lacustrine sediments from the Qaidam Basin of the Qinghai-Tibetan Plateau. Quat. Geochronol. 2010, 5, 212–217. [Google Scholar] [CrossRef]
- Roberts, H.; Duller, G. Standardised growth curves for optical dating of sediment using multiple-grain aliquots. Radiat. Meas. 2004, 38, 241–252. [Google Scholar] [CrossRef]
- Telfer, M.; Bateman, M.; Carr, A.; Chase, B. Testing the applicability of a standardized growth curve (SGC) for quartz OSL dating: Kalahari dunes, South African coastal dunes and Florida dune cordons. Quat. Geochronol. 2008, 3, 137–142. [Google Scholar] [CrossRef]
- Li, Y.; Tsukamoto, S.; Klinge, M.; Sauer, D.; Frechen, M. K-feldspar luminescence dating of the Late Pleistocene sediments in the NW Khangai Mountains, Mongolia. in prep.
- Mueller, D.; Preusser, F. Investigating the applicability of a standardised growth curve approach on Middle Pleistocene sediments from northern Switzerland. Quat. Geochronol. 2021, 101238. [Google Scholar] [CrossRef]
- Chen, G.; Yi, L.; Xu, X.; Yu, H.; Cao, J.; Su, Q.; Yang, L.; Xu, Y.; Ge, J.; Lai, Z. Testing the standardized growth curve (SGC) to OSL dating coastal sediments from the south Bohai Sea, China. Geochronometria 2013, 40, 101–112. [Google Scholar] [CrossRef] [Green Version]
- Murray, A.; Wintle, A. Luminescence dating of quartz using an improved single-aliquot regenerative-dose protocol. Radiat. Meas. 1999, 32, 57–73. [Google Scholar] [CrossRef]
- Peng, J.; Dong, Z.; Han, F.; Long, H.; Liu, X. R package numOSL: Numeric routines for optically stimulated luminescence dating. Anc. TL 2013, 31, 41–48. [Google Scholar]
- Colarossi, D.; Duller, G.; Roberts, H.; Tooth, S.; Lyons, R. Comparison of paired quartz OSL and feldspar post-IR IRSL dose distributions in poorly bleached fluvial sediments from South Africa. Quat. Geochronol. 2015, 30, 233–238. [Google Scholar] [CrossRef] [Green Version]
- Reimann, T.; Notenboom, P.D.; de Schipper, M.; Wallinga, J. Testing for sufficient signal resetting during sediment transport using a polymineral multiple-signal luminescence approach. Quat. Geochronol. 2015, 25, 26–36. [Google Scholar] [CrossRef]
- Tsukamoto, S.; Kondo, R.; Lauer, T.; Jain, M. Pulsed IRSL: A stable and fast bleaching luminescence signal from feldspar for dating Quaternary sediments. Quat. Geochronol. 2017, 41, 26–36. [Google Scholar] [CrossRef] [Green Version]
- Duller, G.A. Single-grain optical dating of Quaternary sediments: Why aliquot size matters in luminescence dating. Boreas 2008, 37, 589–612. [Google Scholar] [CrossRef]
- Gray, H.J.; Jain, M.; Sawakuchi, A.O.; Mahan, S.A.; Tucker, G.E. Luminescence as a Sediment Tracer and Provenance Tool. Rev. Geophys. 2019, 57, 987–1017. [Google Scholar] [CrossRef] [Green Version]
- Timar, A.; Vandenberghe, D.; Panaiotu, E.; Panaiotu, C.G.; Necula, C.; Cosma, C.; Haute, P.V.D. Optical dating of Romanian loess using fine-grained quartz. Quat. Geochronol. 2010, 5, 143–148. [Google Scholar] [CrossRef]
- Timar-Gabor, A.; Buylaert, J.-P.; Guralnik, B.; Trandafir-Antohi, O.; Constantin, D.; Anechitei-Deacu, V.; Jain, M.; Murray, A.; Porat, N.; Hao, Q.; et al. On the importance of grain size in luminescence dating using quartz. Radiat. Meas. 2017, 106, 464–471. [Google Scholar] [CrossRef]
Publisher’s Note: MDPI stays neutral with regard to jurisdictional claims in published maps and institutional affiliations. |
© 2021 by the authors. Licensee MDPI, Basel, Switzerland. This article is an open access article distributed under the terms and conditions of the Creative Commons Attribution (CC BY) license (https://creativecommons.org/licenses/by/4.0/).