Article

Effect of Temperature Fluctuation and Nutritional Status on Starry Flounder, Platichthys stellatus, Survival and Adaptive Physiological Response

East Sea Fisheries Research Institute, National Institute of Fisheries Science, 1194 Haean-ro, Yeongok-myeon, Gangneung-si 25435, Korea
*
Author to whom correspondence should be addressed.
J. Mar. Sci. Eng. 2021, 9(12), 1361; https://doi.org/10.3390/jmse9121361
Submission received: 4 November 2021 / Revised: 27 November 2021 / Accepted: 28 November 2021 / Published: 1 December 2021
(This article belongs to the Section Marine Biology)

Abstract

:
Starry flounder (Platichthys stellatus) is a commercially important cold-water fish. Our aim was to investigate the effects of fluctuating water temperature on flounders after periods of starvation and feeding. Fish were divided into starvation and feeding groups. The water temperature was increased stepwise in experiment 1; more focused variations, based on the results of experiment 1, were studied in experiment 2. At temperatures ≤27 °C, there was no significant difference observed in survival. At 28 °C, mortality increased, survival was lower (21%) in the starvation group than in the feeding group (46%), and weight loss was the highest (15%) in the starvation group. In experiment 2, survival was ≥86%, and there was no significant difference between the starvation/feeding groups. However, when the water temperature was increased to 27 °C after being decreased to 12 °C, weight loss was the highest (11%). Glucose, cortisol, superoxide dismutase (SOD), catalase (CAT), and glutathione (GSH) levels increased with increasing water temperature, and then gradually decreased. Glutamic pyruvic transaminase (GPT)/glutamic oxaloacetic transaminase (GOT) levels showed large variations among individuals. Triglyceride, cholesterol, and protein levels gradually decreased with long-term starvation. Survival was not affected by water temperature drop ≤27 °C after starvation/feeding. These results indicate that 27 °C is the upper limit of tolerable water temperature for the survival of starry flounders. Therefore, aquaculture farms should ensure maintaining water temperatures at ≤27 °C during high-temperature periods.

1. Introduction

The starry flounder (Platichthys stellatus) is a cold-water fish species that inhabits the East Sea of Korea, the Sea of Okhotsk, and the waters from Alaska to California [1]. The flounders are mainly aquafarmed on the east coast of Korea and China. Due to their tolerance of low water temperature, salinity resistance, and high demand, starry flounders have recently become an important marine aquaculture species [2,3]. However, high mortality occurs at water temperature rise above 27 °C during summers in Korea. When the water temperature rises so, the aquaculture farms respond by starving the fish and blocking the inflow of water from outside. The fish respond to this starvation period by utilizing the energy accumulated in the body while adapting to the physiologically and ecologically changed environment in the short term [4,5,6]. In general, proper environmental conditions (water temperature, salinity, dissolved oxygen, etc.) are an important factor in fish-farming [7,8]. For ectotherms such as fish, water temperature change is one of the most important factors for adaptation that enable them to maintain energy homeostasis through such as metabolic regulation and behavioral reduction [9,10]. Fish have a narrow range of temperature that allows optimal survival and growth [11,12], and this range varies depending on the growth stage of the fish. Therefore, water temperature is a very important factor in the growth of aquaculture species and in determining production costs. According to food and agriculture (FAO) report (2020), the production of farmed fish increased continuously, with global production expected to rise from the current 46% to 53% by 2030 [13]. In recent years, damages to farmed fish due to natural disasters, such as heat waves, are increasingly being reported [14]. Global warming due to climate change has both direct and indirect impact on aquaculture. Direct impacts, include physical and physiology effects on the fish stock [15]. Indirect impacts may be observed with the rising prices of fishmeal, fish oil, and other fisheries products [16,17]. Research on the effects of water temperature to reduce or manage fish mortality is, therefore, urgently needed. Several short- and long-term starvation experiments on major fish species report that nutritional deficiencies are distinctly different for each tissue or organ within an individual, and that weight, composition of muscle tissue, blood composition, and hepatic enzyme activity vary as a result of long-term starvation [18,19,20]. Biomarkers used to determine the health of fish include changes in body weight, liver weight index, changes in liver tissue [21], and hematological characteristics. In addition, blood cholesterol, triglyceride, glucose, protein, and insulin levels are used as indicators to determine the nutritional status and patterns of energy consumption [22,23,24].
Oxidative stress occurs when the pro-oxidant–antioxidant equilibrium shifts, leading to dysfunction and oxidative damage. When exposed to oxidative stress, free radicals are generated to protect the body. Reactive oxygen species (ROS) are free radicals that include superoxide (O2−), hydroxyl (OH), peroxyl (RO2), and hydroperoxyl (HRO2−). They can affect living cells by simultaneously attacking proteins, lipids, and nucleic acids. Persistent high levels of oxidative stress can lead to physiological dysfunction, apoptosis, and aging of organisms [25]. The antioxidant defense system is maintained at equilibrium with the level of ROS under normal conditions. Antioxidants, such as superoxide dismutase (SOD), catalase (CAT), and glutathione (GSH) are representative indicators of oxidative stress [26,27].
Cortisol and glucose levels are physiological indicators of increased exposure to environmental stress [28,29]. Cortisol has a direct effect on living cells by specifically binding to glucocorticoid receptors in the cell membrane. Cortisol is a hormone that regulates metabolism and osmosis in organisms and is essential to maintain biological functions under normal conditions [30].
There have also been other studies on starry flounders in the past, including those on nutritional status [31,32,33] and stress responses [2,3].
In the present study, we evaluated the effect of water temperature after starvation and feeding on the change of body weight and survival rate including physiological and oxidative stress response in starry flounder plasma. The observations can help understand the effects of long-term exposure to high water temperature in aquafarms.

2. Materials and Methods

2.1. Fish and Rearing Conditions

Starry flounders (443 ± 41 g/fish) were purchased from a local aquafarm in July 2021. Fish were transported to the laboratory in a 1-ton tank (1.1 m diameter and 1 m depth) filled with UV-treated seawater, the fish were acclimatized for 14 days, and were exposed to a 12 h light–12 h dark photoperiod. Temperature, dissolved oxygen (DO), salinity, and pH of the seawater were maintained at 22 ± 0.5 °C, 7–8 mg/L, 33 psu, and 7.5 ± 0.2, respectively. The experimental conditions (temperature, DO, salinity, and pH) were recorded using YSI ProDSS (YSI Incorporated, USA) every day during the experimental period, with a water exchange rate of 3.33 L/min. Fish were fed twice daily with a commercially extruded pellet feed (Suhyup Feed Co. Ltd., Uiryeong, Korea) containing 52% crude protein and 11% crude lipid. The animal experiment protocols were in accordance with the guidelines of the National Institute of Fisheries Science for Laboratory Animals (approval no. 2021-NIFS-IACUC-36).

2.2. Experimental Design

The experiment was designed to investigate the effect of water temperature after starvation and feeding of the starry flounder and is shown in Figure 1. In experiment 1, the water temperature was increased stepwise to 26, 27, and 28 °C after starvation (26 °C_S, 27 °C_S, and 28 °C_S) and feeding (26 °C_F, 27 °C_F, and 28 °C_F) for one week from a baseline temperature of 22 °C, per group. In experiment 2, the water temperature was increased steeply to 27 °C from 22 °C after starvation (SH) and feeding (FH) for one week; from 12 °C for 2 days to 27 °C after starvation (SCH) and feeding (FCH) at 22 °C; and gradually to 27 °C with an increase of 0.5 °C per day after feeding (NH) at 22 °C. Water temperature was controlled using a heat-pump (BLUE AIR-TEK, Seoul, Korea), there was an error of ±0.3 °C from the set water temperature. Survival was investigated for 4 weeks after reaching the target water temperature for each group. The study was performed in two replicates of tanks per group. Fishes were divided into 11 groups with 75 fish in each tank.

2.3. Sampling

Weight and length of fish were measured at the beginning and end of the experiment.
Fulton’s condition factor (K) was calculated according to the Htun–Han (1987) equation [34] as per the formula given below:
K = W × 100 L 3
W = weight of fish (g), L = length of fish (cm)
The mean weight of total fish in the group was measured for each experimental group at the beginning and the end of the experiment. The weight loss rate of the fish was calculated using the following formula:
Weight loss (WL%) = (mean final weight − mean initial weight)/mean final weight × 100
To investigate stress and changes in blood components, three fish were randomly selected from each group and blood was collected on 0, 7, 9, 12, 15, 21, 27, and 34 days. Fish were anesthetized by immersion in tricaine methanesulfonate (Sigma Aldrich Co., St. Louis, MO, USA) at a dose of 50 ppm, and then blood was collected from the caudal vessel using a syringe treated with heparin and the sample was centrifuged at 3000× g for 20 min. The plasma was collected and stored at −80 °C till further use.

2.4. Biochemical Analysis

Glutamic pyruvic transaminase (GPT), Glutamic pyruvic transaminase (GOT), glucose, total cholesterol (TCHO), triglyceride (TG), and total protein (TP) levels in plasma were measured using an automatic analyzer (FUJI DRI-CHEM 4000i; Fujifilm Co., Tokyo, Japan). Commercially available ELISA kits were used to analyze SOD (Cayman Chemical Co., Ann Arbor, MI, USA), cortisol (Cusabio Biotech Co., Ltd.,Wuhan, China), CAT (Cayman Chemical, USA), and GSH (Cayman Chemical, USA) levels in plasma. The procedure was performed according to the manufacturer’s protocol, and the absorbance was measured at 450 nm using a spectrophotometer (Multiskan GO, Thermo Scientific, Waltham, USA).

2.5. Statistical Analysis

Statistical analyses were performed using the one-way ANOVA using SPSS version 19.0 (SPSS Inc., Chicago, IL, USA). Significant differences between the means were tested using Duncan’s multiple range test (p < 0.05). All data are presented as mean ± standard deviation.

3. Results

3.1. Survival Rate, Condition Factor, and Weight Loss

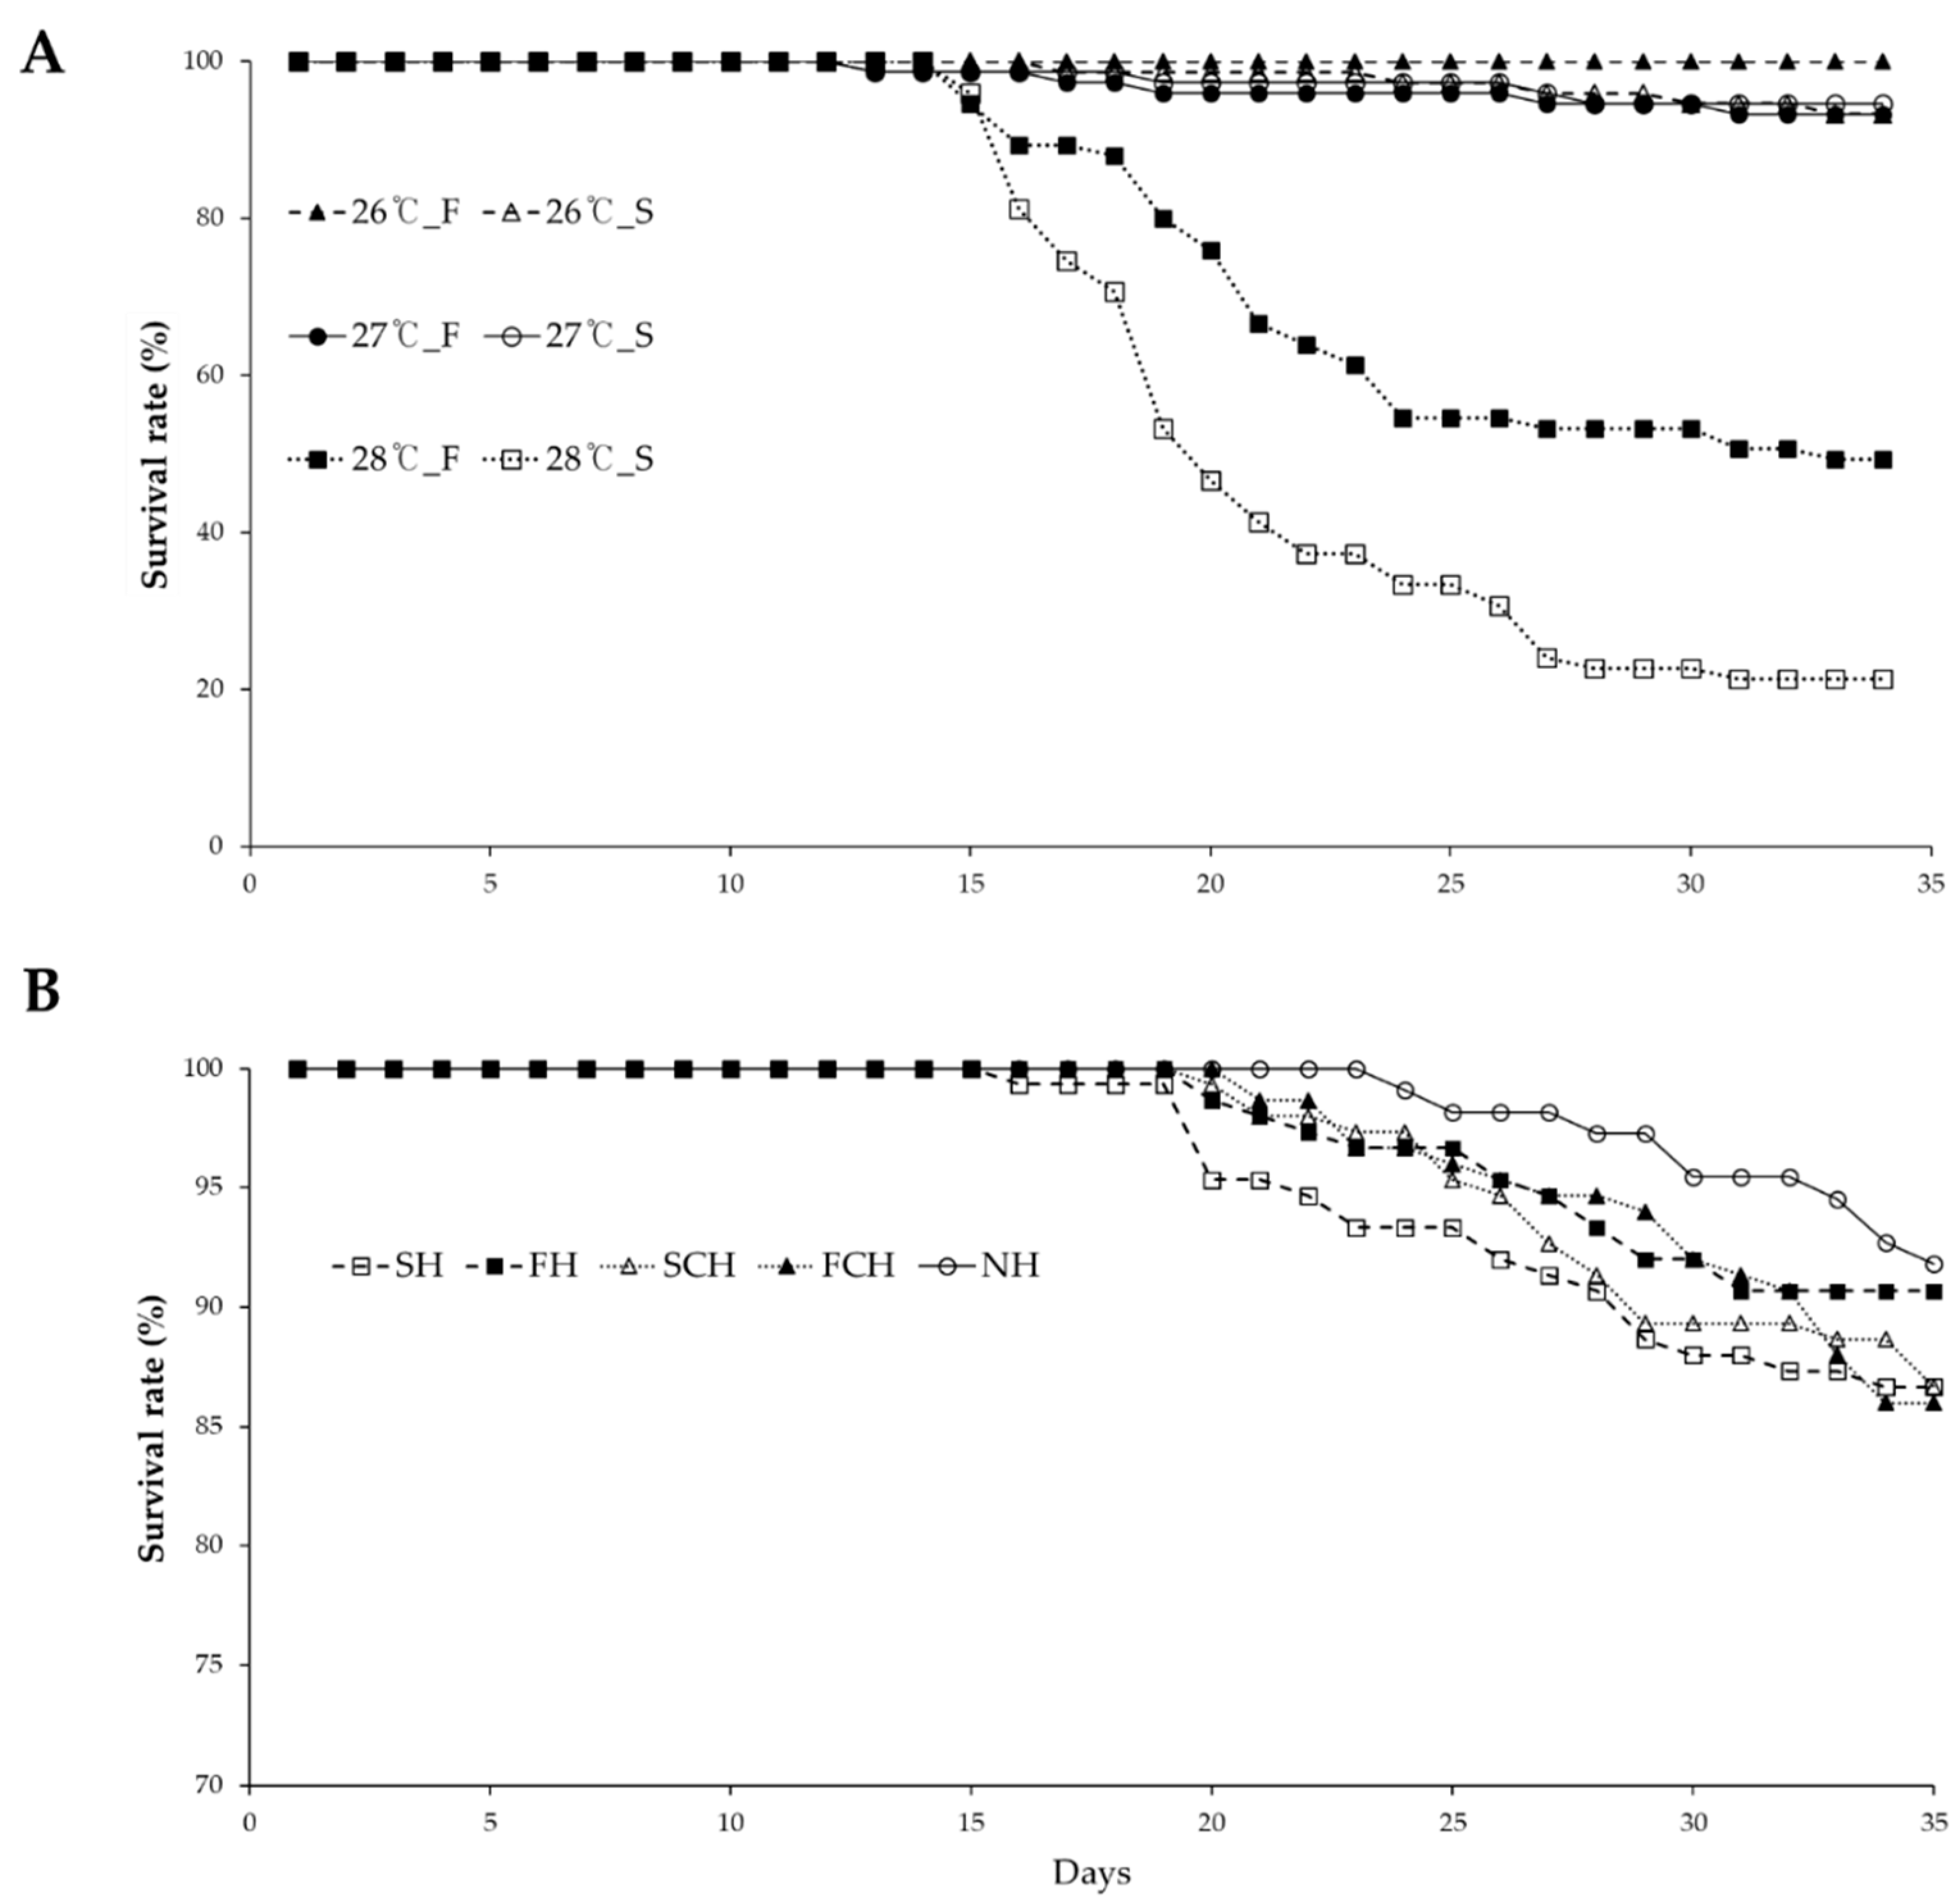
Figure 2 shows the survival rates for various groups when the water temperature was increased after starvation and feeding for one week. In experiment 1, the survival rate was 93% in the group 26 °C_S, 100% in 26 °C_F, 95% in 27 °C_S, and 93% in 27 °C_F; there was no significant difference among the groups. When the water temperature was raised further to 28 °C, the survival rate sharply dropped to 21% in 28 °C_S and 49% in 28 °C_F (Figure 2A). In experiment 2, the survival rate was 86% in SH and 90% in SF when the water temperature was directly increased to 27 °C, 86.6% in SCH, and 86% in FCH when the water temperature was increased to 27 °C after decreasing to 12 °C, and 91.8% in NH (Figure 2B).
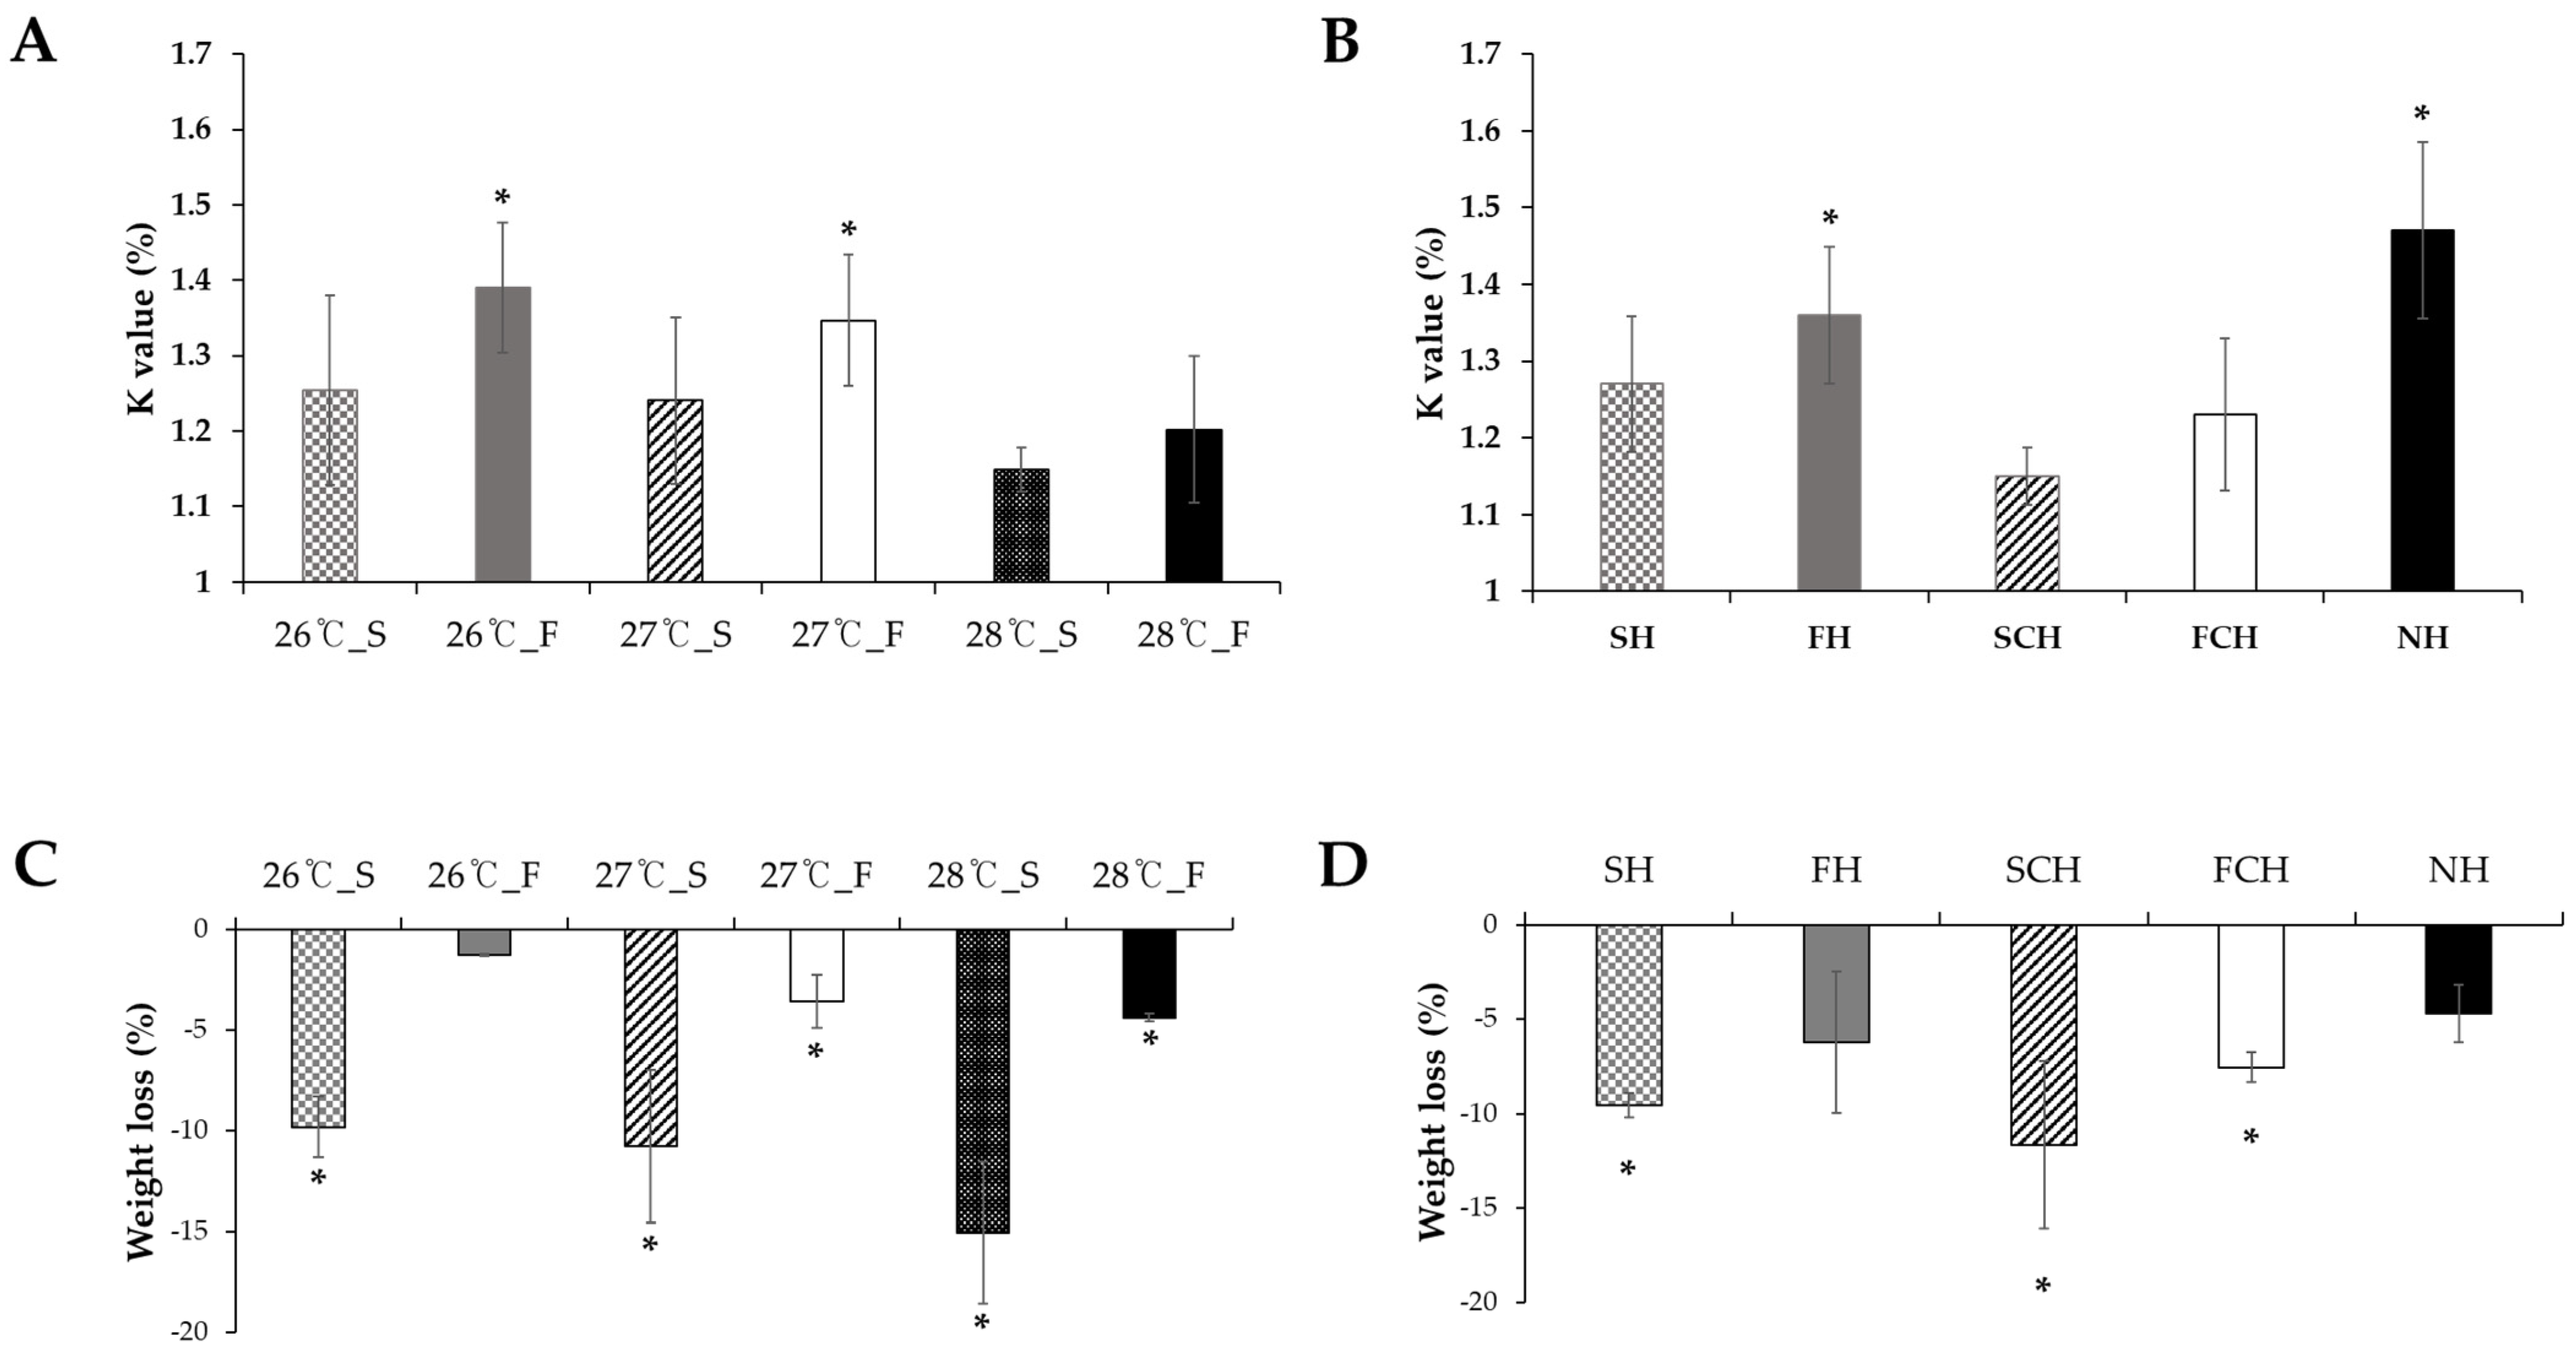
Figure 3 shows the condition factor (%) and weight loss (%) per group when the water temperature was increased after starvation/feeding for one week. In experiment 1, the values of condition factor ‘K’ were 1.14–1.39 (Figure 3A), and the weight loss observed in different groups was 9.8% in 26 °C_S, 1.2% in 26 °C_F, 10.7% in 27 °C_S, 3.5% in 27 °C_F; 15.3% in 28 °C_S, and 4.3% in 28 °C_F (Figure 3C). In experiment 2, the values of condition factor ‘K’ were 1.15–1.47 (Figure 3B), weight loss was observed to be 9.5% in SH and 6.2% in FH, when the water temperature was directly increased to 27 °C; 11% in SCH and 7.5% in FCH, when the water temperature was increased to 27 °C after decreasing to 12 °C; and 4.7% in NH, when the water temperature was gradually increased to 27 °C (Figure 3D).

3.2. Glucose and Cortisol Level in Plasma

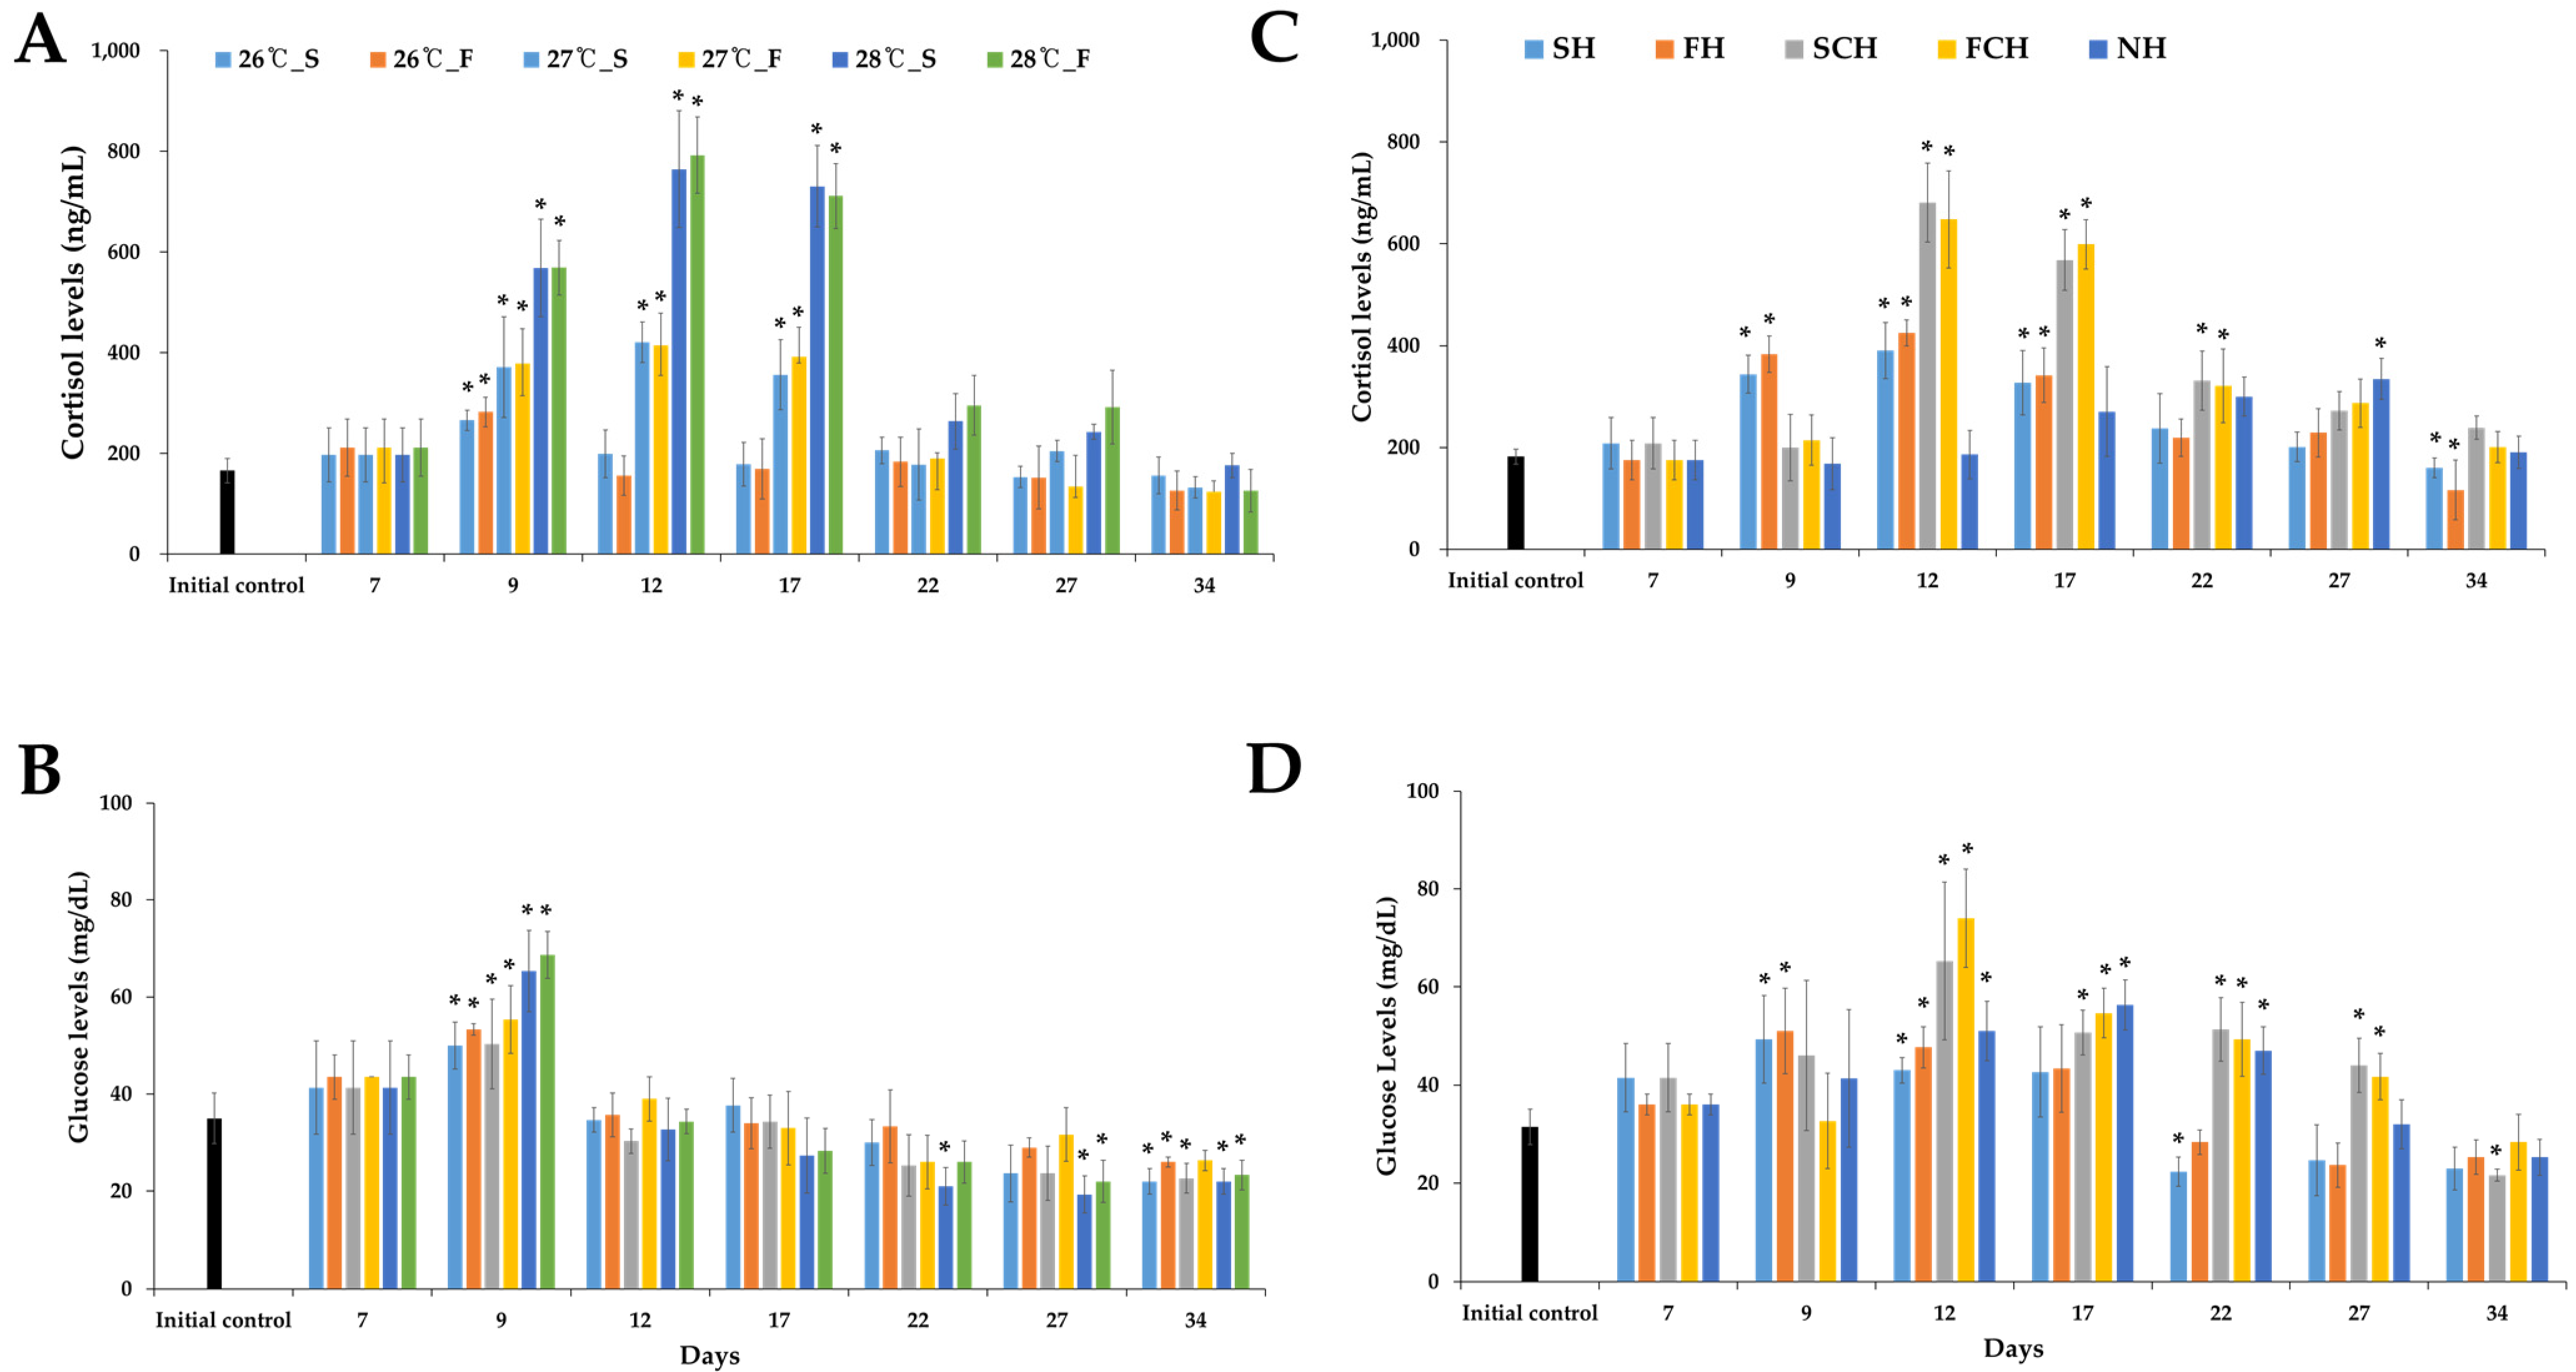
In experiment 1, the level of cortisol increased significantly to 764.6 ng/mL in group 28 °C_S and to 792.7 ng/mL in 28 °C_S; levels remained high until the 17th day (Figure 4A). The glucose levels were observed to be high in all groups from day 9 (second day of increasing the water temperature) and remained between 50–68.6 mg/dL thereafter till day 12 when the glucose level decreased to a level similar to that of the initial control (Figure 4B). In experiment 2, the highest cortisol levels were recorded at 390 ng/mL in SH and 425 ng/mL in FH on day 12; and 681 ng/mL in SCH and 648 ng/mL in SCF on day 12. When the water temperature was increased, an acute increase in cortisol levels was observed. In the NH group, cortisol levels increased gradually, and the highest level observed was 334.6 ng/mL on day 27 (Figure 4C). The glucose levels increased to 49 mg/dL in SH and 51 mg/mL in FH on day 9 (second day of increasing water temperature) compared to the initial control level at 31.5 mg/dL. However, glucose levels in SCH (65.3 mg/dL) and FCH (74 mg/dL) showed a high increase and then gradually decreased. The glucose levels in the NT group increased to the highest value of 56.3 mg/dL on day 17 (Figure 4D).

3.3. Antioxidant Activity (SOD, CAT, and GSH)

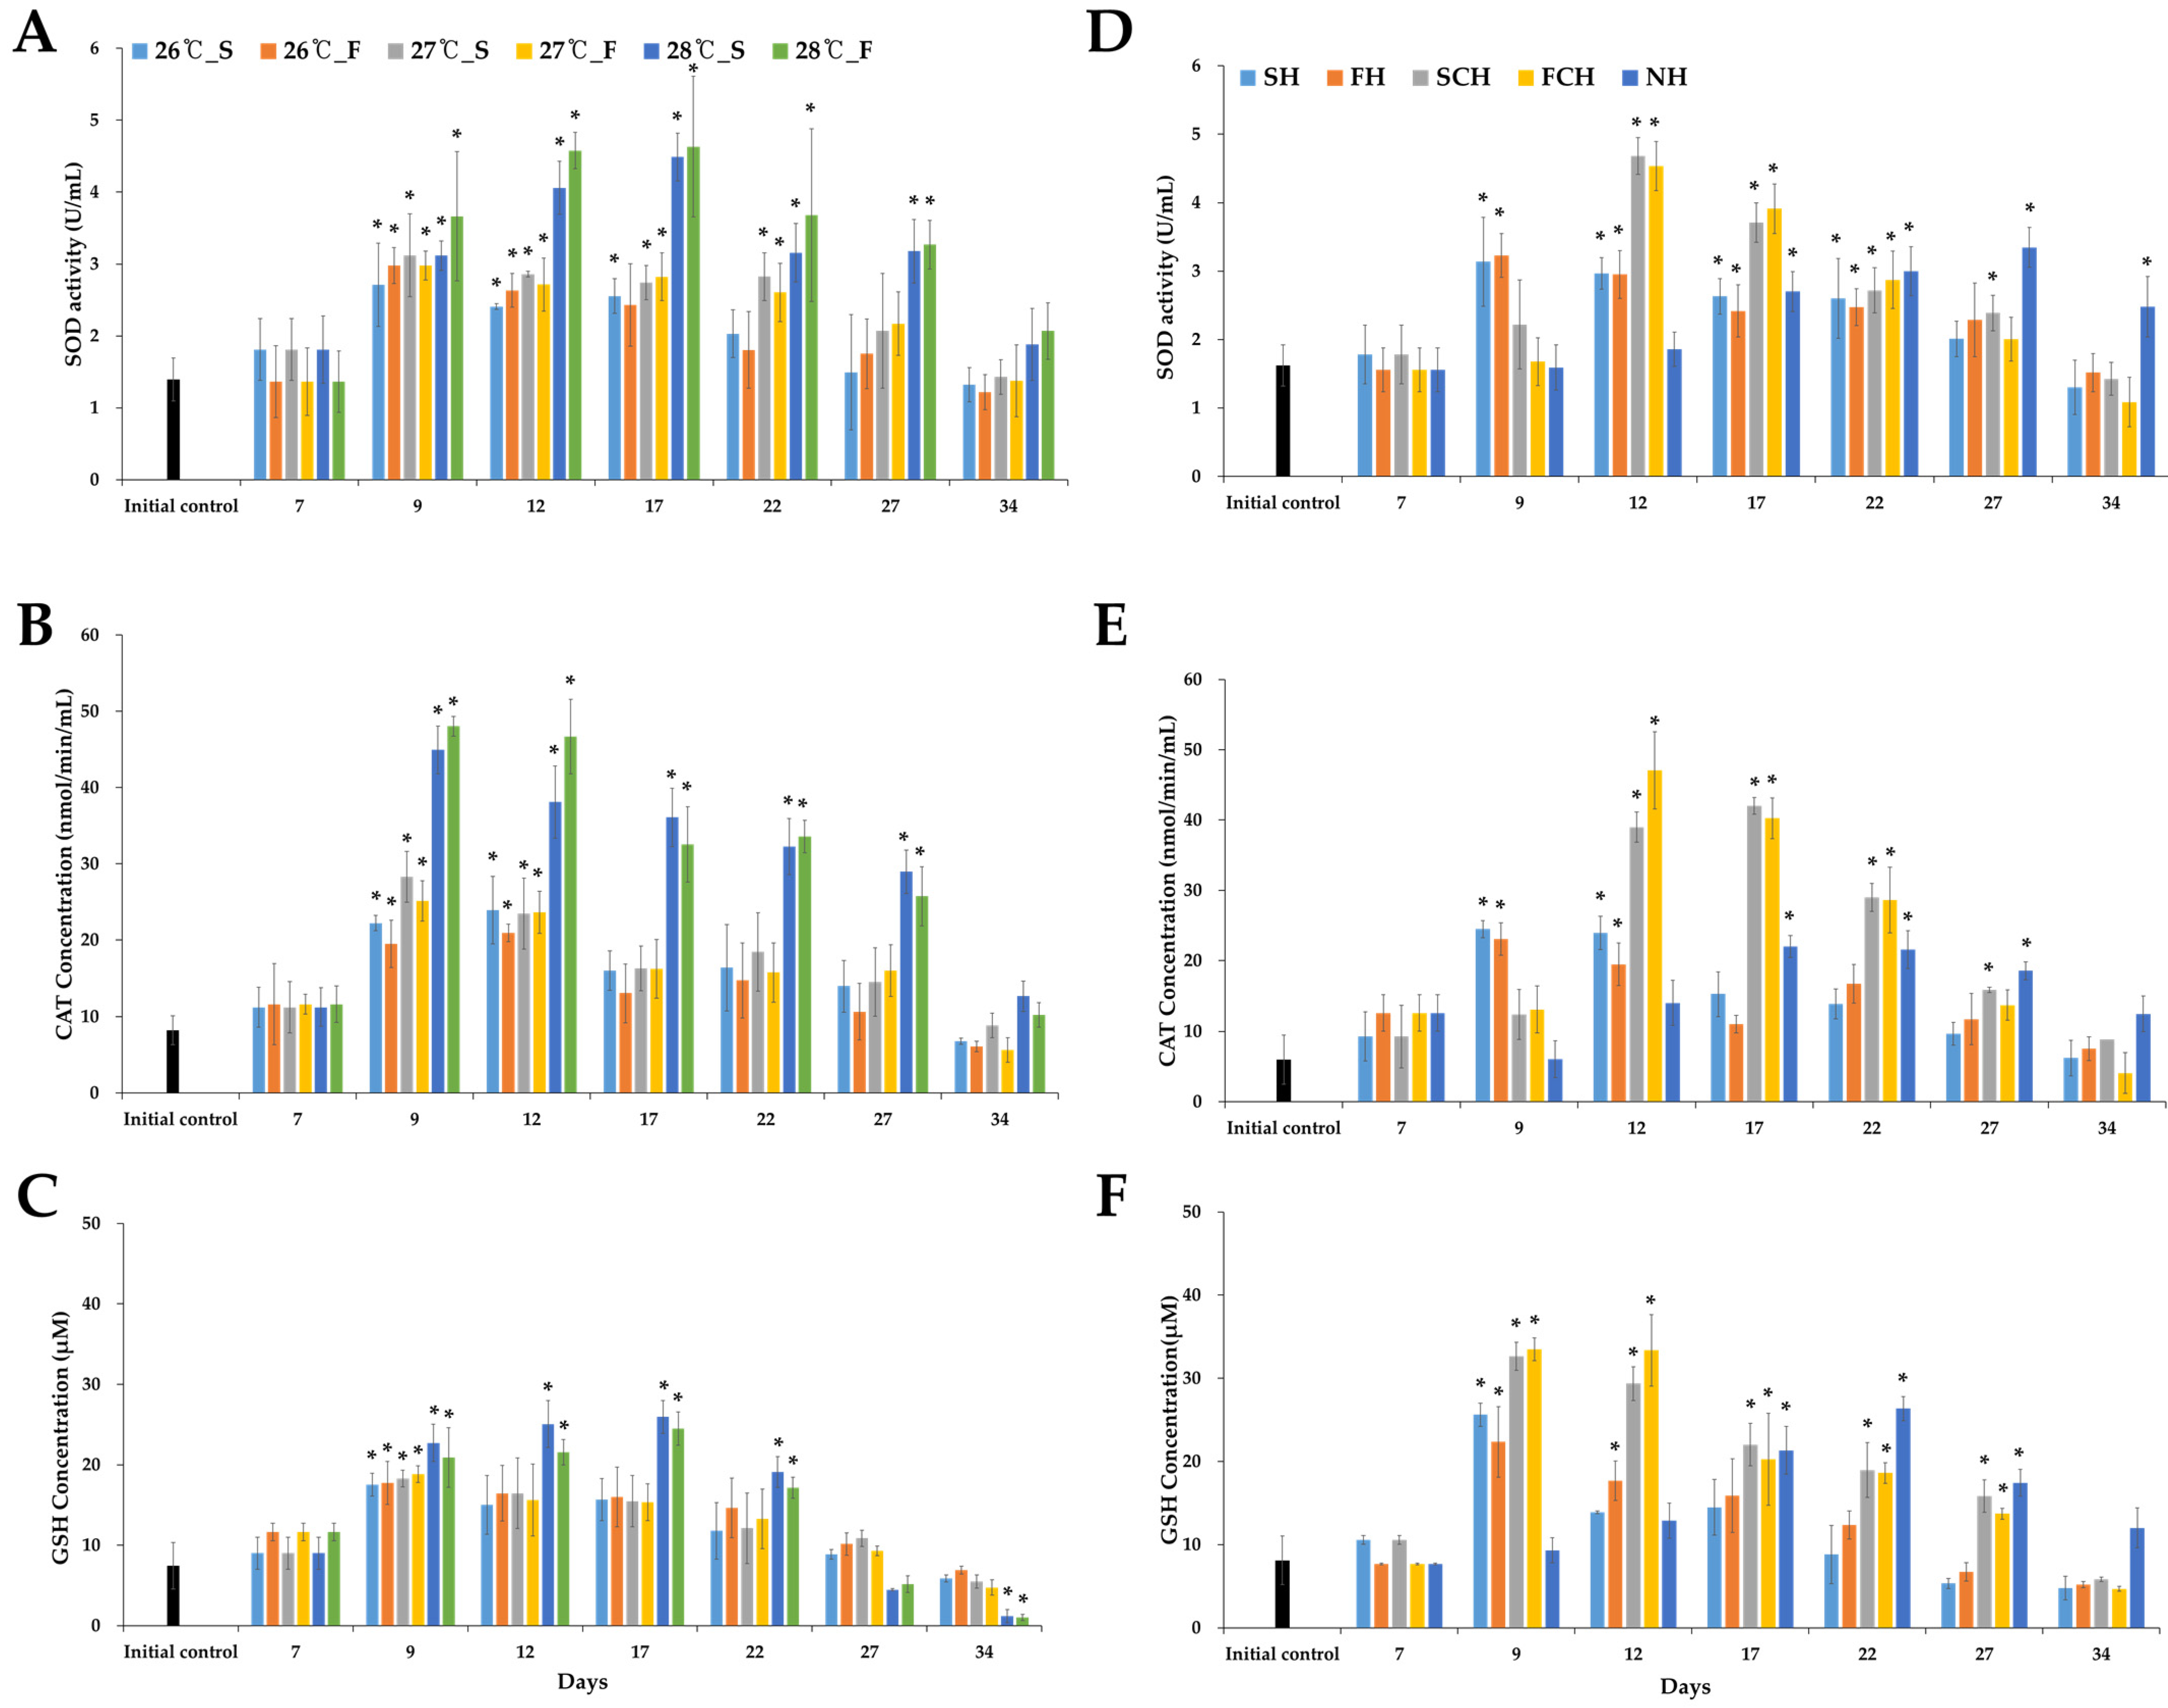
In experiment 1, SOD activity increased with increasing water temperature, and was the highest at 4.6 U/mL in group 28 °C_F on day 17 (Figure 5A). Higher levels of CAT were maintained in the 28 °C groups compared to other experimental groups, and the highest level (48 nmol/min/mL) was observed on day 9 (Figure 5B). The GSH levels were high until day 17 in the 28 °C groups; they decreased thereafter. The GSH levels were the lowest at 1.02 µM on day 34 in the 28 °C groups (Figure 5C). In experiment 2, SOD levels increased on day 9, showing the highest level of 3.2 U/mL in FH on day 9. A sharp increase in the SOD level was observed in groups SCH and FCH, the highest levels being 4.68 U/mL in SCH and 4.53 U/mL in FCH. The levels in the NT group increased with 1.86 U/mL from day 12, showing the highest level of 3.34 U/mL on day 27 (Figure 5D). The CAT levels also showed a pattern similar to the SOD levels, with CAT being the highest at 47.06 nmol/min/mL in FCH. GSH levels were highest at 49.8 µM in SCH on day 12. In the NT group, CAT and GSH levels decreased on day 9 compared to day 7. They gradually increased thereafter, showing the highest level at 22 µM on day 17 and decreased thereafter (Figure 5E,F).

3.4. Biochemical Analysis in Plasma

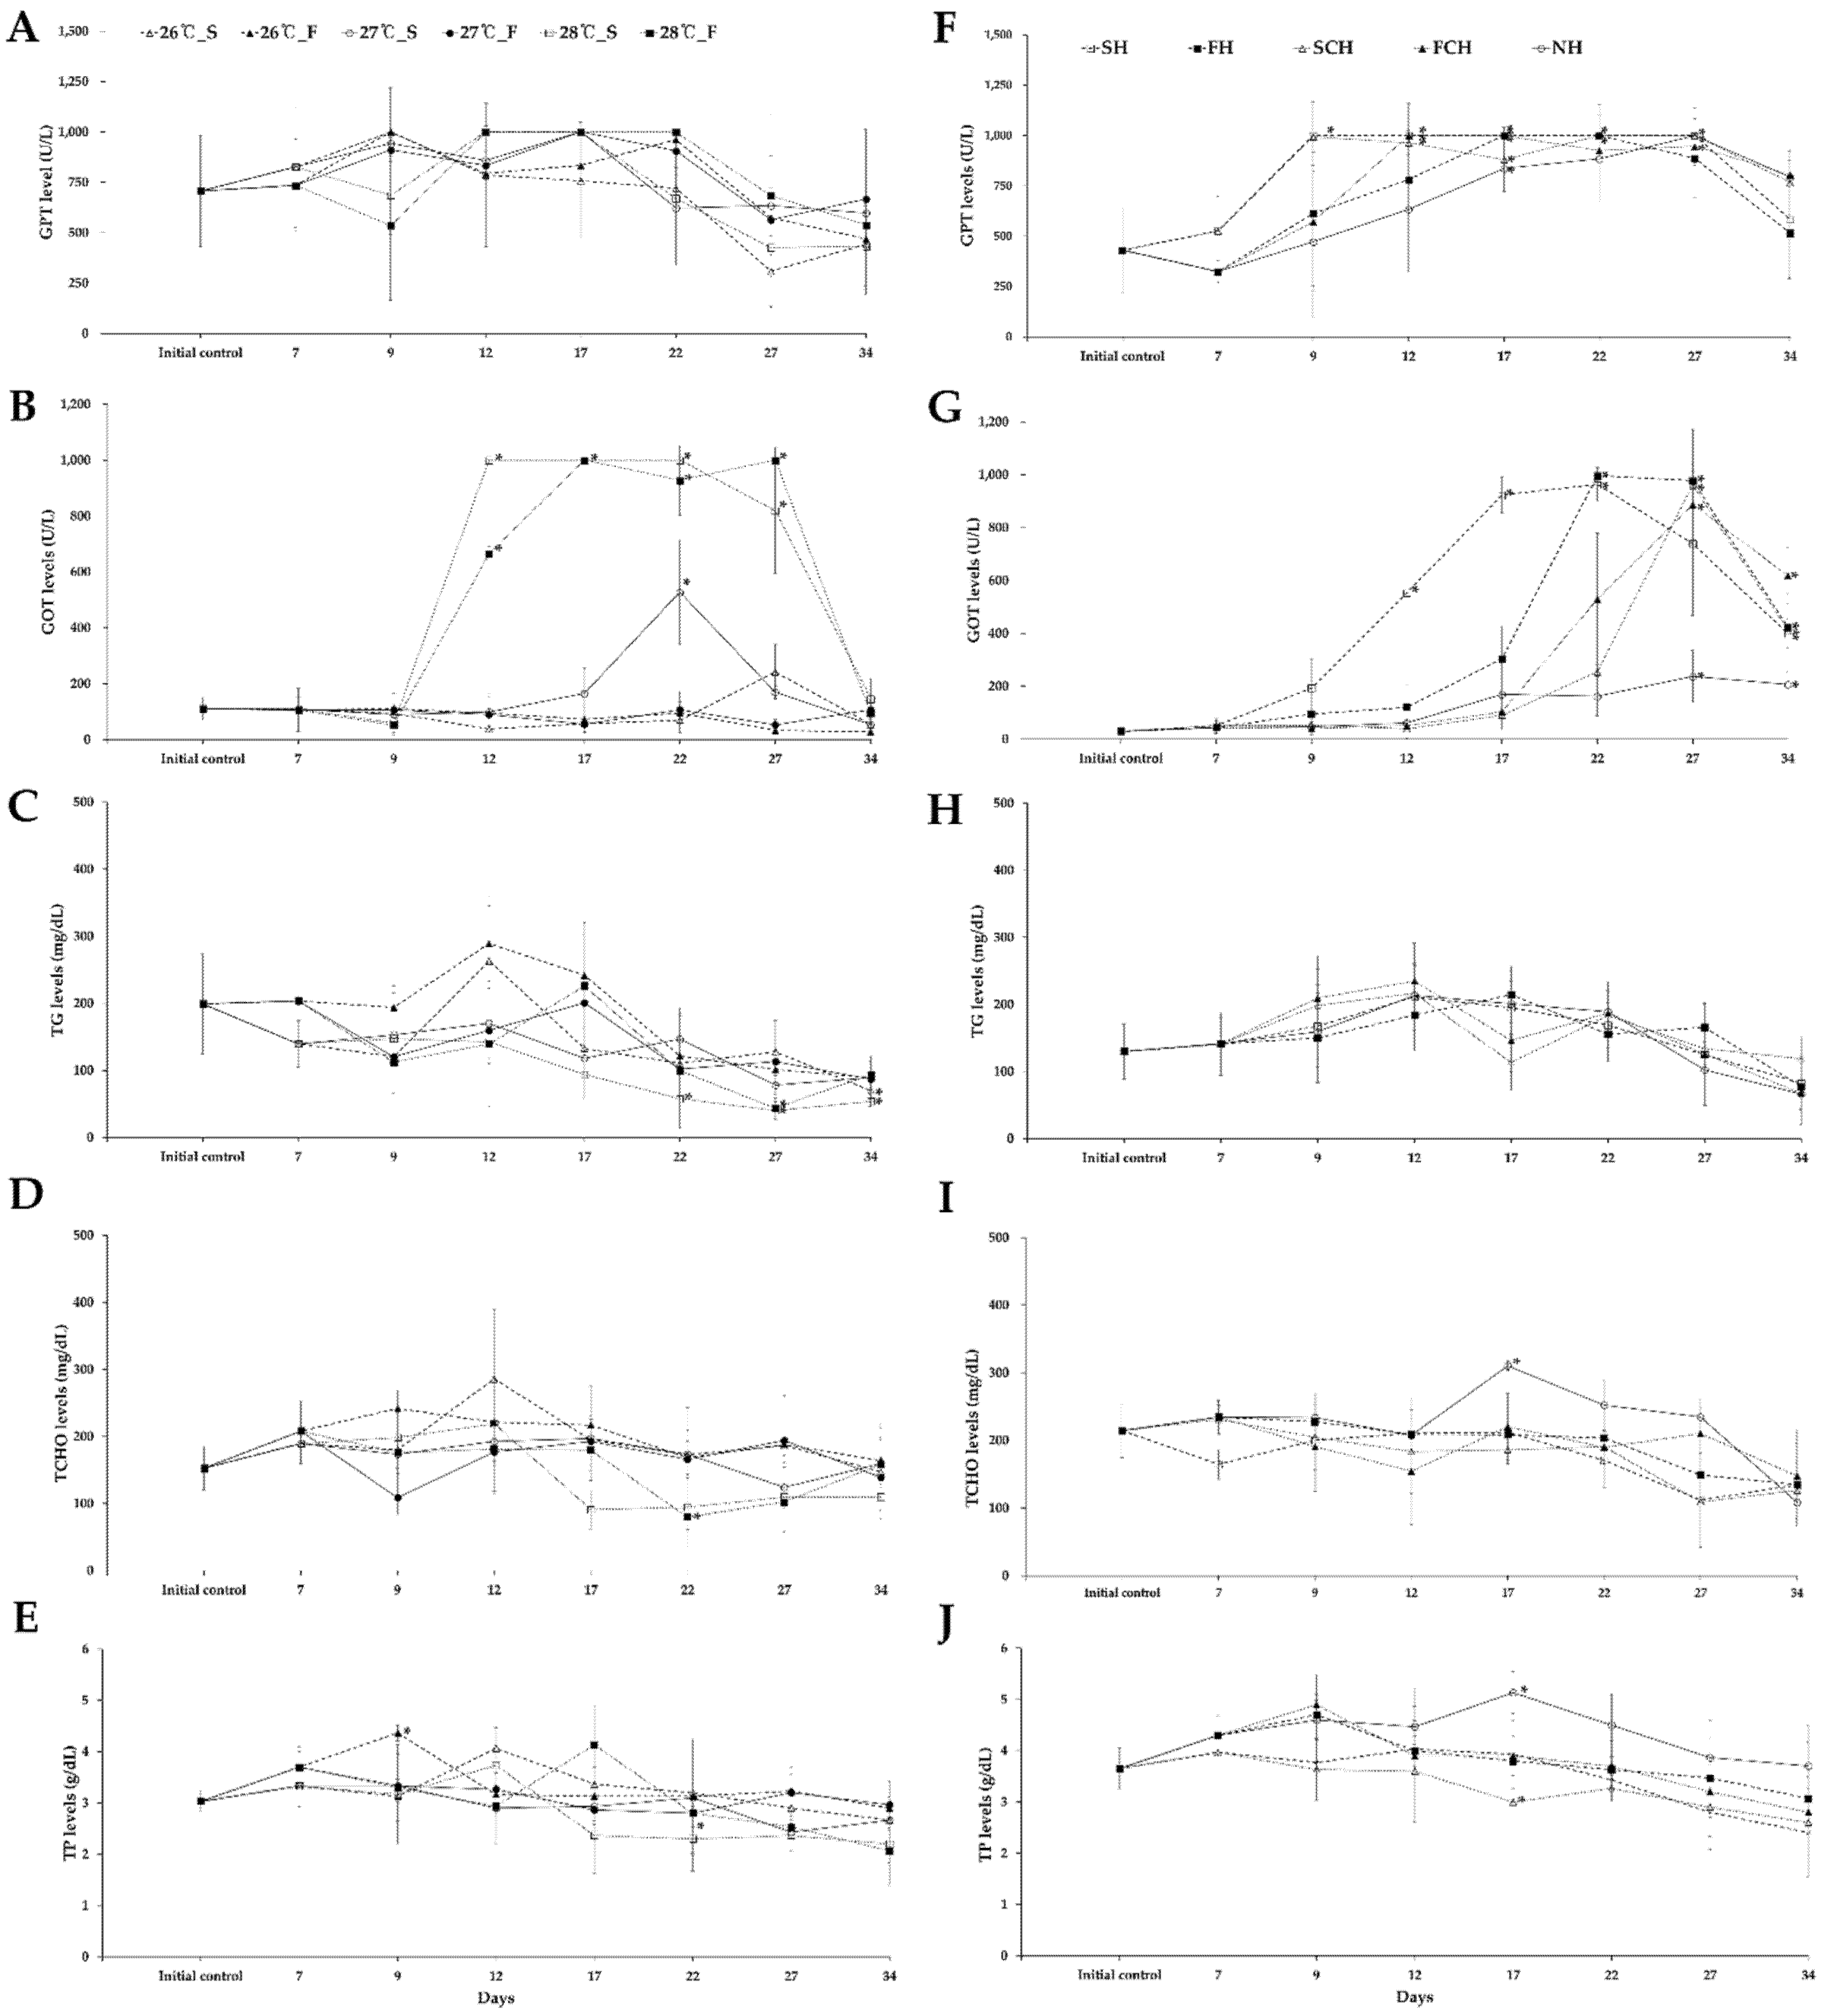
Figure 6 depicts the effects of water temperatures on plasma biochemical parameters of starry flounders. In experiment 1, the GPT levels were observed to be high (≥1000 U/L, actual reading beyond the upper detection limit) with a large deviation after changing the water temperature (Figure 6A). The GOT levels were not significantly different from the initial control on day 9 after the increase of water temperature, but showed a high level (≥1000 U/L) in the 28 °C groups from day 12 but decreased sharply towards the end of the experiment (Figure 6B). TG and THCO levels were higher than those of the initial control in the 26 °C groups on day 12; TG was 263.3 mg/dL in 26 °C_S, and 289 mg/dL in 26 °C_F; THCO was 285 mg/dL in 26 °C_S, and 221 mg/dL in 26 °C_F. The levels decreased thereafter (Figure 6C,D). TP levels increased slightly after change of water temperature; there was no significant difference observed (Figure 6E).
In experiment 2, GPT levels were ≥1000 U/L at increased water temperatures and decreased at the end of the experiment. The GPT levels in the NT group gradually increased (Figure 6F). In the SCH and FCH groups, high GOT levels were observed in the SH and FH groups on day 22, and in the SCH and FCH groups on day 27. The NT group showed the highest level at 237.3 U/L on day 27 (Figure 6G). TG levels were not significantly different (Figure 6H). THCO levels were high in the NT group, which was the highest at 310.3 mg/dL on day 17. THCO levels, except for the NT group, gradually decreased (Figure 6I). TP levels were highest at 5.1 g/dL in NT at day17 and lowest at 2.4 g/dL in SH at the end of the experiment.

4. Discussion

This study aimed to assess the changes in body weight, survival, and the physiological changes of starry flounders in response to changes in water temperature after periods of starvation and feeding. This fish was found to be fairly resistant to low water temperatures, with the range of optimum water temperature being 13–18 °C [35]. There have been reports of damage to cultured fish due to sharp changes in water temperature during the summer season caused by global warming and the occurrence of cold-water zones, according to the topographical characteristics of the east coast region. However, research on these issues is lacking.
Previous studies documented that high temperature induced decreased survival, slower growth rate, and reduced protein synthesis, while starvation had adverse impacts on weight gain indices [36,37]. In the present study, the survival rates observed in experiment 1 indicated that the upper limit of tolerable water temperature of the starry flounder was 27 °C. When the water temperature increased to 27 °C, the survival rate was >80%, but at 28 °C, the survival rate decreased drastically. In addition, there was no significant difference observed in survival rates according to starvation or feeding until 27 °C, but at 28 °C, there was a marked difference, with the starvation group showing a 21% survival rate and the feeding group showing a 49% survival rate. Experiment 2 was designed based on the results of experiment 1. The survival rate in experiment 2 was between 86–91%, and the fish were not significantly affected by the sudden change in water temperature.
The condition factor (K) of a fish reveals the physical and biological environments and fluxes by interactions among the feeding conditions, parasitic infections, and physiological factors [38]. The value of K was the lowest at starvation of 28 °C in experiment 1 and was the lowest in starvation when the water temperature was increased after a decrease (SCH group) in experiment 2. Fish that stopped feeding during the experimental period lost weight. The weight loss was between 9.8–15.1% in the starvation groups of experiment 1, and between 9.5–11.6% in the starvation groups of experiment 2, which were higher than the corresponding feeding groups. Sudden changes in water temperature cause death, and diseases, reduced growth, and consumption of excessive internal energy to maintain homeostasis in aquatic organisms [39]. In the present study, fish at 28 °C showed a higher rate of weight loss and a lower condition factor than those at 26 °C in experiment 1, and starved fish when the water temperature was increased after a decrease (SCH group) showed a higher rate of weight loss and a lower condition factor in experiment 2. It seems that a lot of energy was expended to maintain homeostasis above the tolerable water temperature or at an acute water temperature change. Therefore, the heat-stress effects were typically pronounced at 28 °C. At this temperature, survival, condition factor, and weight declined significantly in the starvation group, reflecting the high energy demands. These energy costs were observed prominently in the changes in the body composition of starved fish at 28 °C.
This study found that high plasma glucose levels indicated heat-stress in fish. Glucose is an important energy source, and its levels seemingly change with increasing water temperature. In organisms under thermal stress, abundant energy in the form of blood glucose is essential to meet the increasing energy demand. The liver is the main organ for gluconeogenesis. When an organism is under extreme thermal stress, the liver is unable to perform gluconeogenesis, with decreasing concentration of glucose in the liver [40]. In our study as well, glucose levels were observed to increase with changes in water temperature. In experiment 1, the glucose levels initially increased with increasing water temperature, but later fell below the initial control level. In experiment 2, a sharp increase in glucose levels was observed when the water temperature was increased.
Activity of transaminases (GPT and GOT) are quantitatively the most important aminotransferases and are related to amino acid metabolism in the liver [40].
GPT and GOT levels increased rapidly in rainbow trout after they were exposed to acute thermal stress as reported by Roh et al. [41]. In the present study, levels of GPT and GOT secreted in the liver were above the detection limit (≥1000 U/L) with the increase in water temperature, and then decreased towards the end of the experiment. This seems to indicate liver damage due to high temperatures rather than adaptation to water temperature.
According to previous studies, decrease of TG and TP levels in serum were obtained from studies of thermal stress [42,43]. TCHO is an important component of the biological membrane and continues to give membrane fluidity at higher temperature, essential for life [44]. TCHO and TG levels changed according to water temperature, and this trend was also observed in European sea bass; these levels decreased with increasing water temperature [45]. The decrease observed in fish was likely due to the depletion of TG and cholesterol levels in the liver, which supports the energy demand of gluconeogenesis [46]. In the present study, TG and THCO levels increased slightly after increasing the water temperature. When the water temperature was gradually increased, the THCO level was high, but the TG, THCO, and TP levels decreased gradually as the high temperatures persisted.
Previous studies have reported changes in cortisol levels with increasing water temperature. Cortisol is an indicator of stress in fish. Changes in cortisol levels in many species have been reported as indicators of thermal stress responses. In fish, such as Atlantic cod (Gadus morhua), goldfish (Carassius auratus), zebrafish (Danio rerio), and rainbow trout (Oncorhynchus mykiss), cortisol levels increased with changes in water temperature [47,48,49,50].
In our study as well, cortisol levels increased with changes in water temperature. In experiment 1, cortisol levels were particularly higher at 28 °C compared to the other experimental groups.
In experiment 2, there was no change in the levels of cortisol when the water temperature decreased, but a sharp increase in their levels was observed when the water temperature was increased.
On considering antioxidants, it was observed that heat stress can impact redox-related biomarkers and homeostasis in starry flounder.
SOD activity is elevated in the reaction of dismutation of superoxide (O2) and H2O2 and is reflected to play key roles in the first step of the enzymatic antioxidative defense system [25,26,27,51]. In this study, SOD activities in plasma showed an increase with heat-stress compared to the initial control.
Previous studies have been documented for the activity of CAT and its regulation under thermal stress [52]. GSH is a well-known substrate for glutathione peroxidase and is a major nonprotein cellular thiol of cysteine containing tripeptide. It is one of the important regulators of the intracellular redox state and represent a main role in the nonenzymatic defense system [51]. In the present study, high CAT levels were observed at 28 °C in experiment 1, and higher CAT and GSH levels were observed when the water temperature was increased after a decrease in experiment 2. At the end of the experiment, the levels were lower than those in the initial control. Referring to glucose, TG, TCHO, and TP levels, it seems that when the energy source is insufficient, the resistance ability is lost due to long-term starvation and stress. SOD, CAT, and GSH increased in a similar pattern according to water temperature stress, while similar results have been reported in previous studies [25,26,27,51,52]. The present result supports the proposition that thermal stress causes reduction in the energy metabolism of fish.
In general, during the high-temperature season, aquafarms block the inflow of water from the outside to maintain the water temperature. Liquid oxygen is supplied instead. Food is not supplied to prevent water pollution due to debris, excrement, or diseases caused by it. In these experiments, there is a point of difference compared to the environment of the aquafarms because the water was changed at a rate of 3.3 L/min in laboratory conditions. This can be considered a limitation on the applicability of these results to farm-conditions.
In conclusion, the present study indicates that survival of the starry flounder was low at a water temperature of 28 °C, and 27 °C was the maximum tolerable water temperature for survival. In addition, there was no difference in survival and physiological changes according to starvation and feeding at water temperatures below 27 °C, but at 28 °C, survival was higher with feeding than starvation. Weight loss was significantly higher during the starvation period at high water temperature. It was found that the sharp changes in water temperature in groups SCH and FCH were physiologically more stressful than in the SH and FH groups. When the water temperature is gradually increased, the starry flounder seems to have increased adaptability at high temperatures, undergoing less stress, and having greater resistance to stress.
Therefore, the results of the present study suggest that the water temperature in aquafarms should not be allowed to exceed 27 °C during high-temperature periods and that food supply should be continued to prevent weight loss, provided that factors such as diseases caused by water pollution are remedied.

Author Contributions

Methodology, S.-S.K. and G.-S.H.; Software, S.-S.K.; Formal analysis, S.-S.K. and G.-S.H.; Investigation, H.-K.Y.; Resources, K.-T.K. and M.-M.J.; Writing—original draft preparation, S.-S.K. and H.-K.Y.; Project administration, S.-G.B.; Supervision, S.-D.H.; Funding acquisition, W.-J.K. All authors have read and agreed to the published version of the manuscript.

Funding

Aquaculture Technology Development for species inhabiting the Korean coasts of the East Sea, National Institute of Fisheries Science: R2021006.

Institutional Review Board Statement

The animal experiment protocols were in accordance to the guidelines of the National Institute of Fisheries Science for Laboratory Animals (approval no. 2021-NIFS-IACUC-36).

Acknowledgments

This study was funded by a grant for aquaculture technology development for species inhabiting the Korean coasts of the East Sea, National Institute of Fisheries Science (grant number R2021006).

Conflicts of Interest

The authors declare no conflict of interest.

References

  1. Lim, H.K.; Byun, S.G.; Lee, J.H.; Park, S.U.; Kim, Y.C.; Han, H.K.; Min, B.H.; Lee, B.Y. Sexual maturity an reproductive cycle of starry flounder Platichthys stellatus cultured in indoor tank. J. Aquac. 2007, 20, 212–218. [Google Scholar]
  2. Lim, H.K.; Min, B.H.; Kwon, M.G.; Byun, S.-G.; Park, M.S.; Jeong, M.H.; Kim, Y.S.; Chang, Y.J. Blood physiological responses and growth of juvenile starry flounder, Platichthys stellatus exposed to different salinities. J. Environ. Biol. 2013, 34, 885–890. [Google Scholar]
  3. Min, B.H.; Park, M.S.; Myeong, J.-I. Stress responses of starry flounder, Platichthys stellatus (Pallas) following water temperature rise. J. Environ. Biol. 2015, 36, 1057–1062. [Google Scholar]
  4. Mustafa, S.; Mittal, A. Protein, RNA and DNA levels in liver and brain of starved catfish, Clarias batrachus. J. Ichthyol. 1982, 28, 396–400. [Google Scholar]
  5. Weatherley, A.H.; Gill, H.S. The Biology of Fish Growth, vol. Protein, Lipid and Caloric Contents; Academic Press: London, UK, 1987; pp. 139–146. [Google Scholar]
  6. Hur, J.W.; Jo, J.H.; Park, I.S. Effects of long-term starvation on hepatocyte ultrastructure of olive flounder Paralichthys olivaceus. Ichthyol. Res. 2006, 53, 306–310. [Google Scholar] [CrossRef]
  7. Alderdice, D.F.; Forrester, C.R. Effects of Salinity, Temperature, and Dissolved Oxygen on Early Development of the Pacific Cod (Gadus macrocephalus). J. Fish. Res. Board Can. 1971, 28, 883–902. [Google Scholar] [CrossRef]
  8. Shi, Y.; Zhang, G.; Liu, J.; Zang, W. Effects of temperature and salinity on oxygen consumption of tawny puffer Takifugu flavidus juvenile. Aquac. Res. 2011, 42, 301–307. [Google Scholar] [CrossRef]
  9. Neubauer, P.; Andersen, K.H. Thermal performance of fish is explained by an interplay between physiology, behaviour and ecology. Conserv. Physiol. 2019, 7, coz25. [Google Scholar] [CrossRef] [PubMed] [Green Version]
  10. Staples, J.F. Metabolic flexibility: Hibernation, torpor, and estivation. Compr. Physiol. 2016, 6, 737–771. [Google Scholar]
  11. Brett, J.R. Environmental Factors and Growth. In Fish Physiology; Hoar, W.S., Randall, D.J., Brett, J.R., Eds.; Academic Press: London, UK, 1979; Volume VIII, pp. 599–677. [Google Scholar]
  12. Gadomski, D.M.; Caddell, S.M. Effects of temperature on early-life-history stages of California halibut Paralichthys californicus. Fish. Bull. 1991, 89, 567–576. [Google Scholar]
  13. FAO. The State of World Fisheries and Aquaculture Sustainability in Action; FAO: Rome, Italy, 2020. [Google Scholar]
  14. Ministry of Environment. Korean Climate Change Assessment Report 2020 (in Korea); Ministry of Environment: Sejong City, Korea, 2020.
  15. De Silva, S.S.; Soto, D. Climate change and aquaculture: Potential impacts, adaptation and mitigation. In Climate Change Implications for Fisheries and Aquaculture: Overview of Current Scientific Knowledge; FAO Fisheries and Aquaculture Technical Paper. No. 530; Cochrane, K., De Young, C., Soto, D., Bahri, T., Eds.; FAO: Rome, Italy, 2009; pp. 151–212. [Google Scholar]
  16. Freeman, E.O. Impact of climate change on aquaculture and fisheries in Nigeria: A review. Int. J. Multidiscipl. Res. Dev. 2017, 4, 53–59. [Google Scholar]
  17. Adhikari, S.; Keshav, C.A.; Barlaya, G.; Rathod, R.; Mandal, R.N.; Ikmail, S.; Saha, G.S.; De, H.K.; Sivaraman, I.; Mahapatra, A.S.; et al. Adaptation and mitigation strategies of climate change impact in freshwater aquaculture in some states of India. J. Fish. 2018, 12, 16–21. [Google Scholar]
  18. Barroso, J.B.; Saltuero, G.L.; Peragon, J.; de la Higuera, M.; Lupianez, J.A. Effects of long-term starvation on the NADPH production systems in several different tissues of rainbow trout (Oncorhynchus mykiss). In Fish Nutrition in Practice; Kaushik, S.J., Luquet, P., Eds.; INRA: Paris, France, 1993; pp. 333–338. [Google Scholar]
  19. Bastrop, R.; Jürss, K.; Wacke, R. Biochemical parameters as a measure of food availability and growth in immature rainbow trout (Oncorhynchus mykiss). Comp. Biochem. Physiol. Part A Physiol. 1992, 102, 151–161. [Google Scholar] [CrossRef]
  20. Liang, Y.J.; Sun, X.J.; Ahang, S.L.; Fu, C.D.; Jiang, Z.Q. The effects of starvation and refeeding on growth and ingestion is Starry flounder, Platichthys stellatus. Fish. Sci. 2011, 30, 125–131. [Google Scholar]
  21. Segner, H.; Möller, H. Electron microscopical investigations on starvation-induced liver pathology in flounders Platichthys flesus. Mar. Ecol. Prog. Ser. 1984, 19, 193–196. [Google Scholar] [CrossRef]
  22. White, A.; Fletcher, T.C. Serum cortisol, glucose and lipids in plaice (Pleuronectes platessa L.) exposed to starvation and aquarium stress. Comp. Bioche. Physiol. 1986, 84, 649–653. [Google Scholar] [CrossRef]
  23. Heming, T.A.; Paleczny, E.J. Compositional changes in skin mucus and blood serum during starvation of trout. Aquaculture 1987, 66, 265–273. [Google Scholar] [CrossRef]
  24. Caruso, G.; Denaro, M.G.; Caruso, R.; Genovese, L.; Mancari, F.; Maricchiolo, G. Short fasting and refeeding in red porgy (Pagrus pagrus, Linnaeus 1958): Response of some haematological, biochemical and non-specific immune parameters. Mar. Environ. Res. 2012, 81, 18–25. [Google Scholar] [CrossRef]
  25. Nordberg, J.; Arnér, E.S.J. Reactive oxygen species, antioxidants, and the mammalian thioredoxin system. Free Radic. Biol. Med. 2001, 31, 1287–1312. [Google Scholar] [CrossRef]
  26. Martínez-Álvarez, R.; Morales, A.; Sanz, A. Antioxidant defences in fish: Biotic and abiotic factors. Rev. Fish Biol. Fish. 2005, 15, 75–88. [Google Scholar] [CrossRef]
  27. Grim, J.M.; Miles, D.R.B.; Crockett, E.L. Temperature acclimation alters oxidative capacities and composition of membrane lipids without influencing activities of enzymatic antioxidants or susceptibility to lipid peroxidation in fish muscle. J. Exp. Biol. 2010, 213, 445–452. [Google Scholar] [CrossRef] [Green Version]
  28. Barton, B.A.; Iwama, G.K. Physiological changes in fish from stress in aquaculture with emphasis on the response and effects of corticosteroids. Annu. Rev. Fish Dis. 1991, 1, 3–26. [Google Scholar] [CrossRef]
  29. Pacheco, M.; Santos, M.A. Biotransformation, Endocrine, and Genetic Responses of Anguilla anguilla L. to Petroleum Distillate Products and Environmentally Contaminated Waters. Ecotoxicol. Environ. Saf. 2001, 49, 64–75. [Google Scholar] [CrossRef] [PubMed]
  30. Samaras, A.; Papandroulakis, N.; Lika, K.; Pavlidis, M. Water temperature modifies the acute stress response of European sea bass, Dicentrarchus labrax L. (1758). J. Therm. Biol. 2018, 78, 84–91. [Google Scholar] [CrossRef]
  31. Ding, L.; Zhang, L.; Wang, J.; Ma, J.; Meng, X.; Duan, P.; Sun, L.; Sun, Y. Effect of dietary lipid level on the growth performance, feed utilization, body composition and blood chemistry of juvenile starry flounder (Platichthys stellatus). Aquac. Res. 2010, 41, 1470–1478. [Google Scholar] [CrossRef]
  32. Ma, J.; Wang, J.; Zhang, D.; Hao, T.; Sun, J.; Sun, Y.; Zhang, L. Estimation of optimum docosahexaenoic to eicosapentaenoic acid ratio (DHA/EPA) for juvenile starry flounder, Platichthys stellatus. Aquaculture 2014, 433, 105–114. [Google Scholar] [CrossRef]
  33. Wang, J.; Li, B.; Ma, J.; Wang, S.; Huang, B.; Sun, Y.; Zhang, L. Optimum dietary protein to lipid ratio for starry flounder (Platichthys stellatus). Aquac. Res. 2017, 48, 189–201. [Google Scholar] [CrossRef]
  34. Htun-Han, M. The reproductive biology of the dab Limanda limanada (L.) in the North Sea: Gonadosomatic index, hepatosomatic index and condition factor. J. Fish. Biol. 1978, 13, 351–377. [Google Scholar] [CrossRef]
  35. Byun, S.G.; Nam, M.M.; Lee, B.I.; Lee, J.H.; Kim, Y.C. Manual of Starry Flounder Culture; National Institute Fisheries Science: Busan, Korea, 2009; pp. 1–131. [Google Scholar]
  36. Tang, U.M.; Muchlisin, Z.A.; Syawal, H.; Masjudi, H. Effect of water temperature on the physiological stress and growth performance of tapah (Wallago leeri) during domestication. Arch. Pol. Fish. 2017, 25, 165–171. [Google Scholar] [CrossRef] [Green Version]
  37. Withers, P.C. Comparative Animal Physiology; Brooks/Cole, Thompson Learning: Pacific Grove, CA, USA, 1992; p. 949. [Google Scholar]
  38. Le Cren, E.D. The length-weight relationships and seasonal cycle in gonad weight and condition in the perch (Perca fluviatilis). J. Anim. Ecol. 1951, 20, 201–219. [Google Scholar] [CrossRef] [Green Version]
  39. Willmer, P.; Stone, J.; Johnston, I. Environmental Physiology of Animals; Wiley-Blackwell: Malden, MA, USA, 2009. [Google Scholar]
  40. Cowey, C.B.; Walton, M. Intermediary metabolism. In Fish Nutrition; Halver, J.E., Ed.; Academic Press: New York, NY, USA, 1989; pp. 259–329. [Google Scholar]
  41. Roh, H.; Kim, A.; Kim, N.; Lee, Y.; Kim, D.H. Multi-Omics Analysis Provides Novel Insight into Immuno-Physiological Pathways and Development of Thermal Resistance in Rainbow Trout Exposed to Acute Thermal Stress. Int. J. Mol. Sci. 2020, 21, 9198. [Google Scholar] [CrossRef]
  42. Shim, K.S.; Hwang, K.T.; Sonand, M.W.; Park, G.H. Lipid Metabolism and peroxidation in broiler chicks under chronic heat stress. Asian-Australas. J. Anim. Sci. 2006, 19, 1206–1211. [Google Scholar] [CrossRef]
  43. Hooda, O.K.; Upadhyay, R.C. Physiological responses, growth rate and blood metabolites under feed restriction and thermal exposure in kids. J. Stress Physiol. Biochem. 2014, 10, 214–227. [Google Scholar]
  44. Peres, H.; Santos, S.; Oliva-Teles, A. Selected plasma biochemistry parameters in gilthead seabream (Sparus aurata) juveniles. J. Appl. Ichthyol. 2012, 29, 630–636. [Google Scholar] [CrossRef]
  45. Fazio, F.; Ferrantelli, V.; Piccione, G.; Saoca, C.; Levanti, M.; Mucciardi, M. Biochemical and hematological parameters in European sea bass (Dicentrarchus labrax Linnaeus, 1758) and Gilthead sea bream (Sparus aurata Linnaeus, 1758) in relation to temperature. Veter. Arh. 2018, 88, 397–411. [Google Scholar] [CrossRef]
  46. Echevarría, G.; Bebiá, M.M.; Zamora, S. Evolution of Biometric Indices and Plasma Metabolites during Prolonged Starvation in European Sea Bass (Dicentrarchus labrax, L.). Comp. Biochem. Physiol. Part A Physiol. 1997, 118, 111–123. [Google Scholar] [CrossRef]
  47. Pérez-Casanova, J.C.; Afonso, L.O.B.; Johnson, S.C.; Currie, S.; Gamperl, A.K. The stress and metabolic responses of juvenile Atlantic cod Gadus morhua L. to an acute thermal challenge. J. Fish Biol. 2008, 72, 899–916. [Google Scholar] [CrossRef]
  48. LeBlanc, S.; Middleton, S.; Gilmour, K.M.; Currie, S. Chronic social stress impairs thermal tolerance in the rainbow trout (Oncorhynchus mykiss). J. Exp. Biol. 2011, 214, 1721–1731. [Google Scholar] [CrossRef] [PubMed] [Green Version]
  49. Yeh, C.-M.; Glöck, M.; Ryu, S. An Optimized Whole-Body Cortisol Quantification Method for Assessing Stress Levels in Larval Zebrafish. PLoS ONE 2013, 8, e79406. [Google Scholar] [CrossRef] [Green Version]
  50. Cockrem, J.F.; Bahry, M.A.; Chowdhury, V.S.; Chowdhury, V.S. Cortisol responses of goldfish (Carassius auratus) to air exposure, chasing, and increased water temperature. Gen. Comp. Endocrinol. 2019, 270, 18–25. [Google Scholar] [CrossRef]
  51. Madeira, D.; Narciso, L.; Cabral, H.; Vinagre, C.; Diniz, M. Influence of temperature in thermal and oxidative stress responses in estuarine fish. Comp. Biochem. Physiol. Part A Mol. Integr. Physiol. 2013, 166, 237–243. [Google Scholar] [CrossRef] [PubMed]
  52. Hermes-Lima, M. Oxygen in biology and biochemistry: Role of free radicals. In Functional Metabolism: Regulation and Adaptation; Storey, K.B., Ed.; Wiley & Sons: Hoboken, NJ, USA, 2004; pp. 319–368. [Google Scholar]
Figure 1. Experimental schedule and schematic of experimental groups. Fish were exposed to changes in water temperatures after starvation or feeding at 22 °C for 1 week. Arrows on the top banner indicate the days on which blood sampling was done. The dashed lines (-----) indicate duration of exposure to changed water temperature. The temperature settings of 27 °C, 12 °C to 27 °C, and 27 °C (+0.5 °C/day) are indicated by H, CH, and NH, respectively.
Jmse 09 01361 g001
Figure 2. Survival rate according to changes of water temperature. (A) In experiment 1, survival rates at different water temperatures are presented as follows: at 26 °C after starvation (26 °C_S) or feeding (26 °C_F), 27 °C after starvation (27 °C_S) or feeding (27 °C_F), and 28 °C after starvation (28 °C_S) or feeding (28 °C_F). (B) In experiment 2, survival rates at changing water temperatures are presented under these headings: temperature raised directly to 27 °C after starvation (SH) or feeding (FH), from 12 °C to 27 °C after starvation (SCH) or feeding (FCH), and temperature gradually raised to 27 °C (+0.5 °C/day; NH).
Jmse 09 01361 g002
Figure 3. Condition factor and weight loss between changes of water temperature and feeding. (A) Condition factor and (C) weight loss according to changing water temperatures after starvation or feeding in experiment 1. (B) Condition factor and (D) weight loss according to changing water temperatures after starvation or feeding in experiment 2. Data are presented as mean ± SD. Asterisks indicate a significant difference (p < 0.05).
Jmse 09 01361 g003
Figure 4. Levels of (A) cortisol, and (B) glucose in experiment 1 at different water temperatures. Levels of (C) cortisol, and (D) glucose in experiment 2 at different water temperatures. Asterisks indicate a significant difference from initial control (p < 0.05).
Jmse 09 01361 g004
Figure 5. Levels of (A) SOD, (B) CAT, and (C) GSH in experiment 1 at different water temperatures. Levels of (D) SOD, (E) CAT and (F) GSH in experiment 2 at different water temperatures. Asterisks indicate a significant difference from initial control (p < 0.05). Data are presented as mean ± SD.
Jmse 09 01361 g005
Figure 6. Plasma biochemical parameters of starry flounder. Levels of (A) GPT, (B) GOT, (C) TG, (D) THCO, and (E) TP according to experimental groups of experiment 1. Levels of (F) GPT, (G) GOT, (H) TG, (I) THCO, and (J) TP in experiment 2 with changes in water temperature. Asterisks indicate a significant difference from initial control (p < 0.05). Data are presented as the mean ± SD.
Jmse 09 01361 g006
Publisher’s Note: MDPI stays neutral with regard to jurisdictional claims in published maps and institutional affiliations.