
Characterizing the Effect of Water Content on Small-Strain Shear Modulus of Qiantang Silt


Abstract
:1. Introduction
2. Testing Program
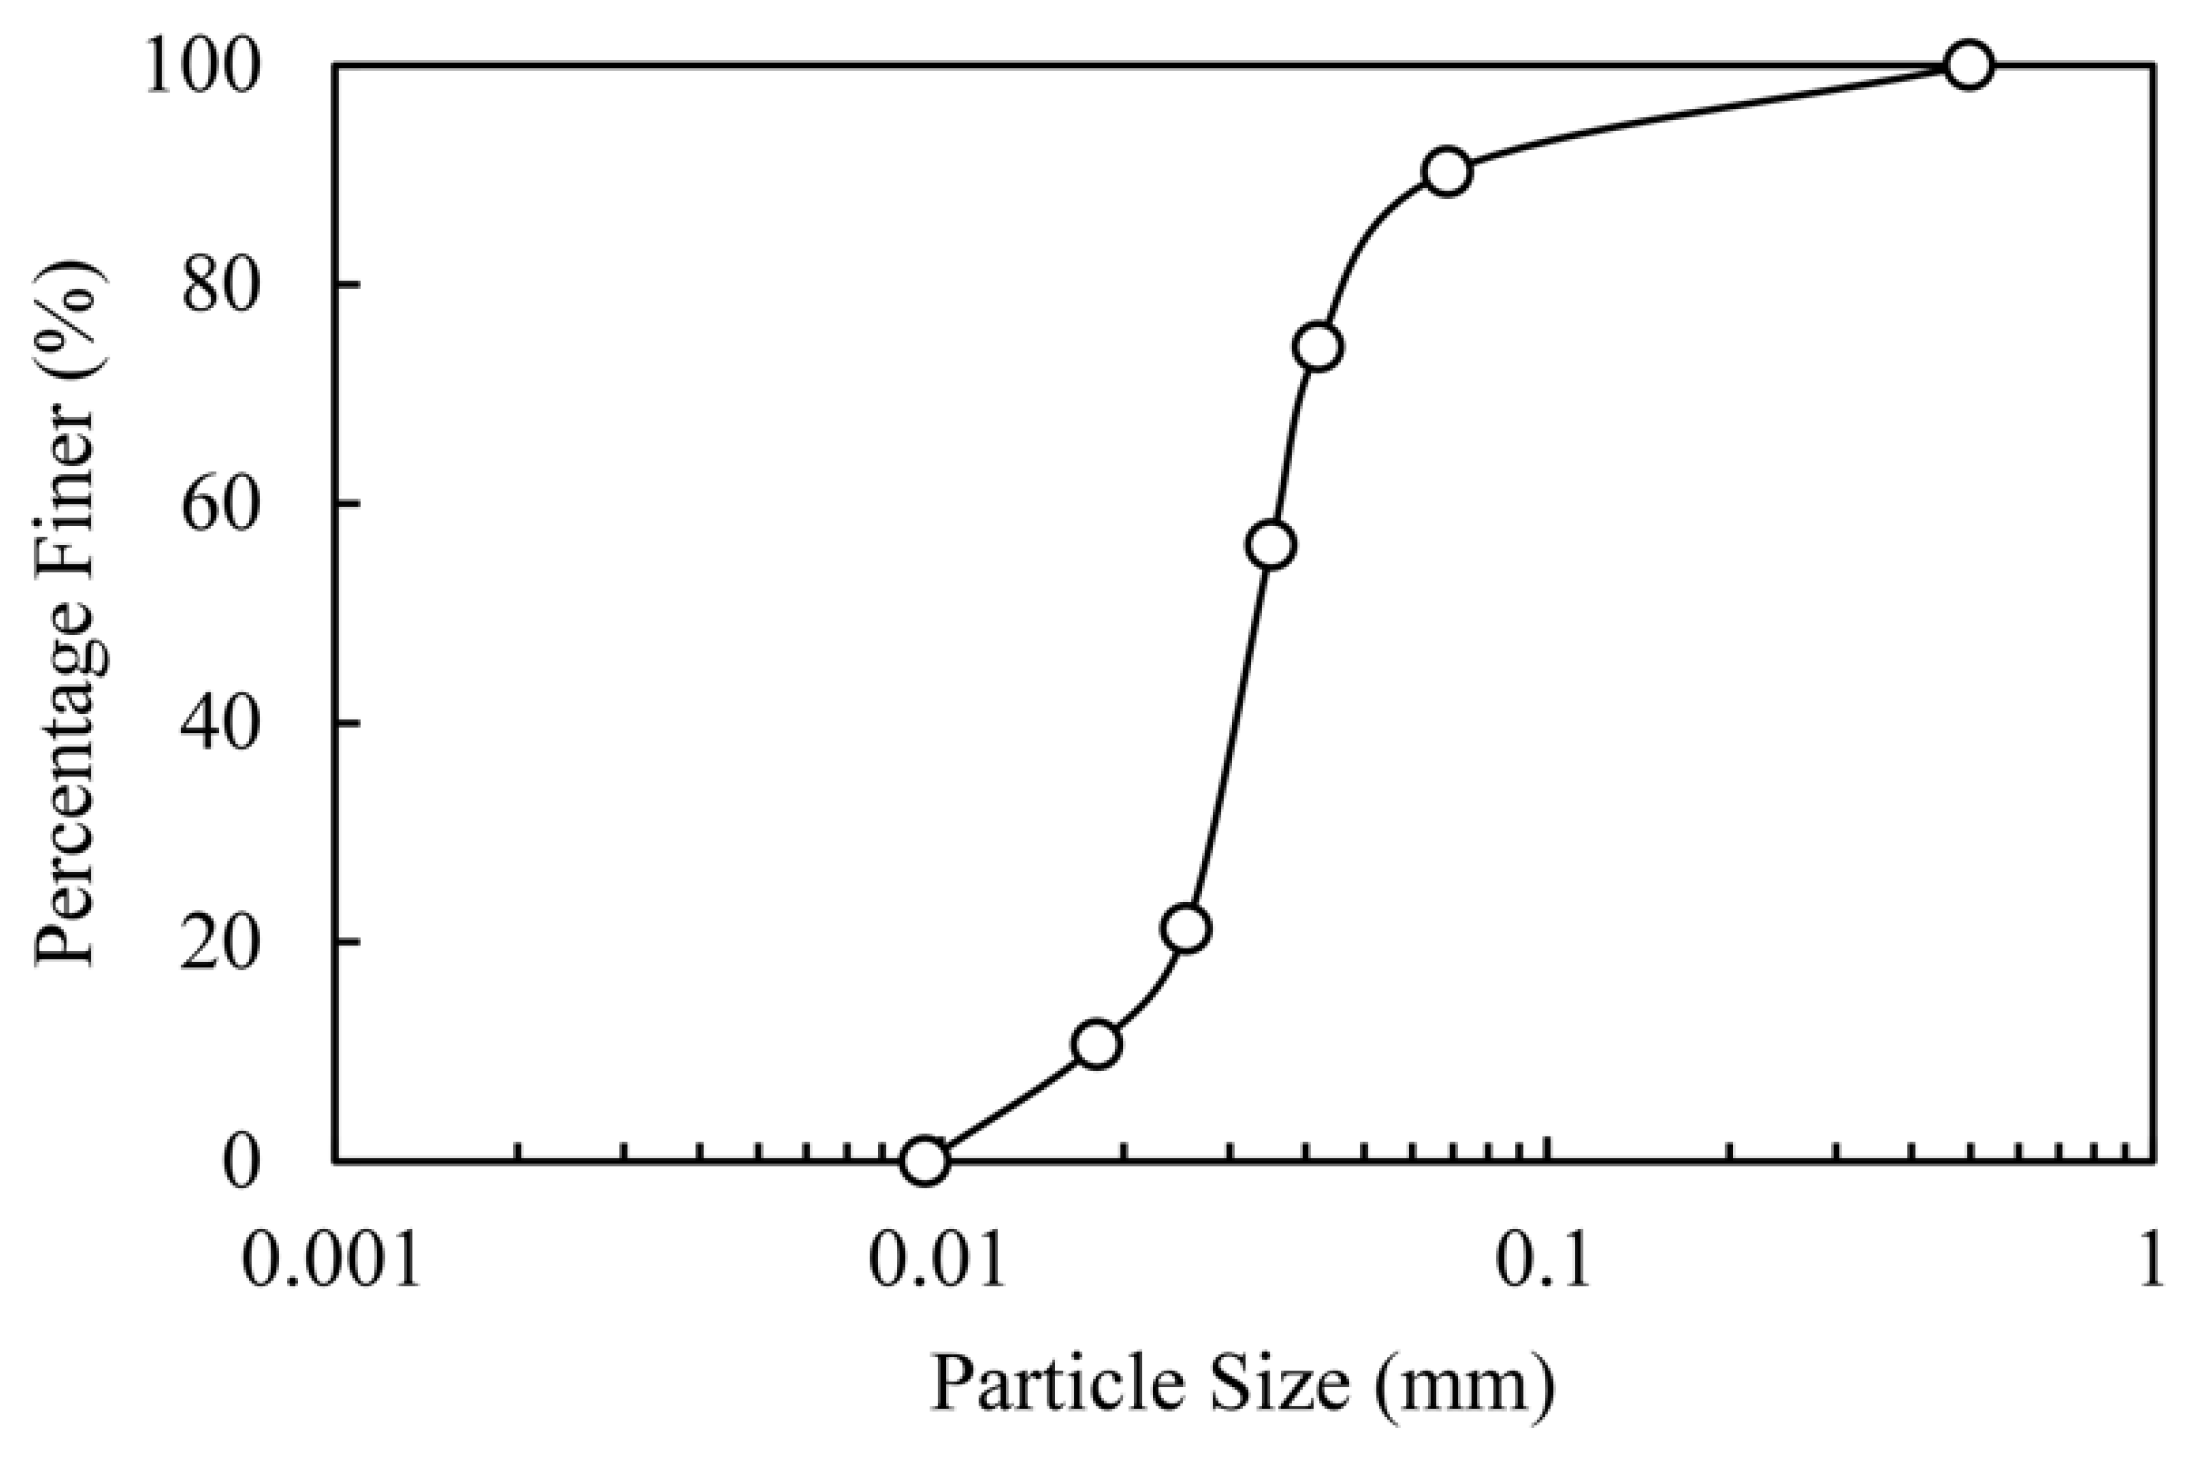
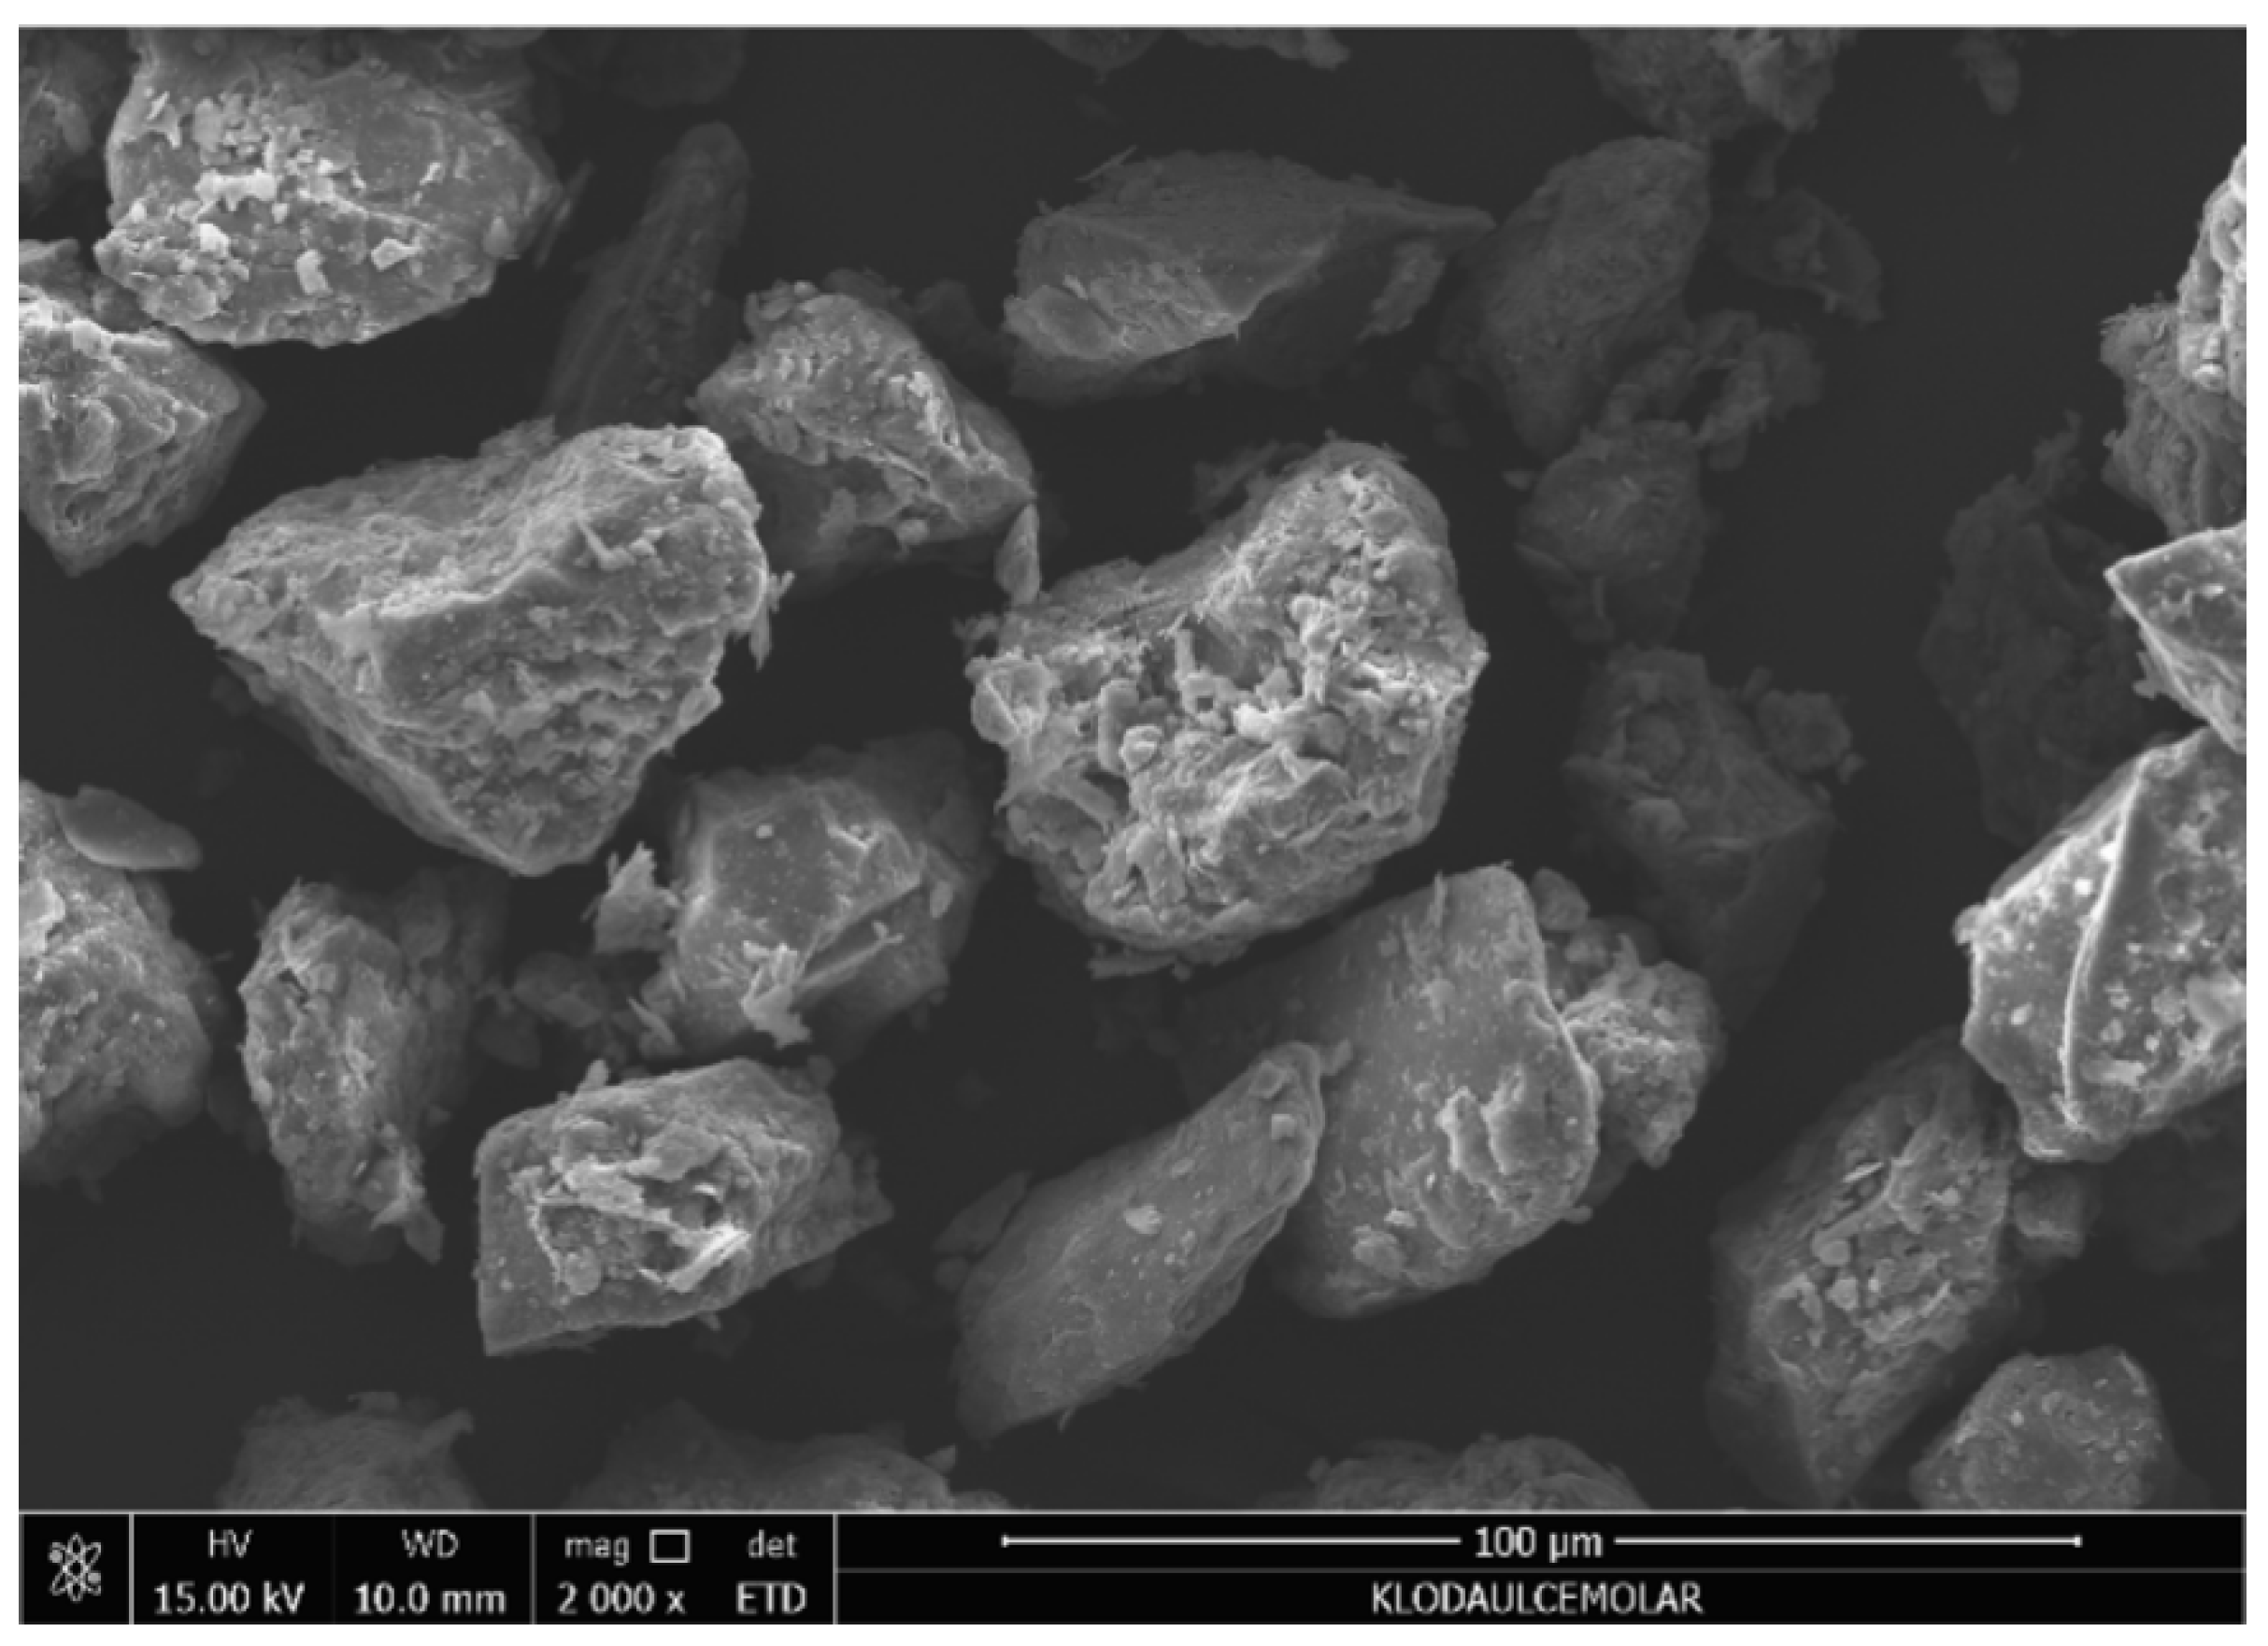
2.1. Tested Soils
2.2. Tested Procedures
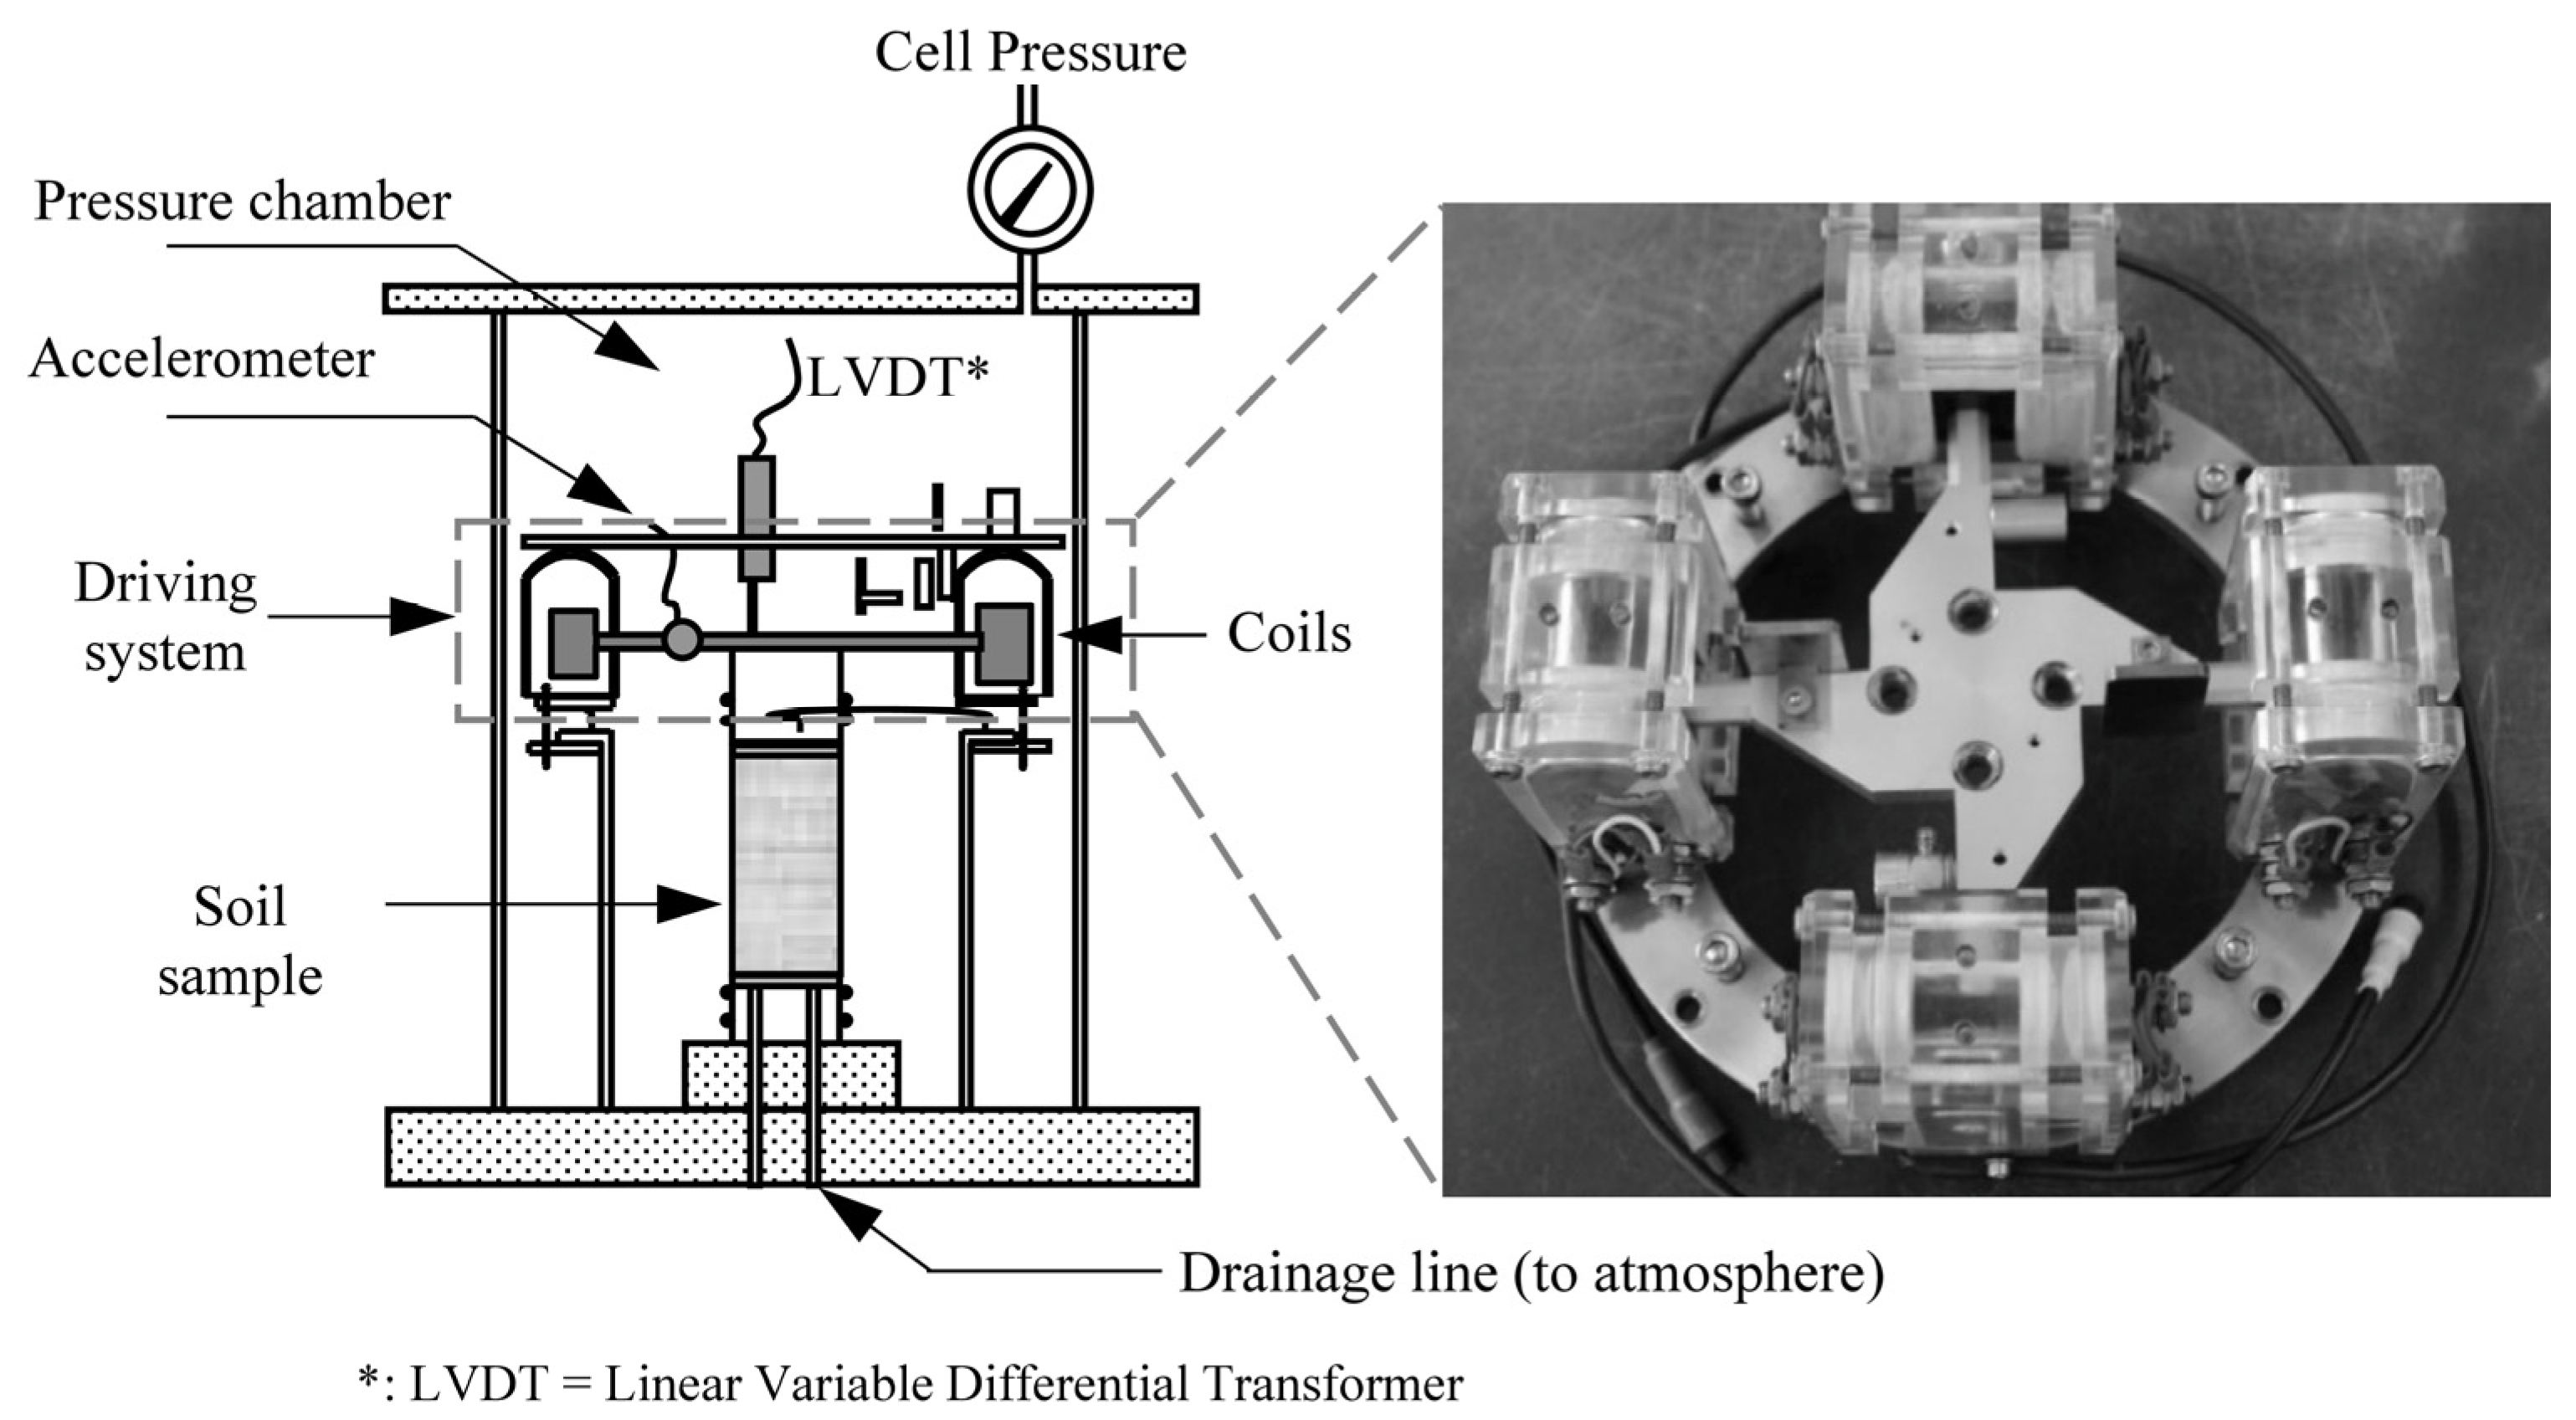
2.3. Resonant Column Tests
3. Test Results
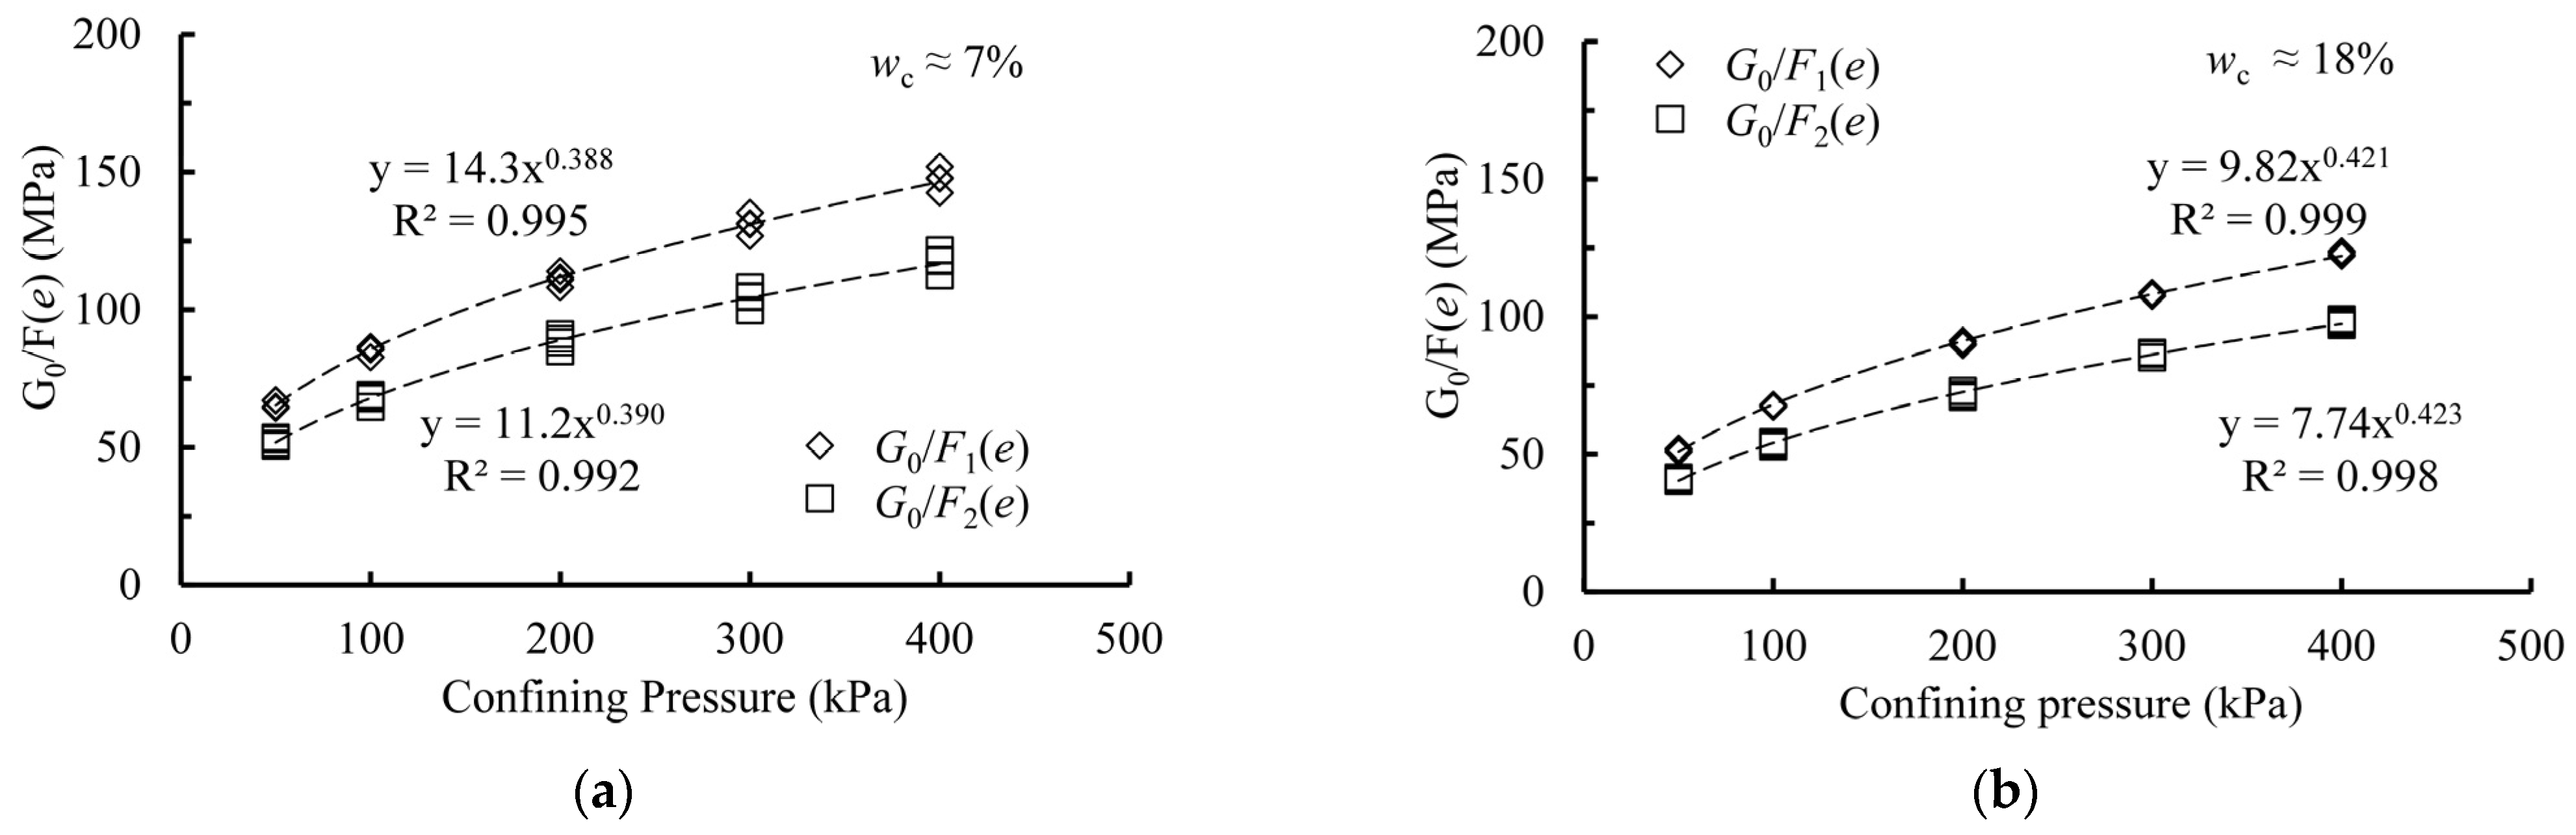
3.1. Effects of Void Ratio and Confining Pressure
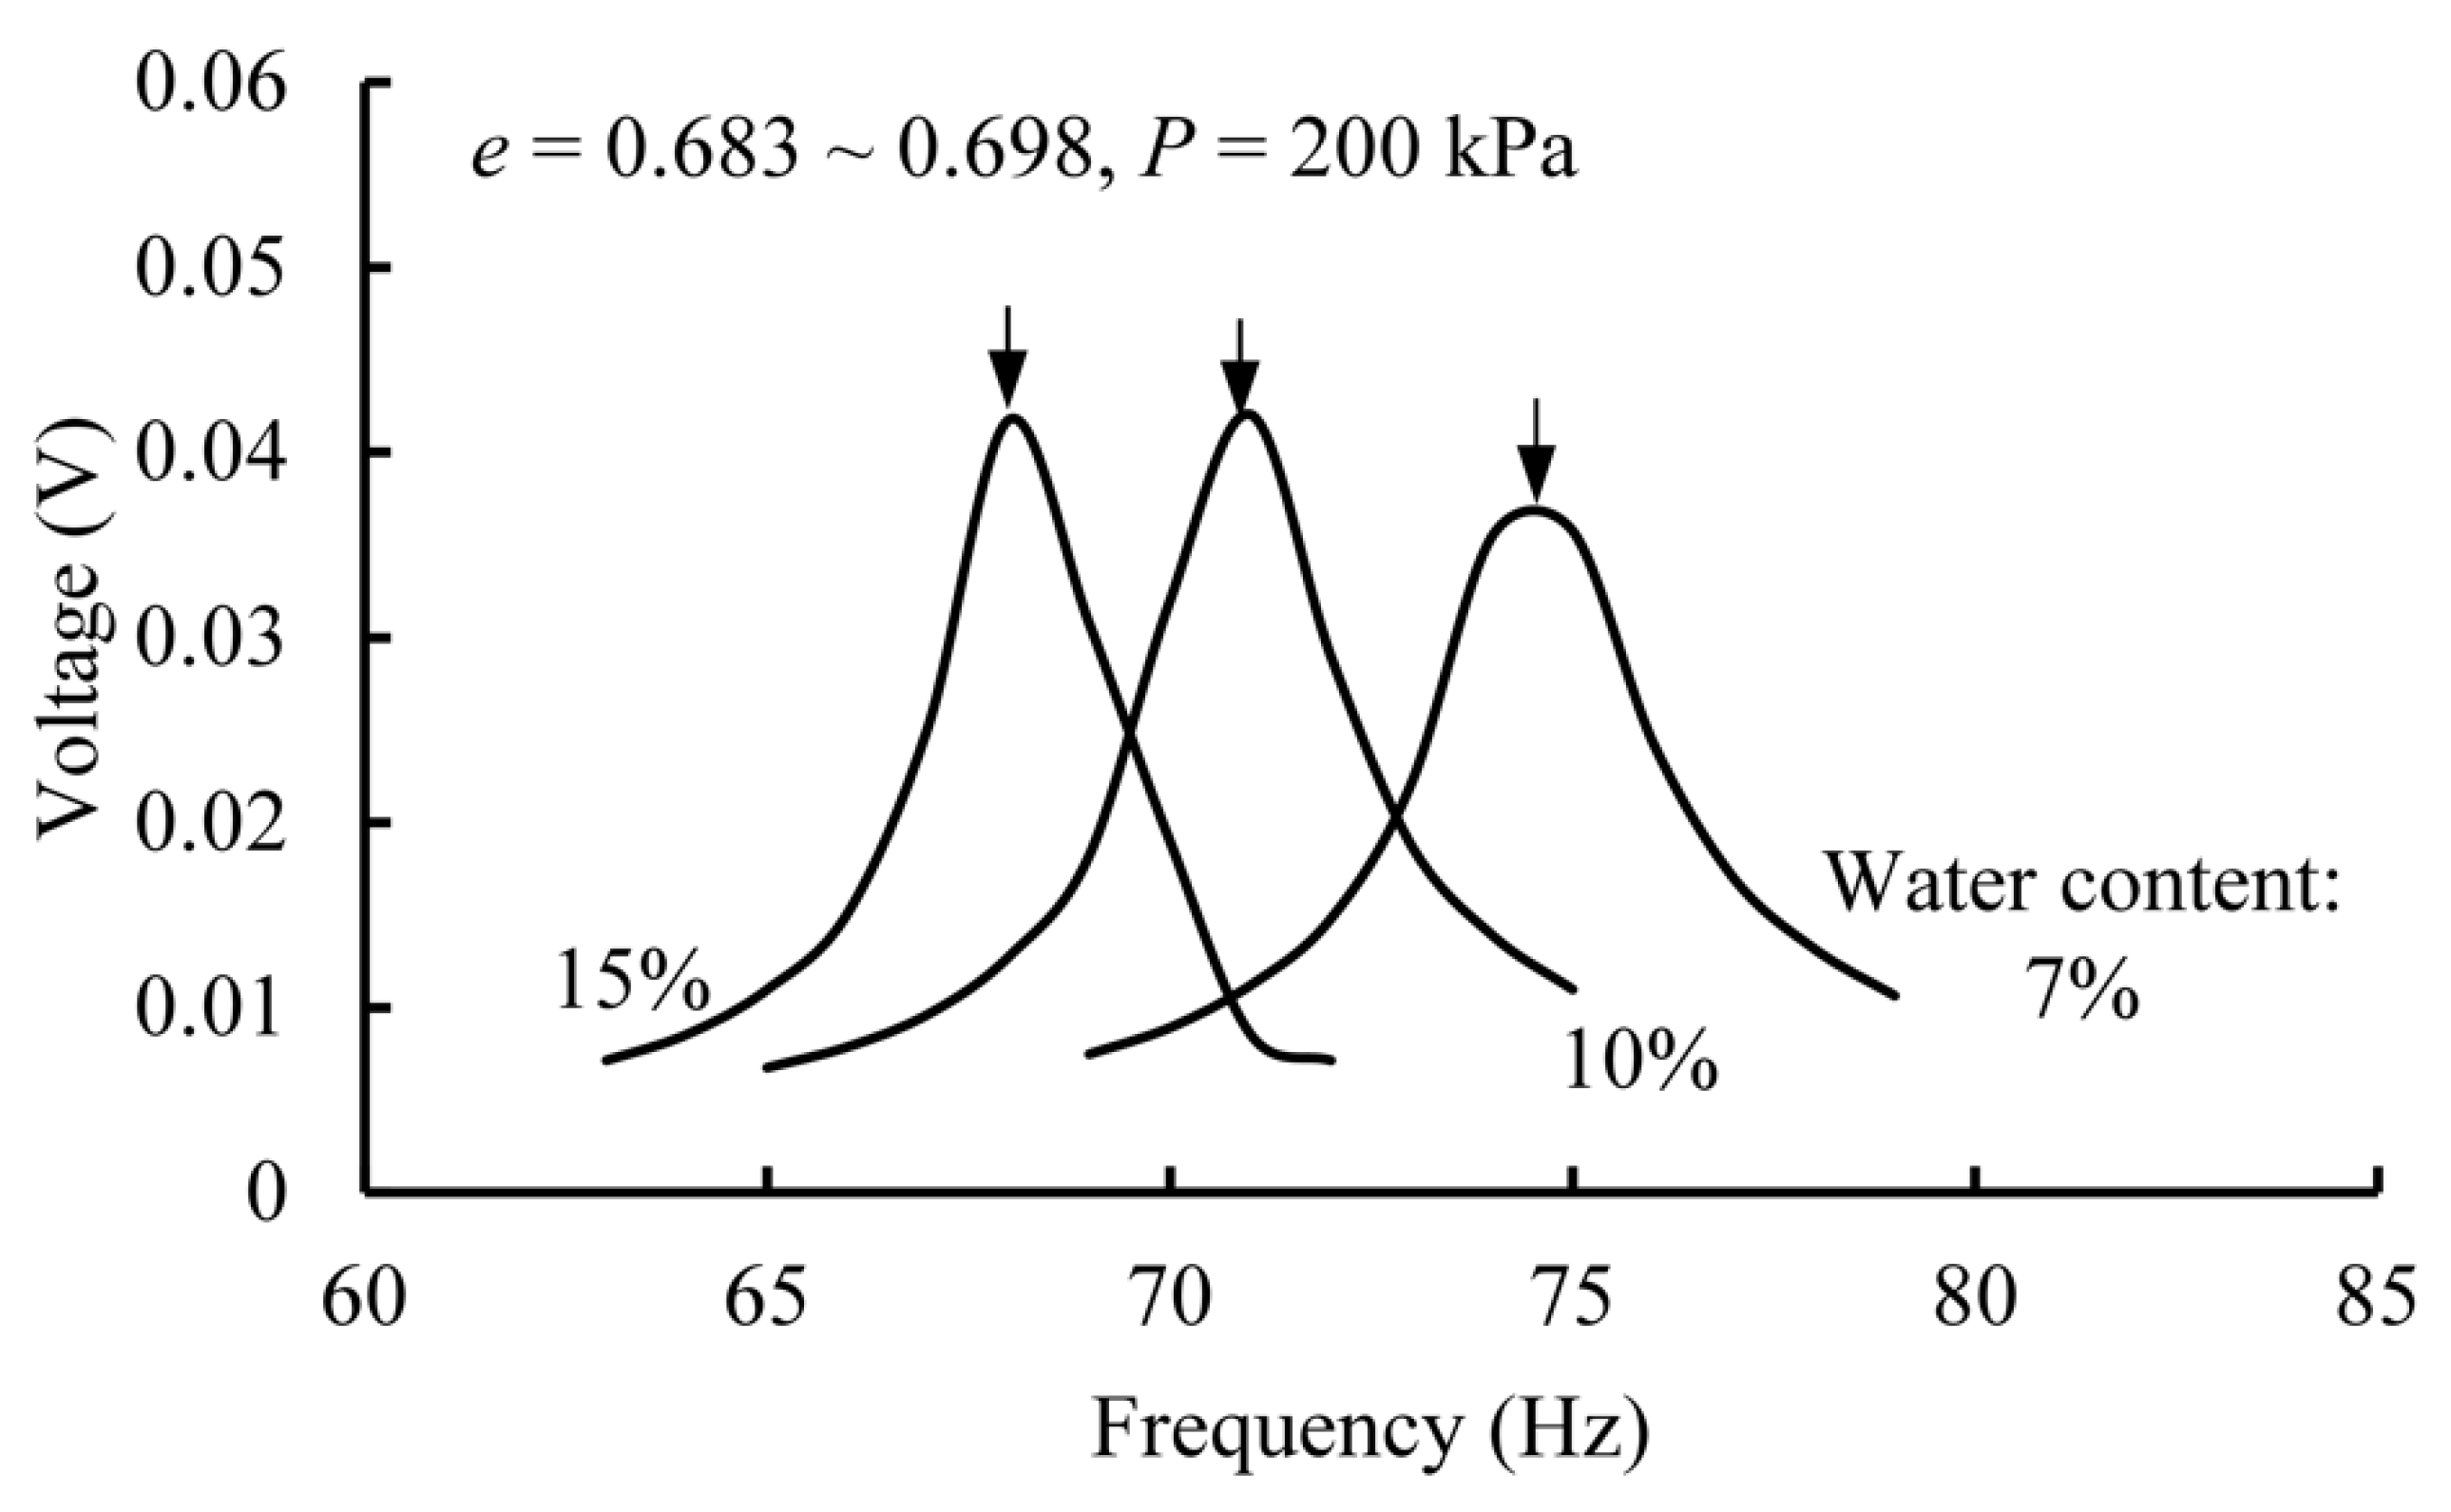
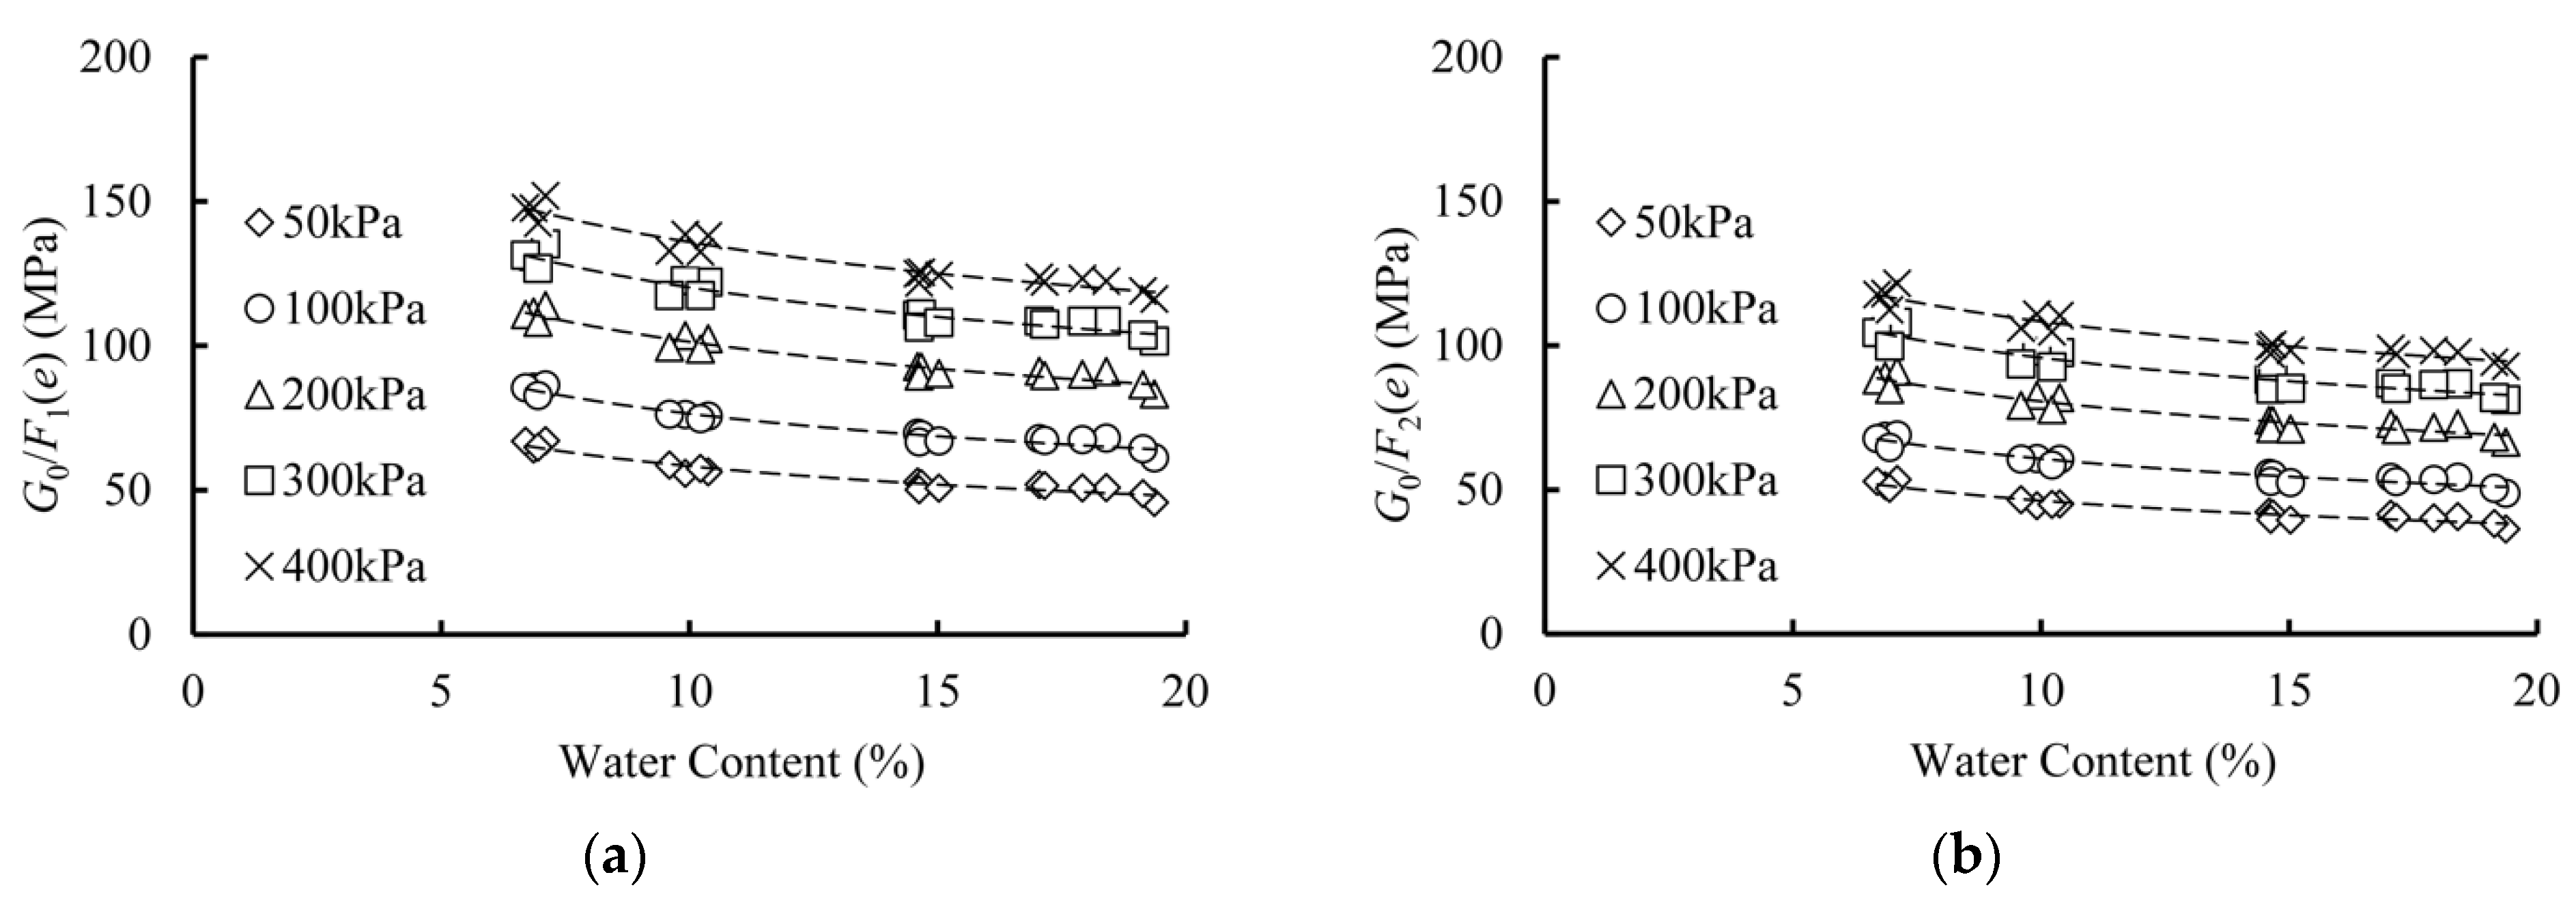
3.2. Effects of Water Content
3.3. Revised Hardin’s Equation
4. Discussions
5. Conclusions
Author Contributions
Funding
Institutional Review Board Statement
Informed Consent Statement
Data Availability Statement
Conflicts of Interest
References
- Zhang, L.; Wei, X. Responses of excavation base under influences of confined aquifer: An analytical approach. Mar. Georesources Geotechnol. 2021, 39, 241–254. [Google Scholar] [CrossRef]
- Liu, X.; Zhang, N.; Lan, H. Effects of sand and water contents on the small-strain shear modulus of loess. Eng. Geol. 2019, 260, 105202. [Google Scholar] [CrossRef]
- Zhang, T.W.; Cui, Y.J.; Lamas-Lopez, F.; Calon, N.; Costa D’Aguiar, S. Compacted soil behaviour through changes of density, suction, and stiffness of soils with remoulding water content. Can. Geotech. J. 2018, 55, 182–190. [Google Scholar] [CrossRef]
- Payan, M.; Khoshghalb, A.; Senetakis, K.; Khalili, N. Effect of Particle Shape and Validity of Gmax Models for Sand: A critical review and a new expression. Comput. Geotech. 2016, 72, 28–41. [Google Scholar] [CrossRef]
- Enomoto, T. Effects of grading and particle characteristics on small strain properties of granular materials. Soils Found. 2016, 56, 745–750. [Google Scholar] [CrossRef]
- Hardin, B.O.; Richart, F.E. Elastic wave velocities in granular soils. J. Soil Mech. Found. Div. 1963, 89, 33–65. [Google Scholar] [CrossRef]
- Shibuya, S.; Tanaka, H. Estimate of elastic shear modulus in Holocene soil deposits. Soils Found. 1996, 36, 45–55. [Google Scholar] [CrossRef] [Green Version]
- Wichtmann, T.; Triantafyllidis, T. Influence of the grain-size distribution curve of quartz sand on the small-strain shear modulus Gmax. J. Geotech. Geoenviron. Eng. 2009, 135, 1404–1418. [Google Scholar] [CrossRef]
- Clayton, C.R.I. Stiffness at small strain: Research and practice. Géotechnique 2011, 61, 5–37. [Google Scholar] [CrossRef] [Green Version]
- Vardanega, P.J.; Bolton, M.D. Stiffness of clays and silts: Normalizing shear modulus and shear strain. J. Geotech. Geoenviron. Eng. 2013, 139, 1575–1589. [Google Scholar] [CrossRef] [Green Version]
- Liu, X.; Yang, J. Shear wave velocity in sand: Effect of grain shape. Géotechnique 2018, 68, 742–748. [Google Scholar] [CrossRef]
- Ishihara, K. Soil Behavior in Earthquake Geotechnics; Clarendon Press: Oxford, UK, 1996. [Google Scholar]
- Ng, C.W.W.; Leung, E.H.Y. Determination of shear wave velocities and shear moduli of completely decomposed tuff. J. Geotech. Geoenvironmental Eng. 2007, 133, 630–640. [Google Scholar] [CrossRef]
- Alonso, E.E.; Pereira, J.M.; Vaunat, J.; Olivella, S. A microstructurally based effective stress for unsaturated soils. Géotechnique 2010, 60, 913–925. [Google Scholar] [CrossRef] [Green Version]
- Xu, J.; Zhou, C. Experimental study of effect of wetting-drying path on small-strain shear modulus of silt. Rock Soil Mech. 2015, 36, 377–381. (In Chinese) [Google Scholar]
- Kim, T.; Finno, R.J. Elastic shear modulus of compressible Chicago clay. KSCE J. Civ. Eng. 2014, 18, 1996–2006. [Google Scholar] [CrossRef]
- Gu, X.; Yang, J.; Huang, M.; Gao, G. Bender element tests in dry and saturated sand: Signal interpretation and result comparison. Soils Found. 2015, 55, 951–962. [Google Scholar] [CrossRef] [Green Version]
- Liu, X.; Yang, J.; Wang, G.; Chen, L. Small-strain shear modulus of volcanic granular soil: An experimental investigation. Soil Dyn. Earthq. Eng. 2016, 86, 15–24. [Google Scholar] [CrossRef]
- Liu, X.; Yang, J. Influence of size disparity on small-strain shear modulus of sand-fines mixtures. Soil Dyn. Earthq. Eng. 2018, 115, 217–224. [Google Scholar] [CrossRef]
- Gu, X.; Yang, J.; Huang, M. Laboratory measurements of small strain properties of dry sands by bender element. Soils Found. 2013, 53, 735–745. [Google Scholar] [CrossRef]
- Tsukamoto, Y.; Iishihara, K.; Nakazawa, H.; Kamada, K.; Huang, Y. Resistance of partly saturated sand to liquefaction with reference to longitudinal and shear wave velocities. Soils Found. 2002, 42, 93–104. [Google Scholar] [CrossRef] [Green Version]
- Song, B.; Chen, W.; Wu, W.; Jiang, Y. Experimental study on the dynamic properties of sliding zone soil of a landslide under varying water content. China Earthq. Eng. J. 2017, 39, 744–758. (In Chinese) [Google Scholar]
- Zhang, D.; Liu, S.; Zhang, T. Water content and modulus relationship of a compacted unsaturated soil. J. Southeast Univ. 2012, 28, 209–214. [Google Scholar]
- Dong, Y.; Lu, N. Dependencies of shear wave velocity and shear modulus of soil on saturation. J. Eng. Mech. 2016, 142, 04016083. [Google Scholar] [CrossRef]
- Lu, N.; Kaya, M. Power law for elastic moduli of unsaturated soil. J. Geotech. Geoenviron. Eng. 2014, 140, 46–56. [Google Scholar] [CrossRef]
- Wei, X.; Yang, J. Cyclic behavior and liquefaction resistance of silty sands with presence of initial static shear stress. Soil Dyn. Earthq. Eng. 2019, 122, 274–289. [Google Scholar] [CrossRef]
- Iwasaki, T.; Tatsuoka, F. Effect of grain size and grading on dynamic shear moduli of sand. Soils Found. 1977, 17, 19–35. [Google Scholar] [CrossRef]
- Lo Presti, D.C.F.; Jamiolkowski, M.; Pallara, O.; Cavallaro, A.; Pedroni, S. Shear modulus and damping of soils. Géotechnique 1997, 47, 603–617. [Google Scholar] [CrossRef]
- Hardin, B.O.; Black, W.L. Sand stiffness under various triaxial stresses. J. Soil Mech. Found. Div. 1966, 92, 27–42. [Google Scholar] [CrossRef]
- Hardin, B.O.; Black, W.L. Vibration modulus of normally consolidated clay. J. Soil Mech. Found. Div. 1968, 94, 353–369. [Google Scholar] [CrossRef]
- Simms, P.H.; Yanful, E.K. Predicting soil—water characteristic curves of compacted plastic soils from measured pore-size distributions. Géotechnique 2002, 52, 269–278. [Google Scholar] [CrossRef]
- Marinho, F.A.M. Nature of soil-water characteristic curve for plastic soils. J. Geotech. Geoenviron. Eng. 2005, 131, 654–661. [Google Scholar] [CrossRef]


| Specific Gravity | Mean Particle Size | Effective Particle Size | Coefficient of Uniformity | Plastic Limit | Liquid Limit |
|---|---|---|---|---|---|
| (-) | (mm) | (mm) | (-) | (%) | (%) |
| 2.69 | 0.035 | 0.015 | 1.50 | 17.3 | 27.9 |
| Targets for Sample Preparation | Measured after Sample Preparation | |||||
|---|---|---|---|---|---|---|
| No. | Water Content (%) | Void Ratio | Degree of Saturation (%) | Water Content (%) | Void Ratio | Degree of Saturation (%) |
| 1-1 | 7 | 0.67 | 28.1 | 6.86 | 0.671 | 27.5 |
| 1-2 | 0.70 | 26.9 | 7.10 | 0.716 | 26.7 | |
| 1-3 | 0.75 | 25.1 | 6.70 | 0.765 | 23.6 | |
| 1-4 | 0.80 | 23.5 | 6.95 | 0.810 | 23.1 | |
| 2-1 | 10 | 0.67 | 40.1 | 10.38 | 0.677 | 41.2 |
| 2-2 | 0.70 | 38.4 | 9.92 | 0.724 | 36.9 | |
| 2-3 | 0.75 | 35.9 | 9.60 | 0.751 | 34.4 | |
| 2-4 | 0.80 | 33.6 | 10.22 | 0.802 | 34.3 | |
| 3-1 | 15 | 0.67 | 60.2 | 14.60 | 0.663 | 59.2 |
| 3-2 | 0.70 | 57.6 | 14.67 | 0.711 | 55.5 | |
| 3-3 | 0.75 | 53.8 | 14.63 | 0.752 | 52.3 | |
| 3-4 | 0.80 | 50.4 | 15.03 | 0.807 | 50.1 | |
| 4-1 | 18 | 0.67 | 72.3 | 18.40 | 0.666 | 74.3 |
| 4-2 | 0.70 | 69.2 | 17.05 | 0.692 | 66.3 | |
| 4-3 | 0.75 | 64.6 | 17.92 | 0.756 | 63.8 | |
| 4-4 | 0.80 | 60.5 | 17.16 | 0.797 | 57.9 | |
| Water Content (%) | Fitting Parameters | |||
|---|---|---|---|---|
| F1(e) | F2(e) | |||
| A1 (MPa) | n1 | A2 (MPa) | n2 | |
| 7 | 85.5 | 0.388 | 67.9 | 0.390 |
| 10 | 75.9 | 0.416 | 60.4 | 0.418 |
| 15 | 68.5 | 0.425 | 54.4 | 0.426 |
| 18 | 68.1 | 0.421 | 54.2 | 0.423 |
| 20 | 63.4 | 0.438 | 50.2 | 0.442 |
| Water Content (%) | Fitting Parameters | |||
|---|---|---|---|---|
| F1(e) | F2(e) | |||
| A* (MPa) | n1 | A* (MPa) | n2 | |
| 7~20 | 131.7 | 0.415 | 104.6 | 0.418 |
Publisher’s Note: MDPI stays neutral with regard to jurisdictional claims in published maps and institutional affiliations. |
© 2021 by the authors. Licensee MDPI, Basel, Switzerland. This article is an open access article distributed under the terms and conditions of the Creative Commons Attribution (CC BY) license (https://creativecommons.org/licenses/by/4.0/).
Share and Cite
Zhang, L.; Zhang, S.; Liu, X.; Sun, Y. Characterizing the Effect of Water Content on Small-Strain Shear Modulus of Qiantang Silt. J. Mar. Sci. Eng. 2021, 9, 1363. https://doi.org/10.3390/jmse9121363
Zhang L, Zhang S, Liu X, Sun Y. Characterizing the Effect of Water Content on Small-Strain Shear Modulus of Qiantang Silt. Journal of Marine Science and Engineering. 2021; 9(12):1363. https://doi.org/10.3390/jmse9121363
Chicago/Turabian StyleZhang, Lisha, Shimin Zhang, Xin Liu, and Yinsuo Sun. 2021. "Characterizing the Effect of Water Content on Small-Strain Shear Modulus of Qiantang Silt" Journal of Marine Science and Engineering 9, no. 12: 1363. https://doi.org/10.3390/jmse9121363
APA StyleZhang, L., Zhang, S., Liu, X., & Sun, Y. (2021). Characterizing the Effect of Water Content on Small-Strain Shear Modulus of Qiantang Silt. Journal of Marine Science and Engineering, 9(12), 1363. https://doi.org/10.3390/jmse9121363