Article

Hydrodynamic Performance of a Multi-Module Three-Cylinder Floating Breakwater System under the Influence of Reefs: A 3D Experimental Study

School of Naval Architecture and Ocean Engineering, Jiangsu University of Science and Technology, Zhenjiang 212003, China
*
Author to whom correspondence should be addressed.
J. Mar. Sci. Eng. 2021, 9(12), 1364; https://doi.org/10.3390/jmse9121364
Submission received: 22 October 2021 / Revised: 22 November 2021 / Accepted: 27 November 2021 / Published: 2 December 2021
(This article belongs to the Special Issue Hydrodynamics and Mooring Analysis of Floating Structures)

Abstract

:
As the technical and theoretical research of floating breakwaters is becoming increasingly mature, the floating breakwaters are now being utilized, especially in offshore reefs. Therefore, it is of practical significance to study the hydrodynamic performance of a multi-module floating breakwater system under the influence of reefs. In this study, a 3D model experiment was carried out on a system consisting of eight three-cylinder floating breakwater modules under the influence of reefs. A wave attenuation mesh cage was incorporated at the bottom of the model. The floating breakwater system was slack-moored in its equilibrium position, and each module was connected by elastic connectors. The reefs were modeled on a bathymetric map of existing reefs in the East China Sea. In this experiment, the wave transmission coefficients, motion responses, and mooring forces of the floating breakwater system were measured. The results showed that the three-cylinder floating breakwater in the beam waves (β = 90°) has excellent wave attenuating performance under the influence of reefs, especially for short-period waves. However, under the influence of the reef reflection wave and the shallow water effect, the motion responses in the three main stress directions of the floating breakwater were large, and there was some surge and pitch motion. Under the influence of the aggregation and superposition of reflected waves on both sides of the reefs, the peak mooring forces in the middle position of the floating breakwater system were the largest at large wave height. The three-cylinder floating breakwater exhibited satisfactory hydrodynamic performance under the influence of reefs. It has broad application prospects in offshore reefs.

1. Introduction

With the development and utilization of marine resources worldwide, research on floating breakwaters has become a hot topic in the fields of naval architecture and ocean engineering. Compared with traditional bottom-fixed breakwaters, floating breakwaters have several advantages. Firstly, the floating breakwater has a low cost and the advantage of convenient construction. Floating breakwaters can also be installed and disassembled more easily. Moreover, floating breakwaters are friendlier to the ocean environment. In addition, because of the limitations of water depth, environment, and construction difficulty, bottom-fixed breakwaters are not suitable for wave prevention and wave dissipation in offshore reefs and open sea areas, while the floating breakwater has unique advantages that cannot be matched by the bottom-fixed breakwater. For example, (1) floating breakwater provides sheltered waters to ensure the safety of island floating platforms, floating trestles, and other marine structures. (2) Floating breakwater provides sheltered waters for deep-sea aquaculture, thus protecting against the effects of typhoons, which cause tremendous losses to fishermen. (3) Floating breakwater provides a safe working environment for temporary offshore construction operations.
To investigate the wave attenuating performance of floating breakwaters, experts and scholars have conducted many numerical analyses and model experiments. Christensen and Cho et al. [1,2,3,4] investigated three basic cross-sections of floating breakwaters in 2D. Their study showed that the cross-section with wing plates and porous media attached to the sides reduced the transmission coefficients most effectively. Zhan et al. [2] used the computational fluid dynamics (CFD) method to compare and analyze the performances of a rectangular floating breakwater, an inverted π-type floating breakwater and an L-type floating breakwater. The results indicated that the L-type floating breakwater has better wave attenuating performance than those of the rectangular and inverted π-type floating breakwaters. Yang et al. [3] conducted an experimental study on a new type of water ballast floating breakwater. The experimental results showed that increasing the height of the vertical plate or the draft of the floating body is conducive to an improvement in the performance. Chen et al. [5] studied the hydrodynamic performance of a floating breakwater consisting of a rectangular pontoon and horizontal plates by establishing a two-dimensional numerical model. This model indicated that the relative width of the rectangular pontoon is an important factor that influences the wave transmission coefficients of the floating breakwater. The transmission coefficients decrease as the relative width of the rectangular pontoon increases. The horizontal plates help reduce the wave transmission coefficients of the floating breakwater. He et al. [6] experimentally investigated the hydrodynamic performance of floating breakwaters with and without pneumatic chambers. The experimental results showed that the pneumatic chambers significantly enhanced the wave energy dissipation and reduced the wave transmission coefficients. Wang et al. [7] proposed a new porous floating breakwater and conducted relevant model experiments. Their experimental results showed that the proposed porous floating breakwater can reduce the incident wave height by attenuating the wave energy more than by reflecting it. Dong et al. [8] conducted a series of model experiments in a 2D wave flume in the laboratory to measure the wave transmission coefficients of three types of floating breakwaters: a single box, a double box, and a board net. Based on the comparison of the wave transmission coefficients of the three breakwater types, they concluded that in deep-sea aquaculture the board net-type floating breakwater is more beneficial for wave prevention and wave dissipation than the other breakwater types studied. The width of the board plays a significant role in the performance of the breakwater. The nets can effectively decrease the wave transmission coefficients, and their interval should be ~20 m. Ghassan et al. [9] investigated the influence of the reflection of the harbor boundary (sidewall) on the performance of a floating breakwater. The results showed that partially reflected waves play an important role in modifying the performance of a floating breakwater, as they can reduce the wave transmission coefficients. Ji et al. [10,11,12,13,14] systematically investigated floating breakwaters and designed a variety of floating breakwater configurations. A series of numerical analyses and model experiments were carried out, and several configurations of a floating breakwater with better performance were optimized. They found that the wave transmission coefficients were significantly reduced by the nets and balls. With an increase in the wave period, the wave transmission coefficients increase before they reach their peak value, followed by a decreasing trend. Furthermore, the results indicated that double-row floating breakwaters attenuate waves significantly better than single-row floating breakwaters.
The motion response of a floating breakwater is one of the factors affecting its performance. Therefore, research on the motion responses of floating breakwaters is very important. He et al. [15] concluded through a 2D experimental study that compared floating breakwater with symmetric and asymmetric pneumatic chambers that the asymmetric chambers increased the heave motion but did not significantly change the surge and pitch motions. Loukogeorgaki et al. [16,17] conducted 3D model experiments to investigate the structural motion responses of a floating breakwater system, including elastic connectors. The results showed that the motion responses of floating breakwaters depend strongly on the incident wave period. The wave height and wave obliquity affected the motion responses mainly in the examined low-frequency range, while in the examined high-frequency range, their effect on the motion response was very small. Gesraha et al. [18] conducted a model experiment on a rectangular floating breakwater with two thin sideboards protruding vertically downward. The results showed that the motion of the floating breakwater can be effectively reduced by two thin sideboards protruding vertically downward. S. A. Sannasiraj et al. [19] investigated the motion responses of pontoon-type floating breakwaters in 2D. The results showed that there was good agreement between the numerical simulation and the model experiments, except at the roll resonance frequency. In the vicinity of the natural roll frequency, the cross-moored breakwater has high motion responses. A. Najafi-Jilani et al. [20] used the Smoothed-Particle Hydrodynamics (SPH) method to simulate the movement of a floating breakwater, and the numerical results were in good agreement with the experimental results. He et al. [6] investigated the movement of a floating breakwater with or without pneumatic chambers, and the results showed that the water in the cabin helped to reduce the surge and pitch motions of the floating breakwater. Christensen et al. [1] investigated a floating breakwater with three basic cross-sections using numerical and experimental methods, and the results showed that the floating breakwater with wing plates reduced the motions of the floating breakwater to the largest extent. Ji et al. [21] conducted a series of model experiments under long regular wave actions to investigate the hydrodynamic performance of floating breakwater models. The overall results demonstrated that the porous plates and mesh cage with balls were effective in increasing the damping and reducing the motion responses of the floating breakwaters.
The characteristics of mooring lines affect the movement of the floating breakwaters and affect the wave attenuating performance. Therefore, the study of mooring forces is an important direction in the study of floating breakwater systems. S. A. Sannasiraj et al. [19] performed a comparative analysis of three mooring system arrangement modes, in which the mooring line arrangement mode had an important influence on the force on the mooring line. The mooring forces of the mooring point at the water level and at the bottom of the floating breakwater are obviously smaller than those of the mooring point at the bottom of the breakwater and crossed mooring. Mane et al. [22] investigated the peak mooring forces of a floating pipe breakwater, and the results showed that the peak mooring forces increased with an increase in wave steepness (Hi/gT2) and decreased with an increase in W/L. The influence of Hi/d on the peak value was significant. Hegde et al. [23] experimentally investigated the mooring forces of floating breakwaters, and the results showed that the force in the windward direction increases with an increase in Hi/L for d/W values ranging between 0.081 and 0.276. In addition, when W/L ≤ 1.3, the mooring force decreases with an increase in W/L, and when W/L > 1.3, the mooring force increases with an increase in W/L. Liang et al. [24] conducted a numerical analysis and experimental study on a spar buoy floating breakwater, and the results showed that the peak mooring forces were mainly affected by the diameter of the pipe and the wave and not by the net buoyancy of the spar buoy. In practical use, the mooring line should be pre-tensioned so that the mooring line connection parts grind less. Martinelli et al. [25] investigated floating breakwaters with two layouts, an I-shaped layout and a J-shaped layout, by means of experiments. The results showed that the breakwater with the J-shaped layout had a smaller mooring force compared with that of the breakwater with an I-shaped layout under perpendicular waves. Loukogeorgaki et al. [26] established a 3D hydrodynamic model for the coupling of a floating breakwater and a mooring system and adjusted the slack-taut state of the mooring lines by changing the length of the mooring lines, thus changing their stiffness. The results showed that the stiffness of the mooring lines has an important impact on the hydrodynamic performance of a floating breakwater. Wang et al. [7] proposed a porous floating breakwater. Compared with that of a conventional breakwater, a porous floating breakwater can effectively reduce the mooring force. Jeong et al. [27] established a two-dimensional numerical model in a fixed coordinate system and investigated the hydrodynamic performance of a floating breakwater in regular waves. The results showed that the numerical simulation results were consistent with the experimental data. At the same time, the mooring forces of square, rectangular, and trapezoidal floating breakwaters were compared and analyzed, and the results showed that the stress of the trapezoidal floating breakwater was the lowest.
Although many experts and scholars have conducted detailed research on floating breakwaters, these studies were for the most part focused on two dimensions and single modules. Fewer studies have been focused on three dimensions and multiple modules. In addition, there are few studies on the influence of reef topography on floating breakwaters. Therefore, it is of great significance to study the 3D hydrodynamic performance of a multi-module floating breakwater system under the influence of reefs. In this study, we designed a multi-module three-cylinder floating breakwater system consisting of a three-cylinder water surface main structure connected by a square box, underwater wave attenuation mesh cage, mooring system, and connection structures. Through a series of 3D model experiments, the hydrodynamic performance of a floating breakwater system under the influence of reefs was studied. During the experiments, the wave transmission coefficients, motion responses, and mooring forces of the floating breakwater system under the action of regular waves were measured. Finally, the main factors affecting the hydrodynamic performance of the multi-module three-cylinder floating breakwater system under the influence of reefs were determined by analyzing the experimental results.

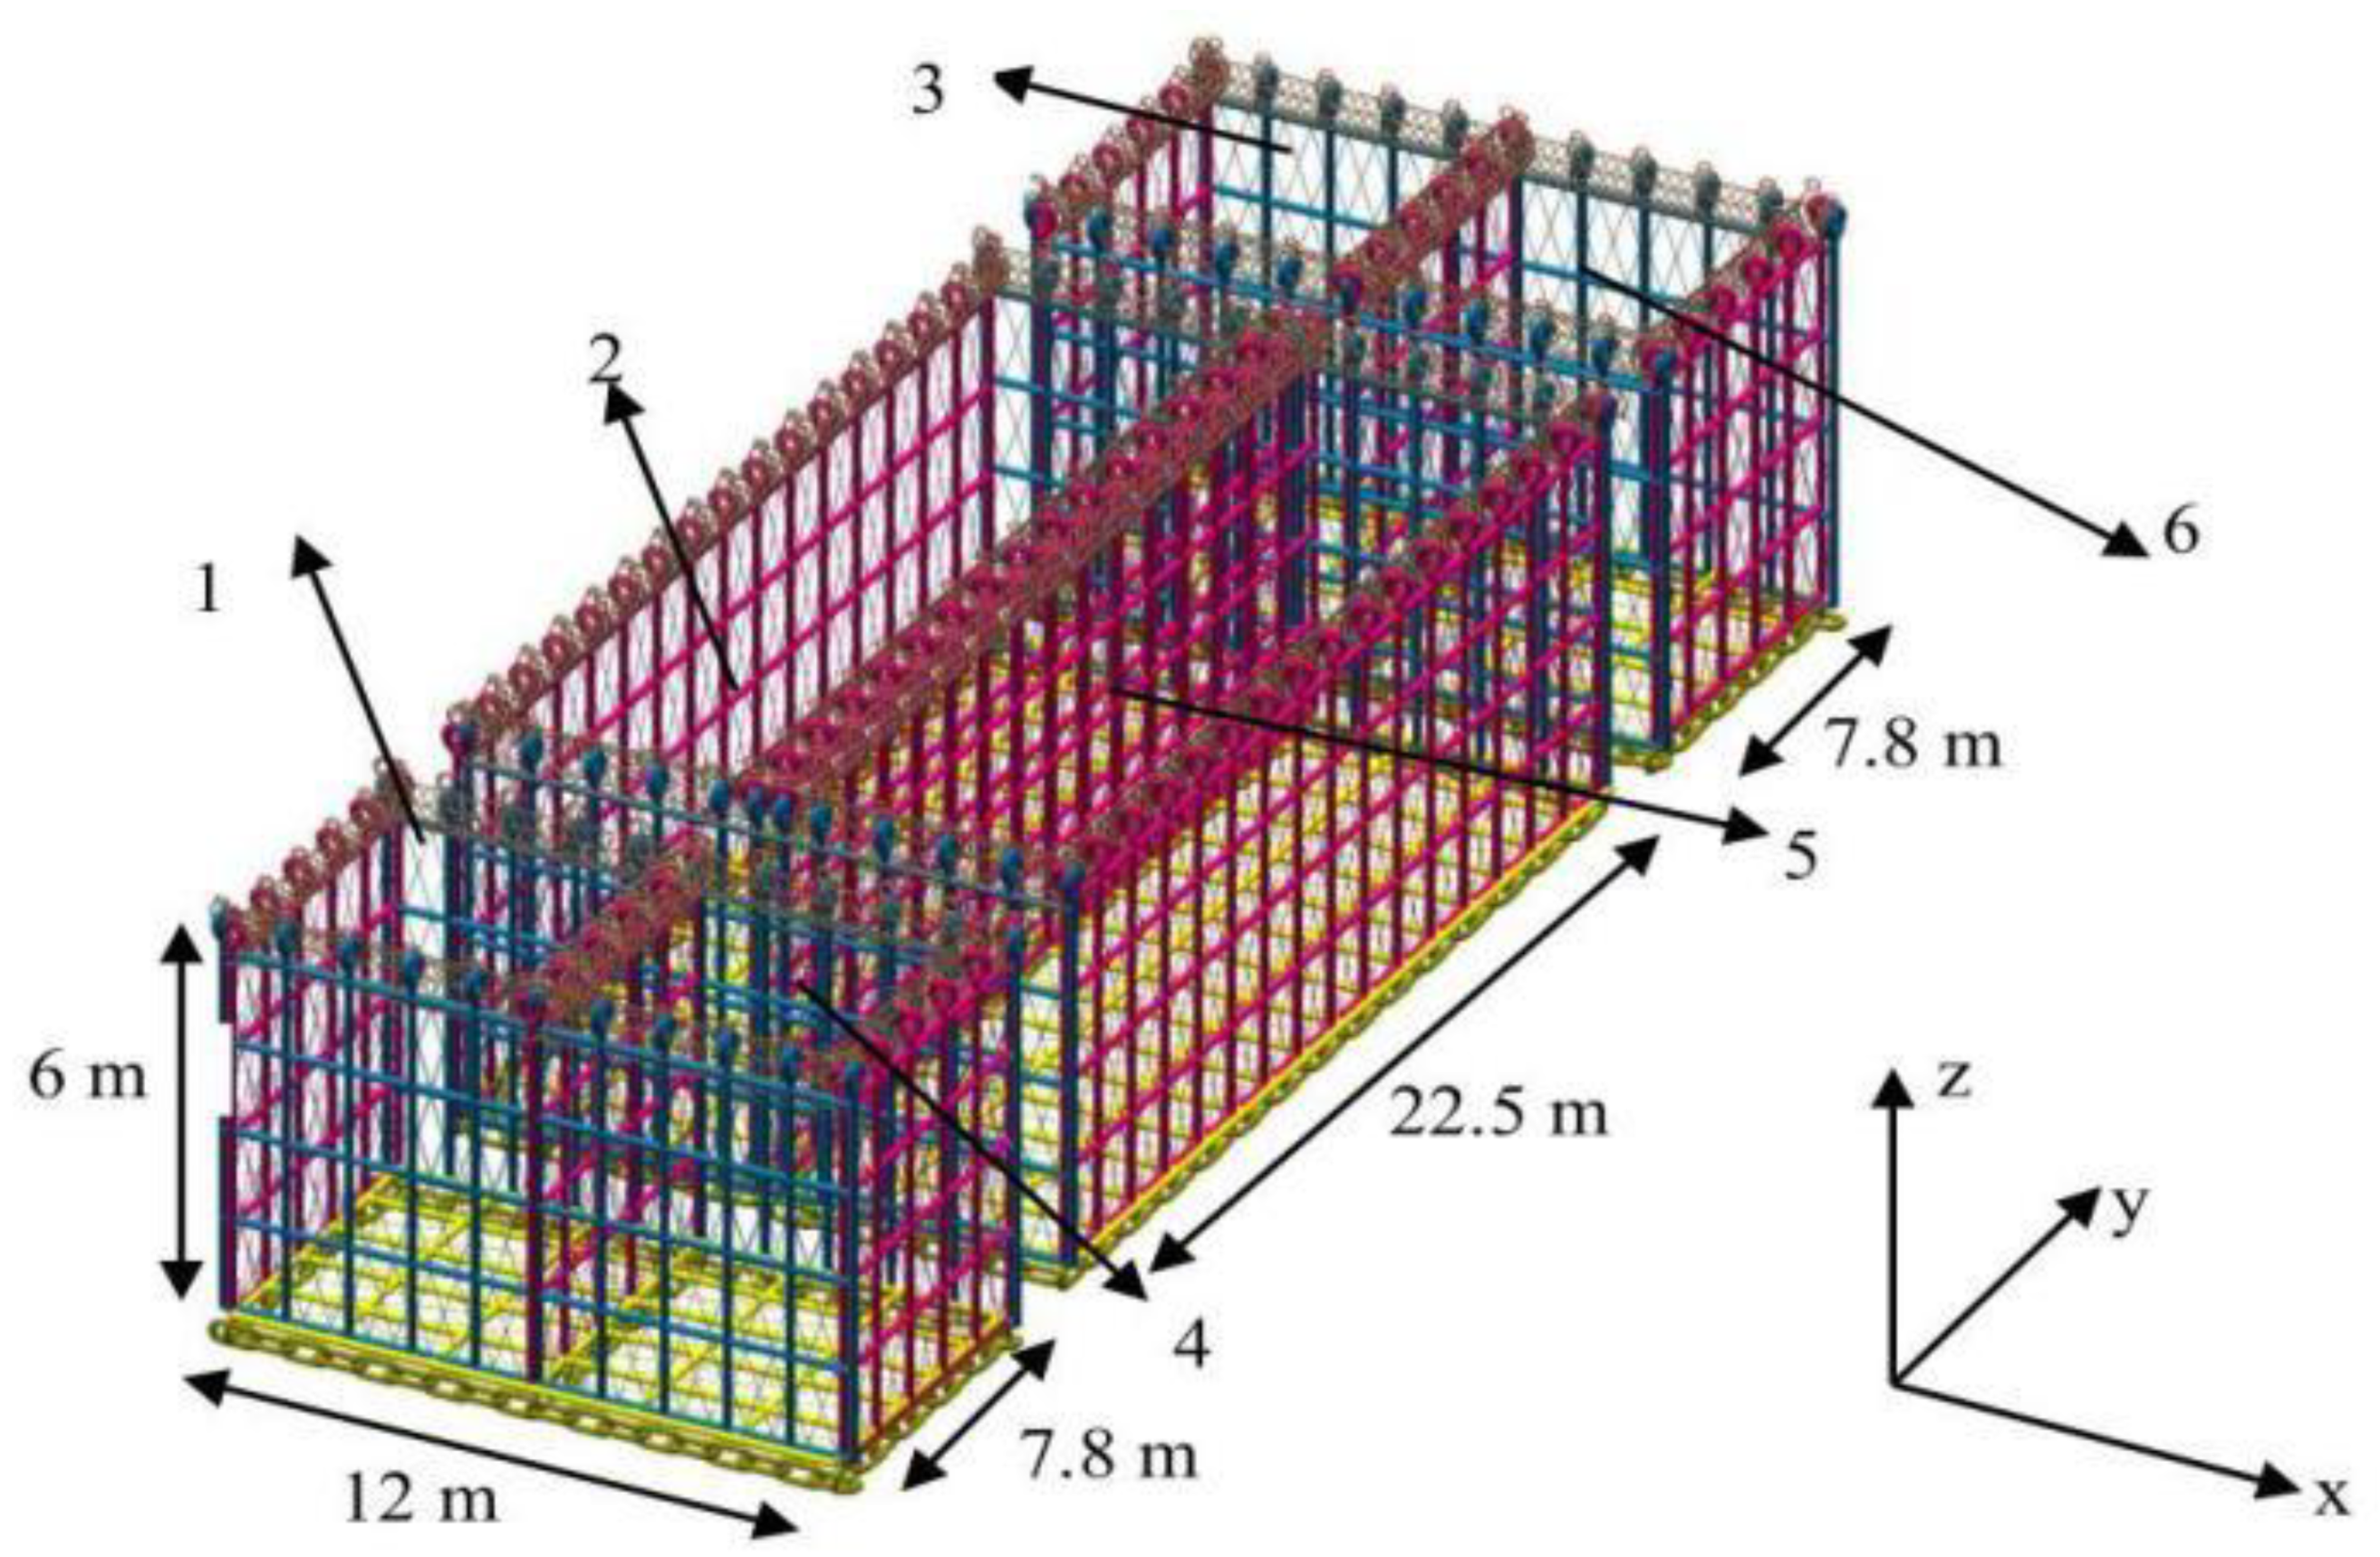
2. Configuration Design

The main configuration of the floating breakwater was optimized based on the cylindrical floating breakwater configuration in a previous study by Professor Ji [10,11,12,13,14], and the three-cylinder floating breakwater was selected as the final configuration and used as the prototype of the experimental model. The design scheme, with a total length of 40 m, width of 15.4 m, and depth of 3.4 m is shown in Figure 1, Figure 2, Figure 3 and Figure 4. The main body is made of three 3 (diameter) × 40 m (length) cylinders, connected by some square box structures, and the width of the square box structures has three specifications: 2, 2.5 and 10 m. The design draft of the configuration is 1.7 m, and the displacement of a single module is 665.6 t.
The underwater wave attenuation mesh cage was divided into six sub-cages, as shown in Figure 5. Mesh cages 1, 3, 4, and 6 have the same dimensions, with lengths of 6, 7.8, and 6 m along the X, Y, and Z directions, respectively. The sizes of mesh cages 2 and 5 are the same; the lengths along X, Y, and Z are 6, 22.5, and 6 m, respectively, and the density of the mesh cage is 0.3 kg/m3.
The connection structure between floating breakwaters was an elastic connection mode that combined rubber rings and crash cushions. The layout scheme of the connection structure of adjacent floating breakwater modules is shown in Figure 3 and Figure 4. Six crash cushions were arranged at each end of the floating breakwater, including four small crash cushions and two large crash cushions. The small crash cushions were arranged at the center of the two outer cylinders, and the actual size was 1000 × 600 mm. The large crash cushions were arranged at the center of the middle cylinders, and the actual size was 2200 × 600 mm. The rubber ring was connected to the structure by the lifting lug arranged at the end of the structure, and the adjacent floating breakwater modules were connected by two rubber rings. The actual size of the rubber ring was 1200 (outside diameter), 400 (inside diameter), and 400 mm (cross-sectional diameter).

3. Experimental Setup

3.1. Model Scale Ratio

Taking into consideration the dimensions of the wave basin, the wave generation capacity, the experimental equipment and requirements, the wave environment characteristics, the topographic conditions, and the dimensions of the floating breakwater unit, the model scale ratio for the experiment was set as 1:50. The water depth was 0.5 m.

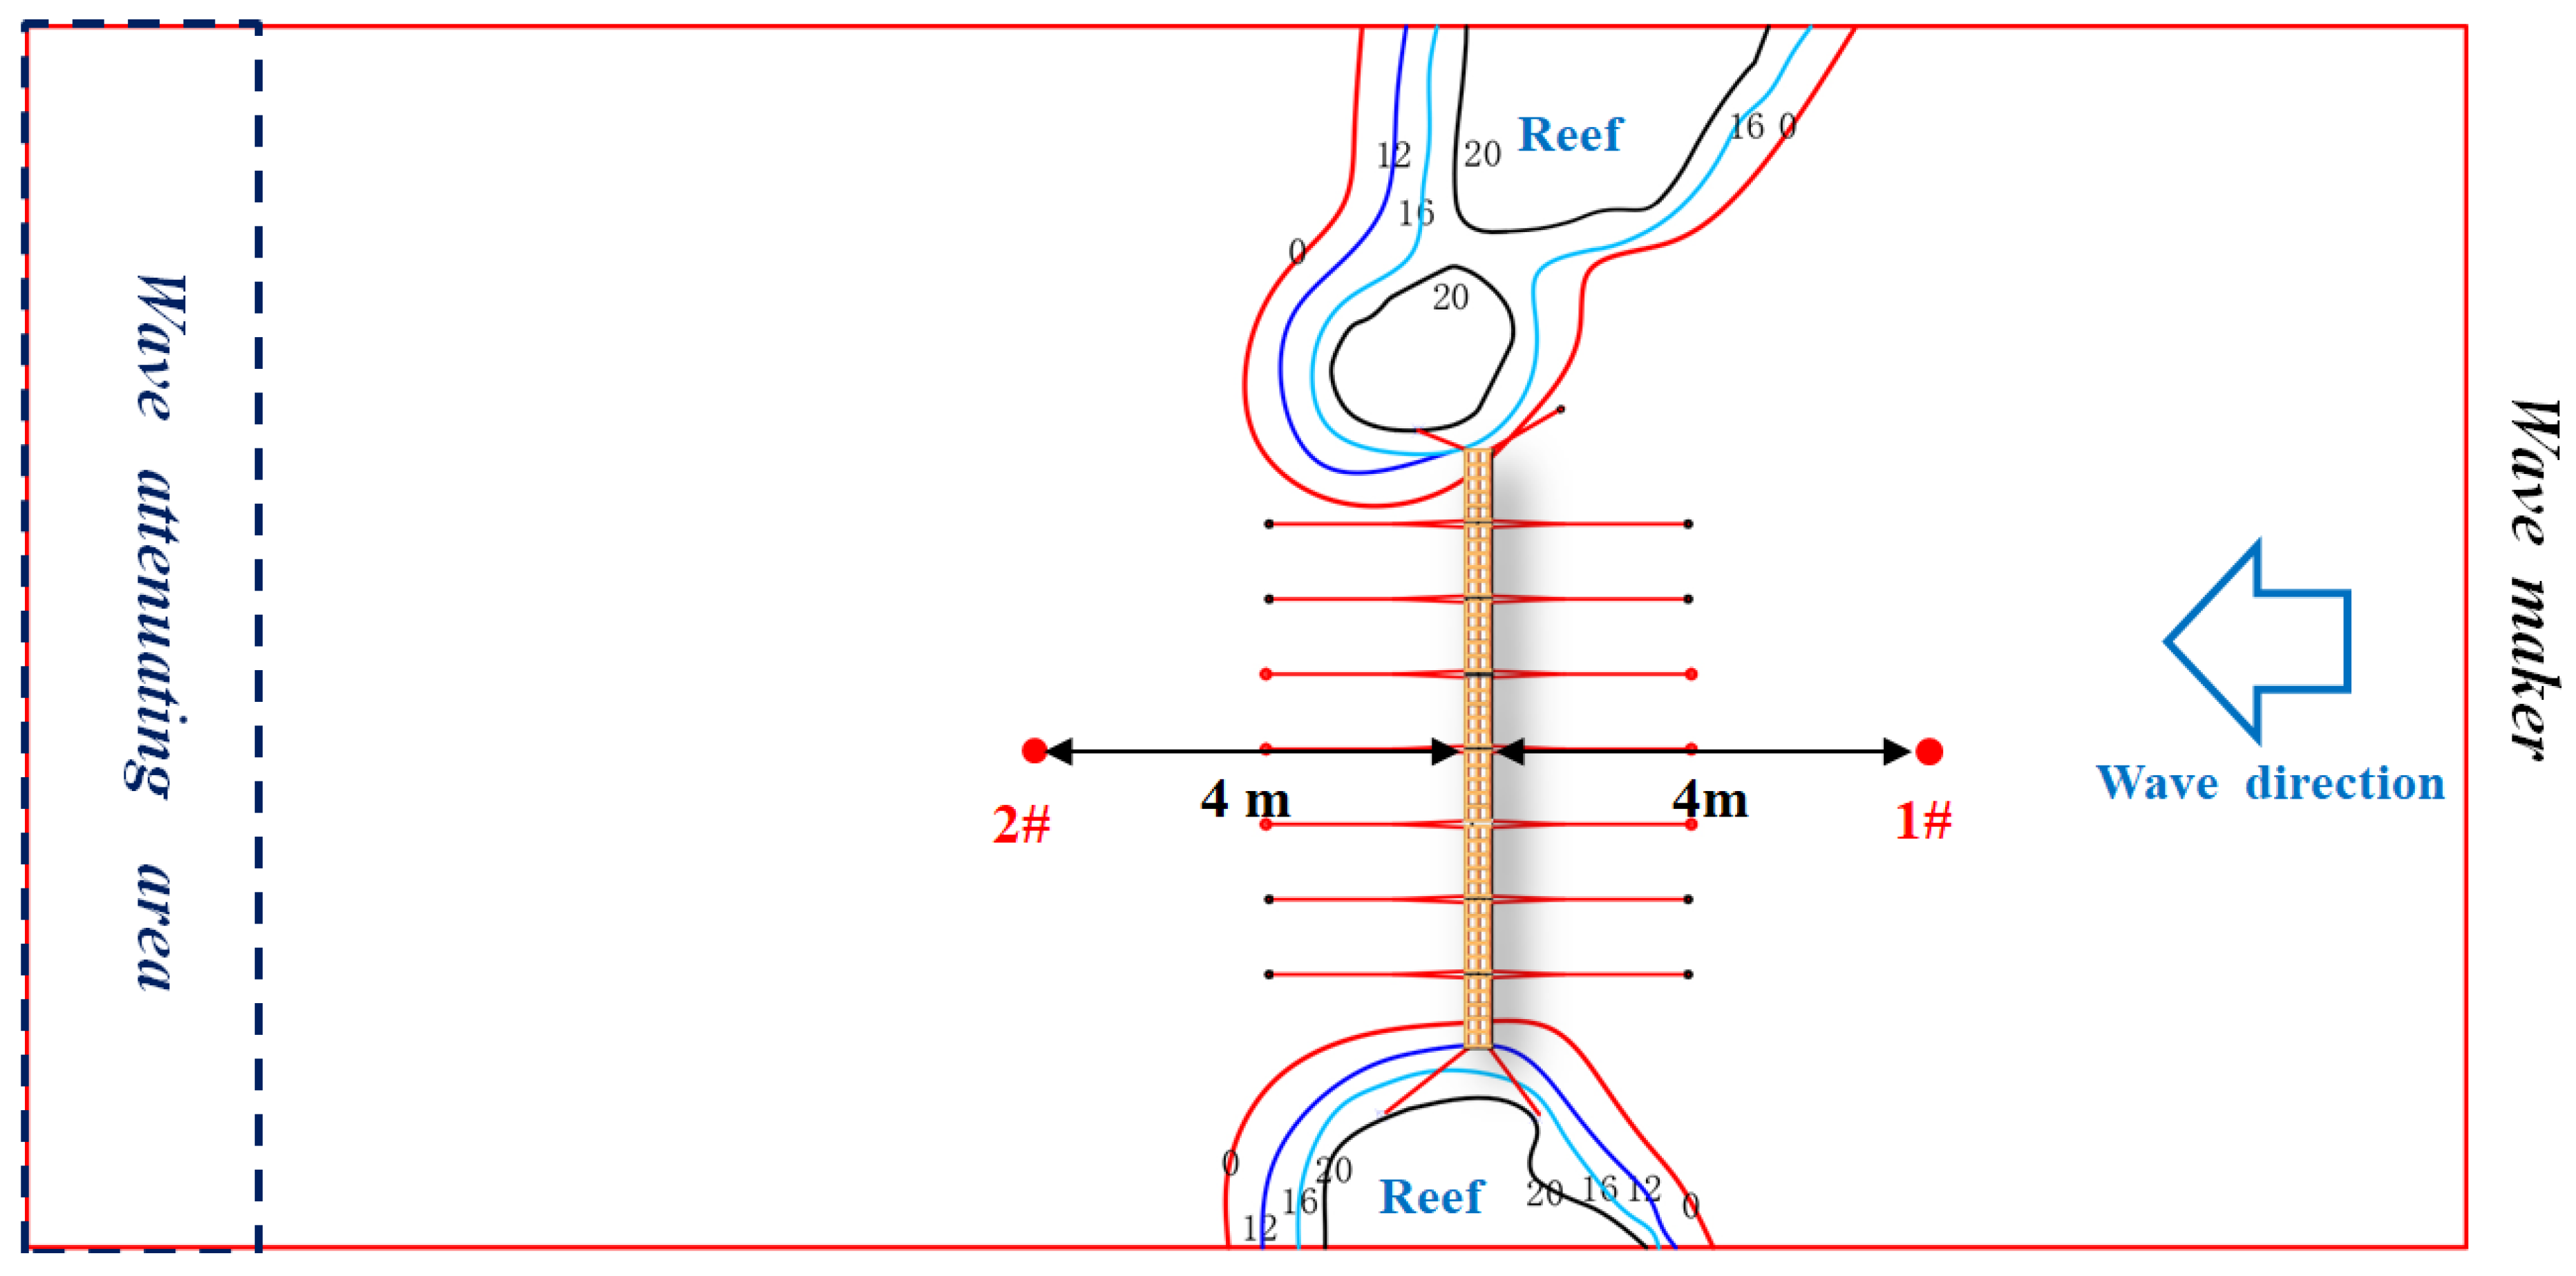
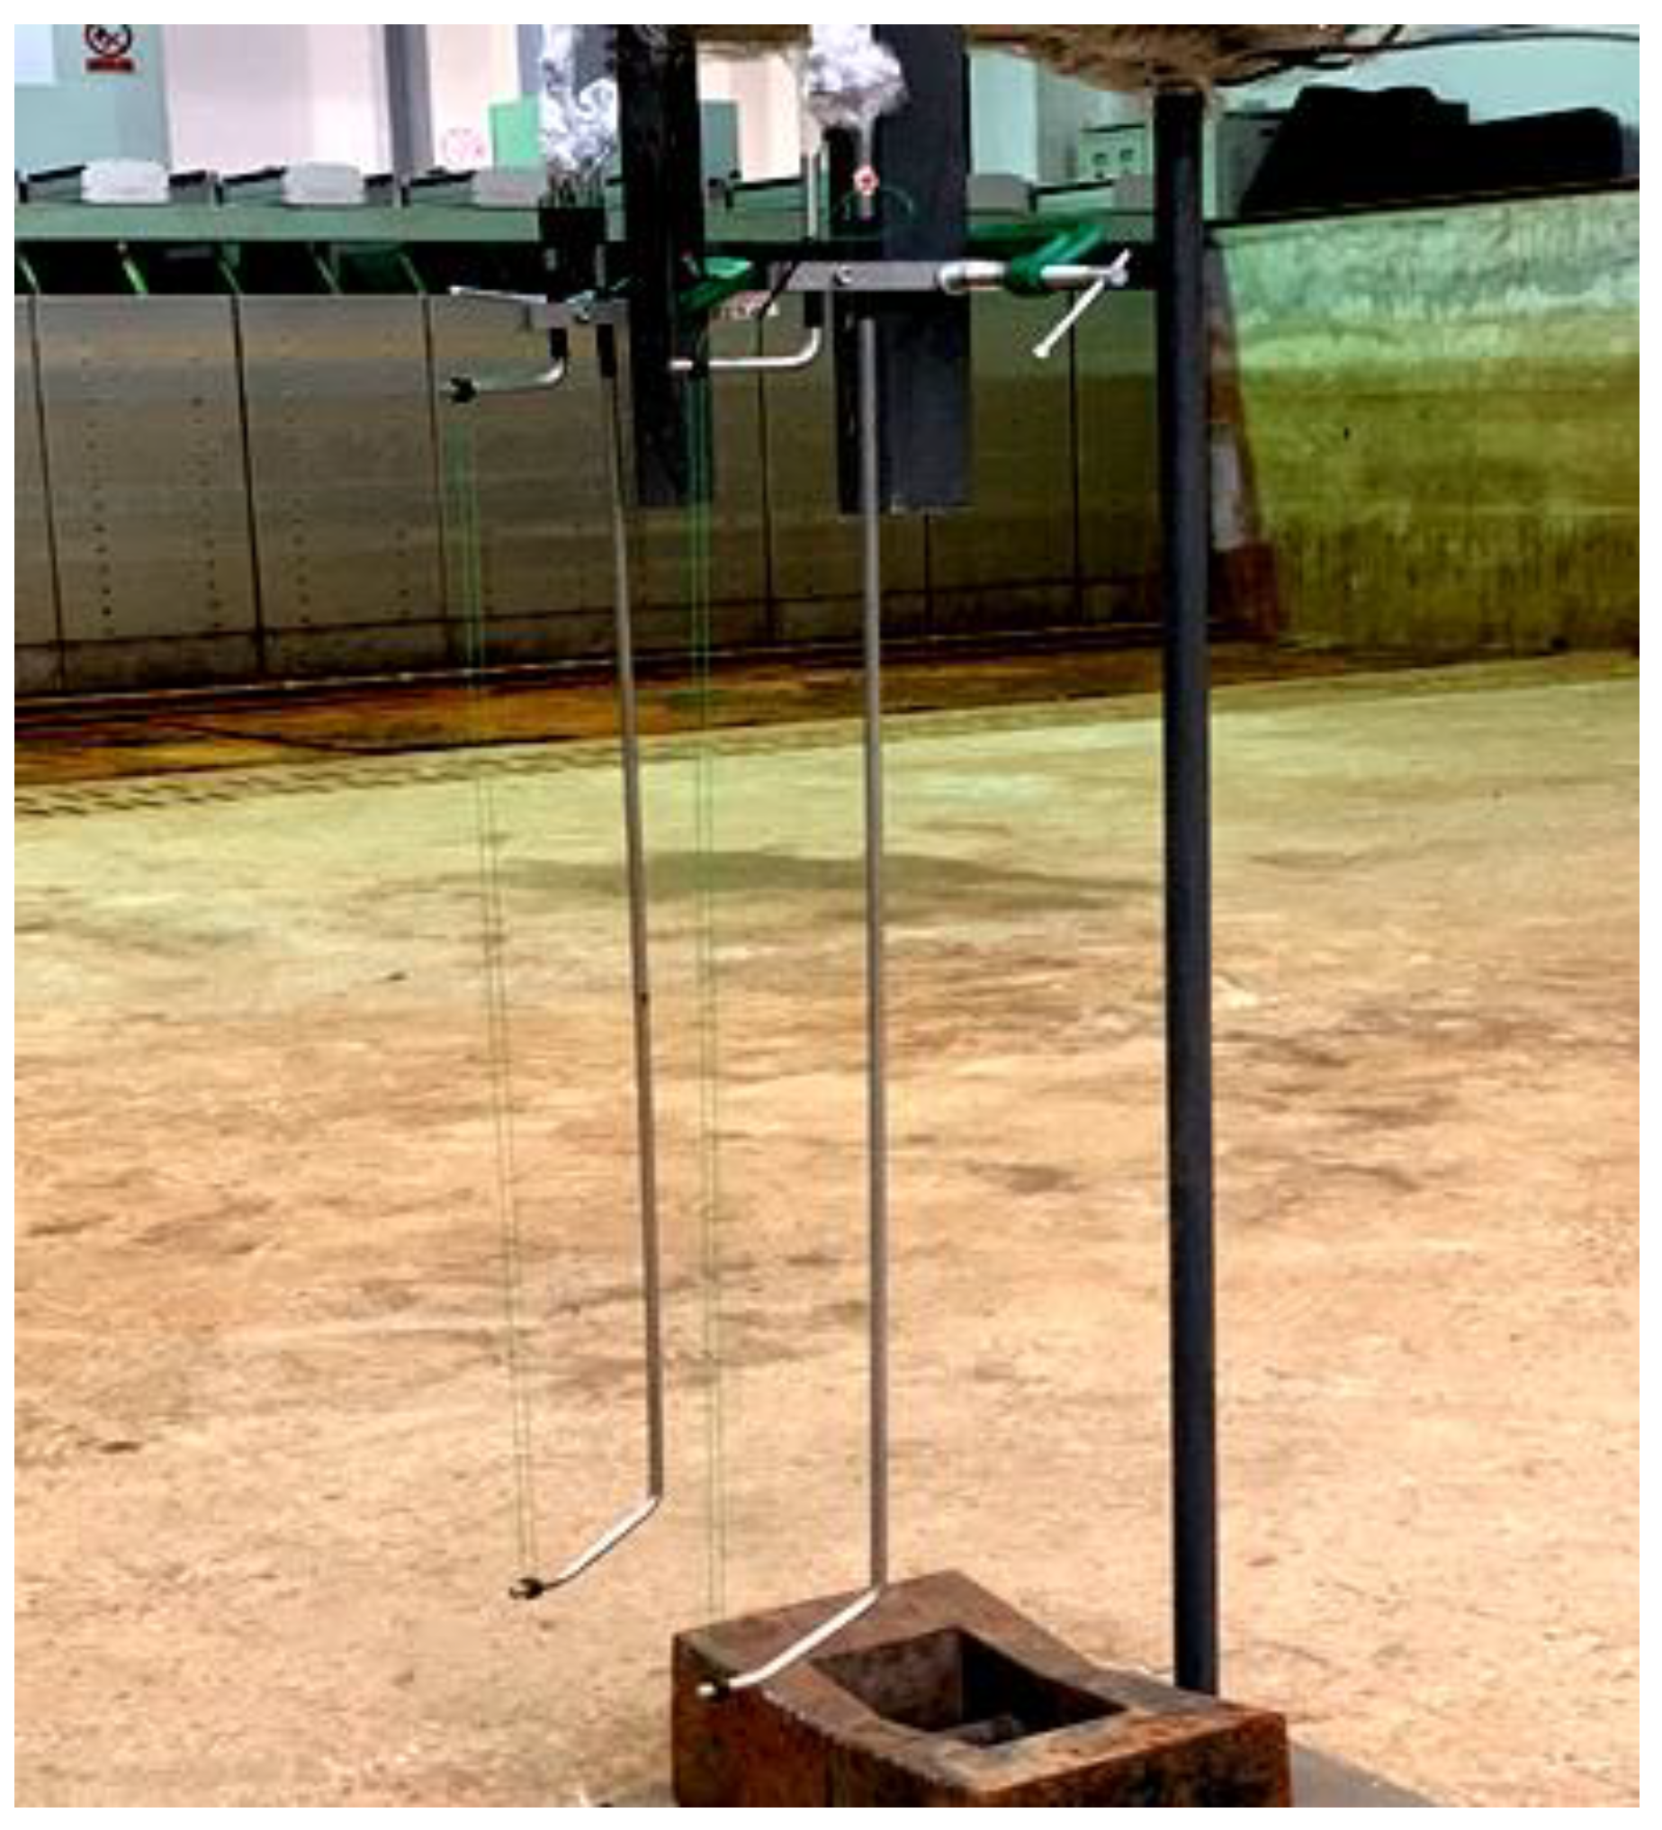
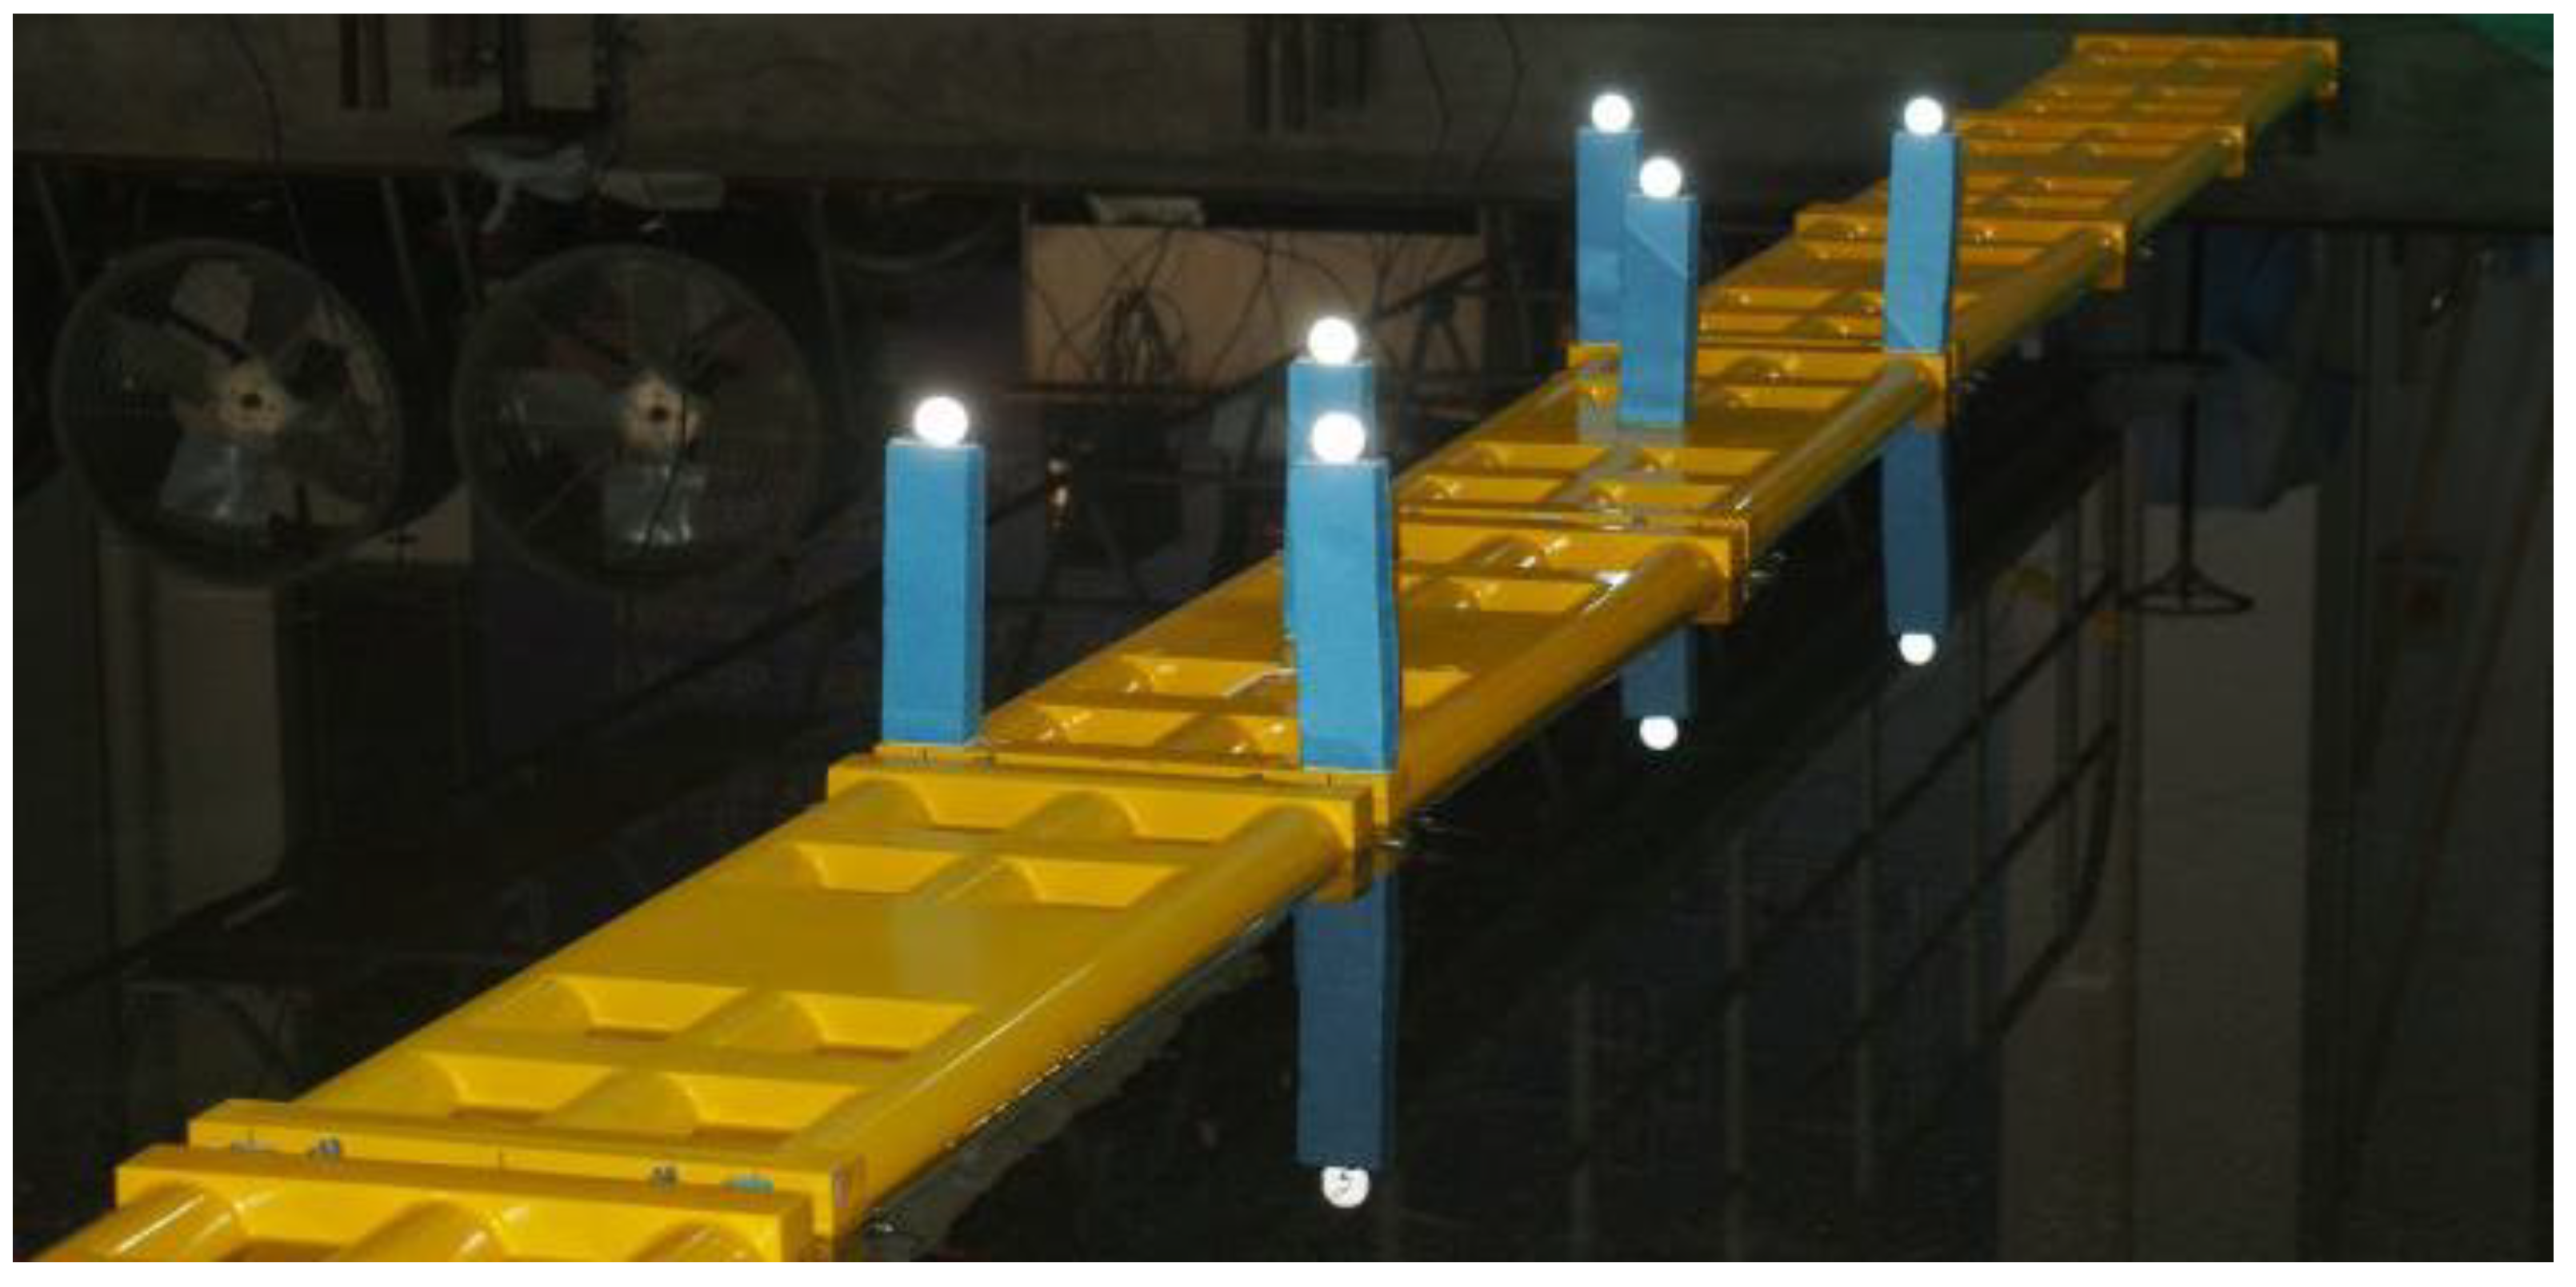
3.2. Experimental Facilities

The experiment was conducted in the comprehensive wave basin of the Laboratory of the School of Naval Architecture and Ocean Engineering, Jiangsu University of Science and Technology, China. The wave basin is 38 m long, 15 m wide and 1 m high. A piston-type wave-maker is installed at one end of the wave basin, which can simulate various waves according to the experiment requirements. To reduce the influence of the wall reflection wave on the experiment, a permeable slope was set at the other end of the wave basin, and a net that can attenuate the wave was laid on the slope to weaken the reflected waves transmitted to the wall surface.
To measure and calculate the wave attenuating performance of the floating breakwaters, a wave gauge (WG) and acquisition system were used to record the time-history curves of the wave in front and back of the floating breakwaters. The layout positions are shown in Figure 6, 1# is located 4 m in front of the breakwater and 2# is located 4 m behind the breakwater. The transmission coefficients were calculated by data processing, which provided an important basis for evaluating the effect of wave attenuation of floating breakwaters. As the transmission coefficients were separated by the two-point method [28], two WGs, shown in Figure 7, were arranged at each layout position during the experiment, the two WGs at the 1# layout position are recorded as WG1 and WG2, the two WGs at 2# layout position are recorded as WG3 and WG4. Load cells were used to measure the mooring forces at the front and back of the floating breakwater, and the layout is shown in Figure 8. The load cell used during the experiment is shown in Figure 9. Data were collected through the collector and amplifier, and then the peak mooring forces were obtained through calculations. To record the motion responses, a non-contact optical 6-DOF measurement system was applied. For convenience of description, the floating breakwaters are numbered in Figure 10, and floating breakwater modules are numbered 1 to 8 from left to right. In order to prevent problems in capturing the light sensing point of module 4# in the measurement process, light sensing points were also arranged on module 5#, as shown in Figure 11 and Figure 12. The motion amplitude of the floating breakwaters was obtained through calculation.

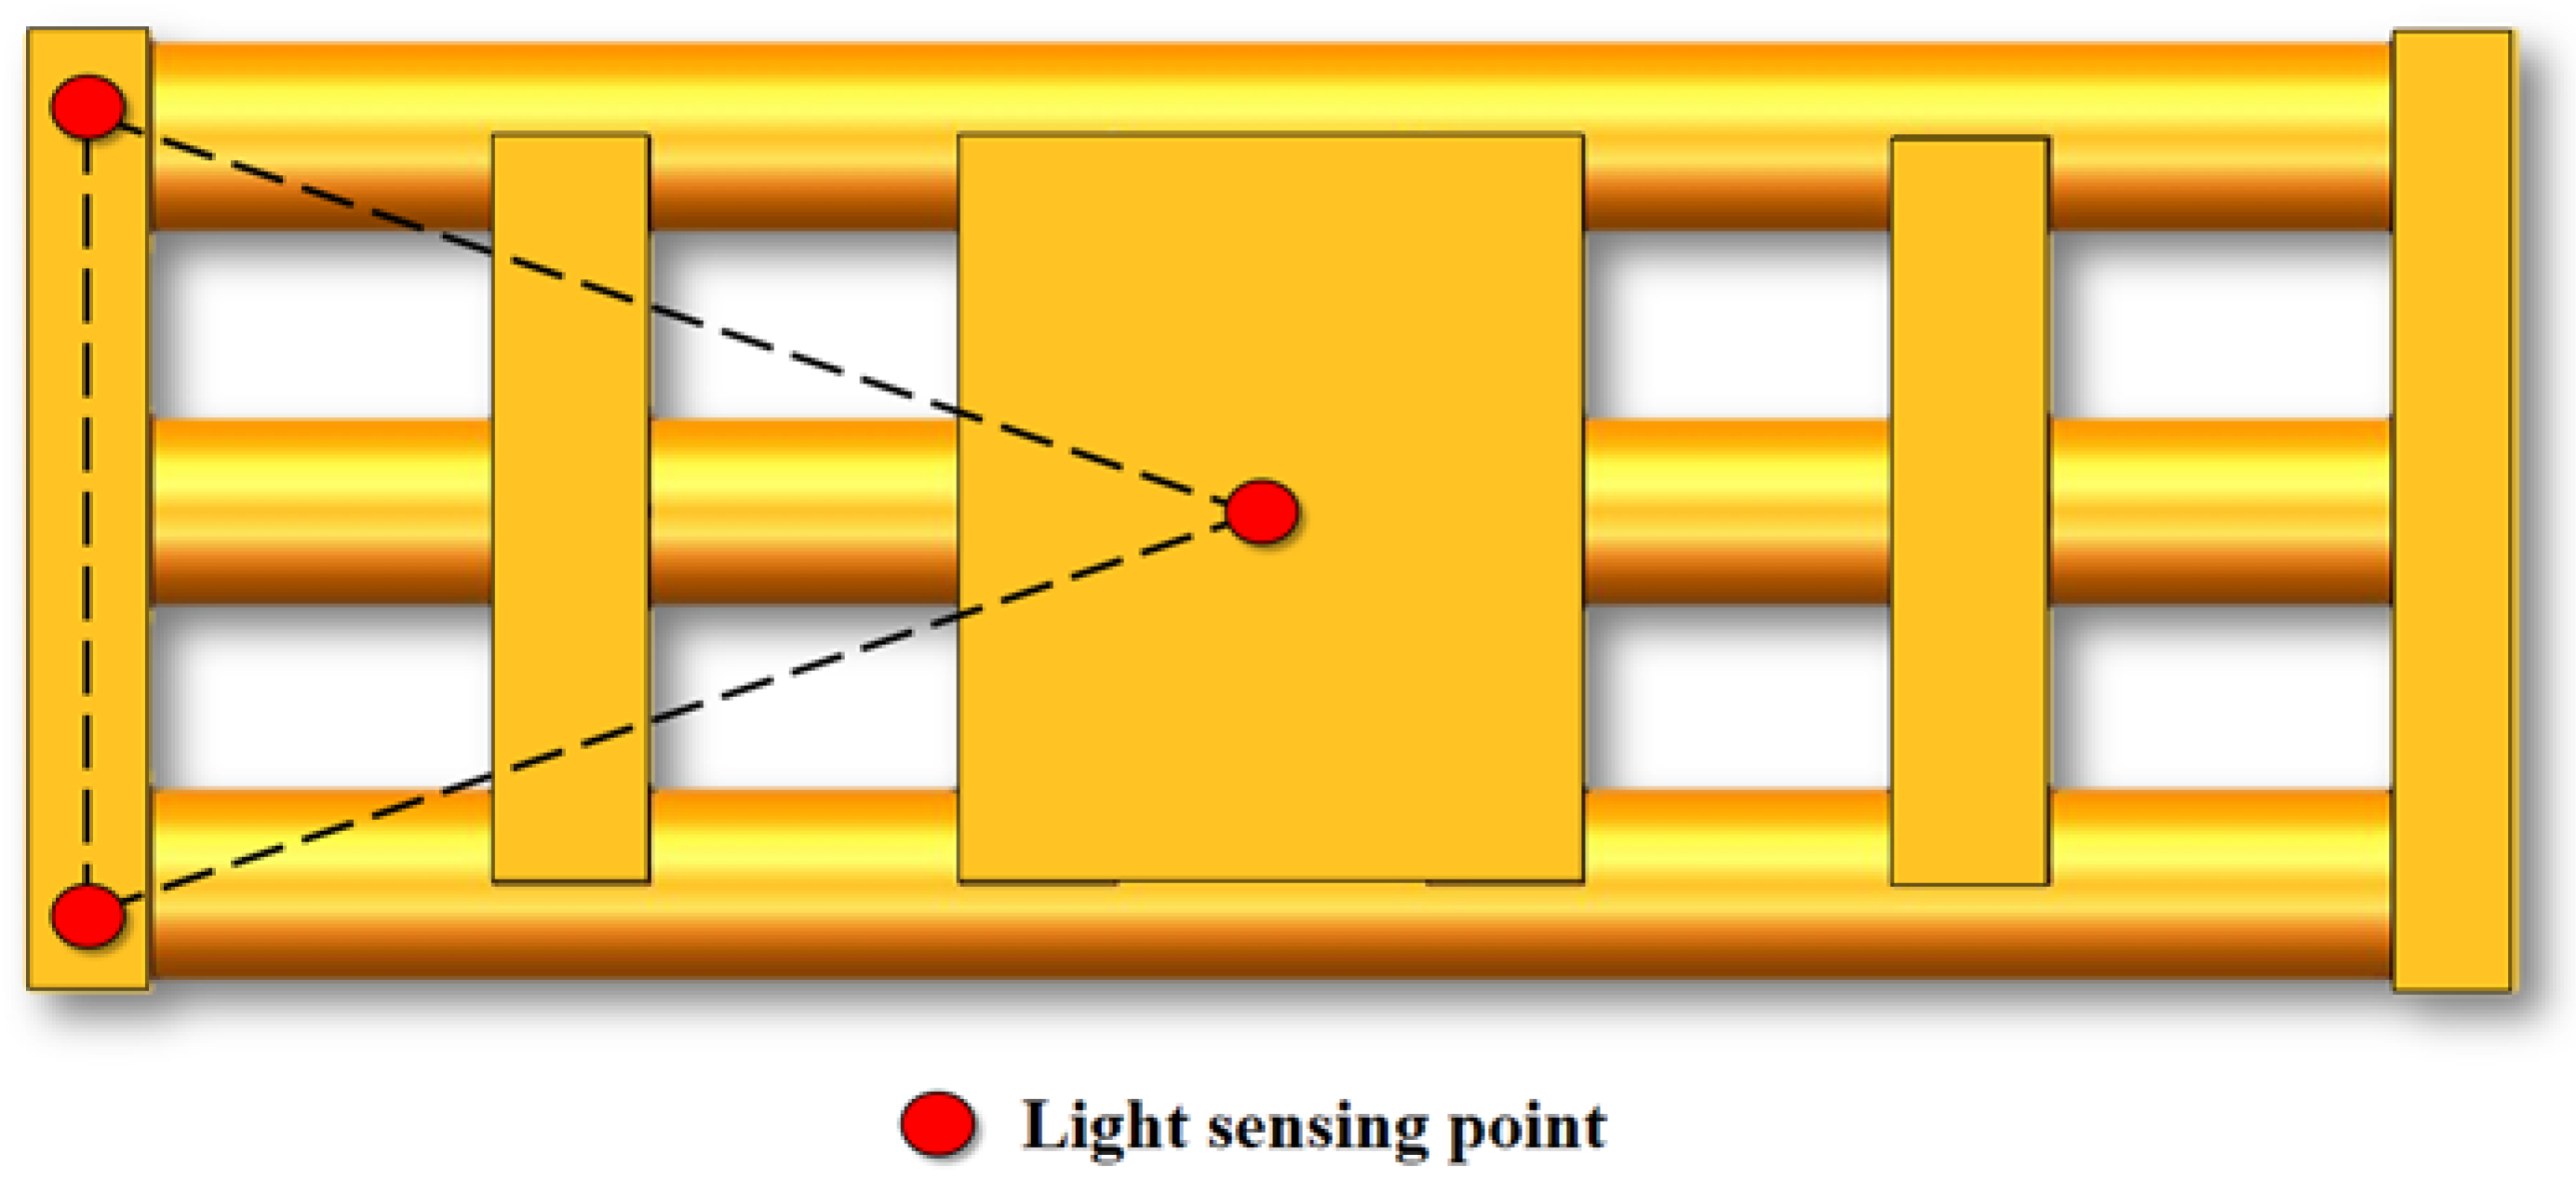
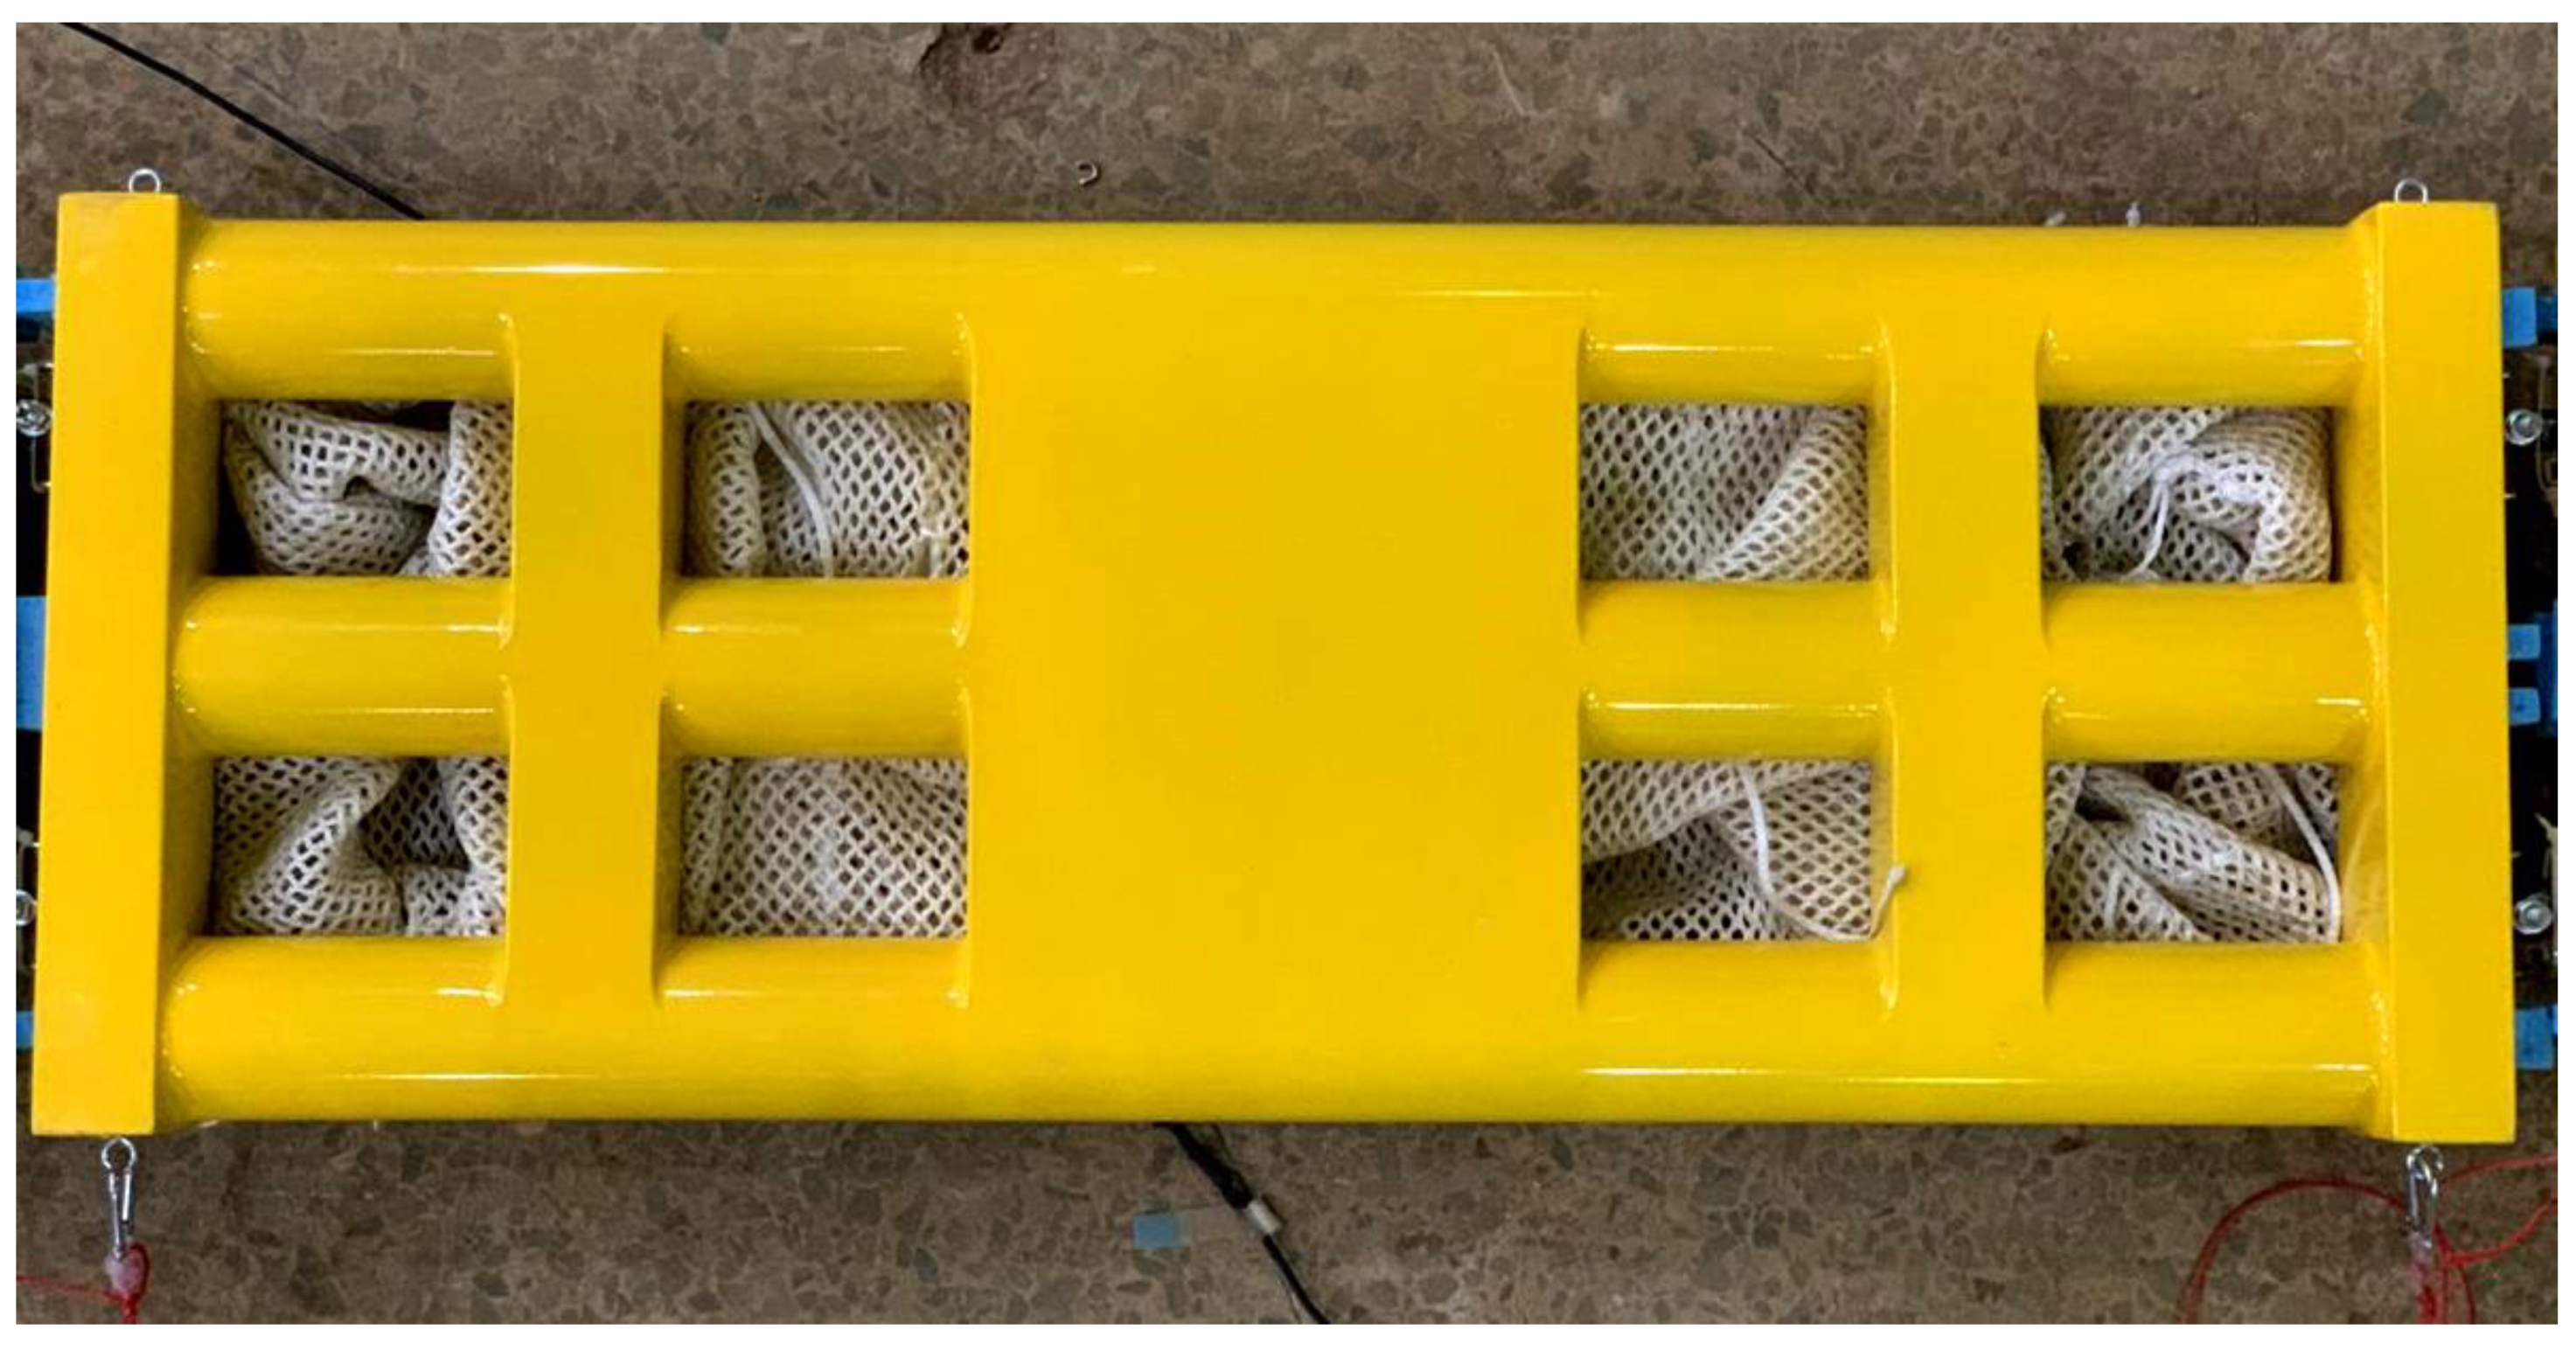
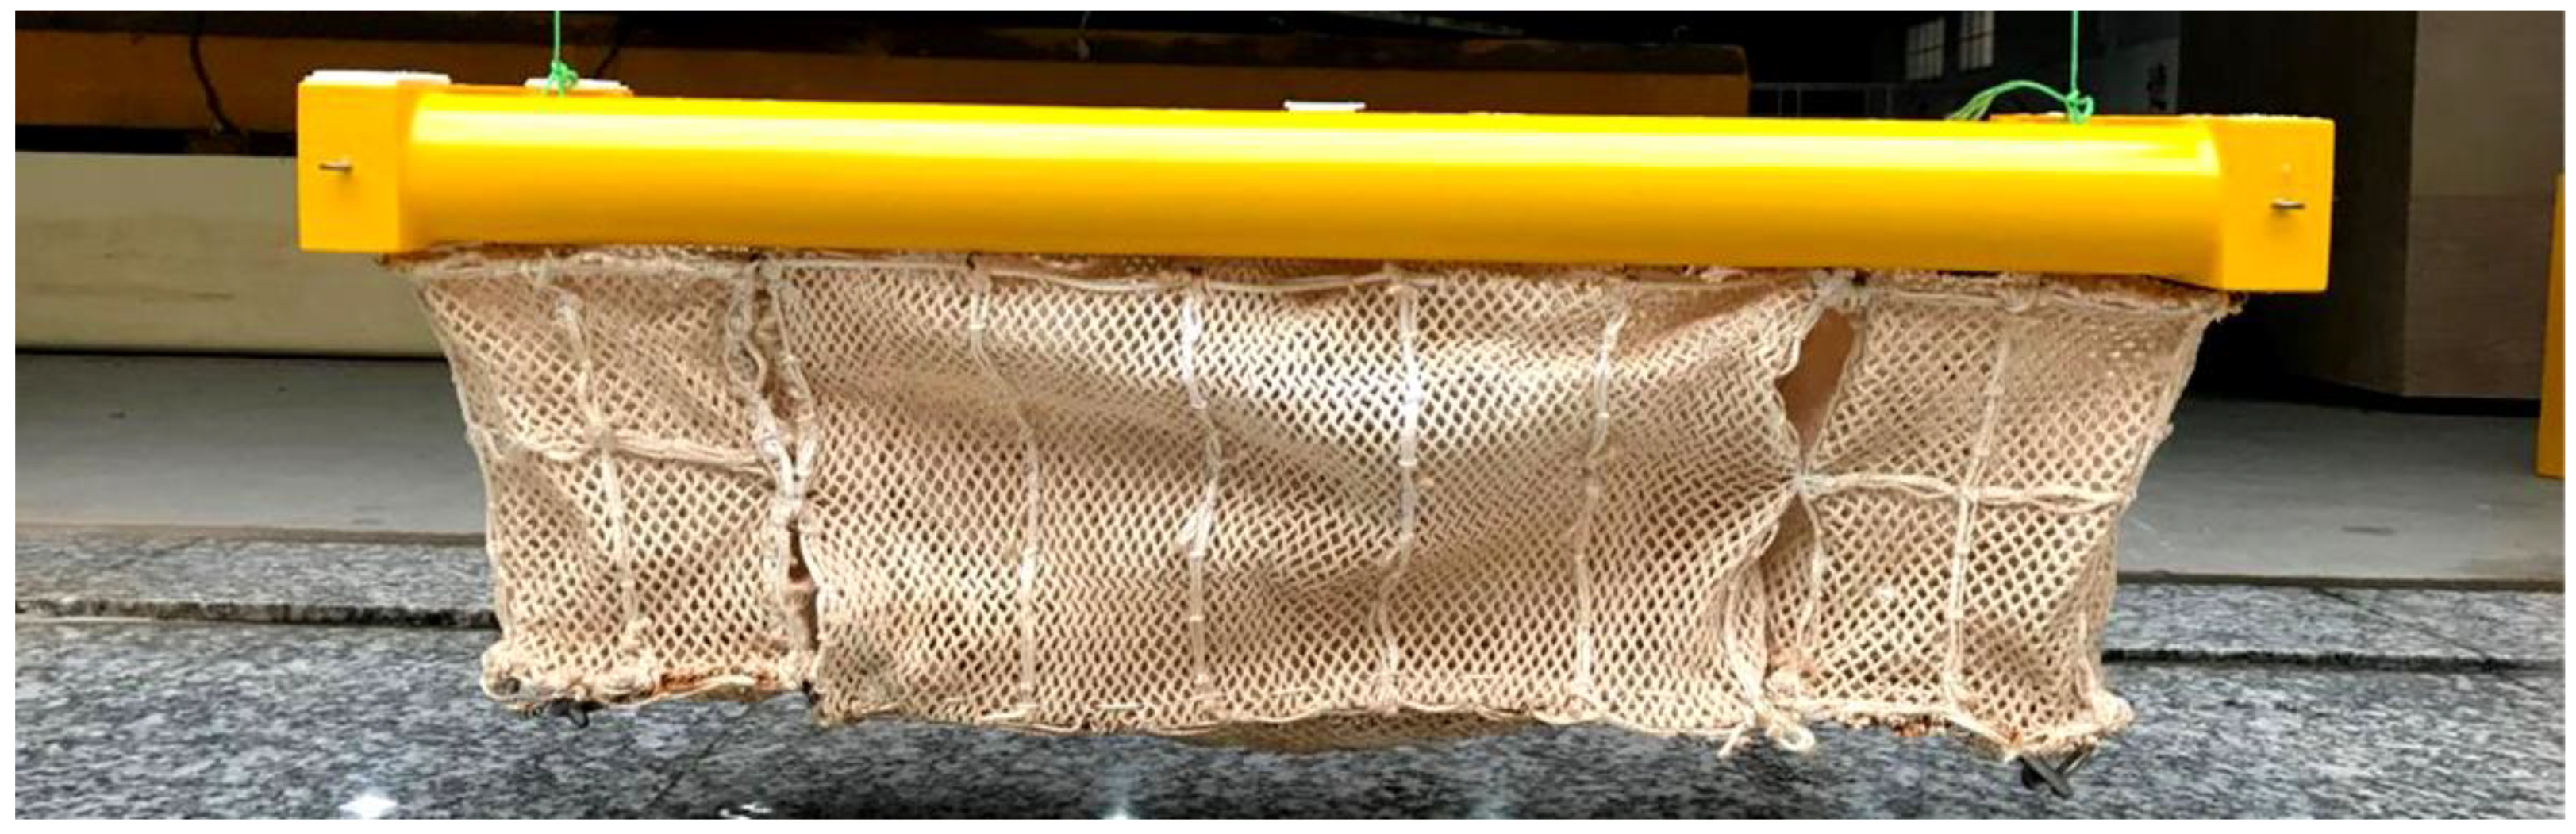
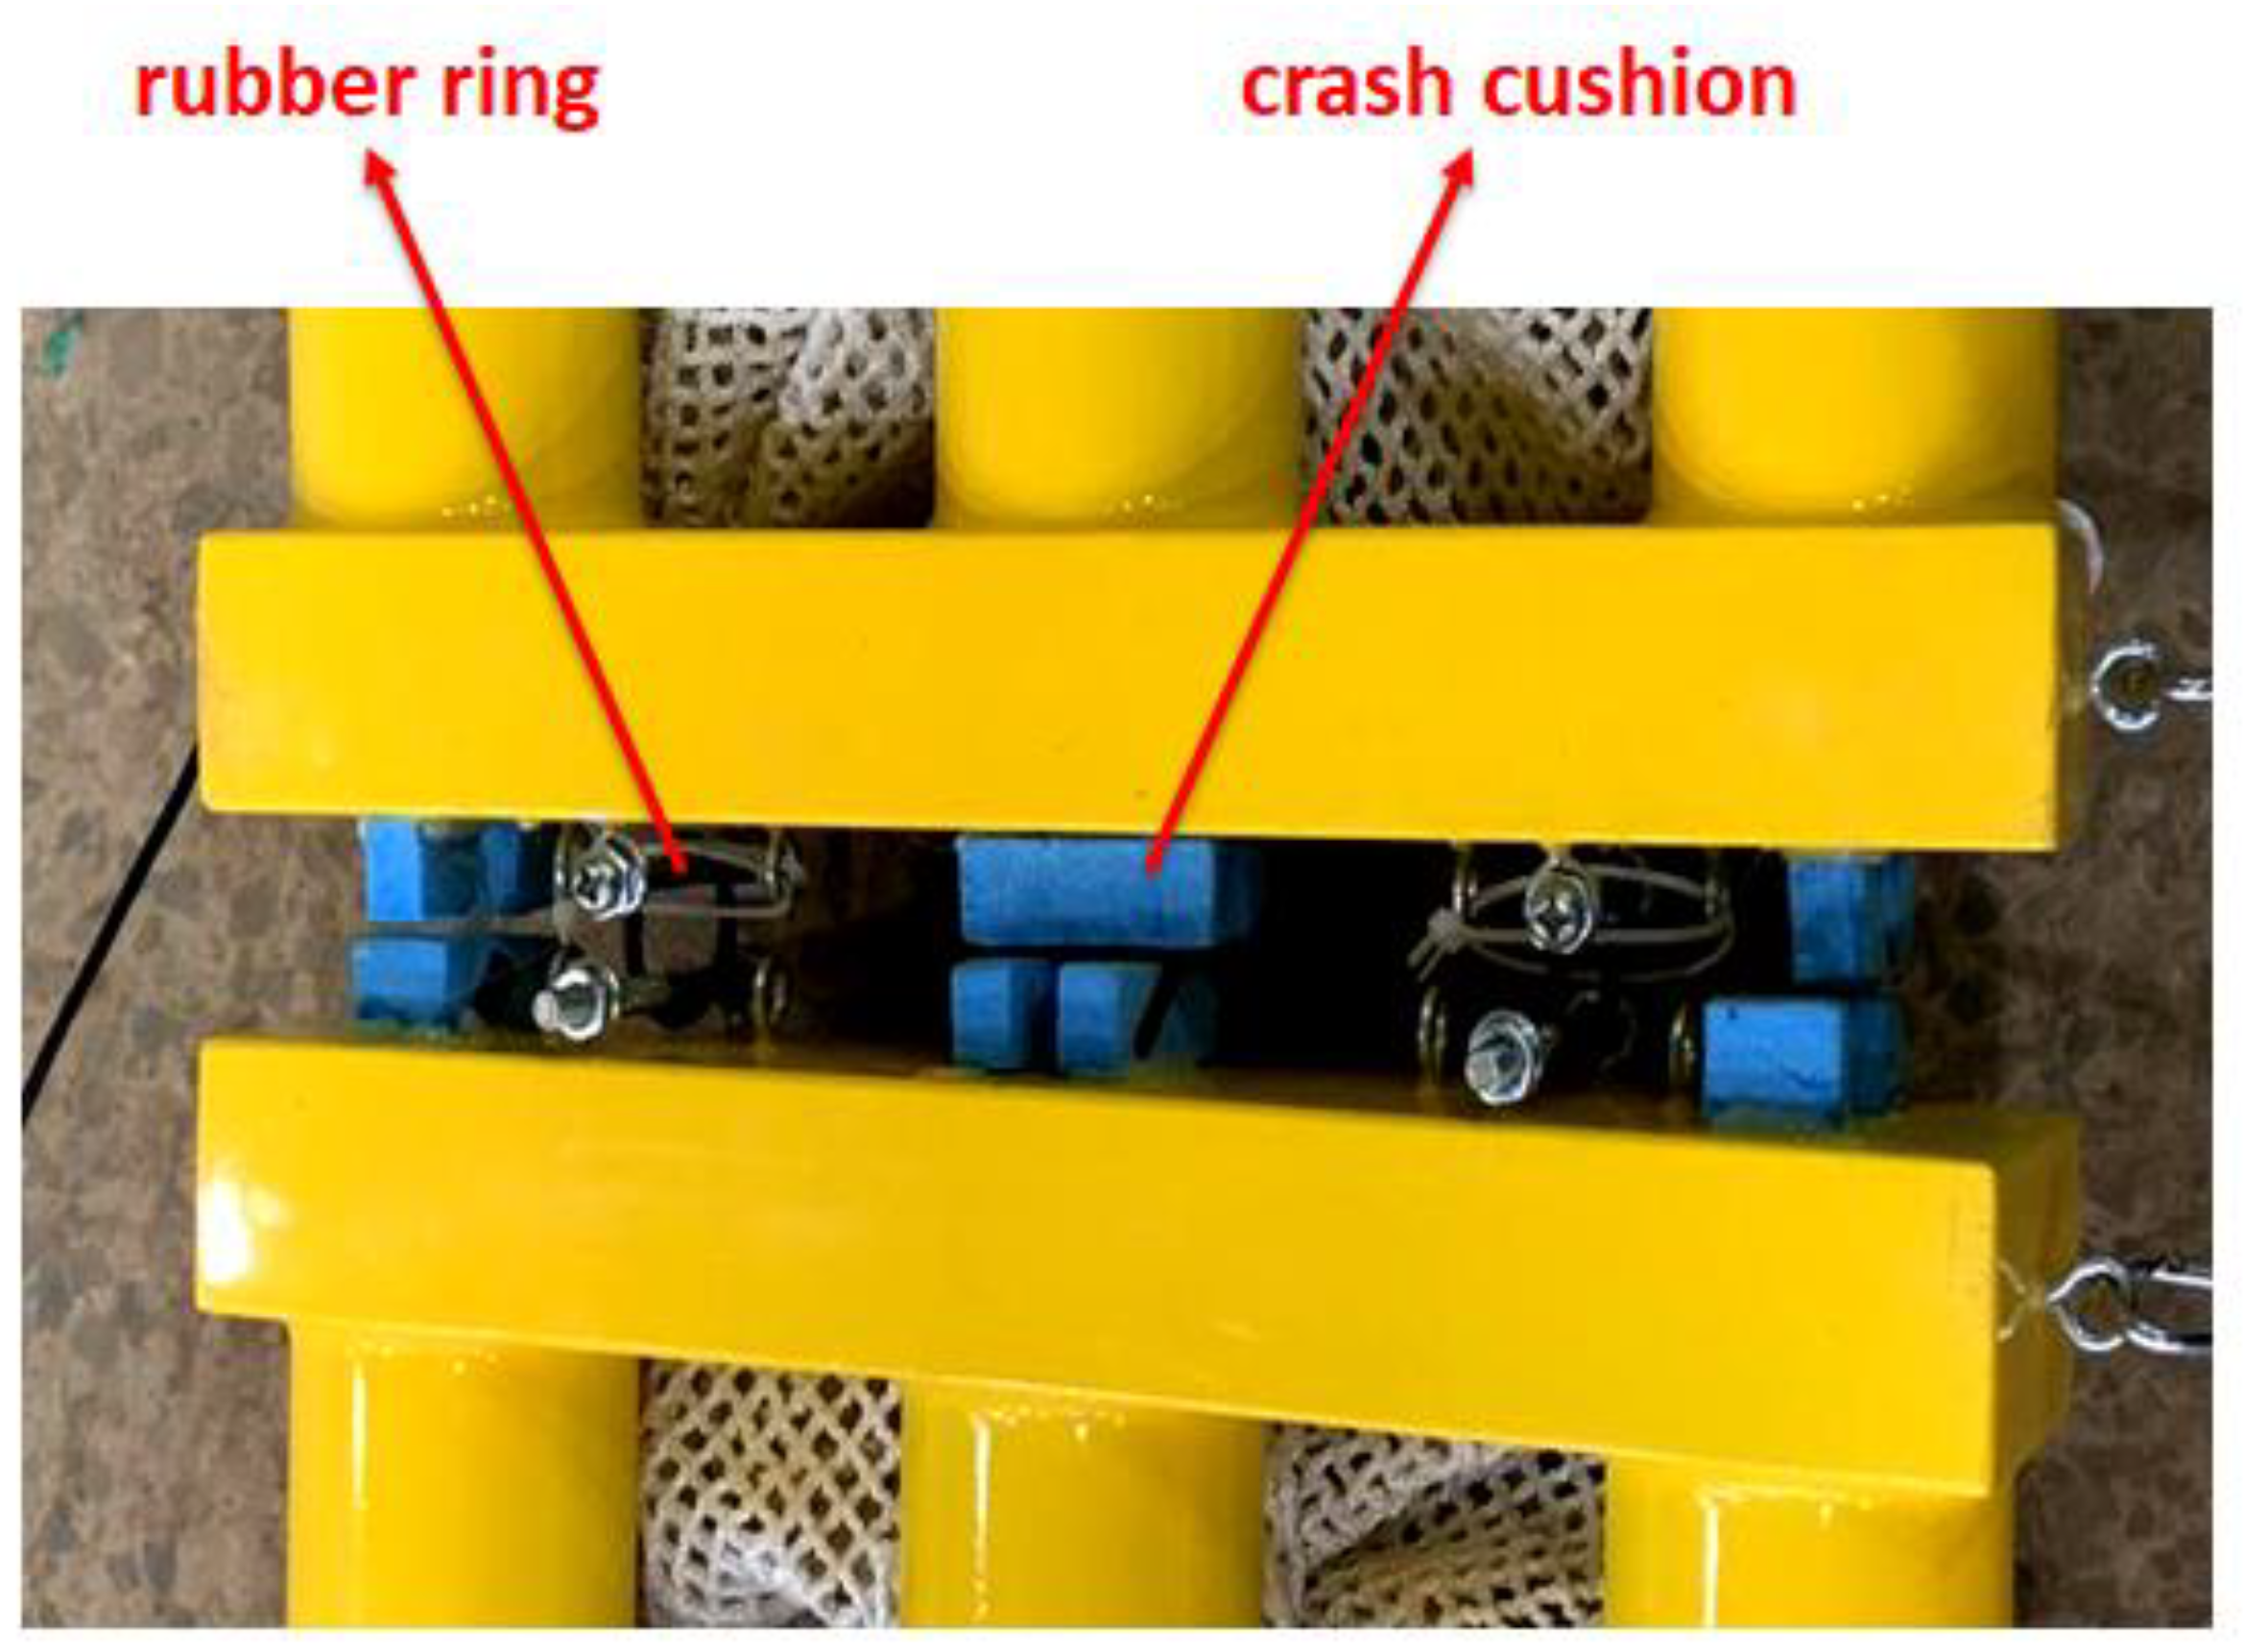
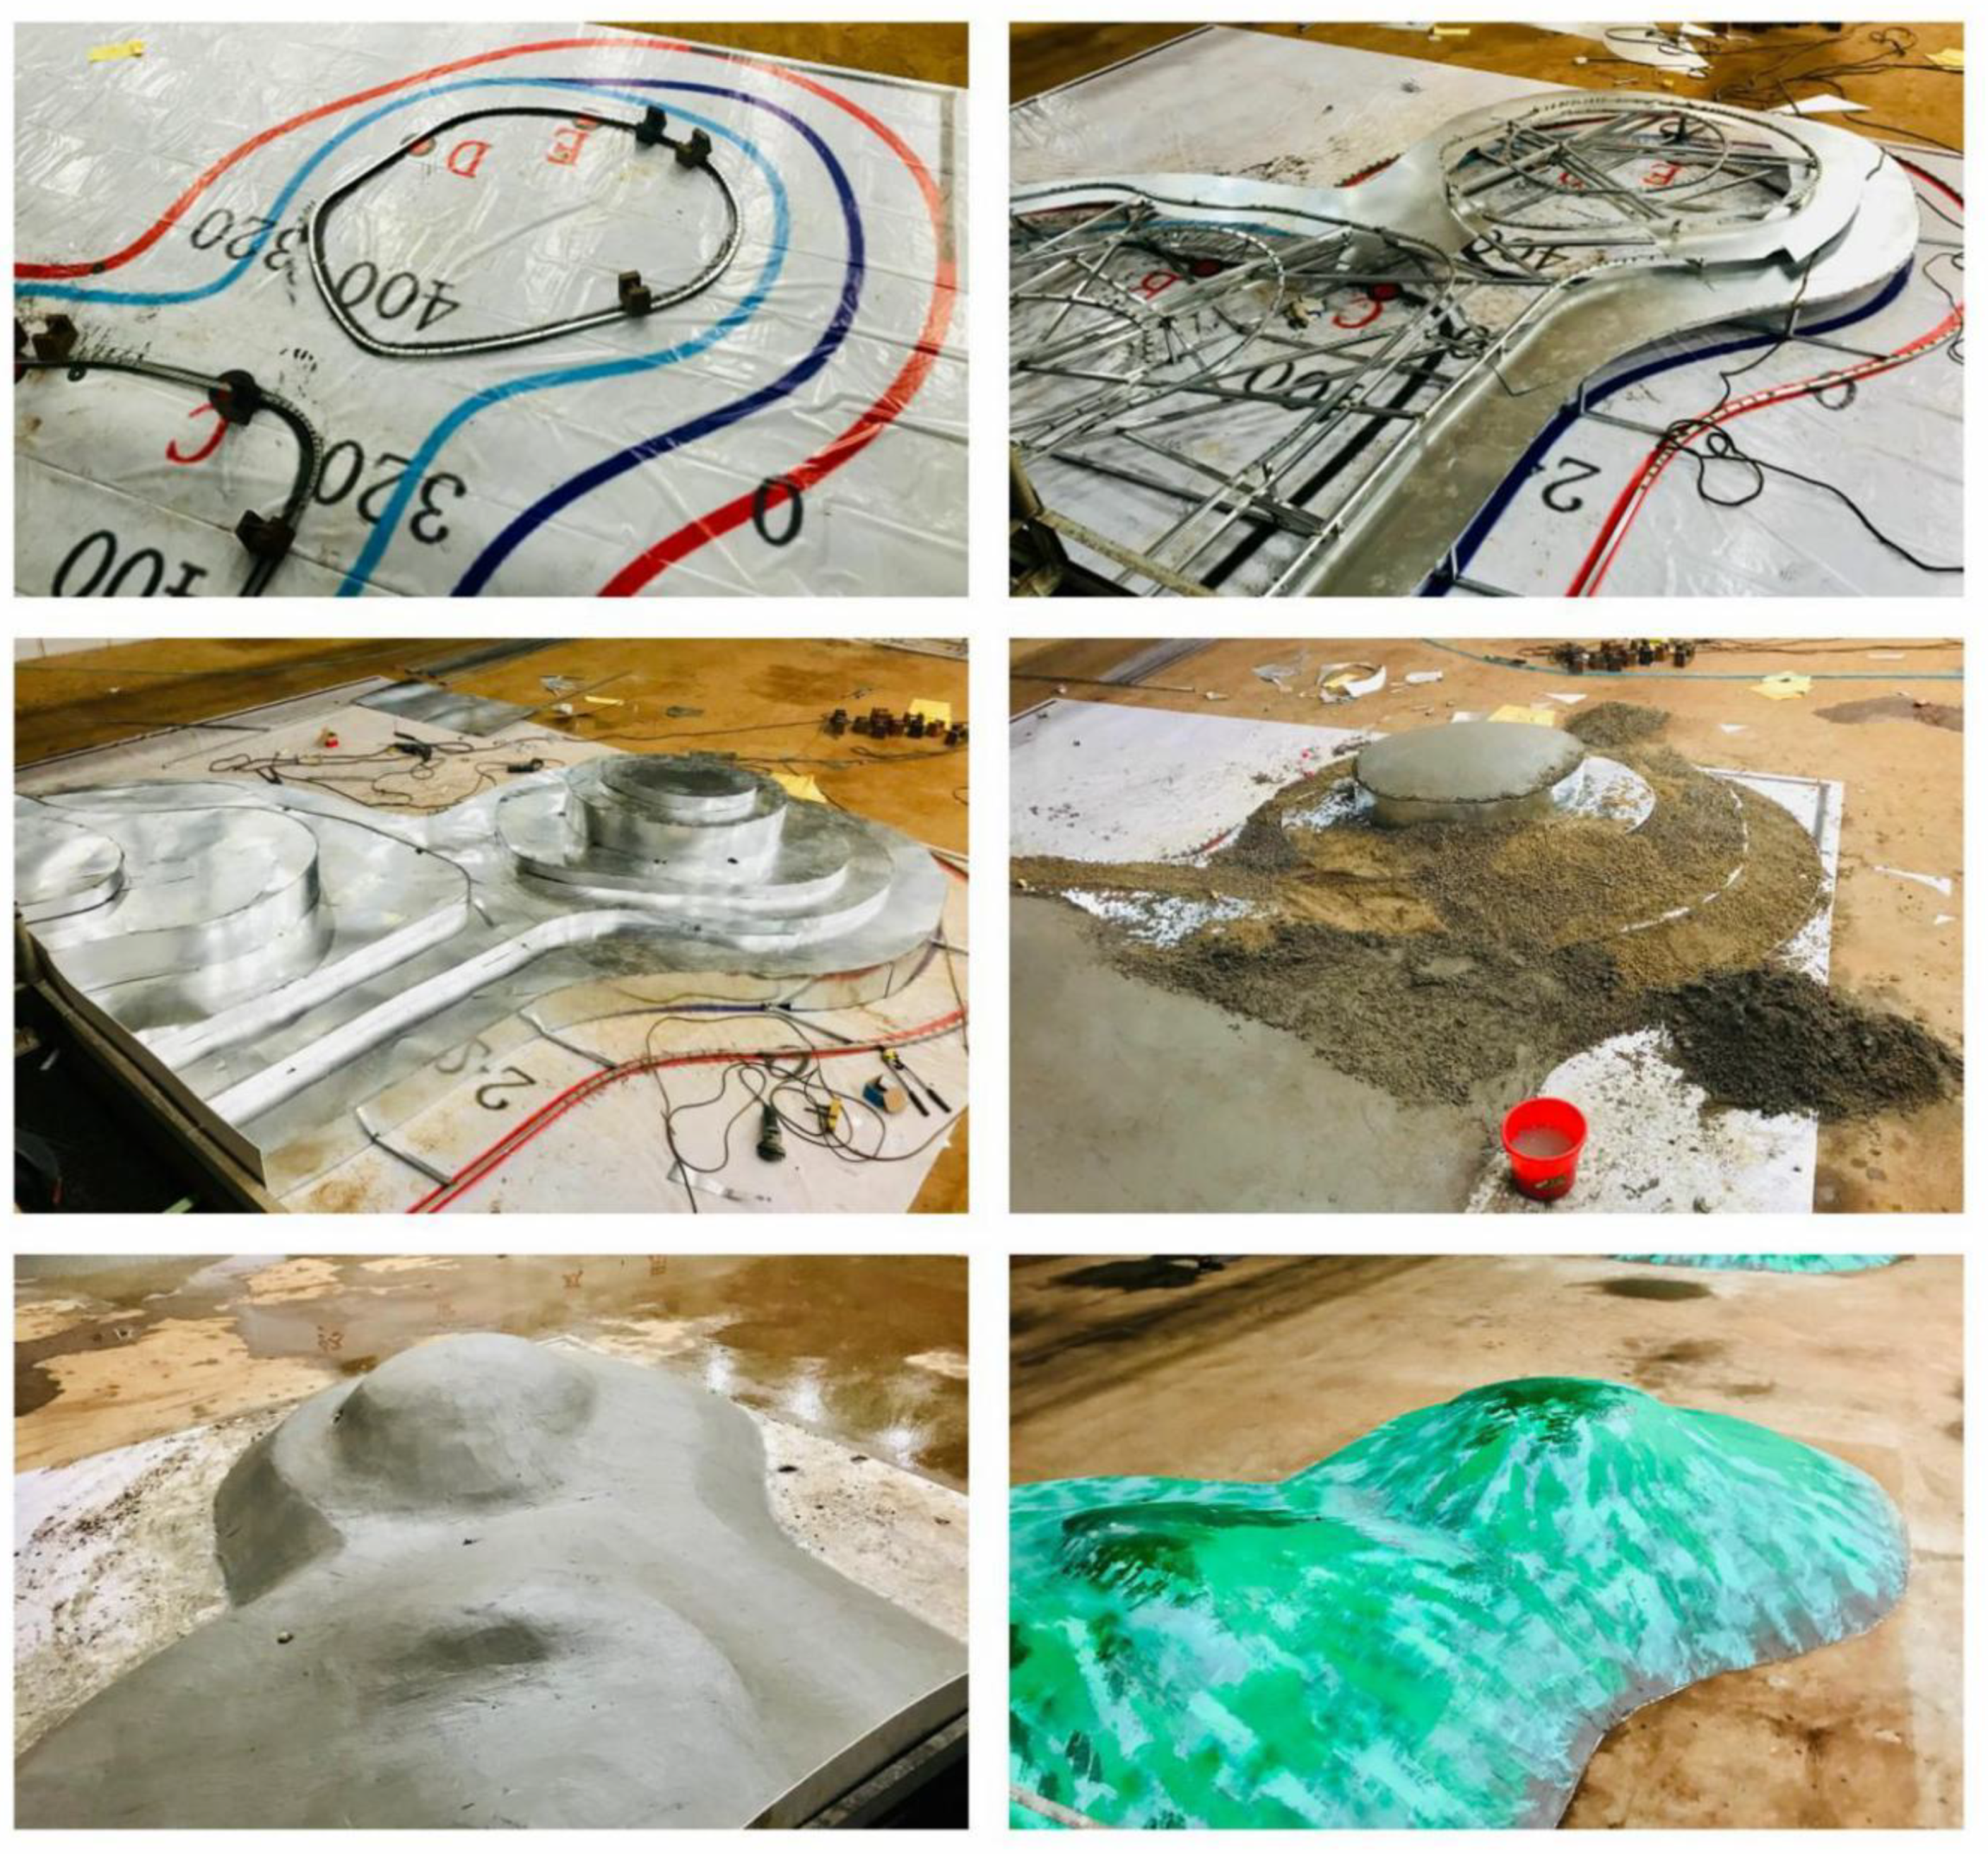
3.3. Experimental Models
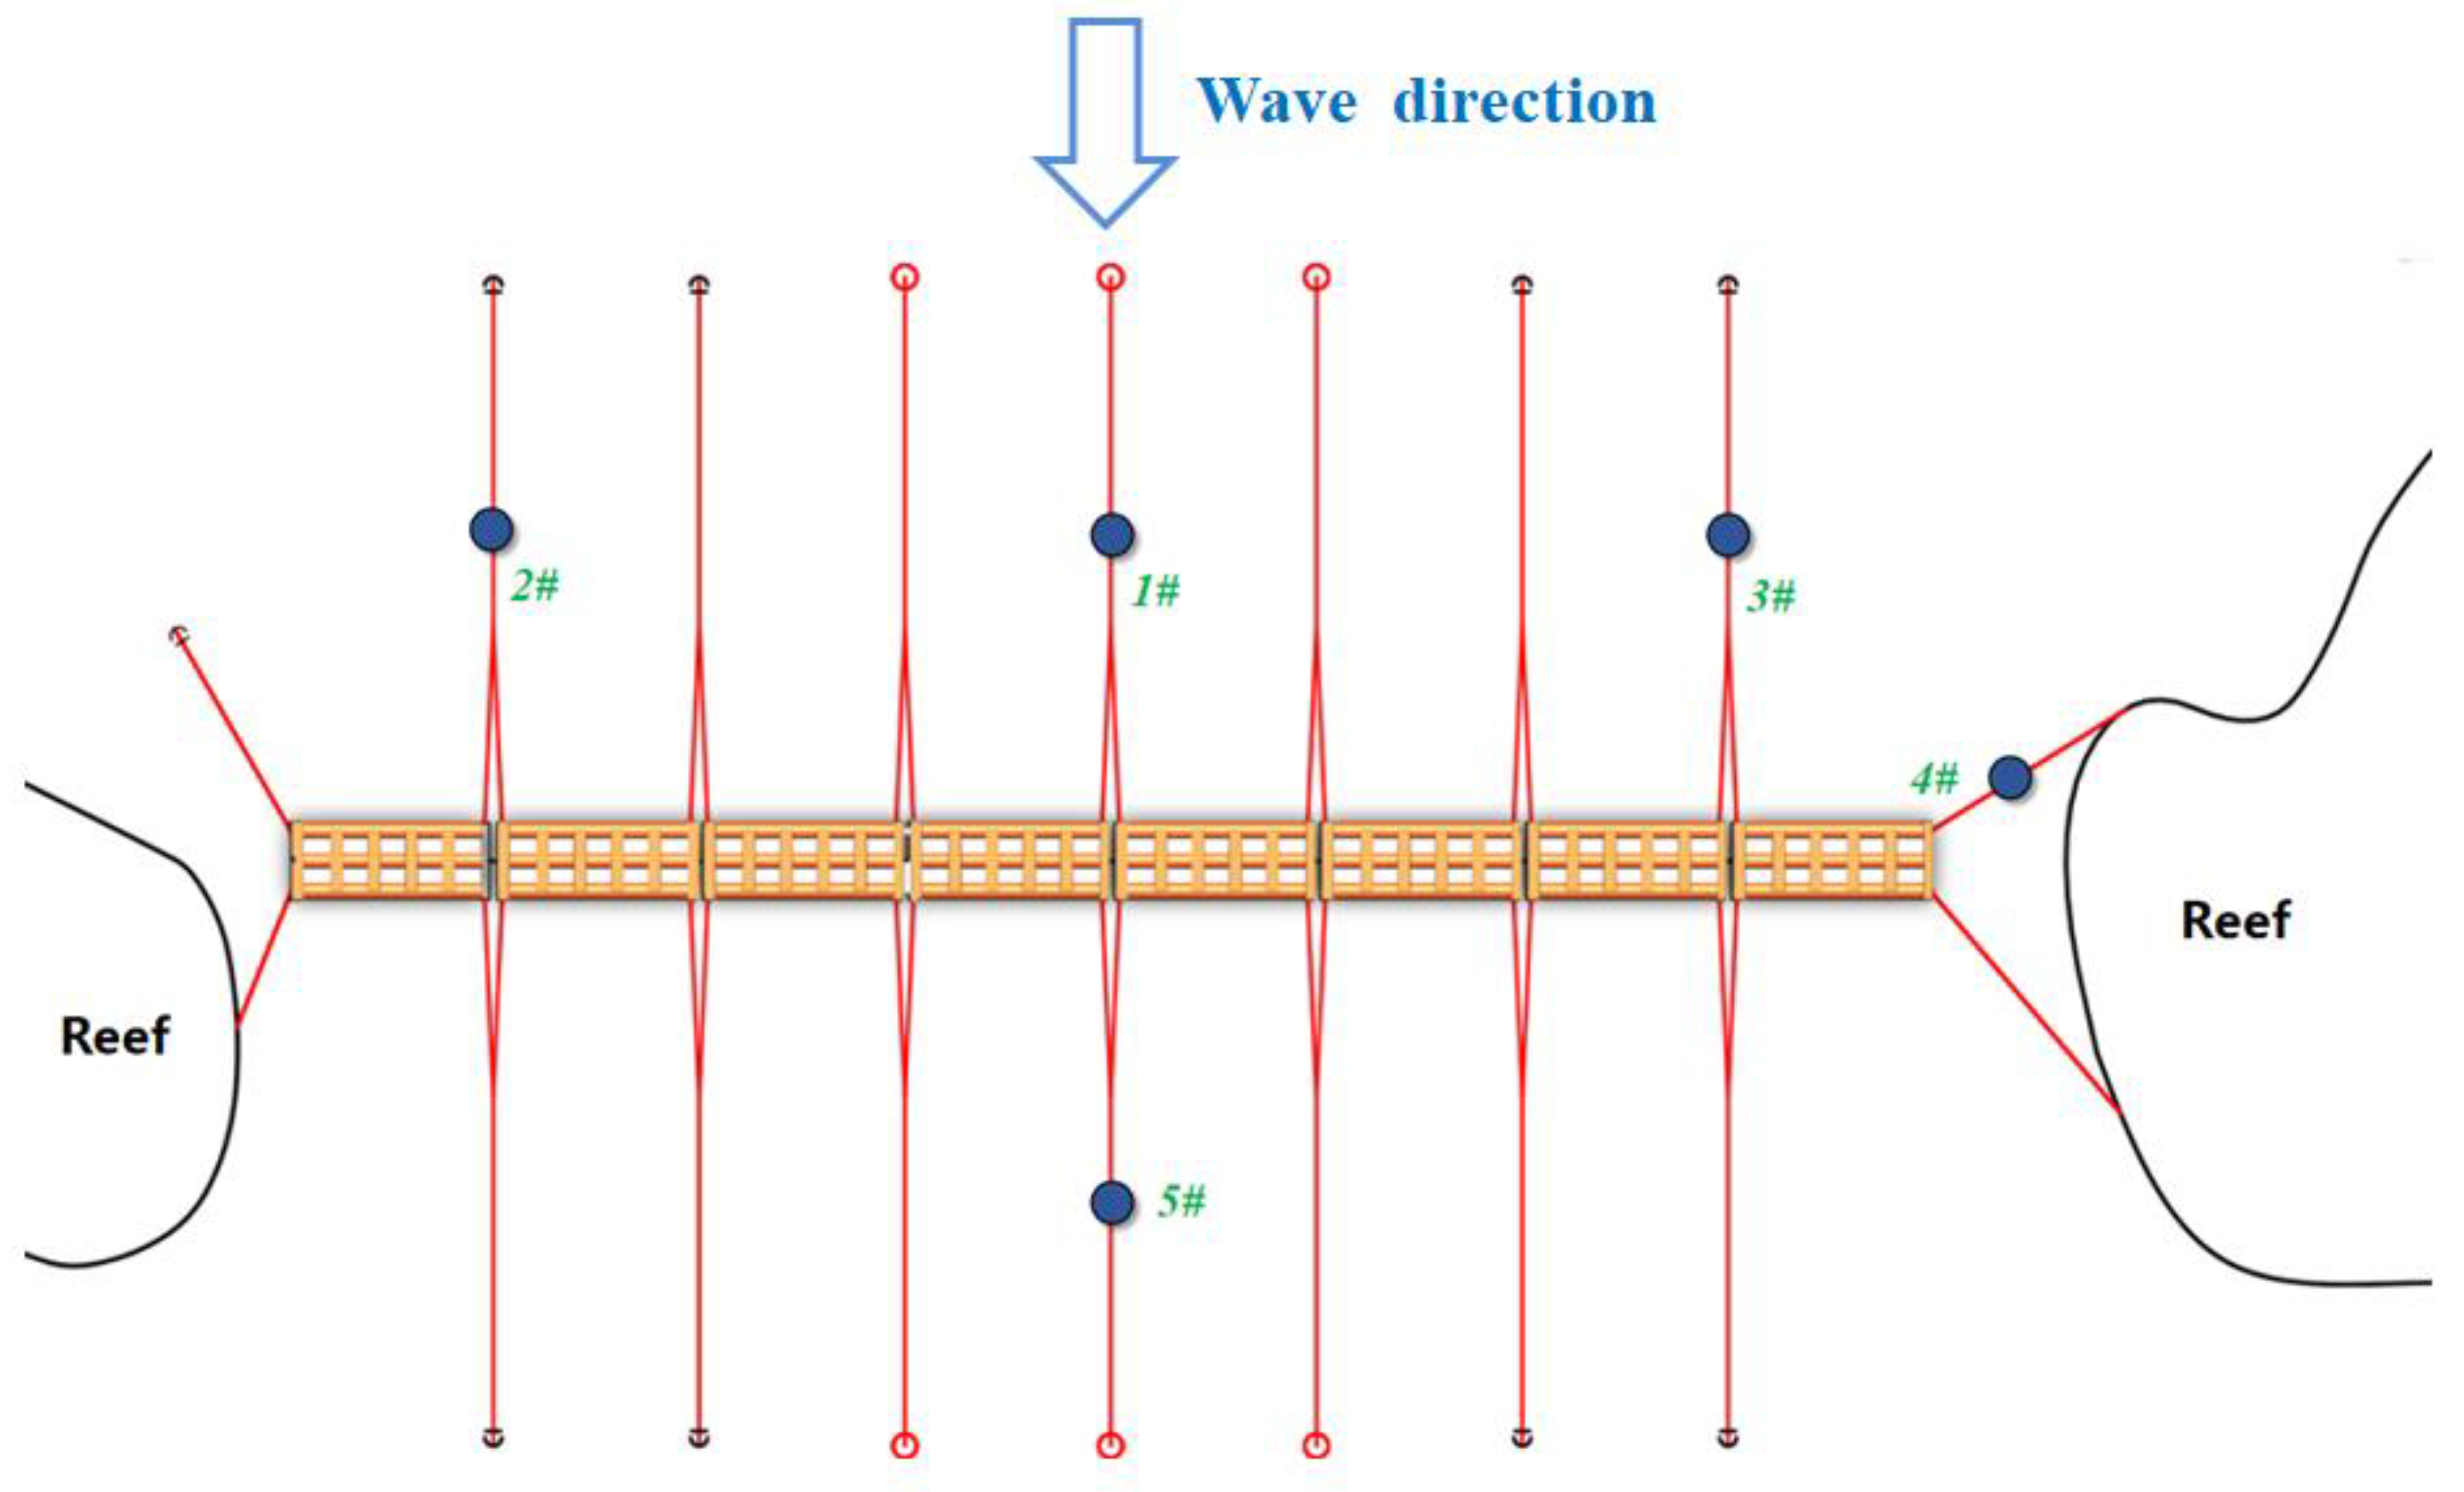
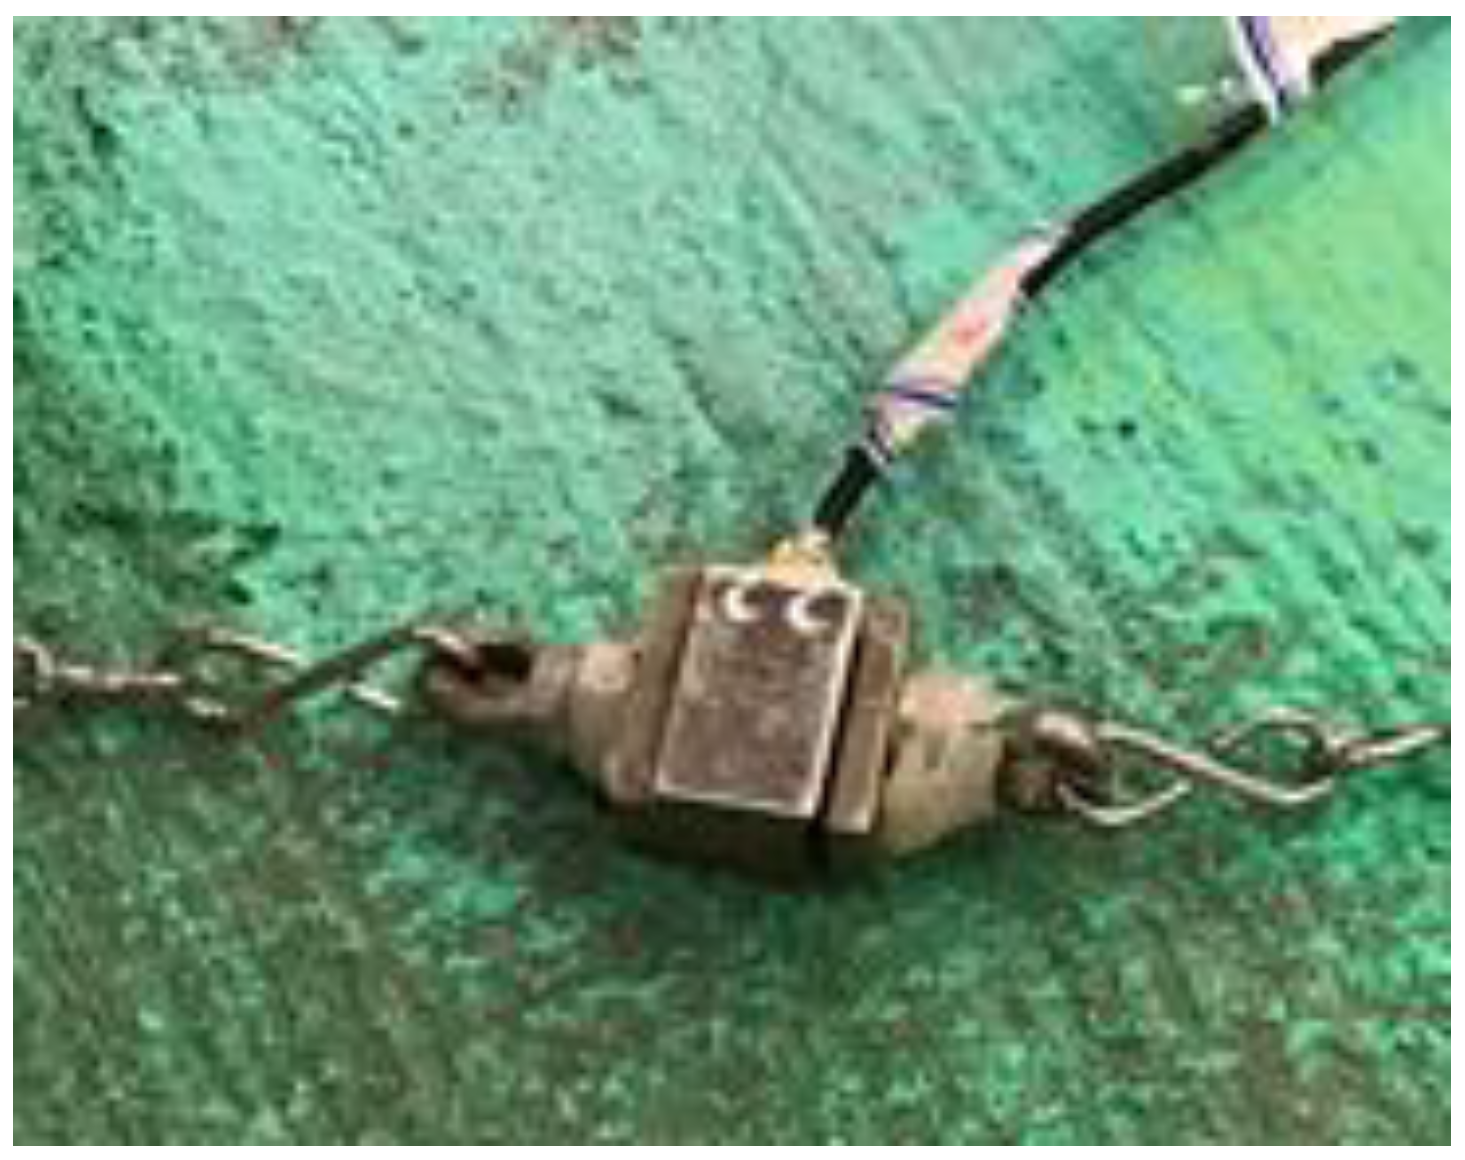
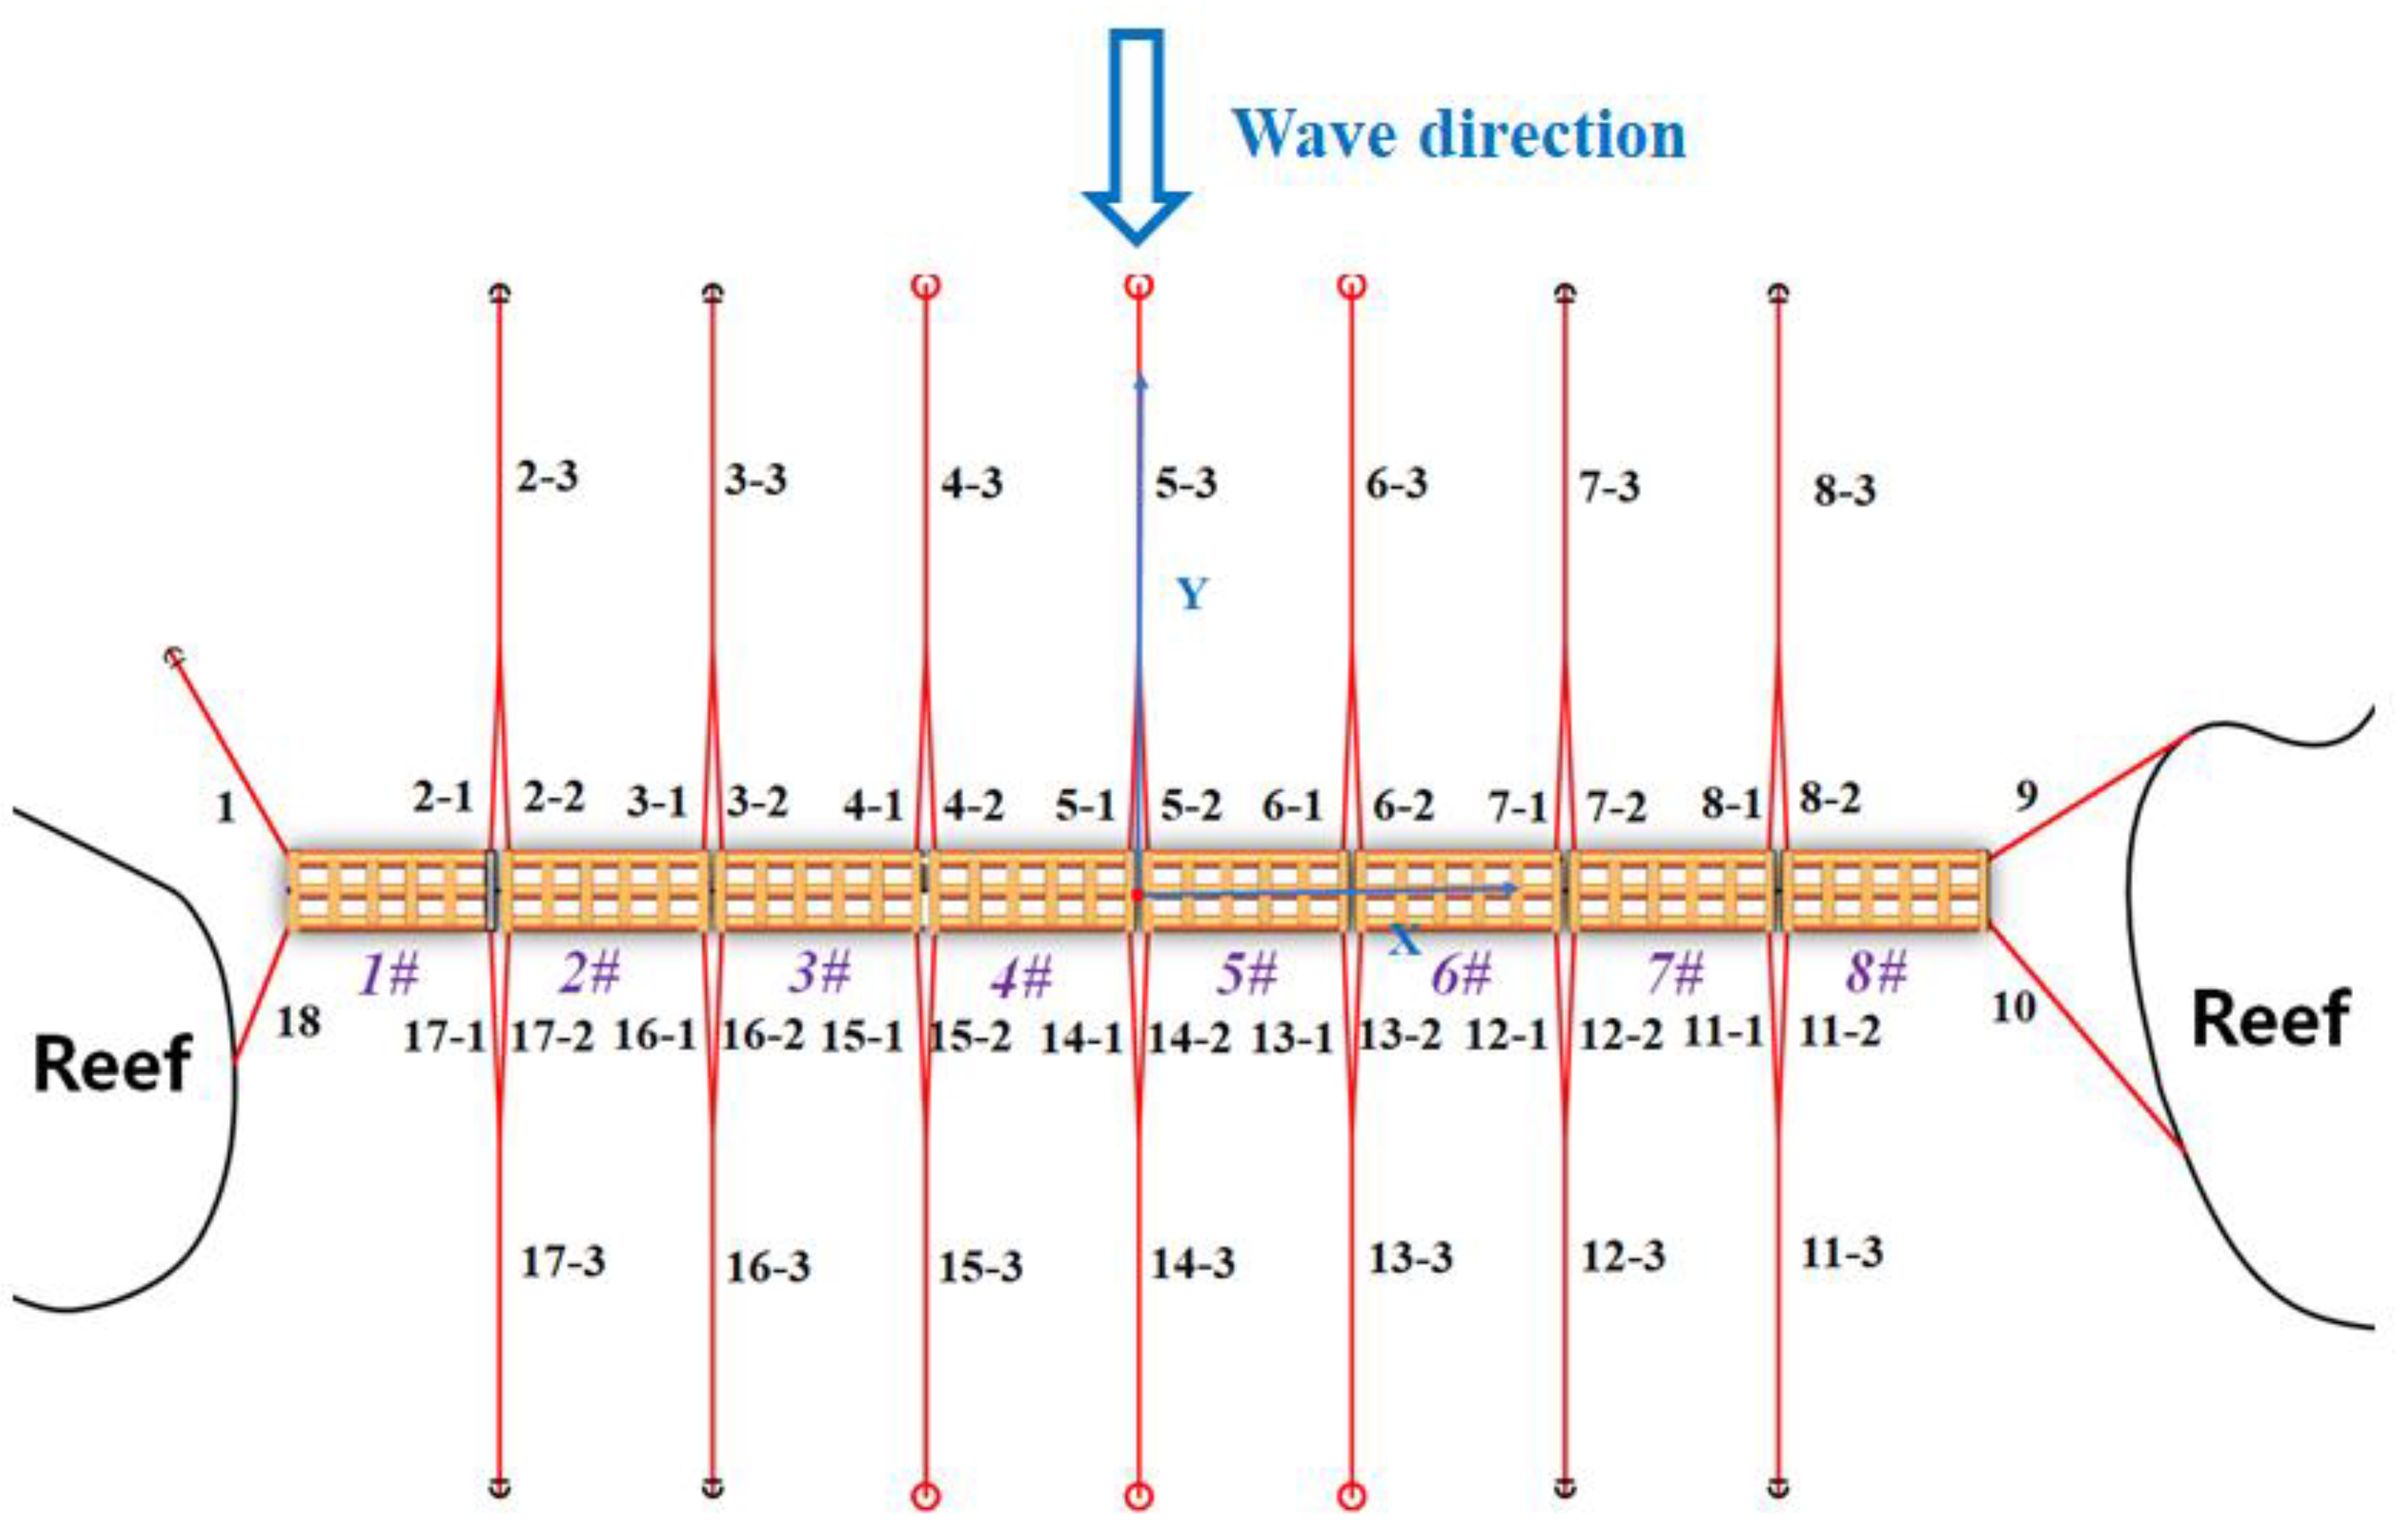
The main parameters of the floating breakwater model are listed in Table 1. The top and front views are shown in Figure 13 and Figure 14. In the model experiment, the simulation of the mesh cage ensures the consistency of the degree of density on the premise of similar material and dimension, that is, the degree of density of model netting was 0.3 kg/m3. The mesh cage model is illustrated in Figure 14.
The floating breakwater system was composed of eight three-cylinder modules. The elastic connectors between every two modules were combined with crash cushions and rubber rings, as shown in Figure 15. Crash cushions were mainly used to withstand the pressure between modules, and the rubber rings were mainly used to withstand the tension between modules.
When waves propagate from deep water to shallow water, influenced by reefs, they undergo a series of complex changes, such as refraction, diffraction, reflection, and fragmentation, and the floating breakwater is often impacted by these evolving waves. To investigate the hydrodynamic performance of a floating breakwater under the influence of reefs, it is necessary to simulate the reefs in the model experiment of the floating breakwater. The reefs in the experiment were simulated according to the bathymetric map of existing reefs in the East China Sea. The construction process and final results are shown in Figure 16 and Figure 17.

3.4. Mooring System

The floating breakwater system was slack-moored in its equilibrium position. In this experiment, we defined the part of the mooring lines connected to the floating breakwater model as the top mooring lines, and the part of the mooring lines connected to the anchor point is considered the bottom mooring lines. The top of the four mooring lines at both ends (including mooring lines 1, 9, 10, and 18) was a polyester cable, and the bottom line was a chain. The rest of the mooring system was a Y-type mooring mode (e.g., Figure 18), with the top two mooring lines (e.g., 2-1 and 2-2) using a polyester cable, and the bottom mooring lines (e.g., 2-3) using a chain. The mooring system layout and number in the experiment are shown in Figure 10, and the mooring line-specific parameters are listed in Table 2 and Table 3. The stiffness of each mooring line was simulated by a spring, and the mooring line and anchorage point models are shown in Figure 18, Figure 19 and Figure 20. The middle water surface of modules 4# and 5# was taken as the origin of the coordinates. The x, y, and z axes were taken along the length direction of the breakwater, parallel to the wave direction, and vertically upward, respectively (as shown in Figure 10). The coordinates of the fairlead and anchorage point of the breakwater are listed in Table 4.

3.5. Experimental Wave Conditions

In order to truly reflect the wave attenuating performance of floating breakwaters under the influence of reef topography, regular wave experiments under different wave heights and periods were conducted. The wave attenuating performance, motion responses, and mooring forces of the floating breakwaters were measured. The wave direction of the regular wave experiments was a regular beam wave (β = 90°). Each wave height contained a combination of different wave periods, as shown in Table 5. The wave direction is shown in Figure 6, and the overall layout of the experiment is shown in Figure 21.

4. Results and Discussions

Based on the wave time-history curves obtained by WGs, the two-point method proposed by Goda and Suzuki [28] was used to separate the incident waves (Ai) from WGs 1–2 and the transmitted waves (At) from WGs 3–4. The transmission coefficient can be obtained by the following formula: K t = A t / A i . Based on the 6-DOF time–history curves of the floating breakwaters, we defined the amplitude of motion as the oscillation amplitude relative to the mean position of the floating breakwater in waves, for example, sway amplitude = (maximum sway amplitude − minimum sway amplitude)/2. Based on the time–history curve of the mooring forces, we obtained the peak mooring forces under each working condition.

4.1. Wave Transmission Coefficients

Figure 22 shows the wave transmission coefficients of floating breakwaters when the incident wave height H = 0.03 m, H = 0.05 m, and H = 0.10 m, respectively. As can be seen from the figure, the transmission coefficients increase with the increase in the period (except the working condition that the wave height is 0.03 m and the period is 1.1 s) and decreases with the increase in wave height (except the working condition, in which the periods are 0.9 and 1.1 s). When T < 0.9 s, the wave attenuating effect is significant, reaching more than 40%. When the period T ≥ 1.0 s, the wave attenuating effect is poor, approximately 20%. This is due to the coupling effect between the waves, reefs, and floating breakwaters. The existence of reefs will cause a wave aggregation effect, and at the same time, it will reflect the aggregation wave, and then produce a strong nonlinear interference phenomenon, as shown in Figure 23. In addition, the floating breakwaters were arranged between the two reefs, and the interaction between the reefs and the floating breakwaters was particularly significant, resulting in a very chaotic wave field around the floating breakwaters and the reefs. All these factors weaken the effect of the wave attenuation.

4.2. Motion Responses

To investigate the motion responses of the floating breakwaters in a real reef environment, the 6-DOF motion responses of the floating breakwaters in beam waves (β = 90°) were measured, and the results are shown in Figure 24, Figure 25, Figure 26, Figure 27, Figure 28 and Figure 29.
Figure 24, Figure 25, Figure 26, Figure 27, Figure 28 and Figure 29 show the changing curves of the motion responses of the floating breakwaters, including surge, sway, heave, roll, pitch, and yaw. As can be seen from the figures, as a whole, the motion responses of the floating breakwaters gradually increase with the increase in wave height and period.
As shown in Figure 25, Figure 26 and Figure 27, owing to the shallow water of the offshore reef area, the motion responses of the three main stress directions (sway, heave, and roll) of the floating breakwaters increased significantly with the increase in wave height owing to the shallow water effect.
As shown in Figure 24 and Figure 28, the floating breakwaters produced a certain amount of heave and pitch motions. The waves produce longitudinal waves along the length of the floating breakwaters owing to the reflection effect of the reefs. Figure 29 shows that the yaw motion of the floating breakwater is small, which is due to the joint action of the connectors and the mooring system to constrain the yaw motion.
As shown in Figure 24 and Figure 26, the floating breakwaters produce heave motion under the influence of reflected waves from the reefs, and the heave motion of the floating breakwater itself is larger. Therefore, in the process of designing floating breakwaters in the reef area, it is necessary to prevent collisions and bottoming between the ends of the floating breakwaters and the reefs during the breakwater movement.
As shown in Figure 24, Figure 25, Figure 26, Figure 27, Figure 28 and Figure 29, the overall motion performance of the floating breakwater system is good under the dual action of the shallow water effect and reefs reflection waves. According to Ji et al. [11], the existence of netting increases the additional mass, damping, and moment of inertia of the system, so that the motion responses of the floating breakwaters are better.

4.3. Mooring Forces

To investigate the variations in the mooring forces of the floating breakwater system in a real reef environment, the mooring forces of the floating breakwater system in beam waves (β = 90°) were measured. There were five measuring points in the experimental process (as shown in Figure 8), among which three measuring points (No.1, No.2, and No.3) were on the windward side. They were located at the two ends and the middle position of the breakwater. The No.5 measuring point on the leeward side was located in the middle position of the floating breakwater system. The No.4 measuring point on the reefs was located on the windward side. The specific results of the peak mooring forces are shown in Figure 30, Figure 31, Figure 32, Figure 33 and Figure 34.
Figure 30, Figure 31, Figure 32, Figure 33 and Figure 34 reveal the changing curves of peak mooring forces with varying wave period as the incident wave height is 0.03, 0.05, and 0.10 m. As can be seen from Figure 30, Figure 31, Figure 32, Figure 33 and Figure 34, the peak mooring forces increase gradually with the increase in wave height on the whole, and the peak mooring forces have no obvious relationship with the wave period and tend to be stable overall.
As shown in Figure 30, Figure 31 and Figure 32, at large wave height (H = 0.1 m), the mooring line 1# has the largest force among the measured mooring lines on the windward side. This is because mooring line 1# is located in the middle position of the floating breakwater system composed of eight modules, where the waves reflected from both sides of the reefs gather and superimpose the most.
As shown in Figure 33, the angle between the 4# mooring line direction and the beam wave (β = 90°) is large. Under the action of the beam waves (β = 90°), the peak mooring force of the 4# mooring line should be smaller in theory, but in fact, it is close to that of the adjacent 2# mooring line. This is because the anchorage point of a mooring line 4# is located on the reefs, and the length of the mooring line is shorter than that of mooring line 2#. The mooring radius is smaller, and the stiffness of the mooring line is larger, which leads to a larger stress on the mooring line. Therefore, in the design process of the mooring system of floating breakwaters under the influence of reefs, attention should be paid to the mooring lines at the reefs to prevent breakage caused by excessive forces.
As shown in Figure 30, Figure 31, Figure 32, Figure 33 and Figure 34, the 1#, 2#, and 3# peak mooring forces are obviously greater than the 5# peak mooring force, indicating that the peak mooring force on the windward side is greater than that on the leeward side. Measuring point # 5 belongs to the leeward region, and its value and fluctuation are small, which was consistent with the actual sea conditions.

5. Conclusions

In this study, we conducted a 3D experiment to investigate the hydrodynamic performance of a multi-module three-cylinder floating breakwater system under the influence of reefs. The wave transmission coefficient, motion response, and mooring force were measured. The following conclusions can be drawn from the results of the experiment.
(1)
In the beam wave (β = 90°) conditions, the floating breakwaters exhibit remarkable wave attenuating performance in short-period waves (T < 0.9 s). Owing to the multiple coupling nonlinear interference of waves, reefs, and floating breakwaters, waves will produce an aggregation effect and a reflection effect, so the wave attenuating performance in long-period waves (T ≥ 1.0 s) was mediocre.
(2)
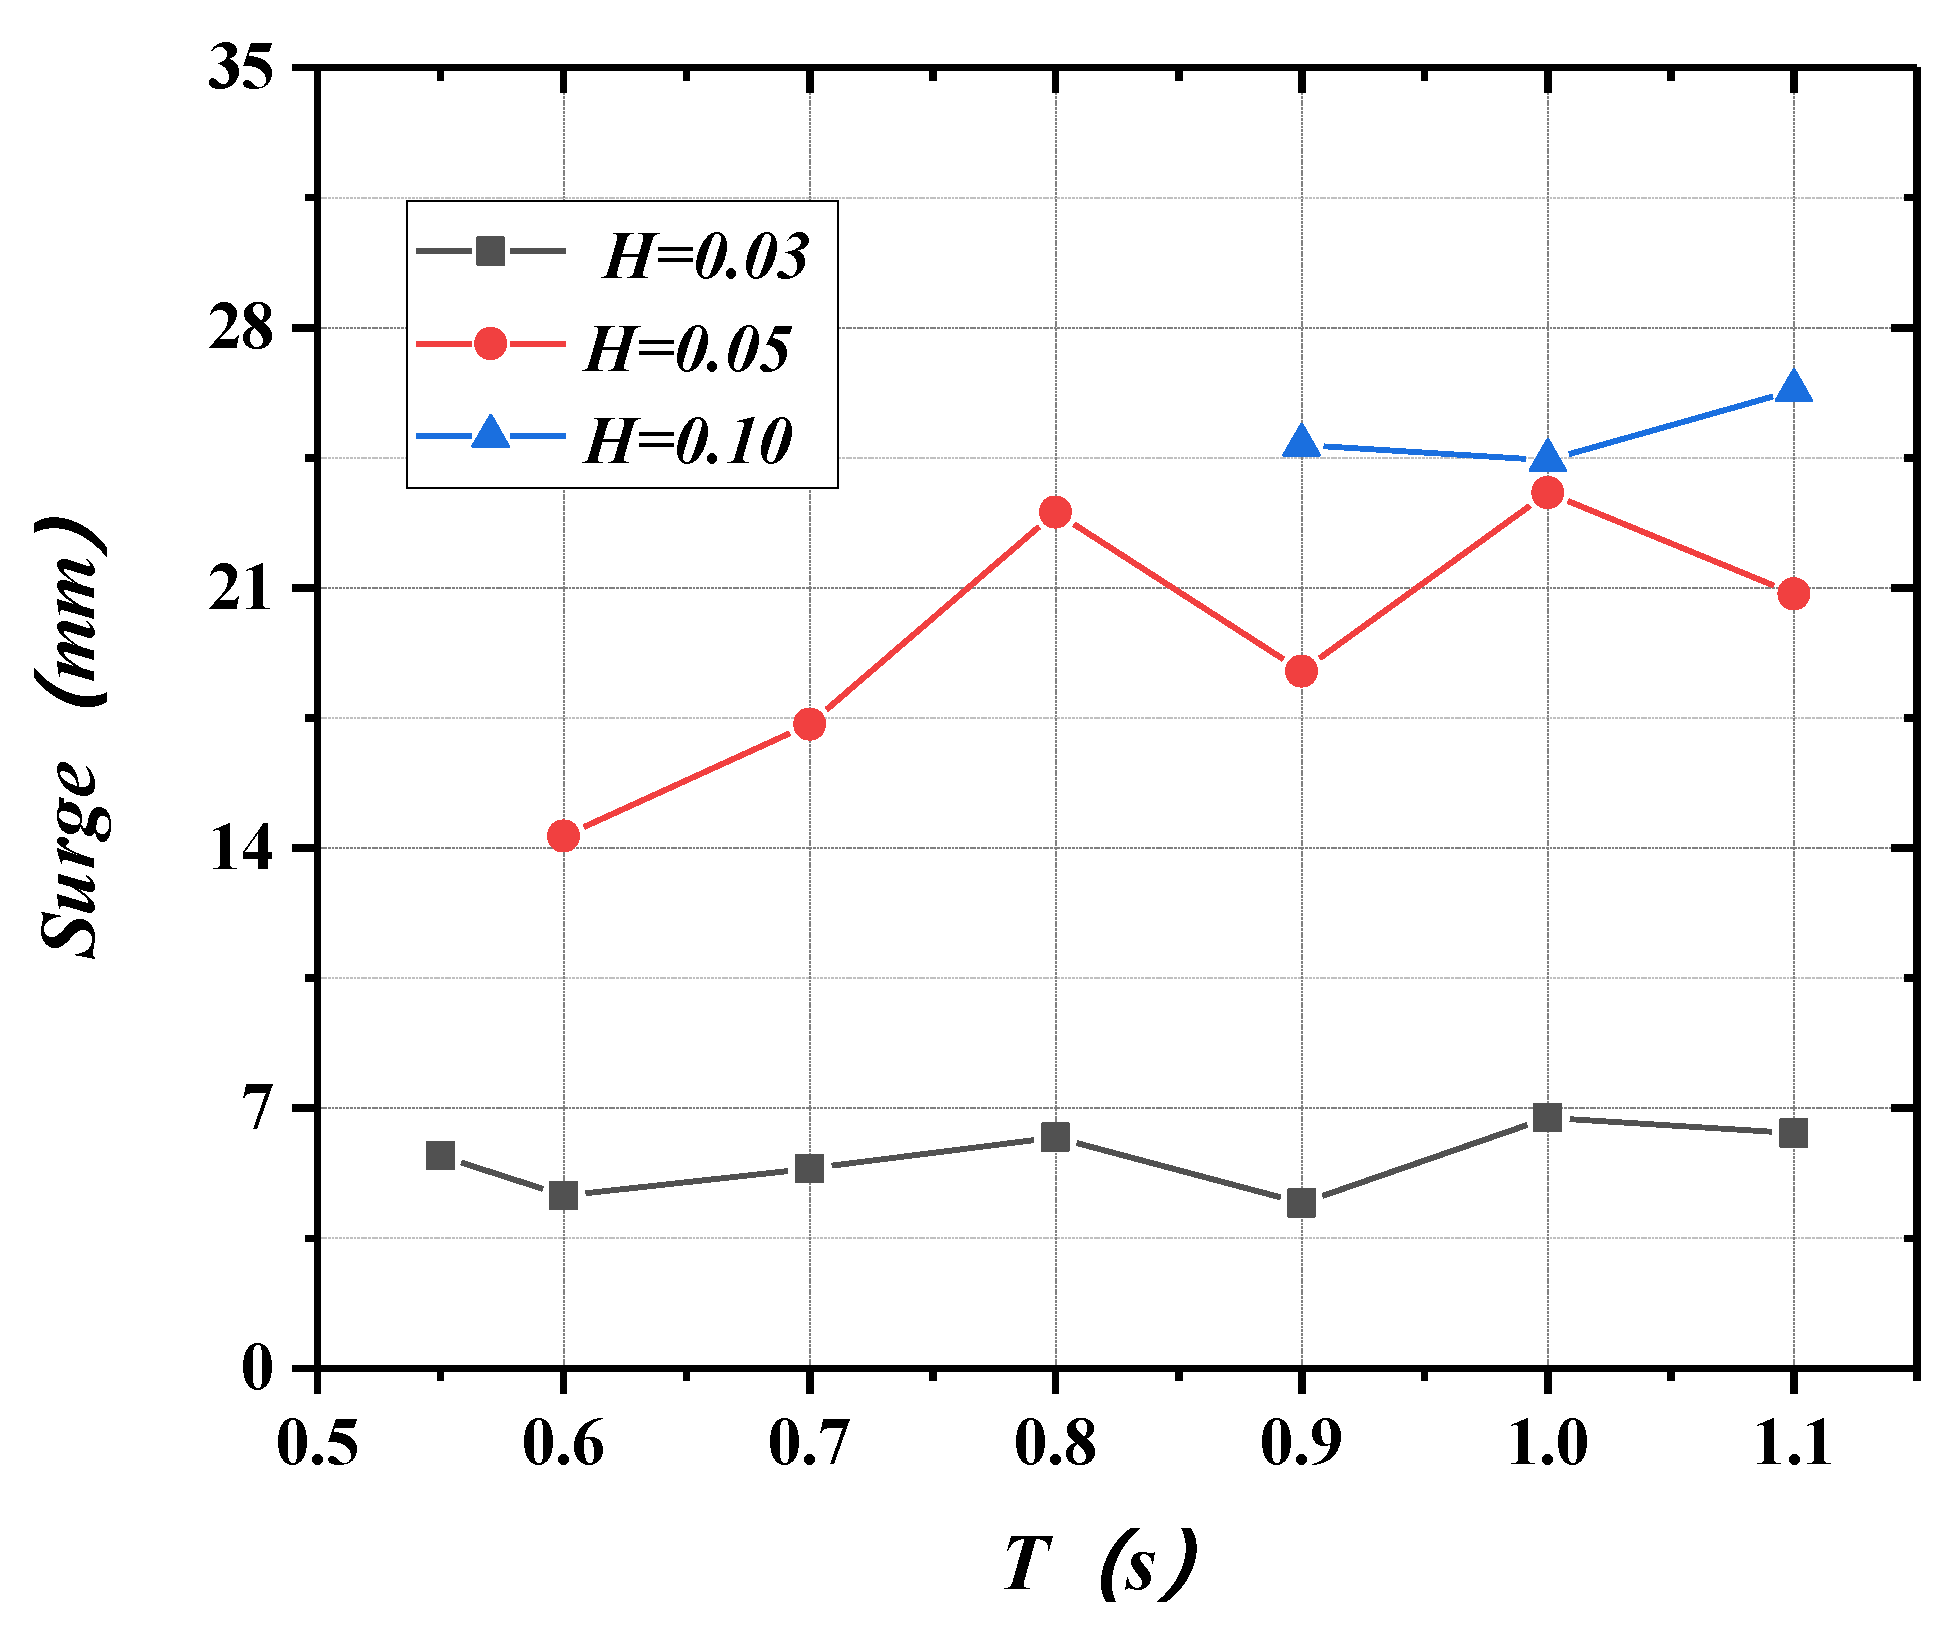
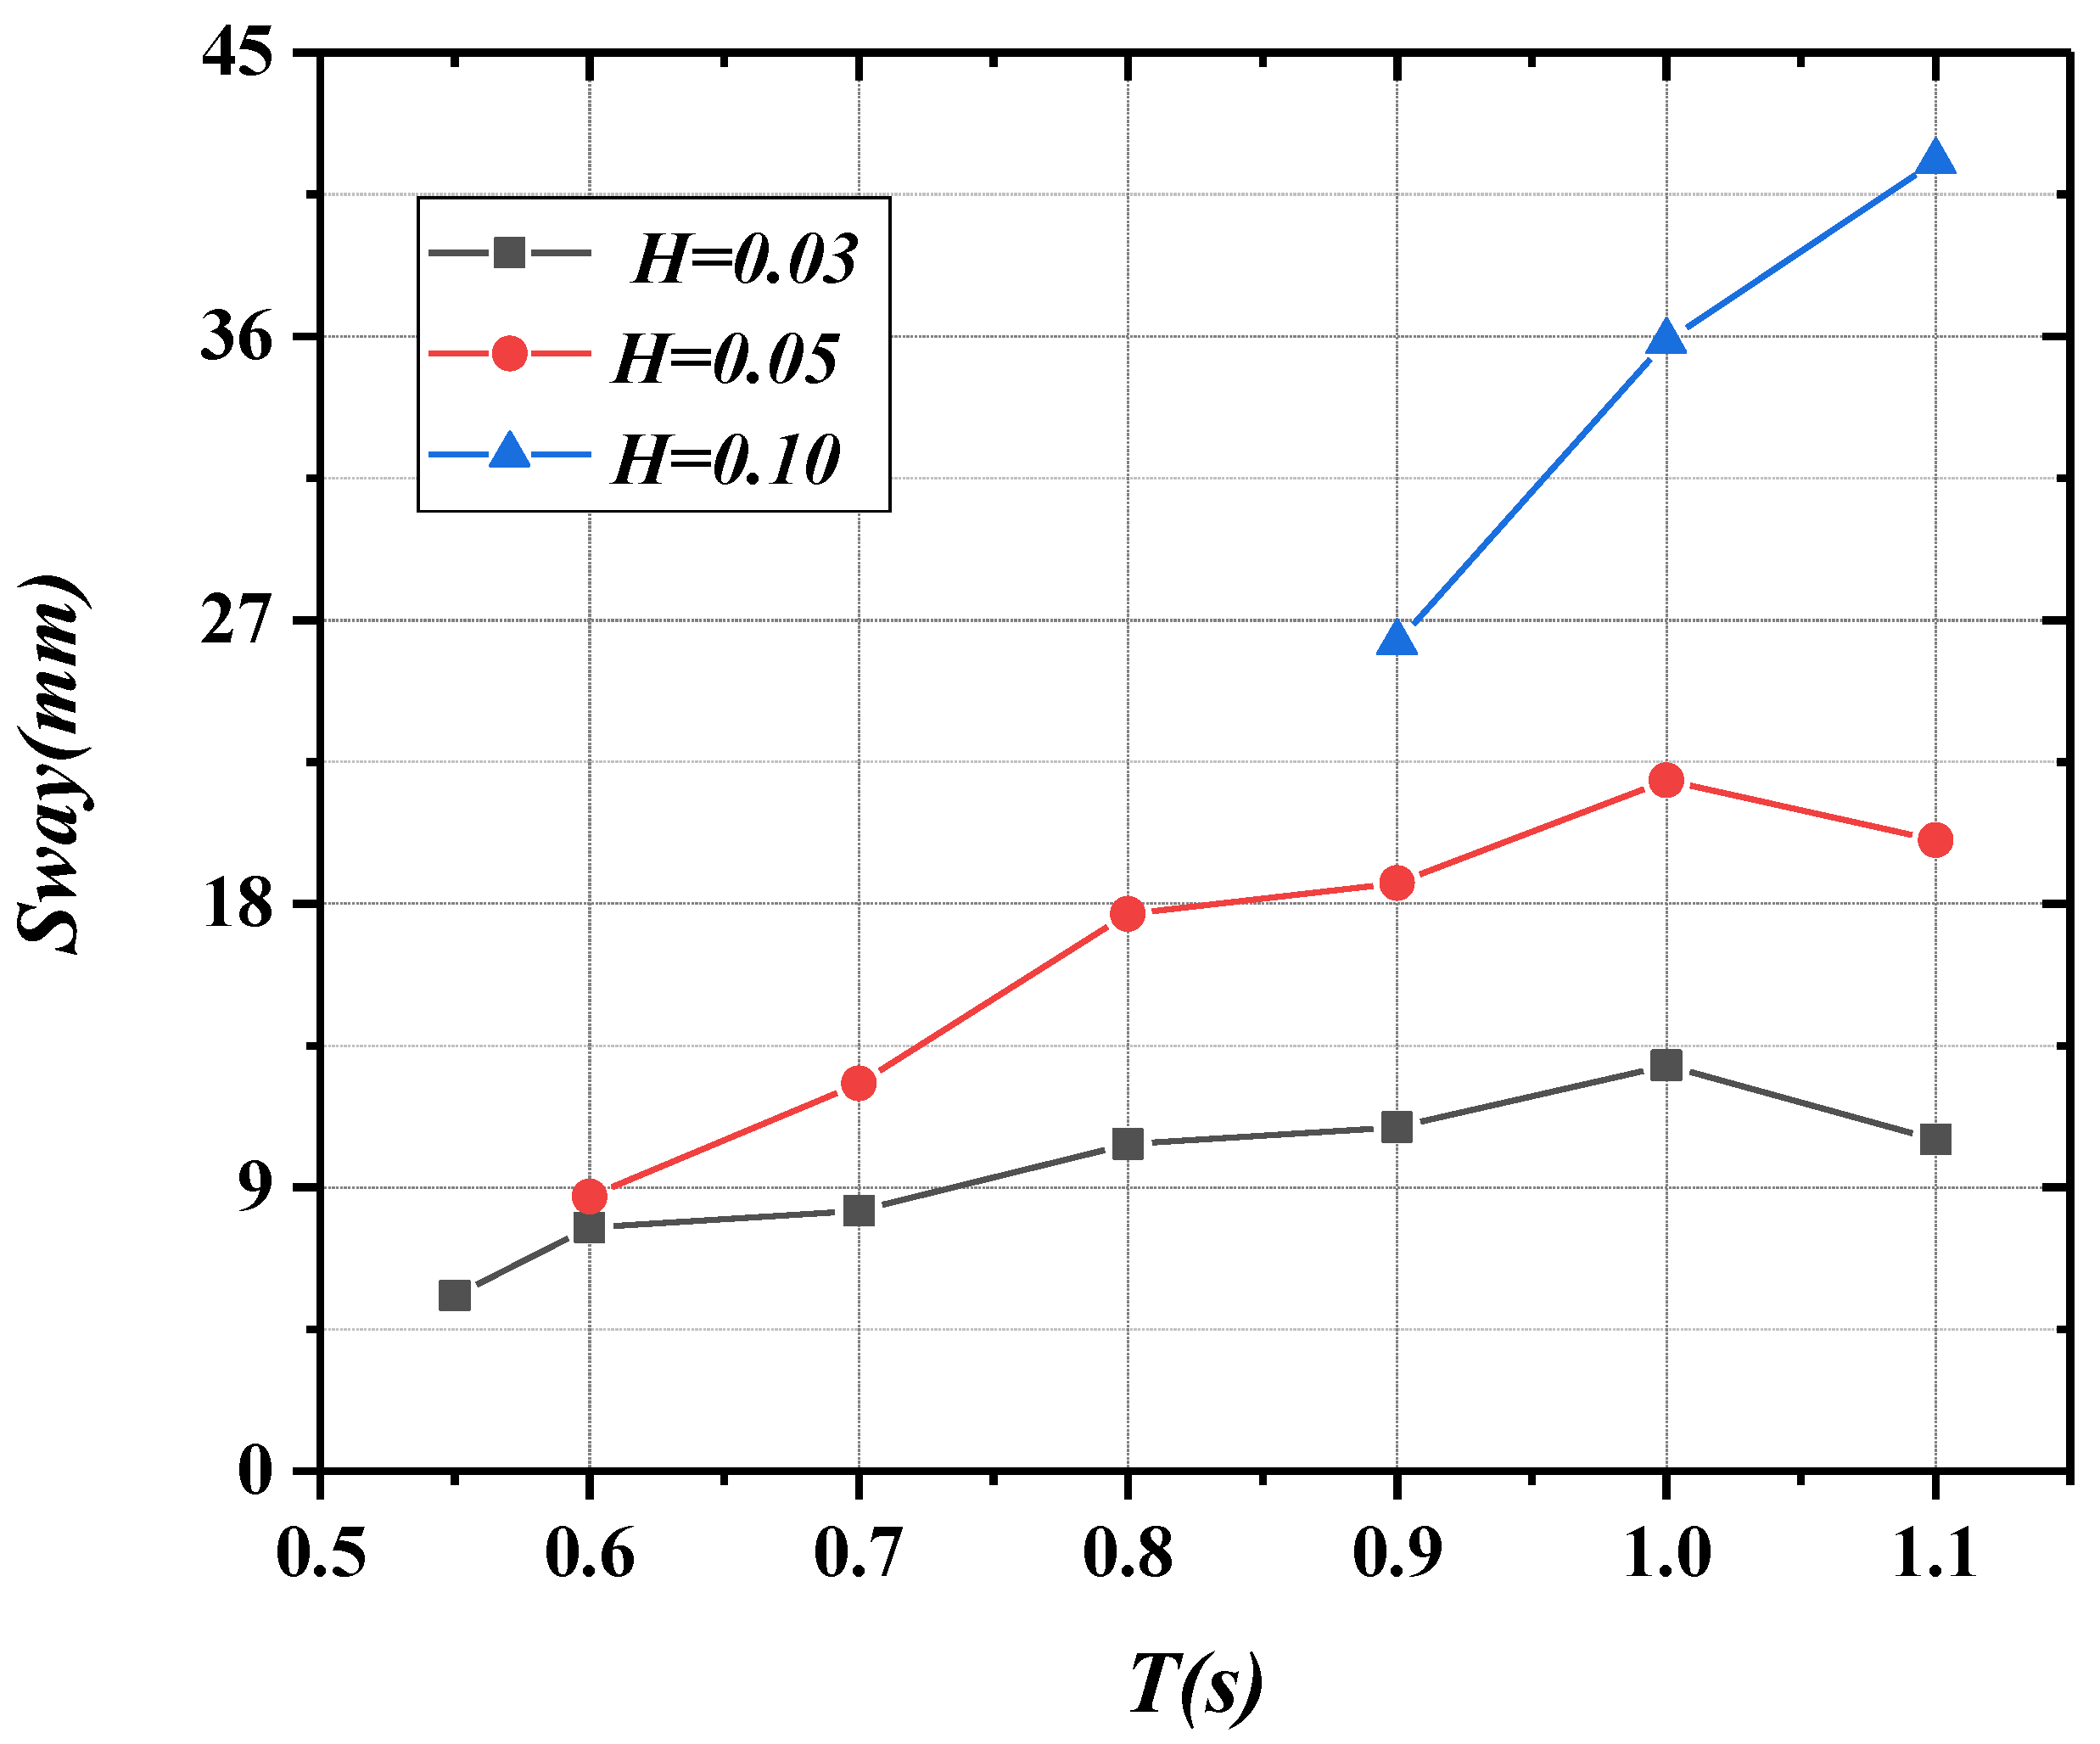
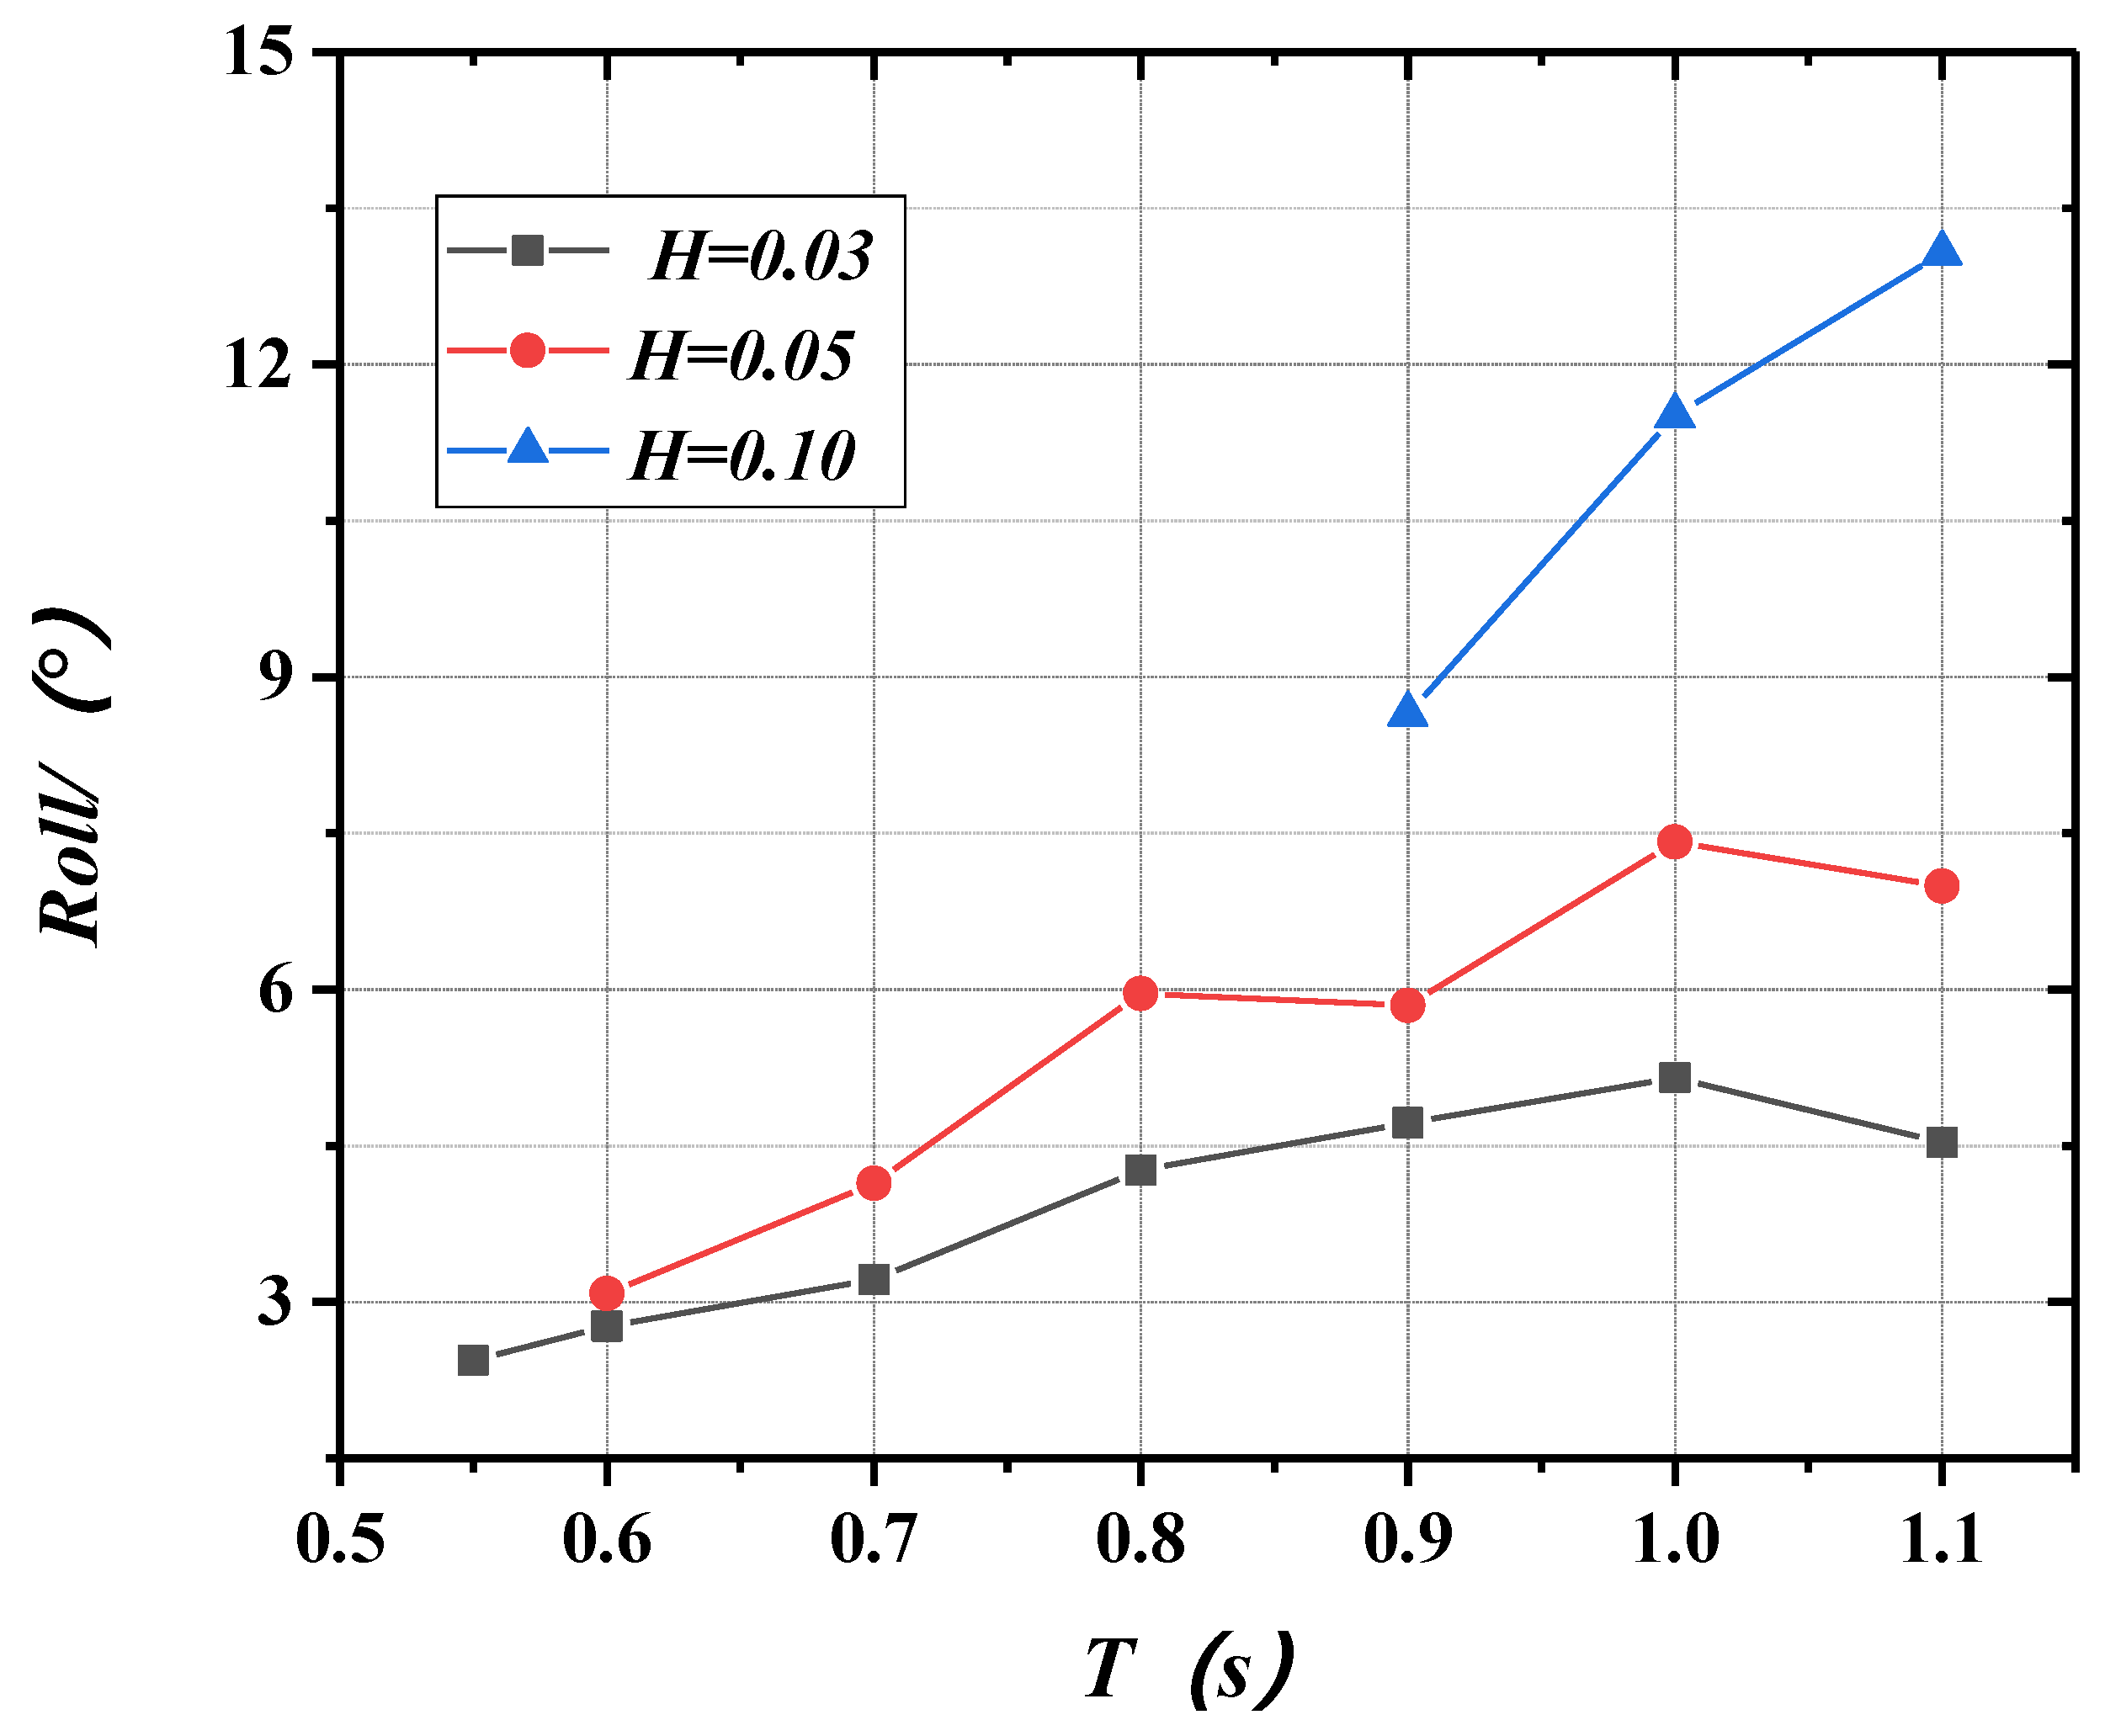
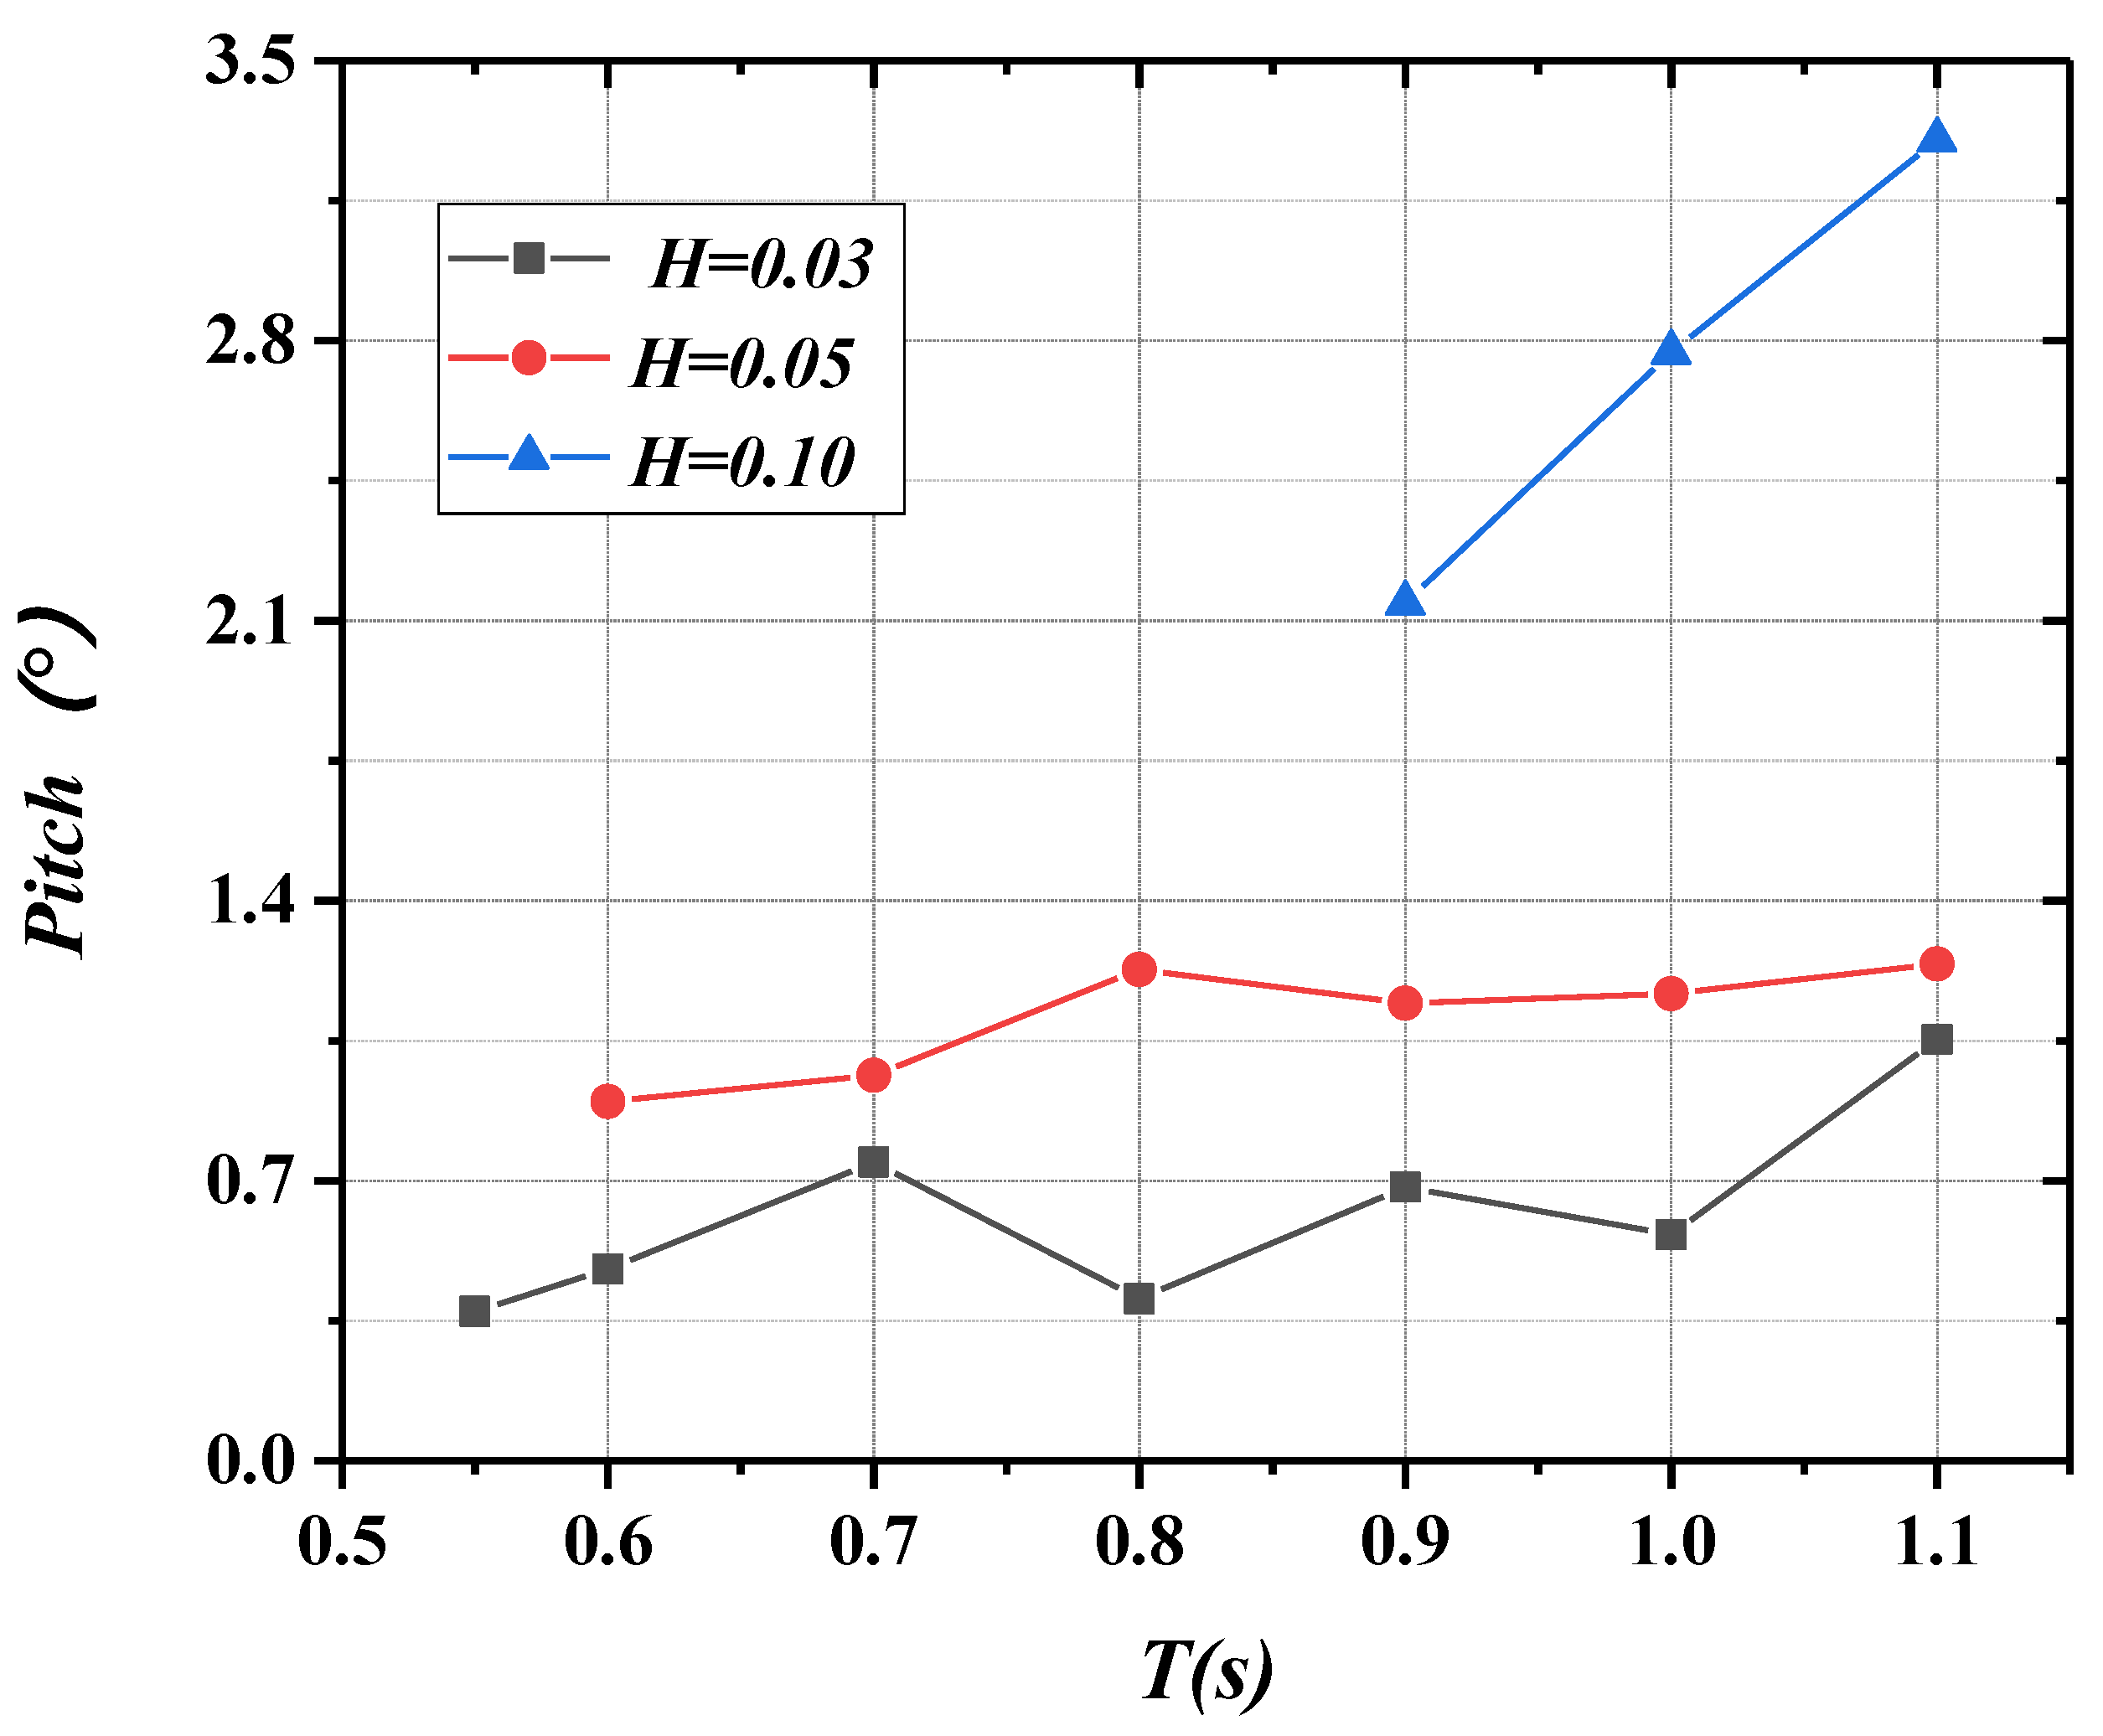
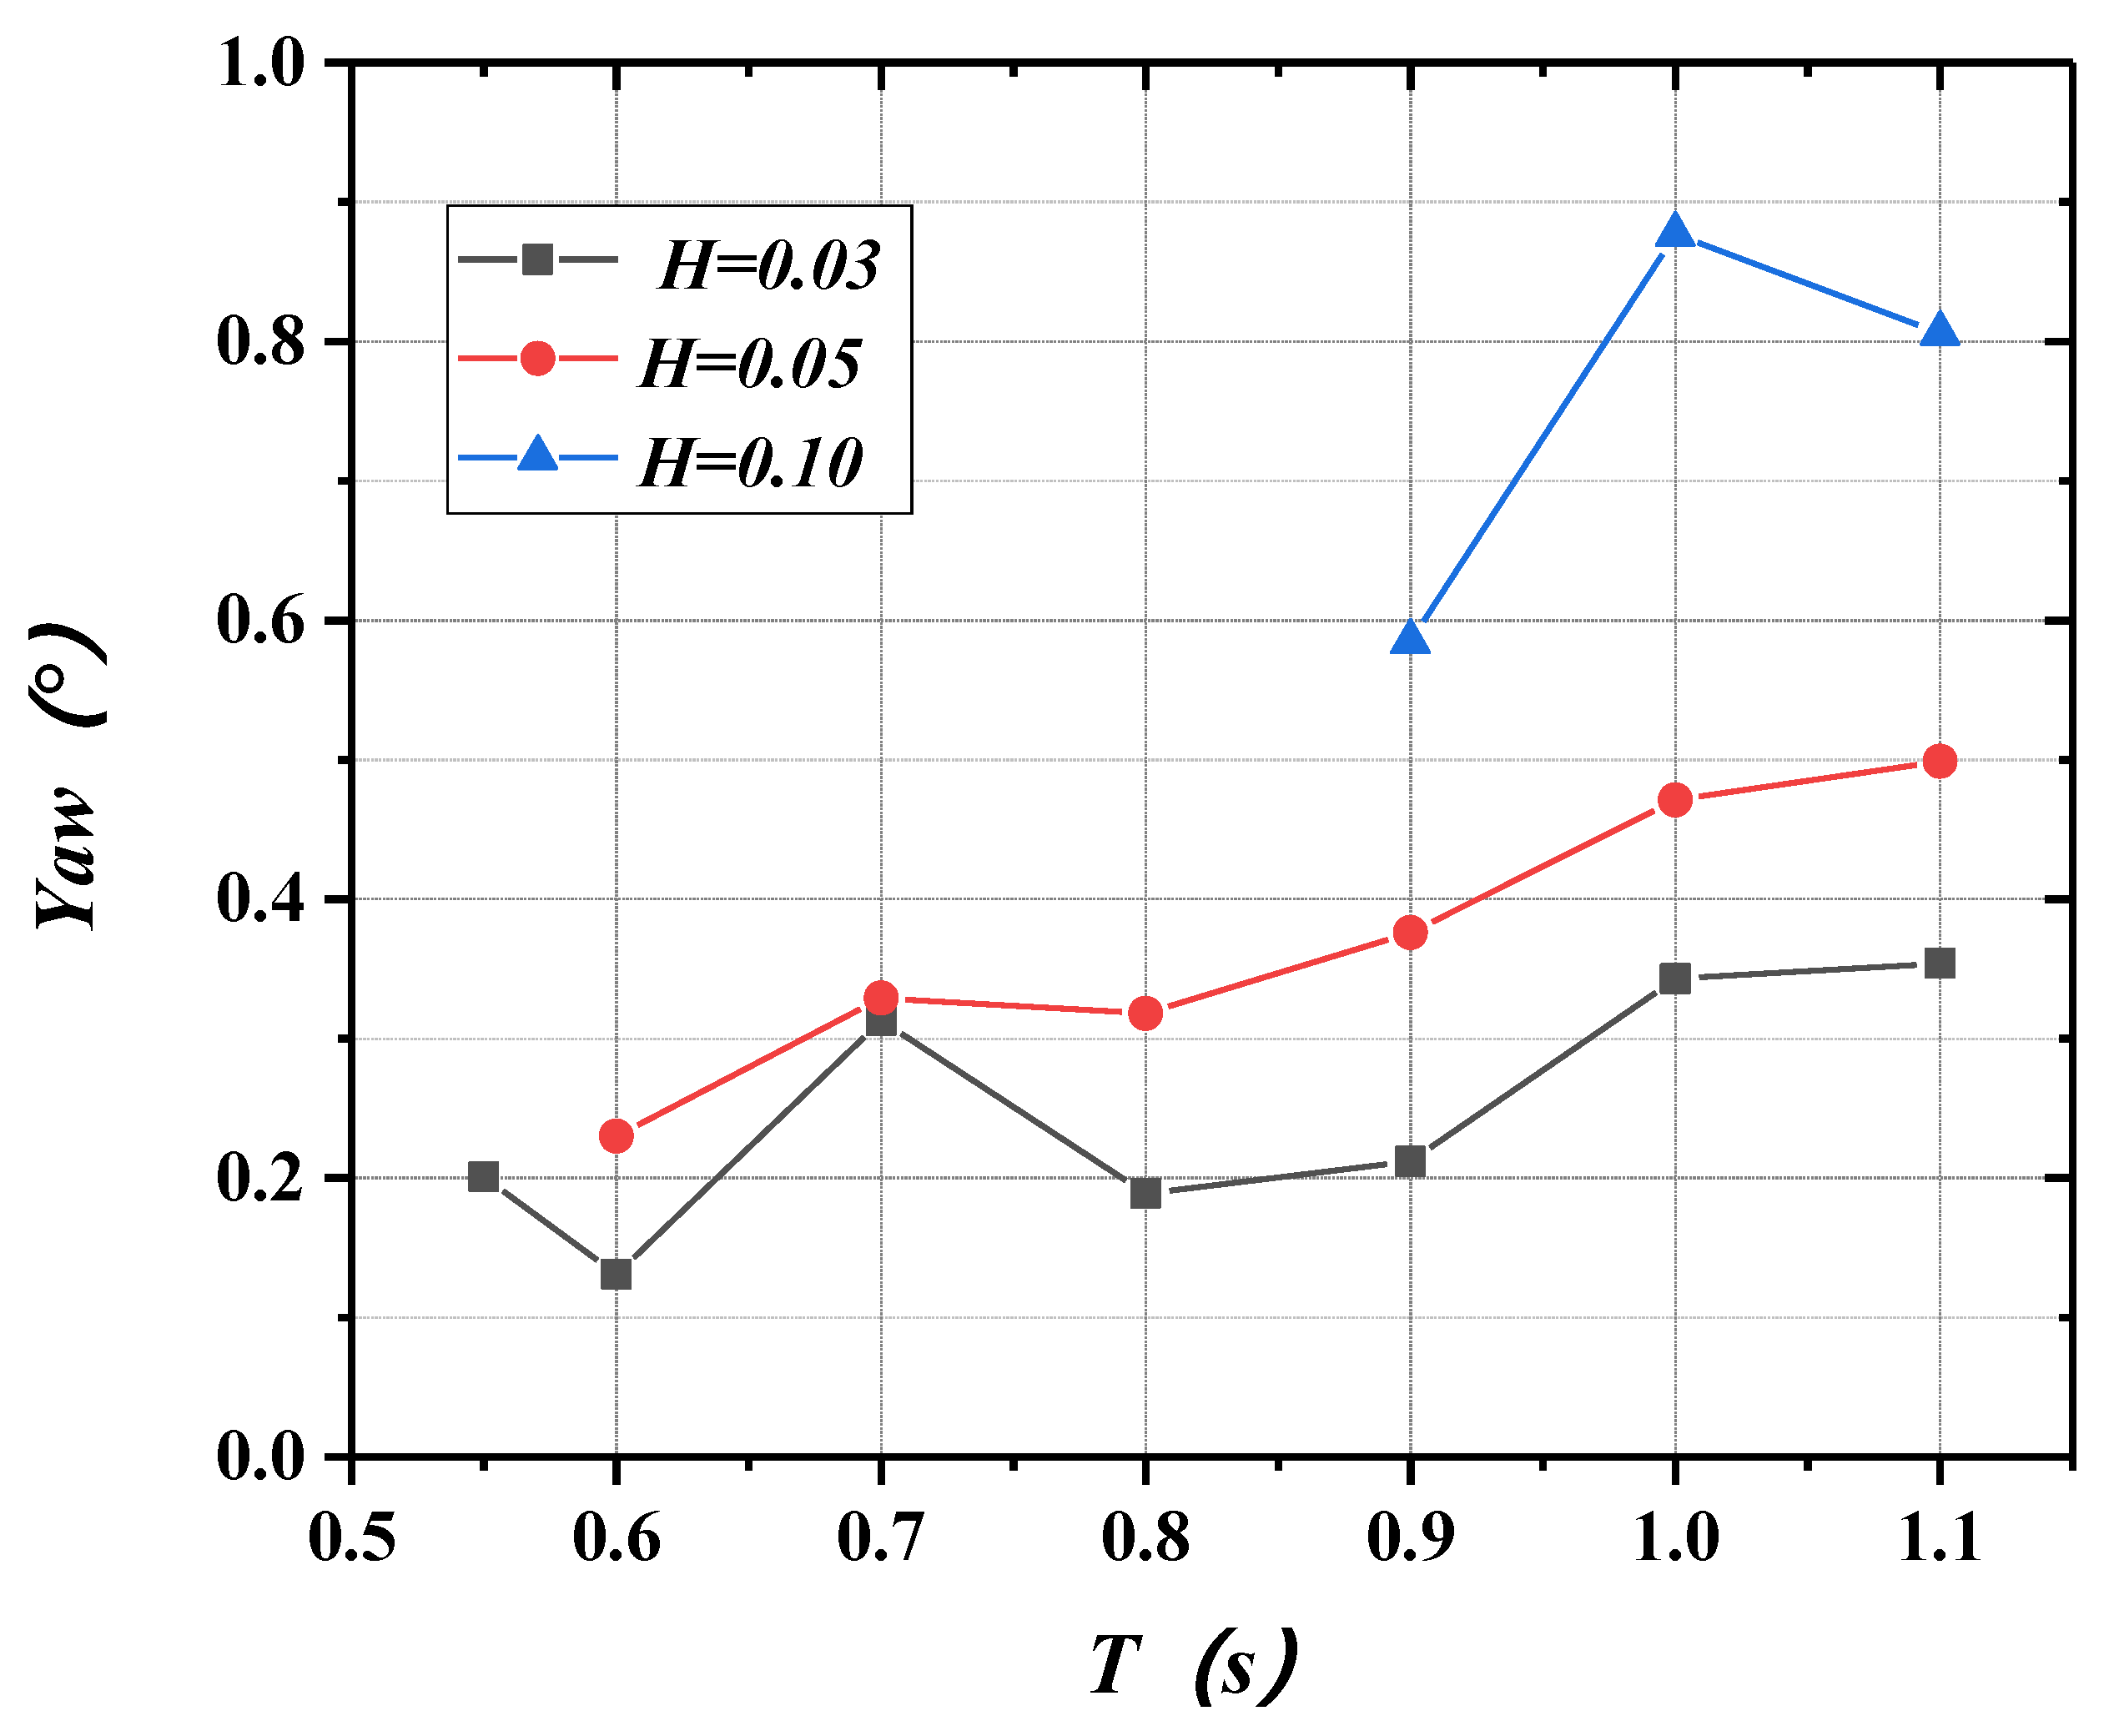
The floating breakwaters will produce a certain surge and pitch under the action of beam waves (β = 90°) owing to the impact of reflected longitudinal waves from the reefs. Under the combined action of connectors and mooring systems, the yaw motions of the floating breakwaters are small.
(3)
Under the action of the beam waves (β = 90°), the overall motion performance of the floating breakwaters was good, but because of the influence of reef reflection waves and the shallow water effect, the motion responses in the three main stress directions of the floating breakwaters were large. During the design and installation of the floating breakwaters in a reef area, it is necessary to prevent the floating breakwater from bottoming and colliding with the reef, taking into account the surge and heave of the floating breakwater in the reef area.
(4)
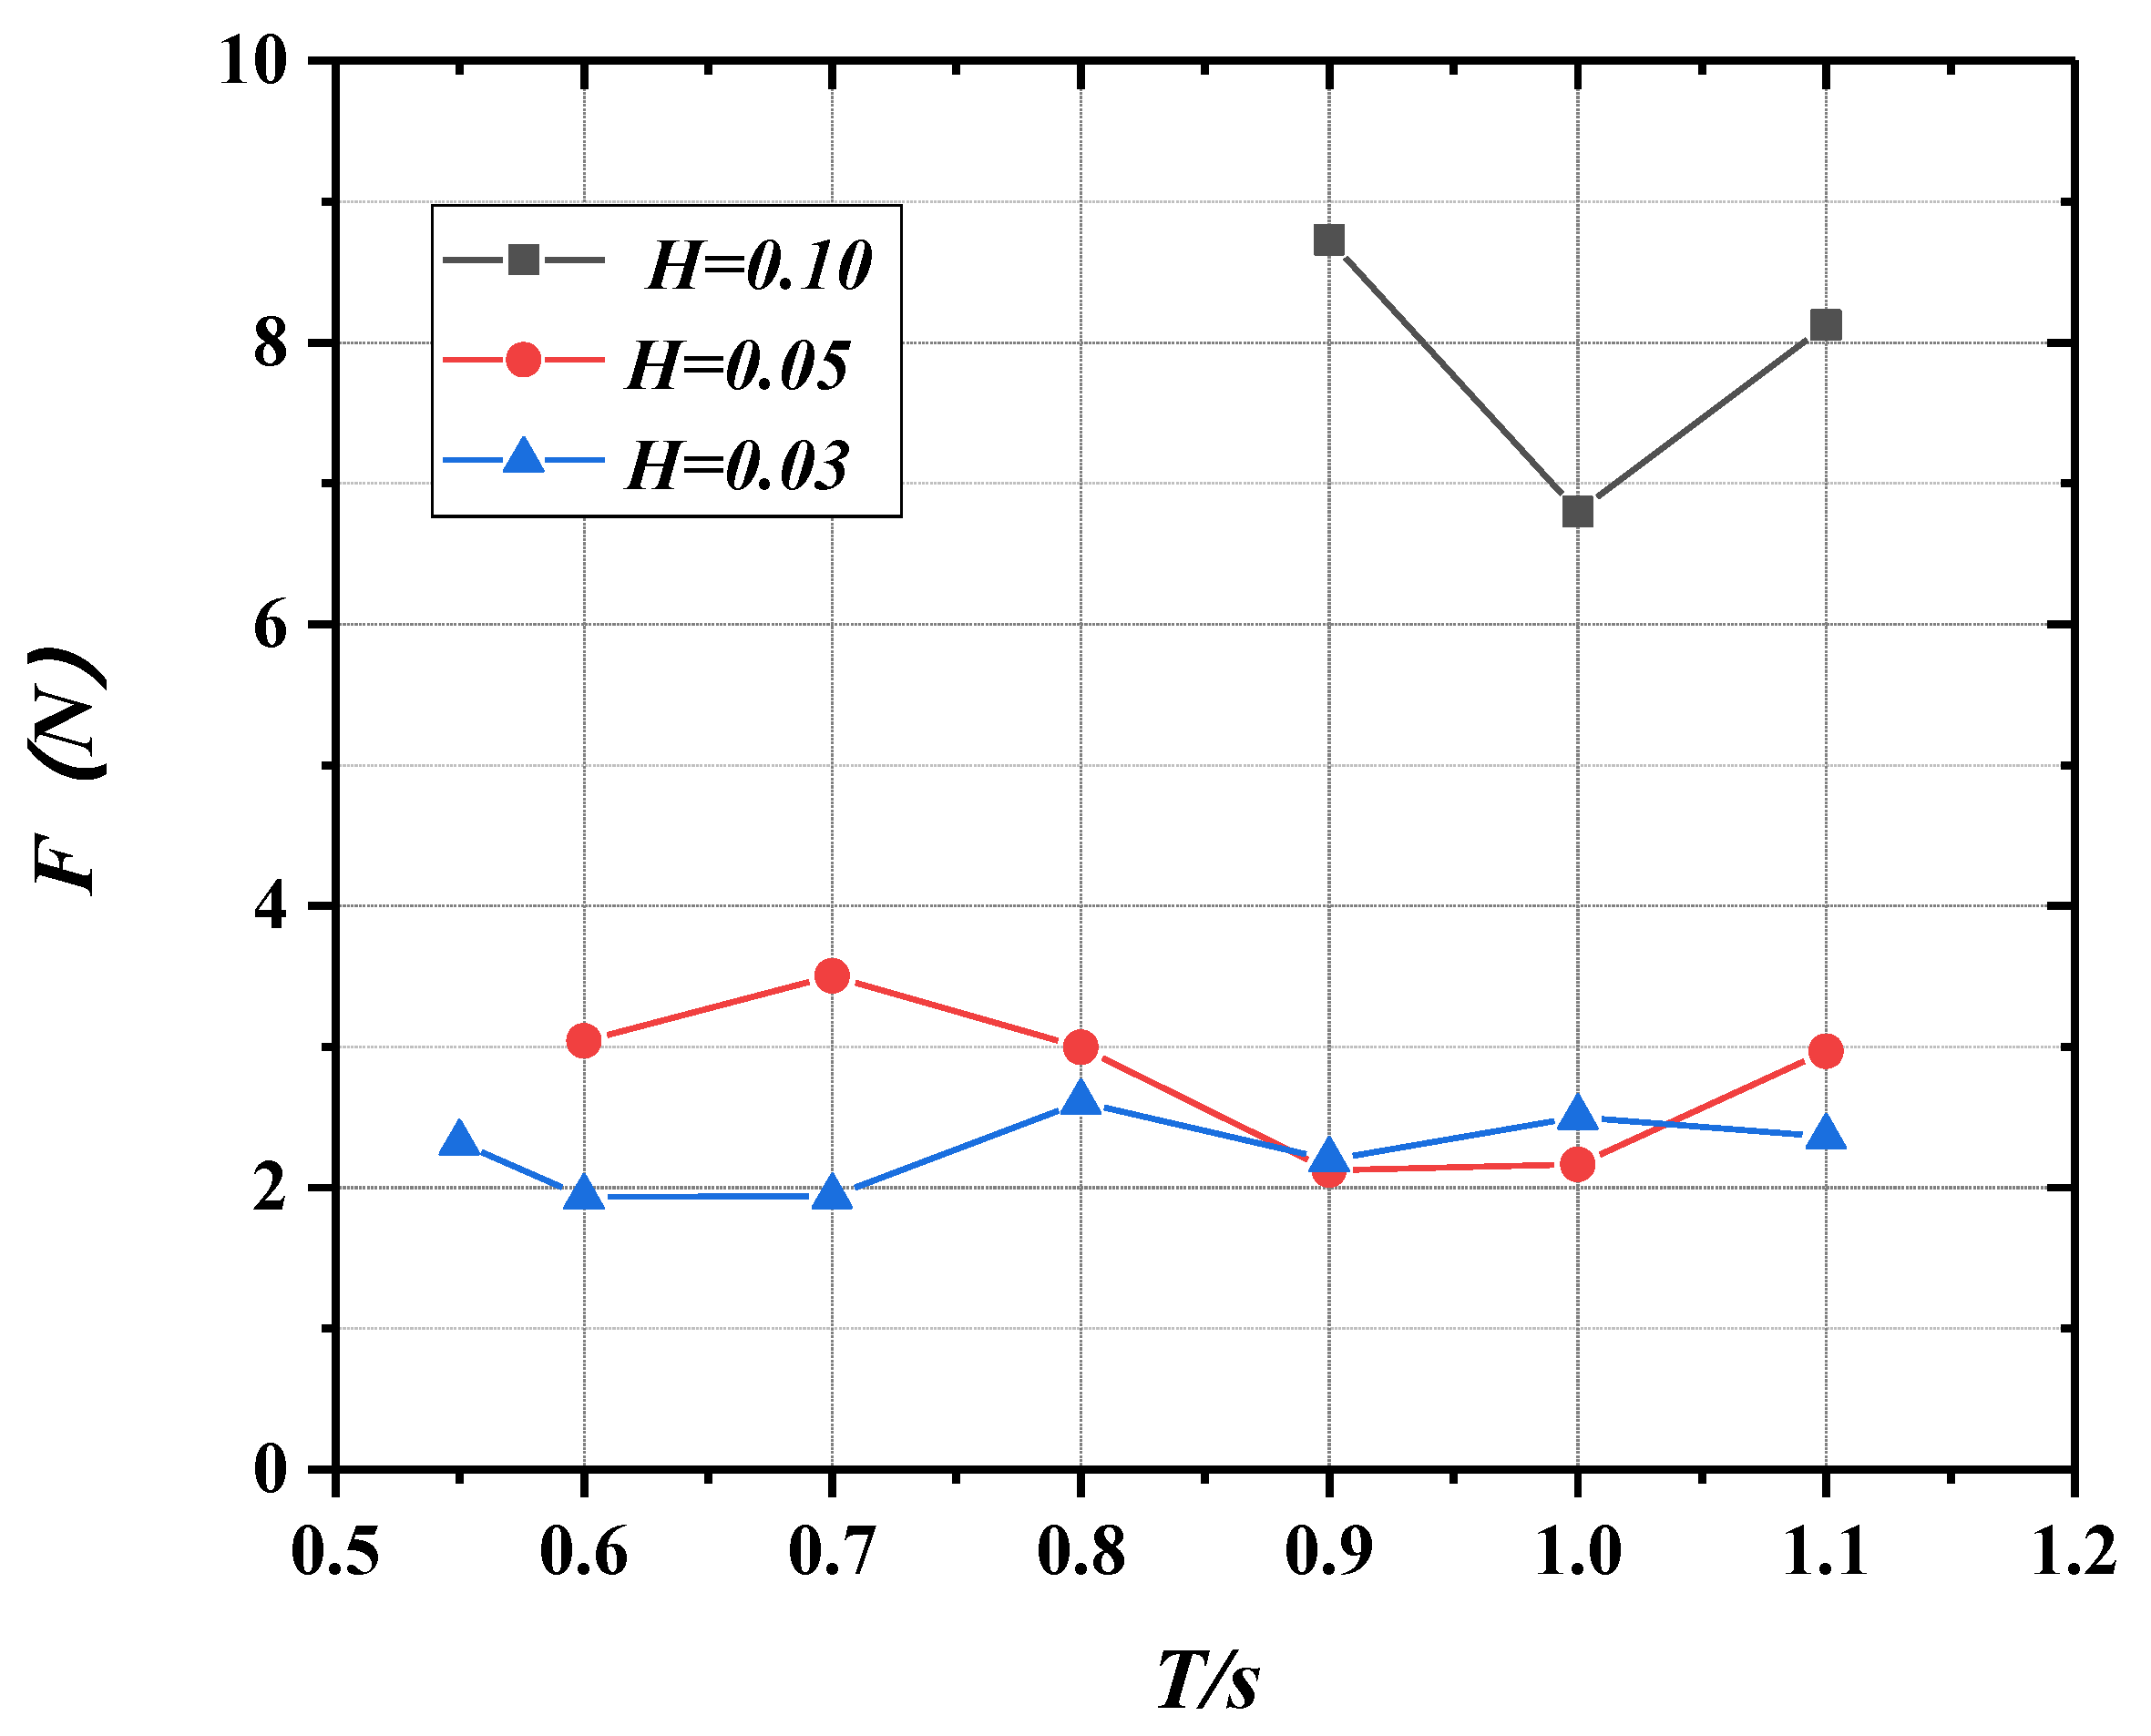
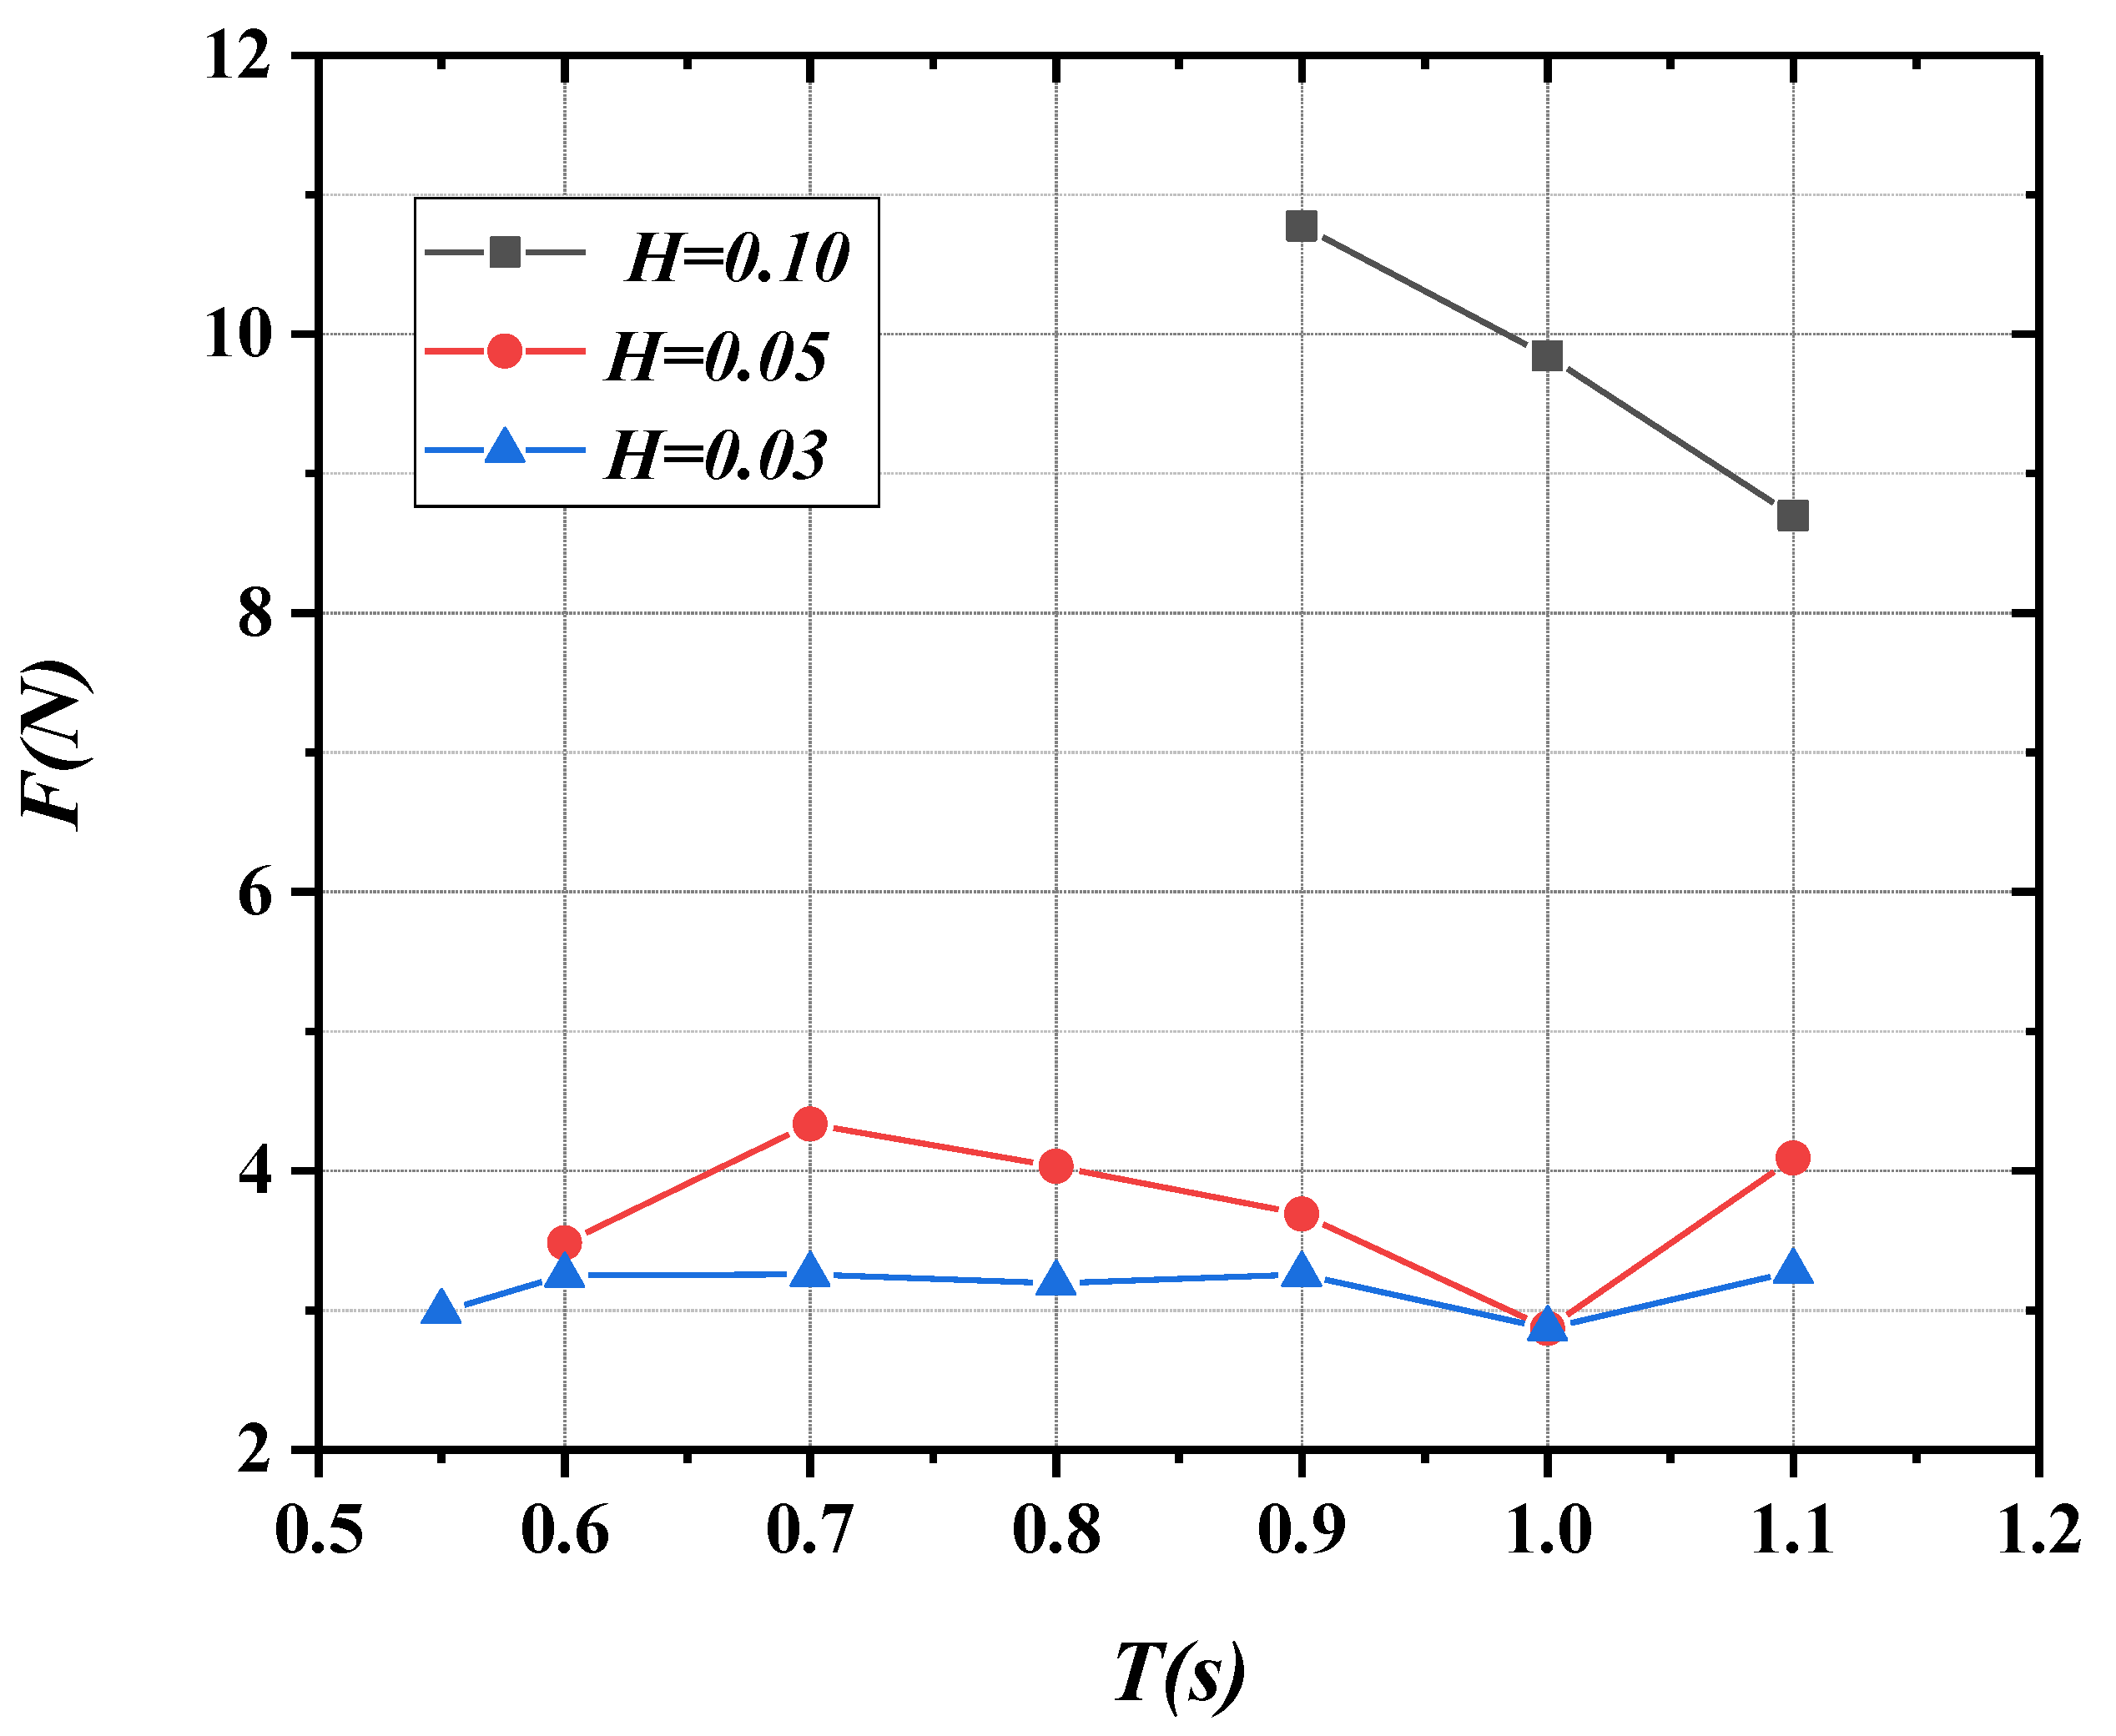
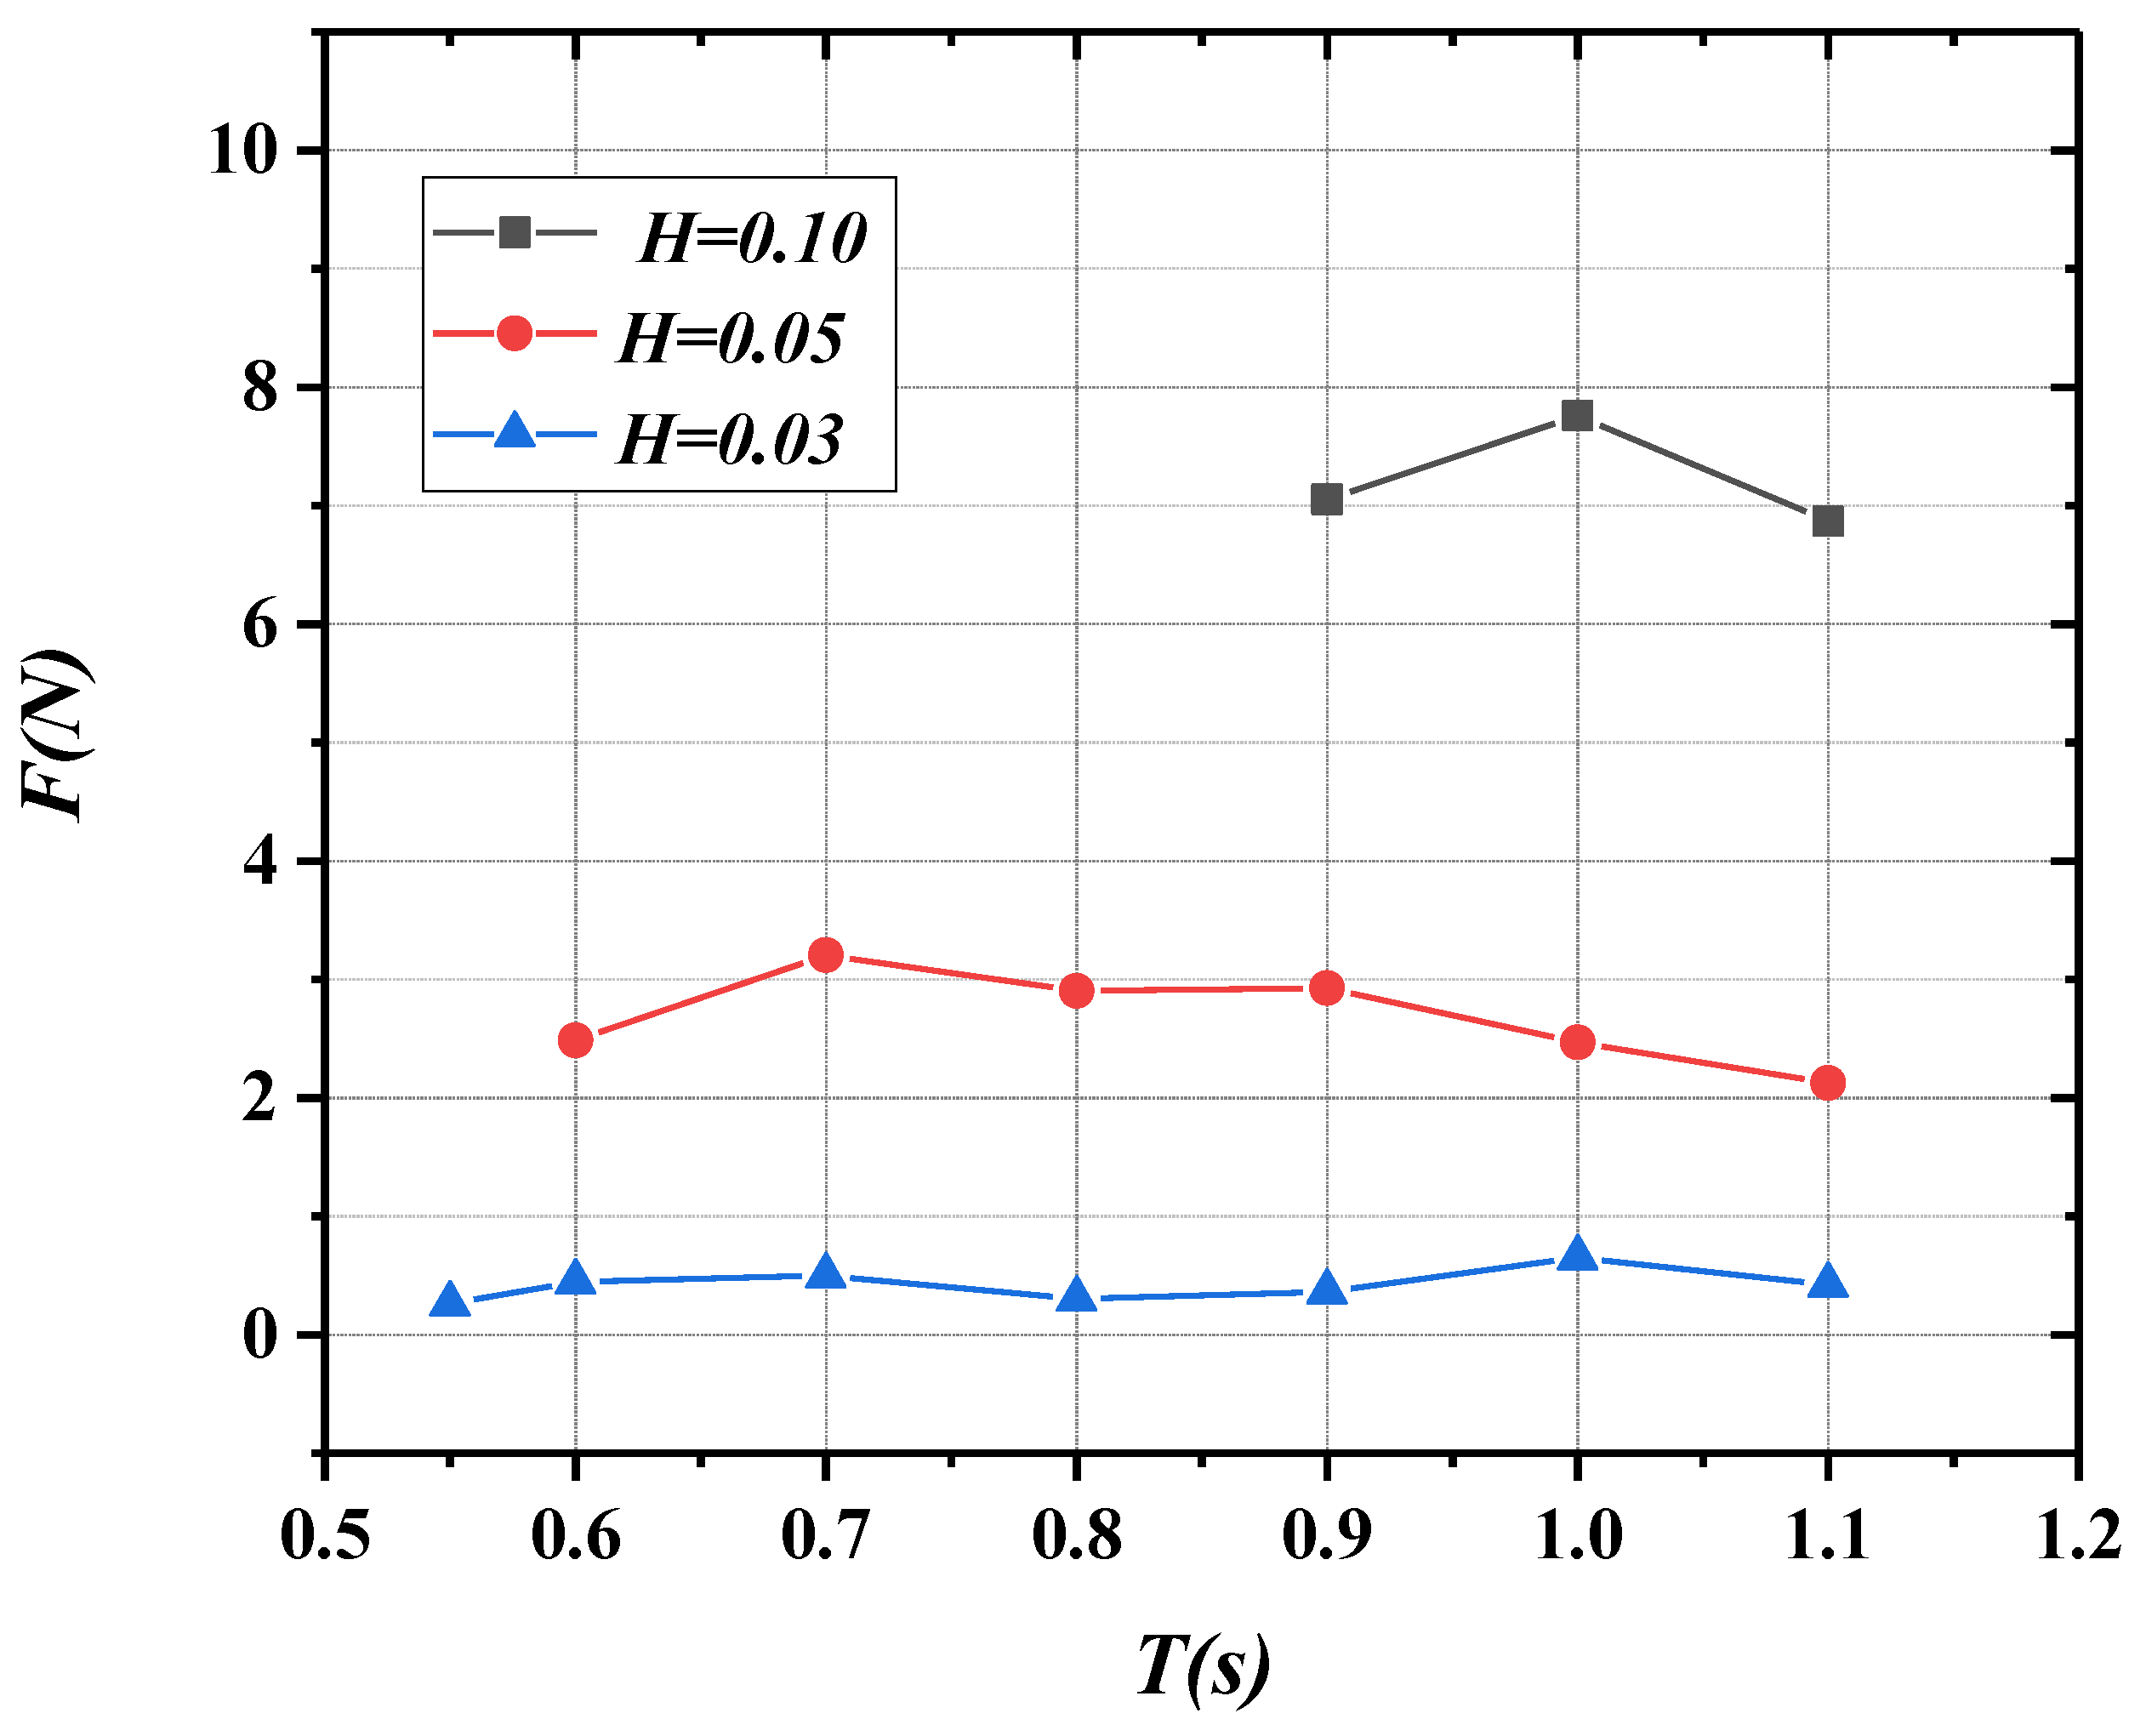
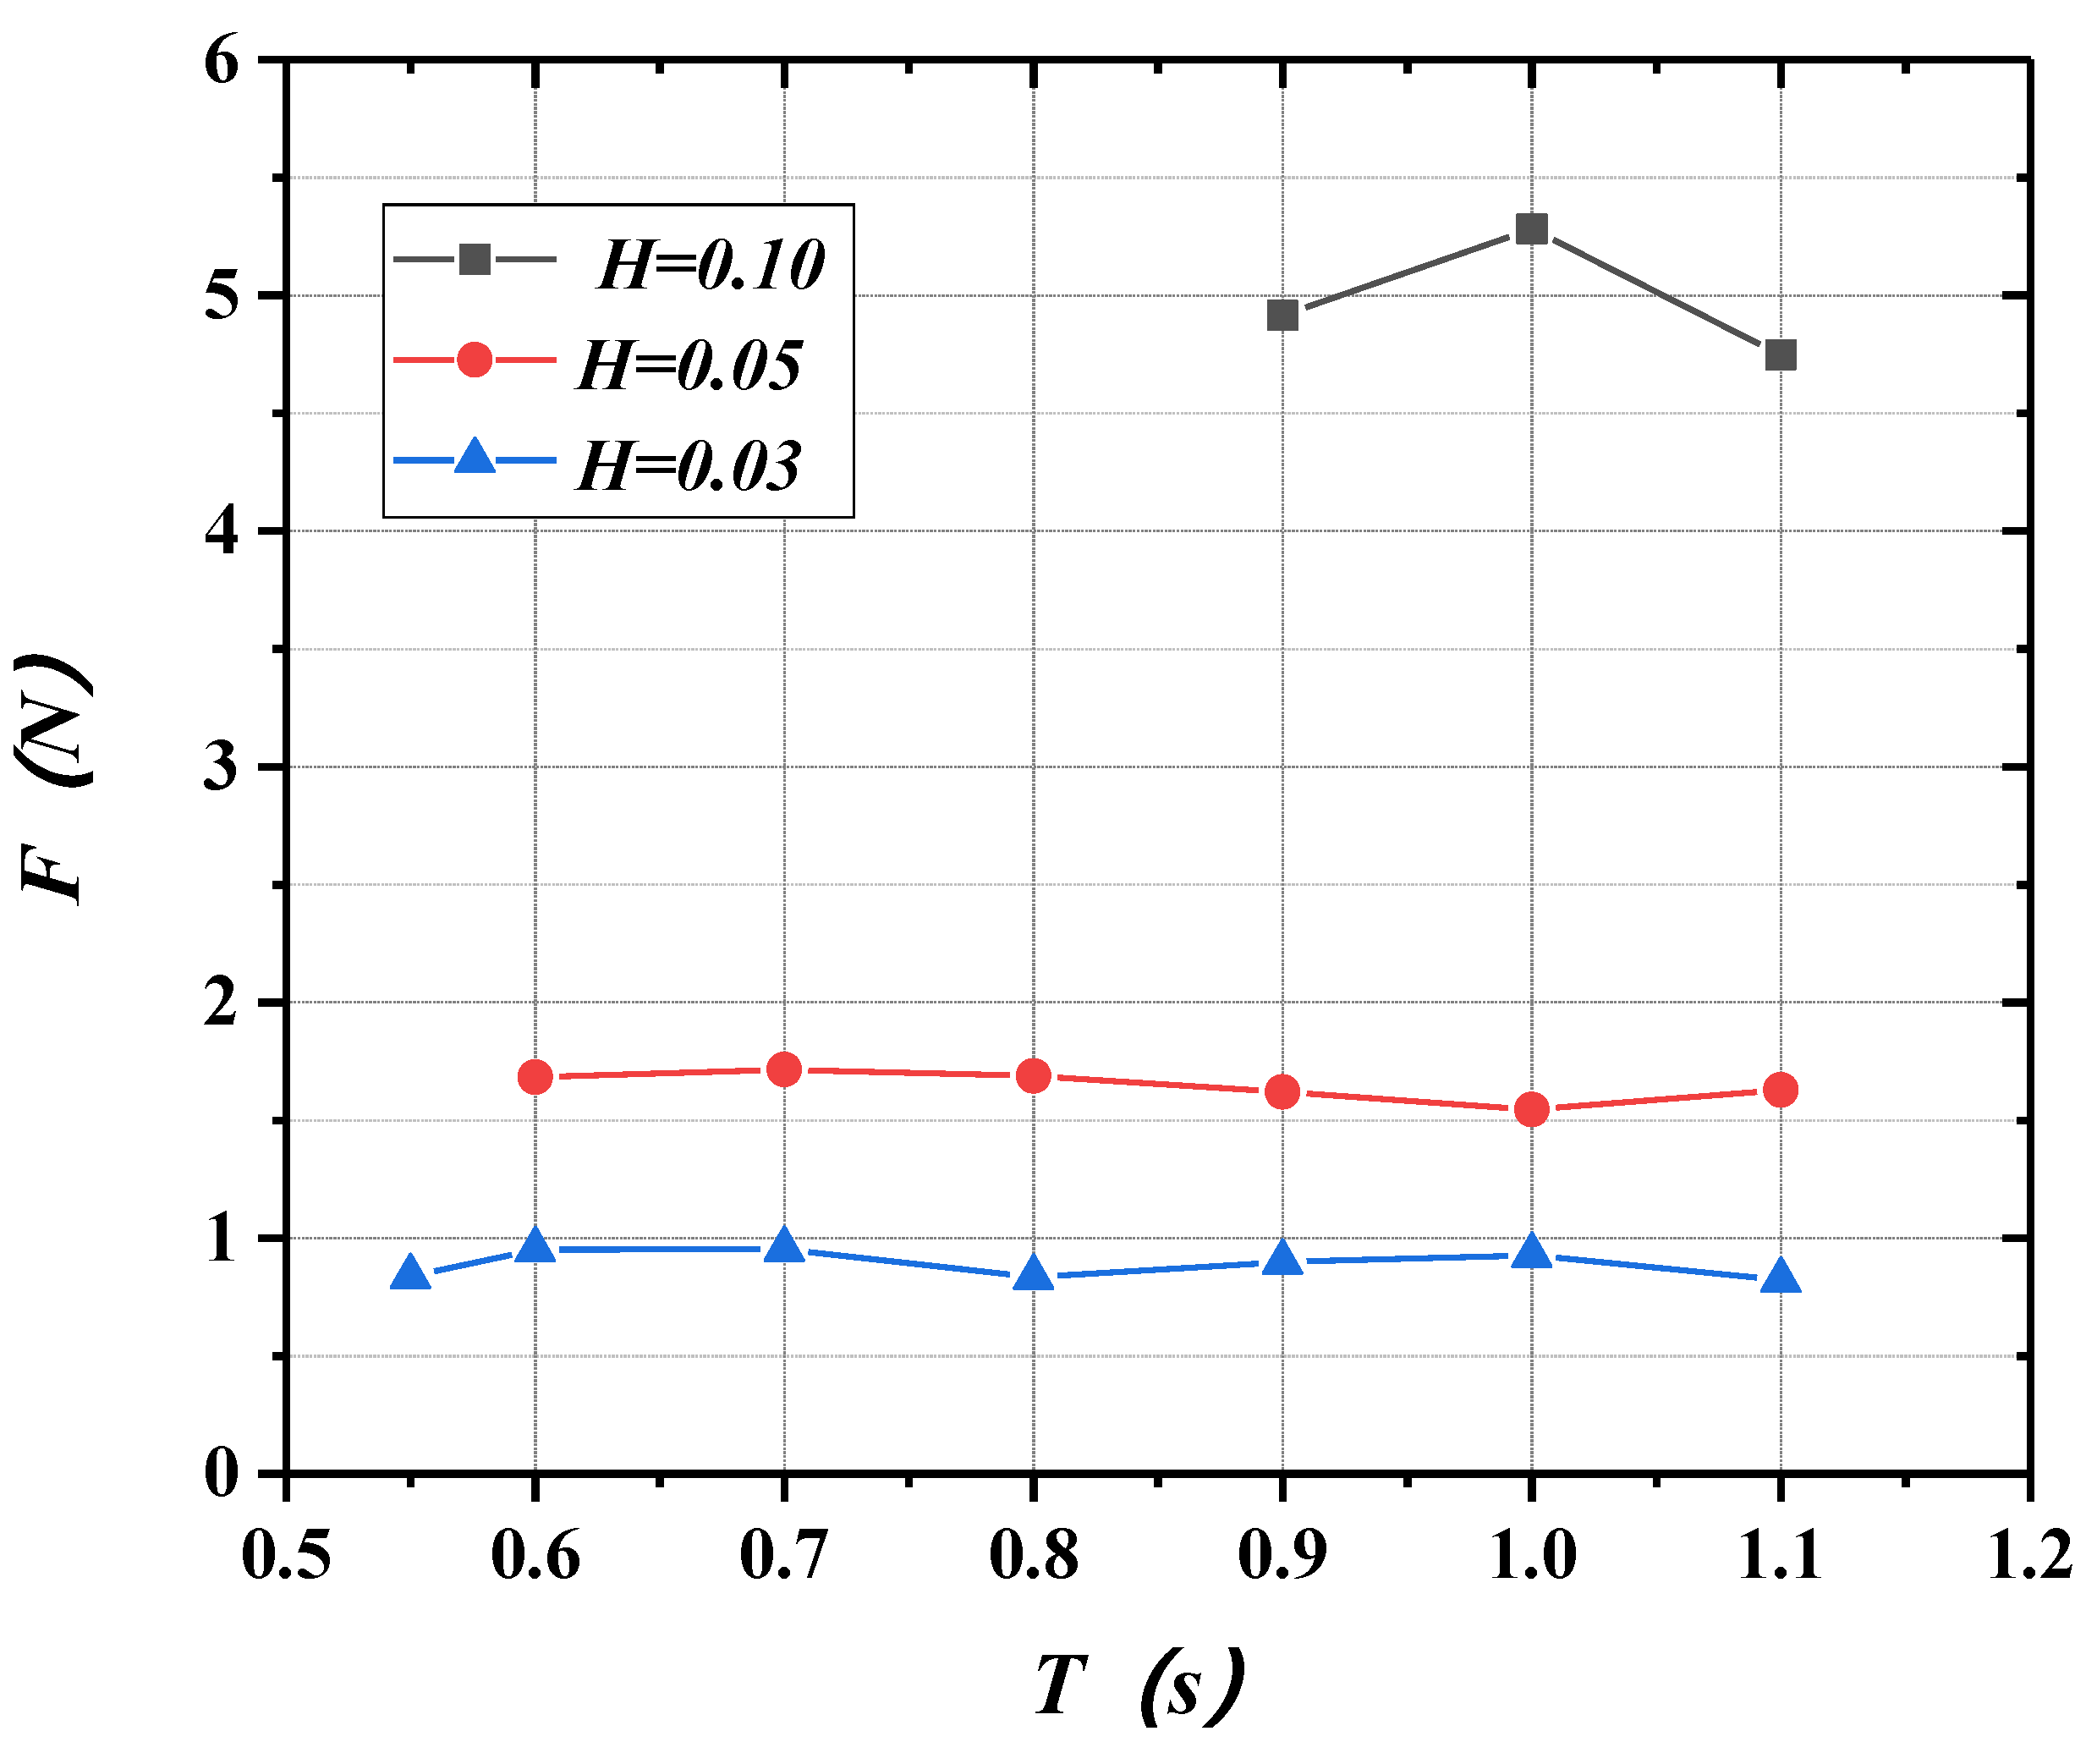
The peak mooring forces on the windward side were greater than those on the leeward side. Under the influence of the aggregation and superposition of reflected waves on both sides of the reefs, the peak mooring forces in the middle position of the floating breakwater system were the largest at large wave height.
(5)
Affected by the mooring radius, the stiffness of the mooring line at the reefs is larger, which leads to greater stress on the mooring line. In the process of mooring system design, attention should be paid to prevent the phenomenon of breaking.
In summary, by analyzing the wave transmission coefficients, motion responses, and mooring forces of a floating breakwater, some conclusions can be drawn. The three-cylinder floating breakwater exhibited satisfactory hydrodynamic performance under the influence of reefs. It has broad application prospects in offshore reefs, including the East China Sea. This experiment is a preliminary study on the hydrodynamic performance of a multi-module floating breakwater system under the influence of reefs, which provides some experience for the design and application of floating breakwaters under the influence of reefs. However, further research is needed on how to improve the wave attenuating performance of long-period waves.

Author Contributions

Conceptualization: J.G. and Y.Z.; data acquisition: J.G., Y.Z., X.B. and S.X.; writing the first draft: J.G. and Y.Z.; final review and editing: J.G. All authors have read and agreed to the published version of the manuscript.

Funding

This study was supported financially by the National Natural Science Foundation of China (Grant No. 52071161).

Institutional Review Board Statement

Not applicable.

Informed Consent Statement

Not applicable.

Data Availability Statement

The numerical and experimental data used to support the findings of this study are included within the article.

Acknowledgments

The authors extend their appreciation to the National Natural Science Foundation of China (Grant No. 52071161) for funding this research.

Conflicts of Interest

The authors declare no conflict of interest.

References

  1. Christensen, E.D.; Bingham, H.B.; Friis, A.P.S.; Larsen, A.K.; Jensen, K.L. An experimental and numerical study of floating breakwaters. Coast. Eng. 2018, 137, 43–58. [Google Scholar] [CrossRef]
  2. Zhang, X.S.; Ma, S.; Duan, W.Y. A new L type floating breakwater derived from vortex dissipation simulation. Ocean Eng. 2018, 164, 455–464. [Google Scholar] [CrossRef]
  3. Yang, Z.; Xie, M.; Gao, Z.; Xu, T.; Guo, W.; Ji, X.; Yuan, C. Experimental investigation on hydrodynamic effectiveness of a water ballast type floating breakwater. Ocean Eng. 2018, 167, 77–94. [Google Scholar] [CrossRef]
  4. Cho, I.H. Transmission coefficients of a floating rectangular breakwater with porous side plates. Int. J. Nav. Arch. Ocean 2016, 8, 53–65. [Google Scholar] [CrossRef] [Green Version]
  5. Chen, Z.J.; Wang, Y.X.; Dong, H.Y.; Zheng, B.X. Time-domain hydrodynamic analysis of pontoon-plate floating breakwater. Water Sci. Eng. 2012, 5, 291–303. [Google Scholar]
  6. He, F.; Huang, Z.H.; Law, A.W.K. Hydrodynamic performance of a rectangular floating breakwater with and without pneumatic chambers: An experimental study. Ocean Eng. 2012, 51, 16–27. [Google Scholar] [CrossRef]
  7. Wang, H.Y.; Sun, Z.C. Experimental study of a porous floating breakwater. Ocean Eng. 2010, 37, 520–527. [Google Scholar] [CrossRef]
  8. Dong, G.H.; Zheng, Y.N.; Li, Y.C.; Teng, B.; Guan, C.T.; Lin, D.F. Experiments on wave transmission coefficients of floating breakwaters. Ocean Eng. 2008, 35, 931–938. [Google Scholar] [CrossRef]
  9. Elchahal, G.; Younes, R.; Lafon, P. The effects of reflection coefficient of the harbour sidewall on the performance of floating breakwaters—ScienceDirect. Ocean Eng. 2008, 35, 1102–1112. [Google Scholar] [CrossRef]
  10. Ji, C.Y.; Chen, X.; Cui, J.; Oleg, G.; Incecik, A. Experimental study on configuration optimization of floating breakwaters. Ocean Eng. 2016, 117, 302–310. [Google Scholar] [CrossRef] [Green Version]
  11. Ji, C.Y.; Chen, X.; Cui, J.; Yuan, Z.M.; Incecik, A. Experimental study of a new type of floating breakwater. Ocean Eng. 2015, 105, 295–303. [Google Scholar] [CrossRef] [Green Version]
  12. Ji, C.Y.; Guo, Y.C.; Cui, J.; Yuan, Z.M.; Ma, X.J. 3d experimental study on a cylindrical floating breakwater system. Ocean Eng. 2016, 125, 38–50. [Google Scholar] [CrossRef] [Green Version]
  13. Ji, C.Y.; Cheng, Y.; Yang, K.; Oleg, G. Numerical and experimental investigation of hydrodynamic performance of a cylindrical dual pontoon-net floating breakwater. Coast. Eng. 2017, 129, 1–16. [Google Scholar] [CrossRef]
  14. Ji, C.Y.; Deng, X.K.; Cheng, Y. An experimental study of double-row floating breakwaters. J. Mar. Sci. Tech. 2018, 24, 359–371. [Google Scholar] [CrossRef]
  15. He, F.; Huang, Z.H.; Law, A.W.K. An experimental study of a floating breakwater with asymmetric pneumatic chambers for wave energy extraction. Appl. Energ. 2013, 106, 222–231. [Google Scholar] [CrossRef]
  16. Loukogeorgaki, E.; Lentsiou, E.N.; Aksel, M.; Yagci, O. Experimental investigation of the hydroelastic and the structural response of a moored pontoon-type modular floating breakwater with flexible connectors. Coast. Eng. 2017, 121, 240–254. [Google Scholar] [CrossRef]
  17. Loukogeorgaki, E.; Yagci, O.; Kabdasli, M.S. 3D Experimental investigation of the structural response and the effectiveness of a moored floating breakwater with flexibly connected modules. Coast. Eng. 2014, 91, 164–180. [Google Scholar] [CrossRef]
  18. Gesraha, M.R. Analysis of Π shaped floating breakwater in oblique waves: I. Impervious rigid wave boards. Appl. Ocean Res. 2006, 28, 327–338. [Google Scholar] [CrossRef]
  19. Sannasiraj, S.A.; Sundar, V.; Sundaravadivelu, R. Mooring forces and motion responses of pontoon-type floating breakwaters. Ocean Eng. 1998, 25, 27–48. [Google Scholar] [CrossRef]
  20. Najafi-Jilani, A.; Rezaie-Mazyak, A. Numerical investigation of floating breakwater movement using SPH method. Int. J. Nav. Arch. Ocean 2011, 3, 122–125. [Google Scholar] [CrossRef] [Green Version]
  21. Ji, C.Y.; Cheng, Y.; Cui, J.; Yuan, Z.M.; Oleg, G. Hydrodynamic performance of floating breakwaters in long wave regime: An experimental study. Ocean Eng. 2018, 152, 154–166. [Google Scholar] [CrossRef] [Green Version]
  22. Mane, V.; Rajappa, S.; Rao, S.; Vittal, H.A. Peak mooring forces in the horizontal interlaced multi-layered moored floating pipe breakwater. Int. J. Nav. Arch. Ocean 2011, 3, 150–158. [Google Scholar] [CrossRef] [Green Version]
  23. Hegde, A.V.; Kamath, K.; Deepak, J.C. Mooring forces in horizontal interlaced moored floating pipe breakwater with three layers. Ocean Eng. 2008, 35, 165–173. [Google Scholar] [CrossRef]
  24. Liang, N.K.; Huang, J.S.; Li, C.F. A study of spar buoy floating breakwater. Ocean Eng. 2004, 31, 43–60. [Google Scholar] [CrossRef]
  25. Martinelli, L.; Ruol, P.; Zanuttigh, B. Wave basin experiments on floating breakwaters with different layouts. Appl. Ocean Res. 2008, 30, 199–207. [Google Scholar] [CrossRef]
  26. Loukogeorgaki, E.; Angelides, D.C. Stiffness of mooring lines and performance of floating breakwater in three dimensions. Appl. Ocean Res. 2005, 27, 187–208. [Google Scholar] [CrossRef]
  27. Jeong, K.L.; Lee, Y.G. Numerical simulations of two-dimensional floating breakwaters in regular waves using fixed cartesian grid. Int. J. Nav. Arch. Ocean 2014, 6, 206–218. [Google Scholar] [CrossRef] [Green Version]
  28. Goda, Y.; Suzuki, Y. Estimation of incident and reflected waves in random wave experiments. In Proceedings of the 15th International Conference on Coastal Engineering, Honolulu, HI, USA, 11–17 July 1976; Volume 4, p. 73. [Google Scholar]
Figure 1. Three-dimensional diagram of the three-cylinder floating breakwater.
Jmse 09 01364 g001
Figure 2. Dimensions of the three-cylinder floating breakwater.
Jmse 09 01364 g002
Figure 3. Schematic diagram of connecting structure at one end of adjacent floating breakwater modules.
Jmse 09 01364 g003
Figure 4. Schematic diagram of connecting structure at the other end of adjacent floating breakwater modules.
Jmse 09 01364 g004
Figure 5. Schematic diagram of underwater wave attenuation mesh cage.
Jmse 09 01364 g005
Figure 6. Schematic diagram of wave gauges measuring point layout.
Jmse 09 01364 g006
Figure 7. The wave gauge in the experiment.
Jmse 09 01364 g007
Figure 8. Schematic diagram of load cells measuring point layout.
Jmse 09 01364 g008
Figure 9. The load cell in the experiment.
Jmse 09 01364 g009
Figure 10. Serial number and origin diagram of mooring lines of 8 modules of breakwater models.
Jmse 09 01364 g010
Figure 11. Schematic diagram of light sensing point layout of 4# module.
Jmse 09 01364 g011
Figure 12. Layout diagram of light sensing points in the experiment.
Jmse 09 01364 g012
Figure 13. Top view of the floating breakwater model.
Jmse 09 01364 g013
Figure 14. Front view of the floating breakwater model.
Jmse 09 01364 g014
Figure 15. Connectors model diagram.
Jmse 09 01364 g015
Figure 16. The reef construction process.
Jmse 09 01364 g016
Figure 17. Reefs model diagram.
Jmse 09 01364 g017
Figure 18. Y-type mooring line.
Jmse 09 01364 g018
Figure 19. Anchorage point on the reef.
Jmse 09 01364 g019
Figure 20. Anchorage point at the bottom of the sea.
Jmse 09 01364 g020
Figure 21. Overall layout of the experiment.
Jmse 09 01364 g021
Figure 22. Wave transmission coefficients (β = 90°).
Jmse 09 01364 g022
Figure 23. Wave aggregation effect.
Jmse 09 01364 g023
Figure 24. Variations of surge with period and wave height.
Jmse 09 01364 g024
Figure 25. Variations of sway with period and wave height.
Jmse 09 01364 g025
Figure 26. Variations of heave with period and wave height.
Jmse 09 01364 g026
Figure 27. Variations of roll with period and wave height.
Jmse 09 01364 g027
Figure 28. Variations of pitch with period and wave height.
Jmse 09 01364 g028
Figure 29. Variations of yaw with period and wave height.
Jmse 09 01364 g029
Figure 30. Variations of 1# mooring force.
Jmse 09 01364 g030
Figure 31. Variations of 2# mooring force.
Jmse 09 01364 g031
Figure 32. Variations of 3# mooring force.
Jmse 09 01364 g032
Figure 33. Variations of 4# mooring force.
Jmse 09 01364 g033
Figure 34. Variations of 5# mooring force.
Jmse 09 01364 g034
Table 1. Main parameters of floating breakwater model.
ParameterSymbolUnitValue
LengthLm0.8
BreadthBm0.308
HeightDm0.068
DraftTm0.034
MassMTkg5.195
Roll inertiaIXXkg·m20.055
Pitch inertiaIYYkg·m20.365
Yaw inertiaIZZkg·m20.416
Pontoon diameterdm0.06
Table 2. Mooring line parameters of material properties.
MaterialDiameter (mm)The Submerged Weight per Unit Length (g/m)Axial Rigidity (N)
Polyester cable2.40195.12
Chains1.7461.273941.46
Table 3. Mooring line parameters of geometric properties.
NumberMaterialLength (m)
2–8, 11–17polyester0.896
polyester0.896
Chains1.402
18polyester + Chains0.3 + 0.344
1polyester + Chains0.4 + 0.632
10polyester + Chains0.5 + 0.68
9polyester + Chains0.4 + 0.526
Table 4. Coordinates of fairlead and anchorage points of the breakwater.
NumberFairlead CoordinatesAnchor Point Coordinates
x (m)y (m)z (m)x (m)y (m)z (m)
2−2.5250.1540−2.492.354−0.5
−2.4550.1540−2.492.354−0.5
3−1.6950.1540−1.662.354−0.5
−1.6250.1540−1.662.354−0.5
4−0.8650.1540−0.832.354−0.5
−0.7950.1540−0.832.354−0.5
5−0.0350.154002.354−0.5
0.0350.154002.354−0.5
60.7950.15400.832.354−0.5
0.8650.15400.832.354−0.5
71.6250.15401.662.354−0.5
1.6950.15401.662.354−0.5
82.4550.15402.492.354−0.5
2.5250.15402.492.354−0.5
17−2.525−0.1540−2.49−1.954−0.5
−2.455−0.1540−2.49−1.954−0.5
16−1.695−0.1540−1.66−1.954−0.5
−1.625−0.1540−1.66−1.954−0.5
15−0.865−0.1540−0.83−1.954−0.5
−0.795−0.1540−0.83−1.954−0.5
14−0.035−0.15400−1.954−0.5
0.035−0.15400−1.954−0.5
130.795−0.15400.83−1.954−0.5
0.865−0.15400.83−1.954−0.5
121.625−0.15401.66−1.954−0.5
1.695−0.15401.66−1.954−0.5
112.455−0.15402.49−1.954−0.5
2.525−0.15402.49−1.954−0.5
18−3.305−0.120−3.555−0.6220
1−3.3050.120−3.7750.934−0.5
103.305−0.1204.018−1.0270
93.3050.1204.0310.6760
Table 5. Experimental wave conditions.
NumberWave Height H (m)Wave Period T (s)Wave Incident Angle β (°)
A1–A70.030.55, 0.6, 0.7, 0.8, 0.9, 1.0, 1.190
A8–A130.050.6, 0.7, 0.8, 0.9, 1.0, 1.190
A14–A170.10.9, 1.0, 1.190
Publisher’s Note: MDPI stays neutral with regard to jurisdictional claims in published maps and institutional affiliations.

