
Impact of Anthropogenic Activities and Sea Level Rise on a Lagoon System: Model and Field Observations


Abstract
:1. Introduction
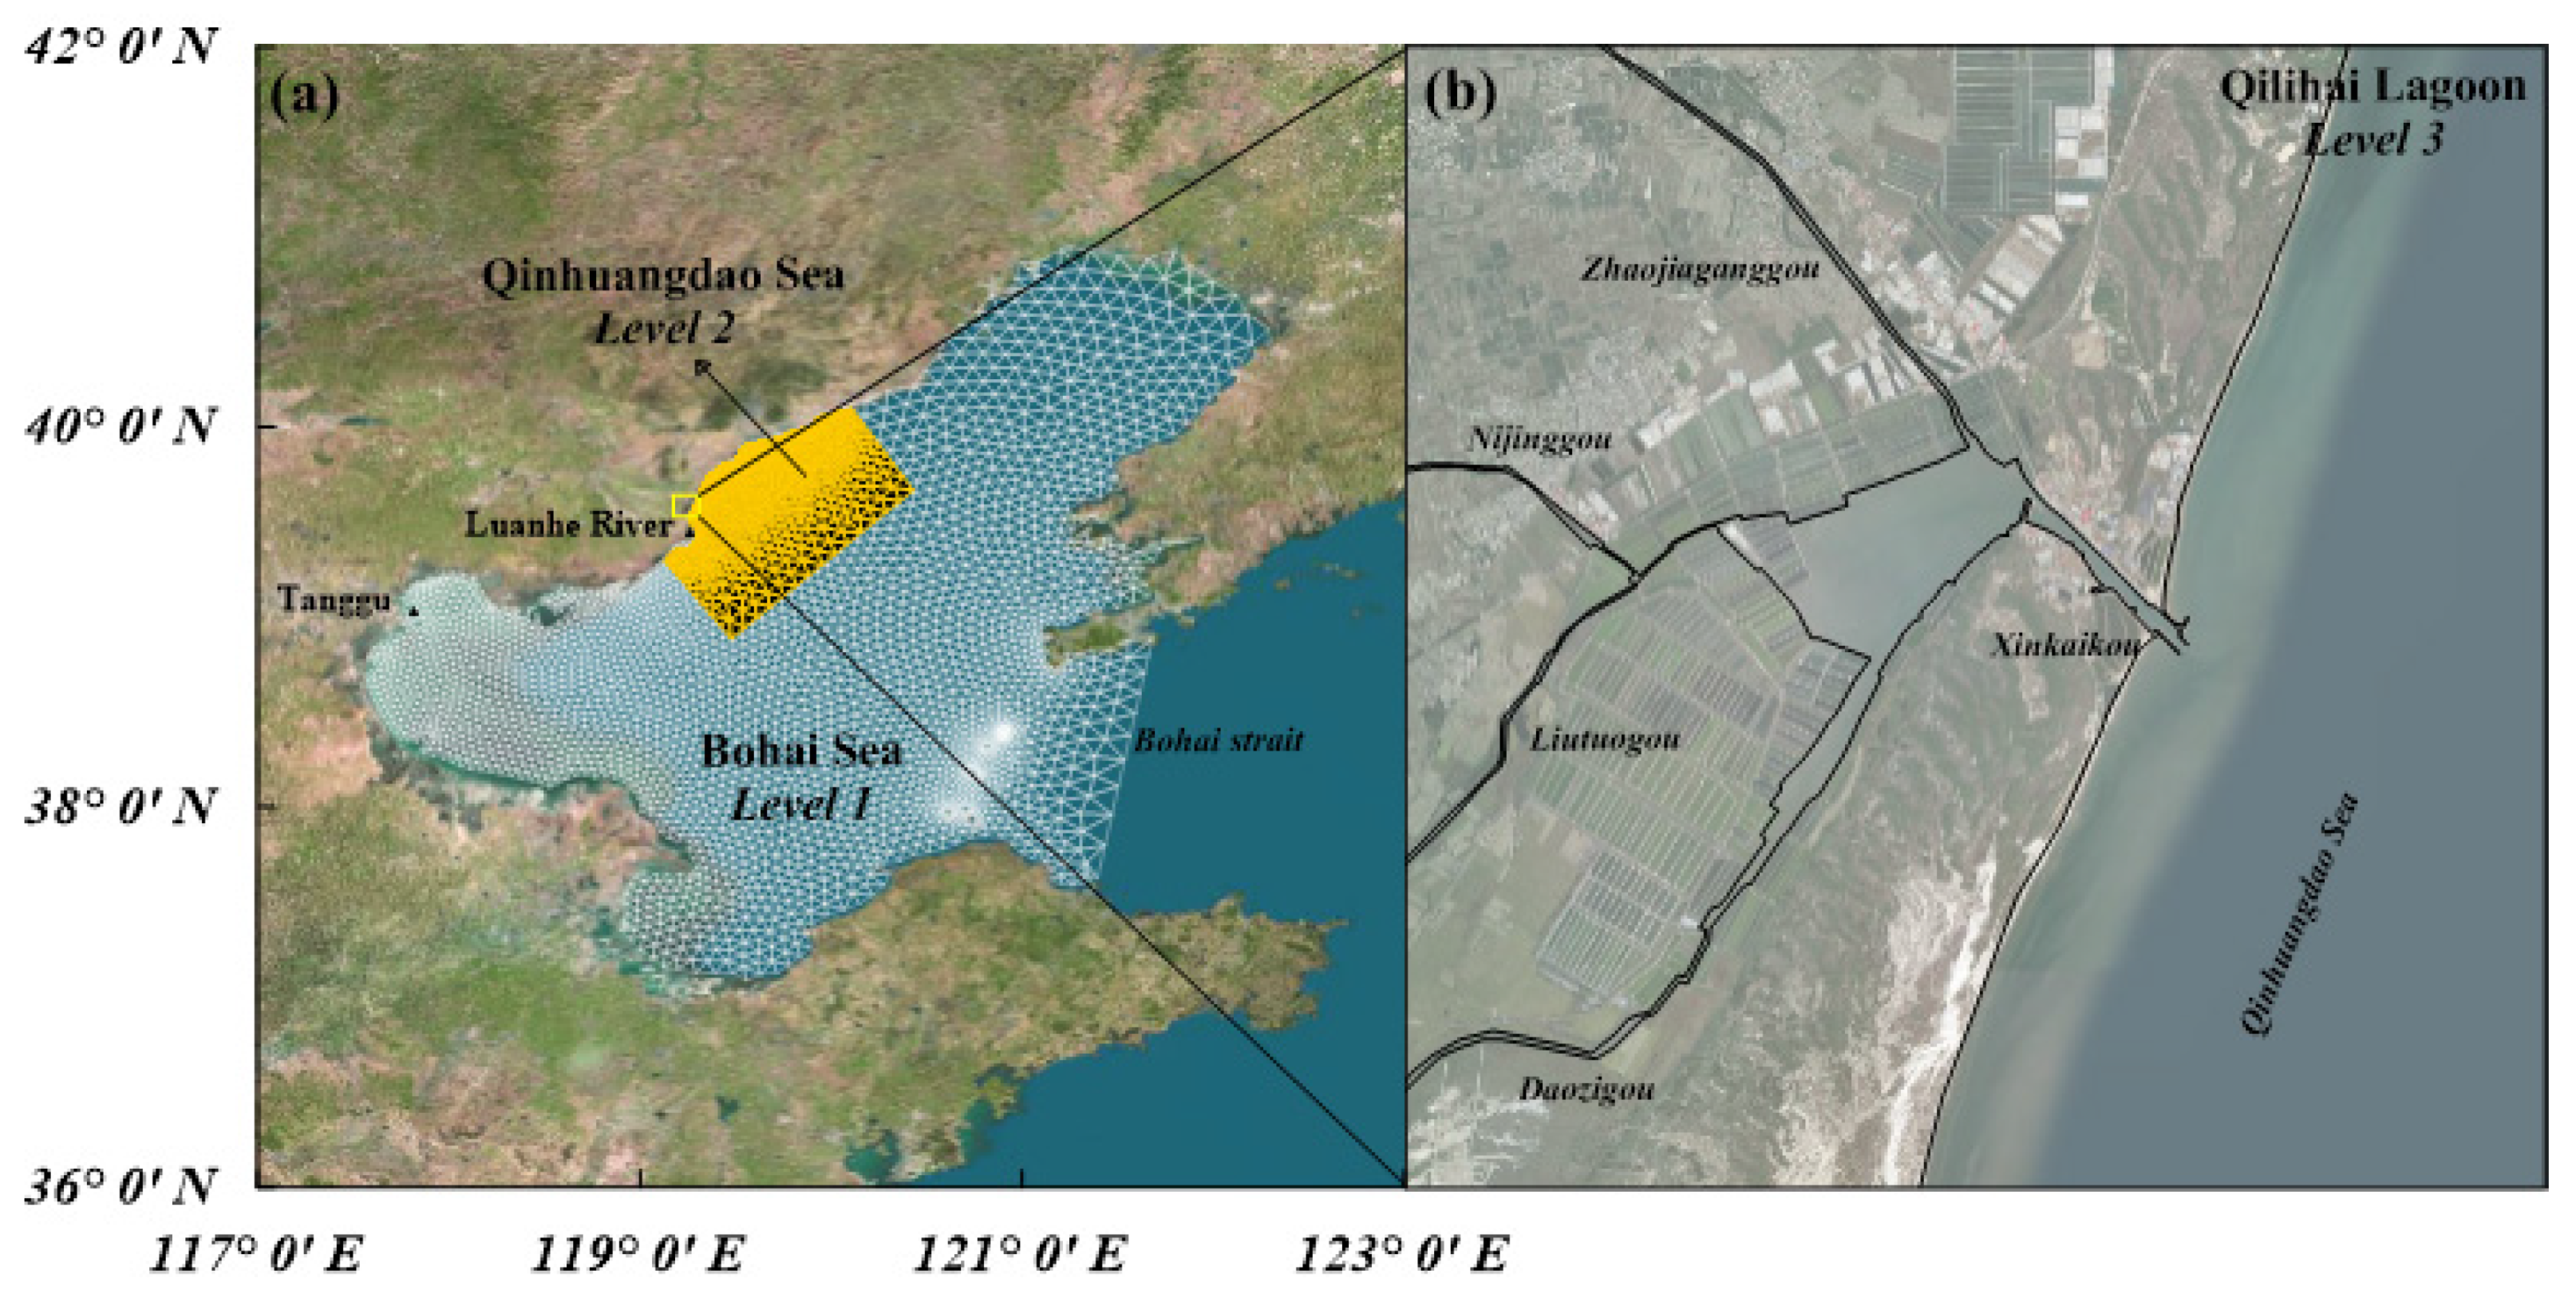
2. Study Area
3. Methodology
3.1. Model Setup
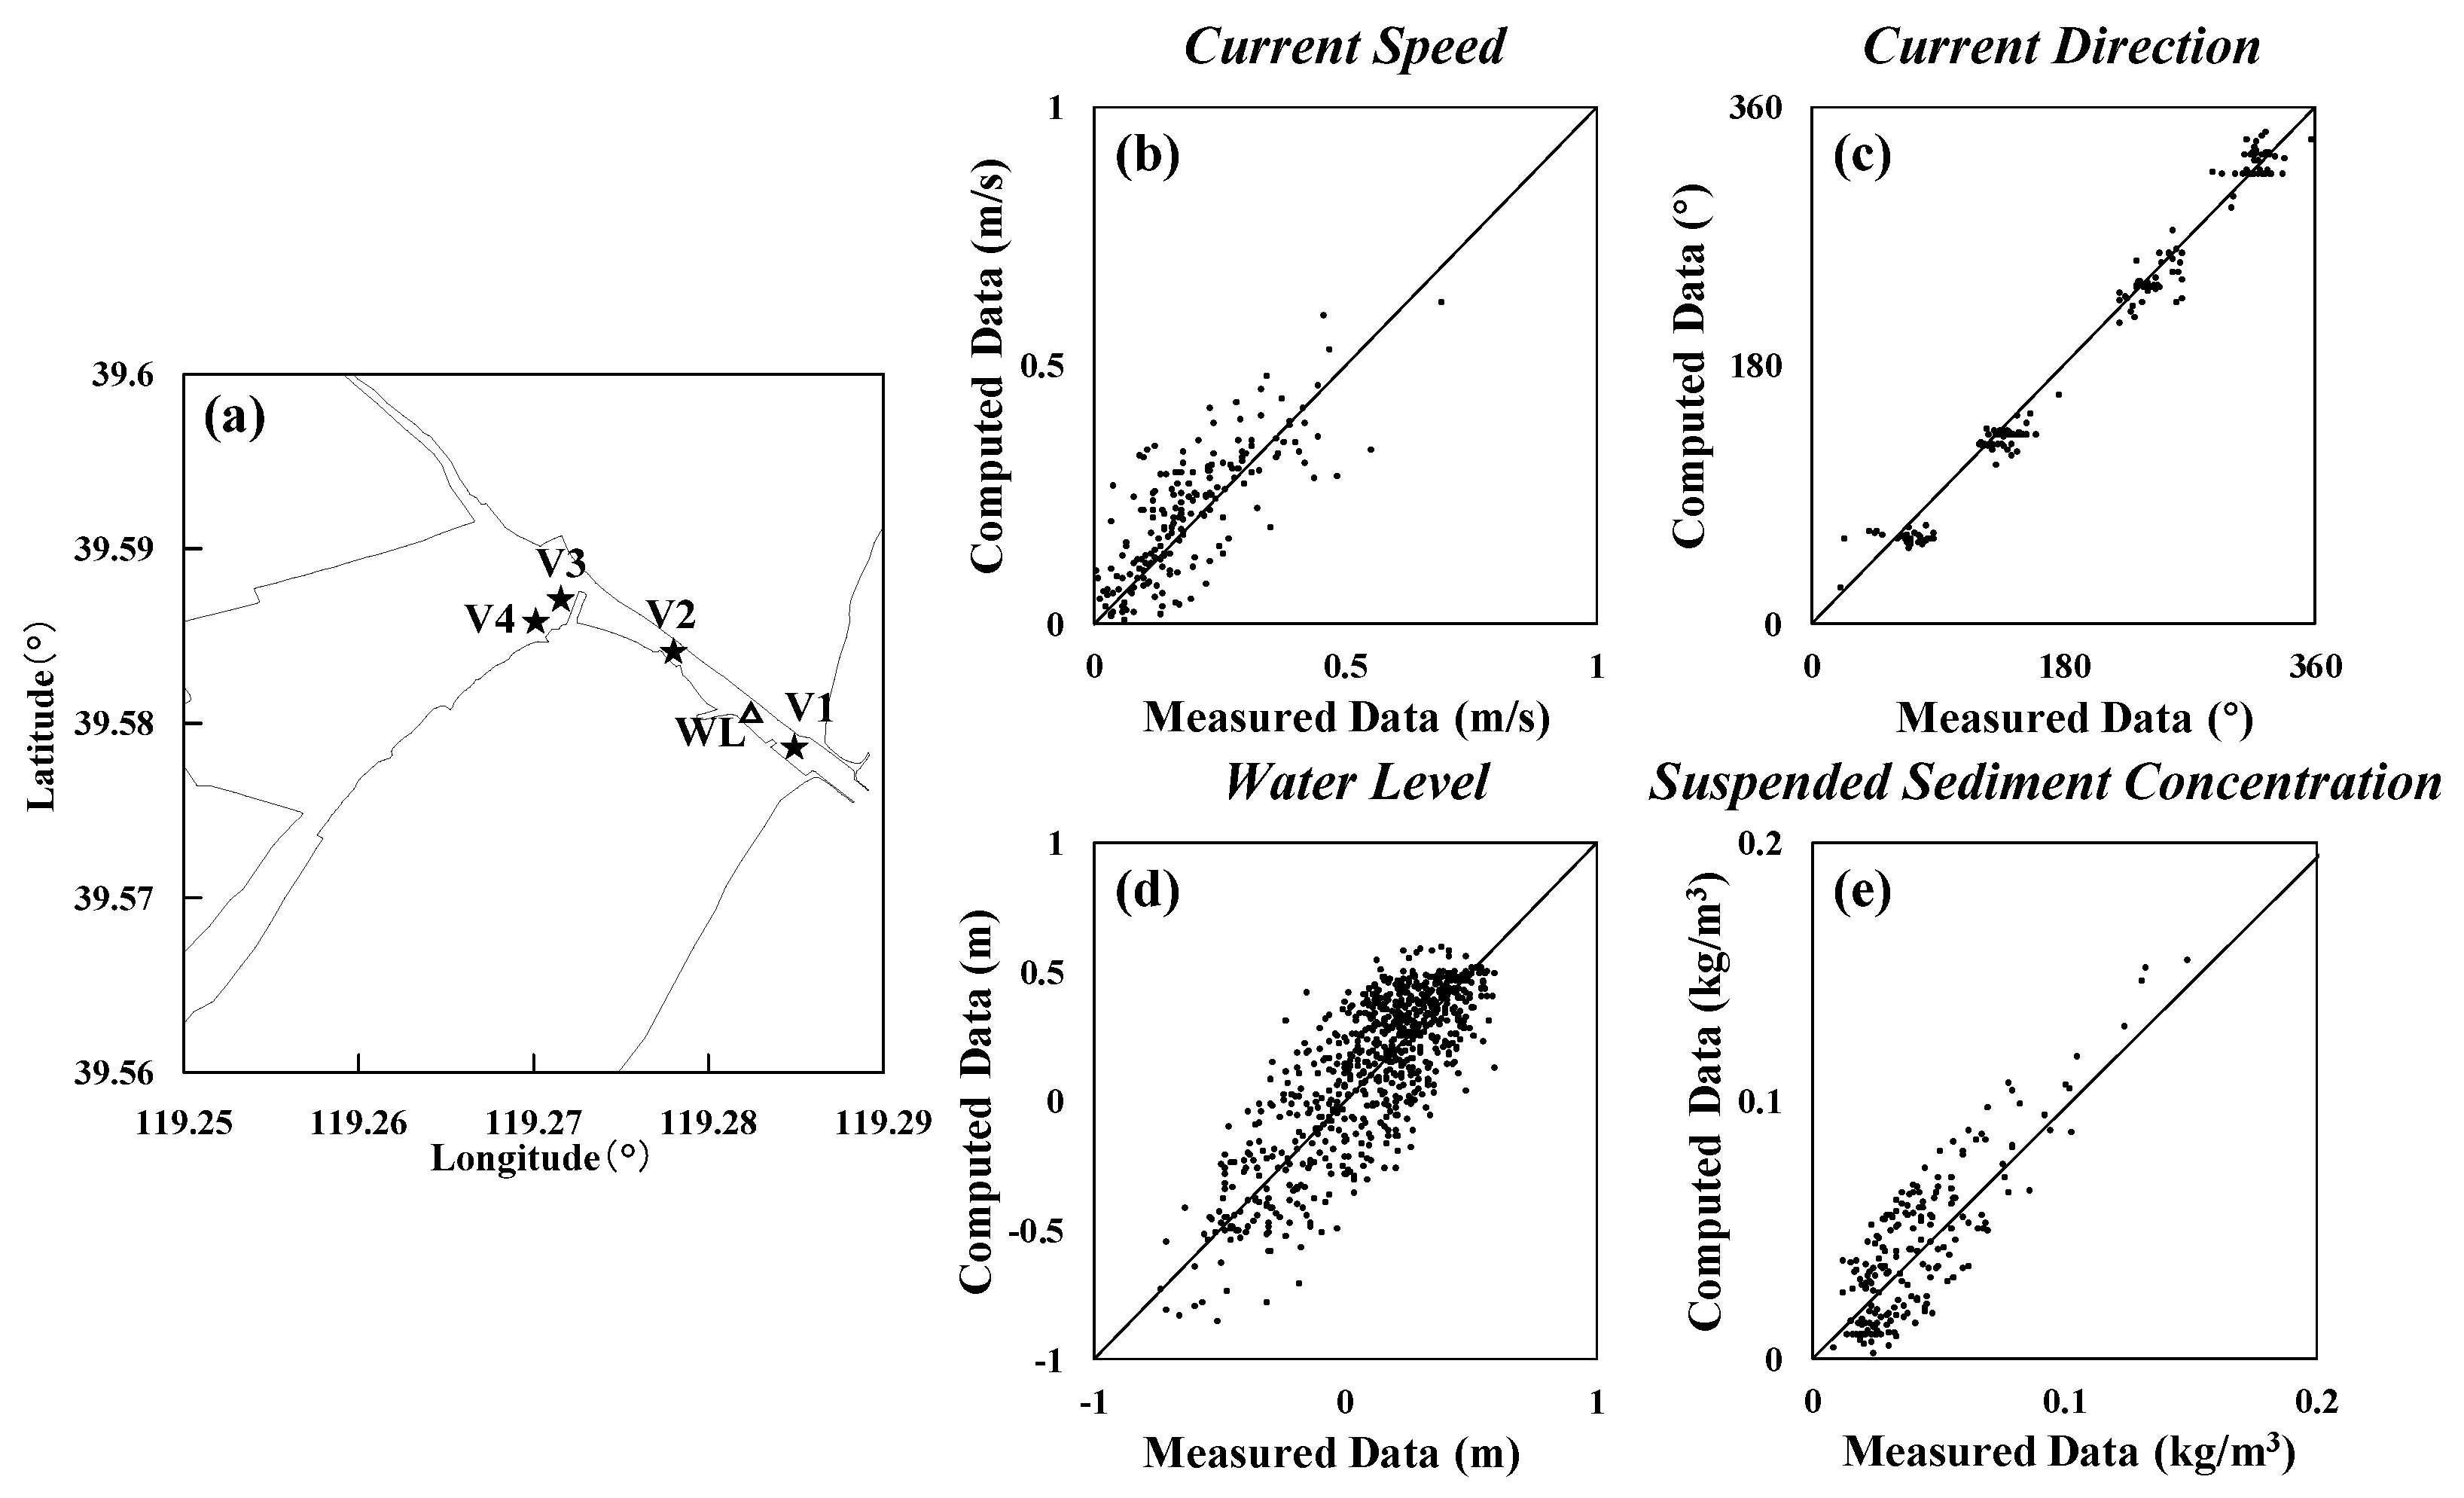
3.2. Model Verification
4. Geomorphological Evolution Process
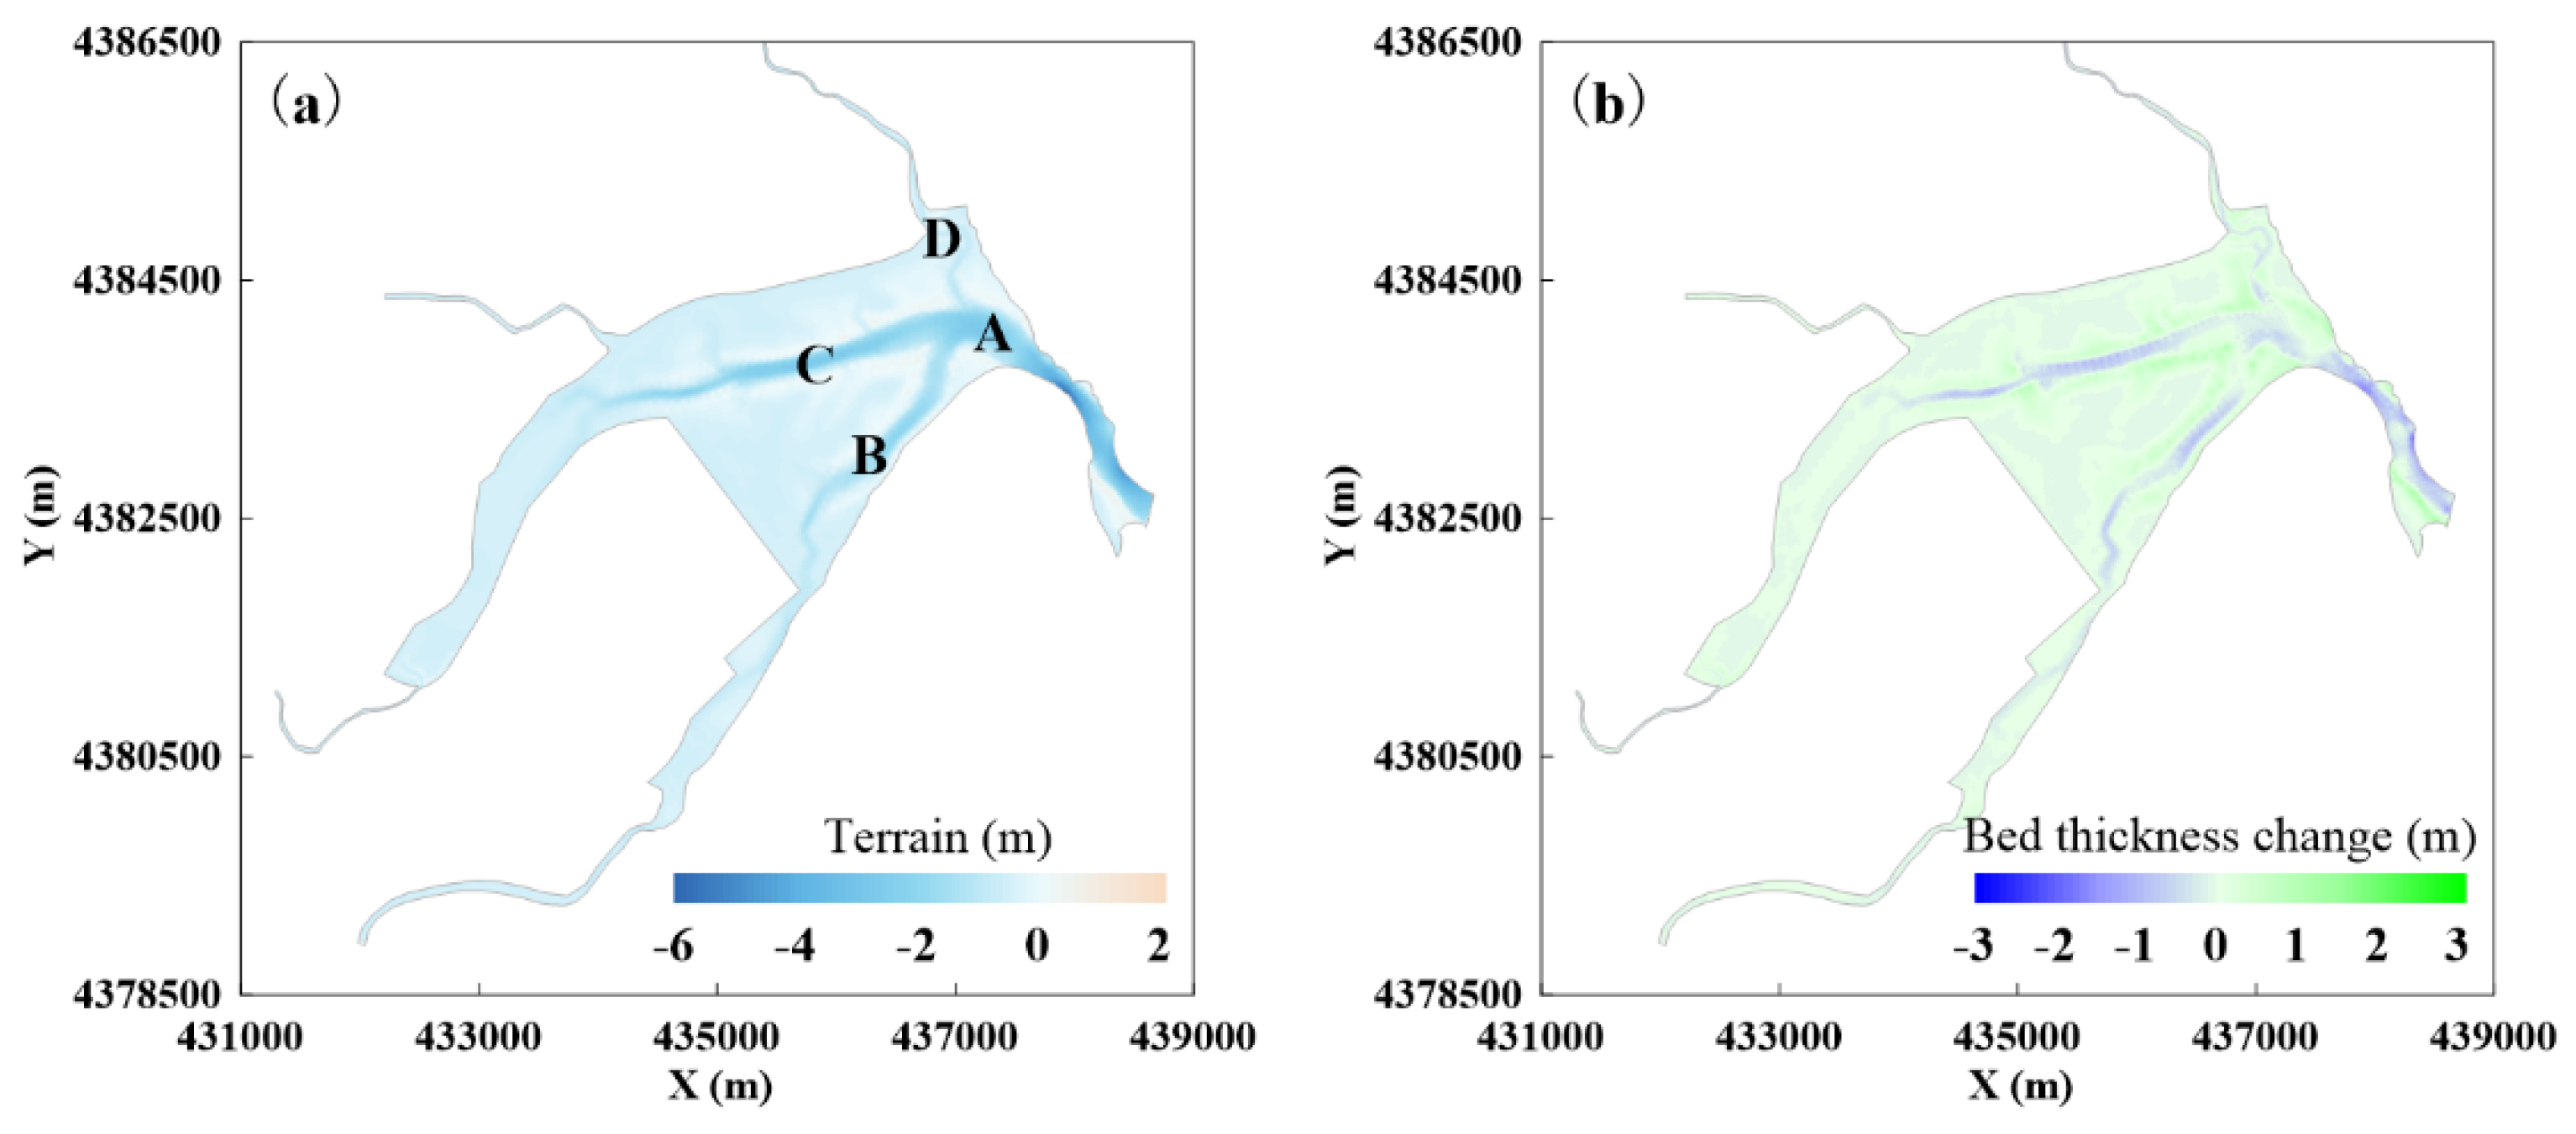
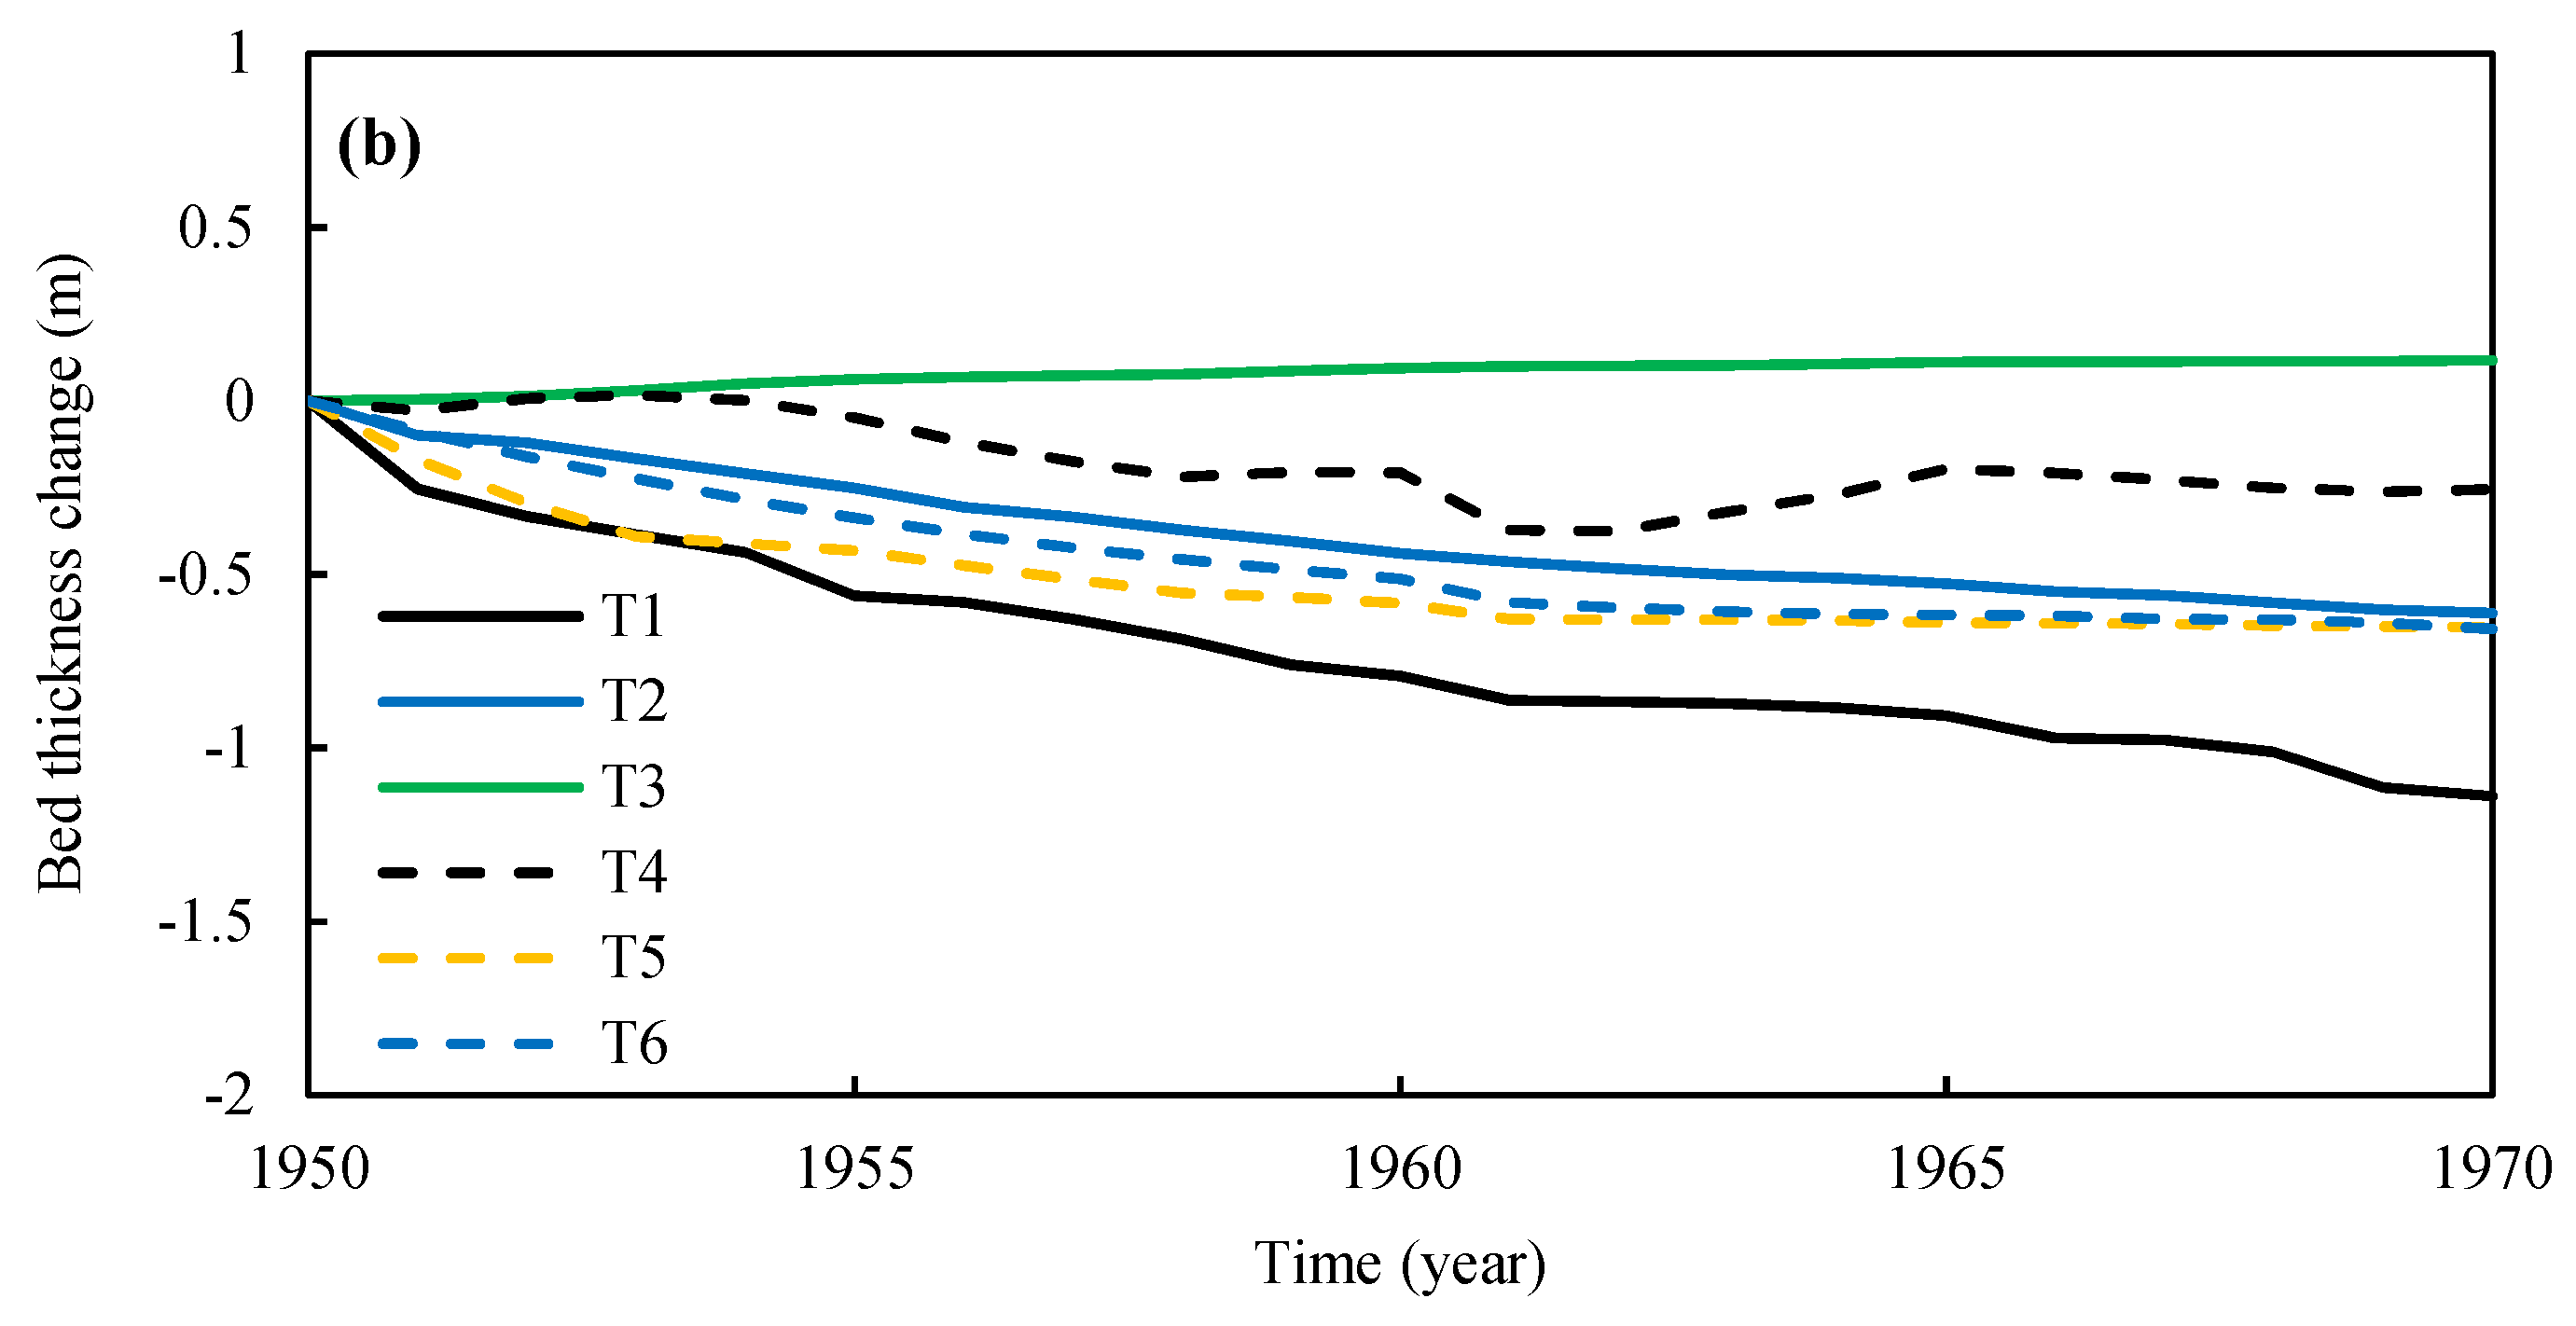
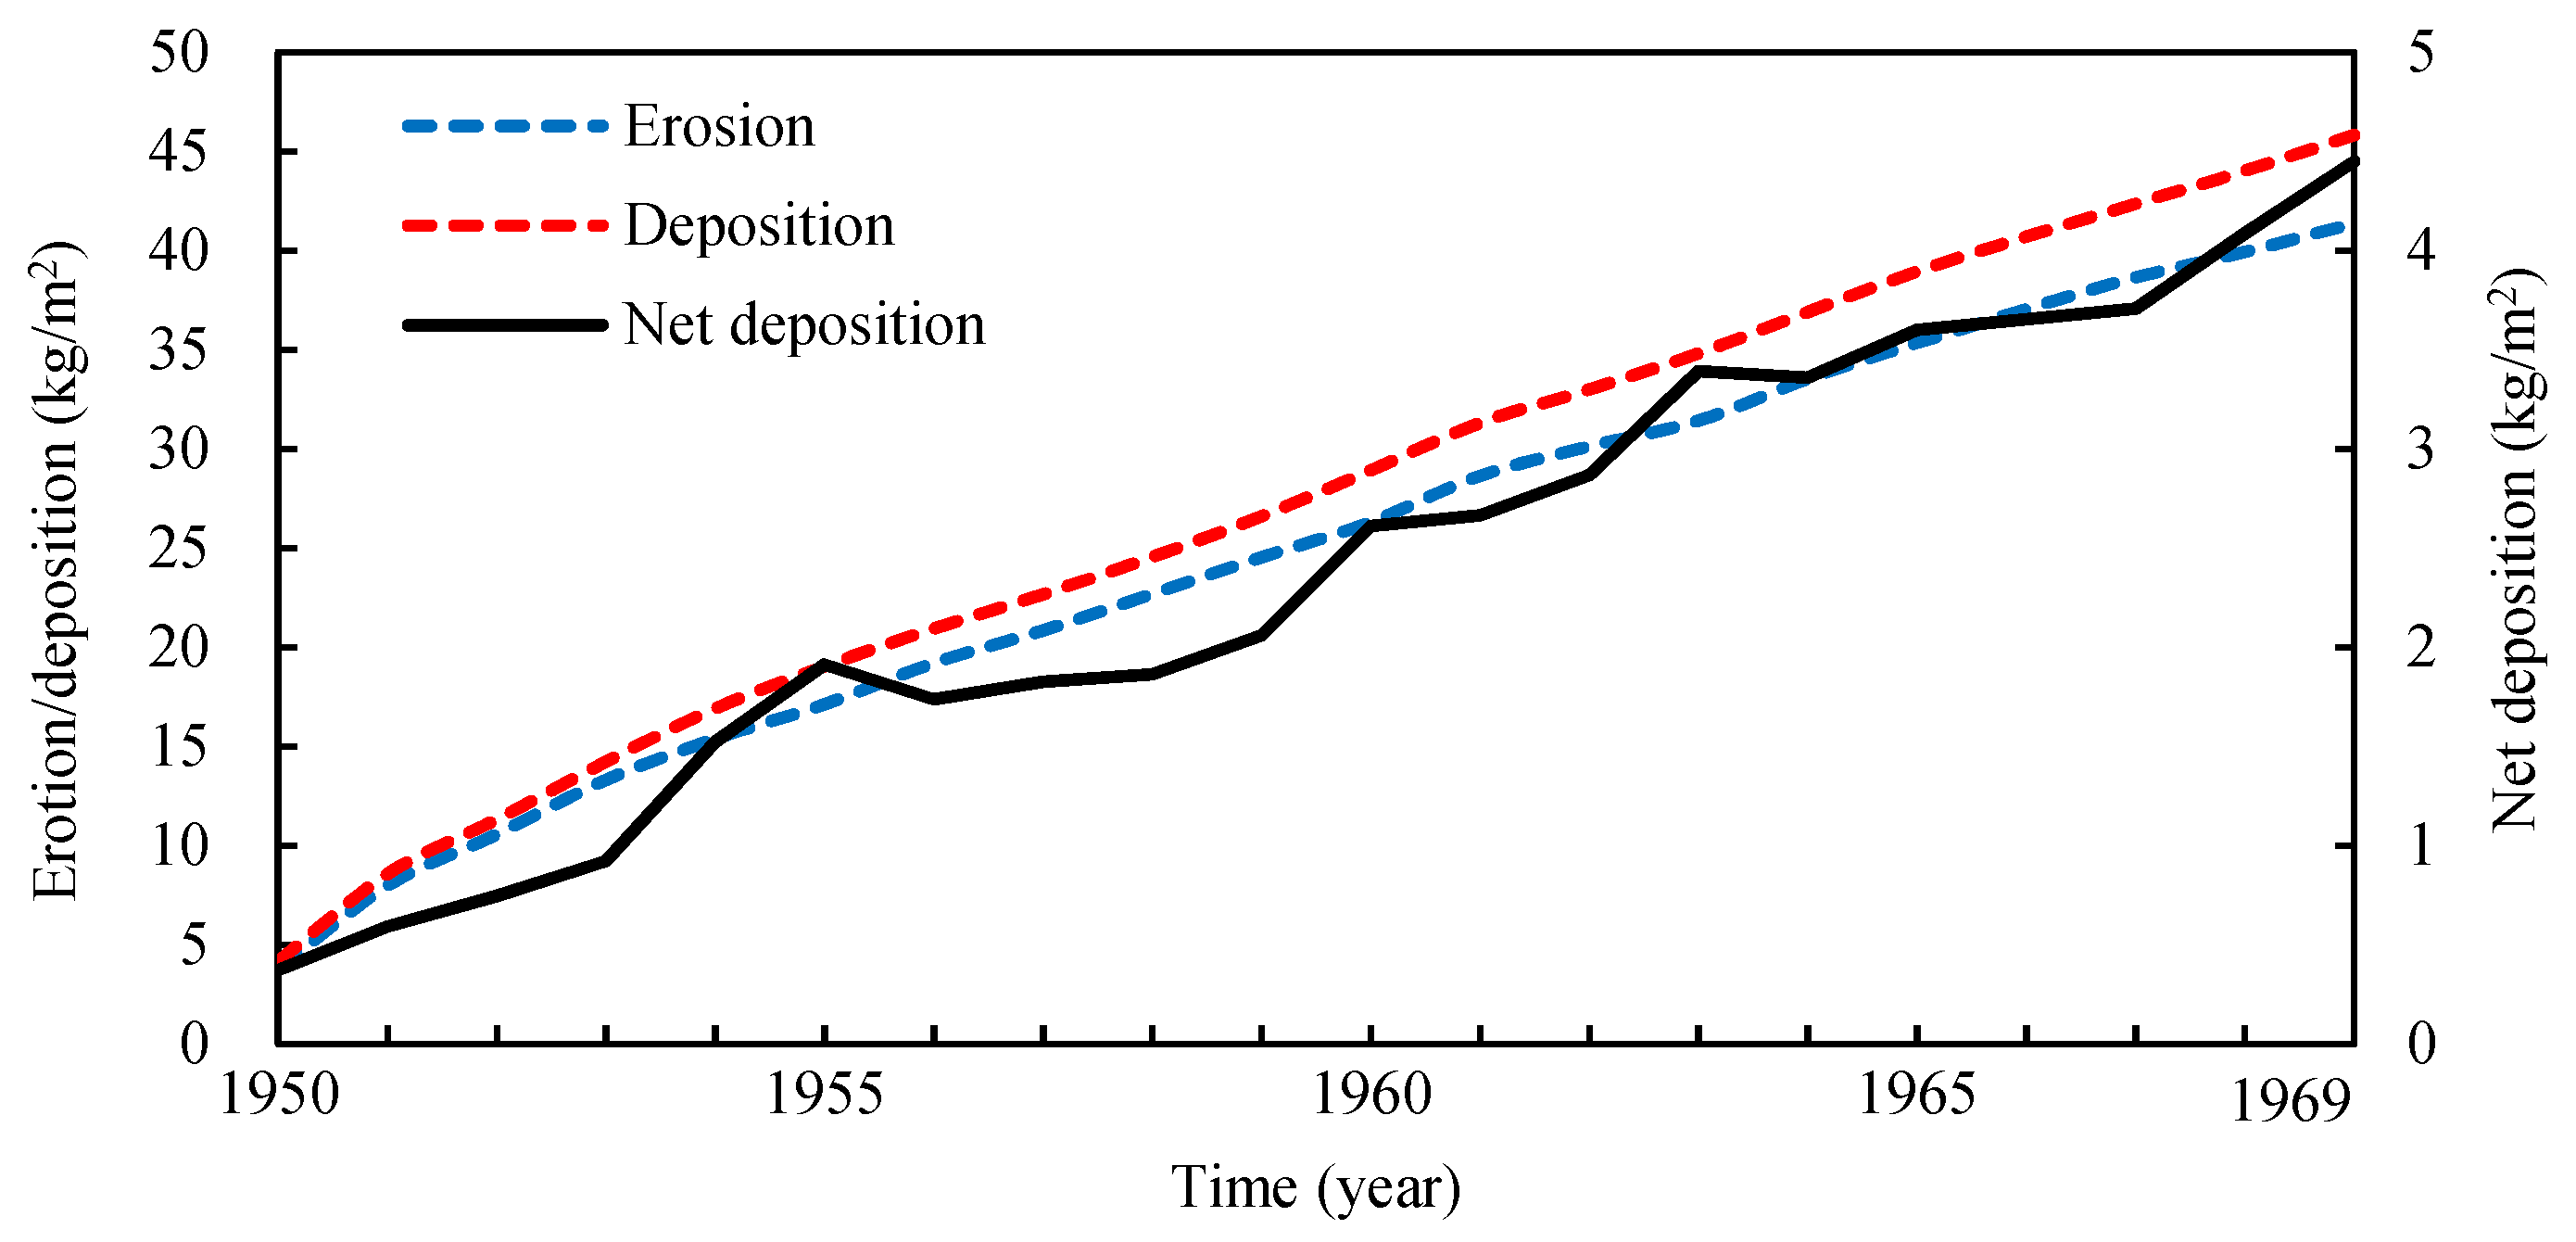
4.1. 1950~1969
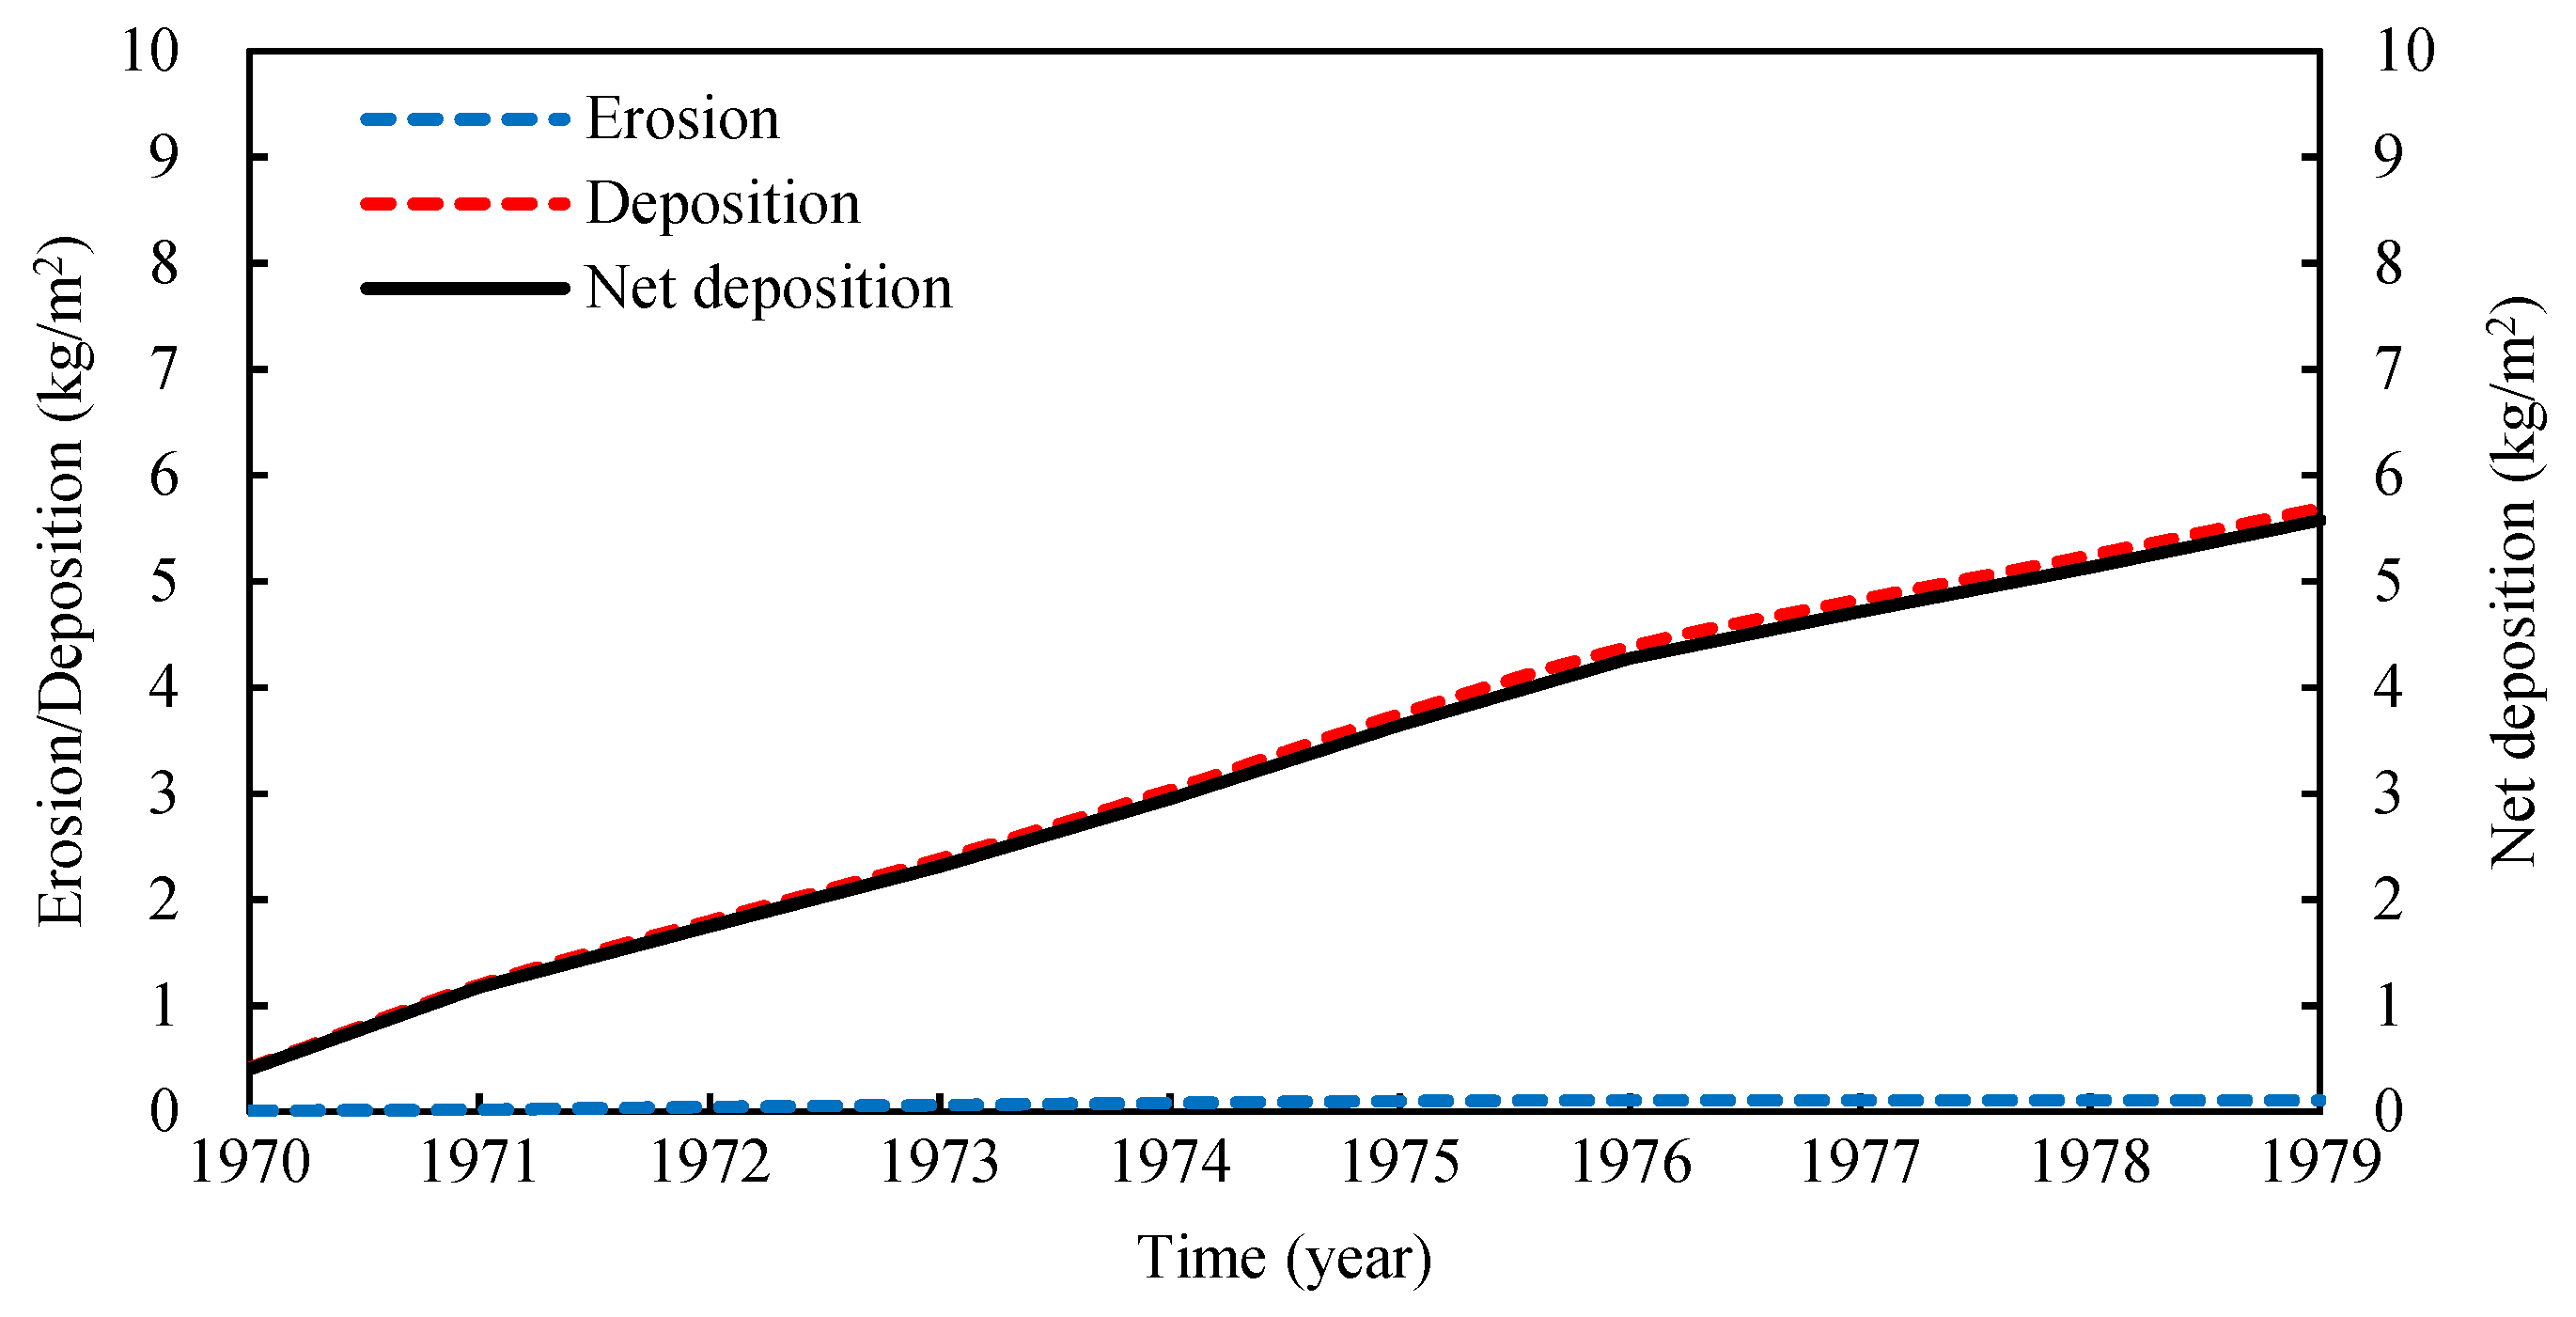
4.2. 1970~1979
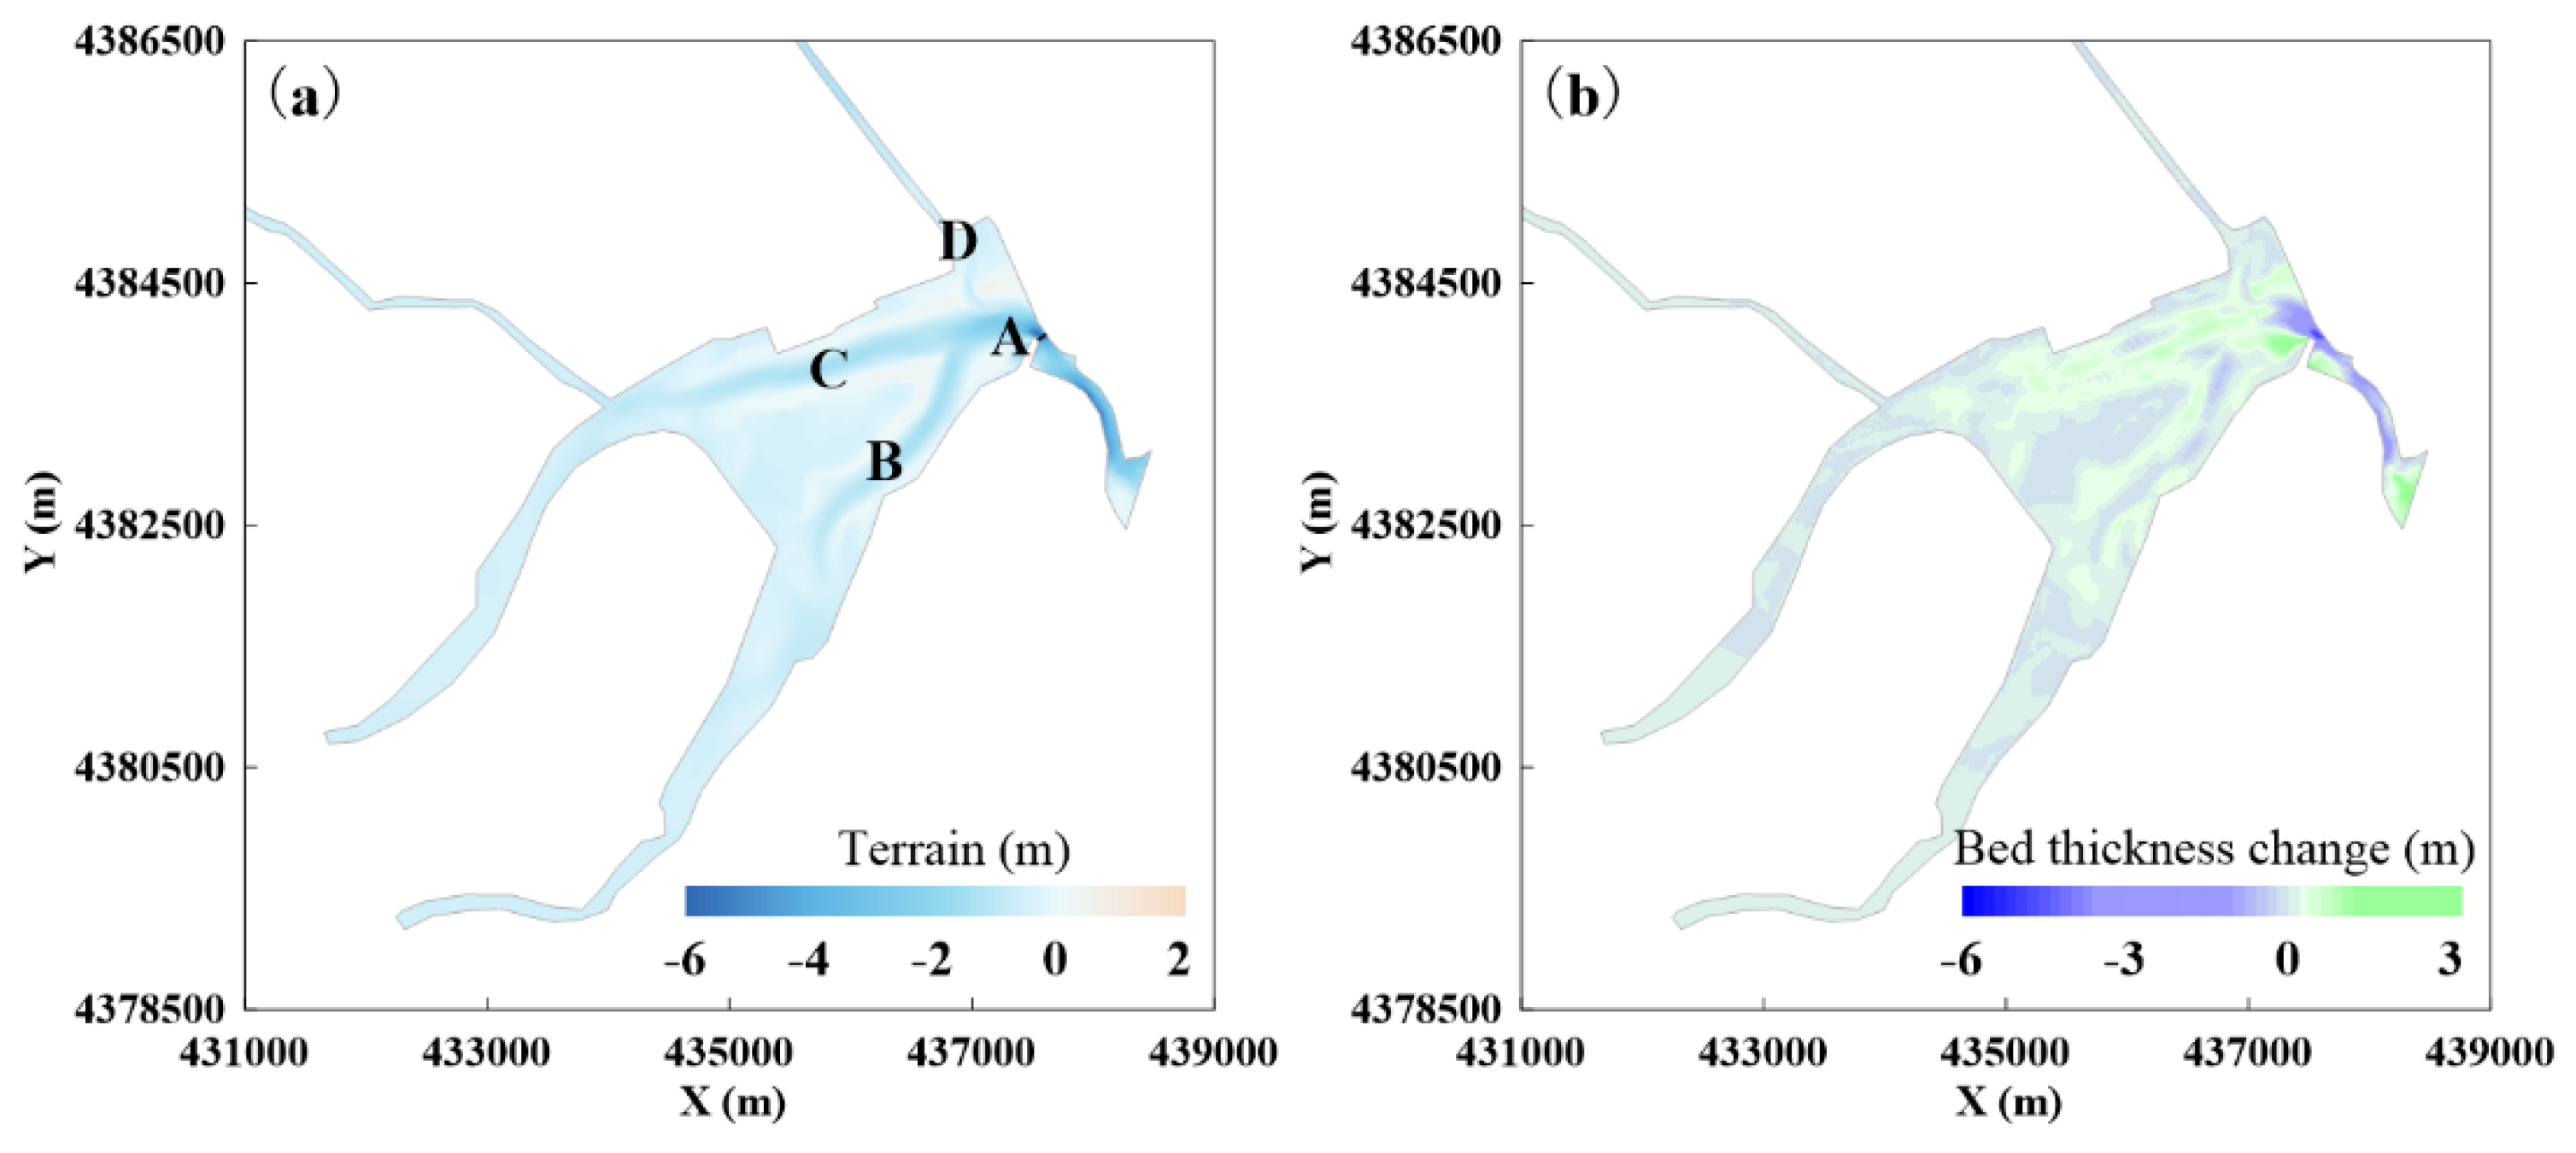
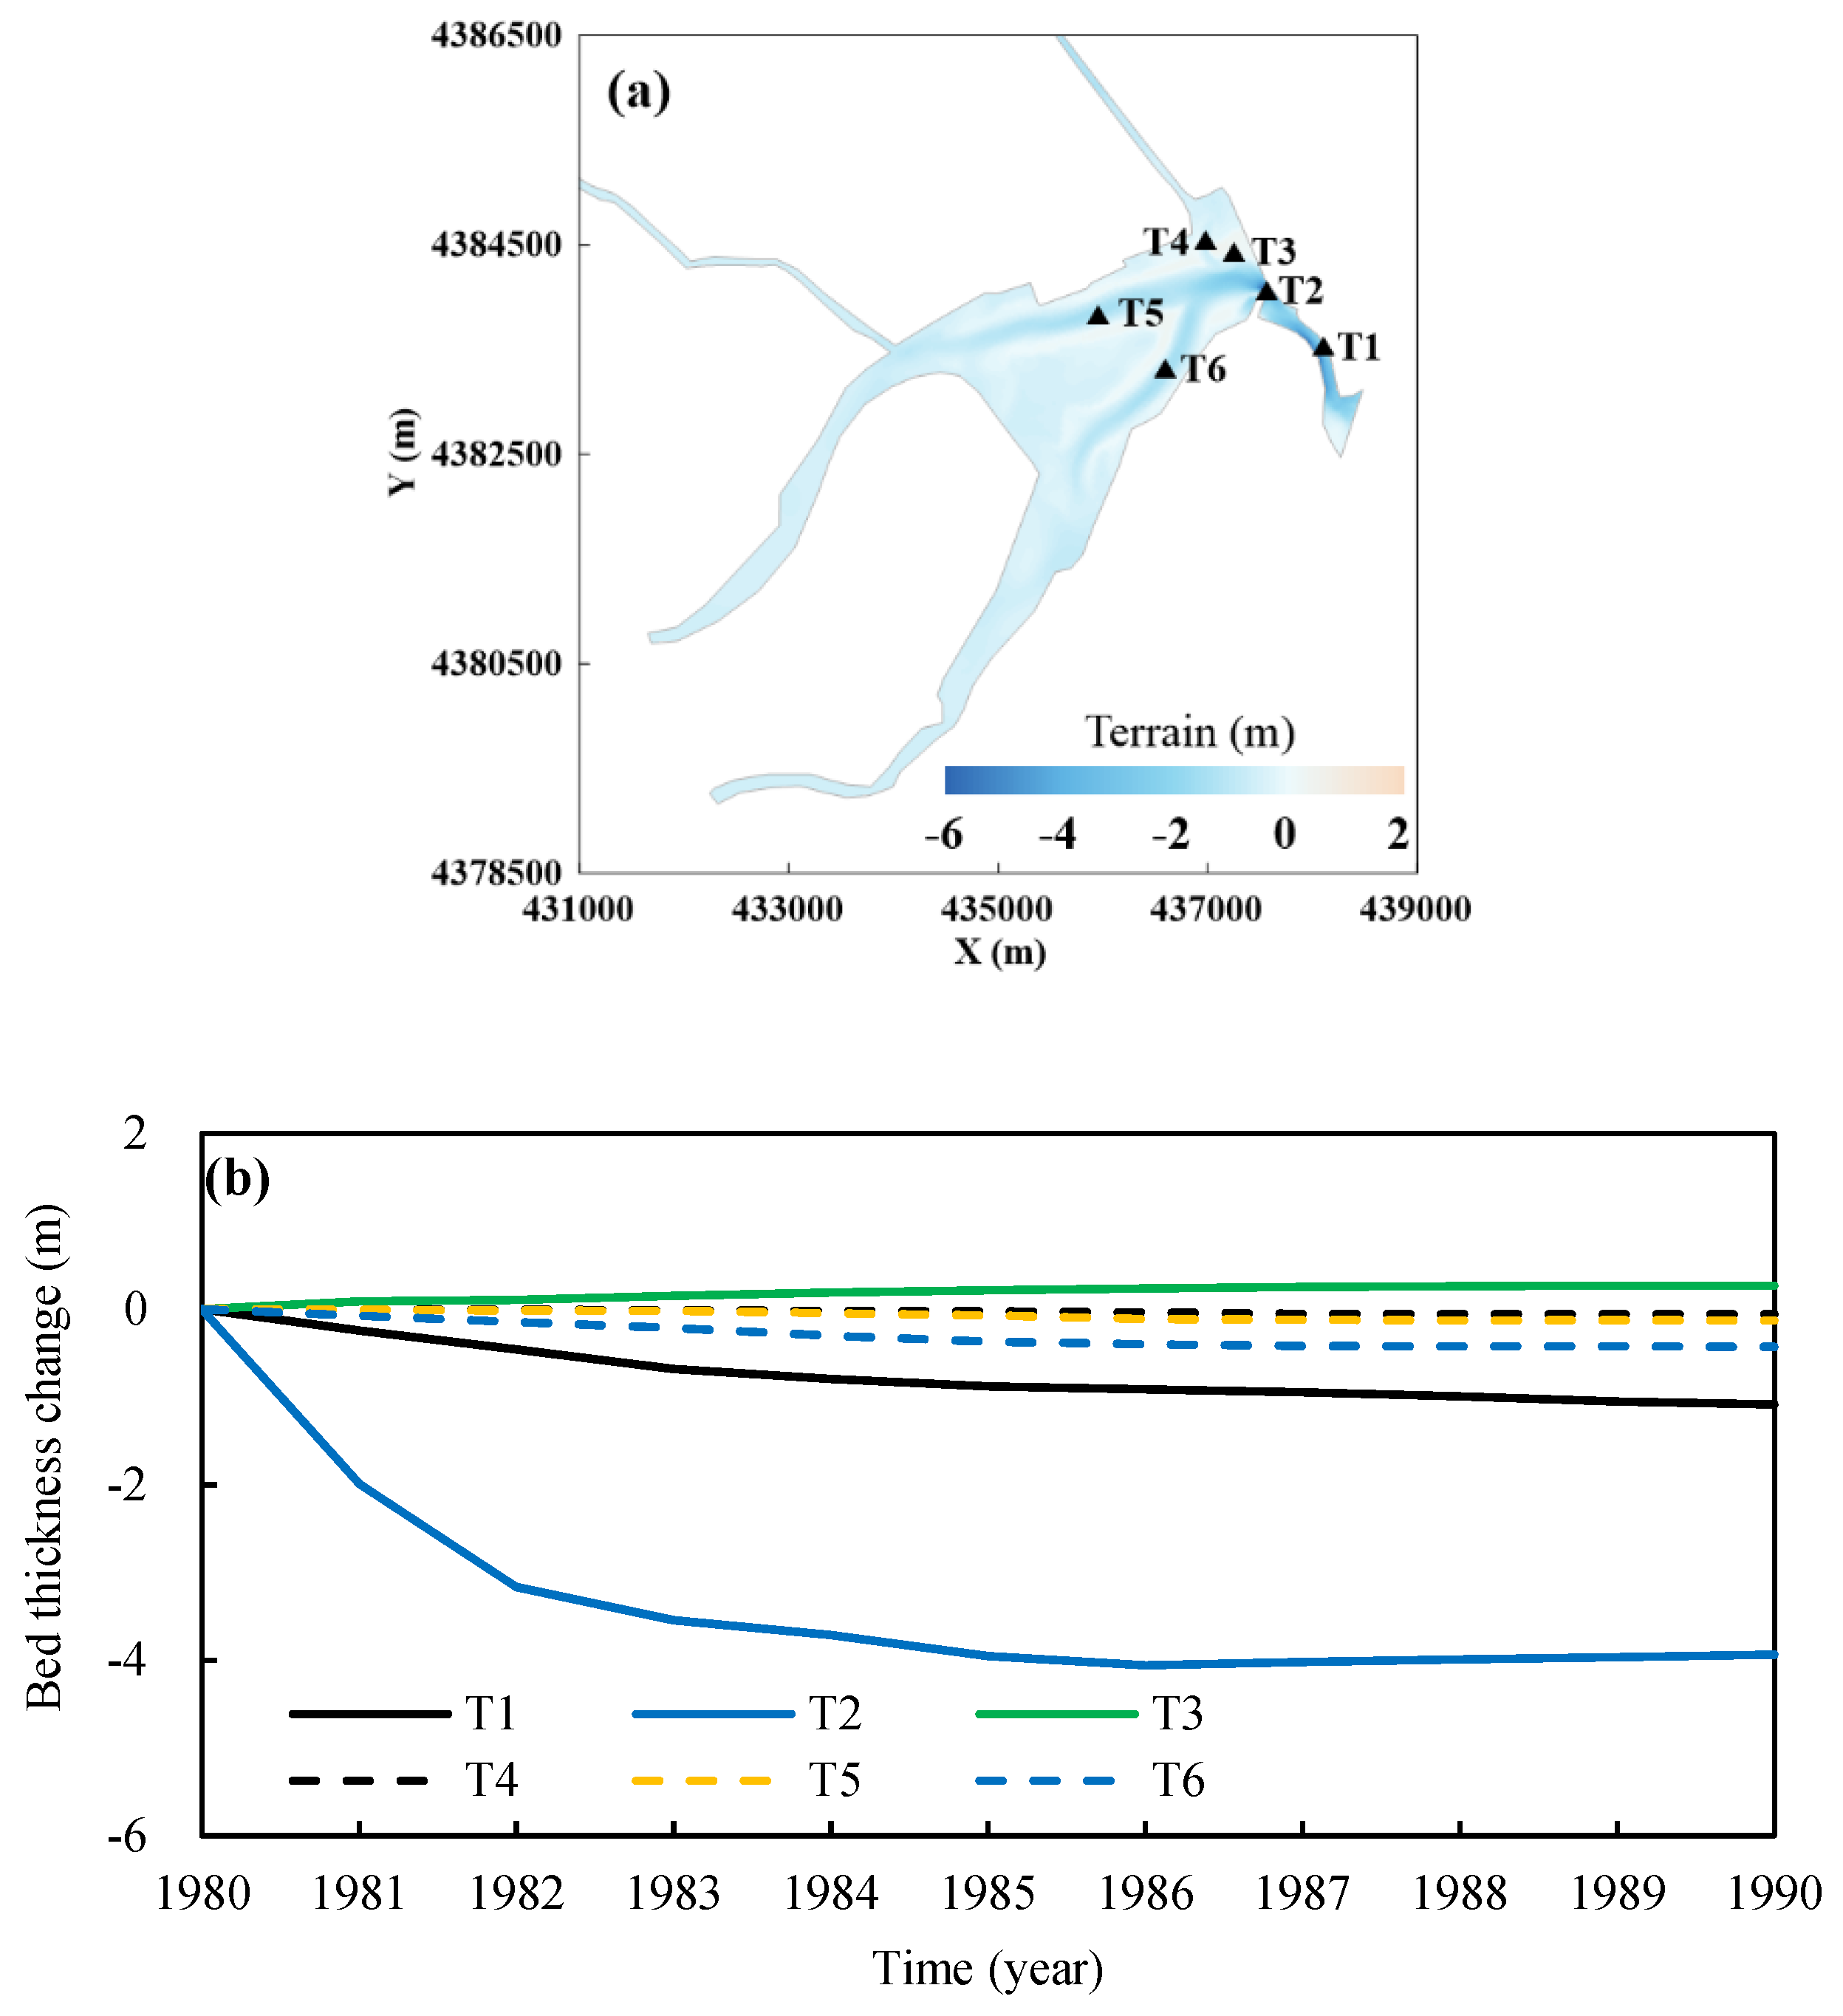
4.3. 1980~1989
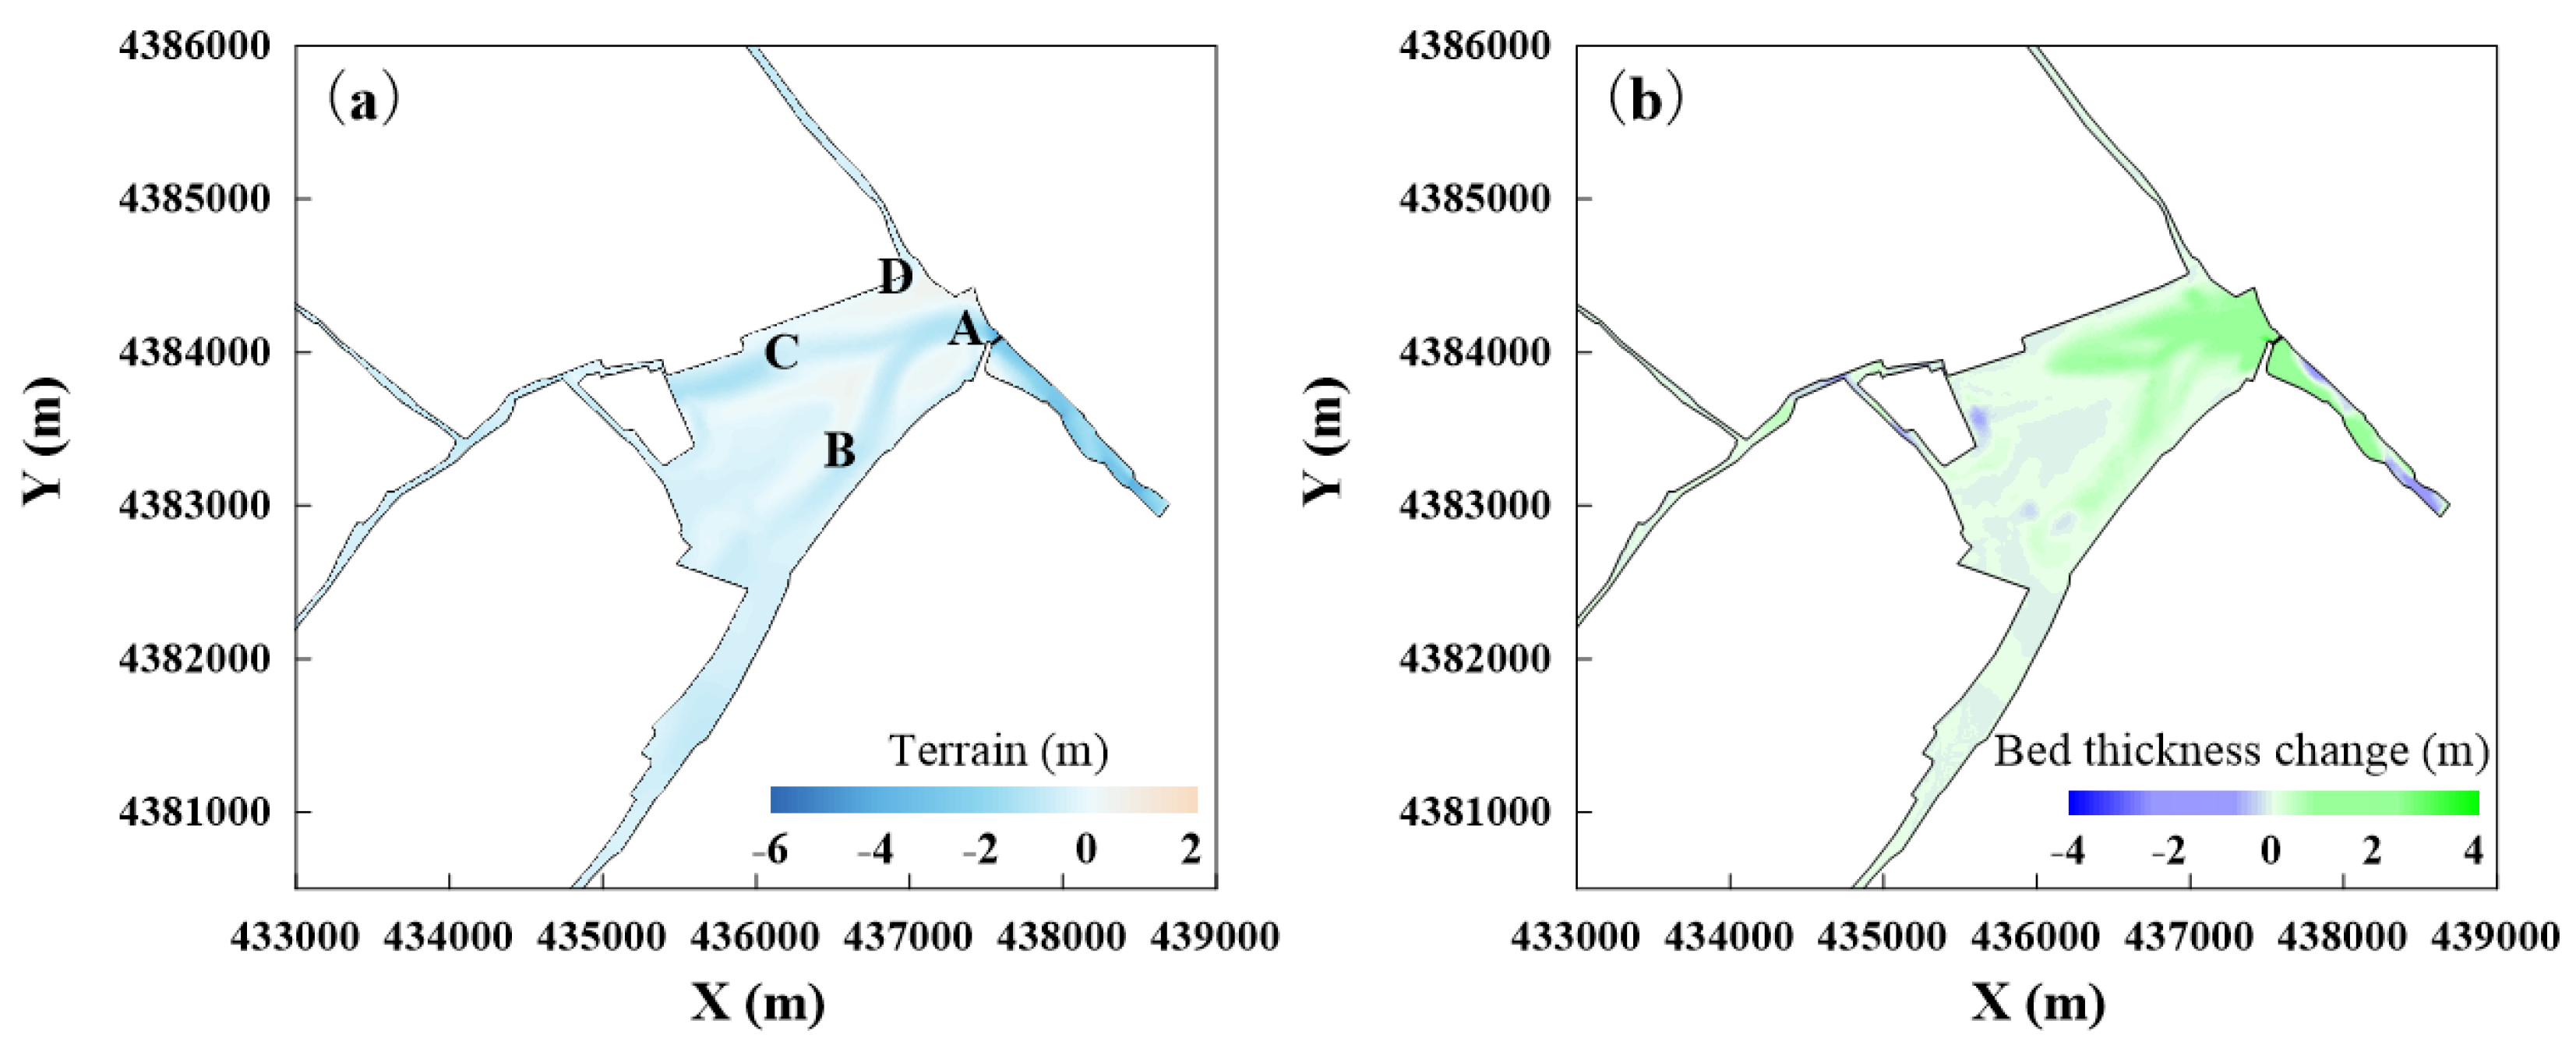
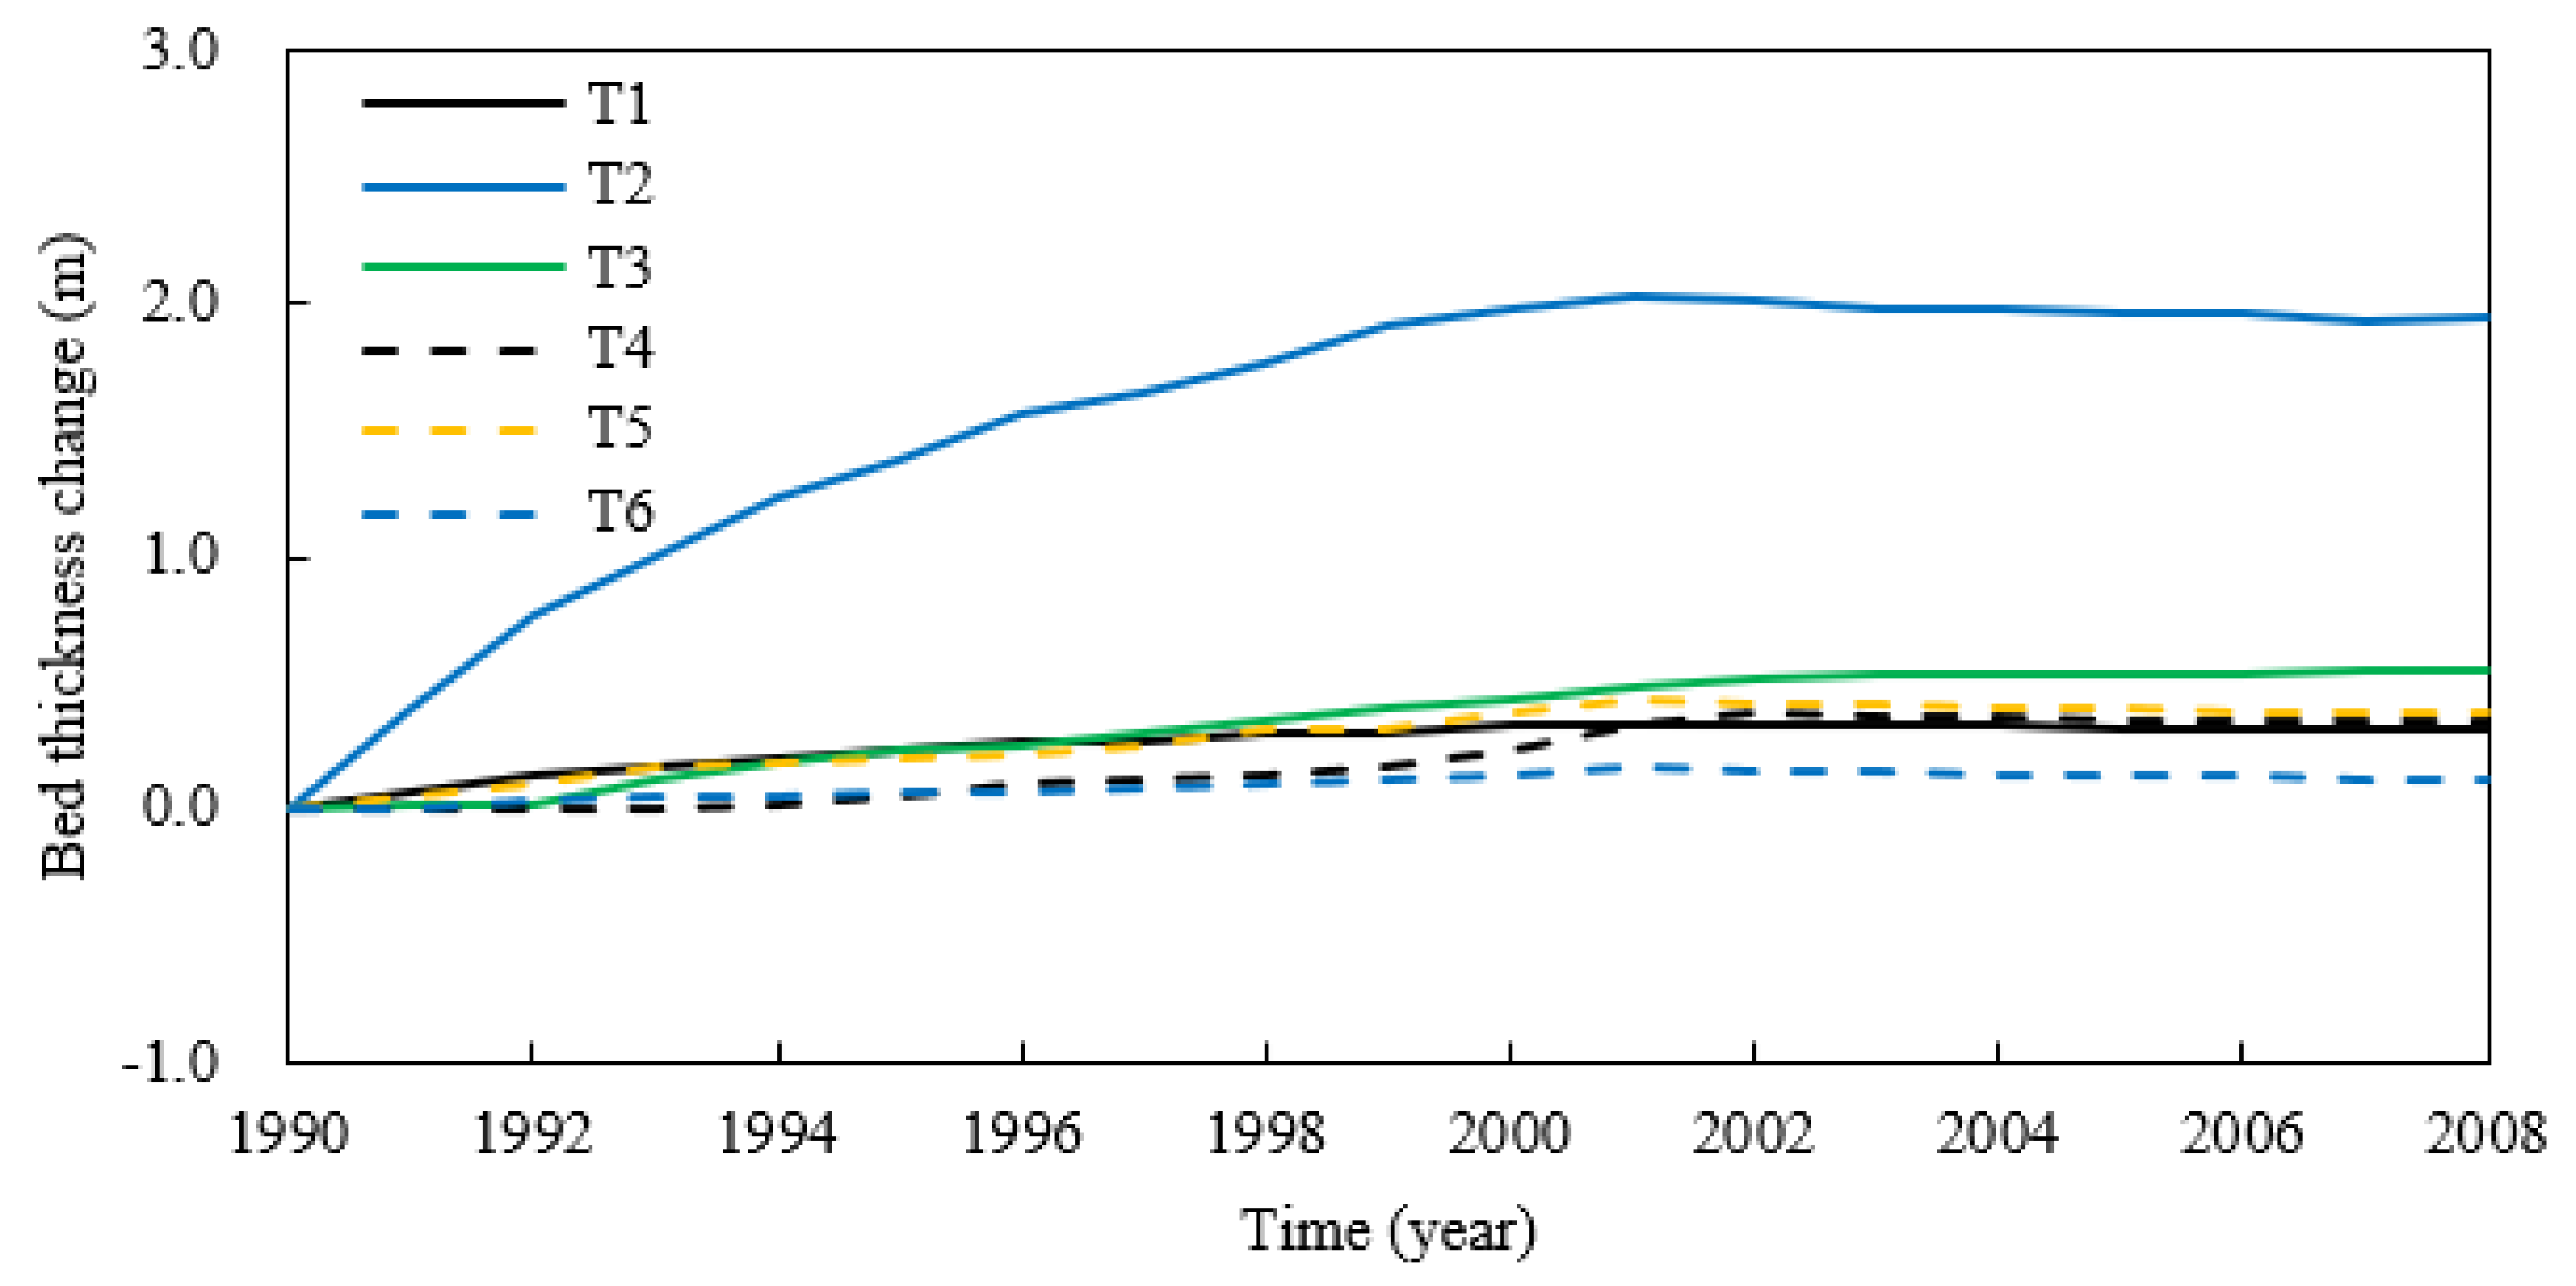
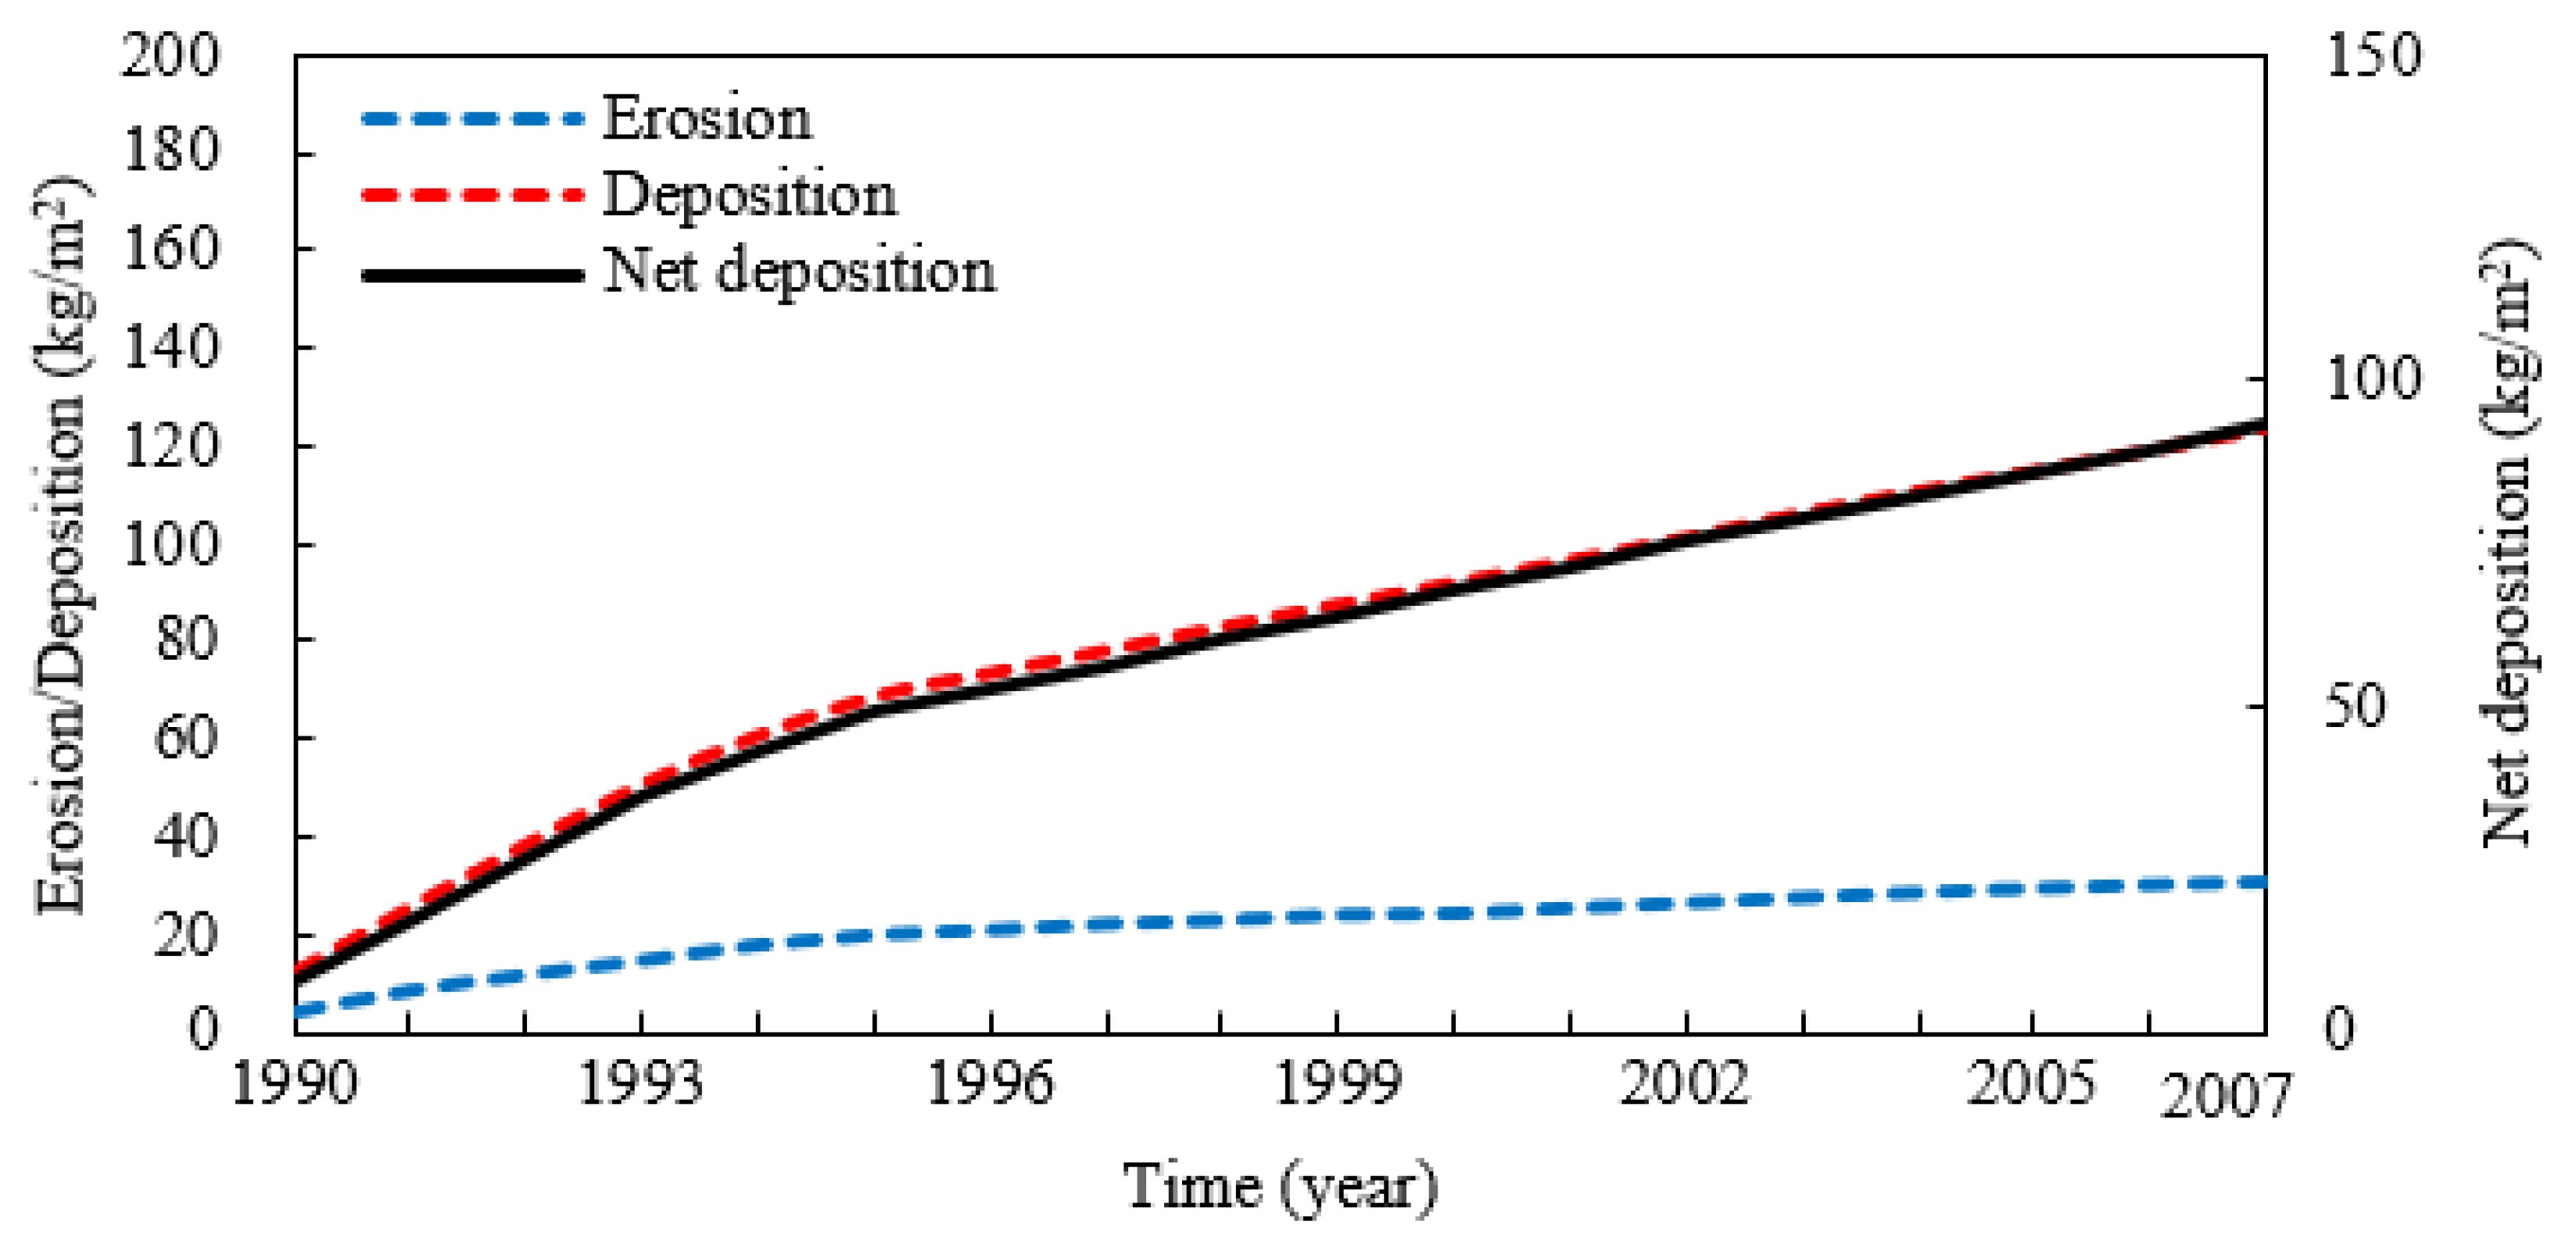
4.4. 1990~2007
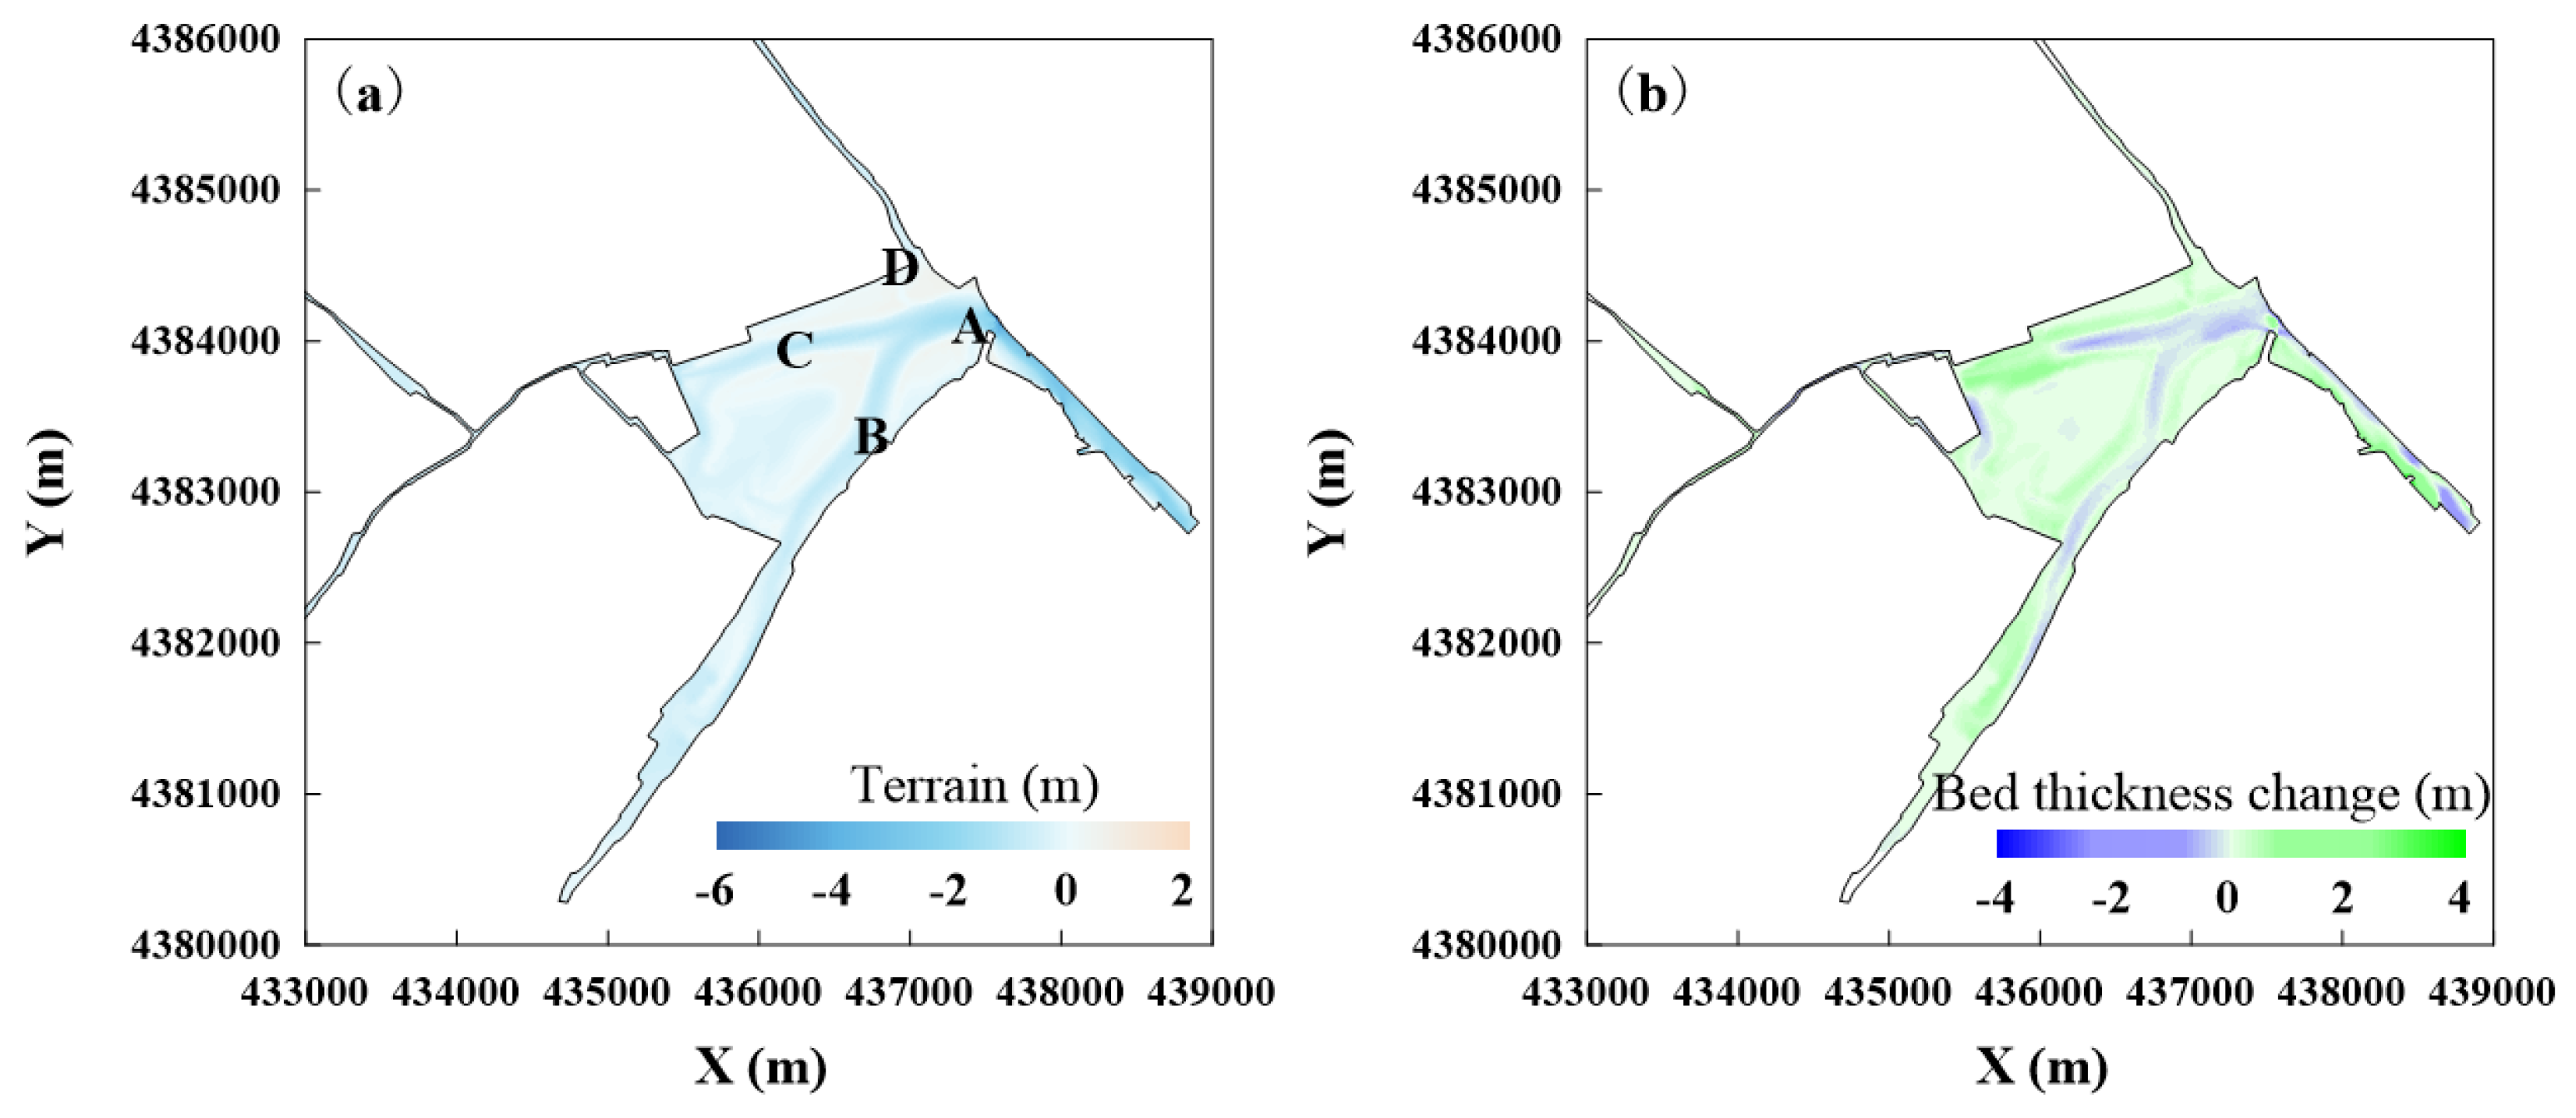
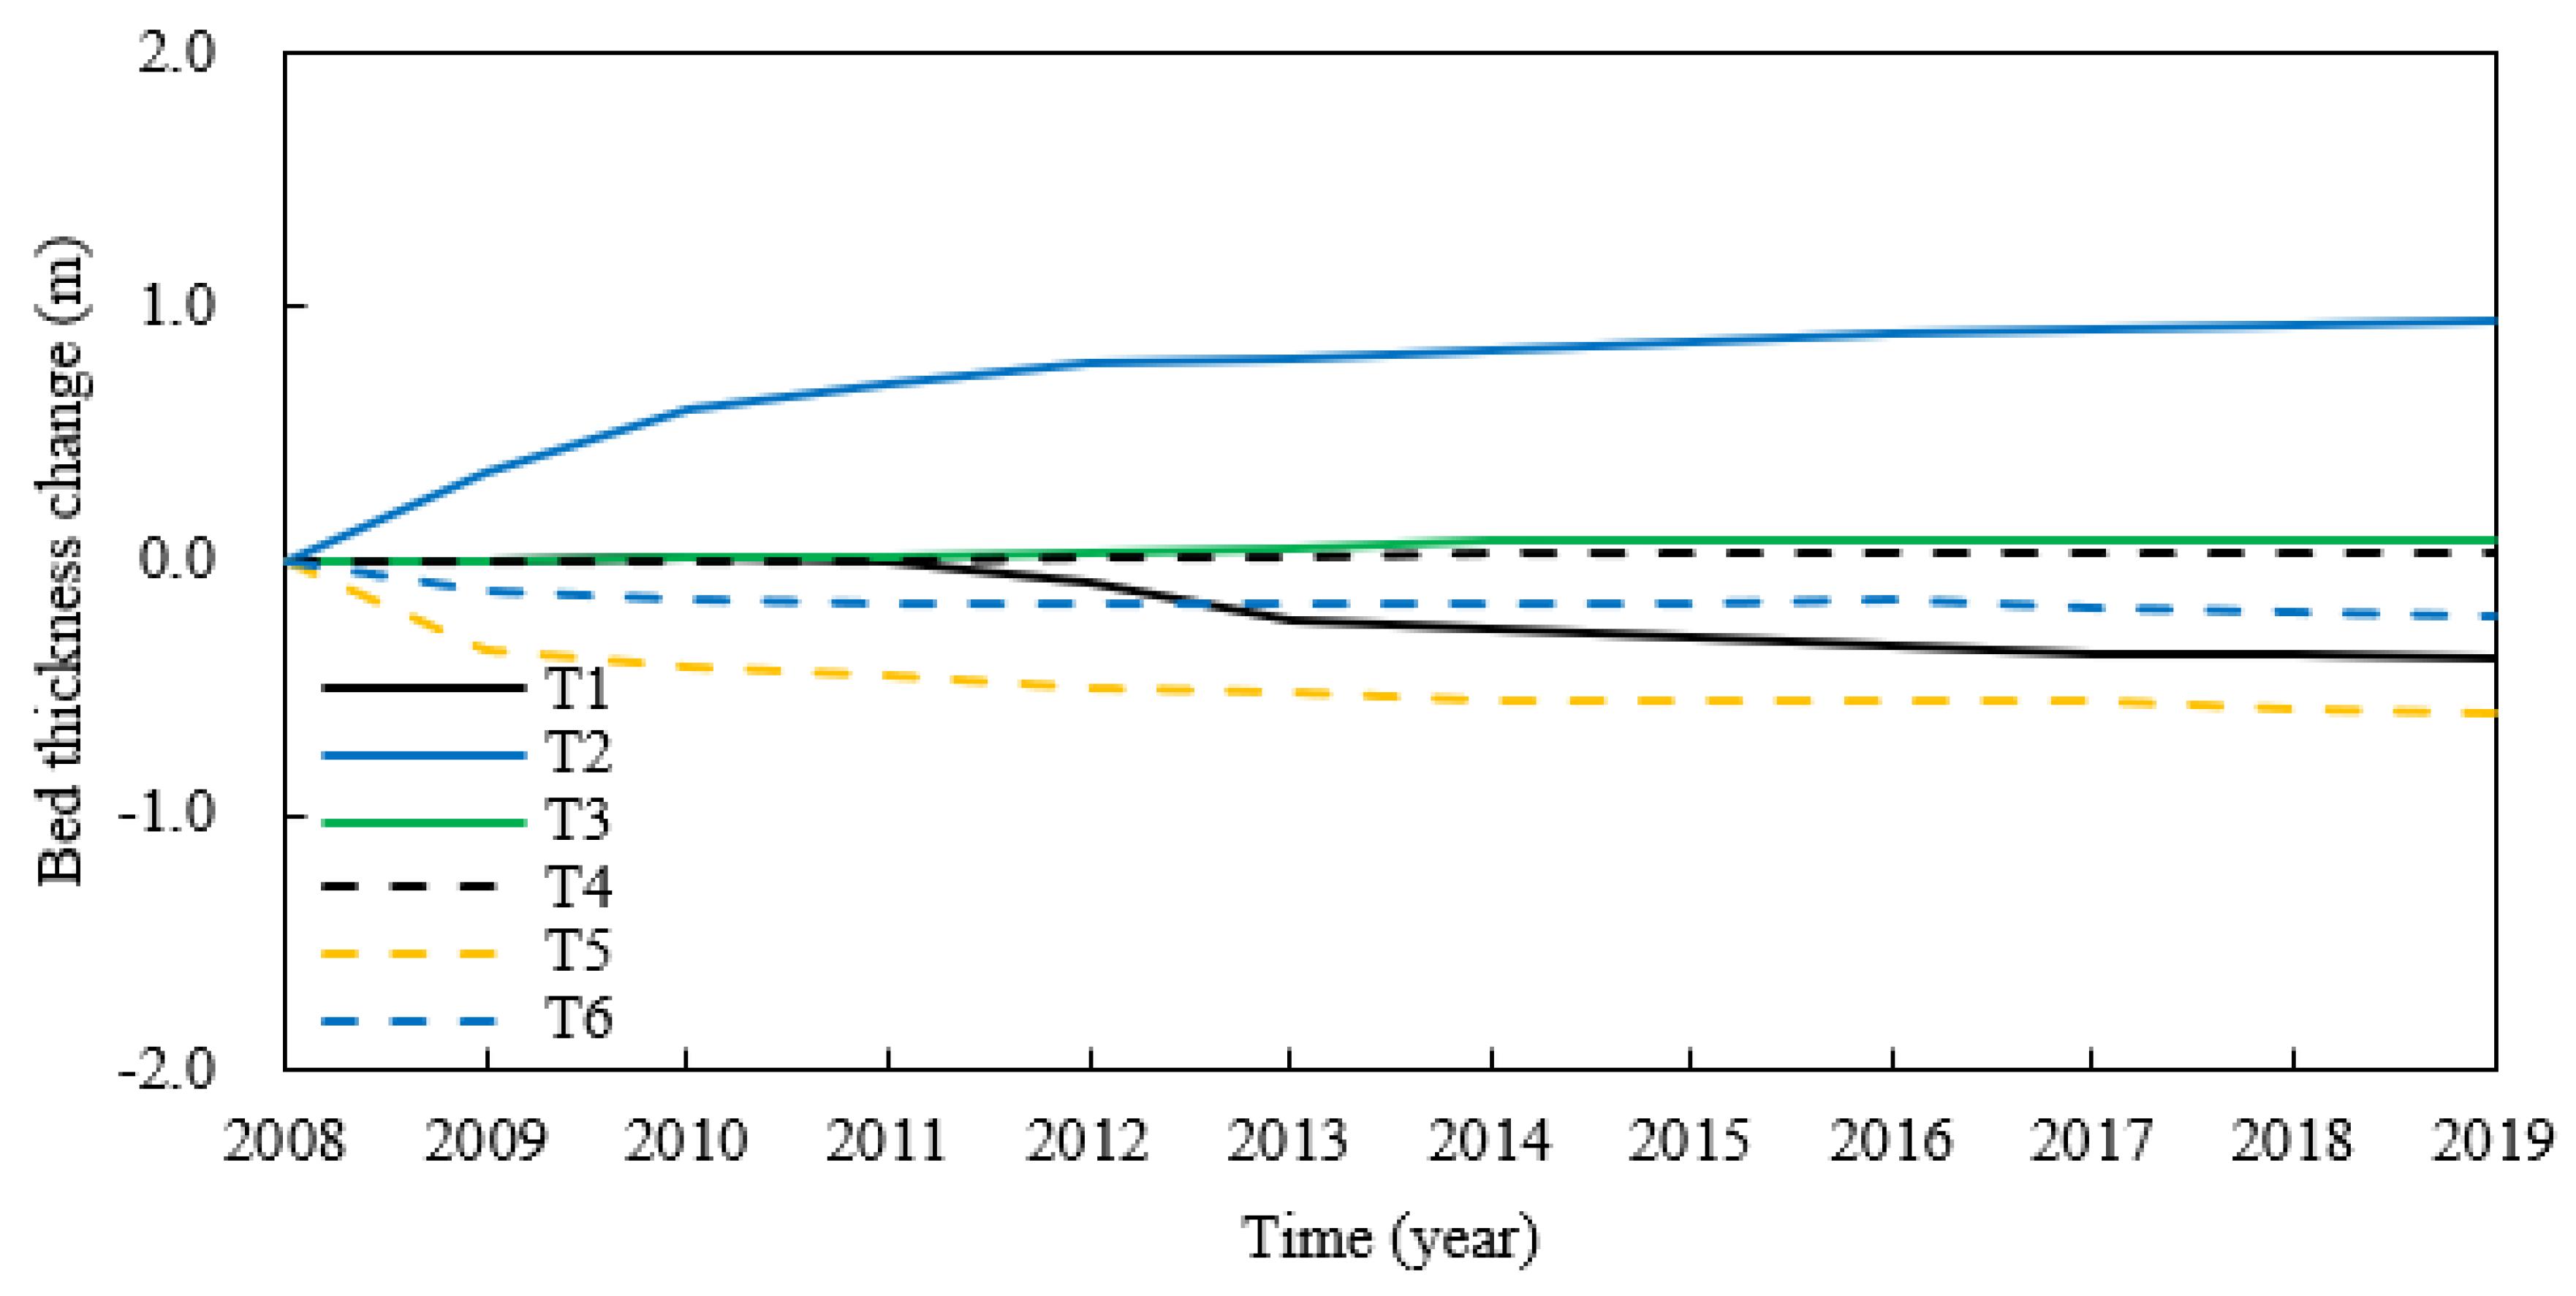
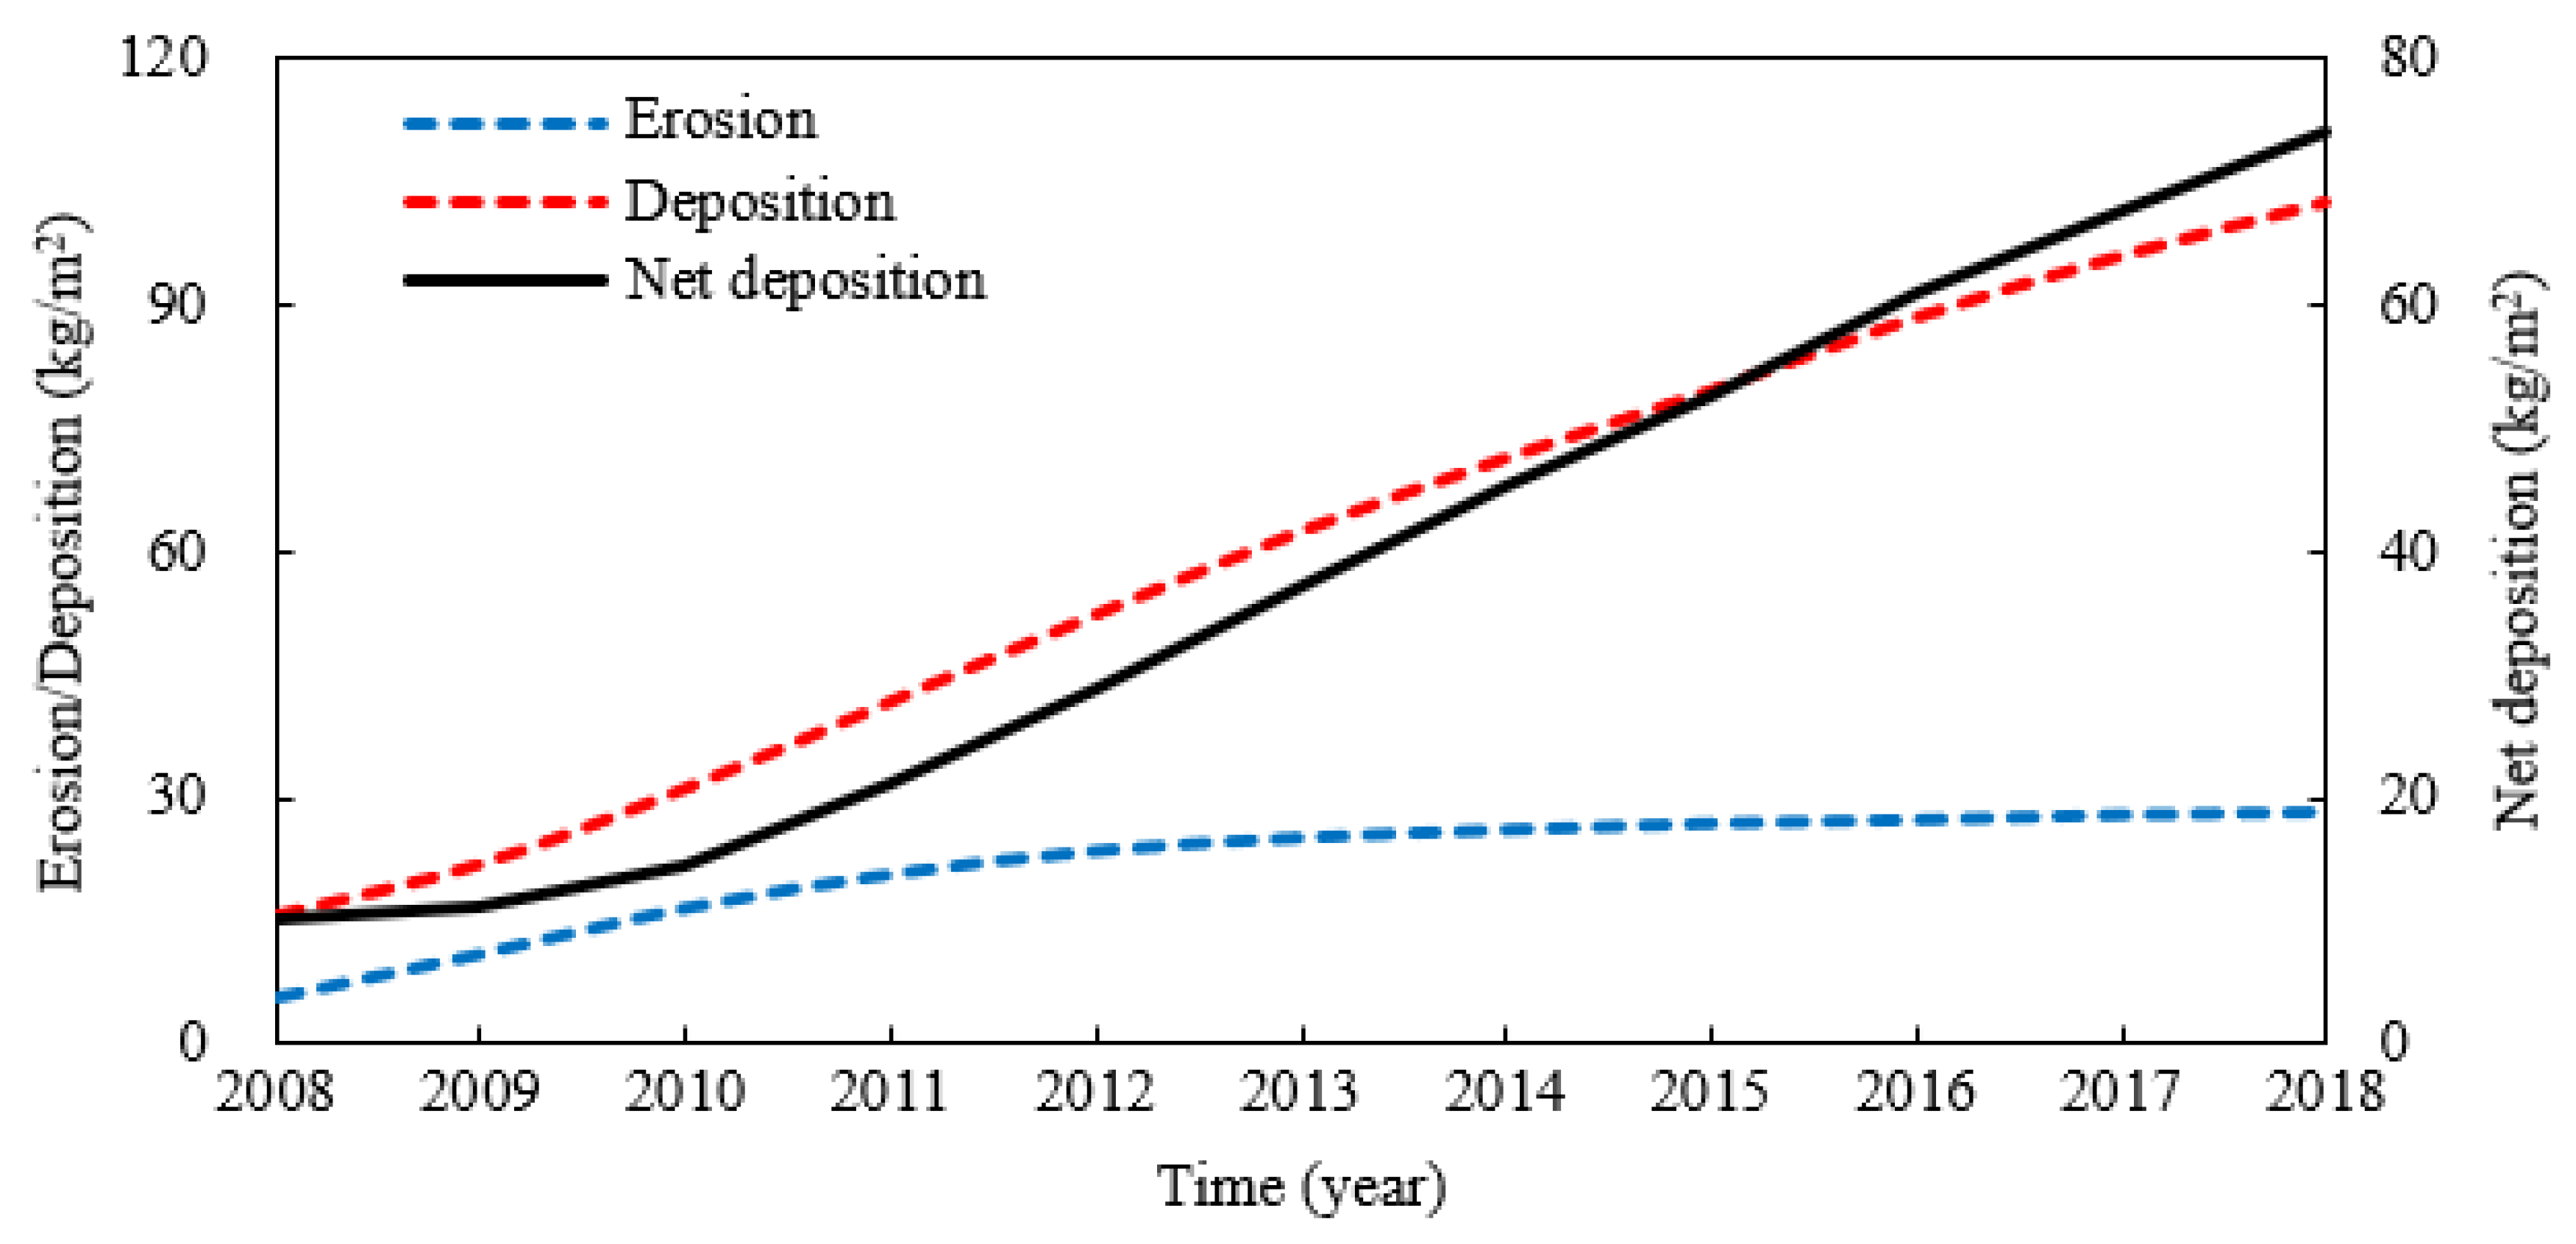
4.5. 2008~2018
5. Discussions
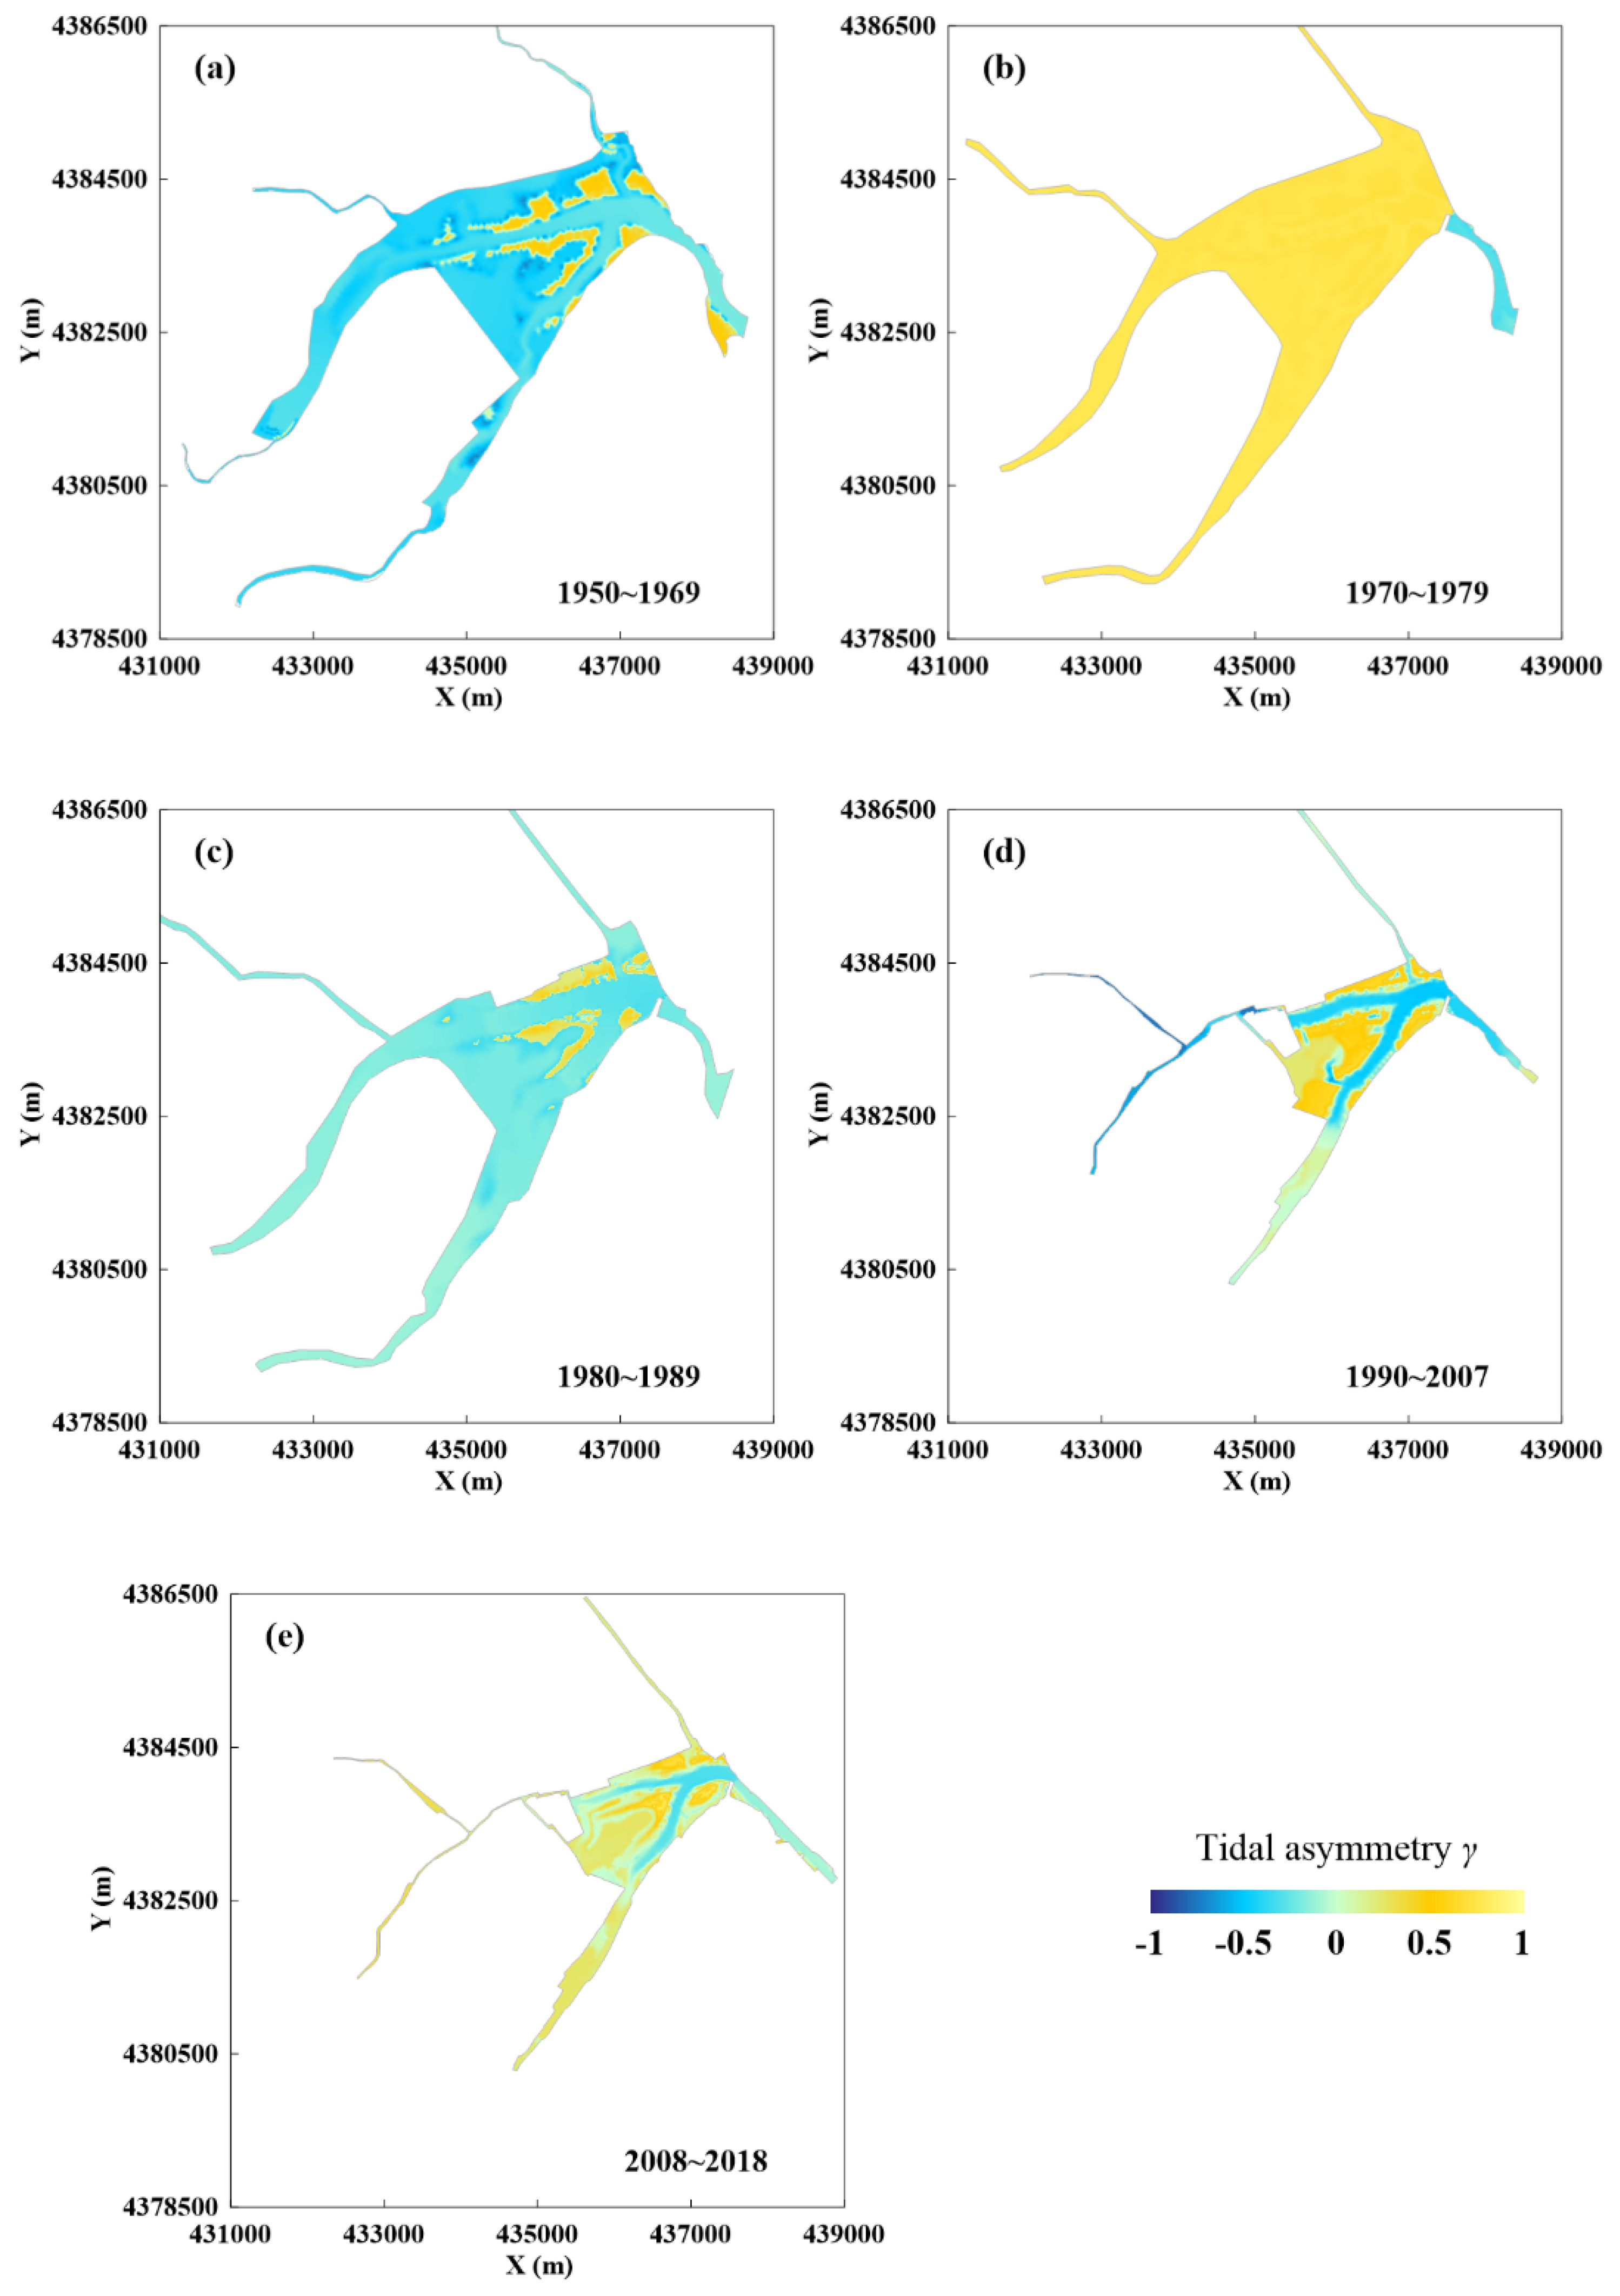
5.1. Spatial Distribution of Tide Asymmetry
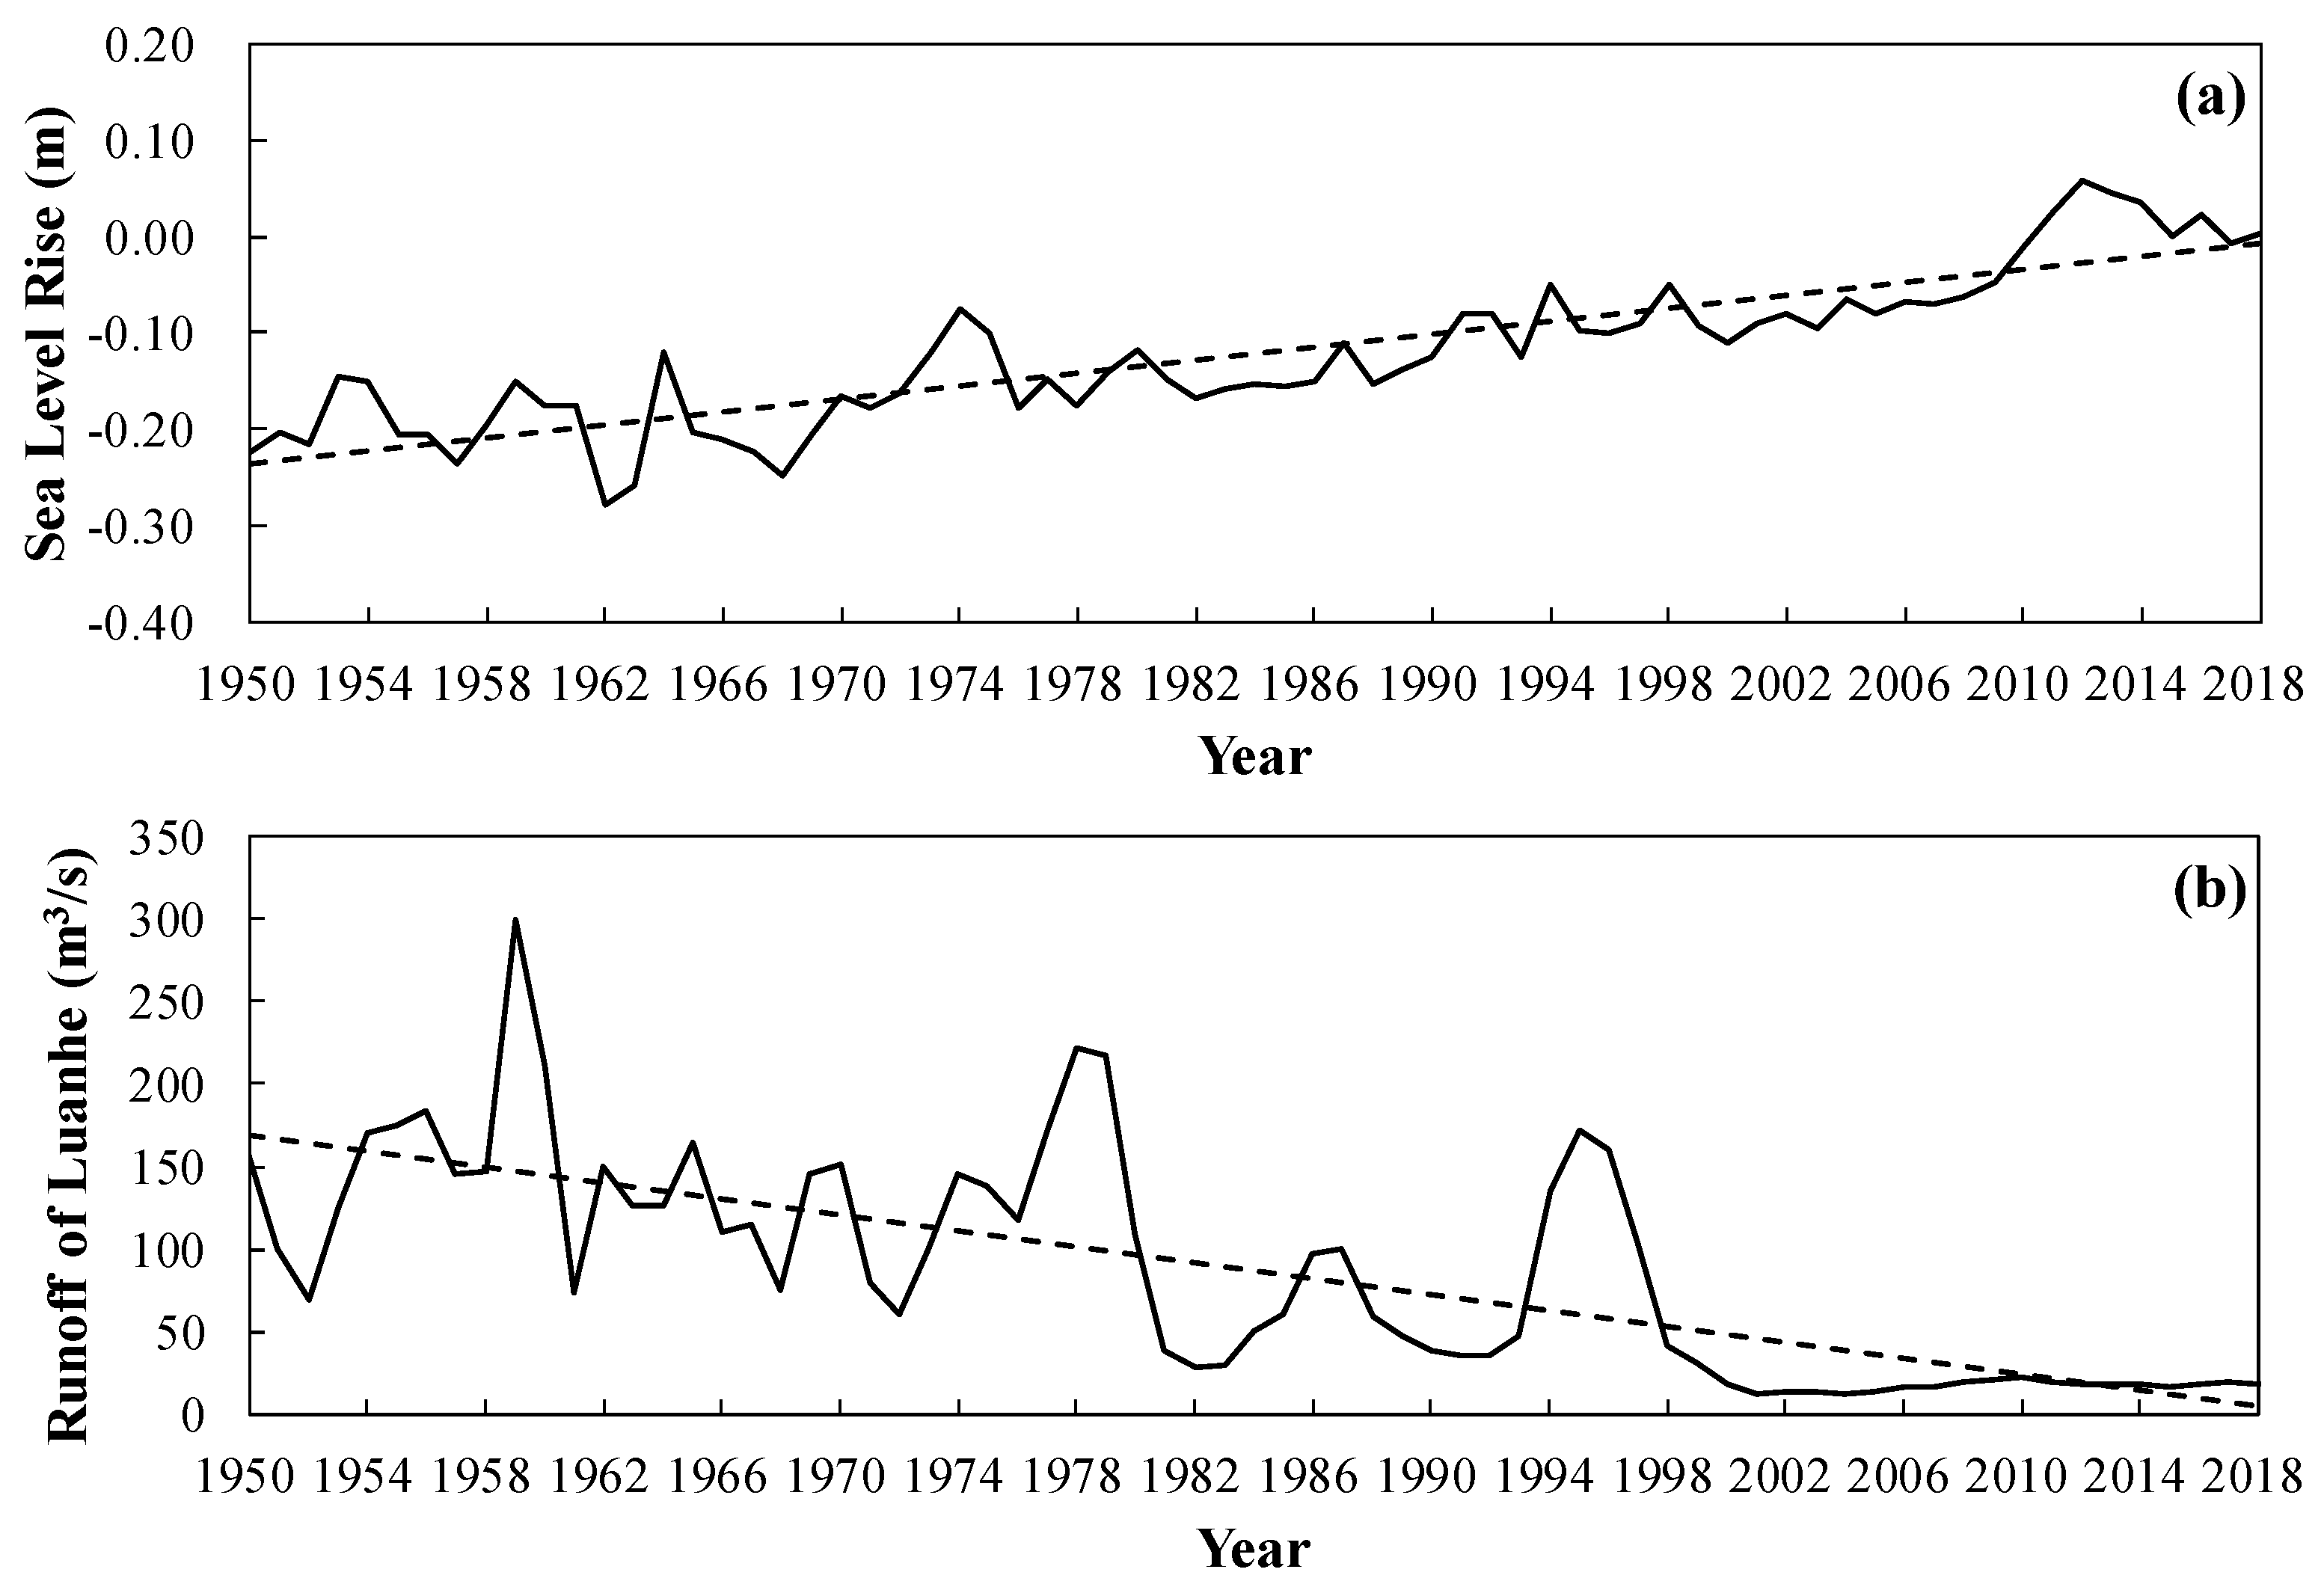
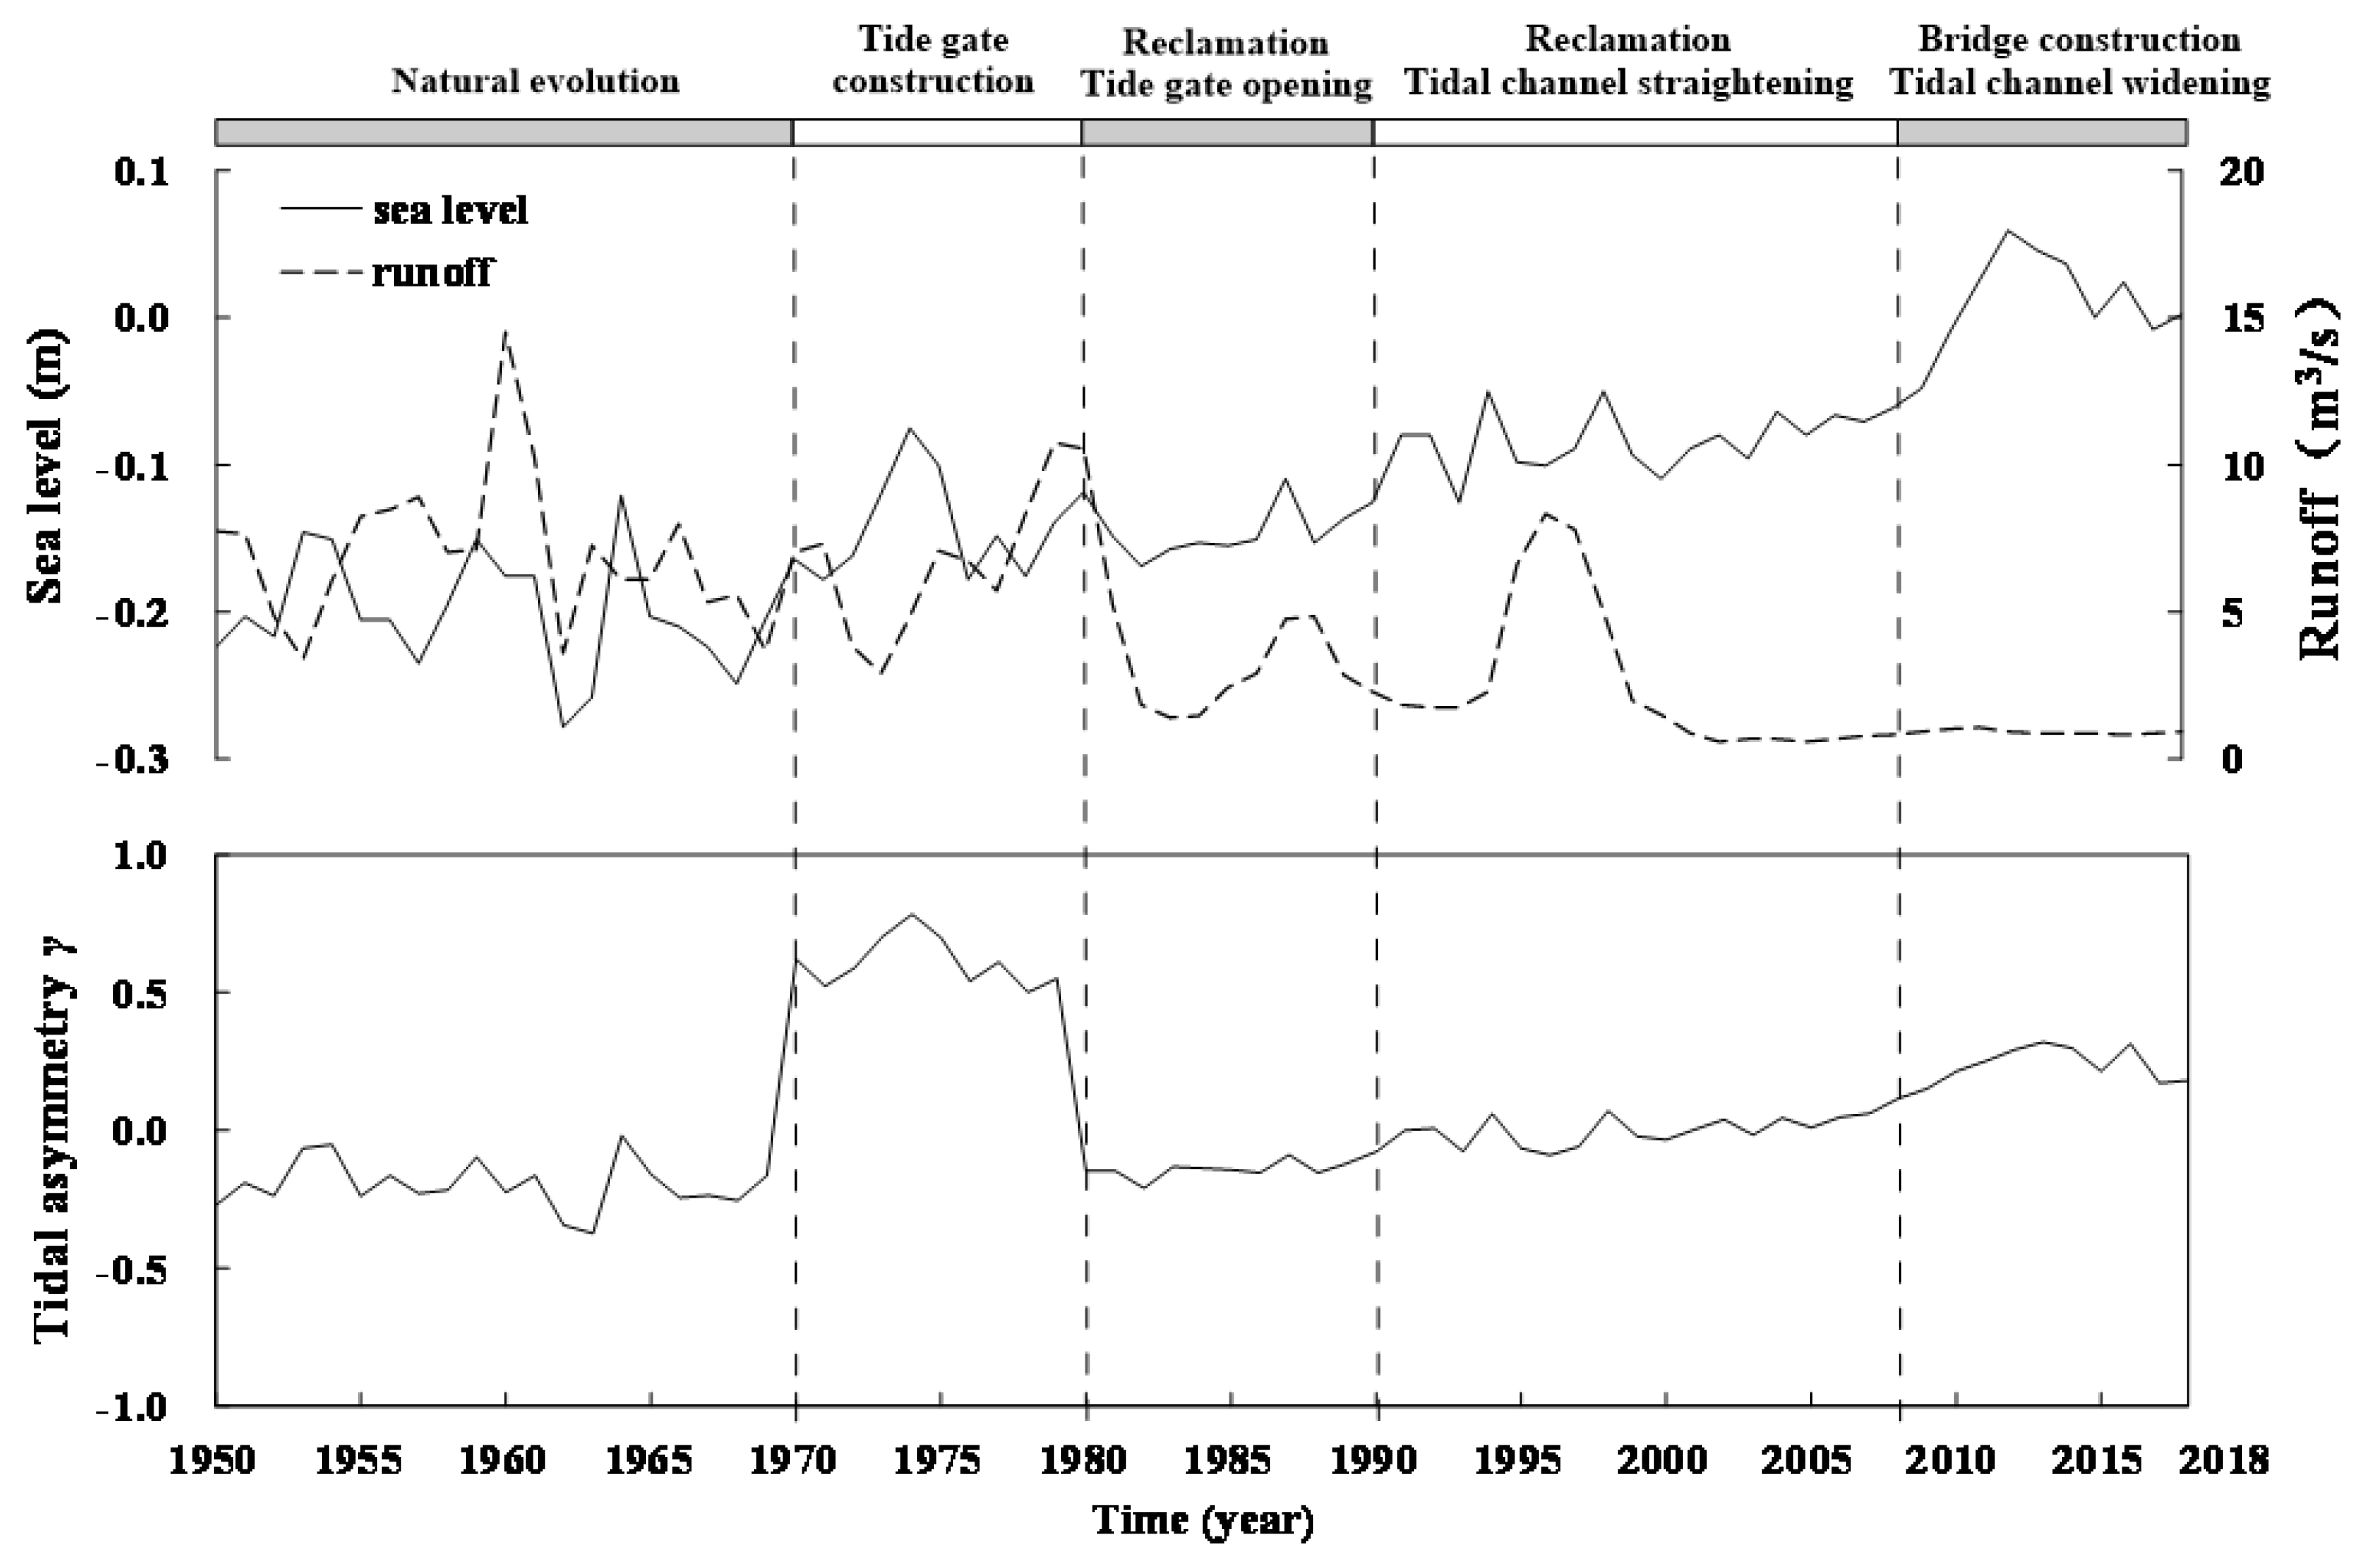
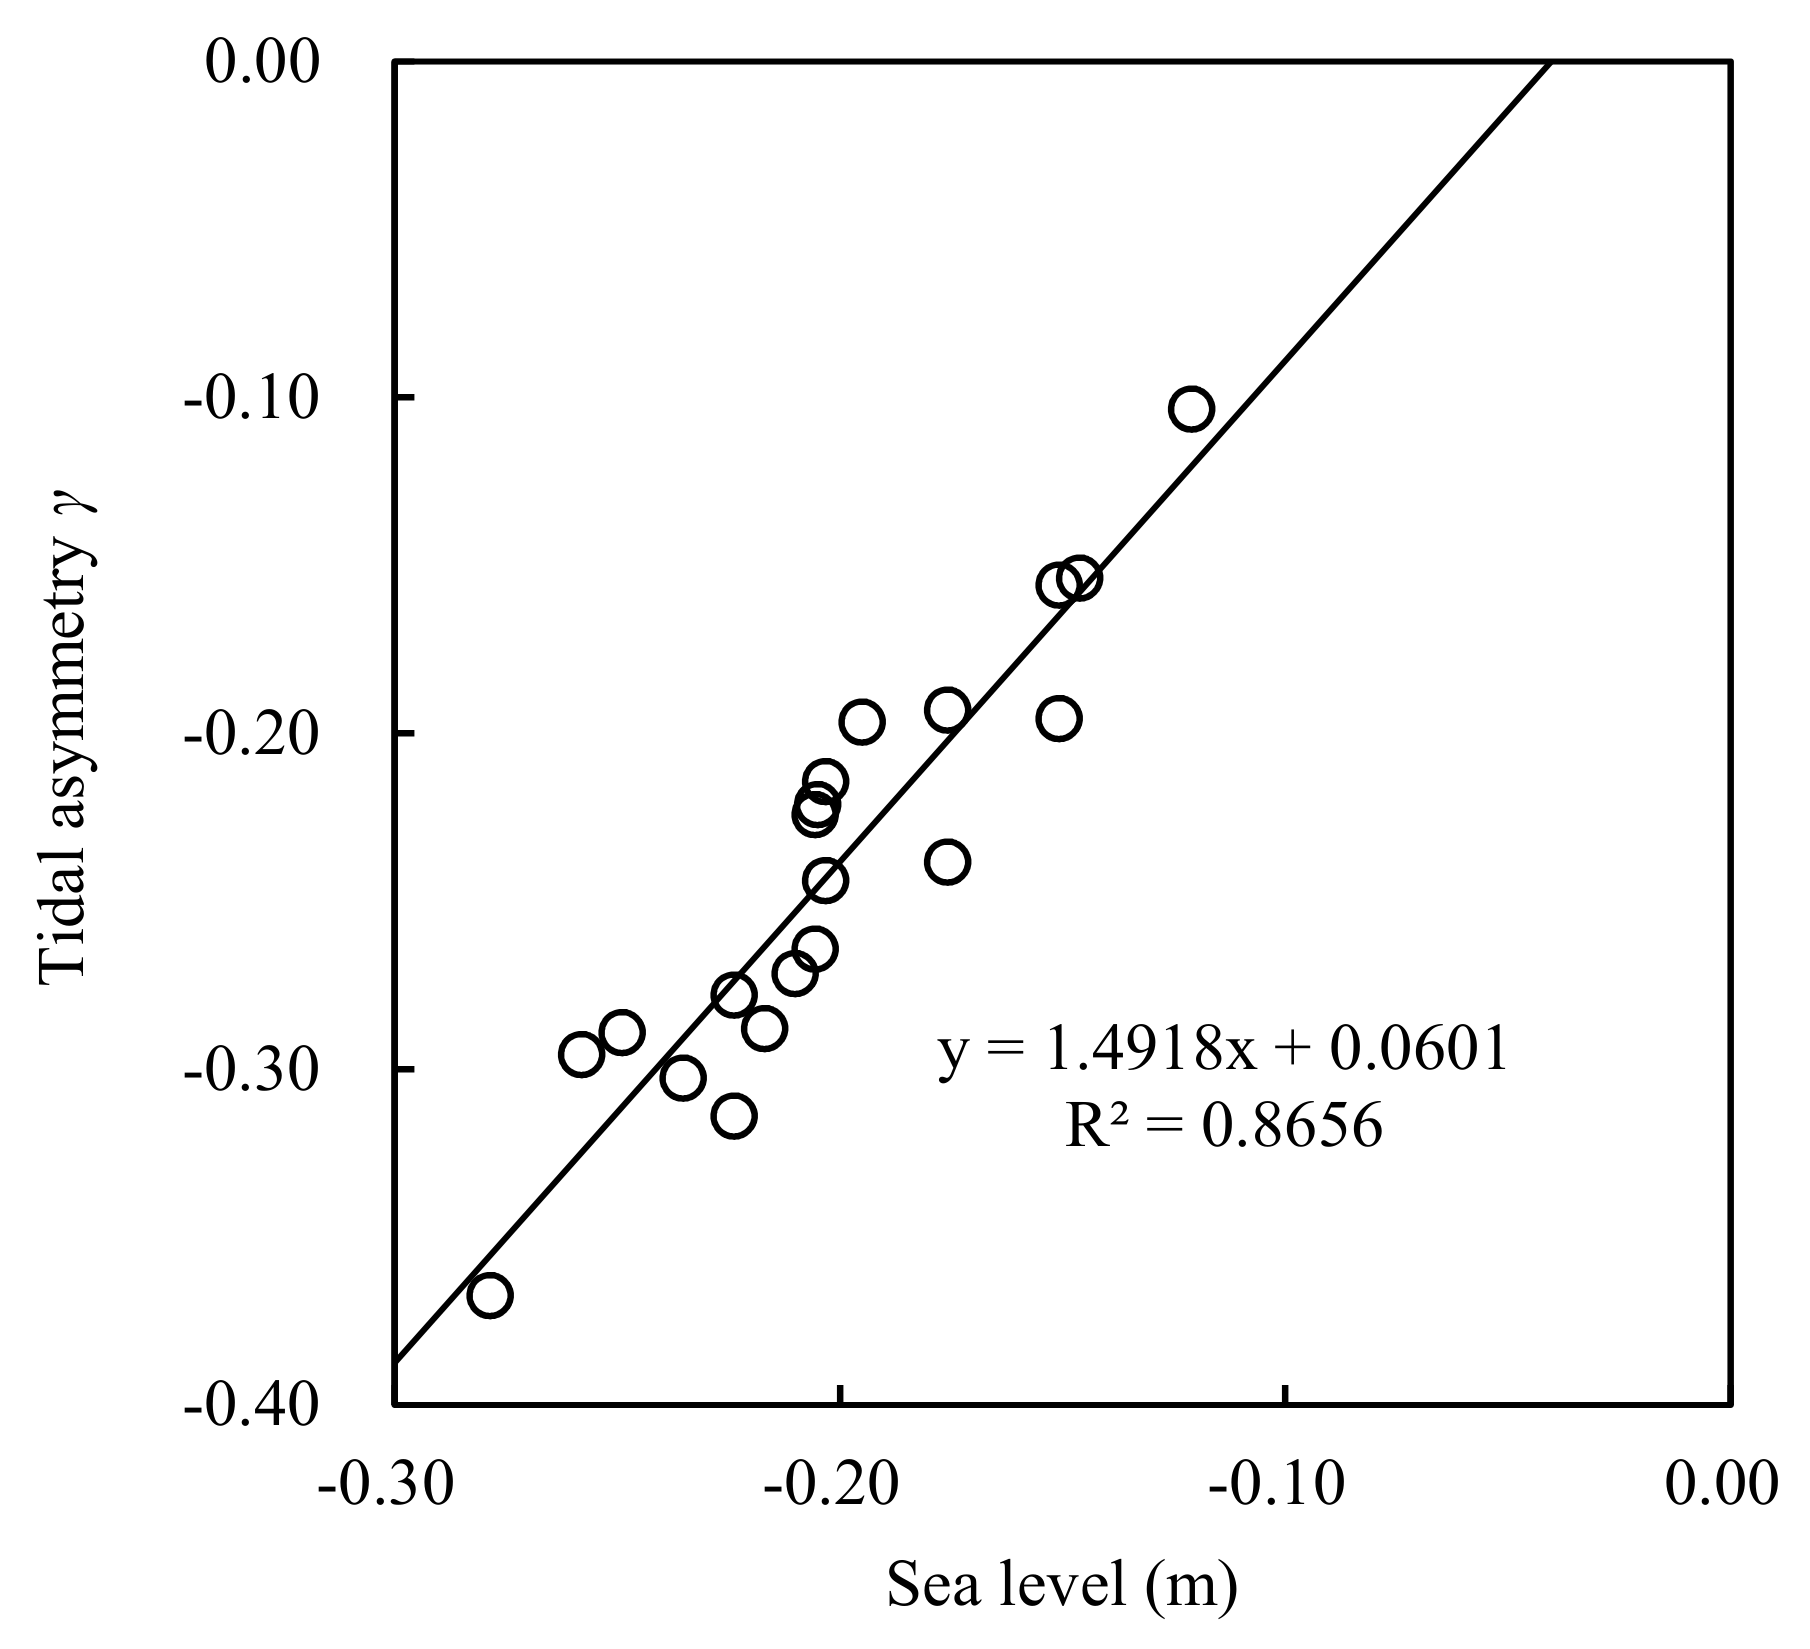
5.2. Effects of Sea Level and Runoff
5.3. Effects of Construction Projects
6. Conclusions
Author Contributions
Funding
Institutional Review Board Statement
Informed Consent Statement
Data Availability Statement
Acknowledgments
Conflicts of Interest
References
- Winston, J.E. Ectoproct diversity of the Indian River coastal lagoon. Bull. Mar. Sci. 1995, 57, 84–93. [Google Scholar]
- Hattori, A.; Mae, S. Habitat use and diversity of waterbirds in a coastal lagoon around Lake Biwa, Japan. Ecol. Res. 2001, 16, 543–553. [Google Scholar] [CrossRef]
- Duarte, P.; Macedo, M.F.; da Fonseca, L.C. The relationship between phytoplankton diversity and community function in a coastal lagoon. In Marine Biodiversity; Springer: Berlin/Heidelberg, Germany, 2006; pp. 3–18. [Google Scholar]
- Ferreira, N.C.; Guereschi, R.M.; Machado, C.; Lopes, C.A.; Nuñer, A. Structure and diversity of fishes in a freshwater and coastal subtropical lagoon. J. Fish Biol. 2017, 90, 1265–1282. [Google Scholar] [CrossRef] [PubMed]
- Kjerfve, B. Coastal Lagoons; Elsevier Oceanography Series; Elsevier: Amsterdam, The Netherlands, 1994; pp. 1–8. [Google Scholar]
- Kjerfve, B.; Magill, K.E. Geographic and hydrodynamic characteristics of shallow coastal lagoons. Mar. Geol. 1989, 88, 187–199. [Google Scholar] [CrossRef]
- Webster, I.T.; Ford, P.W.; Hodgson, B. Microphytobenthos contribution to nutrient-phytoplankton dynamics in a shallow coastal lagoon. Estuaries 2002, 25, 540–551. [Google Scholar] [CrossRef]
- Franco, A.; Franzoi, P.; Malavasi, S.; Riccato, F.; Torricelli, P.; Mainardi, D. Use of shallow water habitats by fish assemblages in a Mediterranean coastal lagoon. Estuar. Coast. Shelf Sci. 2006, 66, 67–83. [Google Scholar] [CrossRef]
- Galván, C.; Juanes, J.A.; Puente, A. Ecological classification of European transitional waters in the North-East Atlantic eco-region. Estuar. Coast. Shelf Sci. 2010, 87, 442–450. [Google Scholar] [CrossRef]
- Fourniotis, N.T.; Horsch, G.M.; Leftheriotis, G.A. Wind and tide-induced hydrodynamics and sedimentation of two tidal inlets in Western Greece. Period. Polytech. Civ. Eng. 2018, 62, 851–857. [Google Scholar] [CrossRef]
- Jeanson, M.; Dolique, F.; Anthony, E.J.; Aubry, A. Decadal-scale dynamics and geomorphological evolution of mangroves and beaches in a reef-lagoon complex, Mayotte Island. J. Coast. Res. 2019, 88, 195–208. [Google Scholar] [CrossRef]
- Maicu, F.; Abdellaoui, B.; Bajo, M.; Chair, A.; Hilmi, K.; Umgiesser, G. Modelling the water dynamics of a tidal lagoon: The impact of human intervention in the Nador Lagoon (Morocco). Cont. Shelf Res. 2021, 228, 104535. [Google Scholar] [CrossRef]
- Duck, R.W.; Da Silva, J.F. Coastal lagoons and their evolution: A hydromorphological perspective. Estuar. Coast. Shelf Sci. 2012, 110, 2–14. [Google Scholar] [CrossRef]
- Carniello, L.; Defina, A.; D’Alpaos, L. Morphological evolution of the Venice lagoon: Evidence from the past and trend for the future. J. Geophys. Res. Earth Surf. 2009, 114, F04002. [Google Scholar] [CrossRef]
- Lopes, C.L.; Silva, P.A.; Rocha, A.; Dias, J.M. Sensitivity analysis of Ria de Aveiro hydro-morphodynamics to the sea level rise integration period. J. Coast. Res. 2011, 64, 230–234. [Google Scholar]
- Zhu, H.; Zuo, L.; Reyns, J.; Lu, Y.; Dastgheib, A.; Roelvink, D. Morphologic modelling of tidal inlet on a barrier-lagoon coast: Case study of the Laolonggou tidal inlet in the Bohai Bay. Appl. Ocean Res. 2020, 94, 101967. [Google Scholar] [CrossRef]
- De Swart, H.E.; Zimmerman, J. Morphodynamics of tidal inlet systems. Annu. Rev. Fluid Mech. 2009, 41, 203–229. [Google Scholar] [CrossRef]
- Gao, S.; Collins, M. Tidal inlet stability in response to hydrodynamic and sediment dynamic conditions. Coast. Eng. 1994, 23, 61–80. [Google Scholar]
- Salles, P. Hydrodynamic Controls on Multiple Tidal Inlet Persistence. Ph.D. Thesis, Massachusetts Institute of Technology and Woods Hole Oceanographic Institution, Cambridge, MA, USA, 2001. [Google Scholar]
- Bertin, X.; Chaumillon, E.; Sottolichio, A.; Pedreros, R. Tidal inlet response to sediment infilling of the associated bay and possible implications of human activities: The Marennes-Oléron Bay and the Maumusson Inlet, France. Cont. Shelf Res. 2005, 25, 1115–1131. [Google Scholar]
- Dastgheib, A.; Roelvink, J.A.; Wang, Z.B. Long-term process-based geomorphological modeling of the Marsdiep Tidal Basin. Mar. Geol. 2008, 256, 90–100. [Google Scholar]
- Beck, T.M.; Wang, P. Morphodynamics of barrier-inlet systems in the context of regional sediment management, with case studies from west-central Florida, USA. Ocean. Coast. Manag. 2019, 177, 31–51. [Google Scholar] [CrossRef]
- Coco, G.; Zhou, Z.; van Maanen, B.; Olabarrieta, M.; Tinoco, R.; Townend, I. Morphodynamics of tidal networks: Advances and challenges. Mar. Geol. 2013, 346, 1–16. [Google Scholar] [CrossRef]
- Zhou, Z.; Olabarrieta, M.; Stefanon, L.; D’Alpaos, A.; Carniello, L.; Coco, G. A comparative study of physical and numerical modeling of tidal network ontogeny. J. Geophys. Res. Earth Surf. 2014, 119, 892–912. [Google Scholar] [CrossRef] [Green Version]
- Marciano, R.; Wang, Z.B.; Hibma, A.; de Vriend, H.J.; Defina, A. Modeling of channel patterns in short tidal basins. J. Geophys. Res. Earth Surf. 2005, 110, F01001. [Google Scholar] [CrossRef] [Green Version]
- Van Maanen, B.; Coco, G.; Bryan, K.R. Modelling the effects of tidal range and initial bathymetry on the geomorphological evolution of tidal embayments. Geomorphology 2013, 191, 23–34. [Google Scholar] [CrossRef]
- Geng, L.; Gong, Z.; Zhou, Z.; Lanzoni, S.; D’Alpaos, A. Assessing the relative contributions of the flood tide and the ebb tide to tidal channel network dynamics. Earth Surf. Process. Landf. 2019, 45, 237–250. [Google Scholar] [CrossRef]
- Stefanon, L.; Carniello, L.; D’Alpaos, A.; Lanzoni, S. Experimental analysis of tidal network growth and development. Cont. Shelf Res. 2010, 30, 950–962. [Google Scholar] [CrossRef] [Green Version]
- Guo, L.; van der Wegen, M.; Jay, D.; Matte, P.; Wang, Z.B.; Roelvink, D.J.A.; He, Q. River-tide dynamics: Exploration of nonstationary and nonlinear tidal behavior in the Yangtze River estuary. J. Geophys. Res. Oceans 2015, 120, 3499–3521. [Google Scholar] [CrossRef] [Green Version]
- Cai, H.; Savenije, H.H.; Jiang, C.; Zhao, L.; Yang, Q. Analytical approach for determining the mean water level profile in an estuary with substantial fresh water discharge. Hydrol. Earth Syst. Sci. 2016, 20, 1177–1195. [Google Scholar] [CrossRef] [Green Version]
- Zhou, Z.; Chen, L.; Townend, I.; Coco, G.; Friedrichs, C.; Zhang, C. Revisiting the Relationship between Tidal Asymmetry and Basin Morphology: A Comparison between 1D and 2D Models. J. Coast. Res. 2018, 85, 151–155. [Google Scholar] [CrossRef]
- Liang, H.; Kuang, C.; Olabarrieta, M.; Song, H.; Ma, Y.; Dong, Z.; Han, X.; Zuo, L.; Liu, Y. Morphodynamic responses of Caofeidian channel-shoal system to sequential large-scale land reclamation. Cont. Shelf Res. 2018, 165, 12–25. [Google Scholar] [CrossRef]
- Liang, H.; Kuang, C.; Gu, J.; Ma, Y.; Chen, K.; Liu, X. Tidal Asymmetry Changes in a Shallow Mud Estuary by a Restoration Project. J. Ocean Univ. China 2019, 18, 339–348. [Google Scholar] [CrossRef]
- Walker, D.J.; Jessup, A. Analysis of the dynamic aspects of the River Murray Mouth, South Australia. J. Coast. Res. 1992, 8, 71–76. [Google Scholar]
- Gao, G.D.; Wang, X.H.; Bao, X.W. Land reclamation and its impact on tidal dynamics in Jiaozhou Bay, Qingdao, China. Estuar. Coast. Shelf Sci. 2014, 151, 285–294. [Google Scholar] [CrossRef]
- Li, L.; Guan, W.; He, Z.; Yao, Y.; Xia, Y. Responses of water environment to tidal flat reduction in Xiangshan Bay: Part II locally re-suspended sediment dynamics. Estuar. Coast. Shelf Sci. 2017, 198, 114–127. [Google Scholar] [CrossRef]
- Kuang, C.; Dong, Z.; Gu, J.; Su, T.; Zhan, H.; Zhao, W. Quantifying the influence factors on water exchange capacity in a shallow coastal lagoon. J. Hydro-Environ. Res. 2020, 31, 26–40. [Google Scholar] [CrossRef]
- Gao, X.; Chen, Y.; Zhang, C. Water renewal timescales in an ecological reconstructed lagoon in China. J. Hydroinf. 2013, 15, 991–1001. [Google Scholar] [CrossRef] [Green Version]
- Kuang, C.; Liang, H.; Mao, X.; Karney, B.; Gu, J.; Huang, H.; Chen, W.; Song, H. Influence of potential future sea-level rise on tides in the China Sea. J. Coast. Res. 2016, 33, 105–117. [Google Scholar] [CrossRef]
- D’Alpaos, A.; Lanzoni, S.; Marani, M.; Bonometto, A.; Cecconi, G.; Rinaldo, A. Spontaneous tidal network formation within a constructed salt marsh: Observations and morphodynamic modelling. Geomorphology 2007, 91, 186–197. [Google Scholar] [CrossRef]
- Carniello, L.; Defina, A.; D’Alpaos, L. Modeling sand-mud transport induced by tidal currents and wind waves in shallow microtidal basins: Application to the Venice Lagoon (Italy). Estuar. Coast. Shelf Sci. 2012, 102, 105–115. [Google Scholar] [CrossRef]
- Feng, J. On the Formation and Evolution of the Qilihai Lagoon. Trans. Oceanol. Limnol. 1998, 2, 6–11. [Google Scholar]
- Landau, H.; Vollath, U.; Chen, X. Virtual reference station systems. J. Glob. Position. Syst. 2002, 1, 137–143. [Google Scholar] [CrossRef] [Green Version]
- Garcia-Oliva, M.; Djordjević, S.; Tabor, G.R. The influence of channel geometry on tidal energy extraction in estuaries. Renew. Energy 2017, 101, 514–525. [Google Scholar] [CrossRef]
- Kuang, C.; Zhao, F.; Song, H.; Gu, J.; Dong, Z. Morphological responses of a long-narrow estuary to a restoration scheme and a major storm. Mar. Geol. 2020, 427, 106224. [Google Scholar] [CrossRef]
- Liang, B.; Shao, Z.; Wu, Y.; Shi, H.; Liu, Z. Numerical study to estimate the wave energy under wave-current interaction in the Qingdao coast, China. Renew. Energy 2017, 101, 845–855. [Google Scholar] [CrossRef]
- Soudi, M.; Ahmadi, H.; Yasi, M.; Sibilla, S.; Fenocchi, A.; Hamidi, S.A. Investigation over the capability of MIKE 3 flow model FM to simulate the hydrodynamics and salinity distribution of hypersaline lakes: Lake Urmia (Iran) as case study. Coast. Eng. J. 2019, 61, 486–501. [Google Scholar] [CrossRef]
- Gu, J.; Hu, C.; Kuang, C.; Kolditz, O.; Shao, H.; Zhang, J.; Liu, H. A water quality model applied for the rivers into the Qinhuangdao coastal water in the Bohai Sea, China. J. Hydrodyn. 2016, 28, 905–913. [Google Scholar] [CrossRef]
- Liu, K.; Wang, H.; Fu, S.; Gao, Z.; Dong, J.; Feng, J.; Gao, T. Evaluation of sea level rise in Bohai Bay and associated responses. Adv. Clim. Chang. Res. 2017, 8, 48–56. [Google Scholar] [CrossRef]
- Kuang, C.; Liang, H.; Gu, J.; Su, T.; Zhao, X.; Song, H.; Ma, Y.; Dong, Z. Geomorphological process of a restored estuary downstream of a tidal barrier. Ocean. Coast. Manag. 2017, 138, 111–123. [Google Scholar] [CrossRef]
- Flather, R.A. A tidal model of the north-west European continental shelf. Mem. Soc. R. Sci. Liege 1976, 10, 141–164. [Google Scholar]
- Shan, C.; Dong, Z.; Fu, X.; Fang, Q.; Liu, C.; Liu, Q. Rules of runoff variation in Luanhe River Basin in recent 50 years. South North Water Transf. Water Sci. Technol. 2013, 11, 5–8. [Google Scholar]
- Cheng, N. Simplified settling velocity formula for sediment particle. J. Hydraul. Eng. 1997, 123, 149–152. [Google Scholar] [CrossRef]
- Wang, Y.P.; Voulgaris, G.; Li, Y.; Yang, Y.; Gao, J.; Chen, J.; Gao, S. Sediment resuspension, flocculation, and settling in a macrotidal estuary. J. Geophys. Res. Oceans 2013, 118, 5591–5608. [Google Scholar] [CrossRef]
- Tang, C. The threshold velocity of sediment. J. Hydraul. 1963, 2, 12. [Google Scholar]
- Zhang, H. A unified formula for incipient velocity of sediment. J. Hydraul. Eng. 2012, 43, 1387–1396. [Google Scholar]
- Park, Y.G.; Kim, H.Y.; Hwang, J.H.; Kim, T.; Park, S.; Nam, J.H.; Seo, Y.K. Dynamics of dike effects on tidal circulation around Saemangeum, Korea. Ocean. Coast. Manag. 2014, 102, 572–582. [Google Scholar] [CrossRef]
- Van Maren, D.S.; van Kessel, T.; Cronin, K.; Sittoni, L. The impact of channel deepening and dredging on estuarine sediment concentration. Cont. Shelf Res. 2015, 95, 1–14. [Google Scholar] [CrossRef] [Green Version]
- Dong, Z. Study on Influence Mechanisms of Morphodynamic Evolution and Water Exchange of Qilihai Lagoon. Ph.D. Thesis, Tongji University, Shanghai, China, 2020. [Google Scholar]
- Nidzieko, N.J.; Ralston, D.K. Tidal asymmetry and velocity skew over tidal flats and shallow channels within a macrotidal river delta. J. Geophys. Res. Oceans 2012, 117, C03001. [Google Scholar] [CrossRef] [Green Version]
- Song, D.; Wang, X.H.; Zhu, X.; Bao, X. Modeling studies of the far-field effects of tidal flat reclamation on tidal dynamics in the east China seas. Estuar. Coast. Shelf Sci. 2013, 133, 147–160. [Google Scholar] [CrossRef]
- Song, D.; Wang, X.H.; Kiss, A.E.; Bao, X. The contribution to tidal asymmetry by different combinations of tidal constituents. J. Geophys. Res. Oceans 2011, 116, C12007. [Google Scholar] [CrossRef]
- Oliver, M.A.; Webster, R. Kriging: A method of interpolation for geographical information systems. Int. J. Geogr. Info. Syst. 1990, 4, 313–332. [Google Scholar] [CrossRef]
- Benesty, J.; Chen, J.; Huang, Y.; Cohen, I. Pearson correlation coefficient. In Noise Reduction in Speech Processing; Springer: Berlin/Heidelberg, Germany, 2009; pp. 1–4. [Google Scholar]


| Month | 1 | 2 | 3 | 4 | 5 | 6 | 7 | 8 | 9 | 10 | 11 | 12 |
|---|---|---|---|---|---|---|---|---|---|---|---|---|
| Zhaojiaganggou | 0.000 | 0.000 | 0.021 | 0.020 | 0.018 | 0.022 | 0.016 | 0.017 | 0.043 | 0.026 | 0.033 | 0.018 |
| Nijinggou | 0.000 | 0.000 | 0.004 | 0.003 | 0.003 | 0.003 | 0.003 | 0.005 | 0.008 | 0.006 | 0.003 | 0.002 |
| Liutuogou | 0.000 | 0.000 | 0.012 | 0.009 | 0.008 | 0.009 | 0.009 | 0.015 | 0.024 | 0.019 | 0.010 | 0.006 |
| Daozigou | 0.000 | 0.000 | 0.000 | 0.000 | 0.015 | 0.016 | 0.034 | 0.023 | 0.025 | 0.016 | 0.015 | 0.011 |
| Simulation Periods | Actual Simulation Times | Satellite Images | Major Project Conditions |
|---|---|---|---|
| 1950~1969 | 1 January 1950~1 January 1970 | 1970 | Natural evolution |
| 1970~1979 | 1 January 1970~1 January 1980 | 1984 | Tide gate construction |
| 1980~1989 | 1 January 1980~1 January 1990 | 1990 | Reclamation; Tide gate opening |
| 1990~2007 | 1 January 1990~1 January 2008 | 2008 | Reclamation; Tidal channel straightening |
| 2008~2018 | 1 January 2008~1 January 2019 | 2018 | Bridge construction; Tidal channel widening |
| Period | 1950~1969 | 1970~1979 | 1980~1989 | 1990~2007 | 2008~2018 |
|---|---|---|---|---|---|
| Sea Level | 0.905 | 0.887 | 0.716 | 0.890 | 0.916 |
| Runoff | 0.109 | 0.264 | 0.115 | 0.507 | 0.003 |
Publisher’s Note: MDPI stays neutral with regard to jurisdictional claims in published maps and institutional affiliations. |
© 2021 by the authors. Licensee MDPI, Basel, Switzerland. This article is an open access article distributed under the terms and conditions of the Creative Commons Attribution (CC BY) license (https://creativecommons.org/licenses/by/4.0/).
Share and Cite
Kuang, C.; Cong, X.; Dong, Z.; Zou, Q.; Zhan, H.; Zhao, W. Impact of Anthropogenic Activities and Sea Level Rise on a Lagoon System: Model and Field Observations. J. Mar. Sci. Eng. 2021, 9, 1393. https://doi.org/10.3390/jmse9121393
Kuang C, Cong X, Dong Z, Zou Q, Zhan H, Zhao W. Impact of Anthropogenic Activities and Sea Level Rise on a Lagoon System: Model and Field Observations. Journal of Marine Science and Engineering. 2021; 9(12):1393. https://doi.org/10.3390/jmse9121393
Chicago/Turabian StyleKuang, Cuiping, Xin Cong, Zhichao Dong, Qingping Zou, Huaming Zhan, and Wei Zhao. 2021. "Impact of Anthropogenic Activities and Sea Level Rise on a Lagoon System: Model and Field Observations" Journal of Marine Science and Engineering 9, no. 12: 1393. https://doi.org/10.3390/jmse9121393