Article

Analysis of Timing Effect on Flow Field and Pulsation in Vertical Axial Flow Pump

1
College of Hydraulic Science and Engineering, Yangzhou University, Yangzhou 225009, China
2
Key Laboratory of Fluid and Power Machinery, Ministry of Education, Chengdu 610039, China
3
Jiangsu Water Conservancy Research Institute, Nanjing 210017, China
4
Anhui Survey and Design Institute of Water Resources & Hydropower Co., Ltd., Hefei 230088, China
5
School of Mechanical and Automotive Engineering, Zhejiang University of Water Resources and Electric Power, Hangzhou 310018, China
*
Author to whom correspondence should be addressed.
J. Mar. Sci. Eng. 2021, 9(12), 1429; https://doi.org/10.3390/jmse9121429
Submission received: 10 November 2021 / Revised: 9 December 2021 / Accepted: 9 December 2021 / Published: 14 December 2021
(This article belongs to the Section Ocean Engineering)

Abstract

:
Vertical axial flow pump device has the characteristics of large flow and low head, which is widely used in pumping station projects with head of 3–9 m. In order to study the influence of the timing effect of the impeller relative flow channel and guide vane on the flow field and pulsation in the axial flow pump device, the whole flow channel of the vertical axial flow pump device was taken as the research object. The reliability of the numerical simulation was verified by physical model test. The flow field characteristics and pressure pulsation characteristics of the inlet and outlet regions of the impeller, the guide vane and the campaniform inlet conduit at different timing positions of the impeller under different flow rates were analyzed. The results show that the pressure coefficient distribution of the impeller inlet of the vertical axial flow pump device presents four high-pressure areas and four low-pressure areas with the rotation of the impeller. The pressure pulsation at the inlet and outlet of the impeller is mainly affected by the rotation of the impeller, and the main frequency is 4 times the rotation frequency amplitude of pressure pulsation decreases with the increase of flow rate. When the flow rate increased from 0.8 Qbep to 1.2 Qbep, the average velocity circulation at the guide vane outlet decreased by 12%; there is an obvious negative value region of the internal regularized helicity of the guide vane. When the flow rate increases from 0.8 Qbep to 1.2 Qbep, the amplitude of the pressure pulsation coefficient at the outlet of the guide vane decreases gradually, with a decrease of 94%. When the flow rate is 1.2 Qbep, the main frequency and the secondary frequency of the pressure pulsation are both low-frequency, with obvious low-frequency pulsation characteristics. Under the small flow condition of 0.8 Qbep, the outlet flow fluctuation of seven guide vane was 18.9% on average, and the flow variation of each guide vane was large. Under the optimal flow condition of 1.0 Qbep and large flow condition of 1.2 Qbep, the outlet flow fluctuation of 7 guide vane is 4.7% and 0.56% on average, and the flow change of each guide vane is stable. The outlet flow of the guide vane is mainly concentrated in two guide vane slots of the guide vane, and the flow ratios are 30.56%, 30.14% and 29.16% under three flow conditions, respectively. The research results provide a scientific basis for the optimization design and stable operation of vertical axial flow pump device.

1. Introduction

Axial flow pump station is a very important hydraulic structure in water conservancy projects. Because of its large flow and low lift characteristics, it is widely used in many national economic fields such as municipal engineering, agricultural production, water diversion engineering and marine engineering, and has made great contributions to the development and stability of the national economy. According to the angle between the pump shaft and the horizontal direction, the axial flow pump station can be divided into vertical axial flow pump station, horizontal axial flow pump station (tubular pump station) and slanted axial flow pump station [1]. Among them, the vertical axial flow pump station is the most widely used in the middle and lower reaches of the Yangtze River Plain, Guanzhong Plain, North China Plain and other regions. The internal flow during operation is a very complex three-dimensional dynamic flow, and adverse factors such as reflux and cavitation are prone to occur at the impeller outlet, thus inducing the vibration and noise of the axial flow pump device. It is urgent to study the three-dimensional dynamic flow inside the vertical axial flow pump device. Many scholars in China and abroad have carried out a lot of research work, and the main research contents are focused on the analysis of the three-dimensional flow field inside the axial flow pump device [2,3,4,5] and the numerical analysis of the internal pressure pulsation of the axial flow pump device [6,7,8]. Study on three-dimensional shape optimization of axial flow pump device flow structure [9,10,11]; the mechanism of cavitation flow in axial flow pump device [12,13], and the influence of inflow conditions on the flow and pulsation characteristics of axial flow pump device [14,15,16]. Such as: Kan Kan et al. [2] Based on a Level-set Immersed Boundary Method, the internal flow characteristics of slanted axial flow pump under different flow rates are studied and analyzed. Xiaowen Zhang et al. [3] simulated the internal flow change and pressure fluctuation during the opening process of vertical axial flow pump by CFX software, and clarified the internal flow characteristics of axial flow pump at each period of startup. Chaoyue Wang et al. [4] found that there was a flow deviation phenomenon in the S-shaped channel of the slanted axial flow pump, and carried out numerical simulation research and field measurement on the test bench to clarify the mechanism of this phenomenon. Kim Youn Sung et al. [5] explored the influence of inlet guide vane and blade angle on three-dimensional steady and unsteady flow of submersible axial flow pump. Ahmed Ramadhan Al-Obaidi et al. [6] studied the pressure pulsation of axial flow pump and analyzed the relationship between pressure pulsation and cavitation. Lijian Shi et al. [7] compared the pressure pulsation of tubular pump and axial flow pump, and analyzed the difference between them. Ying Zhou et al. [8] studied the pressure pulsation and blade stress distribution under the power generation condition of the vertical axial flow pump device, and compared it with the pressure pulsation and stress distribution under the pump condition. Chengyi Li et al. [9] studied the influence of this optimization on the internal flow pulsation of bidirectional axial flow by optimizing the radius ratio of S-shaped elbow. Mohamed Abdessamed Ait Chikh et al. [10] used cuckoo search to optimize tip clearance with head and efficiency as optimization objectives. Yongsheng Zhou et al. [11] in order to improve the unsteady flow of axial flow pump under small flow condition, the double inlet design was used to optimize the small flow condition of axial flow pump. Peng Lin et al. [12] studied the influence of sediment concentration, particle size and cavitation on the axial flow pump, and studied the influence of three factors on the axial flow pump pressure pulsation. Desheng Zhang et al. [13] studied the generation of TLV cavitation through the impeller at different cavitation numbers by numerical and experimental visualization. Fan Yang et al. [14] studied the influence of bias flow on the internal flow of vertical axial flow pump and the pressure pulsation distribution of pump device. Xijie Song et al. [15] measured the flow field under the vortex condition of axial flow pump based on V3V, and studied the energy change, velocity change and vortex intensity change in the evolution process of axial flow pump bottom vortex. Wenpeng Zhang et al. [16] studied the influence of different inflow conditions on the performance of axial flow pump and the influence of different grid scales on the accuracy of numerical simulation.
Timing effect refers to the phenomenon that the change of relative circumferential position (timing position) between rotating parts and stationary parts or between rotating parts and rotating parts in rotating machinery has a significant impact on rotating mechanical properties. The study of the time series effect in rotating machinery is the earliest in the compressor. After decades of development, the time series effect has made breakthrough progress in other rotating machinery such as turbines, compressors and steam turbines, which makes it possible to improve the rotating mechanical properties and operate more stably. In the early 21st century, the related research on timing effect in water pumps has also gradually developed. Up to now, scholars in China and abroad have started relatively late in the research on the timing effect of impellers, guide vanes and inlets in axial flow pump devices, and the research results obtained are few. There is a lack of in-depth study on the internal flow of the timing effect of axial flow pump devices. In this paper, based on the theoretical basis and methods of previous studies on axial flow pump device, the unsteady numerical simulation of vertical axial flow pump device is carried out, and the influence of time sequence effect on the flow field and pressure pulsation in the vertical axial flow pump device is analyzed.

2. Numerical Calculation and Experimental Verification

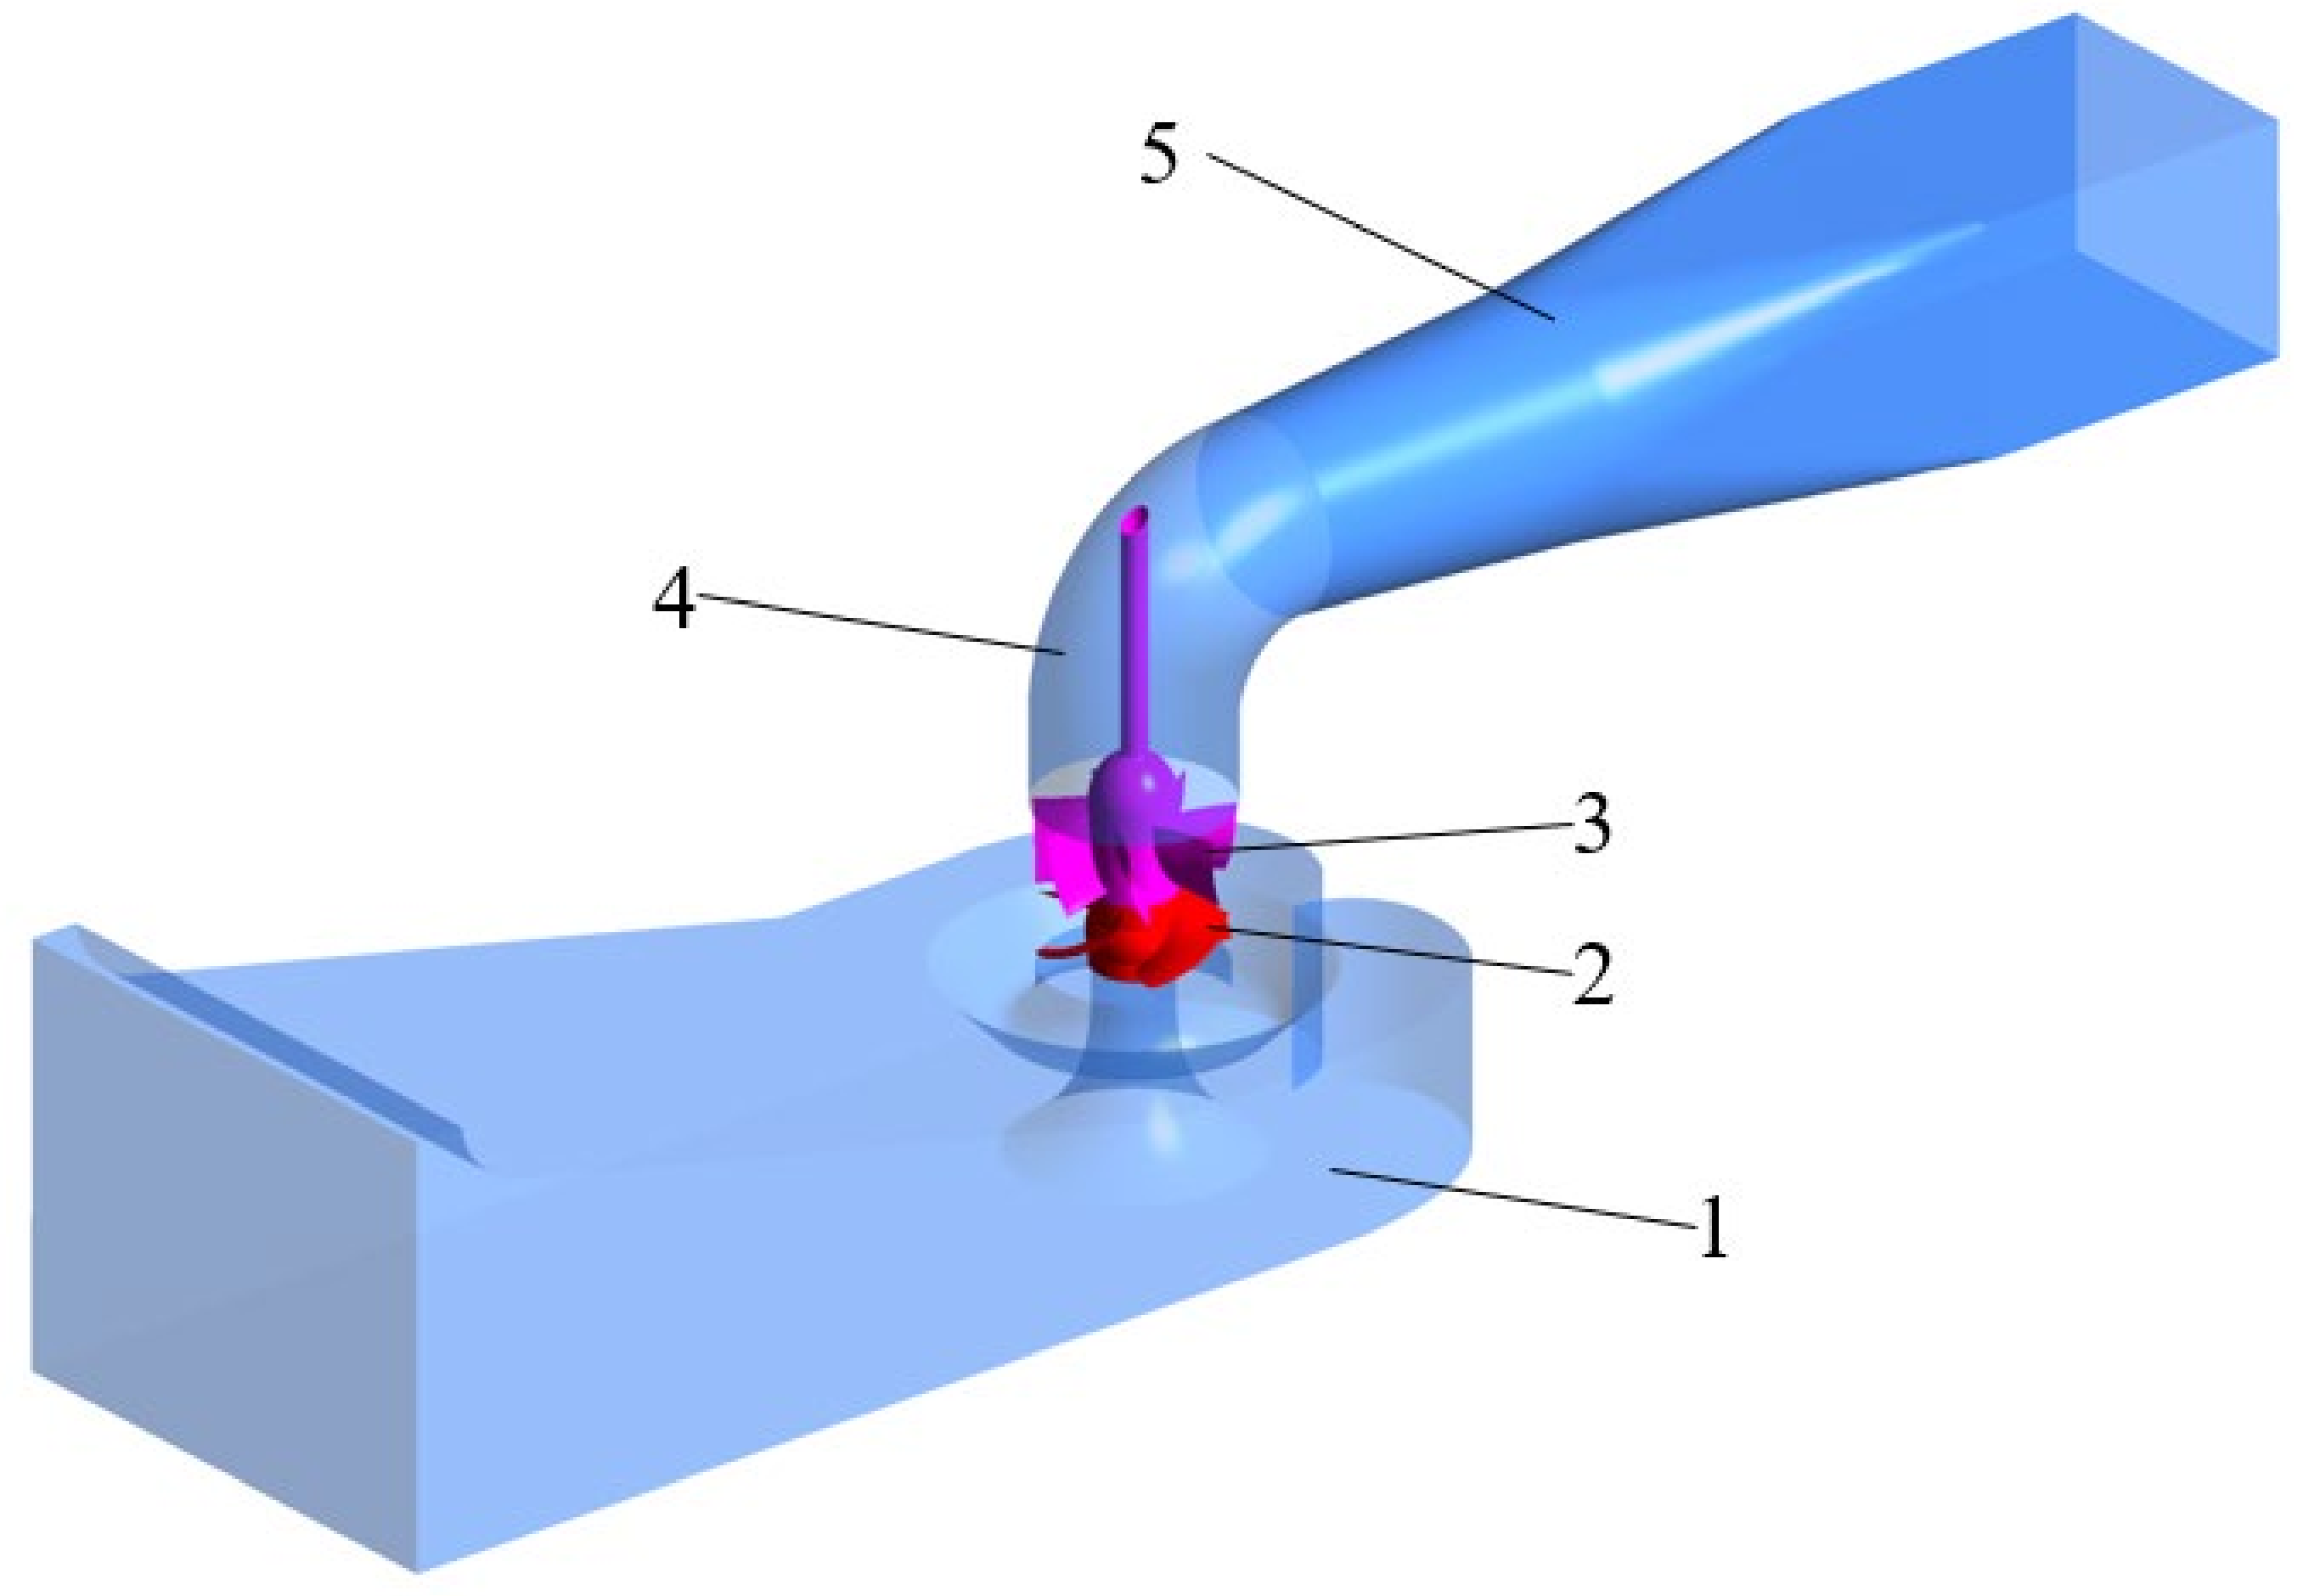
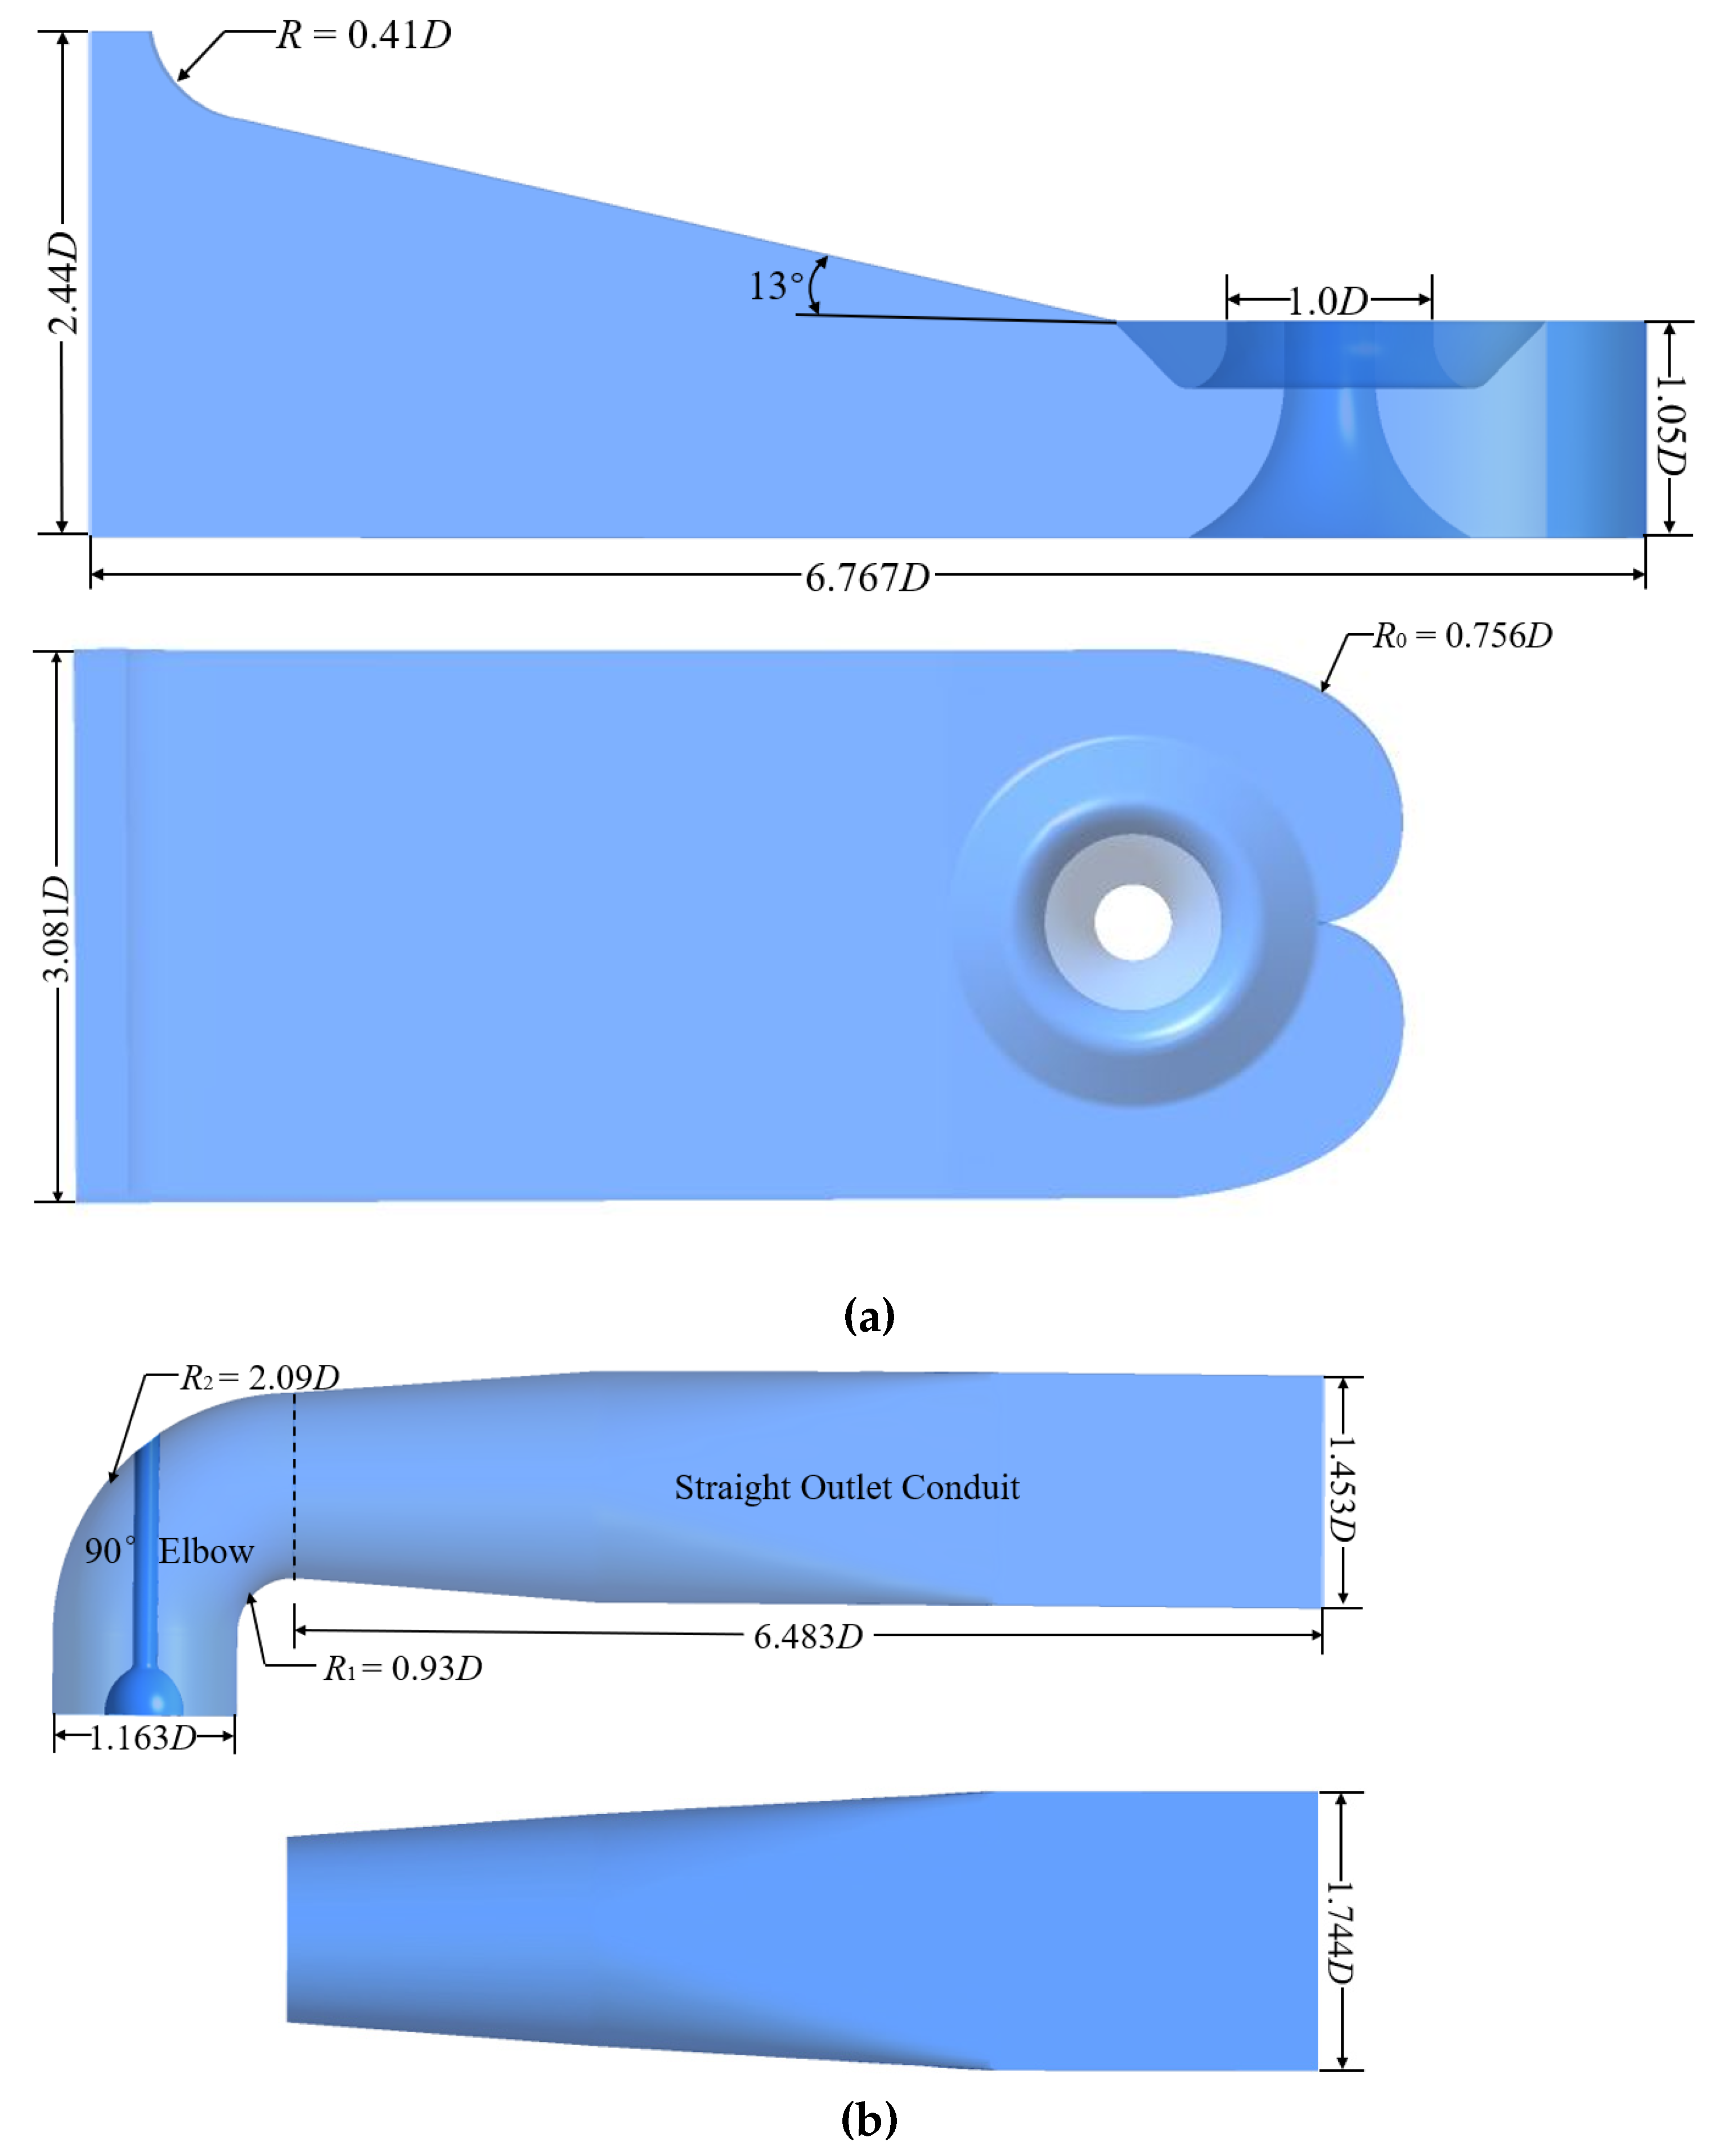
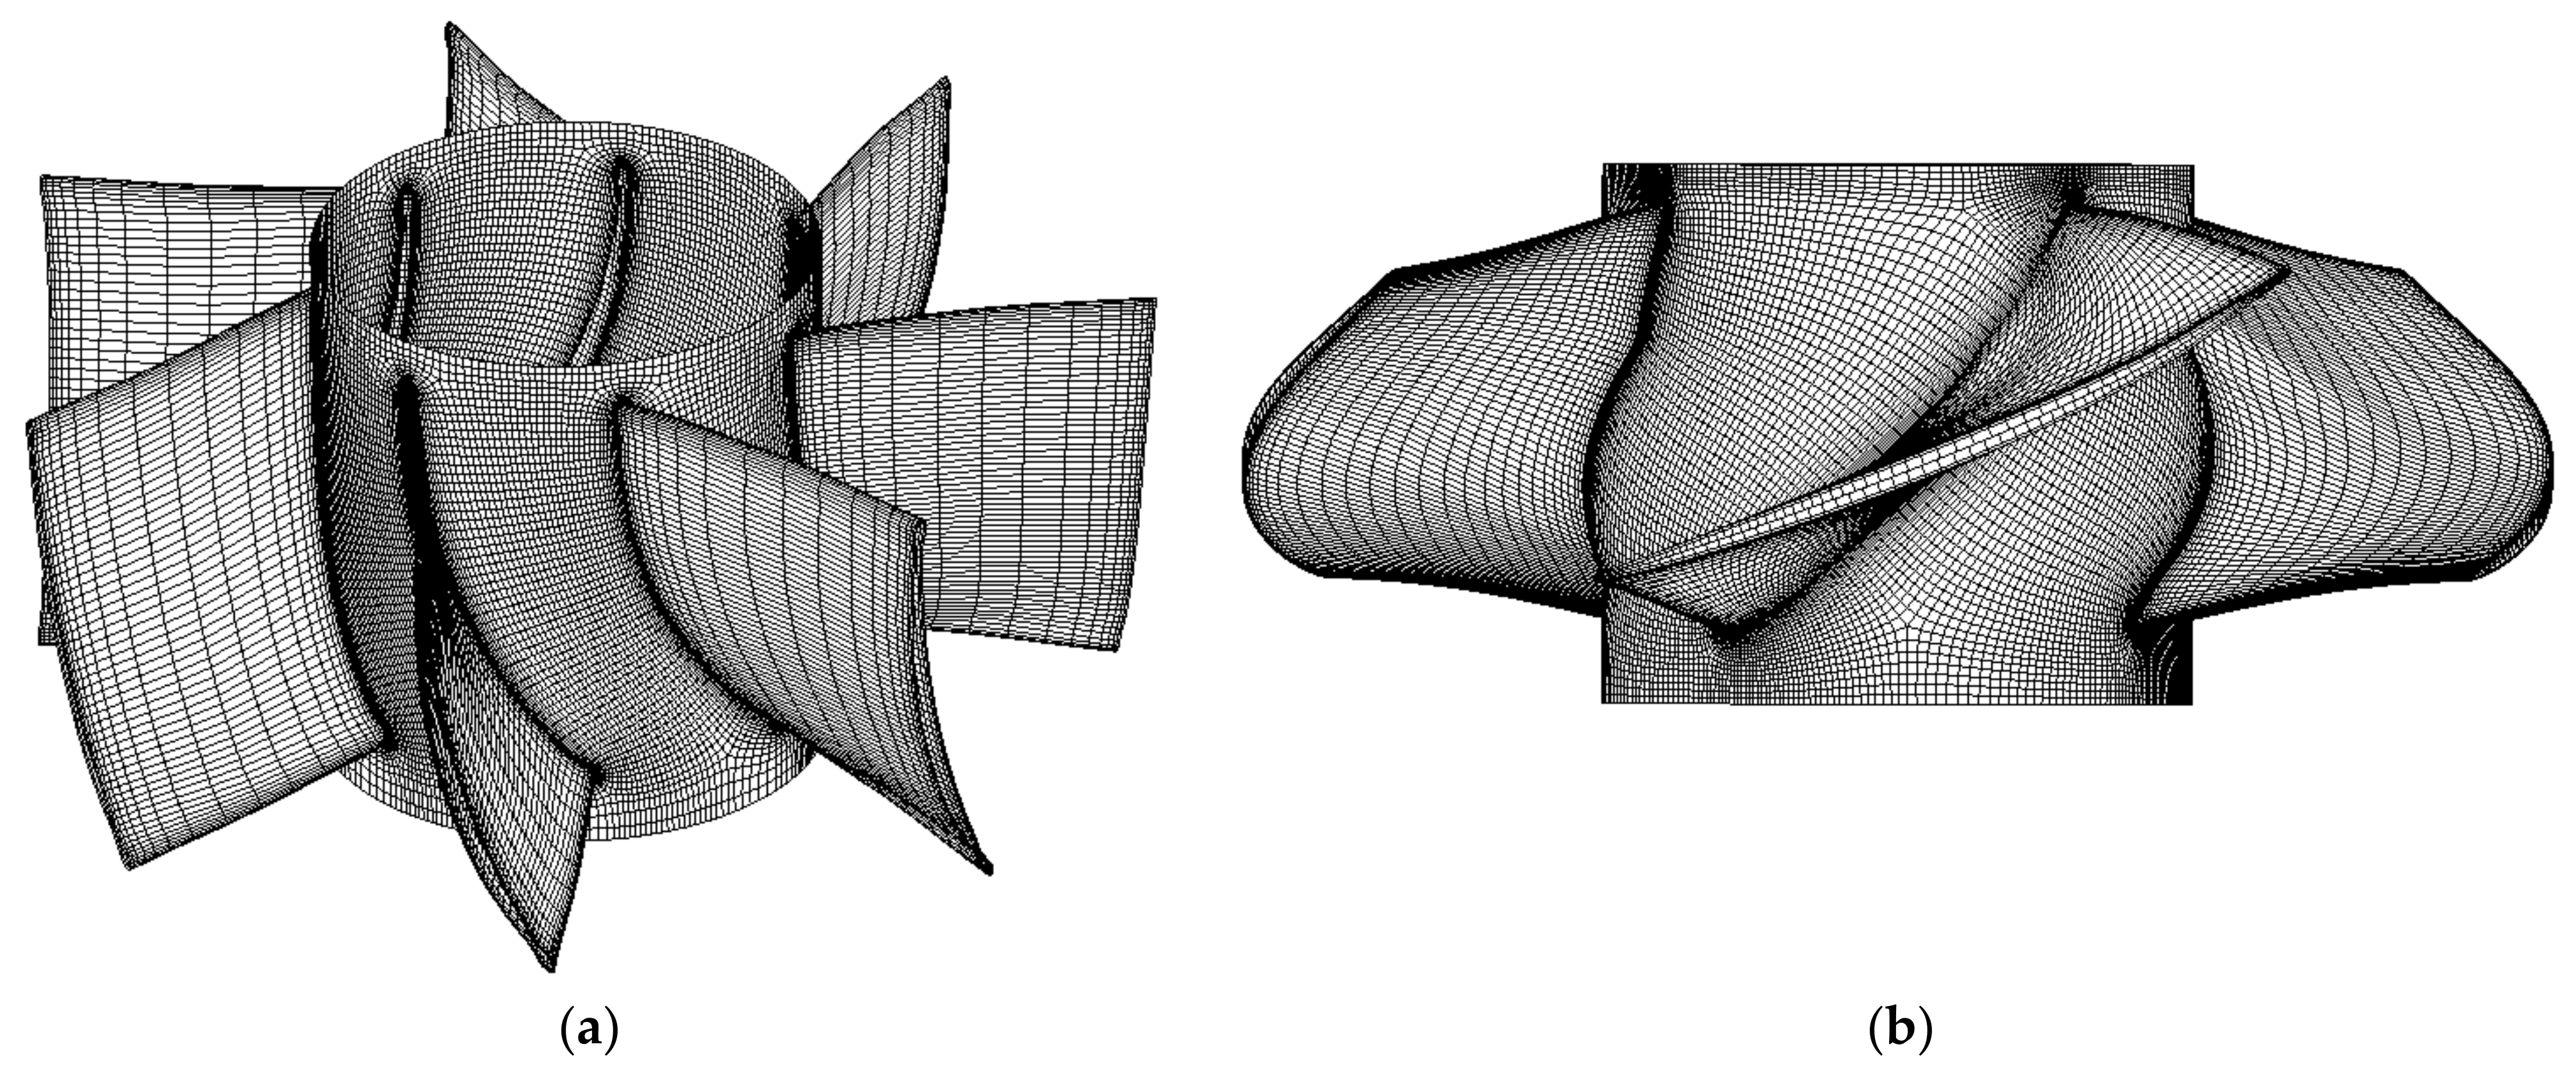
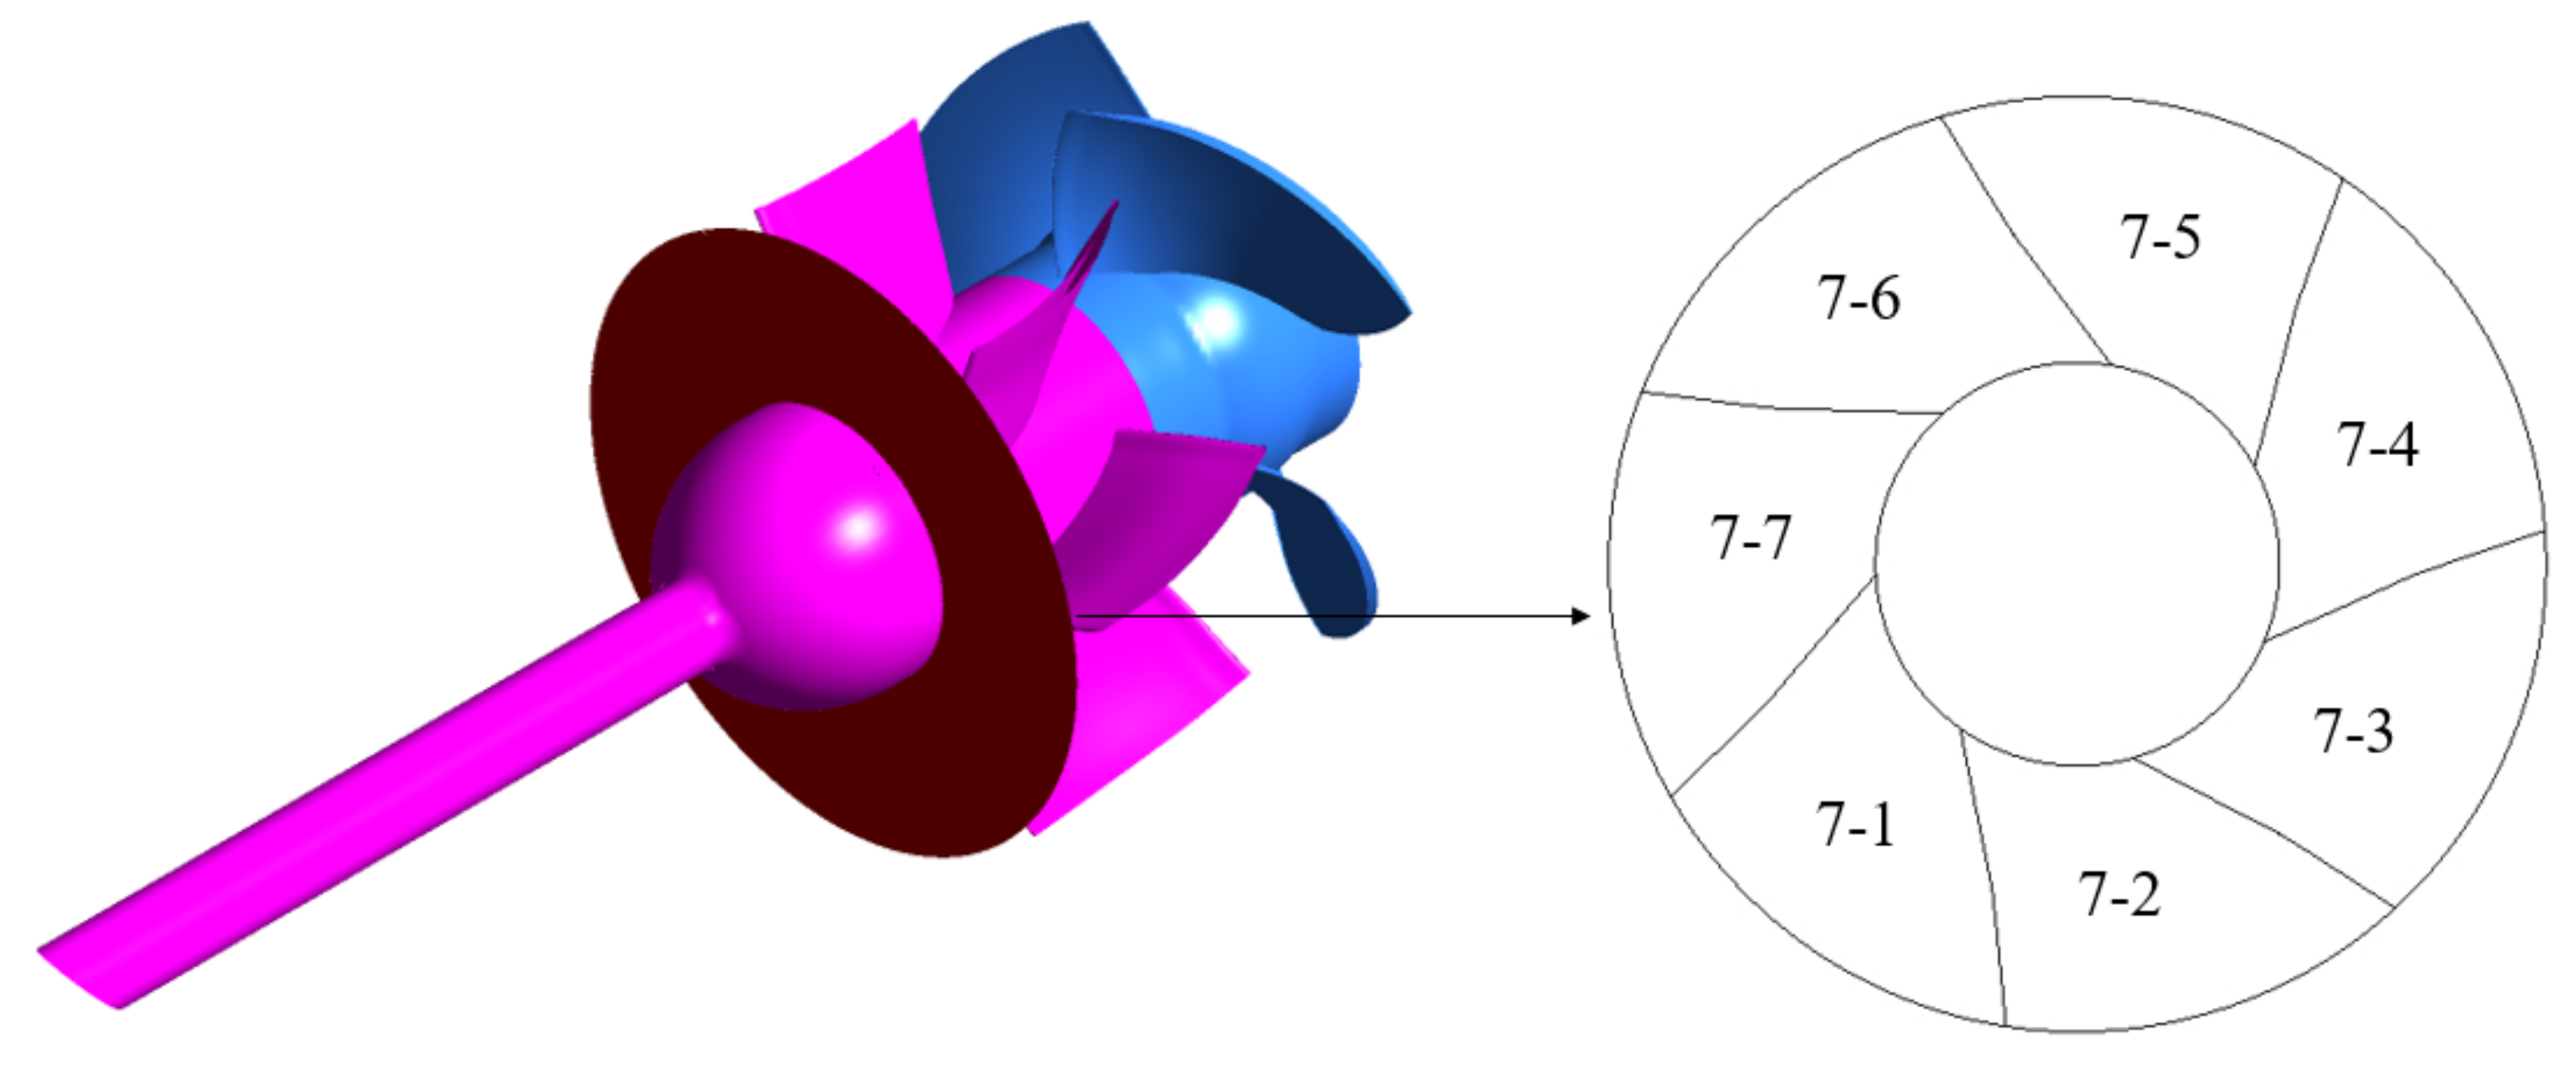
2.1. Computation Model

The vertical axial flow pump device includes five flow passage components: campaniform inlet conduit, impeller, guide vane, 90° elbow and straight outlet conduit. In this paper, the three-dimensional solid models of campaniform inlet conduit, 90° elbow and straight outlet conduit were established by NX10.0, and the three-dimensional solid models of impeller calculation domain and guide vane calculation domain were established by ANSYS TurboGrid software. The nominal diameter of the impeller is 0.3 m, the number of blades of the impeller is 4, the tip clearance is 0.2 mm, the number of blades of the guide vane is 7, the hub ratio is 0.483, the rated speed n is 1433 r/min, and the design flow Qbep = 338 L/s. The three-dimensional solid model of the pump device is shown in Figure 1, and the geometric dimensions of the campaniform inlet conduit, 90° elbow and straight outlet conduit are shown in Figure 2.

2.2. Calculation Method and Boundary Conditions

The RNG k-ε turbulence model takes into account the rotation and swirl flow in the average flow, which can better deal with the flow with high strain rate and large streamline curvature. It is mainly applied to the flow in the rotating coordinate system. The model can better reflect the dynamic and static interference caused by the rotation of the impeller, and can effectively predict the unsteady three-dimensional flow and pressure pulsation of the axial flow pump device [3,17,18]. In this paper, Reynolds-averaged Navier-Stokes equations and RNG k-ε turbulence model are used to simulate the flow in vertical axial flow pump. The inlet boundary condition is flow inlet, the outlet boundary condition is pressure outlet, the pressure value is 1 atm (atmospheric pressure), the solid wall is non-slip wall, and the convergence accuracy is 1.0 × 10⁻⁵. The interfaces between impeller calculation domain and campaniform inlet conduit calculation domain and guide vane calculation domain are set as static and dynamic interface. Transient Rotor Stator interface type is used for unsteady calculation of pump device [19,20,21]. The interface between other calculation domains is set as static and static interface, and None interface model is used. In the unsteady numerical simulation of the vertical axial flow pump device, the impeller is calculated once every 3° rotation [19,22], and the impeller rotation is 120 steps. In order to stabilize the unsteady flow field simulation results and control the calculation amount, eight impeller rotation cycles are calculated in this paper, with a total of 960 steps. According to the rotation speed of the vertical axial flow pump impeller, the time length of 3° rotation is 0.000348 s, and the total time length of 8 circles is 0.335 s. With the increase of impeller rotation time, the flow field movement tends to be stable. Therefore, the pressure pulsation data of the last four rotation cycles are selected to analyze the pump device.

2.3. Verification of Grid Number Independence and Convergence

ICEM CFD software was used to conduct structured grid division for campaniform inlet conduit, 90° elbow and straight outlet conduit, and Ansys TurboGrid software was used to conduct structured grid division for impeller and guide vane.
In order to control the calculation efficiency and ensure the calculation accuracy, the grid number independence analysis of the vertical axial flow pump device was carried out at the design flow rate (Qbep = 338 L/s). A total of 7 groups of grids (2.84 million, 3.33 million, 3.6 million, 3.87 million, 4.1 million, 4.26 million and 4.8 million) were were numbered as schemes 1–7, respectively. The pump device efficiency was used as the evaluation standard. The calculation results are shown in Figure 3. It can be seen from Figure 3 that when the grid number of the vertical axial flow pump device reaches 4.26 million, the absolute error of the device efficiency of schemes 6 and 7 is controlled within 0.2%, which meets the accuracy requirement of numerical simulation [12].
In order to further verify the grid convergence, the grid convergence index GCI (Grid convergence Index) is introduced in reference [23,24]. In order to evaluate the grid convergence, the GCI is calculated with the device head as a variable, as shown in Table 1.
It can be seen from Table 1 that the grid convergence index GCI of schemes 5 and 6 is less than 3%, which meets the grid convergence criterion of reference. Combined with the mesh number independence analysis, scheme 6 is finally selected as the calculation scheme.
In order to ensure the accuracy of the calculation after using the split grid model, the dimensionless parameter y+ is introduced to represent the distance from the grid node closest to the wall, which is defined as follows [25,26,27,28]:
y + = Δ y u τ ν
where Δy is the distance from the first grid node to the wall; uτ is wall friction velocity; ν is kinematic viscosity.
Under the working condition of 1.0 Qbep, the y+ values of each flow passage component of the vertical axial flow pump device studied in this paper are: y+ of the bell-shaped inlet channel is about 389, y+ of the impeller is about 36, y+ of the guide vane is about 78, and y+ of the straight pipe outlet channel is about 450, which meets the requirements of numerical simulation [25,26,27,28]. The grid of impeller and guide vane of vertical axial flow pump is shown in Figure 4.

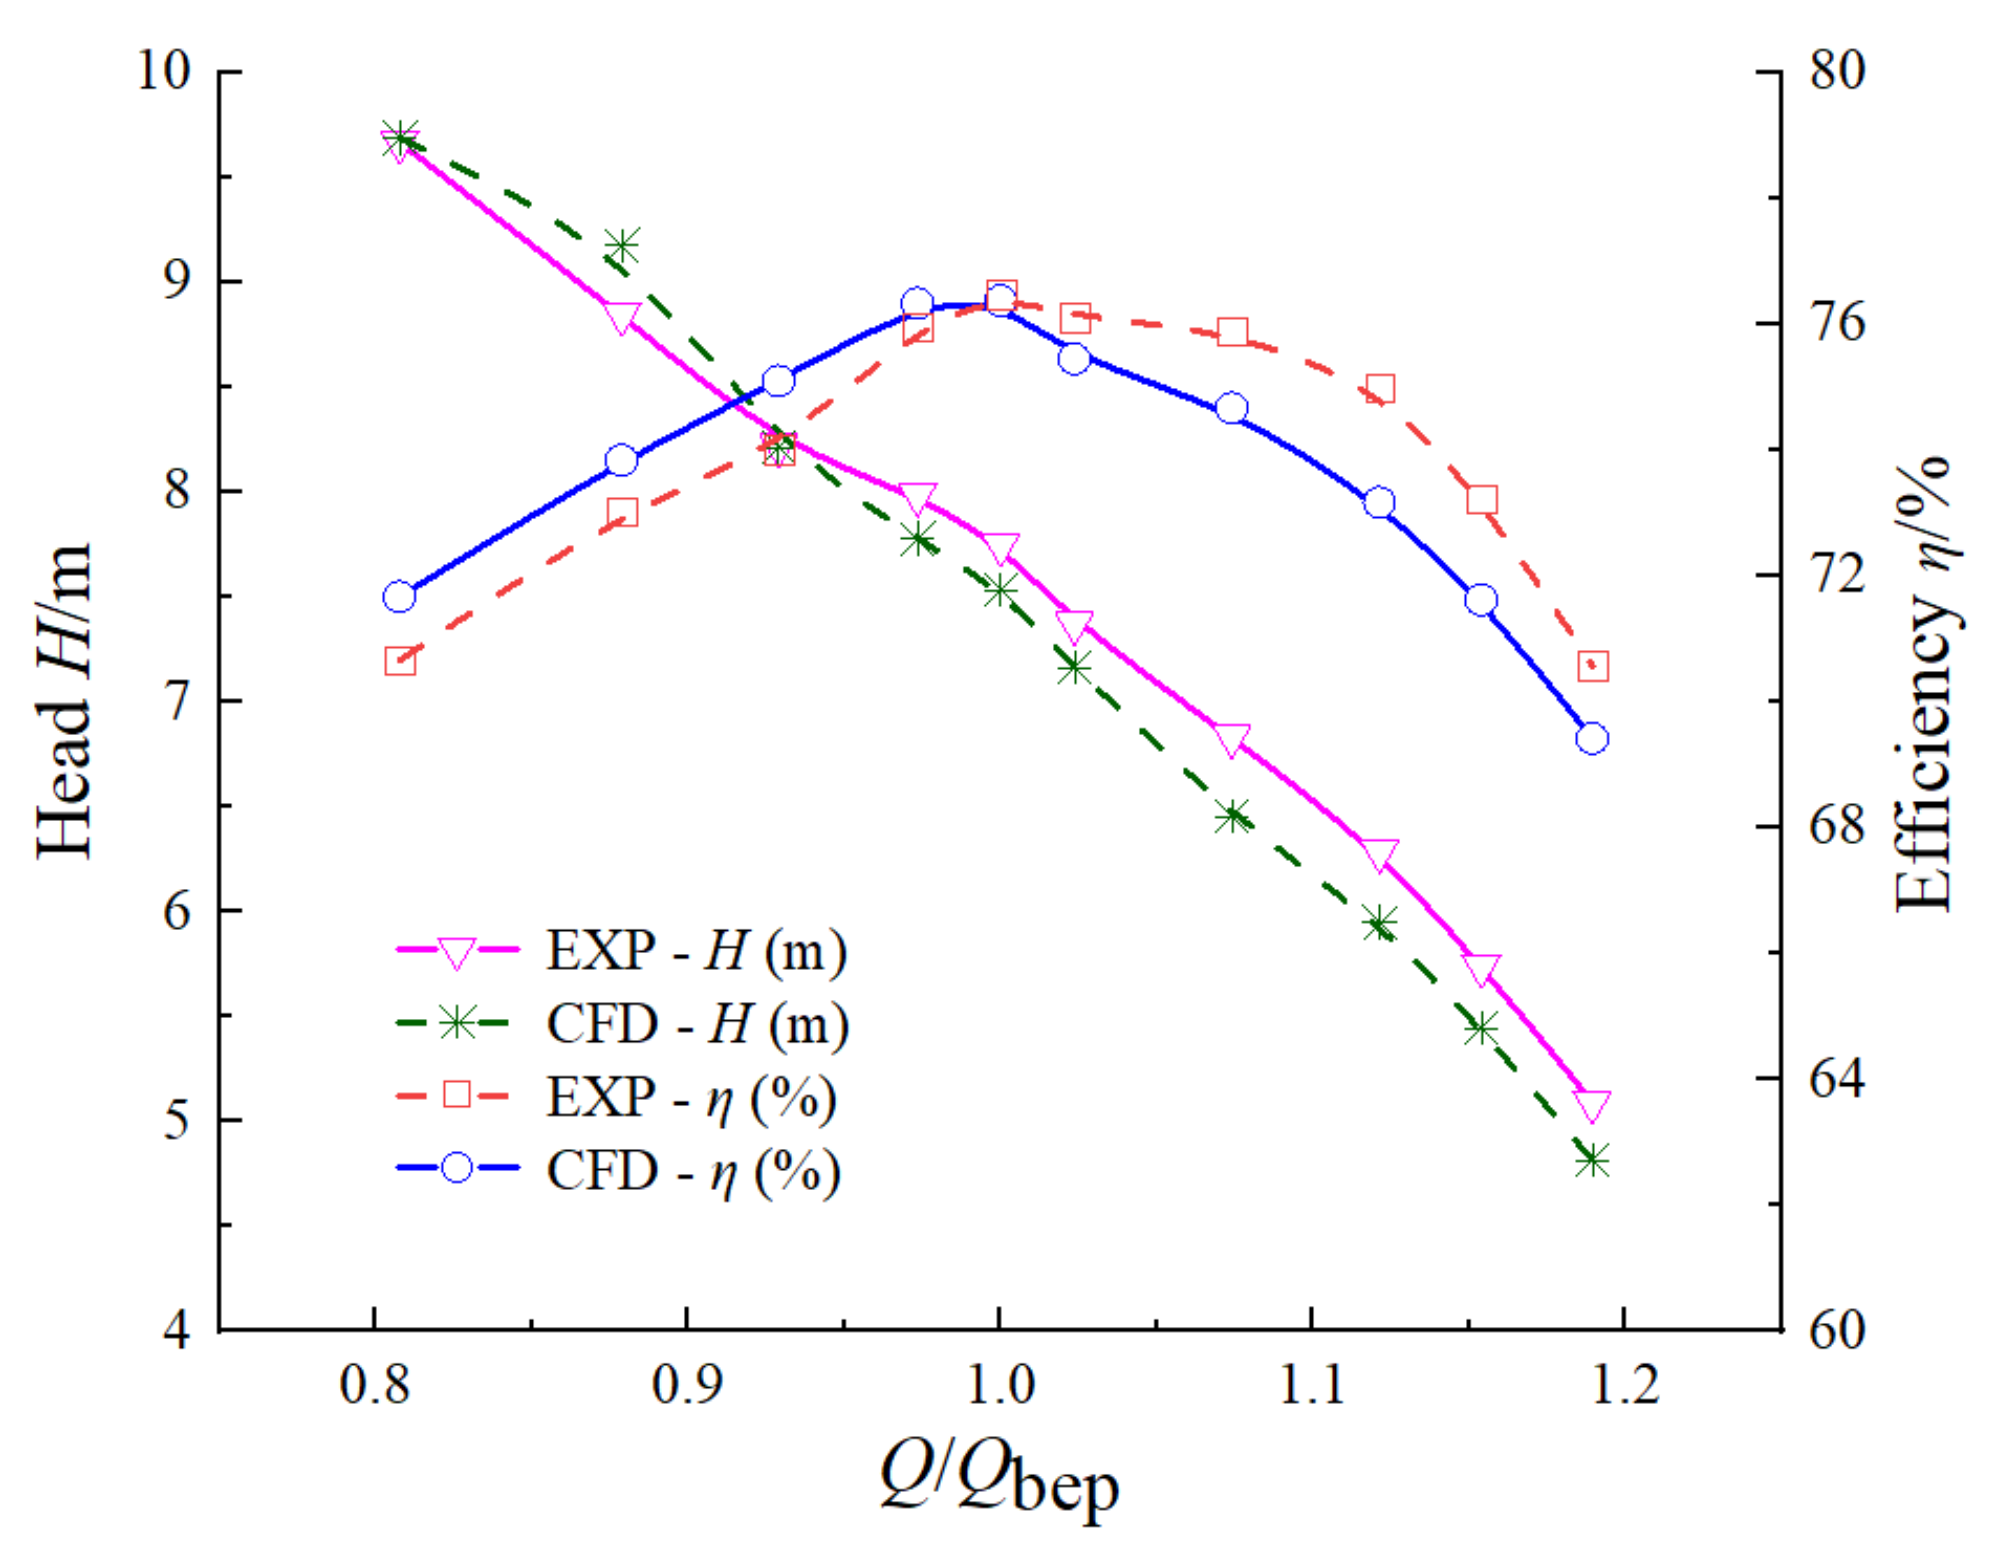
2.4. Experimental Verification of Numerical Calculations

The physical model test of the vertical axial flow pump device is carried out on the high precision hydraulic mechanical test bench of the Key Laboratory of Jiangsu Province, China. The uncertainty of the test bench system is ±0.2612%, the uncertainty of the test bench efficiency test is ±0.13%, and the total uncertainty of the test bench efficiency test is ±0.293%, which meets the requirements of the allowable total uncertainty of the test specified in the national industrial standard Code of Practice for Model Pump and Its Installation Acceptance Tests (SL140-2006). The nominal diameter of the impeller used in the model test is 300 mm, the rotational speed is 1433 r/min, the number of blades of the impeller is 4, the number of blades of the guide blade is 7, the blade placement angle is 0°, and the average tip clearance of the impeller is 0.2 mm. The physical model test diagram of vertical axial flow pump device is shown in Figure 5. Under the condition of 0° blade placement angle, the head and efficiency of the pump device model under different flow conditions are collected. The performance results of the collected physical model are compared with the energy performance results of the numerical simulation, as shown in Figure 6. The energy performance curve predicted by the vertical axial flow pump device model is basically consistent with the change trend of the test curve. The maximum relative error between the head of the pump device predicted by the numerical simulation and the physical model test value is 5.5%, and the minimum relative error is 0.2%. The maximum relative error between the efficiency of the pump device predicted by the numerical simulation and the physical model test value is 2.44%, and the minimum relative error is 0.12%. The small relative error indicates the effectiveness and reliability of the numerical simulation of the vertical axial flow pump device.

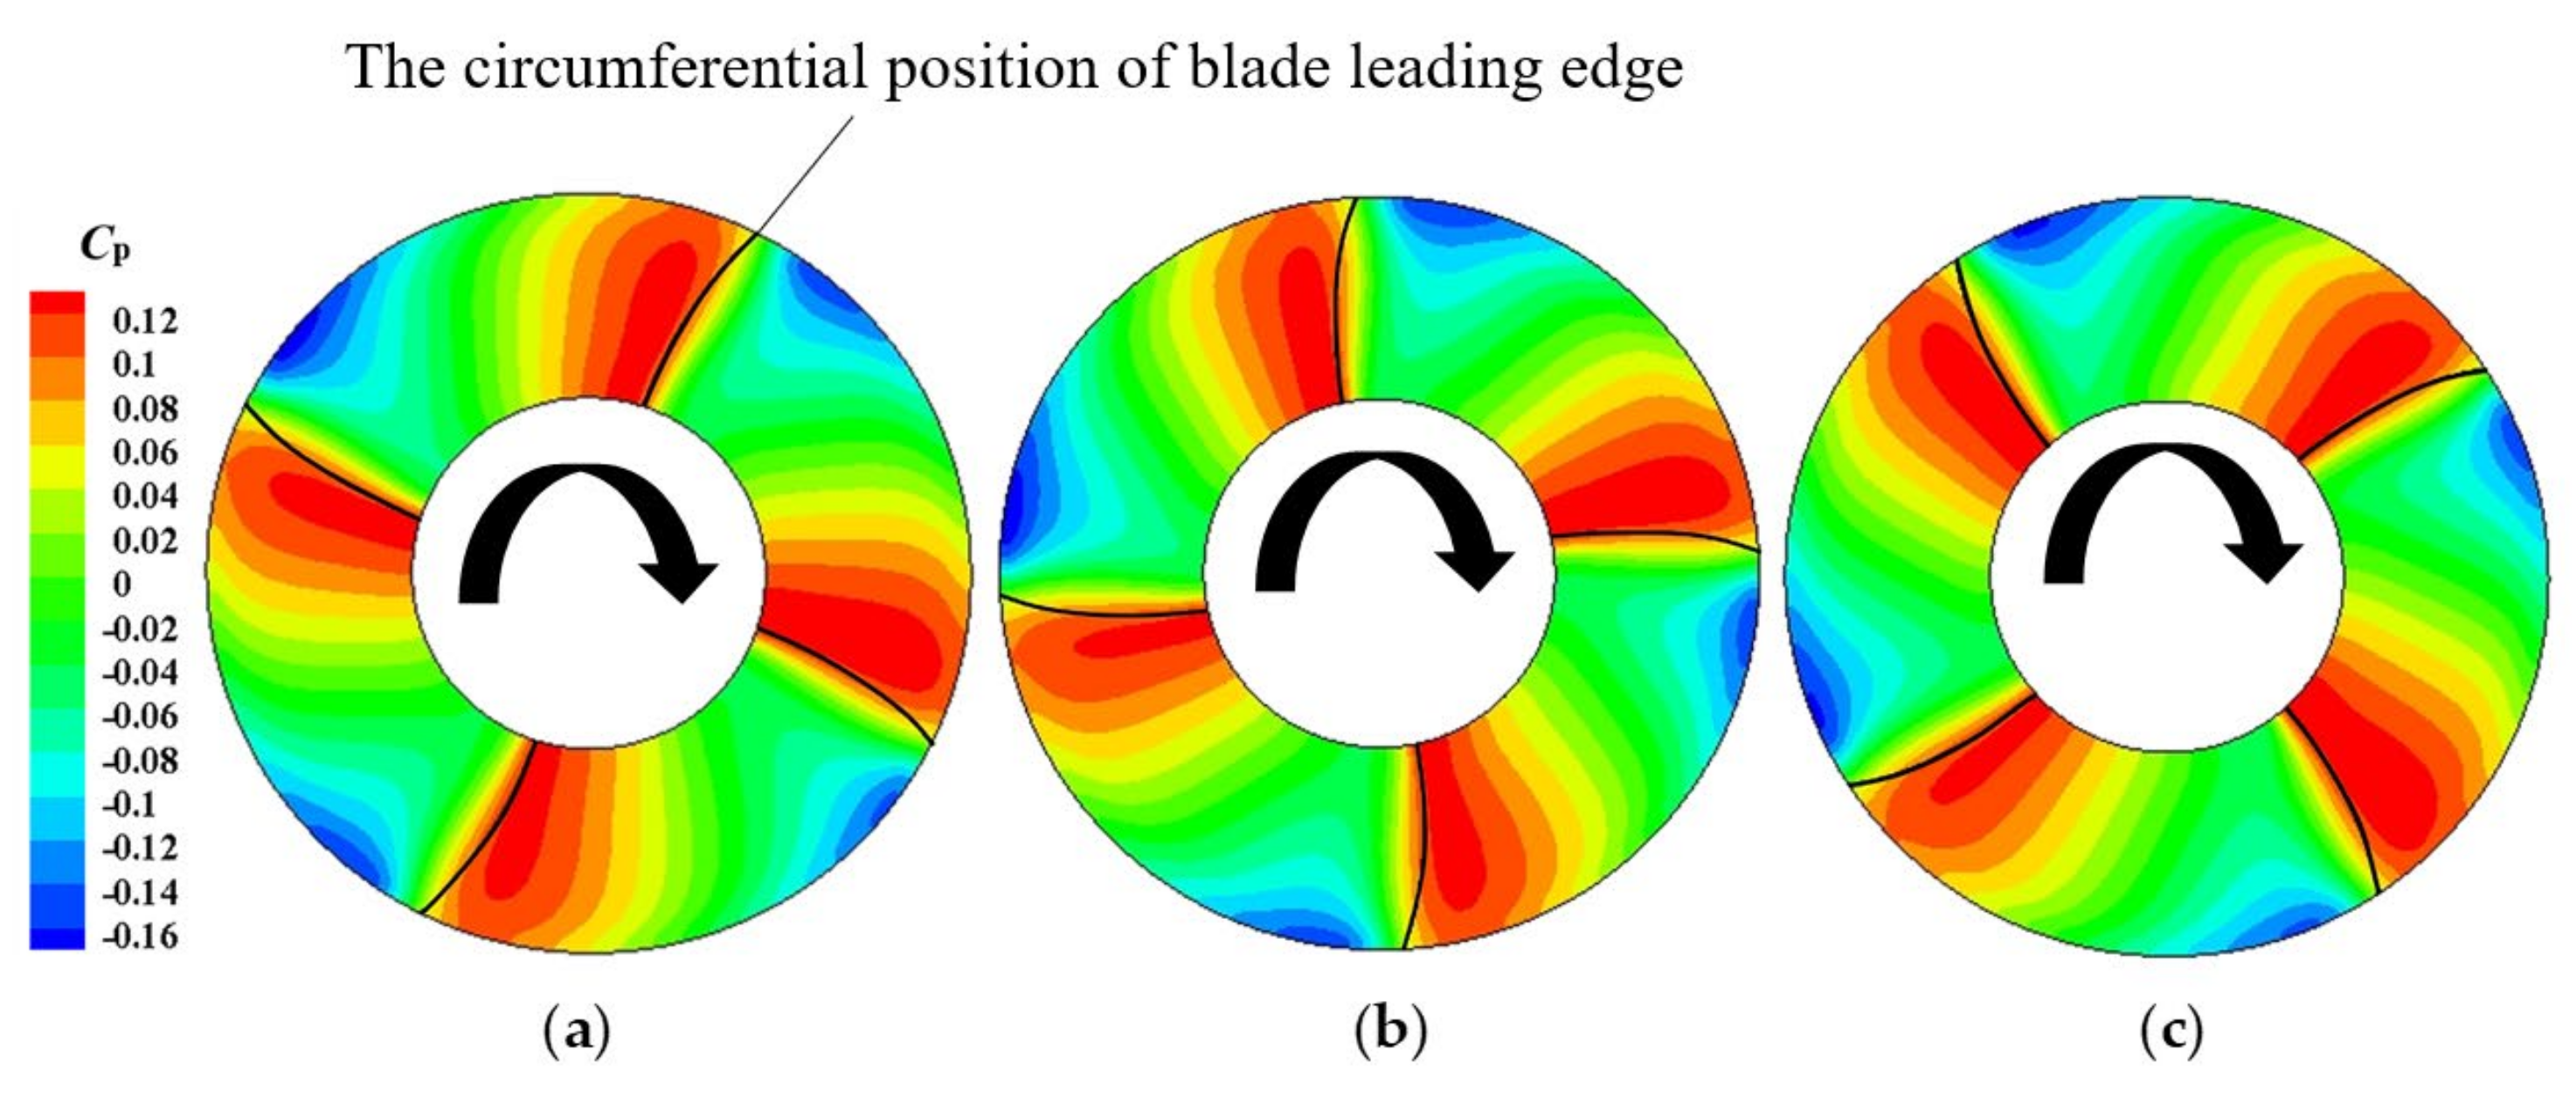
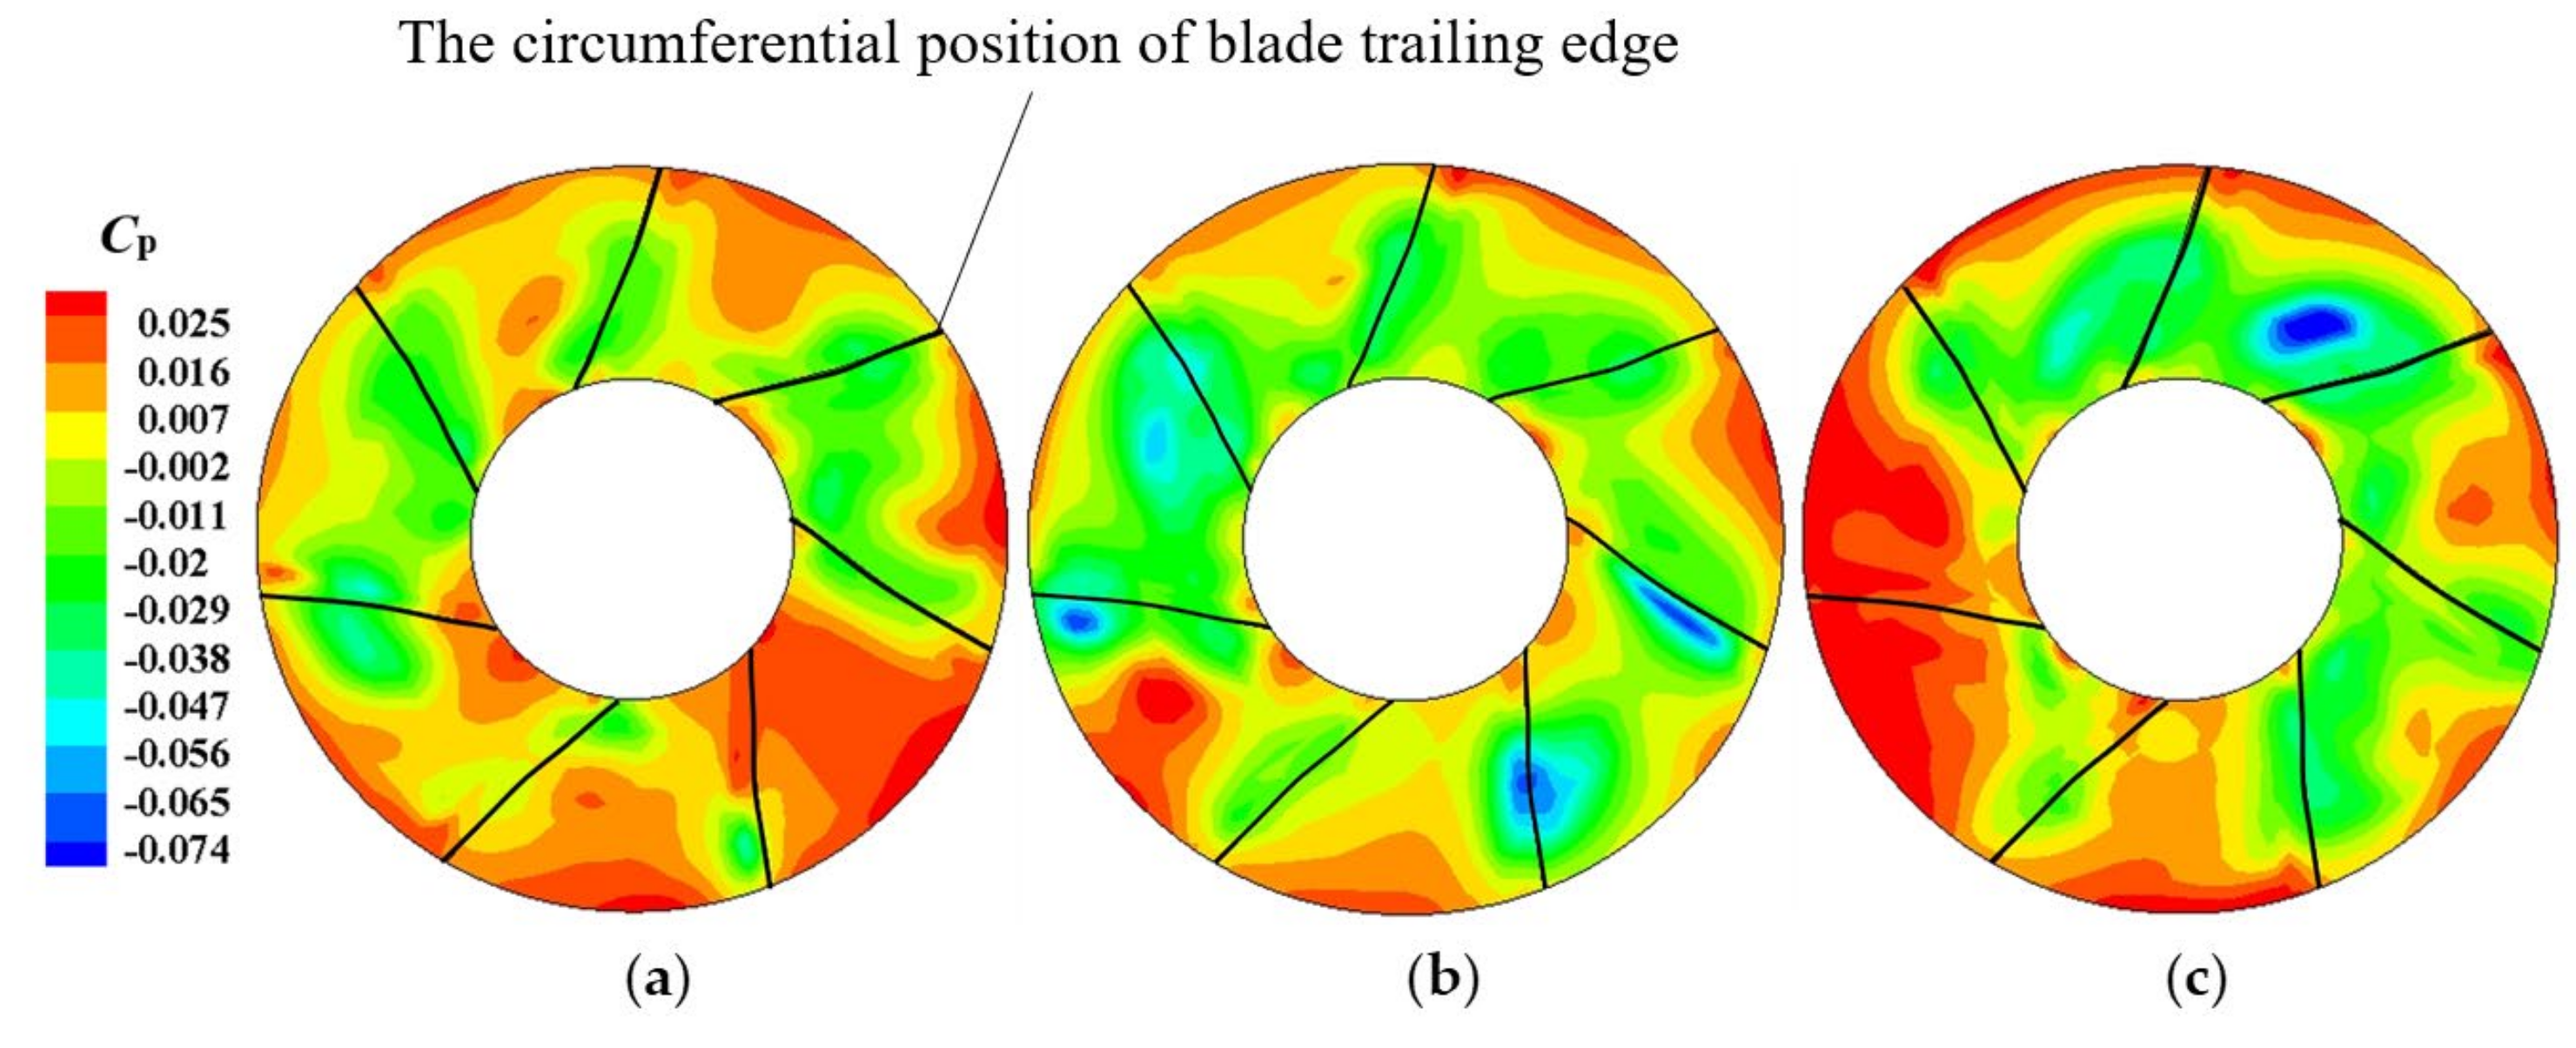
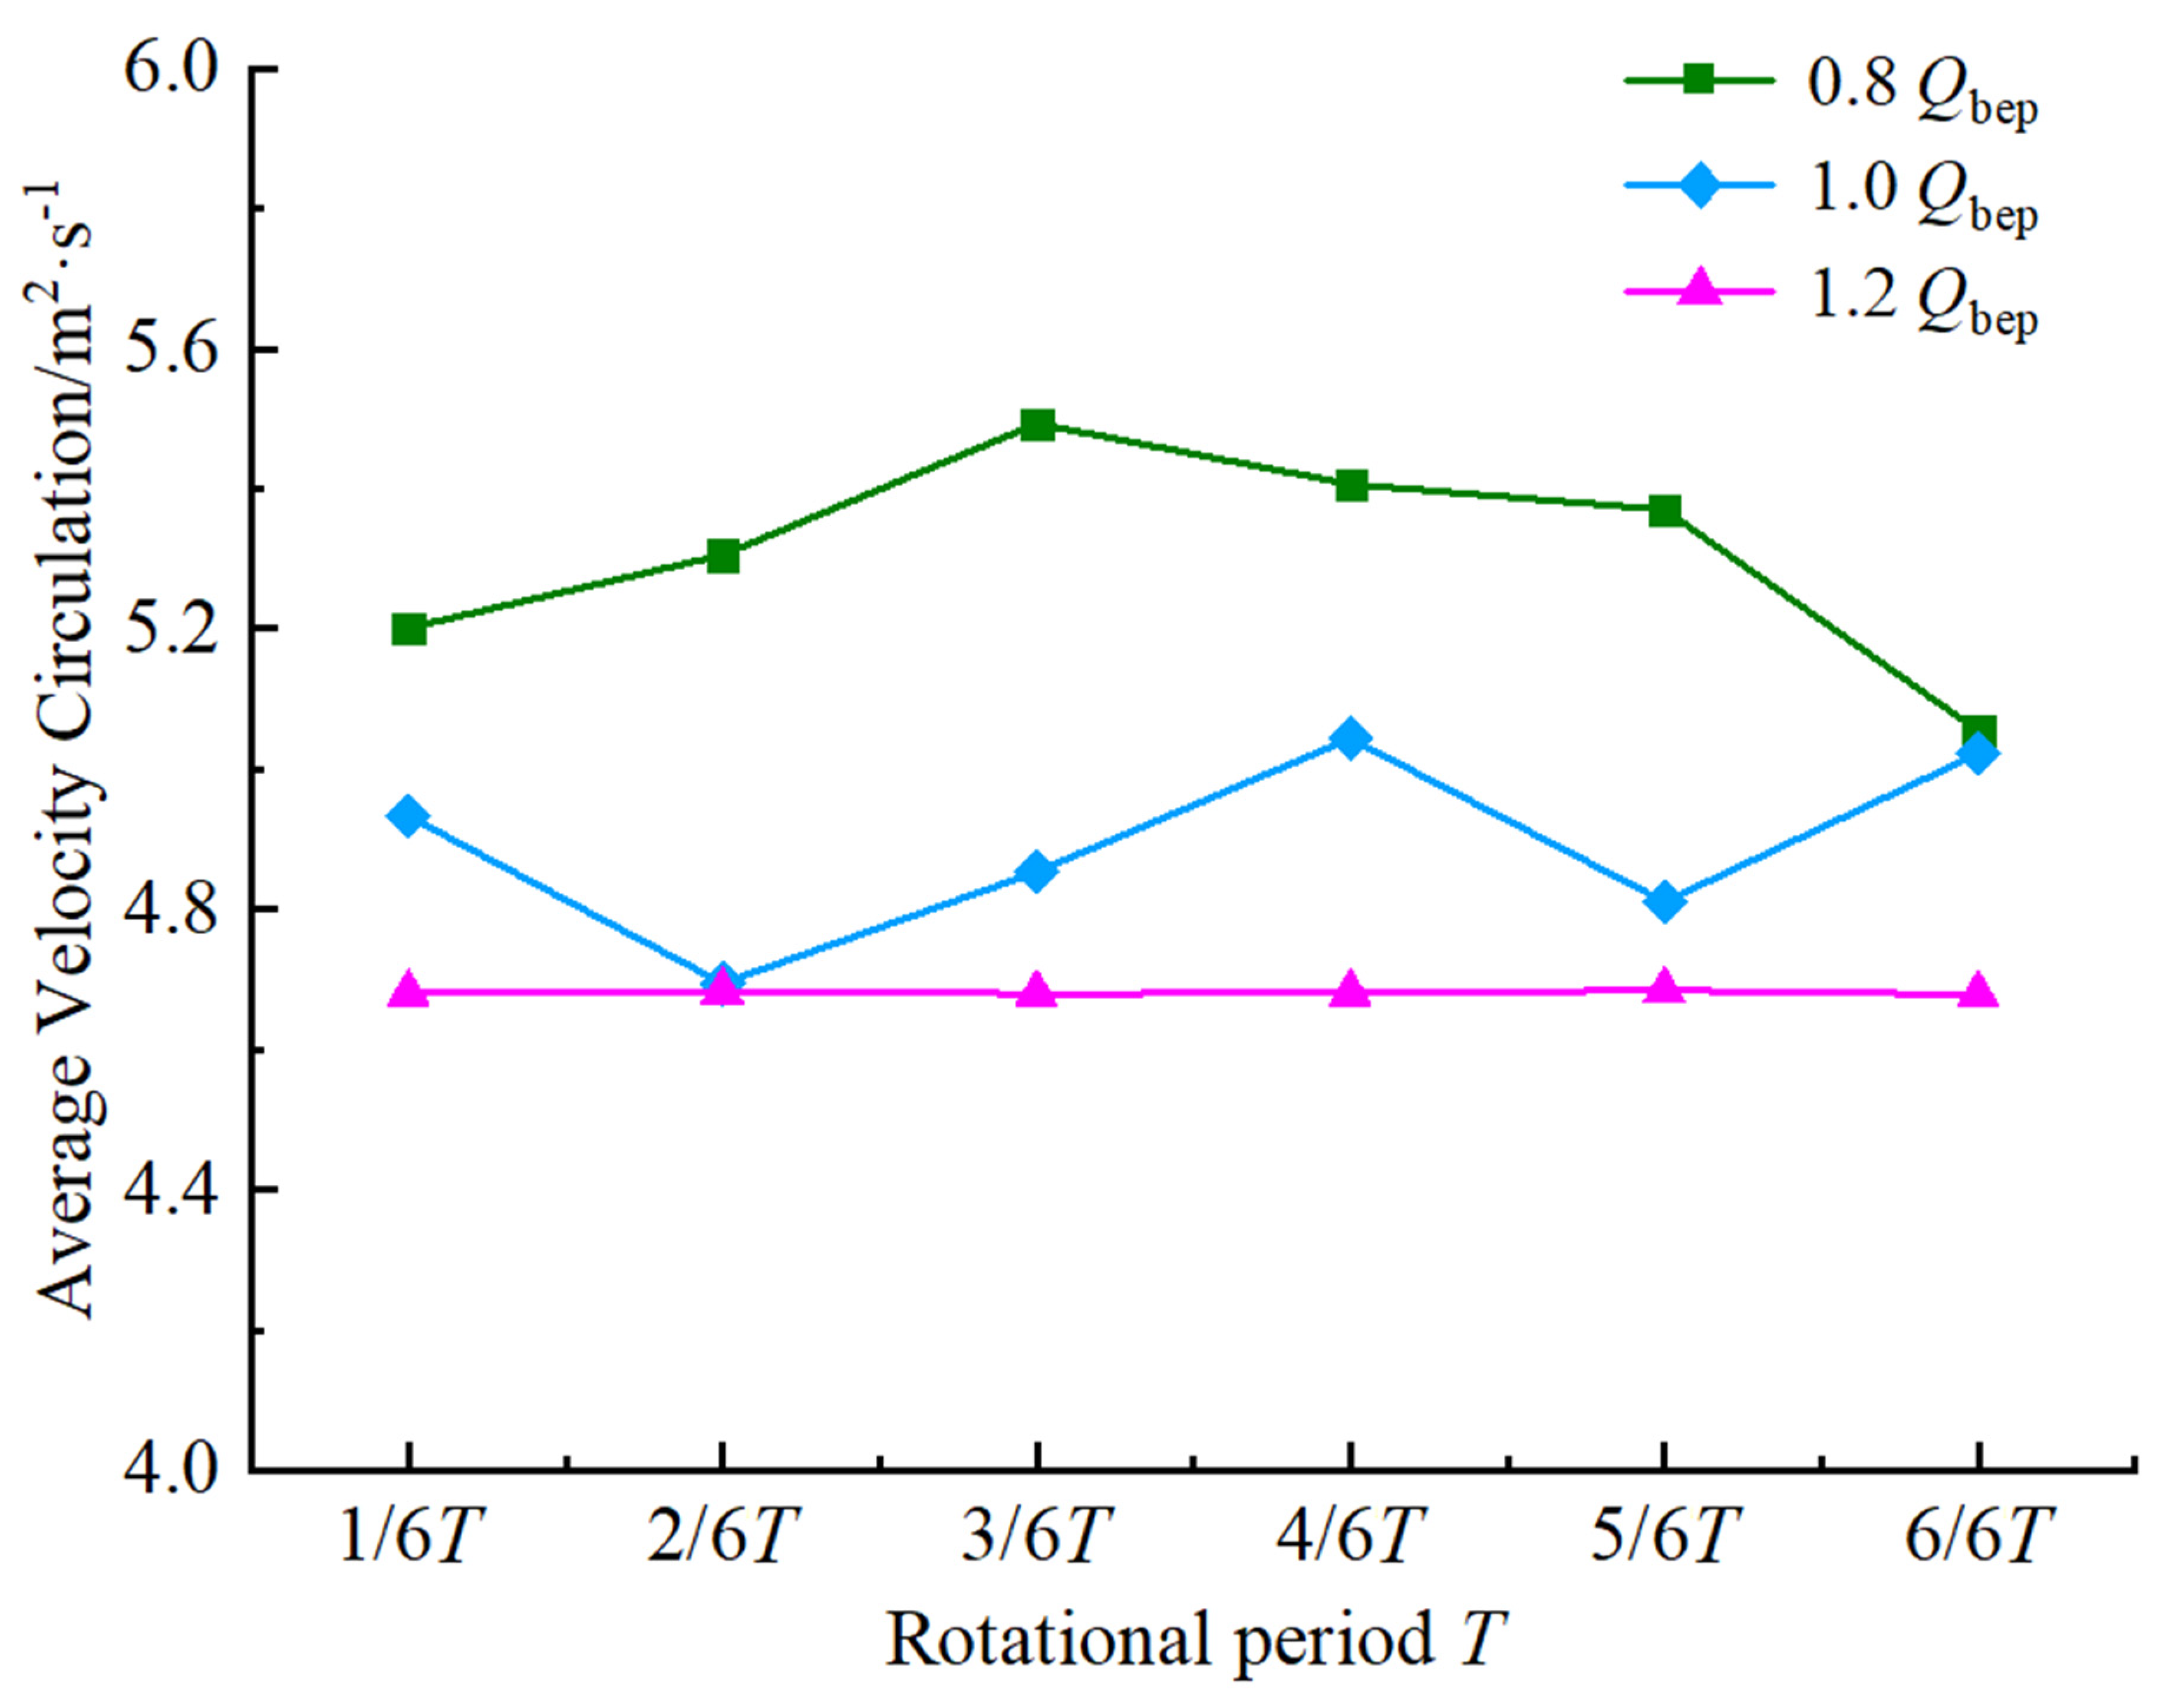
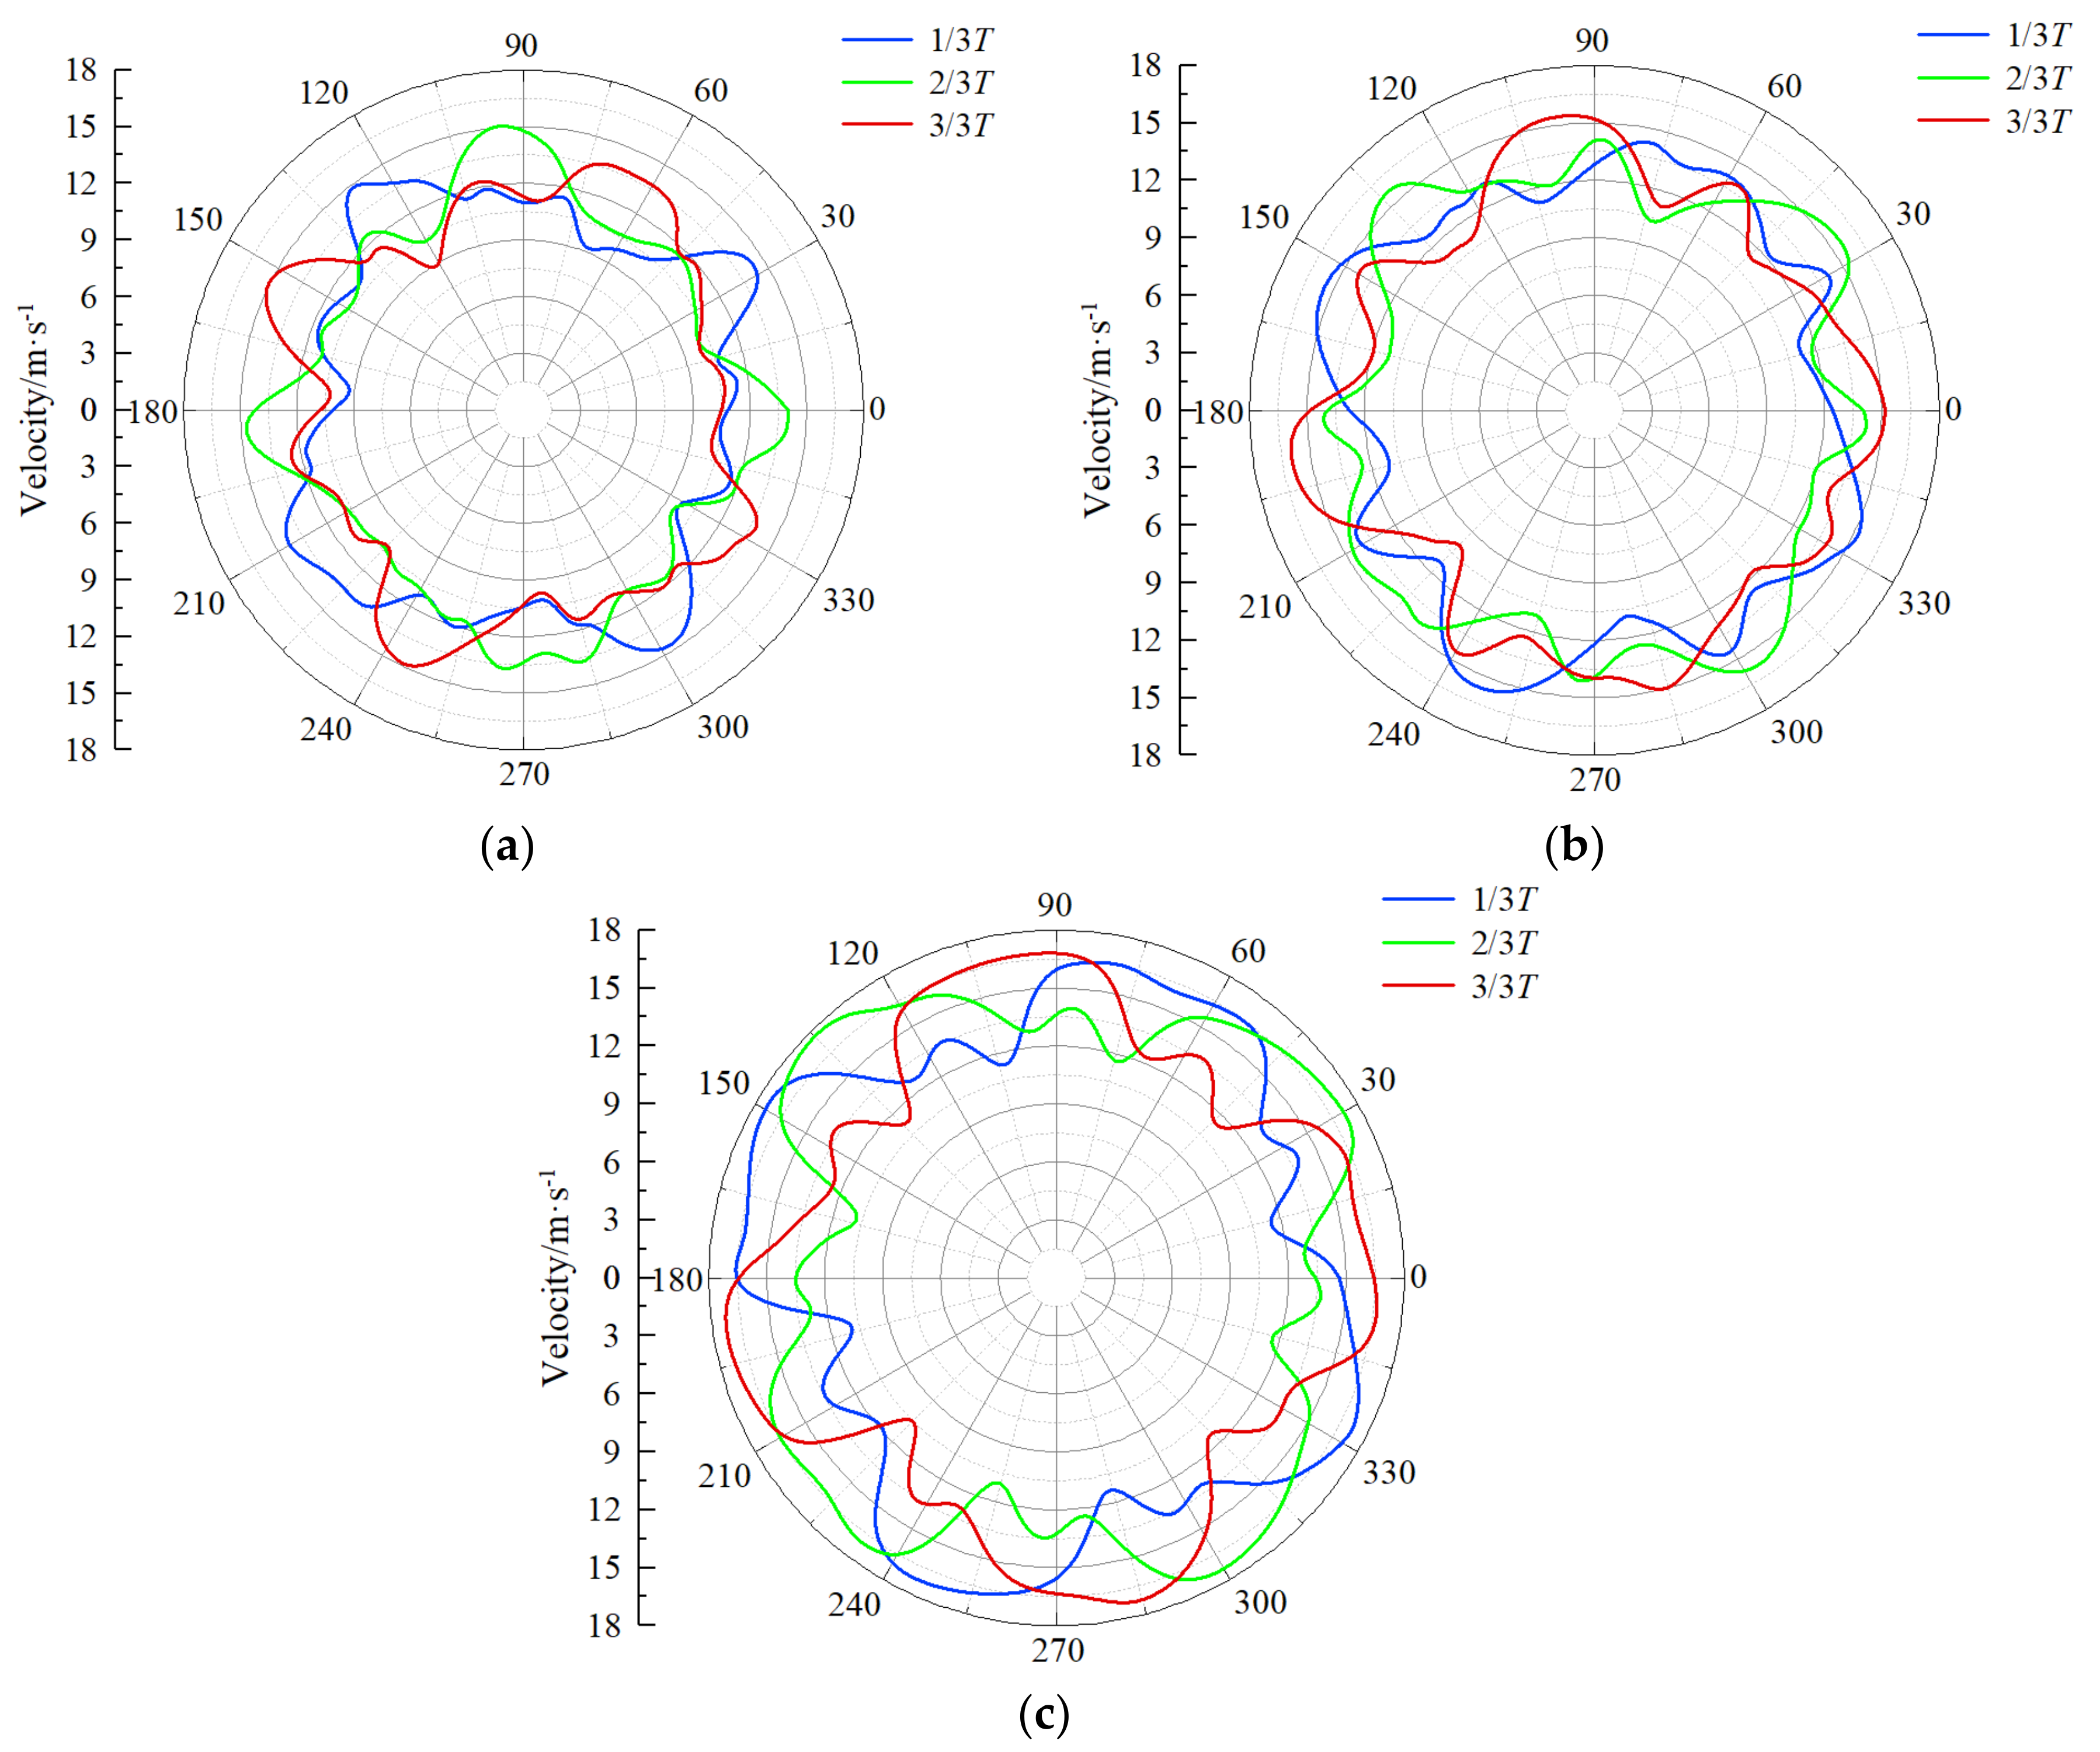
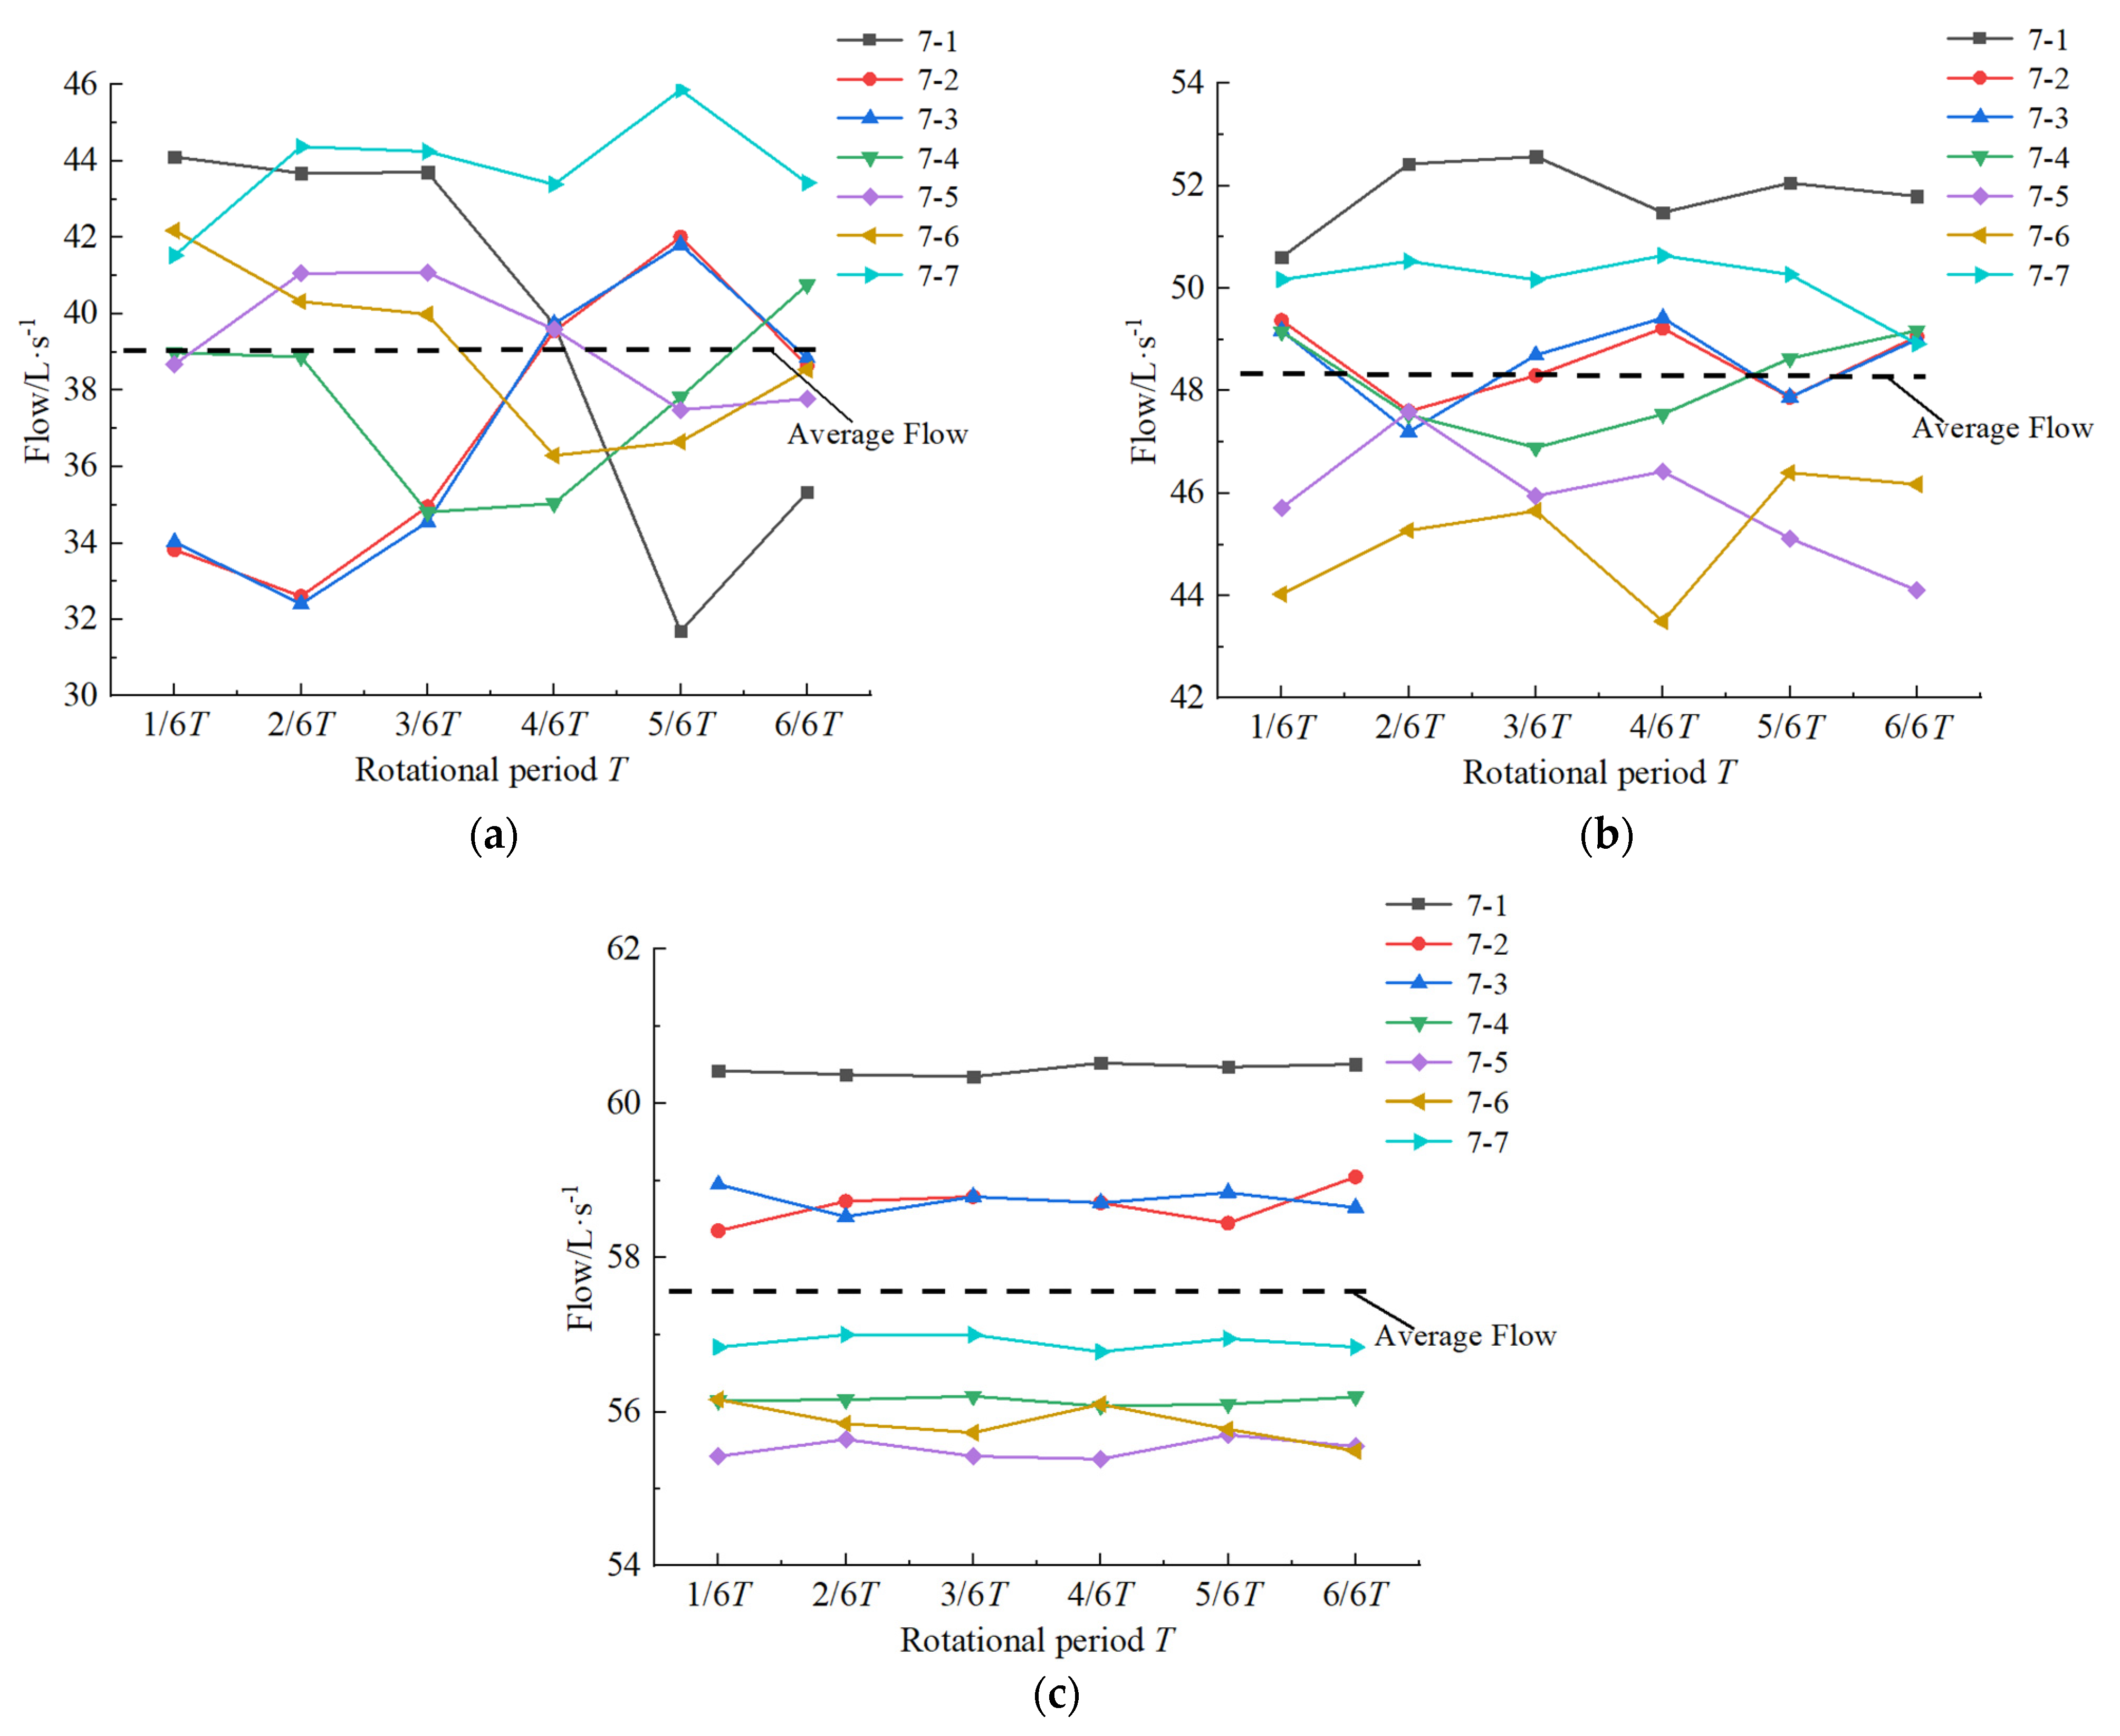
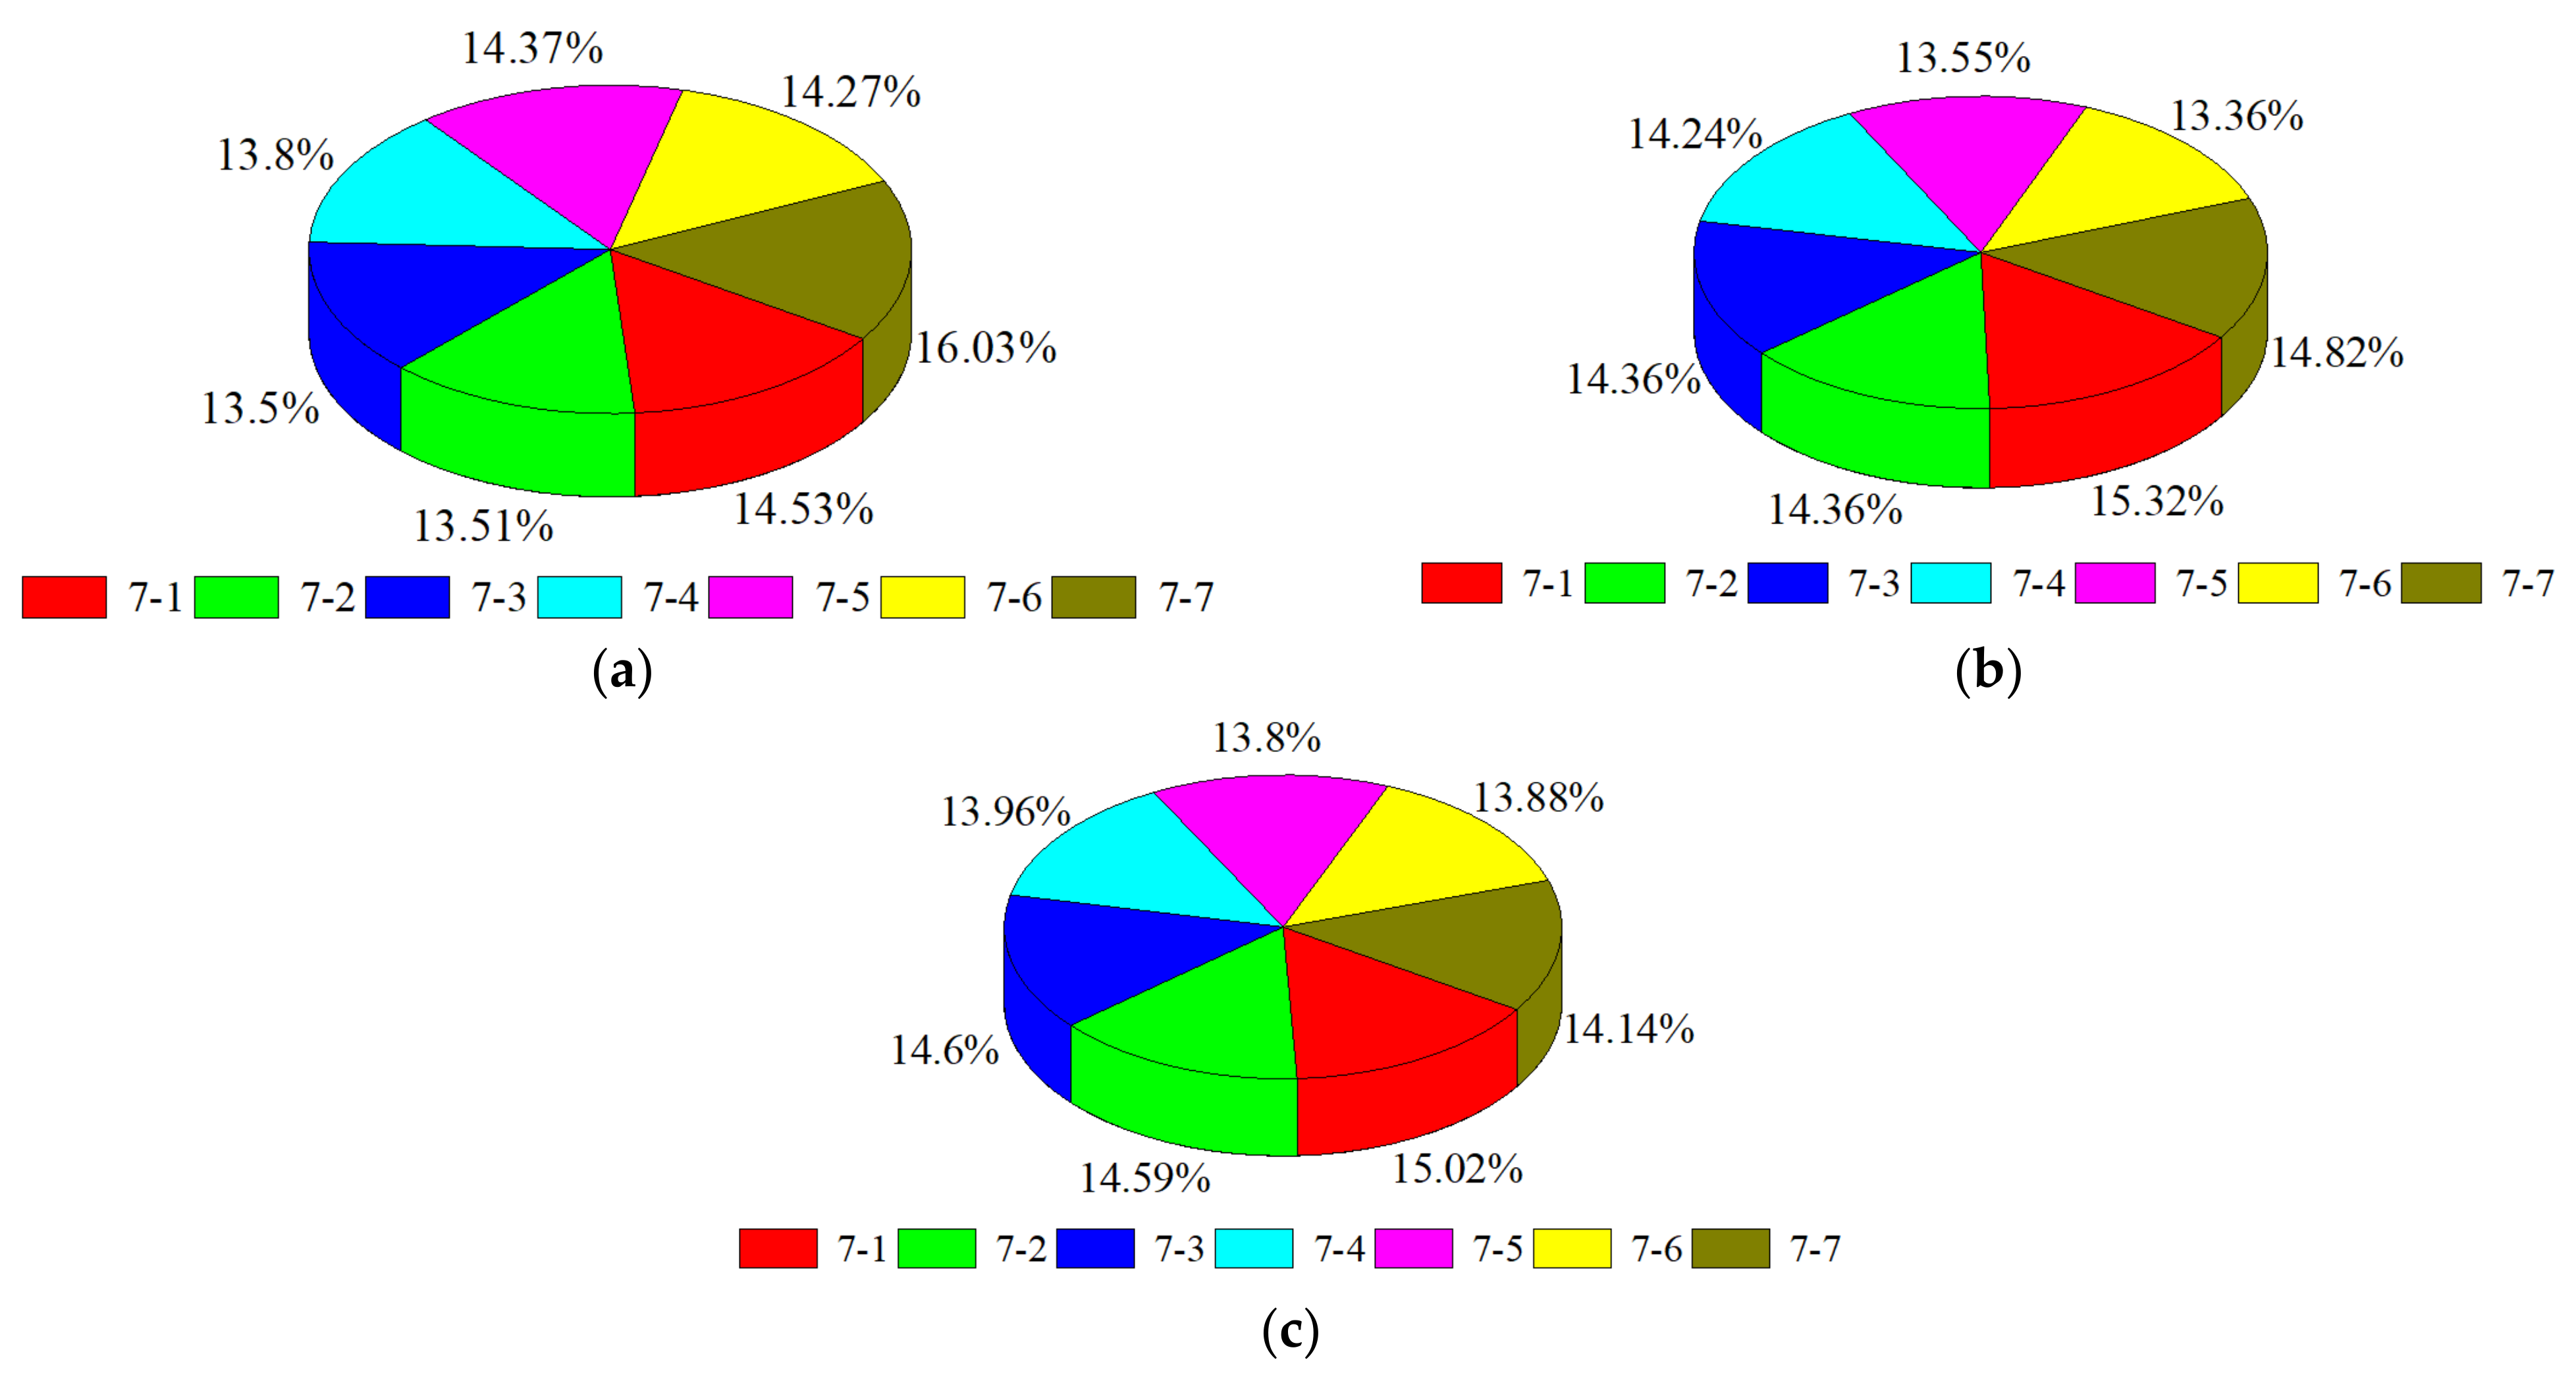
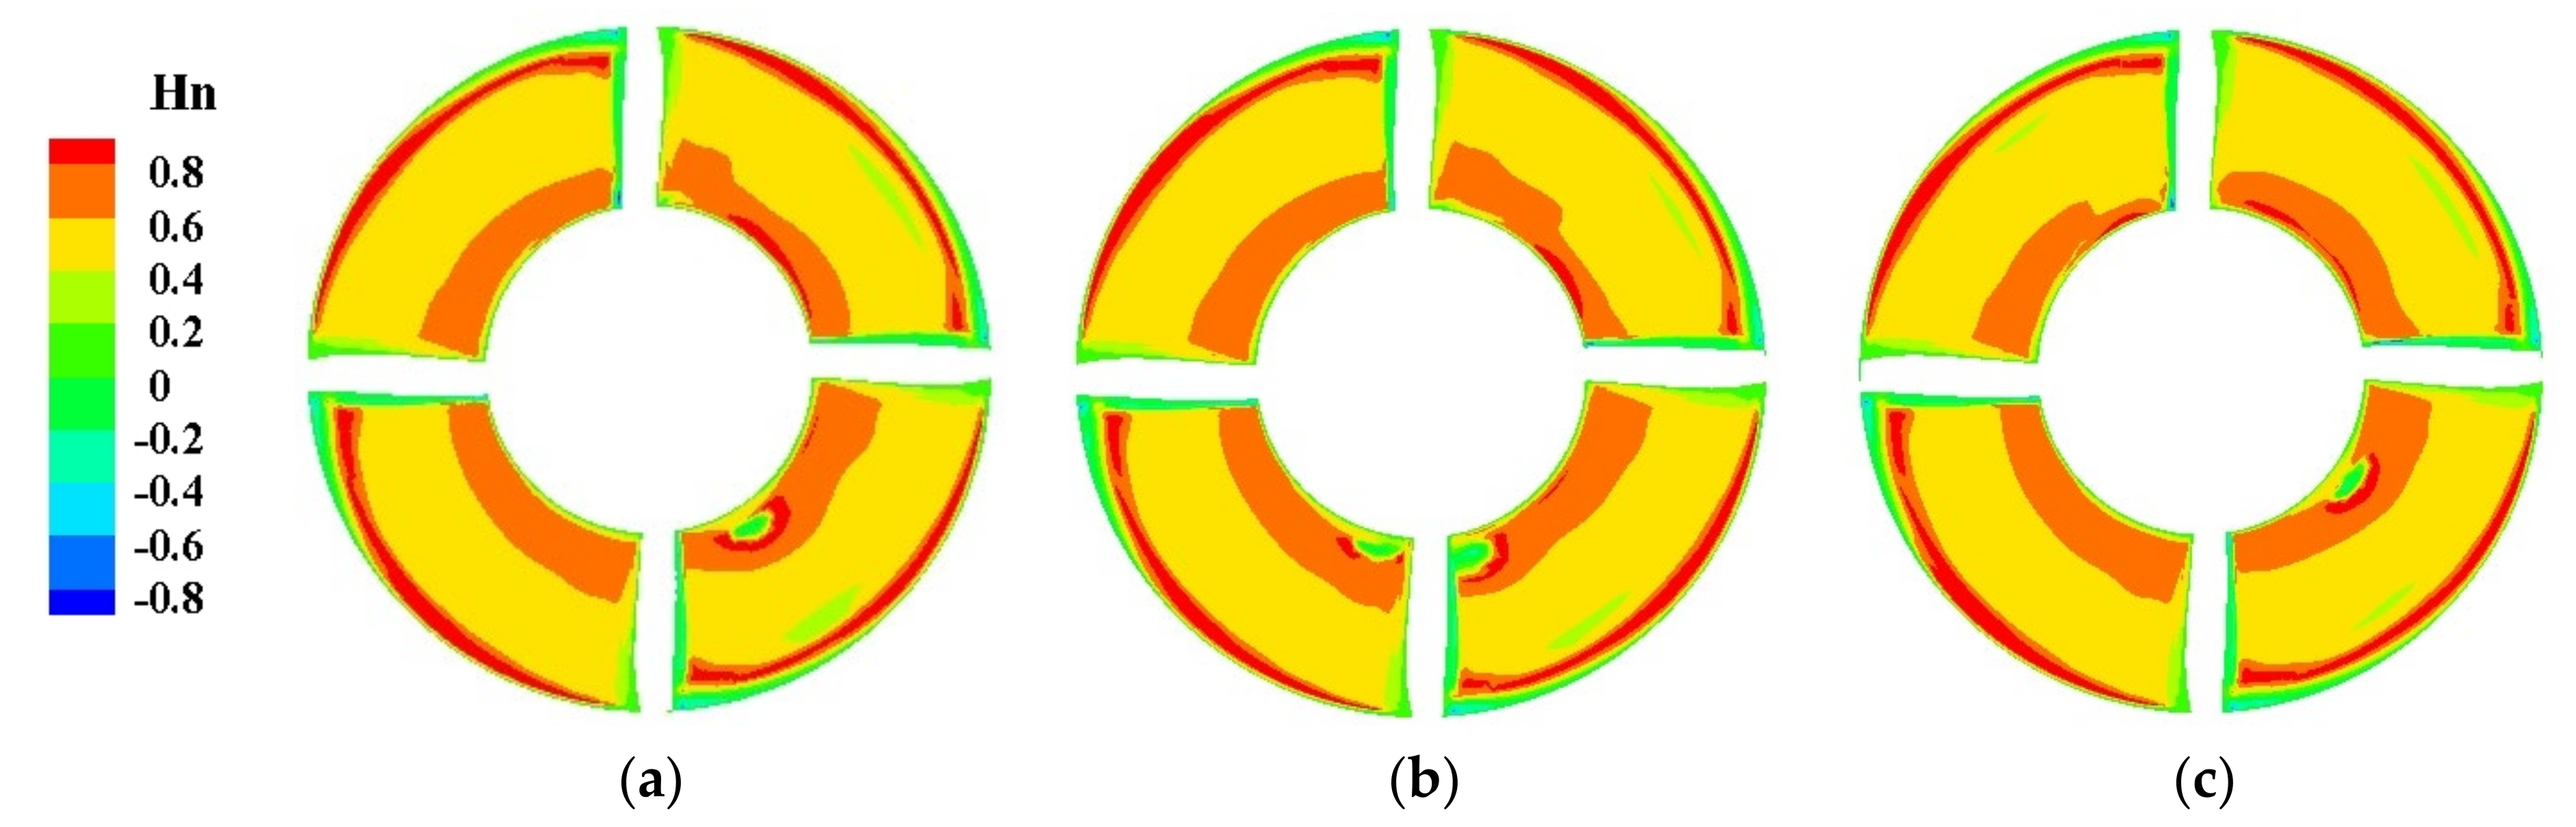
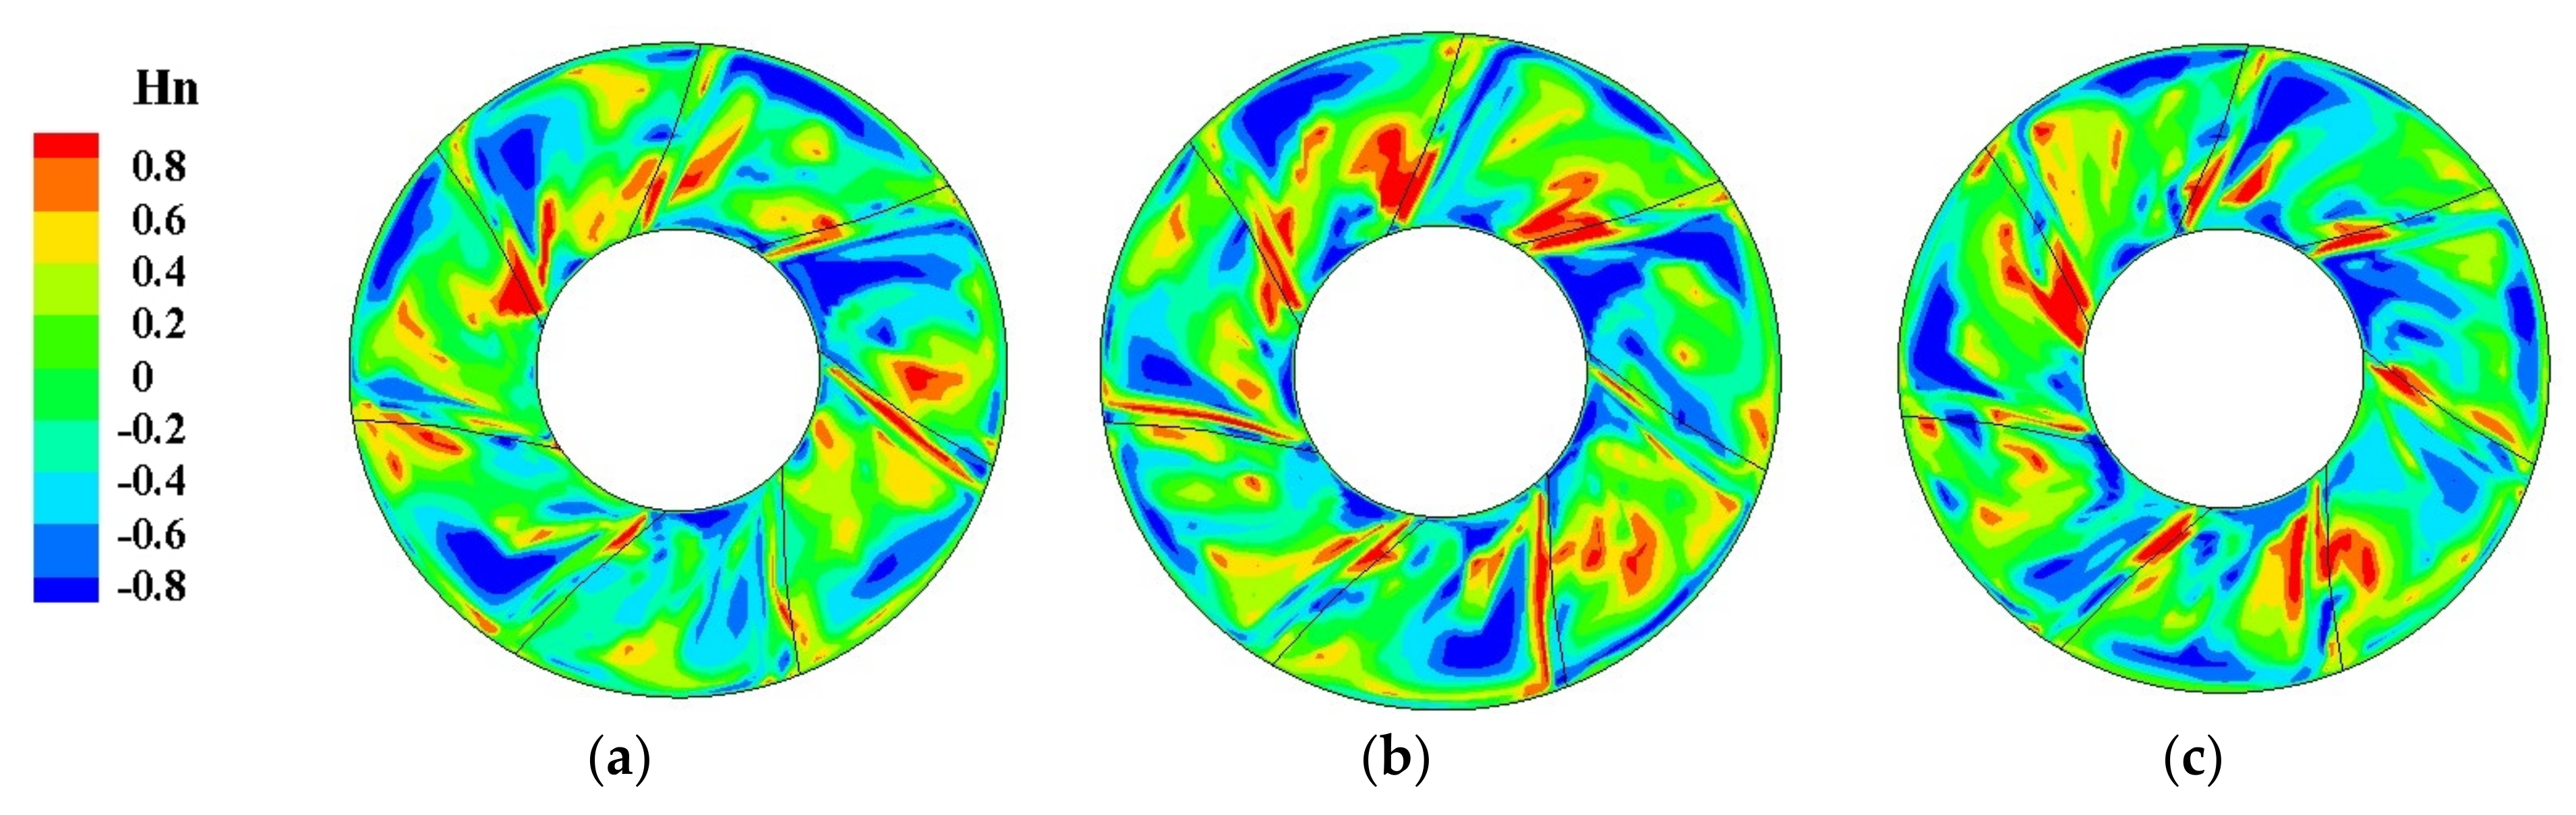
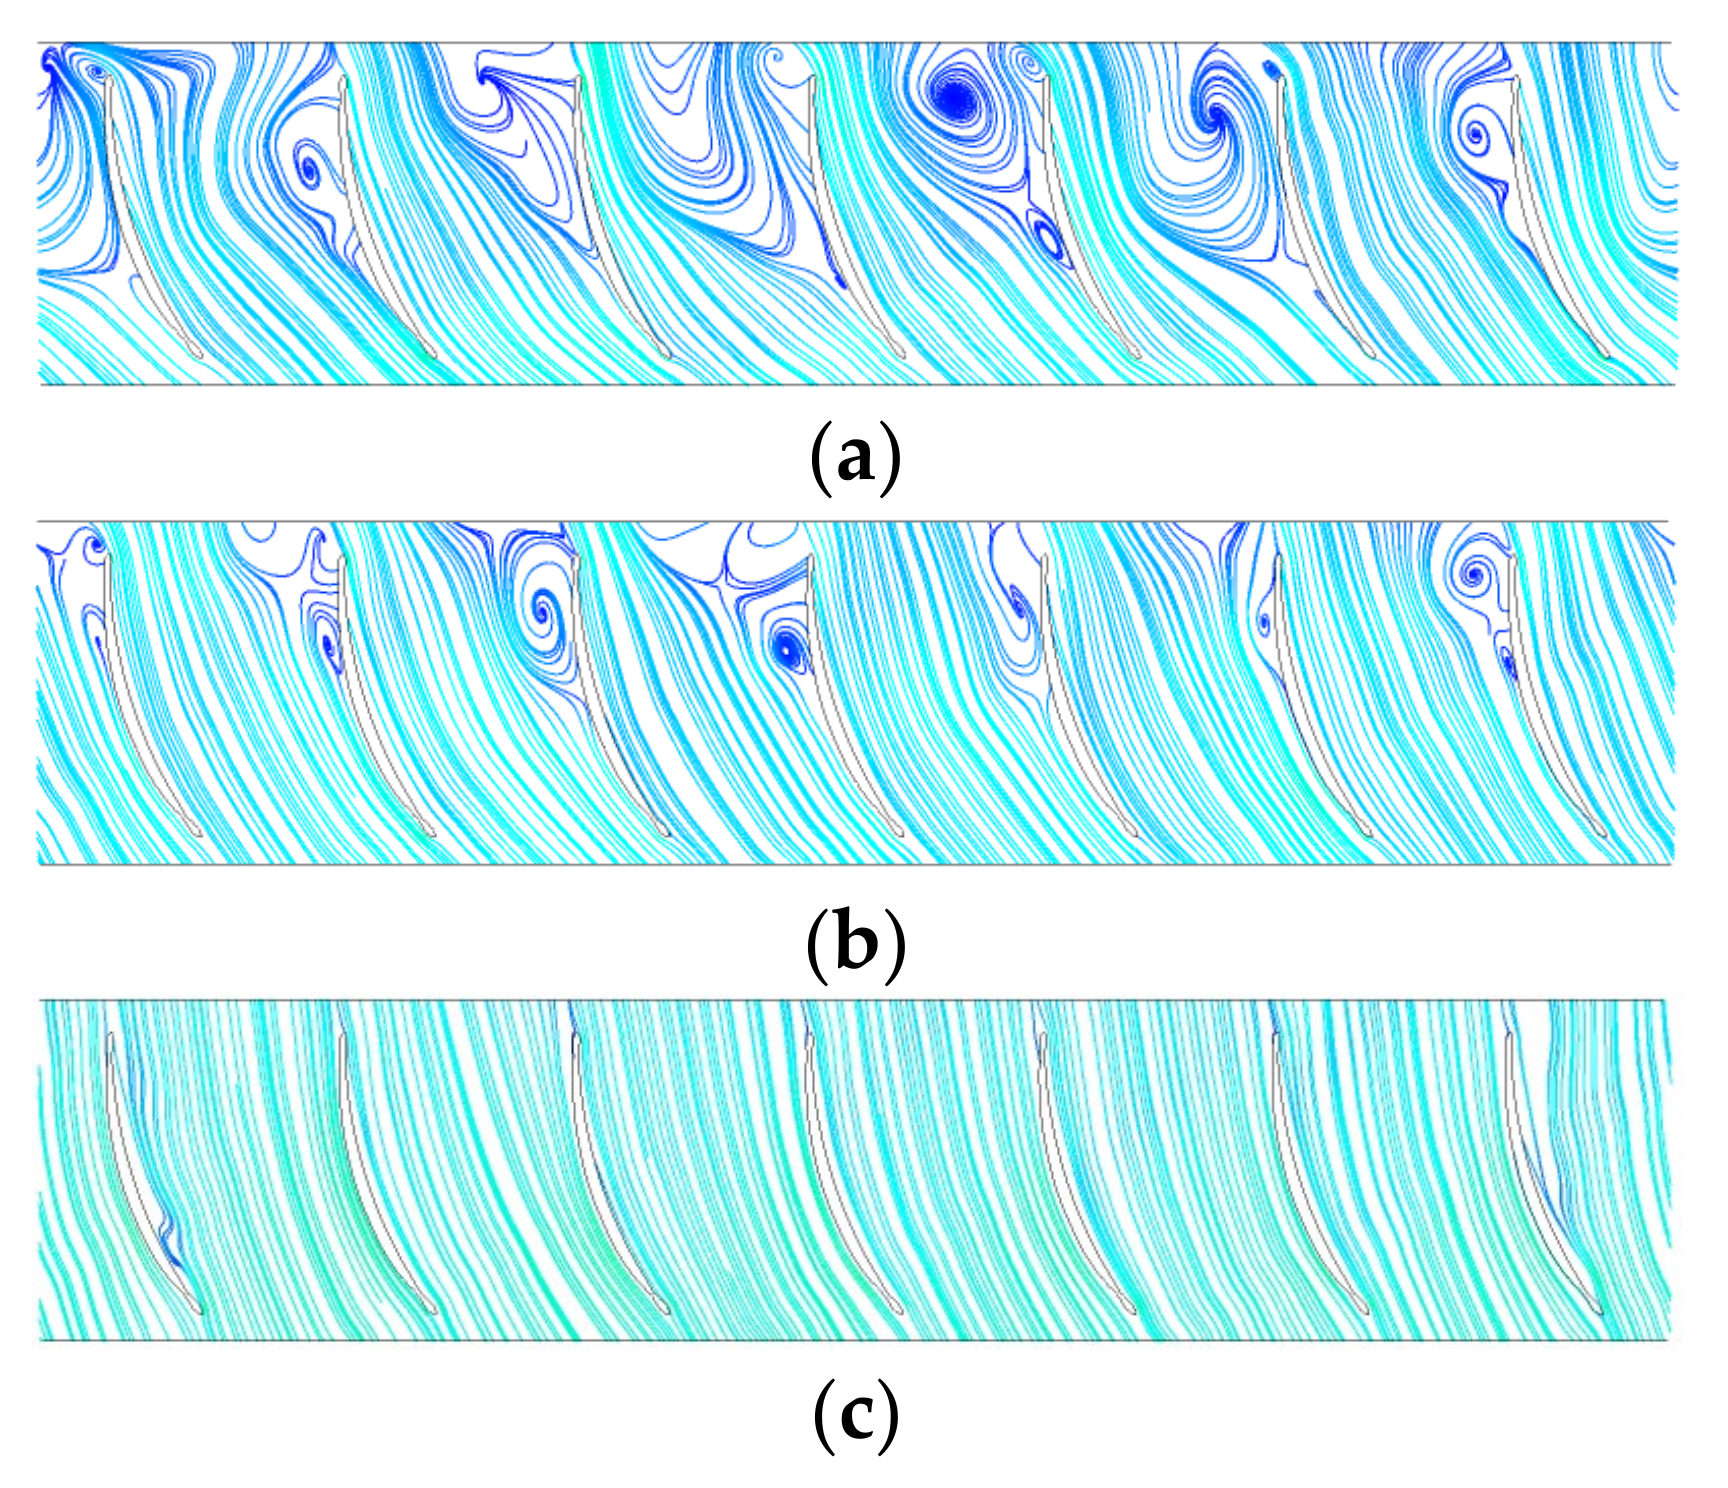
3. Effect of Time Series on Flow Characteristics in Blade Region

The impeller rotation provides energy for water flow, and its structure and motion stability play a decisive role in the overall efficiency of the pump device. In order to analyze the influence of timing effect on the internal flow of impeller and guide vane, the internal flow characteristics of impeller and guide vane are analyzed. For the convenience of analysis, five characteristic sections were intercepted from the impeller and guide vane for analysis. section 1-1 was located at the impeller inlet distance from the impeller centerline 0.147D, section 2-2 was located at the impeller centerline, section 3-3 was located at the impeller outlet distance from the impeller centerline 0.206D, section 4-4 was located at the guide vane centerline distance from the impeller centerline 0.457D, and section 5-5 was located at the guide vane outlet distance from the impeller centerline 0.684D. The section diagram is shown in Figure 7.
The pressure coefficient is defined as:
C p = P P ¯ 0.5 ρ u 2
where, P is the instantaneous pressure, Pa; P ¯ is the average pressure, Pa; ρ is the density of water, kg/m3; u is the impeller circumferential velocity, m/s.
Figure 8 shows the transient change of impeller inlet section 1-1 pressure coefficient at 1.0 Qbep. As shown in Figure 8, the high pressure region is mainly distributed in the back area of the blade, and the low pressure region is mainly distributed in the tip position. It changes with the rotation of the impeller, and the number of high pressure regions and the number of low pressure regions correspond to the number of blades. In a rotation cycle, the pressure coefficient distribution of section 3-3 (Figure 9) is more complex than that of section 1-1, because the flow has a large velocity circulation after passing through the impeller and enters the guide vane for circulation recovery. Under the influence of the two, the flow pressure changes significantly. The low pressure area is mainly located near the hub and the high pressure area is mainly located near the rim. Figure 10 shows the pressure coefficient nephogram of guide vane outlet at 1.0 Qbep. As shown in Figure 10, the outlet pressure distribution of the guide vane changes irregularly in a rotation period. The high pressure area is mainly distributed at the rim and hub. Because the water flow at the outlet of the guide vane still has a certain circulation, the local high pressure area increases. At 1/3T, the large high pressure area on the right side accounts for about 21% of the area of section 5-5, and at 3/3T, the high pressure area is transferred to the right side.
In order to analyze the influence of time series effect on the average velocity circulation of guide vane outlet, the average velocity circulation of guide vane outlet at different time under different flow conditions is analyzed, as shown in Figure 11. When the flow rate increases from 0.8 Qbep to 1.2 Qbep, the average velocity circulation of the guide vane outlet is reduced by 12%, indicating that as the flow rate increases, the effect of the guide vane recovery circulation is better. Under the condition of 1.2 Qbep, the average velocity circulation of the guide vane outlet has little change with the rotation of the impeller, and the average velocity circulation is basically stable at about 4.68 m2/s. At 0.8 Qbep and 1.0 Qbep, the velocity circulation of the guide vane outlet varies greatly with the rotation of the impeller. At 1.0 Qbep, the average velocity circulation fluctuates between 4.7 m2/s and 5.0 m2/s, and at 0.8 Qbep, the average velocity circulation fluctuates between 5.1 m2/s and 5.5 m2/s. On the whole, the average velocity circulation at 0.8 Qbep is larger than that at 1.0 Qbep, which is related to the unstable operation of the pump device under small flow conditions.
The guide vane is located at the outlet of the impeller. Since the water flow out of the guide vane has a certain amount of circulation, the flow distribution at the outlet of the guide vane is not uniform, resulting in a partial flow in the outlet conduit [4]. Therefore, this paper studies the flow distribution at the outlet surface of the guide vane in a rotating cycle. The outlet surface of the guide vane is 0.684D away from the impeller centerline. In order to clarify the influence mechanism of time sequence effect on the flow rate of seven guide vane slots of the guide vane, the outlet area of the guide vane is divided into seven regions according to the number of guide vanes, as shown in Figure 12. Each region is based on the impeller rotation direction as 7-1, 7-2, 7-3, 7-4, 7-5, 7-6 and 7-7.
Figure 13 shows the circumferential velocity distribution of impeller outlet at different times. The circumferential velocity of the impeller outlet varies in the same phase angle interval at different times, which leads to different flow rates of the water flow into the two adjacent guide vane of the guide vane. The circumferential velocity of the impeller outlet changes obviously under different flow conditions. The circumferential velocity fluctuation of the impeller outlet is the smallest at 1.0 Qbep, and the average circumferential velocity is 13.3 m/s. The circumferential velocity fluctuation of the impeller outlet is larger at 0.8 Qbep and 1.2 Qbep, and the average circumferential velocity is 11.8 m/s and 14.7 m/s, respectively. Figure 14 shows the transient change of outlet flow rate of each guide vane. It can be seen from Figure 14 that the flow rates of sections 7-1 and 7-7 are large, and the flow rates of sections 7-5 and 7-6 are small. Because the flow also has a certain velocity circulation at the outlet of the guide vane, the flow distribution at the outlet of the guide vane is uneven, which directly leads to the flow deviation in the outlet conduit [4]. Under 0.8 Qbep condition, the flow at the outlet of guide vane changed significantly. The flow at section 7-1 decreased sharply at 4/6T and 5/6T, while the flow at sections 7-2 and 7-3 increased sharply at 4/6T and 5/6T. The flow rate of other sections has certain changes at different times. The average fluctuation range of the flow rate at the outlet of the guide vane slot is 18.9%, and the flow change is unstable. Overall (Figure 15), the flow is mainly concentrated in sections 7-1 and 7-7. In a rotation cycle under 1.0 Qbep condition, the average flow rate of section 7-1 is 51.82 L/s, accounting for 15.32% of the total flow rate (Figure 15); section 7-2 average flow rate is 48.57 L/s, accounting for 14.36% of the total flow rate; section 7-3 average flow rate is 48.56 L/s, accounting for 14.36% of the total flow rate; section 7-4 average flow rate is 48.15 L/s, accounting for 14.24% of the total flow rate; section 7-5 average flow rate is 45.82 L/s, accounting for 13.55% of the total flow rate; section 7-6 average flow rate is 45.17 L/s, accounting for 13.36% of the total flow rate; section 7-7 average flow rate is 50.11 L/s, accounting for 14.82% of the total flow rate. Under the condition of 1.2 Qbep, the flow changes at the same cross-section at each time are stable (Figure 14), and the flow ratios of cross-sections 7-1, 7-2 and 7-3 reach 15.2%, 14.59% and 14.6%, indicating that the flow changes are stable under the condition of large flow. The flow fluctuation amplitude at the outlet of guide vane is 0.56% on average, and the flow distribution is relatively average.
In order to clarify the variation of the internal vortex of the vertical axial flow pump in the timing effect, the regularized helicity was introduced to analyze the internal vortex of the impeller and guide vane of the vertical axial flow pump device in Reference [29]. Helicity is an important physical quantity to measure the topological structure of turbulent vorticity field [30]. The helicity in the three-dimensional unsteady flow field of the vertical axial flow pump device is defined as:
H t = V V ω d V
where, the integrand function is called helicity density, V and ω are velocity vector and vorticity vector respectively. Regularized helicity judges the vortex core according to the angle between velocity vector and vorticity. This method can capture the position of vortex core. Hn is defined as the dot product of velocity and vorticity divided by the product of the module of velocity and the module of vorticity, as follows:
H n = V ω V ω
In the flow field region, it is a defined scalar field except the special point where the velocity vector V and the vorticity vector ω are 0, and its value is in the range of [−1,1]. In the vortex core region, the direction of velocity vector is nearly parallel to that of vorticity vector, and the regularized helicity Hn tends to ±1. The symbol of the regularized helicity Hn indicates the direction of the vortex rotation. The flow direction is positive, Hn is positive, and the direction of the vortex rotation is counterclockwise. Hn is negative, vortex direction is clockwise [31].
Figure 16 shows the transient variation of the regularized helicity of the impeller section 2-2. It can be seen from Figure 16 that in a rotation period, the main vortex direction in the impeller is counterclockwise, which is consistent with the rotation direction of the impeller. This shows that the vortex generated in the impeller domain is mainly the impeller work to drive the water flow to rotate. Figure 17 shows the transient variation of the regularized helicity of guide vane section 4-4. The guide vane mainly recovers the velocity circulation of the water flow, so that the water flow may enter the outlet passage smoothly, so the internal flow of the guide vane is more complicated. From Figure 17, it can be seen that the regularized helicity in the guide vane changes obviously at different times. The vortex mainly distributes in the hub and rim of the guide vane, the forward vortex mainly distributes in the back and hub of the blade, the reverse vortex mainly distributes in the rim and the surface of the guide vane, and the vortex in the guide vane is mainly positive vortex. Figure 18 shows the 5-5 regularized helicity transient change of guide vane exit section. It can be seen from Figure 18 that, compared with section 4-4, the negative value area of the regularized helicity of section 5-5 becomes larger, indicating that there is a certain range of reflux area at the outlet of the guide vane. In a rotation cycle, the vortex changes have no obvious regularity.

4. Pressure Pulsation Analysis Based on FFT Transform

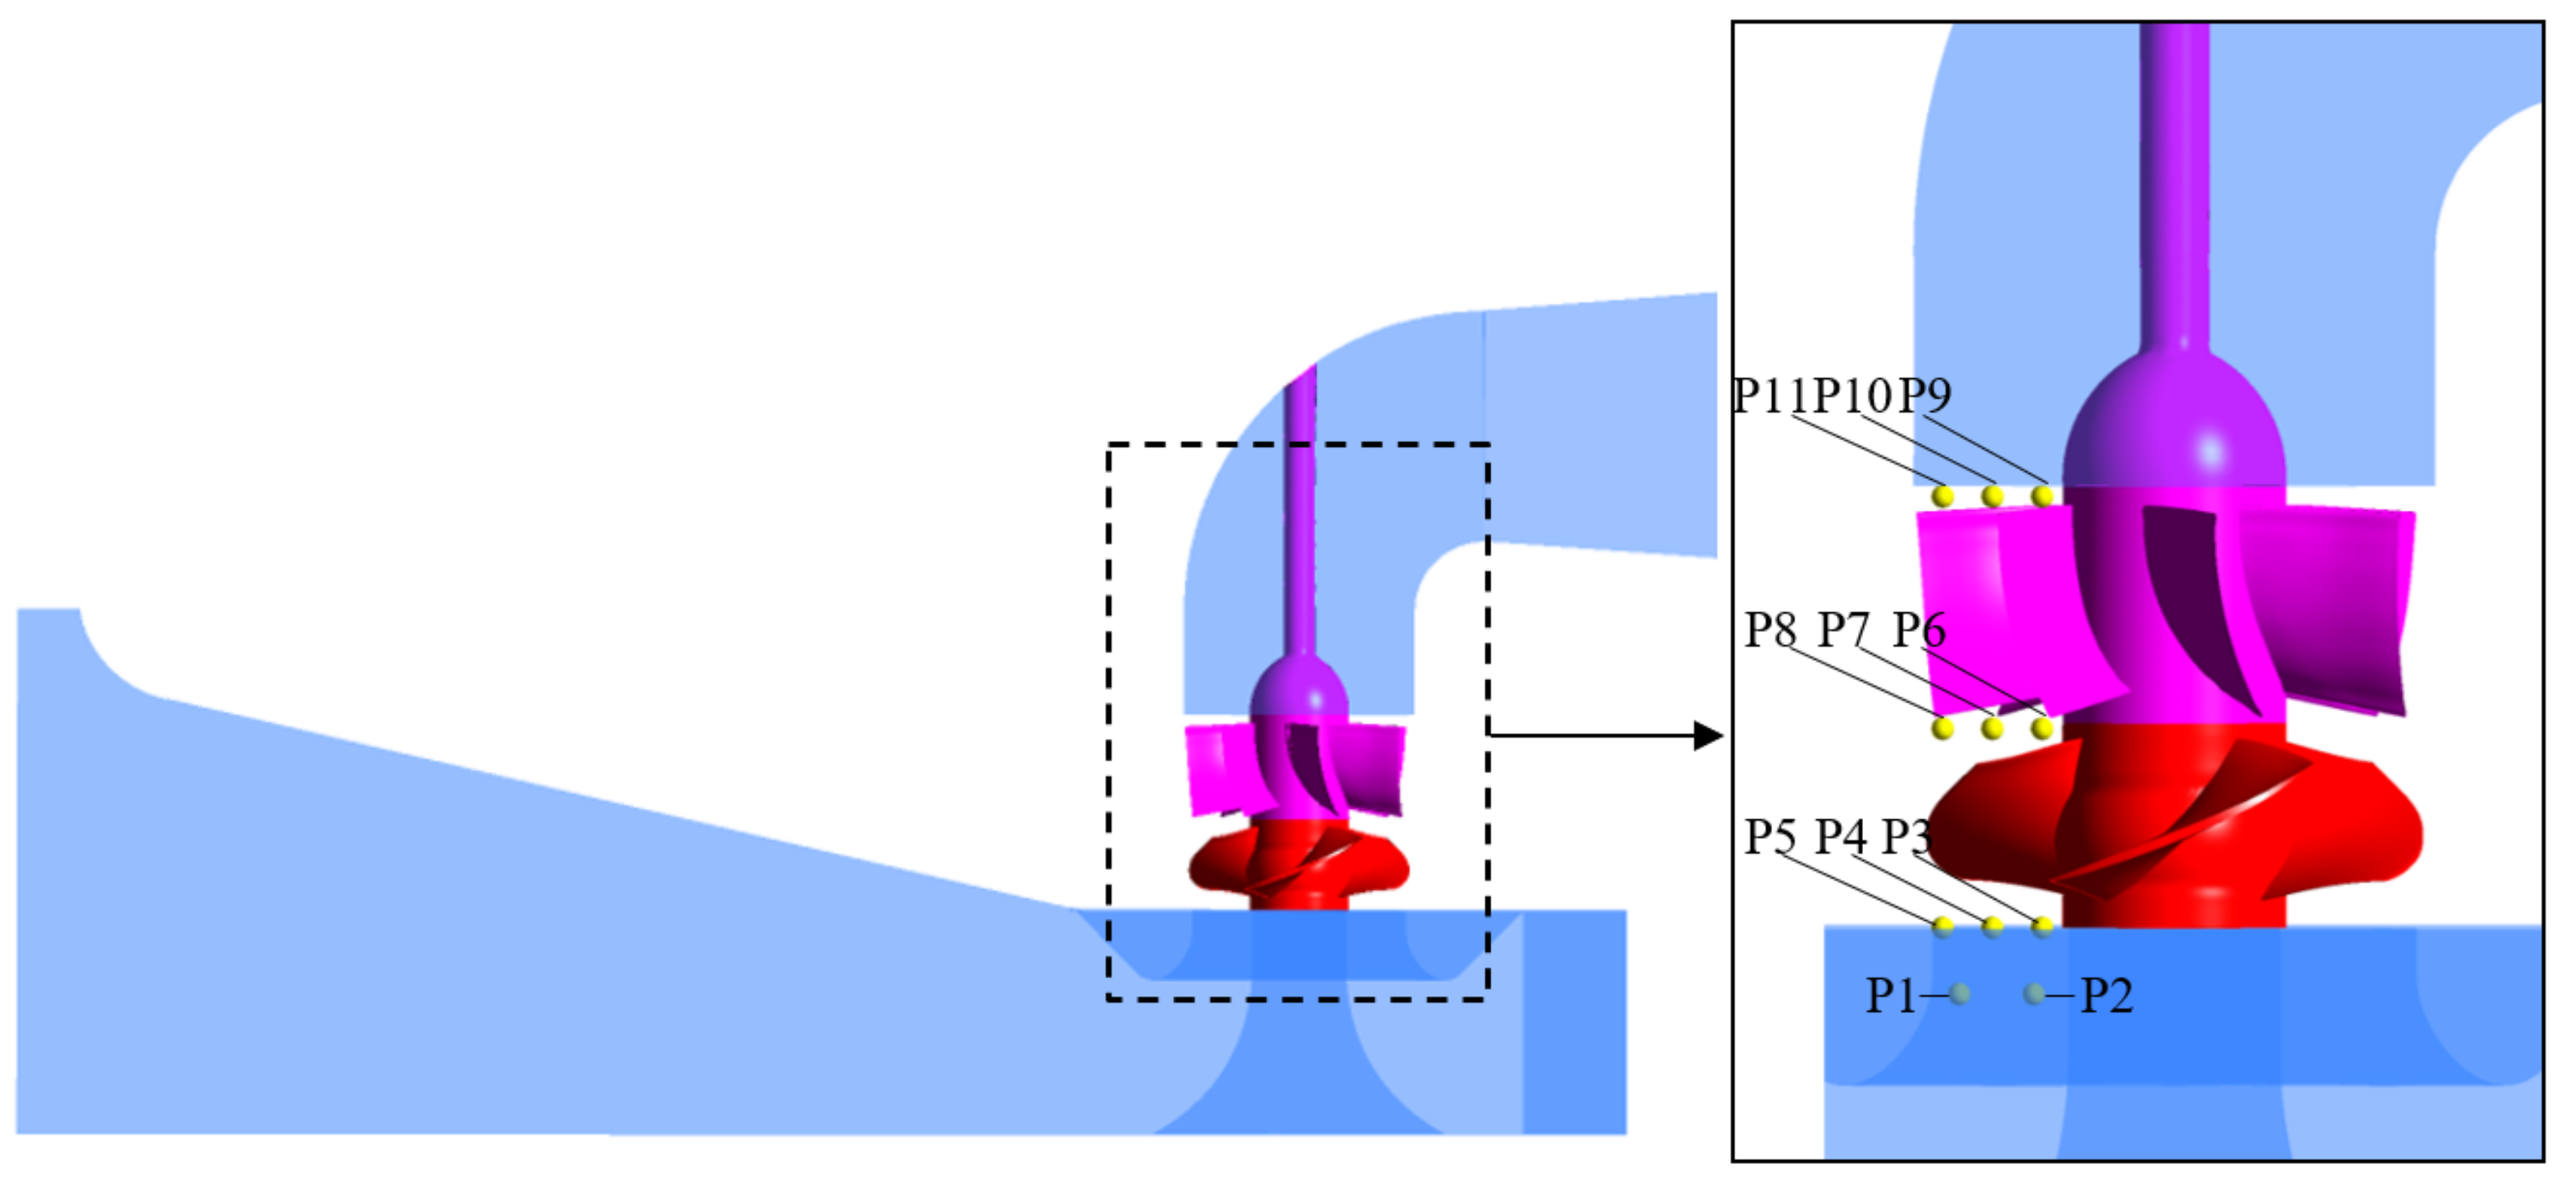
4.1. Pressure Pulsation Monitoring Point Arrangement

In order to monitor and analyze the pressure pulsation in the blade area of the vertical axial flow pump device, a total of 11 pressure pulsation monitoring points are set, and the pressure pulsation monitoring points are shown in Figure 19. Two monitoring points were arranged in the campaniform inlet conduit (0.3167D away from the impeller center line): monitoring point 1 and monitoring point 2. The pressure pulsation monitoring points P3 ~ P5 are arranged at the inlet of the impeller (0.1667D from the center line of the impeller), the pressure pulsation monitoring points P6 ~ P8 are arranged at the interface between the impeller and the guide vane (0.2167D from the center line of the impeller), and the pressure pulsation monitoring points P9 ~ P11 are arranged at the outlet of the guide vane (0.6833D from the center line of the impeller). The pressure pulsation monitoring points of the three sections are equidistant.

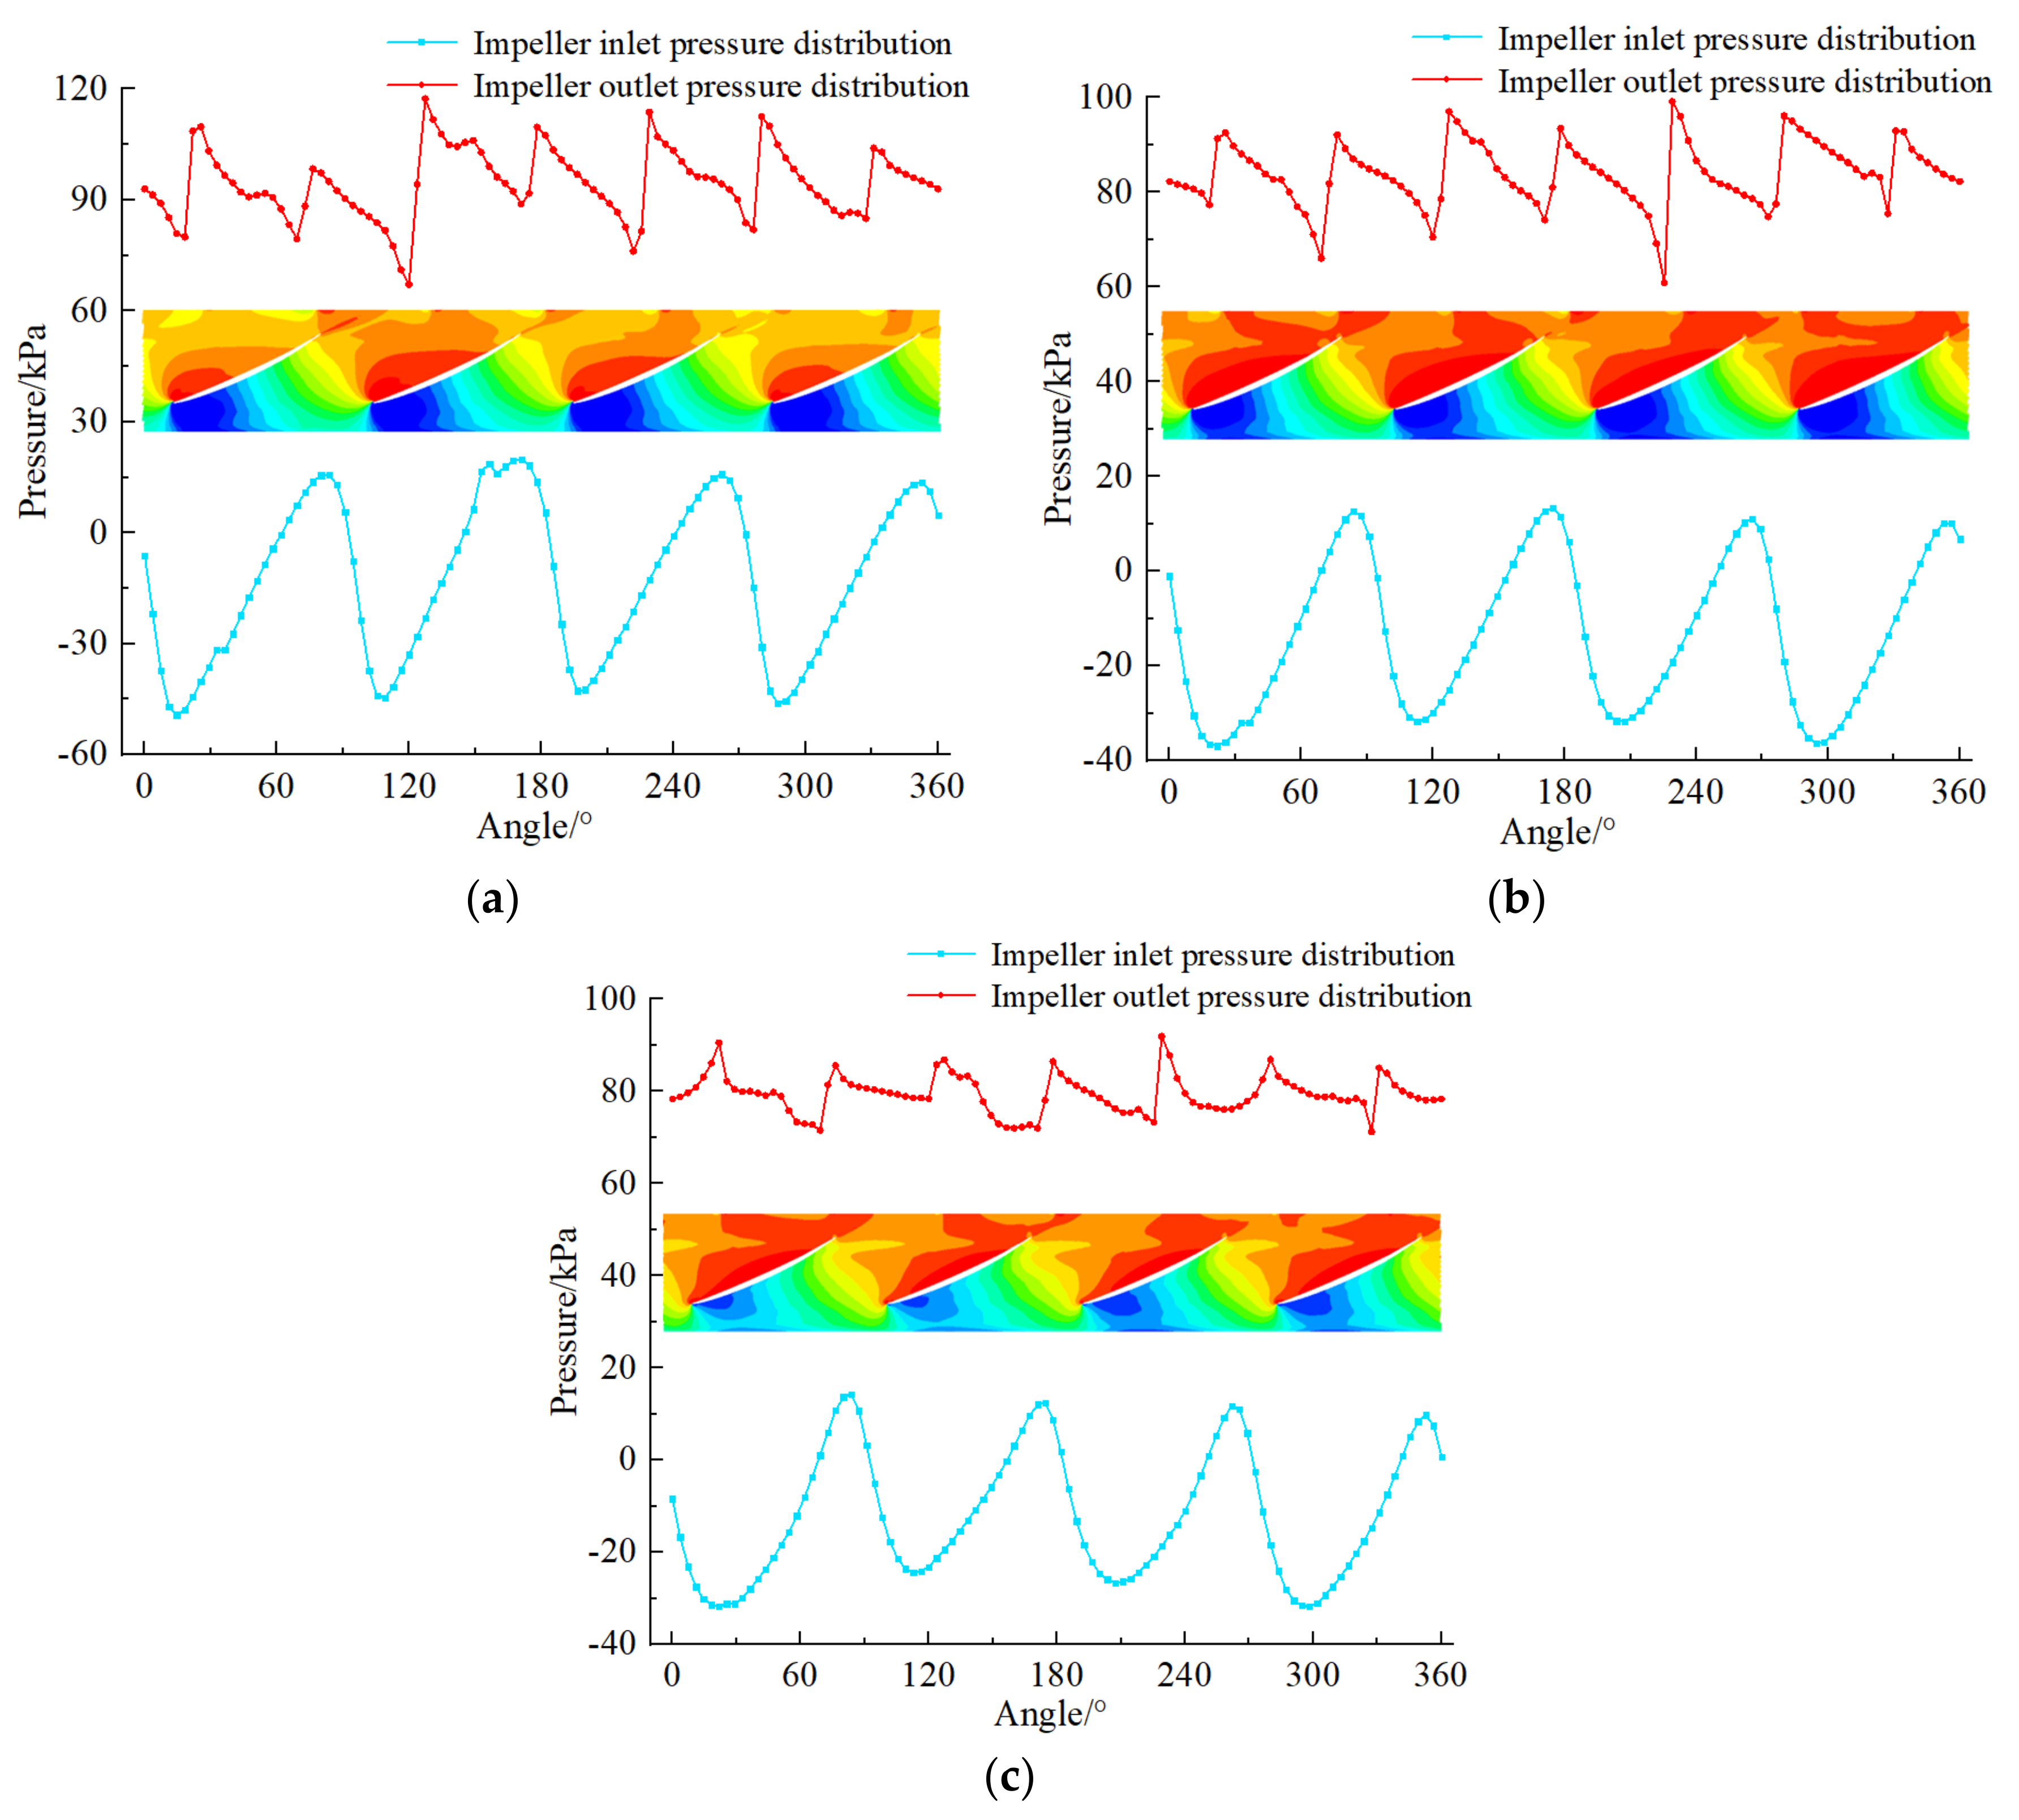
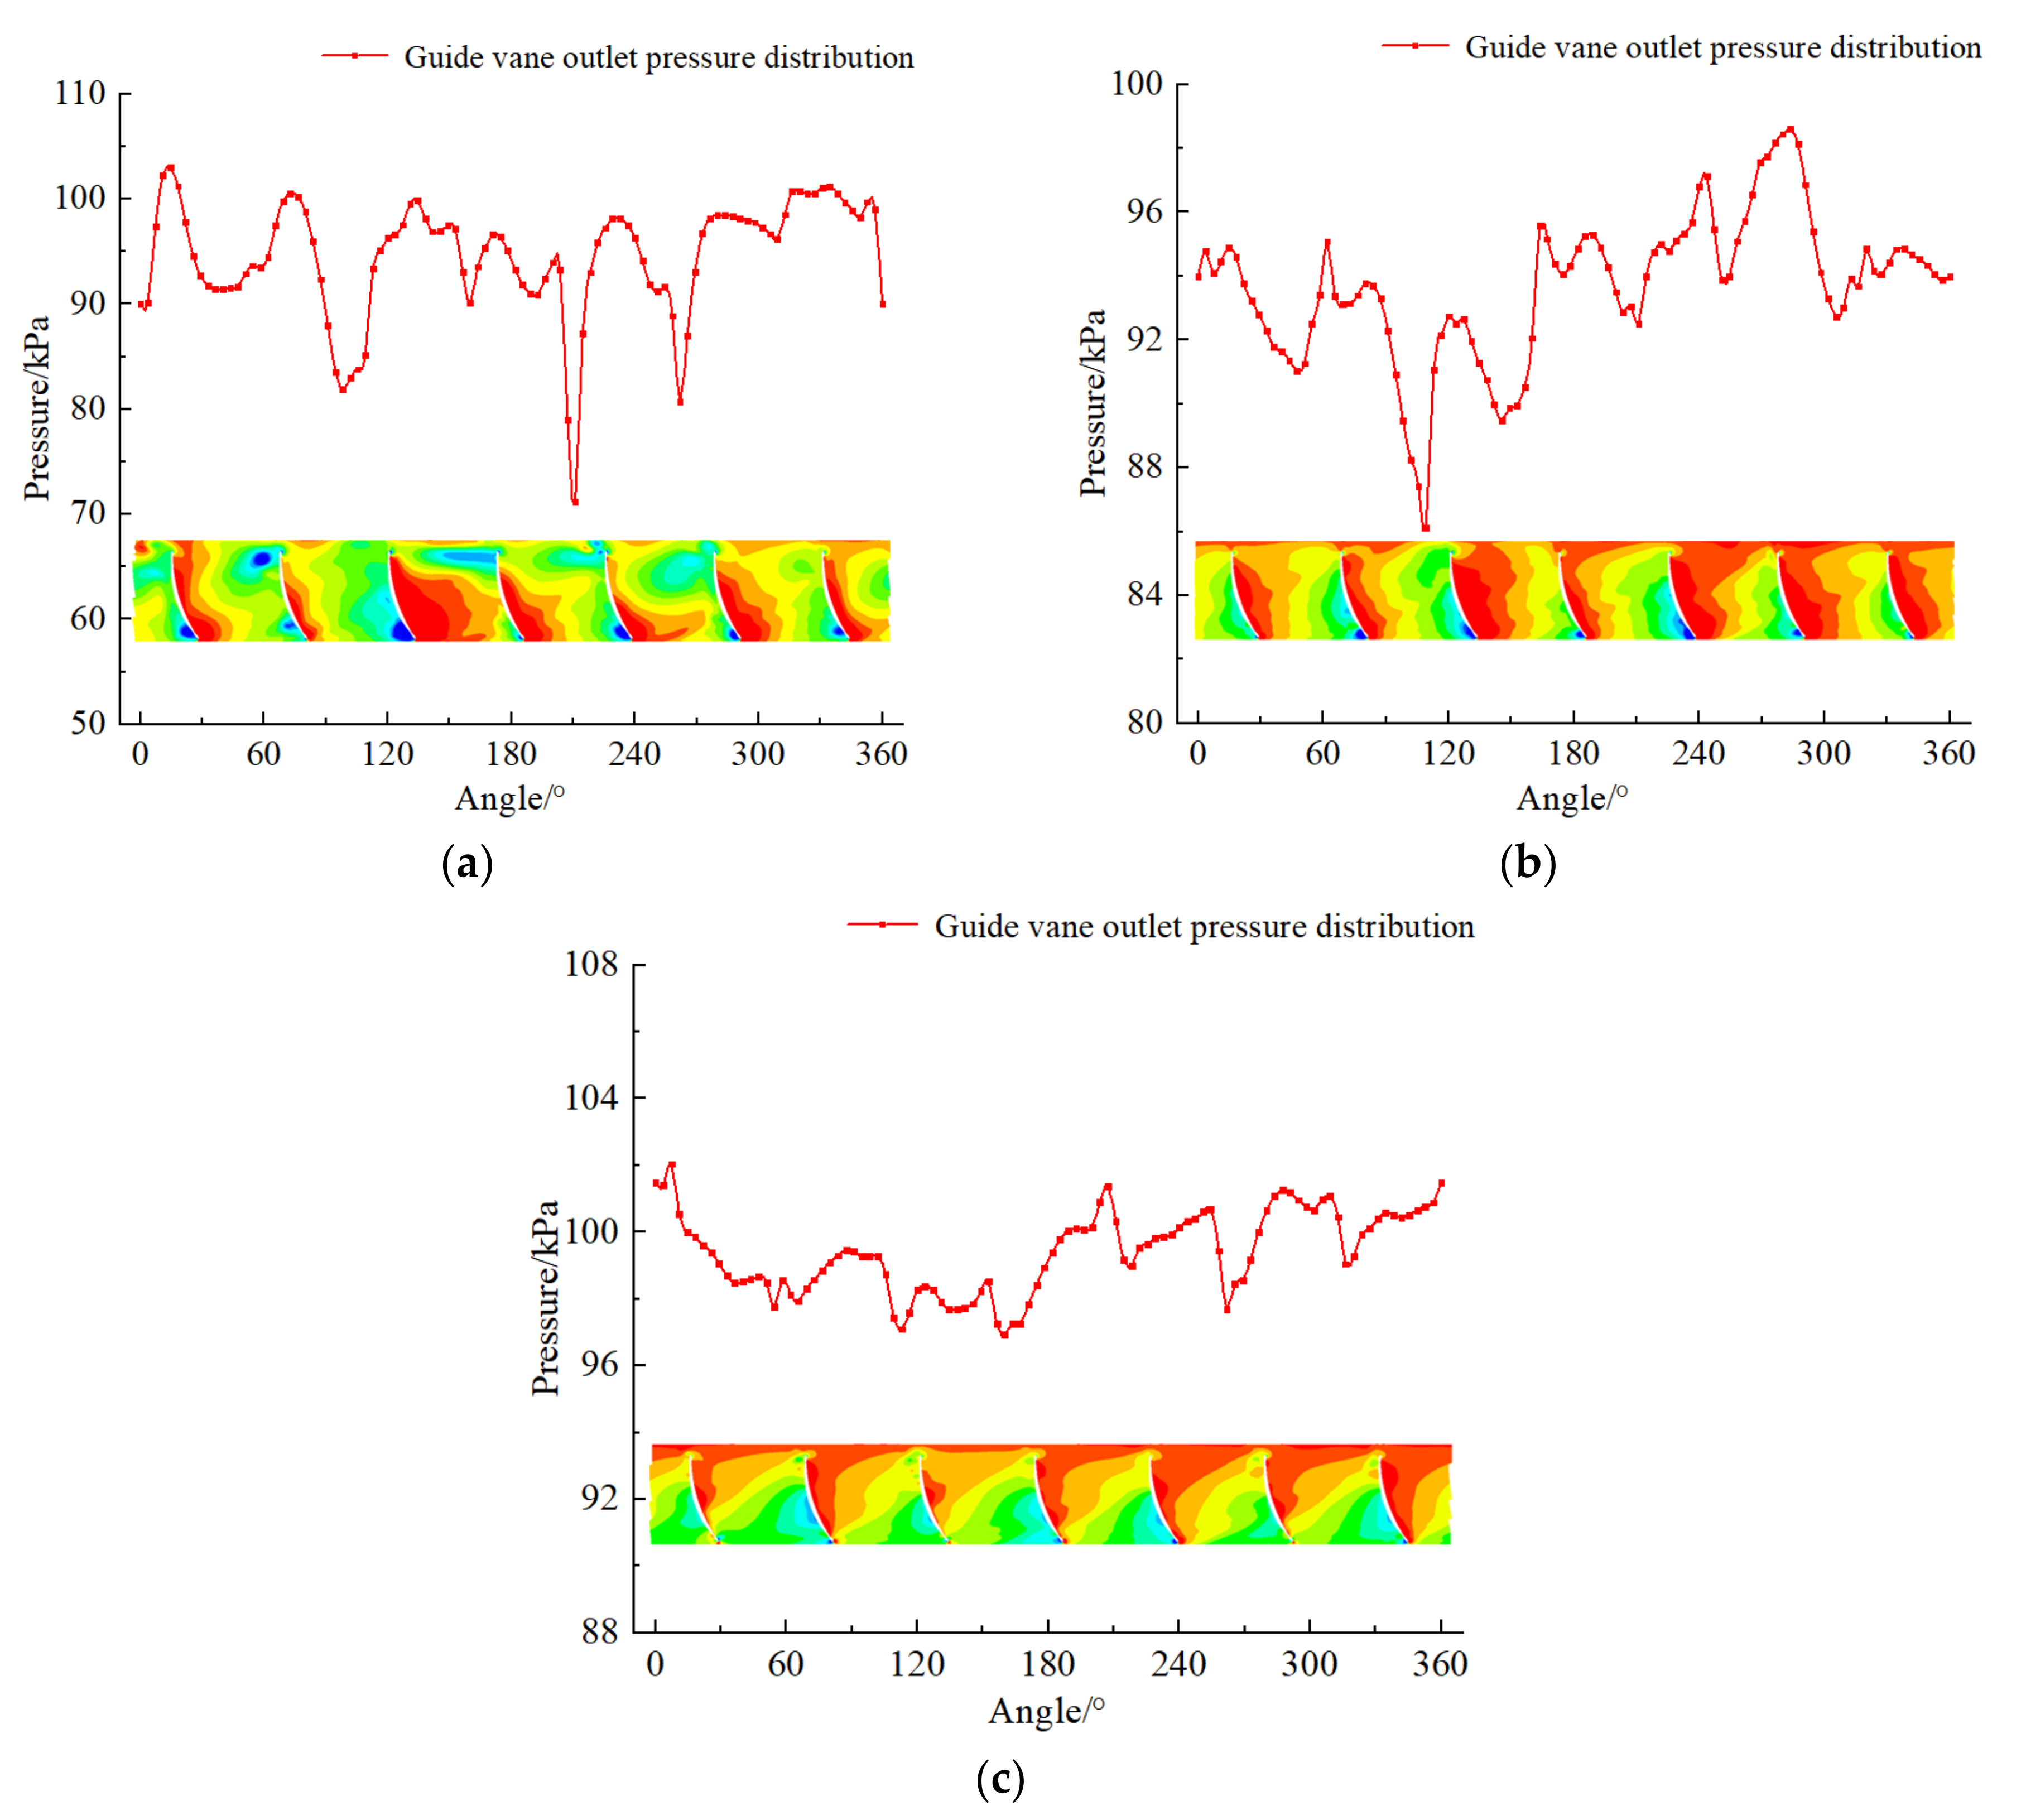
4.2. Mechanism Analysis of Pressure Pulsation

In order to analyze the causes of pressure pulsation at the inlet and outlet of the impeller and the outlet of the guide vane, the impeller chamber and the outer edge of the guide vane are expanded, and the pressure distribution at the inlet and outlet of the impeller and the outlet of the guide vane are taken out respectively. The curve of pressure distribution with angle is shown in Figure 20 and Figure 21.
It can be seen from Figure 20 that the surface pressure distribution of the axial flow pump blade can be divided into a pressure surface near the guide vane side and a suction surface near the flow channel side. Among them, the pressure distribution of impeller suction surface is wide and the pressure gradient is large, while the pressure distribution of pressure surface is relatively stable and the pressure gradient is small. Under different conditions, the pressure distribution range of impeller inlet and outlet is different. Under 0.8 Qbep condition, the pressure distribution range of impeller inlet and outlet is the widest, and under 1.2 Qbep condition, the pressure distribution range of impeller inlet and outlet is the smallest. The pressure distribution at the impeller inlet is relatively regular. This is because when the flow passes through the blade of the pump device, the angle of attack in the flow direction is positive, and a local low-pressure zone is generated at the head of the impeller suction surface. Therefore, there are four low-pressure zones and four high-pressure zones at the impeller inlet corresponding to the phase angles in four ranges, respectively, leading to four peaks and four troughs of the pressure pulsation at the impeller inlet in a rotating cycle. The suction surface of the impeller near the outlet direction is affected by the pressure surface, and the pressure gradually increases. The work of the impeller makes the water flow obtain energy, and the water flow has a large velocity circulation at the inlet of the guide vane at the impeller, which makes the flow pattern at the outlet of the impeller The pressure value is mainly affected by the pressure of the impeller pressure surface and the pressure of the guide vane. With the increase of the flow rate, the pressure fluctuation at the outlet of the impeller is gradually stable. Impeller blade tail from the pressure surface to the suction surface transition, the pressure change is obvious, this is because the impeller pressure surface of the low-speed water flow and suction surface of the high-speed water flow in this round lead to flow disorder and local pressure changes. It can be seen from Figure 21 that the pressure fluctuation at the outlet of the guide vane is relatively disorderly, which is less affected by the impeller, and its pressure distribution is related to the number of guide vanes. Under 3 flow conditions, the pressure distribution at the outlet of seven guide vanes is non-axisymmetric, because the flow at the outlet of the impeller has the effect of velocity circulation and the solid wall of the guide vane itself on the flow constraint. Under the condition of 0.8 Qbep, there is a large range of vortex at the outlet of the guide vane (Figure 22), which seriously affects the recovery of the circulation of the guide vane and leads to the obvious change of the local pressure distribution at the outlet of the guide vane. Under 1.0 Qbep condition, there is a certain vortex at the outlet of the guide vane. Compared with 0.8 Qbep condition, the scope of the vortex decreases obviously, and the local pressure distribution at the outlet of the guide vane changes. Under 1.2 Qbep condition, the outlet flow pattern of the guide vane is smooth, the recovery effect of the guide vane on the circulation is the best, and the pressure fluctuation is stable.

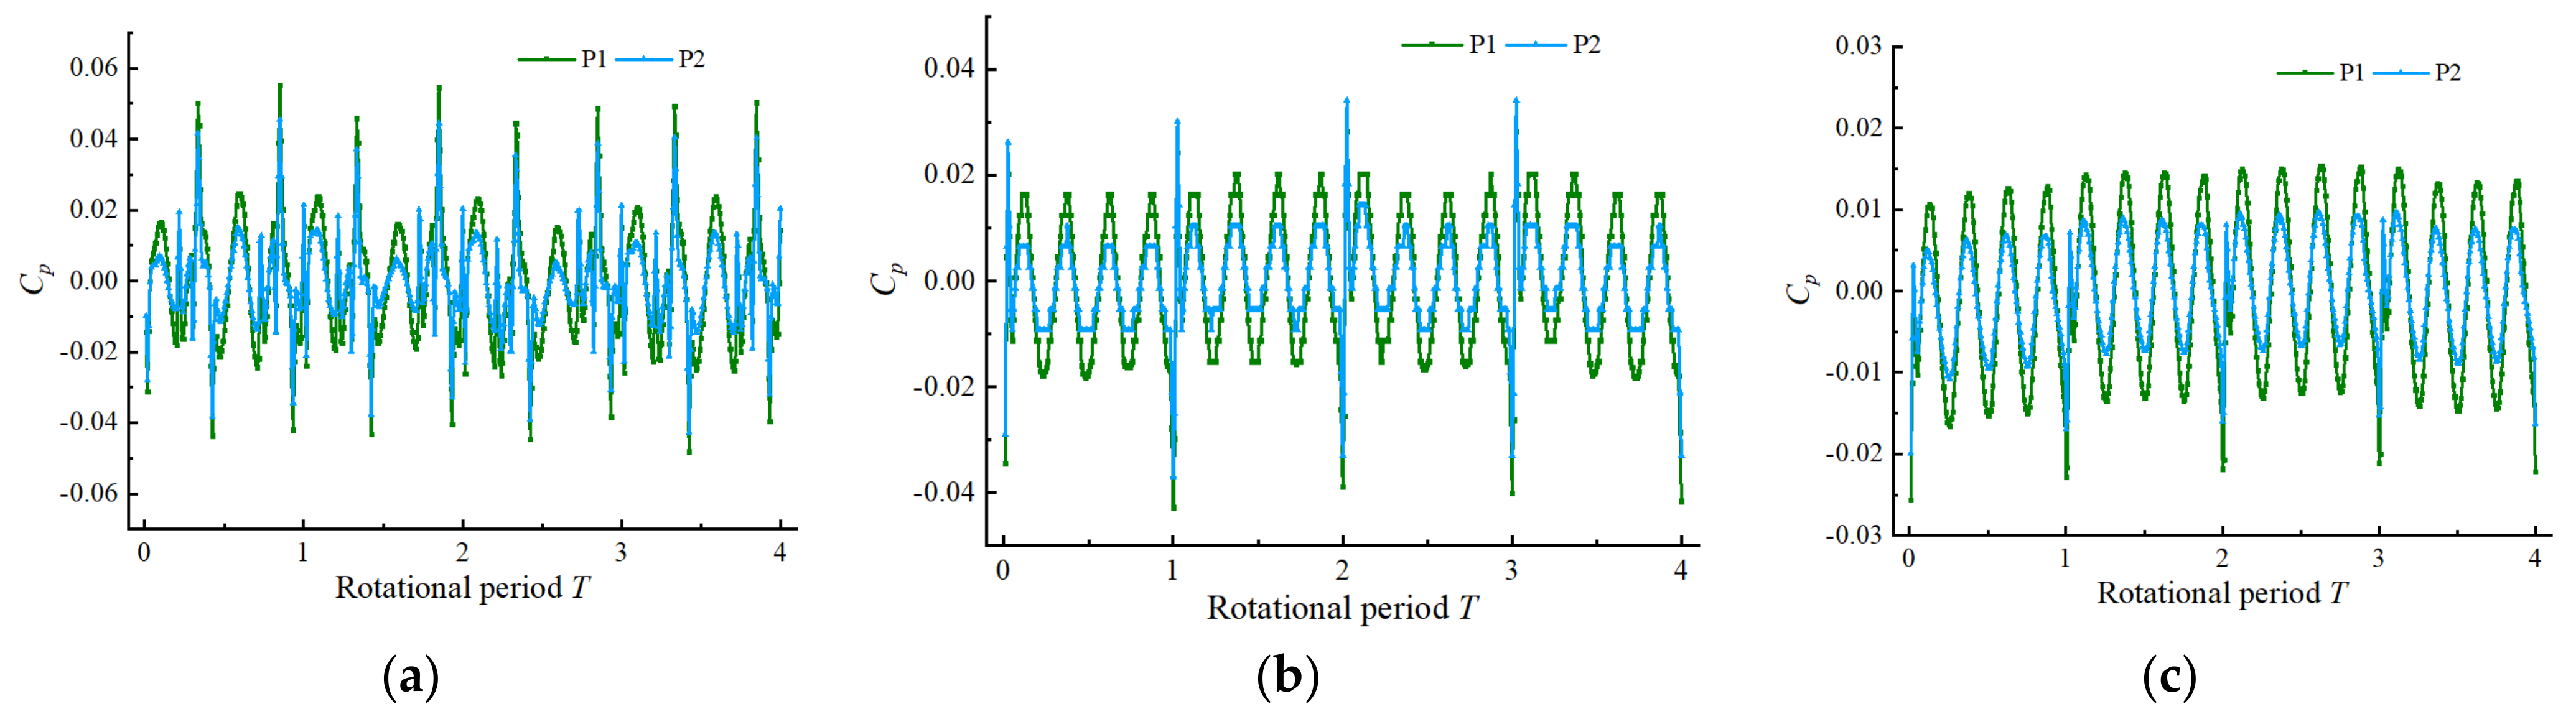
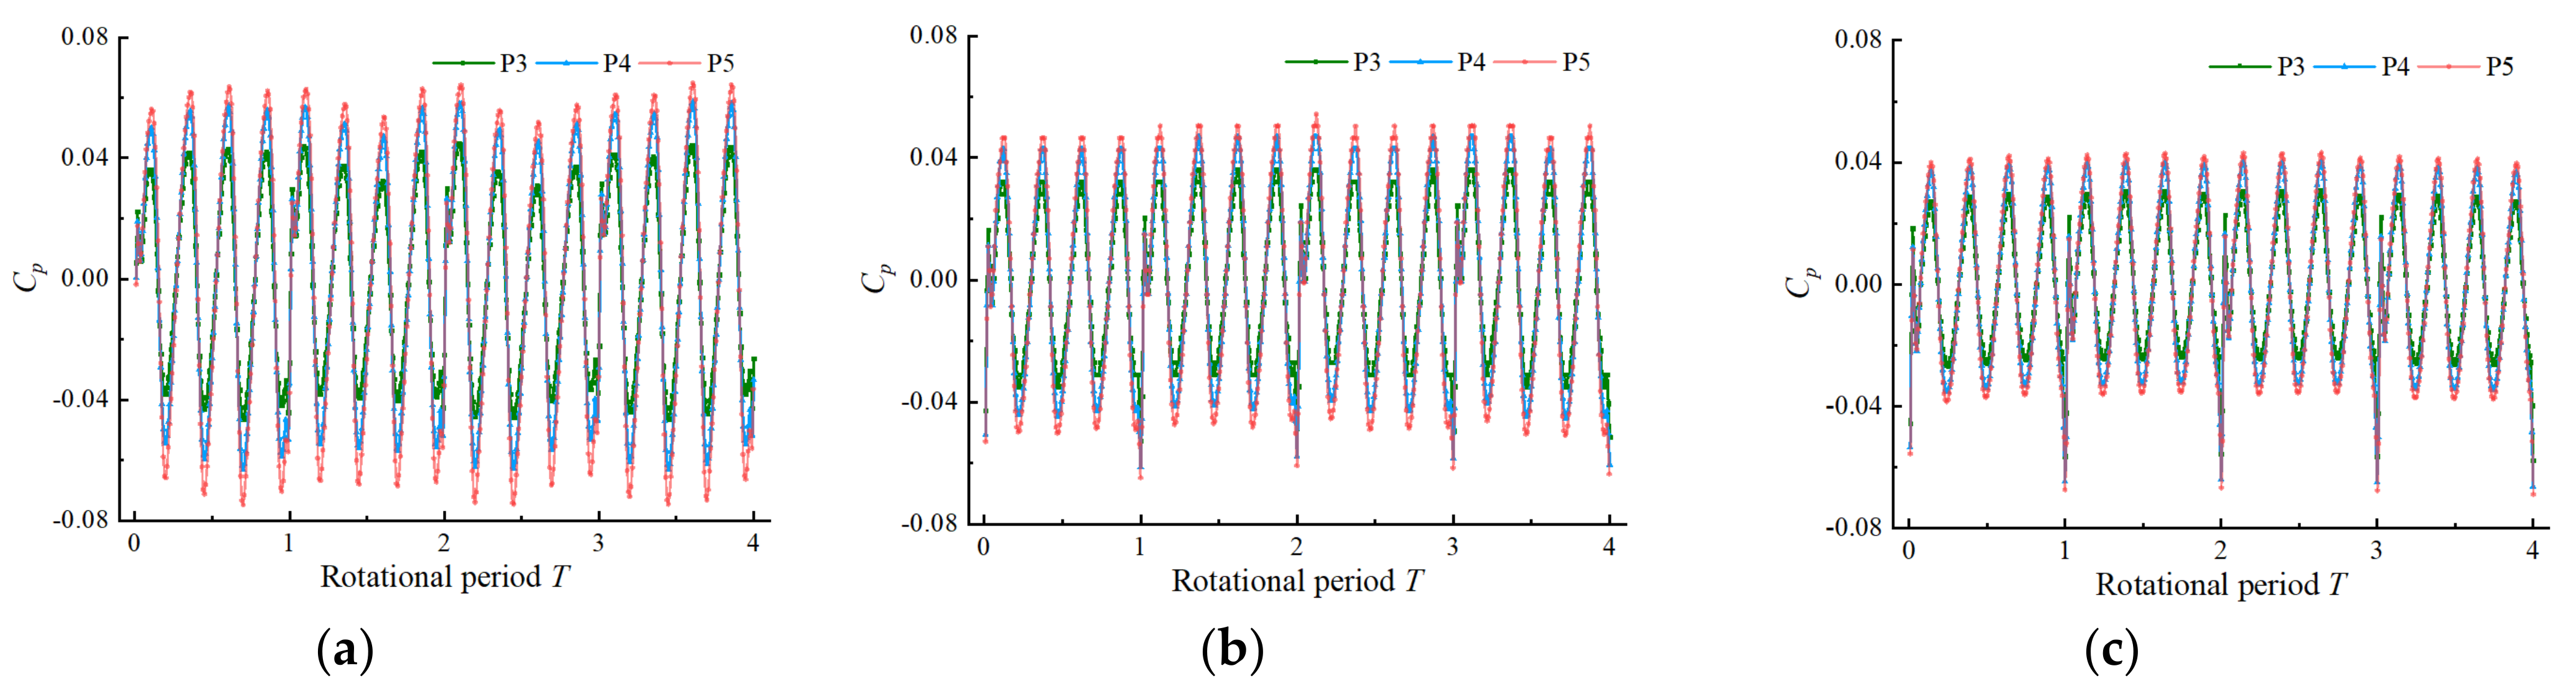
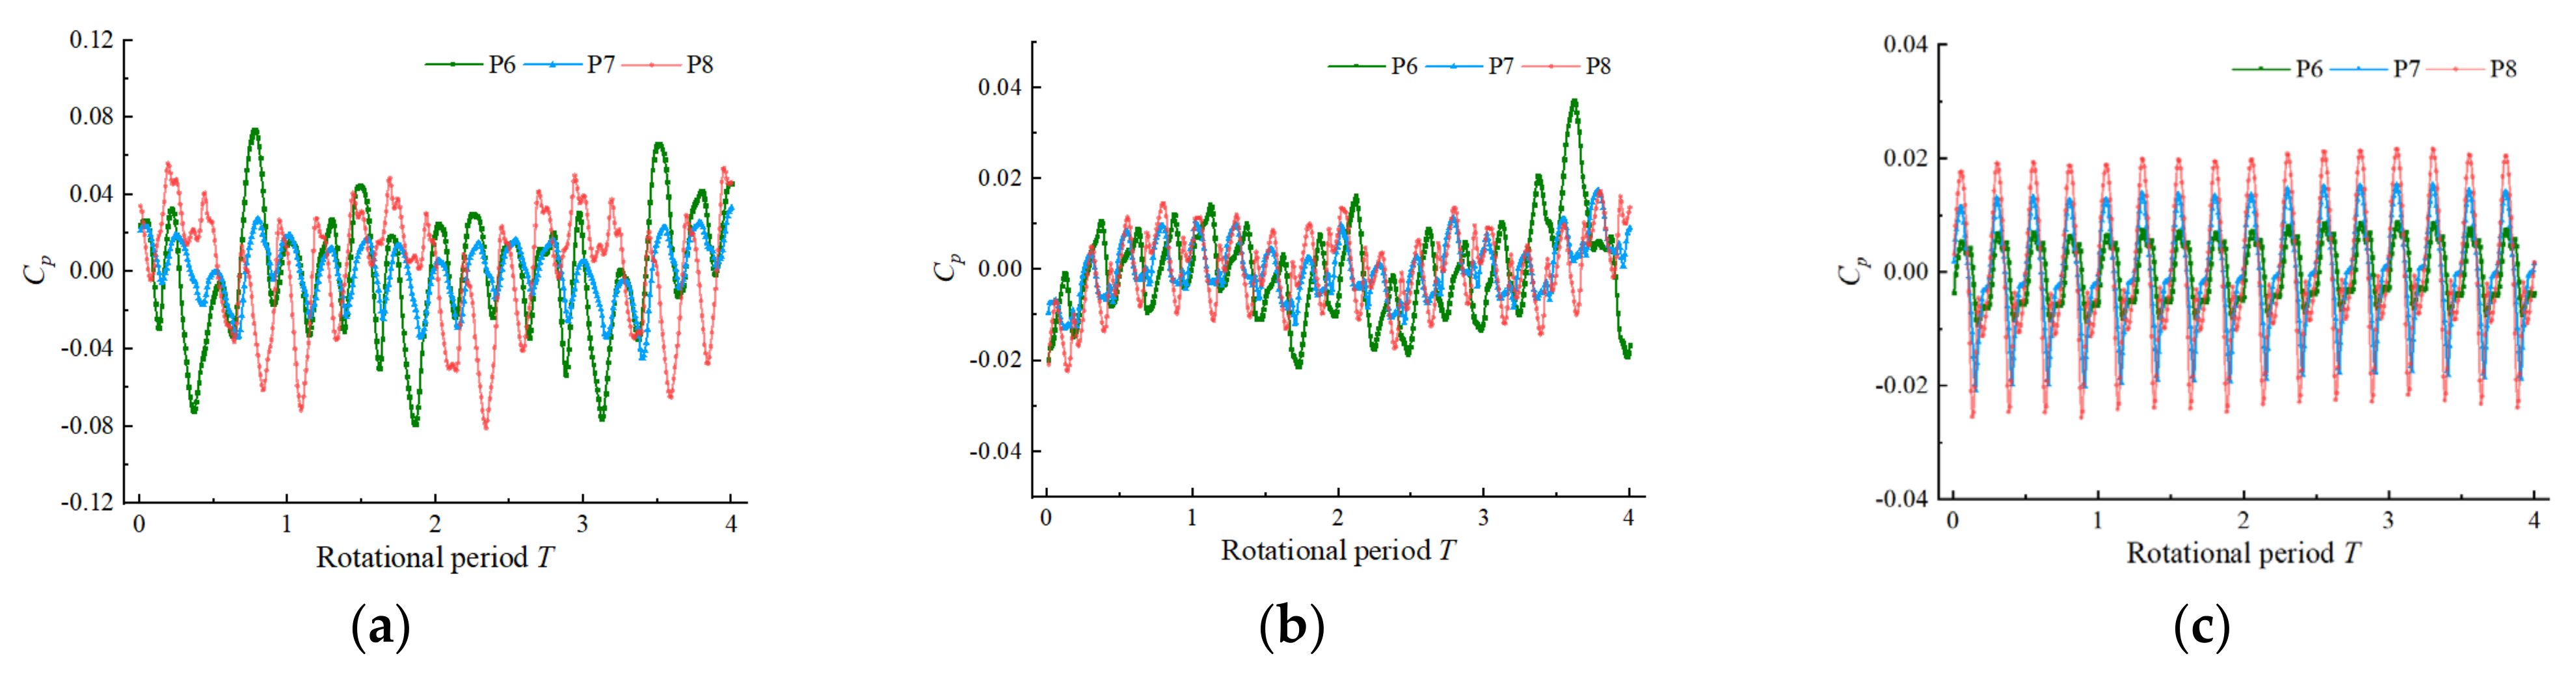
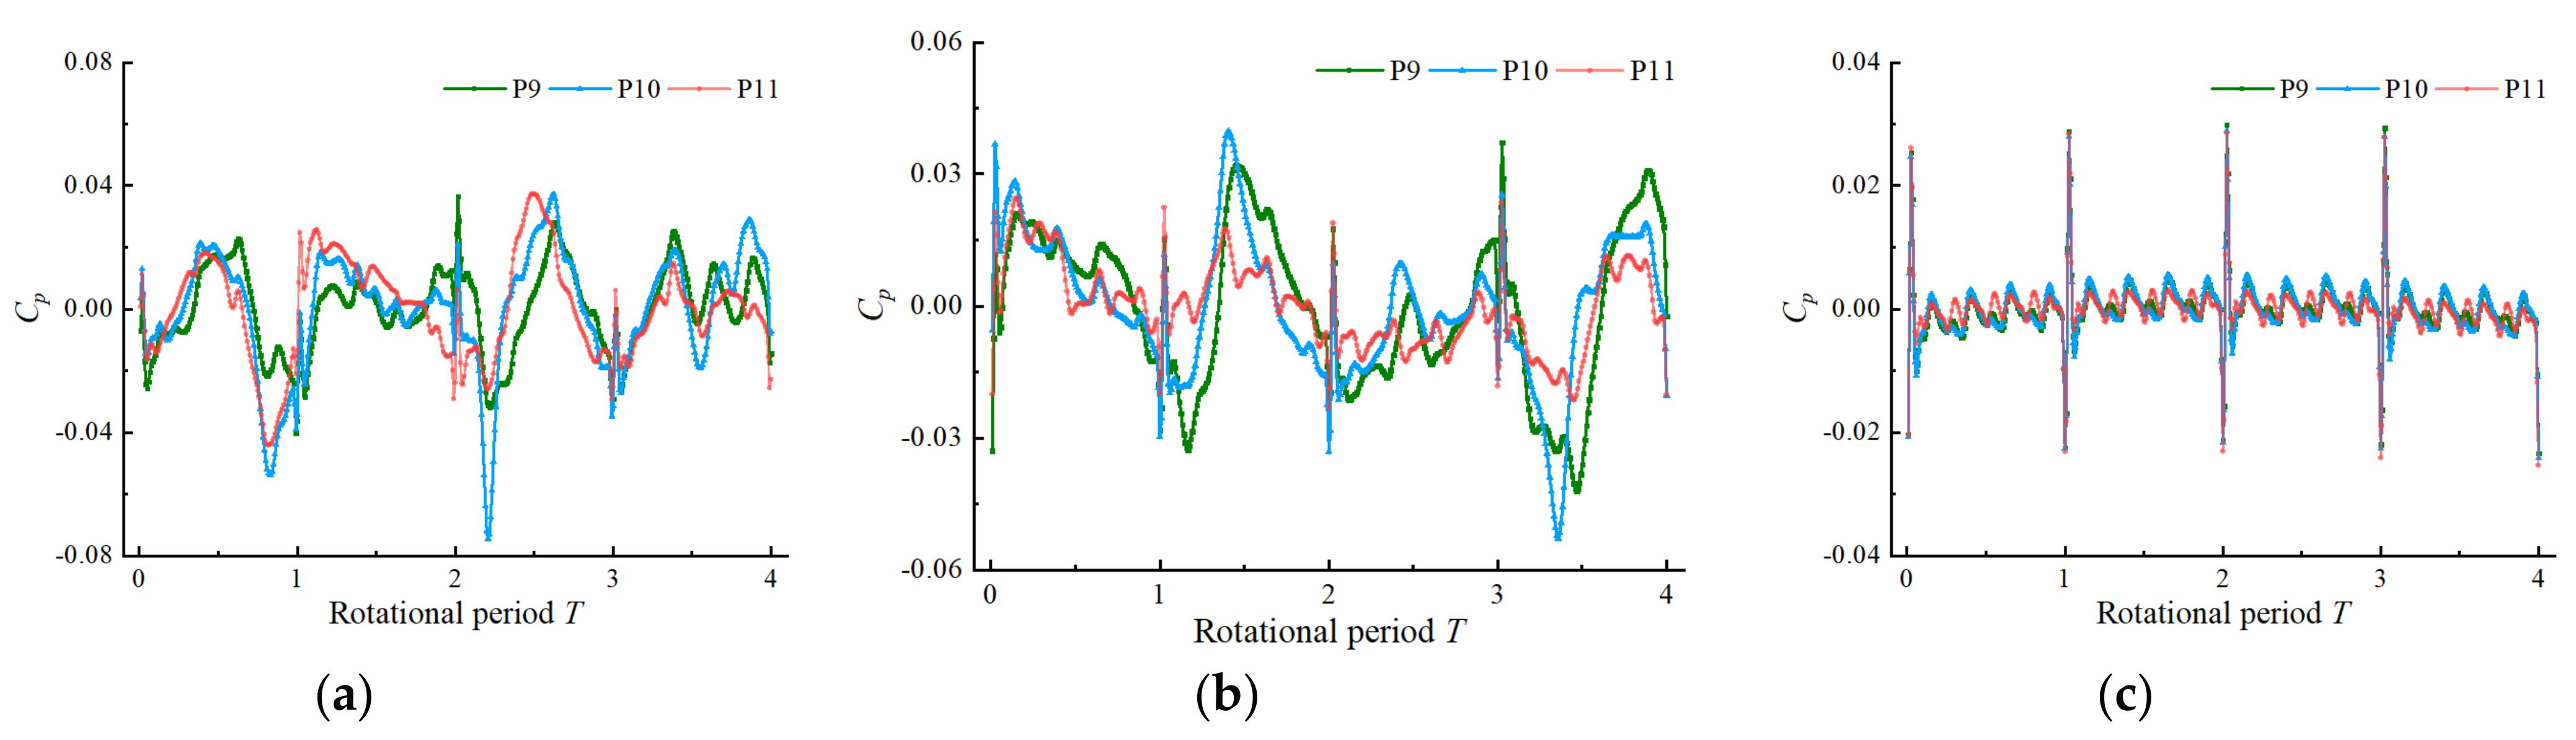
4.3. Time Domain Analysis of Pressure Fluctuation

In this paper, the pressure pulsation under three flow conditions of 0.8 Qbep, 1.0 Qbep and 1.2 Qbep is selected for analysis. In order to eliminate the static pressure interference, the instantaneous pressure needs to be dimensionless, and the pressure pulsation coefficient CP is introduced [32,33].
Figure 23 shows the time domain diagram of pressure fluctuation at the outlet of campaniform inlet conduit. At 0.8 Qbep, the pressure fluctuation of monitoring point 1 is disordered, and the pressure fluctuation distribution of each monitoring point under other working conditions has 4 peaks and 4 troughs in each cycle, indicating that with the increase of flow rate, the pressure fluctuation at the outlet of bell-shaped inlet duct is obviously affected by impeller. Figure 24 shows the time domain diagram of impeller inlet pressure fluctuation. The pressure pulsation at the impeller inlet is relatively regular and has obvious periodicity. In one rotation cycle, there are four peaks and four troughs, and the time of peaks and troughs is roughly equal. This is because the impeller rotates and the pressure produces alternating fluctuations. Figure 25 is the time domain diagram of pressure fluctuation at impeller outlet. Between the impeller and guide vane of axial flow pump, due to the influence of static and dynamic interference, the flow is disordered, and the pressure fluctuation changes sharply. Under the condition of 0.8 Qbep, the outlet pressure fluctuation near the hub is chaotic, which is related to the flow disorder under small flow rate. The fluctuation of pressure fluctuation coefficient decreases with the increase of flow rate, and the flow pressure fluctuation shows good regularity under the condition of 1.2 Qbep. Figure 26 shows the time domain diagram of the pressure pulsation at the outlet of the guide vane. The pressure pulsation coefficient distribution is between-0.08 and 0.04 at 0.8 Qbep. The effect of the guide vane recycling ring volume becomes better with the increase of the flow rate, and the flow pattern at the outlet of the guide vane becomes better. The pressure pulsation coefficient distribution is between −0.06 and 0.04 at 1.0 Qbep, and the pressure pulsation coefficient distribution is between −0.02 and 0.03 at 1.2 Qbep, which shows that the flow pattern at the outlet of the 1.2 Qbep guide vane is the best.

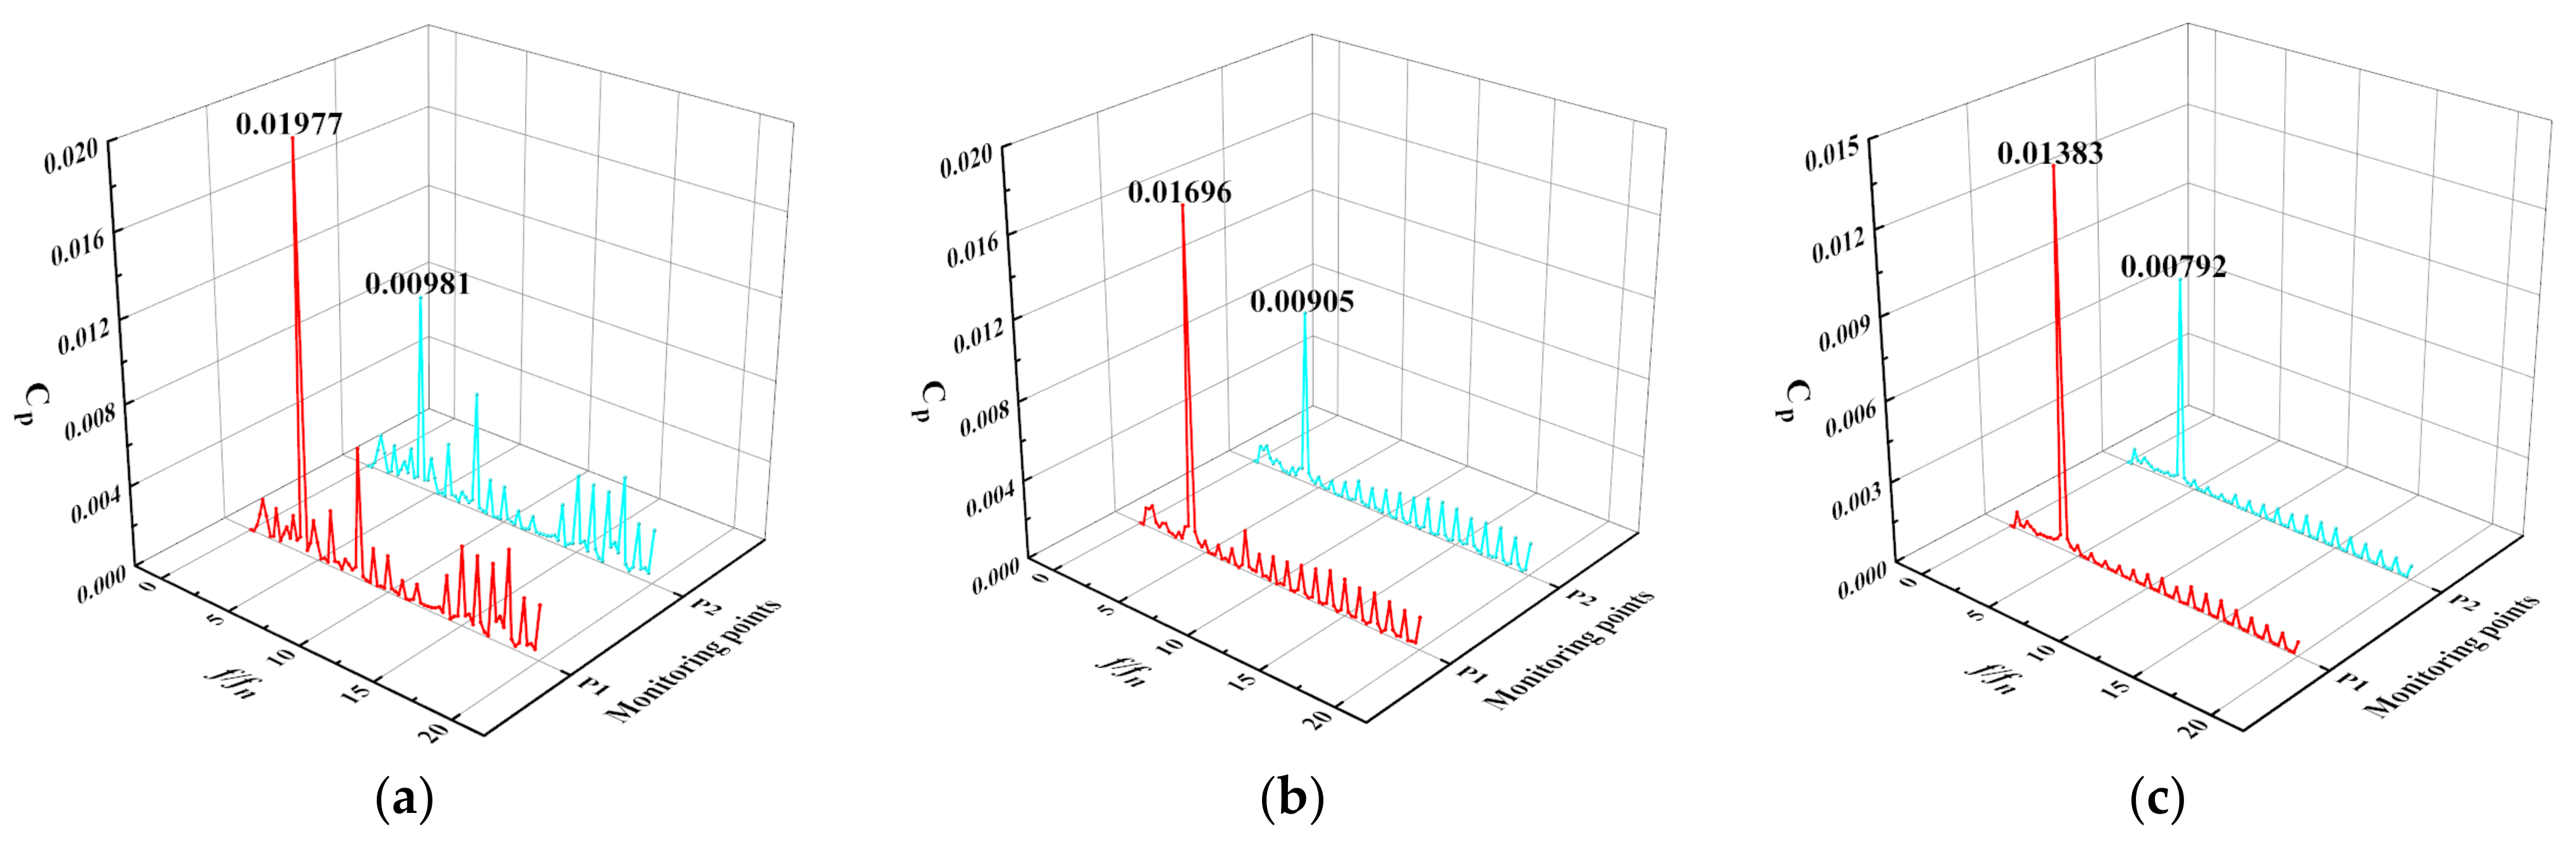
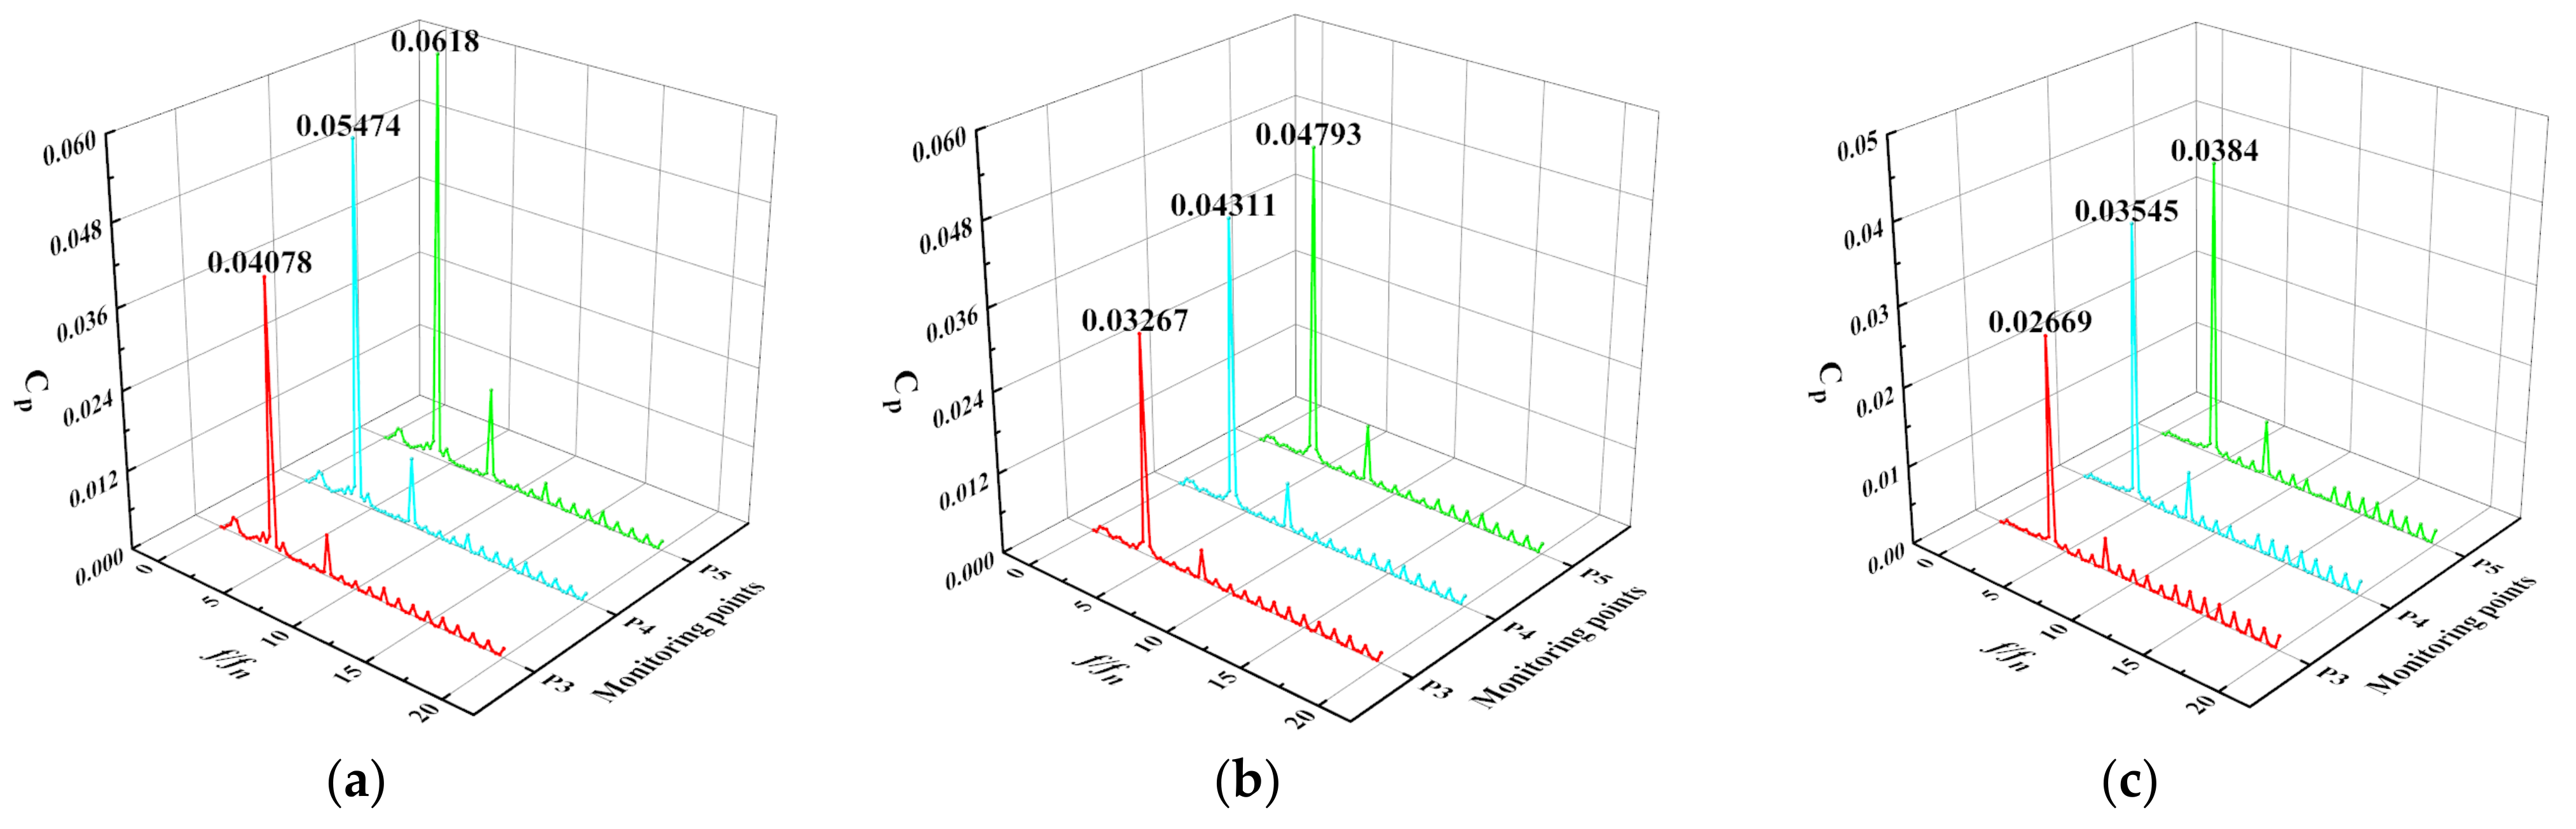
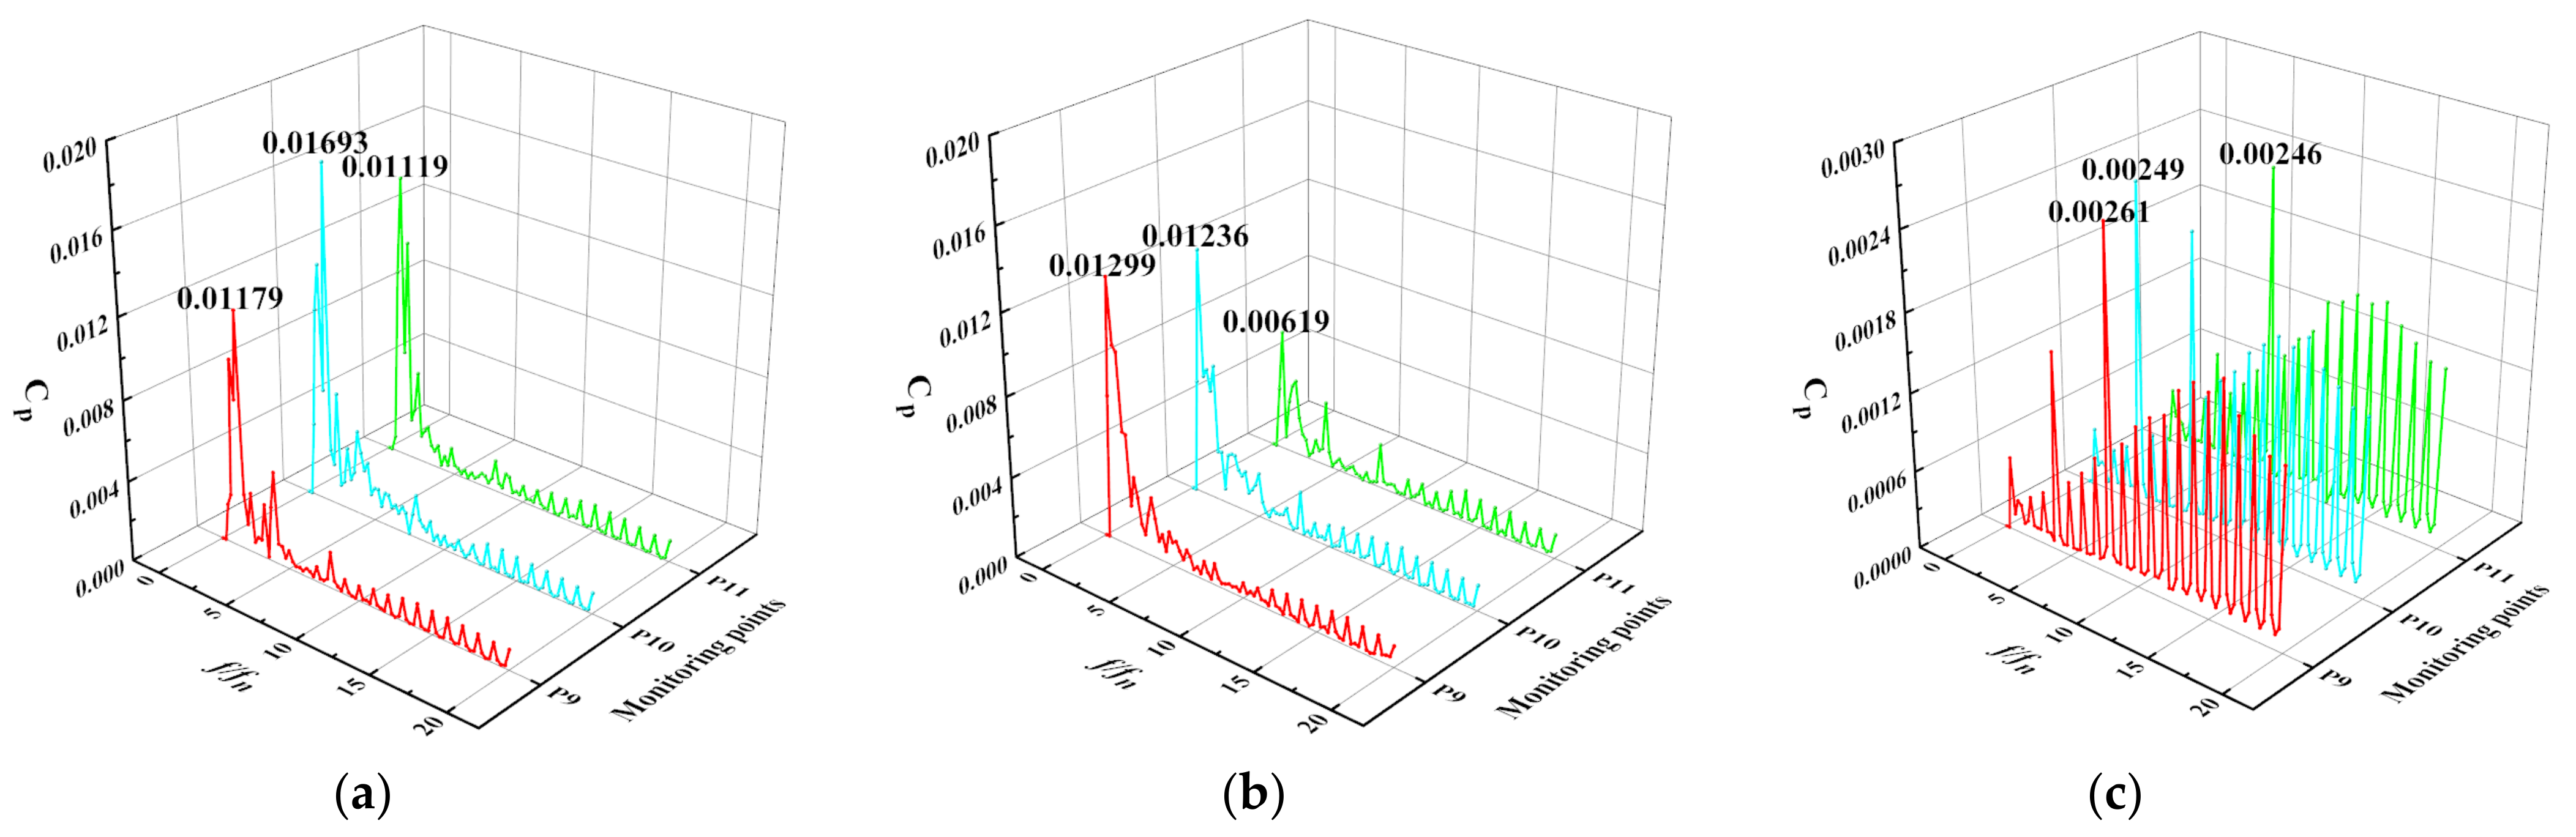
4.4. Frequency Domain Analysis of Pressure Pulsation

Fourier transform is a commonly used signal analysis method. The components contained in the signal can be analyzed by Fourier transform, and the contained components can also be synthesized into signals. References [34,35], this paper uses fast Fourier transform FFT to analyze the pressure pulsation in frequency domain.
Figure 27 shows the frequency domain diagram of pressure fluctuation at outlet of campaniform inlet conduit. The pressure fluctuation spectrum of the two monitoring points is similar, and the low frequency fluctuation of 0.8 Qbep is rich. With the increase of flow rate, the amplitude of low frequency fluctuation coefficient is smaller and smaller. Affected by the rotation of the impeller, the main frequency of the three conditions is 4 times the rotation frequency, and with the increase of the flow rate, the main frequency amplitude decreases gradually, and the fluctuation coefficient amplitude of the water flow becomes smaller. The maximum pressure fluctuation coefficient amplitude of monitoring point P1 near the conduit edge is about twice that of monitoring point P2 near the channel center. Figure 28 shows the frequency domain diagram of impeller inlet pressure pulsation. It can be seen from Figure 28 that the main frequency of impeller inlet pressure pulsation is 4 times, and the secondary frequency is 8 times. Under different flow conditions, the pressure pulsation law is similar, and the amplitude of pressure pulsation coefficient increases gradually from hub to flange. Under 0.8 Qbep condition, the maximum amplitude of pressure pulsation is 0.0618. With the increase of flow rate, the flow field structure becomes relatively stable, and the amplitude of pulsation coefficient becomes smaller. Under 1.0 Qbep condition, the maximum amplitude of pressure pulsation coefficient is 0.04793, and under 1.2 Qbep condition, the maximum amplitude of pressure pulsation coefficient is 0.0384. Figure 29 shows the impeller outlet pressure pulsation frequency domain diagram. It can be seen from Figure 29 that the flow is affected by the dynamic and static interference between the impeller and the guide vane. The static guide vane is called the pressure pulsation excitation source relative to the rotating impeller, which produces hydraulic excitation at the outlet of the impeller. The flow field at the outlet of the impeller becomes complicated. In addition, the flow has a large velocity circulation, which increases the turbulent kinetic energy of the flow at the outlet of the impeller. The pressure pulsation at the outlet of the impeller is more complex and intense than that at the inlet of the impeller, so the peak number of pressure pulsation at the outlet of the impeller is more than that at the inlet of the impeller. At 0.8 Qbep and 1.0 Qbep, the main frequency of each monitoring point is 4 times of the rotating frequency. At 1.0 Qbep, the main frequency of each monitoring point is significantly lower than that at 0.8 Qbep. At 1.2 Qbep, the main frequency of each monitoring point is the blade frequency. The pressure pulsation decreases gradually from the rim to the hub. Figure 30 shows the frequency domain diagram of pressure fluctuation at the guide vane outlet. It can be seen from Figure 30 that the amplitude of the pressure pulsation coefficient at the outlet of the guide vane decreases significantly, and there is no obvious law of pressure pulsation under different working conditions. When 0.8 Qbep, the main frequency of the pressure pulsation is 1.5 times of the rotating frequency, and the maximum amplitude of the pressure pulsation coefficient at the middle monitoring point is 0.01693. When 1.0 Qbep, the main frequency of the pressure pulsation at each monitoring point is 0.75 times of the rotating frequency, and the maximum amplitude of the pressure pulsation coefficient near the hub is 0.1299. When 1.2 Qbep, the amplitude of the pressure pulsation at each monitoring point is lower than that under 1.0 Qbep and 0.8 Qbep conditions, indicating that the effect of large flow guide vane recycling volume is obvious, which makes the flow pulsation smaller.

5. Conclusions

In this paper, the reliability and effectiveness of the numerical calculation model are verified by physical model test. The influence of time series effect on the flow and pulsation in the blade of vertical axial flow pump device is studied. The conclusions are as follows:
(1) The inlet pressure coefficient distribution of the impeller presents four high-pressure areas and four low-pressure areas, and changes with the change of the impeller blade position. The regularized helicity of the section 2-2 at the center line of the impeller is mainly positive, indicating that the vortex in the impeller is mainly driven by the impeller rotation to drive the flow rotation. Impeller inlet pressure pulsation is affected by the impeller, the main frequency is 4 times the rotating frequency.
(2) The flow at the outlet of the impeller is more chaotic than that at the inlet of the impeller. The pressure coefficient distribution and the regularity of the regular helicity at different times are not strong, but the main frequency of the pressure fluctuation is still 4 times of the rotating frequency. With the increase of the flow rate, the amplitude fluctuation of the pressure fluctuation coefficient at the outlet of the impeller decreases. Under the condition of 1.2 Qbep, the flow pressure fluctuation shows good regularity of four peaks and four valleys.
(3) The exit of the guide vane produces a local recirculation zone and a vortex zone in a rotation period, which makes the negative values of pressure and regularized helicity change obviously at different times. The flow distribution at the outlet of the guide vane is not uniform. At 0.8 Qbep and 1.0 Qbep, the flow at the outlet of the guide vane is mainly concentrated in the two guide vane (sections 7-1 and 7-7) of the guide vane, accounting for 14.53% and 16.03%, 15.32% and 14.82%, respectively. 1.2 Qbep guide vane outlet flow distribution is more uniform; the pressure pulsation at the outlet of the guide vane decreases with the increase of the flow rate. The main frequency of the pressure pulsation at 1.2 Qbep is about 1/5 of the main frequency of the pressure pulsation at 1.0 Qbep, indicating that the larger the flow rate, the better the effect of the guide vane recovery circulation.

Author Contributions

Conceptualization, F.Y.; software and writing—original draft preparation, P.C.; writing—review and editing, F.Y. and R.X.; visualization, N.L. and Z.L.; investigation, X.Z. and Y.Y.; supervision, F.Y.; project administration, F.Y.; funding acquisition, F.Y.; All authors have read and agreed to the published version of the manuscript.

Funding

This research was funded by the National Natural Science Foundation of China (Grant no. 51609210), major projects of the Natural Science Foundation of the Jiangsu Higher Education Institutions of China (Grant no. 20KJA570001), the open research subject of the Key Laboratory of Fluid and Power Machinery, Ministry of Education (Grant no. szjj2016-078), the Technology Project of the Water Resources Department of the Jiangsu Province (Grant no. 2020029), the Scientific Research Program of Jiangsu Hydraulic Research Institute (Grant no. 2020z026), the Priority Academic Program Development of the Jiangsu Higher Education Institutions (PAPD), Jiangxi Water Science and Technology Project (Grant no. 201921YBKT11)and Jiangsu Graduate Practice Innovation Program (Grant no. SJCX21_1590).

Institutional Review Board Statement

Not applicable.

Informed Consent Statement

Not applicable.

Data Availability Statement

All data necessary to carry out the work in this paper are included in the figures, tables or are available in the cited references.

Conflicts of Interest

The authors declare no conflict of interest.

References

  1. Liu, C. Technical Innovation and Development Analysis of Axial Flow Pump System. Trans. Chin. Soc. Agric. Mach. 2015, 46, 49–59. [Google Scholar]
  2. Kan, K.; Yang, Z.; Lyu, P.; Zheng, Y.; Shen, L. Numerical study of turbulent flow past a rotating axial-flow pump based on a level-set immersed boundary method. Renew. Energy 2020, 168, 960–971. [Google Scholar] [CrossRef]
  3. Zhang, X.; Tang, F.; Liu, C.; Shi, L.; Liu, H.; Sun, Z.; Hu, W. Numerical Simulation of Transient Characteristics of Start-Up Transition Process of Large Vertical Siphon Axial Flow Pump Station. Front. Energy Res. 2021, 9, 382. [Google Scholar] [CrossRef]
  4. Wang, C.; Wang, F.; Tang, Y.; Zi, D.; Xie, L.; Chenglian, H.; Zhu, Q.; Huang, C. Investigation into the Phenomenon of Flow Deviation in the S-Shaped Discharge Passage of a Slanted Axial-Flow Pumping System. J. Fluids Eng. 2020, 142, 041205. [Google Scholar] [CrossRef]
  5. Kim, Y.S.; Shim, H.S.; Kim, K.Y. Effects of inlet guide vane and blade pitch angles on the performance of a submersible axial-flow pump. Proc. Inst. Mech. Eng. Part A J. Power Energy 2021, 235, 718–732. [Google Scholar] [CrossRef]
  6. Al-Obaidi, A.R.; Mohammed, A.A. Investigations of Transient Flow Characteristic in Axial Flow Pump and Pressure Fluctuation Analysis Based on the CFD Technique. J. Eng. Sci. Technol. Rev. 2019, 12, 70–79. [Google Scholar] [CrossRef]
  7. Shi, L.; Yuan, Y.; Jiao, H.; Tang, F.; Cheng, L.; Yang, F.; Jin, Y.; Zhu, J. Numerical investigation and experiment on pressure pulsation characteristics in a full tubular pump. Renew. Energy 2021, 163, 987–1000. [Google Scholar] [CrossRef]
  8. Zhou, Y.; Zheng, Y.; Kan, K.; Zhang, Y.; Wang, H.; Tang, W.; Zhao, M. Study on hydraulic characteristics of large vertical axial-flow pump used as constant frequency power generation. Proc. Inst. Mech. Eng. Part A J. Power Energy 2021, 235, 59–69. [Google Scholar] [CrossRef]
  9. Li, C.; Zheng, Y.; Zhang, Y.; Kan, K.; Xue, X.; Fernandez-Rodriguez, E. Stability Optimization and Analysis of a Bidirectional Shaft Extension Pump. J. Fluids Eng. 2020, 142, 071203. [Google Scholar] [CrossRef]
  10. Chikh, M.A.A.; Belaidi, I.; Khelladi, S.; Hamrani, A.; Bakir, F. Coupling of inverse method and cuckoo search algorithm for multiobjective optimization design of an axial flow pump. Proc. Inst. Mech. Eng. Part A J. Power Energy 2019, 233, 988–1006. [Google Scholar] [CrossRef]
  11. Zhou, Y.S.; Zhang, H.; Chen, B. Influence of double-inlet design on the flow-head characteristics of axial-flow pump. J. Hydrodyn. 2021, 33, 763–772. [Google Scholar] [CrossRef]
  12. Lin, P.; Xiang, L.; Hu, D.; Zhai, S.; Guo, P.; Wang, S. Effect of sand-containing cavitation on pressure pulsation characteristics in axial flow pump. J. Vib. Shock 2021, 40, 140–147. [Google Scholar]
  13. Zhang, D.; Shi, W.; Pan, D.; Dubuisson, M. Numerical and Experimental Investigation of Tip Leakage Vortex Cavitation Patterns and Mechanisms in an Axial Flow Pump. J. Fluids Eng. 2015, 137, 121103. [Google Scholar] [CrossRef]
  14. Yang, F.; Li, Z.; Yuan, Y.; Liu, C.; Zhang, Y.; Jin, Y. Numerical and Experimental Investigation of Internal Flow Characteristics and Pressure Fluctuation in Inlet Passage of Axial Flow Pump under Deflection Flow Conditions. Energies 2021, 14, 5245. [Google Scholar] [CrossRef]
  15. Song, X.; Liu, C. Experimental study of the floor-attached vortices in pump sump using V3V. Renew. Energy 2021, 164, 752–766. [Google Scholar] [CrossRef]
  16. Zhang, W.; Shi, L.; Tang, F.; Duan, X.; Liu, H.; Sun, Z. Analysis of inlet flow passage conditions and their influence on the performance of an axial-flow pump. Proc. Inst. Mech. Eng. Part A J. Power Energy 2021, 235, 733–746. [Google Scholar] [CrossRef]
  17. Yang, F.; Hu, W.Z.; Li, C.; Liu, C.; Jin, Y. Computational study on the performance improvement of axial-flow pump by inlet guide vanes at part loads. J. Mech. Sci. Technol. 2020, 34, 4905–4915. [Google Scholar] [CrossRef]
  18. Zhang, D.; Shi, W.; Zhang, H.; Yao, J.; Guan, X. Application of Different Turbulence Models in Performance Prediction of Axial Flow Pump. Trans. Chin. Soc. Agric. Eng. 2012, 28, 66–71+296. [Google Scholar]
  19. Jin, Y.; He, X.; Zhang, Y.; Zhou, S.; Chen, H.; Liu, C. Numerical and Experimental Investigation of External Characteristics and Pressure Fluctuation of a Submersible Tubular Pumping System. Processes 2019, 7, 949. [Google Scholar] [CrossRef] [Green Version]
  20. Izmaylov, R.A.; Lopulalan, H.D.; Norimarna, G.S. Unsteady Flow Modeling Using Transient Rotor–Stator Interface//ASME Turbo Expo 2013: Turbine Technical Conference and Exposition. Am. Soc. Mech. Eng. Digit. Collect. 2013, 6, 1–8. [Google Scholar]
  21. Li, Y.; Zheng, Y.; Meng, F.; Osman, M.K. The Effect of Root Clearance on Mechanical Energy Dissipation for Axial Flow Pump Device Based on Entropy Production. Processes 2020, 8, 1506. [Google Scholar] [CrossRef]
  22. Zhao, B.; Xie, Y.; Liao, W.; Han, L.; Fu, Y.; Huang, Z. Applicability Analysis of Second Generation Vortex Identification Method in Internal Flow Field of Mixed Flow Pump. J. Mech. Eng. 2020, 56, 216–223. [Google Scholar]
  23. Daniels, S.J.; Rahat, A.A.M.; Tabor, G.R.; Fieldsend, J.E.; Everson, R.M. Shape optimisation of the sharp-heeled Kaplan draft tube: Performance evaluation using Computational Fluid Dynamics. Renew. Energy 2020, 160, 112–126. [Google Scholar] [CrossRef]
  24. Roache, P.J. Method for Uniform Reporting of Grid Refinement Studies. J. Fluids Eng. 1994, 116, 405–413. [Google Scholar] [CrossRef]
  25. Wang, F. Flow Analysis Methods of Water Pumps and Pumping Stations; China Water Conservancy and Hydropower Publishing House: Beijing, China, 2020. [Google Scholar]
  26. Yang, F. Internal Flow Characteristics and Hydraulic Stability of Low-Lift Pump Device; China Water Conservancy and Hydropower Publishing House: Beijing, China, 2020. [Google Scholar]
  27. Mu, T.; Zhang, R.; Xu, H.; Zheng, Y.; Fei, Z.; Li, J. Study on improvement of hydraulic performance and internal flow pattern of the axial flow pump by groove flow control technology. Renew. Energy 2020, 160, 756–769. [Google Scholar] [CrossRef]
  28. Chalghoum, I.; Elaoud, S.; Kanfoudi, H.; Akrout, M. The effects of the rotor-stator interaction on unsteady pressure pulsation and radial force in a centrifugal pump. J. Hydrodyn. 2018, 30, 672–681. [Google Scholar] [CrossRef]
  29. Li, W.; Ji, L.; Zhang, Y.; Shi, W.; Yang, Y. Vortex dynamics analysis of transient flow field in start-up process of mixed-flow pump. J. Cent. South Univ. (Sci. Technol.) 2018, 49, 2480–2489. [Google Scholar]
  30. Levy, Y.; Degani, D.; Seginer, A. Graphical Visualization of Vortical Flows by Means of Helicity. AIAA J. 1990, 28, 1347–1352. [Google Scholar] [CrossRef]
  31. Tong, B.; Yin, X.; Zhu, K. Vortex Dynamics; Press of University of Science and Technology of China: Hefei, China, 2009. [Google Scholar]
  32. Yang, F.; Chang, P.; Hu, W.; Mao, B.; Liu, C.; Li, Z. Numerical Study on Pressure Pulsation in a Slanted Axial-Flow Pump Device under Partial Loads. Processes 2021, 9, 1404. [Google Scholar] [CrossRef]
  33. Song, X.; Liu, C.; Yang, F.; Chao, Z.; Chu, C.; Zhang, C. Experimental study on pressure pulsation of axial flow pump induced by inflow swirl. J. Vib. Shock 2018, 37, 25–31+62. [Google Scholar]
  34. Bai, L.; Zhou, L.; Han, C.; Zhu, Y.; Shi, W. Numerical Study of Pressure Fluctuation and Unsteady Flow in a Centrifugal Pump. Processes 2019, 7, 354. [Google Scholar] [CrossRef] [Green Version]
  35. Wang, C.; He, X.; Shi, W.; Wang, X.; Wang, X.; Qiu, N. Numerical study on pressure fluctuation of a multistage centrifugal pump based on whole flow field. AIP Adv. 2019, 9, 035118. [Google Scholar] [CrossRef] [Green Version]
Figure 1. Three-dimensional solid figure of vertical axial flow pump device 1 Campaniform Inlet Conduit 2 Impeller 3 Guide Vane 4 90° Elbow 5 Straight Outlet Conduit).
Jmse 09 01429 g001
Figure 2. Geometric dimension of flow conduit (a) Campaniform Inlet Conduit (b) 90° Elbow and Straight Outlet Conduit.
Jmse 09 01429 g002
Figure 3. Number independence of grids.
Jmse 09 01429 g003
Figure 4. Grid diagram of impeller and guide vane (a) Guide Vane (b) Impeller.
Jmse 09 01429 g004
Figure 5. Physical model of vertical axial flow pump device.
Jmse 09 01429 g005
Figure 6. Comparison of energy performance between model test and numerical simulation of pump device.
Jmse 09 01429 g006
Figure 7. Characteristic section diagram of impeller guide vane.
Jmse 09 01429 g007
Figure 8. Pressure coefficient transient change of impeller inlet section 1-1 at 1.0 Qbep (a) 1/3T (b) 2/3T (c) 3/3T.
Jmse 09 01429 g008
Figure 9. Pressure coefficient transient change of impeller outlet section 3-3 at 1.0 Qbep (a) 1/3T (b) 2/3T (c) 3/3T.
Jmse 09 01429 g009
Figure 10. Pressure coefficient transient change of guide vane outlet section 5-5 at 1.0 Qbep (a) 1/3T (b) 2/3T (c) 3/3T.
Jmse 09 01429 g010
Figure 11. Transient variation of average velocity circulation.
Jmse 09 01429 g011
Figure 12. Diagram of section distribution at guide vane outlet.
Jmse 09 01429 g012
Figure 13. Distribution of circumferential velocity at impeller outlet at different times (a) 0.8 Qbep (b) 1.0 Qbep (c) 1.2 Qbep.
Jmse 09 01429 g013
Figure 14. Transient variation of flow distribution at guide vane outlet (a) 0.8 Qbep (b) 1.0 Qbep (c) 1.2 Qbep.
Jmse 09 01429 g014
Figure 15. Proportion of flow distribution at each section of guide vane outlet (a) 0.8 Qbep (b) 1.0 Qbep (c) 1.2 Qbep.
Jmse 09 01429 g015
Figure 16. Transient variation of regularized helicity of section 2-2 impeller (a) 1/3T (b) 2/3T (c) 3/3T.
Jmse 09 01429 g016
Figure 17. Transient variation of regularized helicity of section 4-4 guide vane (a) 1/3T (b) 2/3T (c) 3/3T.
Jmse 09 01429 g017
Figure 18. Transient variation of regularized helicity of section 5-5 guide vane outlet (a) 1/3T (b) 2/3T (c) 3/3T.
Jmse 09 01429 g018
Figure 19. The layout of pressure fluctuation monitoring points.
Jmse 09 01429 g019
Figure 20. Internal pressure distribution of impeller under different flow conditions (a) 0.8 Qbep (b) 1.0 Qbep (c) 1.2 Qbep.
Jmse 09 01429 g020
Figure 21. Internal pressure distribution of guide vane under different flow conditions (a) 0.8 Qbep (b) 1.0 Qbep (c) 1.2 Qbep.
Jmse 09 01429 g021
Figure 22. Internal flow line distribution of guide vane under different flow conditions (a) 0.8 Qbep (b) 1.0 Qbep (c) 1.2 Qbep.
Jmse 09 01429 g022
Figure 23. Time domain diagram of pressure fluctuation at outlet of campaniform inlet conduit (a) 0.8 Qbep (b) 1.0 Qbep (c) 1.2 Qbep.
Jmse 09 01429 g023
Figure 24. Time domain diagram of pressure fluctuation at impeller inlet (a) 0.8 Qbep (b) 1.0 Qbep (c) 1.2 Qbep.
Jmse 09 01429 g024
Figure 25. Time domain diagram of impeller outlet pressure fluctuation (a) 0.8 Qbep (b) 1.0 Qbep (c) 1.2 Qbep.
Jmse 09 01429 g025
Figure 26. Time domain diagram of pressure fluctuation at guide vane outlet (a) 0.8 Qbep (b) 1.0 Qbep (c) 1.2 Qbep.
Jmse 09 01429 g026
Figure 27. Frequency domain diagram of pressure fluctuation at outlet of campaniform inlet conduit (a) 0.8 Qbep (b) 1.0 Qbep (c) 1.2 Qbep.
Jmse 09 01429 g027
Figure 28. Frequency domain diagram of impeller inlet pressure pulsation (a) 0.8 Qbep (b) 1.0 Qbep (c) 1.2 Qbep.
Jmse 09 01429 g028
Figure 29. Frequency domain diagram of impeller outlet pressure pulsation (a) 0.8 Qbep (b) 1.0 Qbep (c) 1.2 Qbep.
Jmse 09 01429 g029
Figure 30. Time domain diagram of pressure fluctuation at guide vane outlet (a) 0.8 Qbep (b) 1.0 Qbep (c) 1.2 Qbep.
Jmse 09 01429 g030
Table 1. Analysis of grid convergence index.
Grid SchemeAverage Grid Spacing
hi (mm)
Grid Encryption Ratio rHeadGrid Convergence Error
ε
GCI (%)
11.291.047.710.00385.91
21.241.077.680.00524.56
31.161.067.640.00394.01
41.091.057.610.00263.22
51.041.087.59−0.00261.99
60.961.077.600.00131.14
70.907.59
Publisher’s Note: MDPI stays neutral with regard to jurisdictional claims in published maps and institutional affiliations.

