Abstract
Gravel barriers represent physiographic, hydrographic, sedimentary, and ecological boundaries between inshore and open marine offshore environments, where they provide numerous important functions. The morphosedimentary features of gravel barriers (e.g., steep, energy reflective form) have led to their characterization as effective coastal defense features during extreme hydrodynamic conditions. Consequently, gravel barriers have often been intensively managed to enhance coastal defense functions. The Blakeney Point Barrier System (BPBS), U.K., is one such example, which offers the opportunity to investigate the impact of alternative management regimes under extreme hydrodynamic conditions. The BPBS was actively re-profiled along its eastern section from the 1950s to the winter of 2005, whilst undergoing no active intervention along its western section. Combining an analysis of remotely sensed elevation datasets with numerical storm surge modeling, this paper finds that interventionist management introduces systemic differences in barrier morphological characteristics. Overly steepened barrier sections experience greater wave run-up extents during storm surge conditions, leading to more extreme morphological changes and landward barrier retreat. Furthermore, while high, steep barriers can be highly effective at preventing landward flooding, in cases where overwashing does occur, the resultant landward overtopping volume is typically higher than would be the case for a relatively lower crested barrier with a lower angled seaward slope. There is a growing preference within coastal risk management for less interventionist management regimes, incorporating natural processes. However, restoring natural processes does not immediately or inevitably result in a reduction in coastal risk. This paper contributes practical insights regarding the time taken for a previously managed barrier to relax to a more natural state, intermediary morphological states, and associated landward water flows during extreme events, all of which should be considered if gravel barriers are to be usefully integrated into broader risk management strategies.
1. Introduction
Coastal barriers represent physiographic, hydrographic, sedimentary, and ecological boundaries between inshore and open marine offshore environments [1,2]. They provide a number of important functions, including: sites of human settlement [3,4]; controlling salinity gradients and wave/current energy, even under storm conditions [5,6,7]; maintaining sediment transport pathways [8]; and sheltering ecological habitats [9].
The ability of pure gravel and mixed sand–gravel barriers (hereafter, ‘gravel barriers’) to perform varied and valuable functions derives partly from their morphosedimentary characteristics [10,11,12]. The relatively steep, energy-reflective beach face, high ridge and coarse clastic composition generally precludes substantial changes to profile morphology even under relatively high energy conditions [13].
The long term (millennial to centennial) persistence of gravel barriers, is regulated by sediment supply, relative sea level rise, and geological frameworks [14,15]. These barriers have been observed to respond to multi-decadal sea level rise through landward migration whilst maintaining their essential form [16].
Imposed atop the baseline sea level, it is infrequent storm events that drive landward migration of these landforms [17,18,19]. Under these conditions, landward migration occurs because extreme hydrodynamic events, such as storm surges, are capable of overcoming morphodynamic thresholds (e.g., wave run-up relative to barrier crest height) not reached under more moderate forcing conditions [20,21,22]. Threshold exceedance may result in rapid reorganization of the gravel barrier system as it tends towards a new equilibrium in response to high energy forcing conditions. A spectrum of extreme event responses has been categorized, ranging from minimal change to breaching (Table 1).

Table 1.
Hydrodynamic and associated morphological responses of gravel barriers (based on ref [23]).
Limited change during low and moderate energy conditions, combined with resilient responses to extreme hydrodynamic events, has led to the characterization of gravel barriers as effective coastal defense features [24]. Common management strategies include the use of gravel barriers to shield eroding sandy beaches [25] and the conversion of hard defenses to gravel-based alternatives [26,27]. In the past, these gravel structures have been intensively managed; for example, through re-profiling of the barrier crest to maintain a specified cross-shore position and elevation [28,29], nourishment schemes [30], and the installation of hard engineered structures such as groins or riprap [31].
Estimates for the capital and maintenance costs of gravel barrier management schemes are not readily available. However, it is generally the case that interventionist management carries higher cost implications than non-interventionist alternatives [32]. The high costs associated with interventionist management schemes have been justified using “classic” cost-benefit analyses which quantify direct damaged avoided, or in some cases, “enhanced” cost-benefit analyses which account for broader economic and environmental impacts [33]. Among the advantages of holistic approaches to scheme appraisal include the ability to capture a greater diversity of costs, benefits, and coastal system functions [34].
Furthermore, and partly as a result of the high cost associated with interventionist management, there is a growing preference within coastal risk management for less interventionist management regimes, incorporating natural processes [35,36,37,38]. The proposed benefits include an inherent ability to self-repair and recover from external disturbances such as storm damage [39], an ability to provide a multiplicity of benefits [40], and sustainability under uncertain future environmental conditions [41,42]. Accordingly, many gravel beaches and barriers have been allowed to relax towards a more natural state (e.g., Medmerry, south coast, U.K. [43]; Porlock, south-west coast, U.K. [44]; Sillon de Talbert, north-west coast, France [45]). In these cases, barriers have undergone relatively dramatic changes (landward rollover, crest lowering, and inlet widening) in the period following cessation of active management.
There remains, however, substantial uncertainty regarding the way in which gravel barrier landforms will respond to extreme hydrodynamic events in light of sudden management regime changes [46,47]. Constraining the likely response of gravel barrier landforms under such conditions is a priority given the momentum behind less interventionist coastal management approaches, and the likelihood that gravel barriers will increasingly be permitted to respond more naturally to environmental forcing conditions. Under these alternative management priorities, research is needed to establish whether certain morphologies emerge as more vulnerable to increased run-up extents and consequent morphological and flooding impacts.
In this paper, we therefore address three key research questions:
- (1)
- How does an interventionist regime impact on gravel barrier morphology compared to an unmanaged state?
- (2)
- To what extent do morphological differences between the managed and unmanaged barrier sections alter barrier responses to extreme hydrodynamic events?
- (3)
- Where differences in barrier morphology alter responses to storm events, what are the implications for landward overtopping water volume?
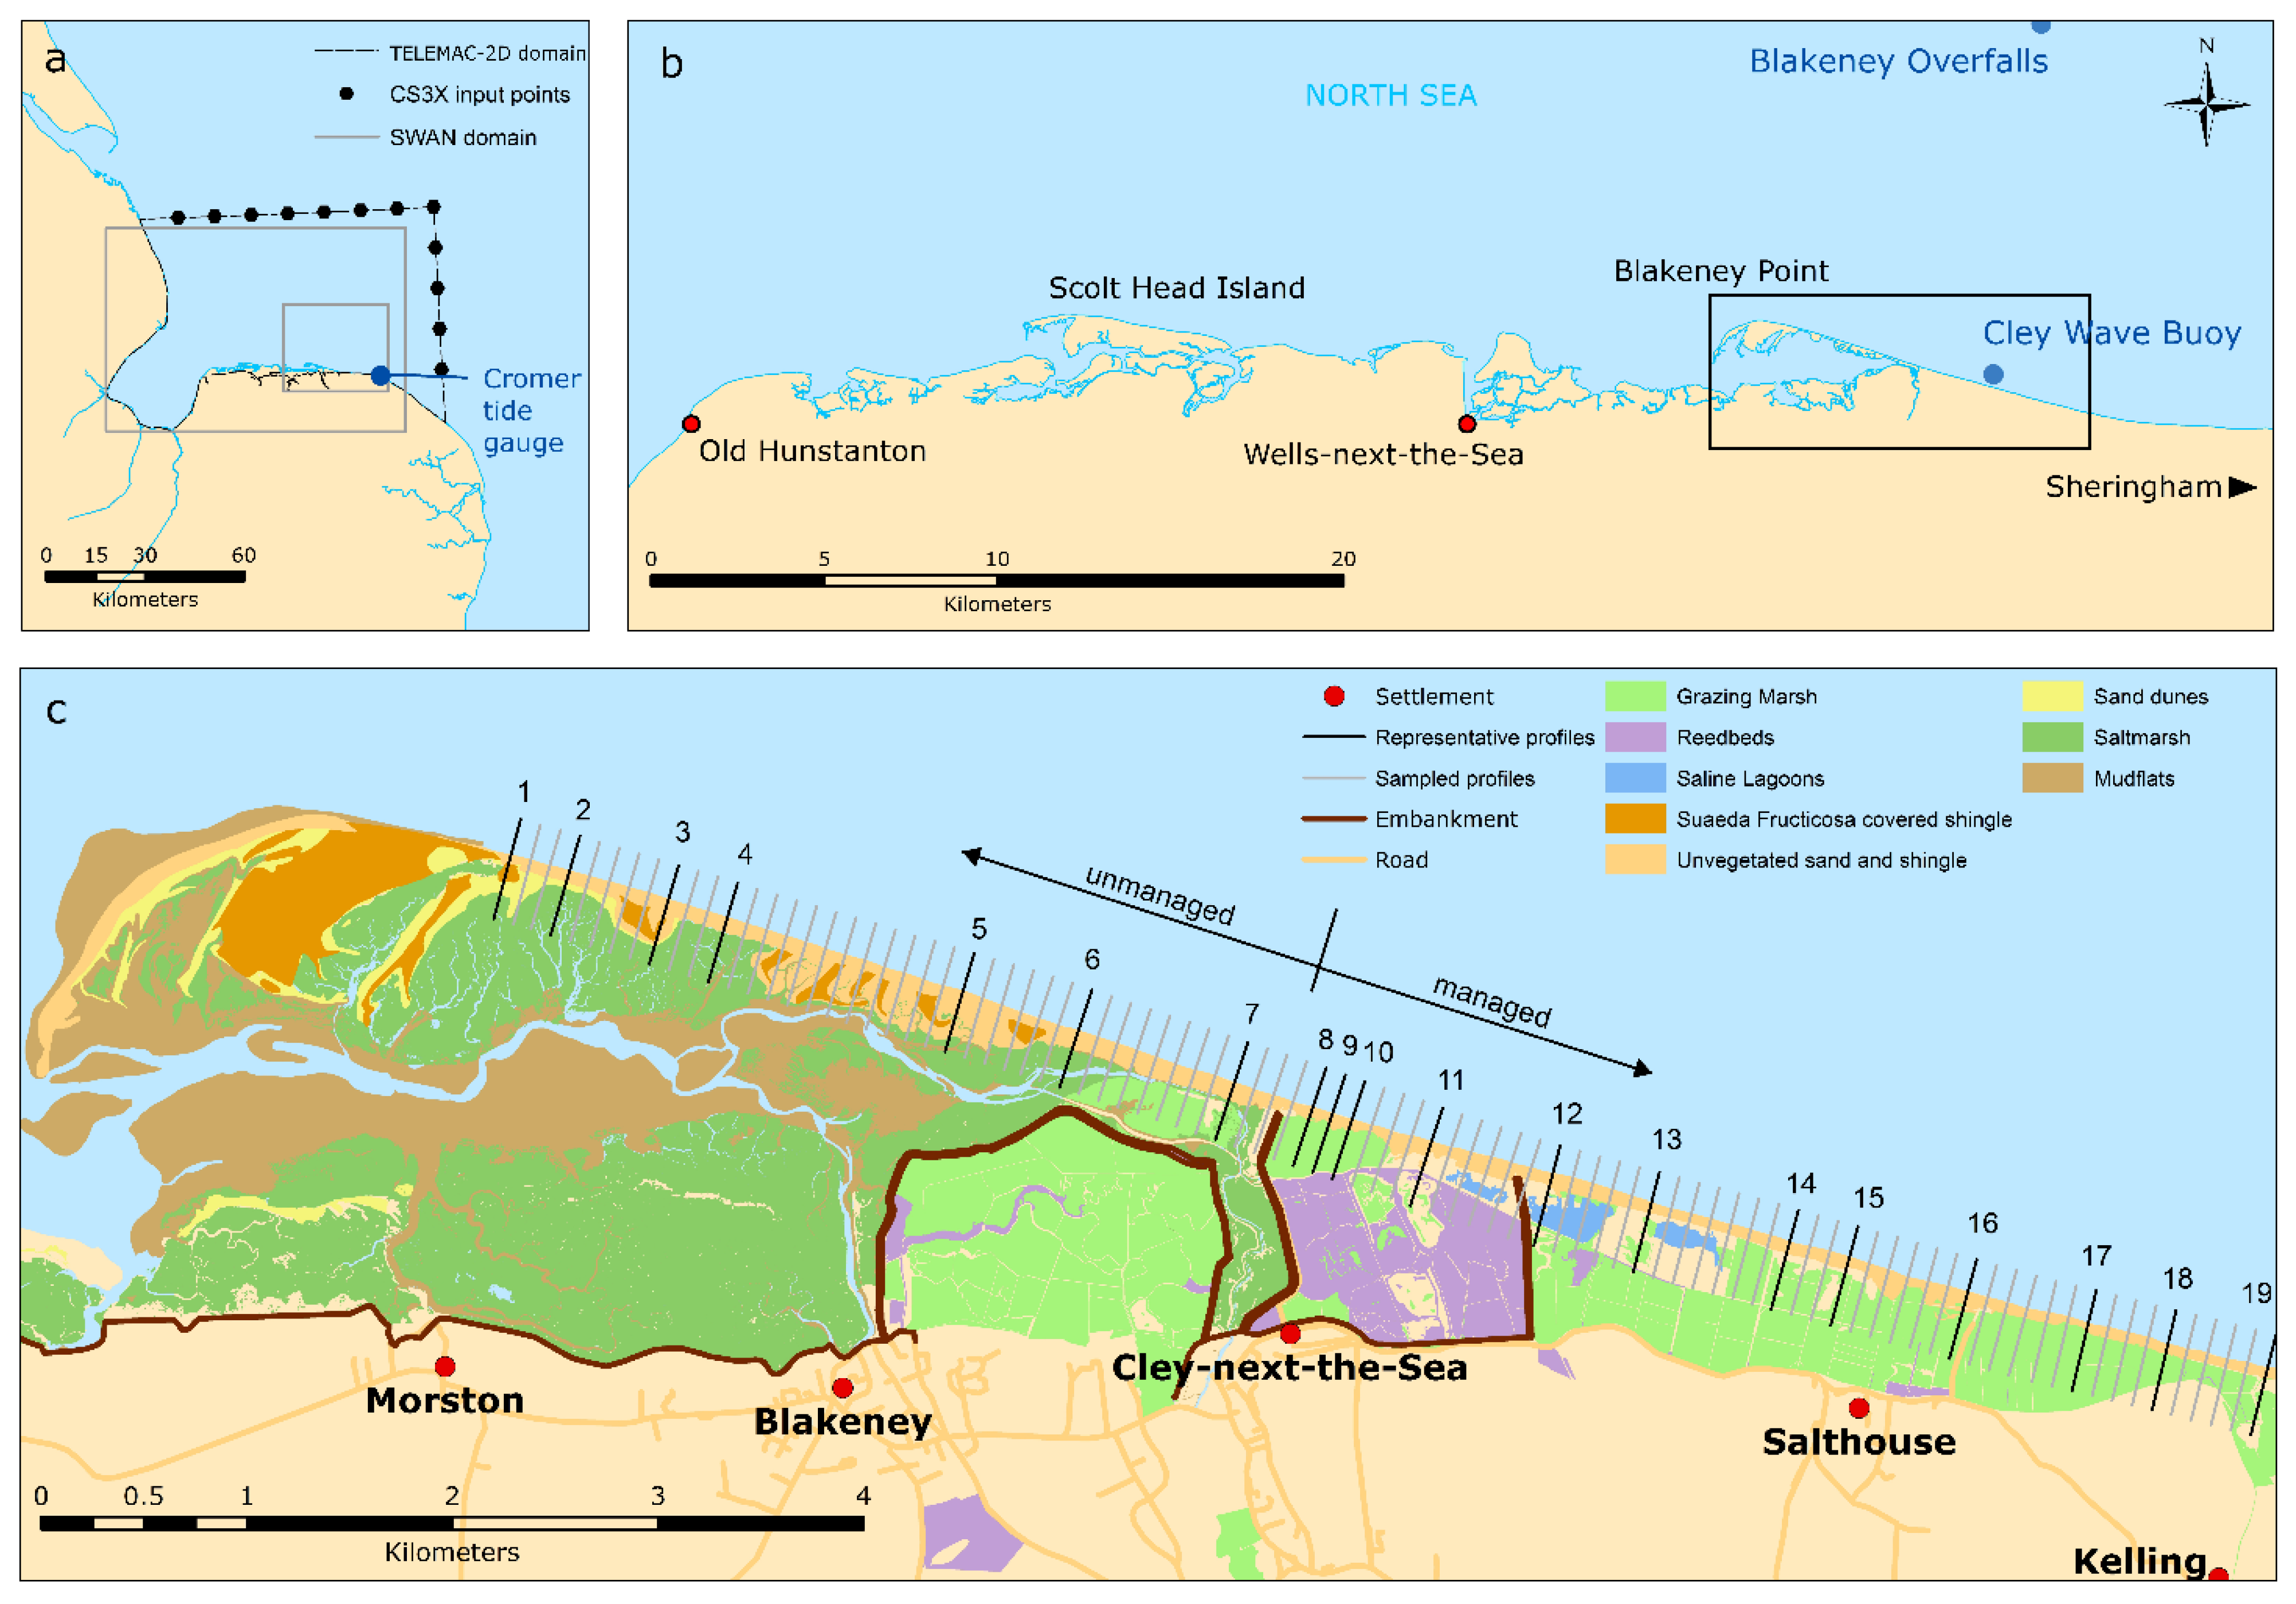
These questions are investigated over the period 2005–2014 through reference to the Blakeney Point Barrier System (BPBS), a barrier beach and spit complex located on the North Norfolk coast, U.K. (Figure 1a,b).
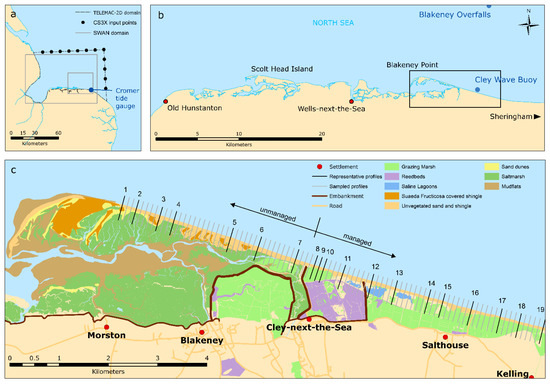
Figure 1.
The Blakeney Point Barrier System: (a) U.K. east coast showing TELEMAC-2D and SWAN model domains, CS3X input nodes and Cromer tide gauge; (b) the North Norfolk coast showing Blakeney Overfalls and Cley wave buoys; (c) the Blakeney Point Barrier System (BPBS) with indicative management regime zones, habitat types, coastal defense structures, road network, and settlements. Grey shore–normal transects indicate sampled cross-shore profiles which were used to determine selection of representative profiles for XBeach-G modeling (indicated as black shore-normal transects). The two 5 December 2013 breaches occurred to the east of profile 13 and profile 15.
2. Regional Setting and Study Location
The North Norfolk coast experiences a macro-tidal, semi-diurnal tidal regime, with the mean spring tidal range falling from 6.4 m at Hunstanton to 4.7 m at Cromer [48]. Under typical conditions, the wind climate is predominantly south-south westerly, with wind speeds rarely exceeding 16 m s−1. This results in a moderate wave climate, as recorded at the Cley-next-the-Sea (hereafter, Cley) wave buoy (7 m water depth, 400 m offshore; Figure 1b) where the annual mean significant wave height has varied between 0.55–0.72 m over the period November 2006–November 2009 [49]. During the same period, offshore mean significant wave heights at the Blakeney Overfalls wave buoy (25 m water depth, 10.5 km offshore; Figure 1b) were 0.8–1.0 m [49].
The Blakeney Point Barrier System (BPBS) begins where the Cley–Salthouse barrier departs the mainland at Kelling Hard at an angle of 16 degrees [50] and extends westwards for approximately 6 km, terminating offshore between the villages of Stiffkey and Morston (Figure 1c [51]). Initially, to the east, the BPBS is backed by brackish, freshwater, and grazing marsh, but further west the Blakeney Channel inlet exposes the back-barrier area to tidal influence. In places to the east, the marshes incorporate low hills, or “eyes”, formed of sediments from the last (Devensian) glaciation, most notably at Gramborough Hill, against which barrier gravels are now banked. Beach and aeolian sand deposition gives the terminus of the barrier (referred to as Blakeney Point) a different character from the mixed sand–gravel Cley–Salthouse barrier to the east [52].
Today, the BPBS can be broadly divided into two sections according to the different management interventions (Figure 1c). To the east of Cley, the barrier was actively re-profiled from the 1950s to maintain the crest height at 8–9 m Ordnance Datum Newlyn (ODN, where 0.0 m ODN approximates to the mean sea level) [29]. Barrier crest re-profiling was terminated after the winter of 2005, allowing the barrier to respond more naturally to hydrodynamic forcing conditions. To the west of Cley, the barrier has remained unmanaged at all times; it is characterized by a crest height of 5–6 m ODN [29].
Presently, the BPBS provides flood protection to the landward communities of Salthouse (0.65 km landward of the barrier crest), Cley (1.0 km), Blakeney (1.7 km), and Morston (2.4 km). This protection is important for these communities during relatively infrequent storm surge events. In the period 1883–2014, twenty-one surge events were identified as having substantial societal impacts [53]. Along the Cley–Salthouse barrier, the elevated water levels and energetic wave conditions associated with storm events have frequently resulted in gravel barrier overwashing. Such behavior was observed following storm surges during the winter of 1910–1911 [51,54], on 14 September 14 1916 [55], 31 December 1921 [56], 31 January 31–1 February 1953 [57,58], 11 January 1978 [59,60], 1 January 1995, and 19 February 1996 [53]. The most extreme morphological response to storm surges exhibited at the BPBS is barrier breaching. The Cley–Salthouse barrier is vulnerable to breaching; this behavior was documented following surge events in 1897, 1938, 1949, 1953, 1978 and 2013 [58,61].
On 5 December 2013, during the stormiest winter in a 143-year record for the British Isles [62], the BPBS was impacted by a storm surge event that has been characterized elsewhere as the most severe to affect the east coast of the U.K. in the past 60 years [61]. The surge residual recorded at Immingham tide gauge was 1.97 m (the closest gauge at Cromer failed during the event itself) and peak wave heights of 3.8 m were recorded at the Blakeney Overfalls wave buoy. In addition to extensive washover deposition, the 5 December 2013 event resulted in two breaches along the Cley–Salthouse barrier. The breaches occurred directly opposite Salthouse, and approximately 1 km to the west, seaward of the Blakeney Freshes reedbeds at Cley (Figure 1c); each was just under 100 m wide. Following the event, both breaches were sealed by 24 January 2014, most likely the result of strong, persistent easterly winds and associated longshore sediment transport [61].
3. Datasets and Modeling Approach
The Blakeney Point Barrier System was selected for this study given observed morphological changes following recent storm surge events, and the presence of two alternative management regimes. Each section of the BPBS is characterized by similar basement geology, sediment composition, and vegetation communities. Accordingly, the methods described below focus on distinguishing the influence of differing management regimes during the December 2013 storm surge event.
We began by analyzing representative cross-shore profiles, extracted from LiDAR datasets, to examine the impact of extreme hydrodynamic conditions on gravel beach morphology. We then performed numerical modeling to quantify the relationship between barrier morphological change and landward overtopping volume.
3.1. Analysis of Representative Cross-Shore Profiles from LiDAR
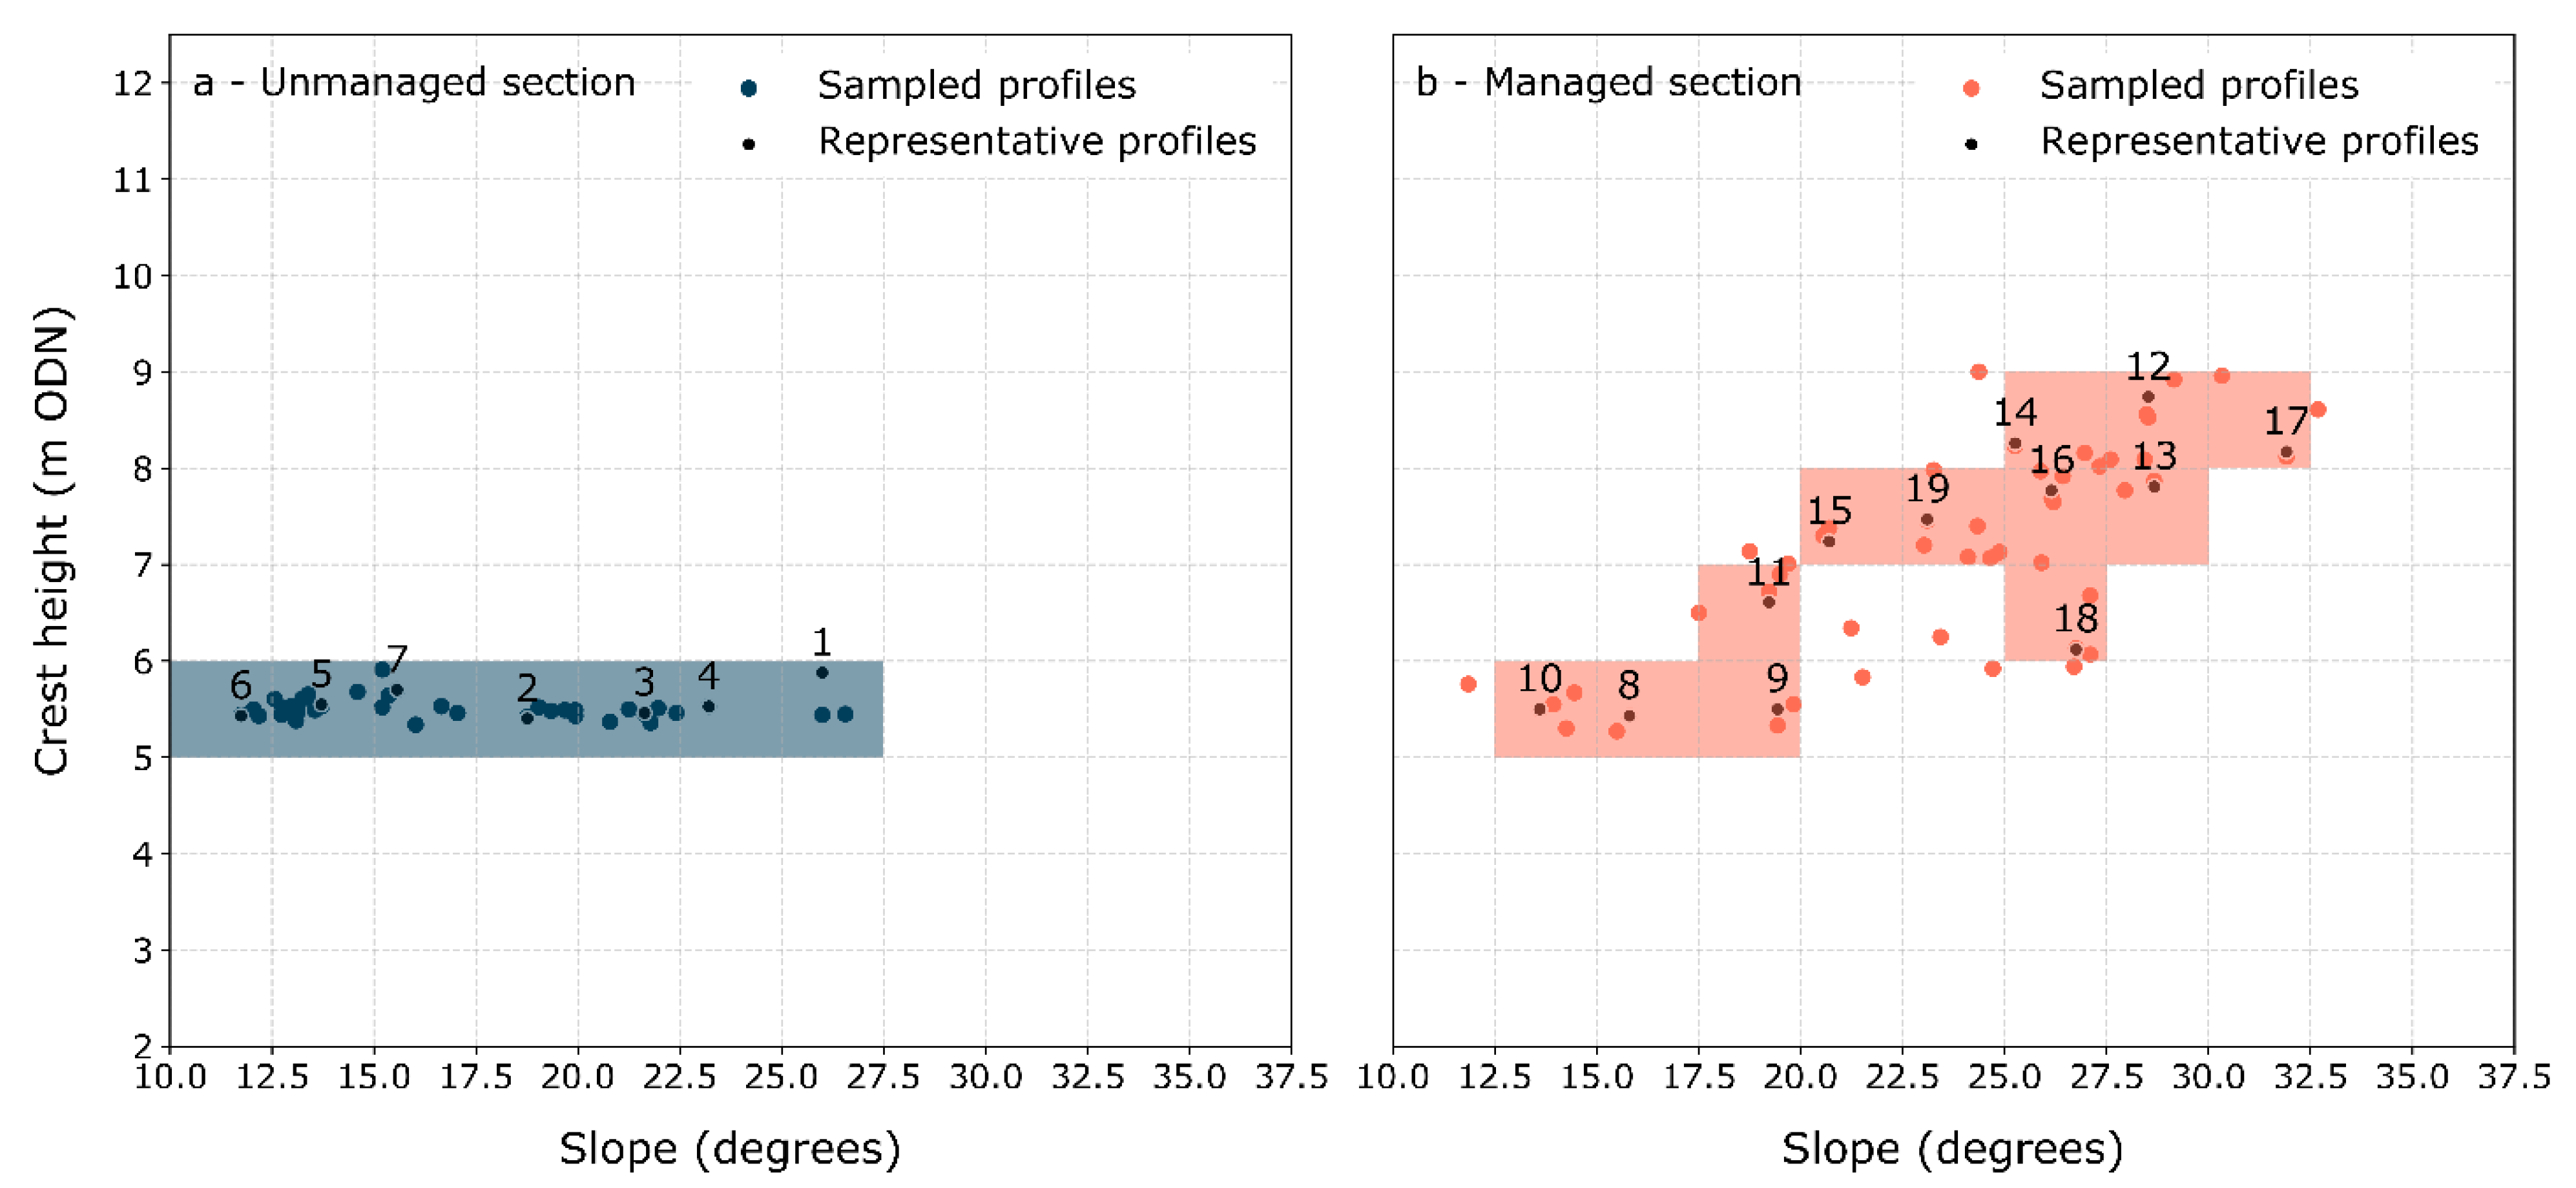
LiDAR DTMs (Digital Terrain Models) were collected by the U.K. Environment Agency 11 months prior to the December 2013 event (28 January 2013) and two months after the event (3 February 2014) and obtained from the Defra Data Service Platform [63]. Cross-shore profiles were extracted from LiDAR DTMs along the BPBS frontage at an alongshore spacing of 100 m, giving a total of ninety profiles (Figure 1c). Profiles were categorized by management regime, crest elevation, and beach slope. Seaward beach slope was calculated at 0.25 m either side of the point where the Mean High Water Line (MHWL) intersected with each profile. Representative profiles (7 unmanaged, profile IDs 1–7; and 12 managed, profile IDs 8–19) were then selected using a matrix of these conditions (crest elevation interval of 1 m, beach slope interval of 2.5 degrees) (Figure 2). When selecting a single profile to represent each shaded square, an effort was made to achieve even spatial coverage along the BPBS frontage. Crest elevation was highly consistent in the unmanaged section, with all the 39 sampled profiles falling within the shaded area (Figure 2a). Crest elevation and beach slope were more variable in the managed section of the spit, compared to the unmanaged section, necessitating a greater number of representative profiles. For the managed section, 86% of the 51 profiles were encompassed by the shaded area (Figure 2b).
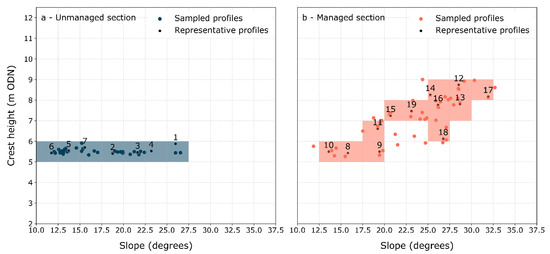
Figure 2.
Scatter plots of crest height and seaward beach slope: (a) unmanaged profiles along the BPBS; (b) managed profiles along the BPBS. Shaded areas indicate the crest height and beach slope combinations chosen to ensure representation along the BPBS frontage.
The representative profiles were characterized by pre-surge crest height and cross-sectional area (calculated as barrier cross-sectional area above the Mean High Water Spring (MHWS) datum, a two-dimensional equivalent to the concept of “inertia” discussed in ref [16]). To capture impacts resulting from the December 2013 storm surge, post-surge crest heights and morphological changes were also determined.
3.2. Modeling Overtopping Volume and Morphological Change from the December 2013 Storm Surge
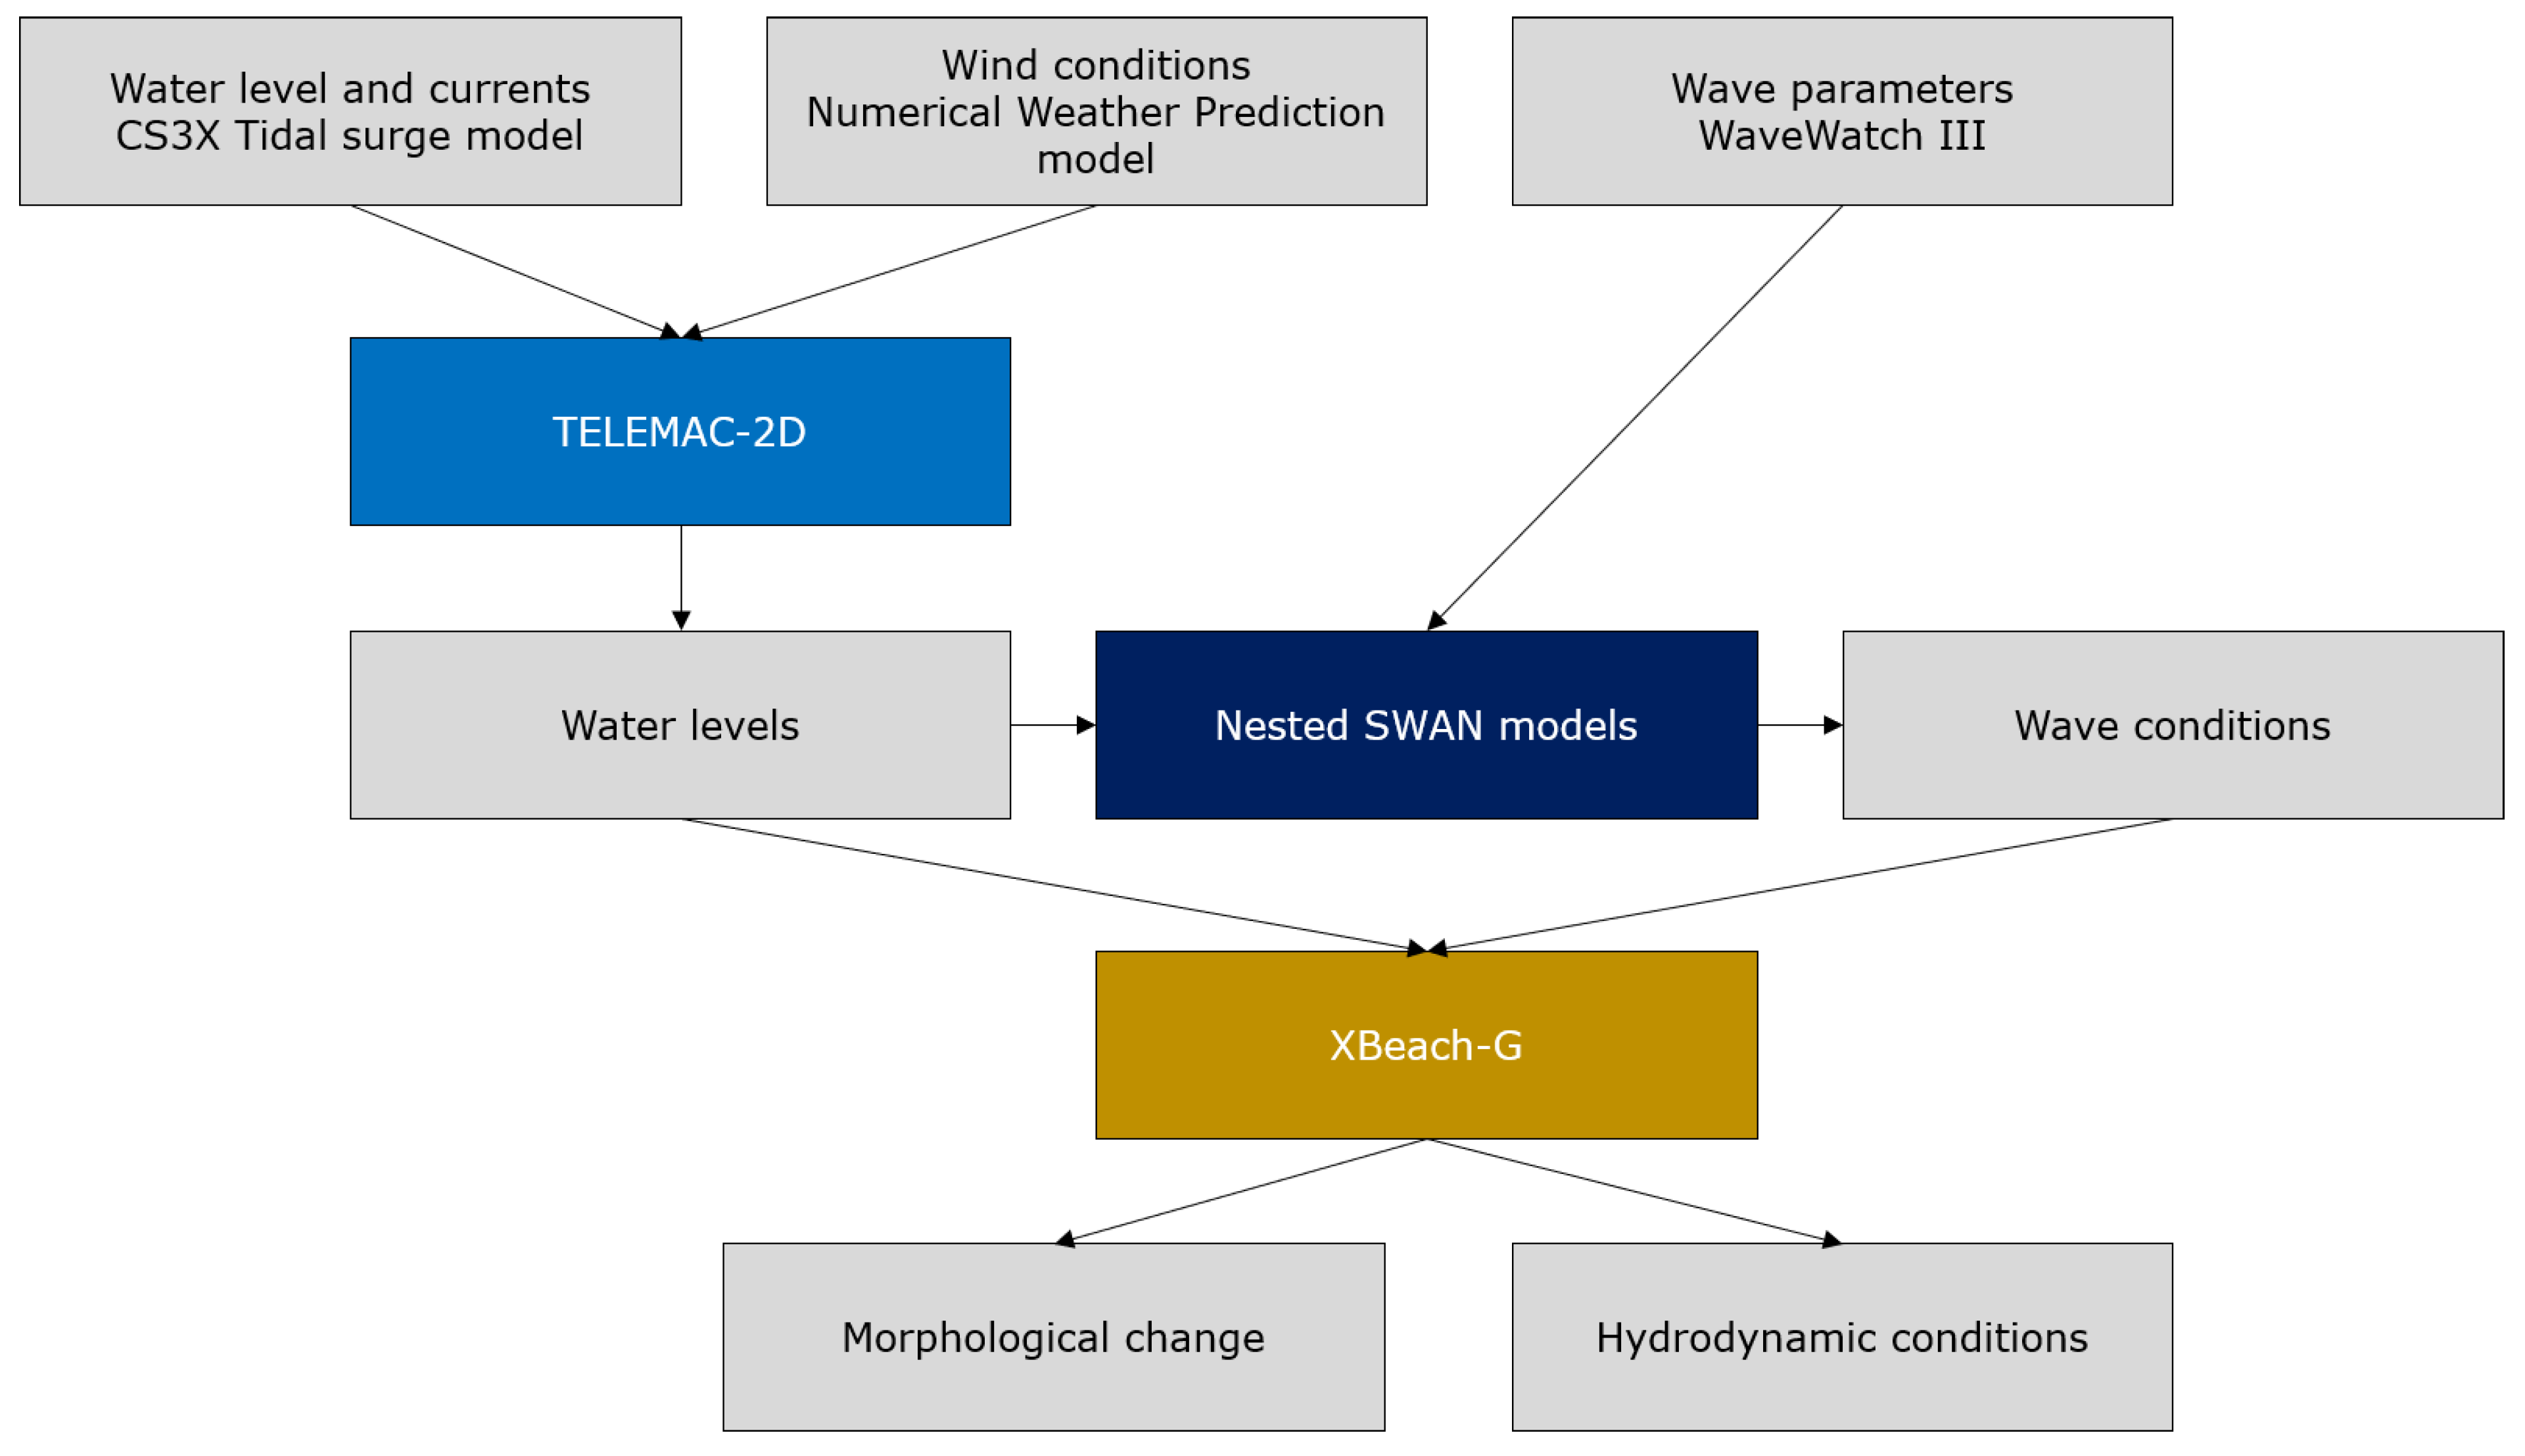
To investigate hydrodynamic and morphological processes during the December 2013 storm surge, a numerical model chain was devised, taking as its starting point an existing model chain developed for the North Norfolk coast (Figure 1a, Figure 3 [64]). Nearshore water level and wave modeling was undertaken to increase the accuracy of nearshore hydrodynamics, and to allow for spatial variations in these inputs arising from a complex nearshore bathymetry. Firstly, water levels were modeled over a regional scale (Figure 1a) using TELEMAC-2D (v7p1r0), part of the TELEMAC-MASCARET modeling suite [65]. Secondly, the water levels, wind conditions, and offshore waves were used to drive a nearshore wave model using SWAN (v41.20) (Figure 1a [66]). Finally, outputs from TELEMAC-2D and SWAN were used as boundary conditions for XBeach-G, a 1D, coupled hydrodynamic and morphodynamic model for investigating extreme event impacts at specific cross-shore points on gravel barriers [67,68].
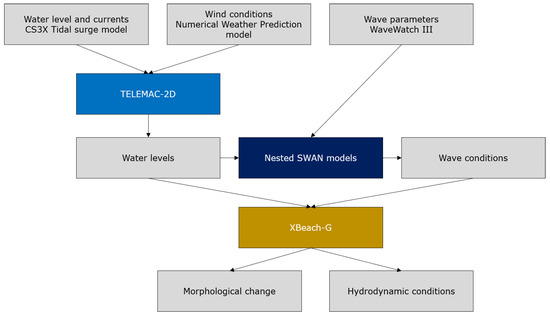
Figure 3.
Numerical modeling framework displaying flow of data from TELEMAC-2D to nested SWAN models to XBeach-G outputs.
The TELEMAC-2D model domain extended to approximately 50 km offshore of the BPBS and covered a total area of 4750 km2 (Figure 1a). An unstructured mesh was used to achieve efficient scaling from low resolution offshore inputs (ca. 12 km) to higher resolution at the coast (ca. 200 m). The mesh consisted of 5759 nodes and 10,704 elements. The onshore boundary was defined by the +7.5 m ODN contour. Using an onshore boundary further inland than the shoreline itself helped to avoid over-prediction of nearshore water levels [69].
Hourly water level and velocity input at the offshore boundary came from the U.K. National Oceanography Centre CS3X tidal surge model hindcast [70]. Temporally and spatially variable wind field data were obtained from the U.K. Met Office Numerical Weather Prediction model [71]. Wind data were interpolated, using a linear interpolation, to create a continuous wind field dataset. Offshore bathymetry was obtained from the U.K. Hydrographic Office (UKHO [72]) and combined with coastal zone topography data [63,73] to produce an elevation and depth model for the southern North Sea. To harmonize the bathymetric and topographic datasets, the UKHO Vertical Offshore Reference Frame (VORF) surface was used [74]. Once joined, the elevation data were interpolated using a linear interpolation to create a continuous dataset which was then mapped onto the TELEMAC-2D mesh.
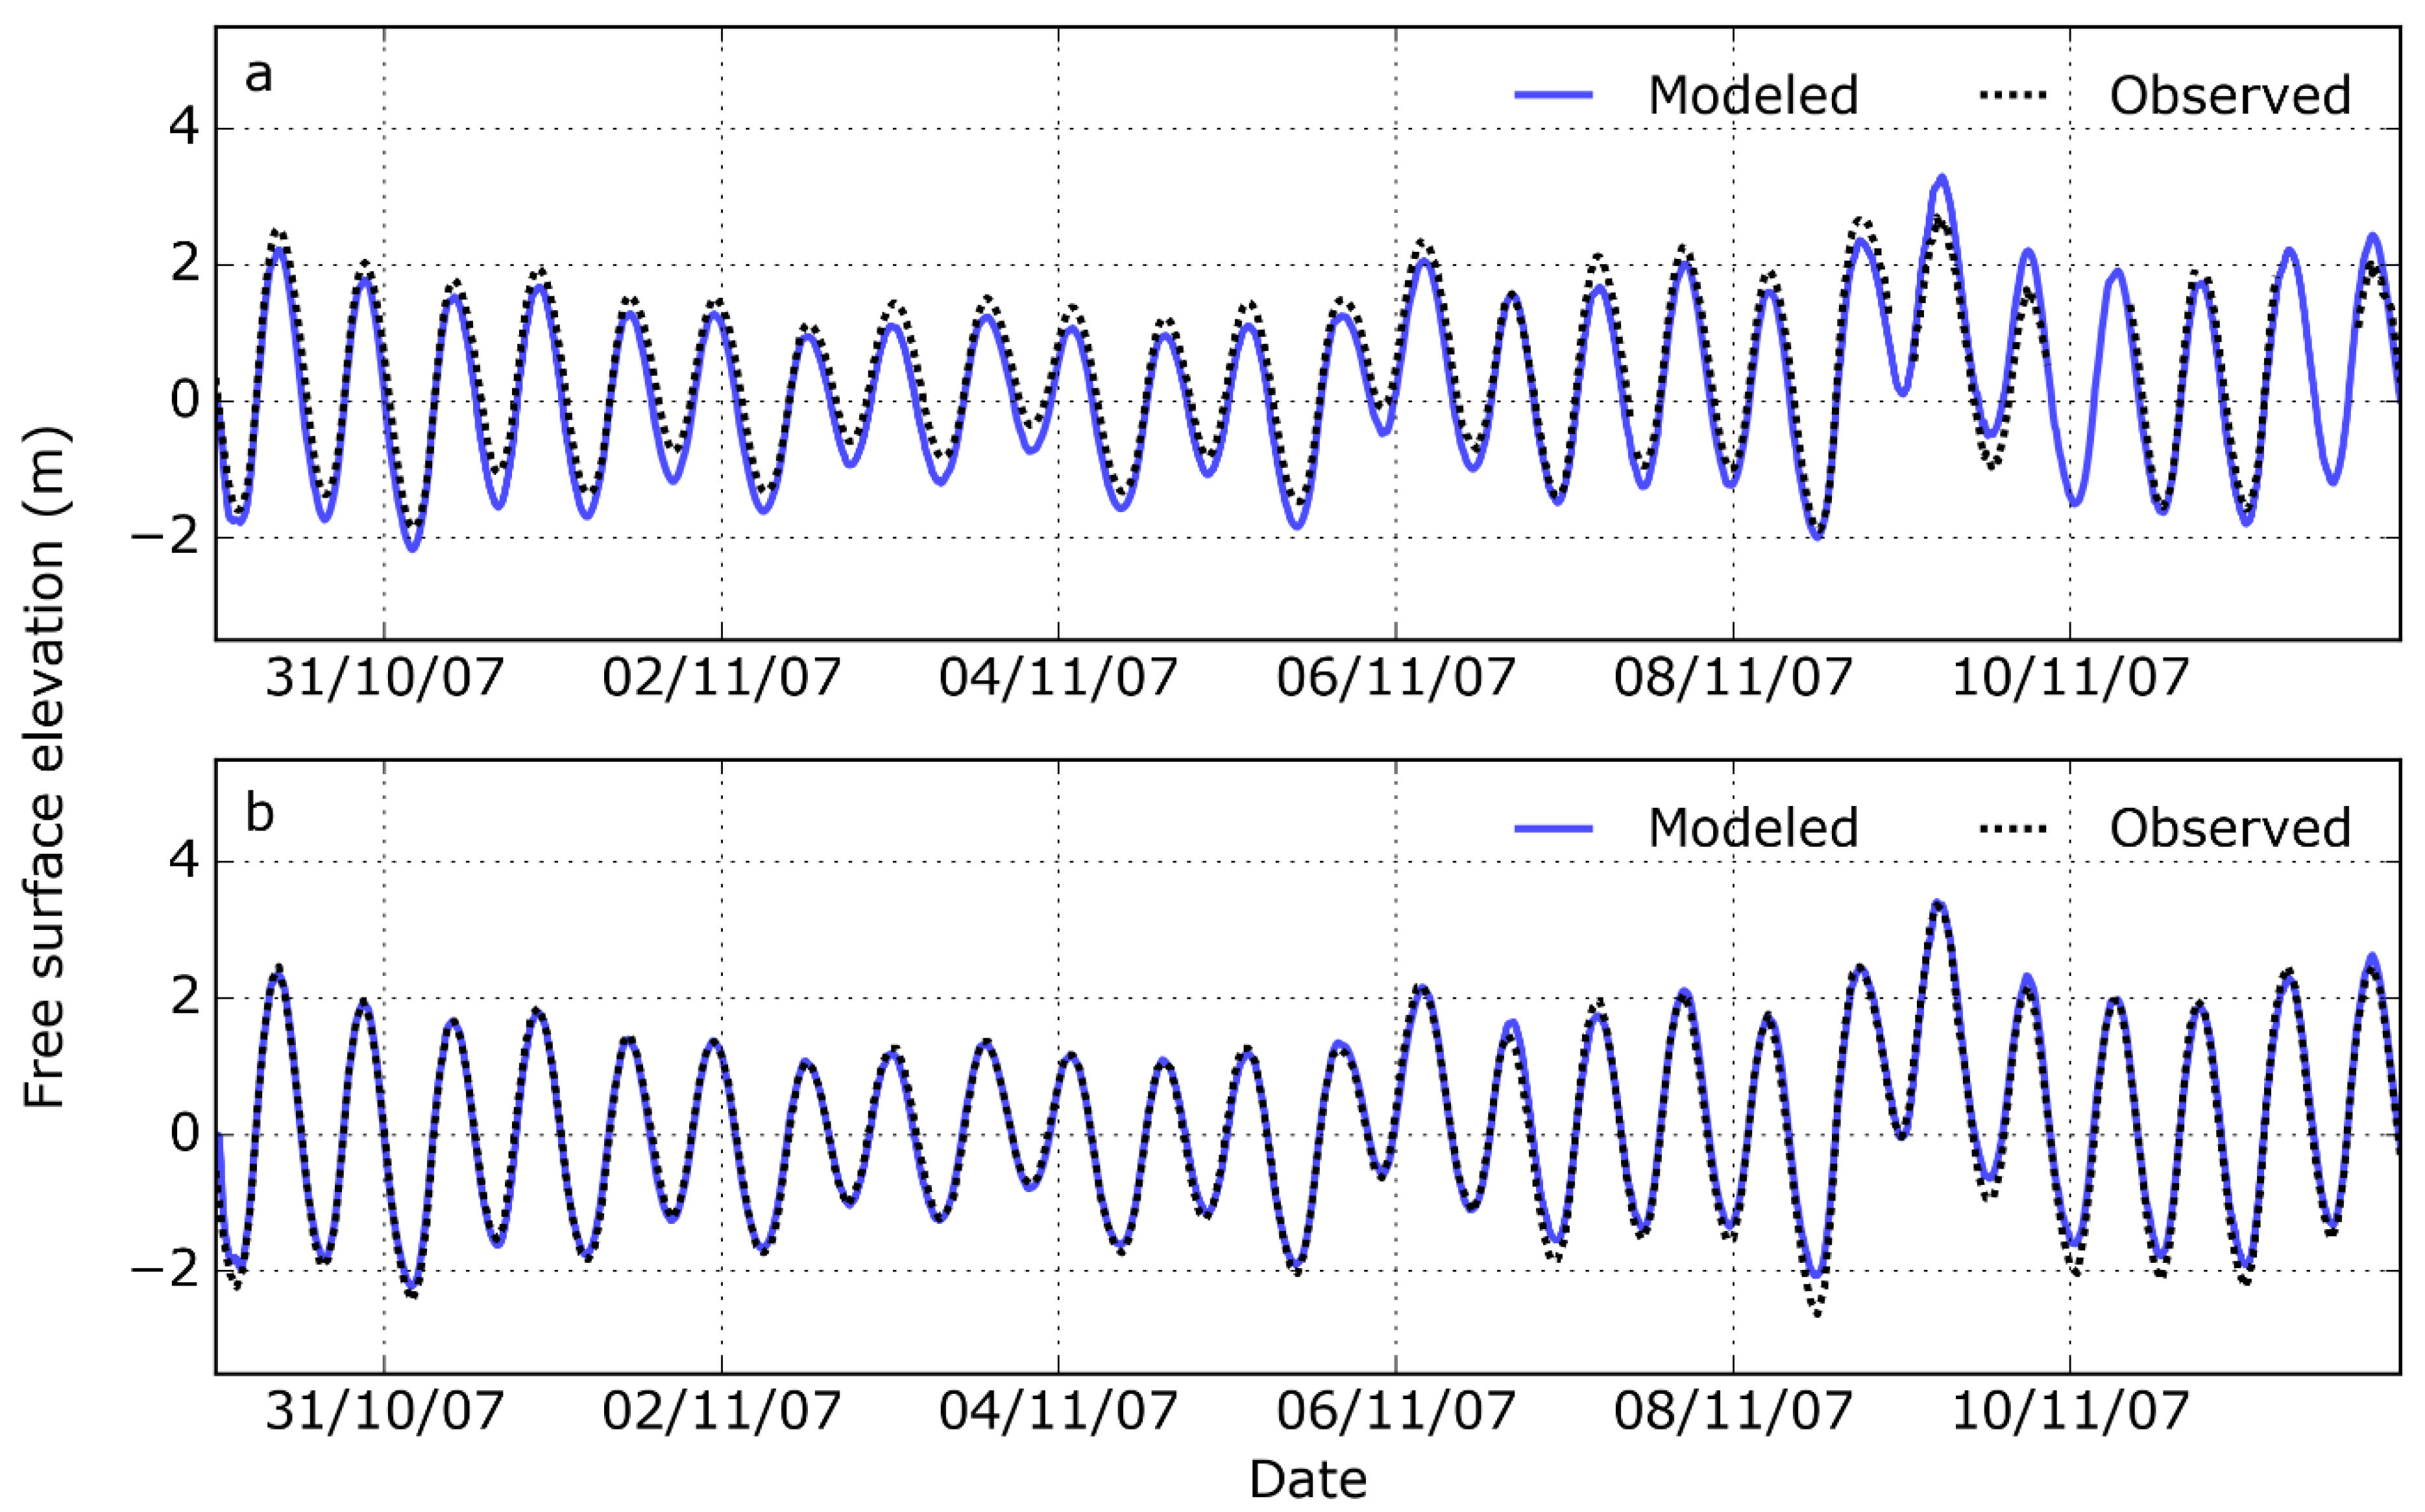
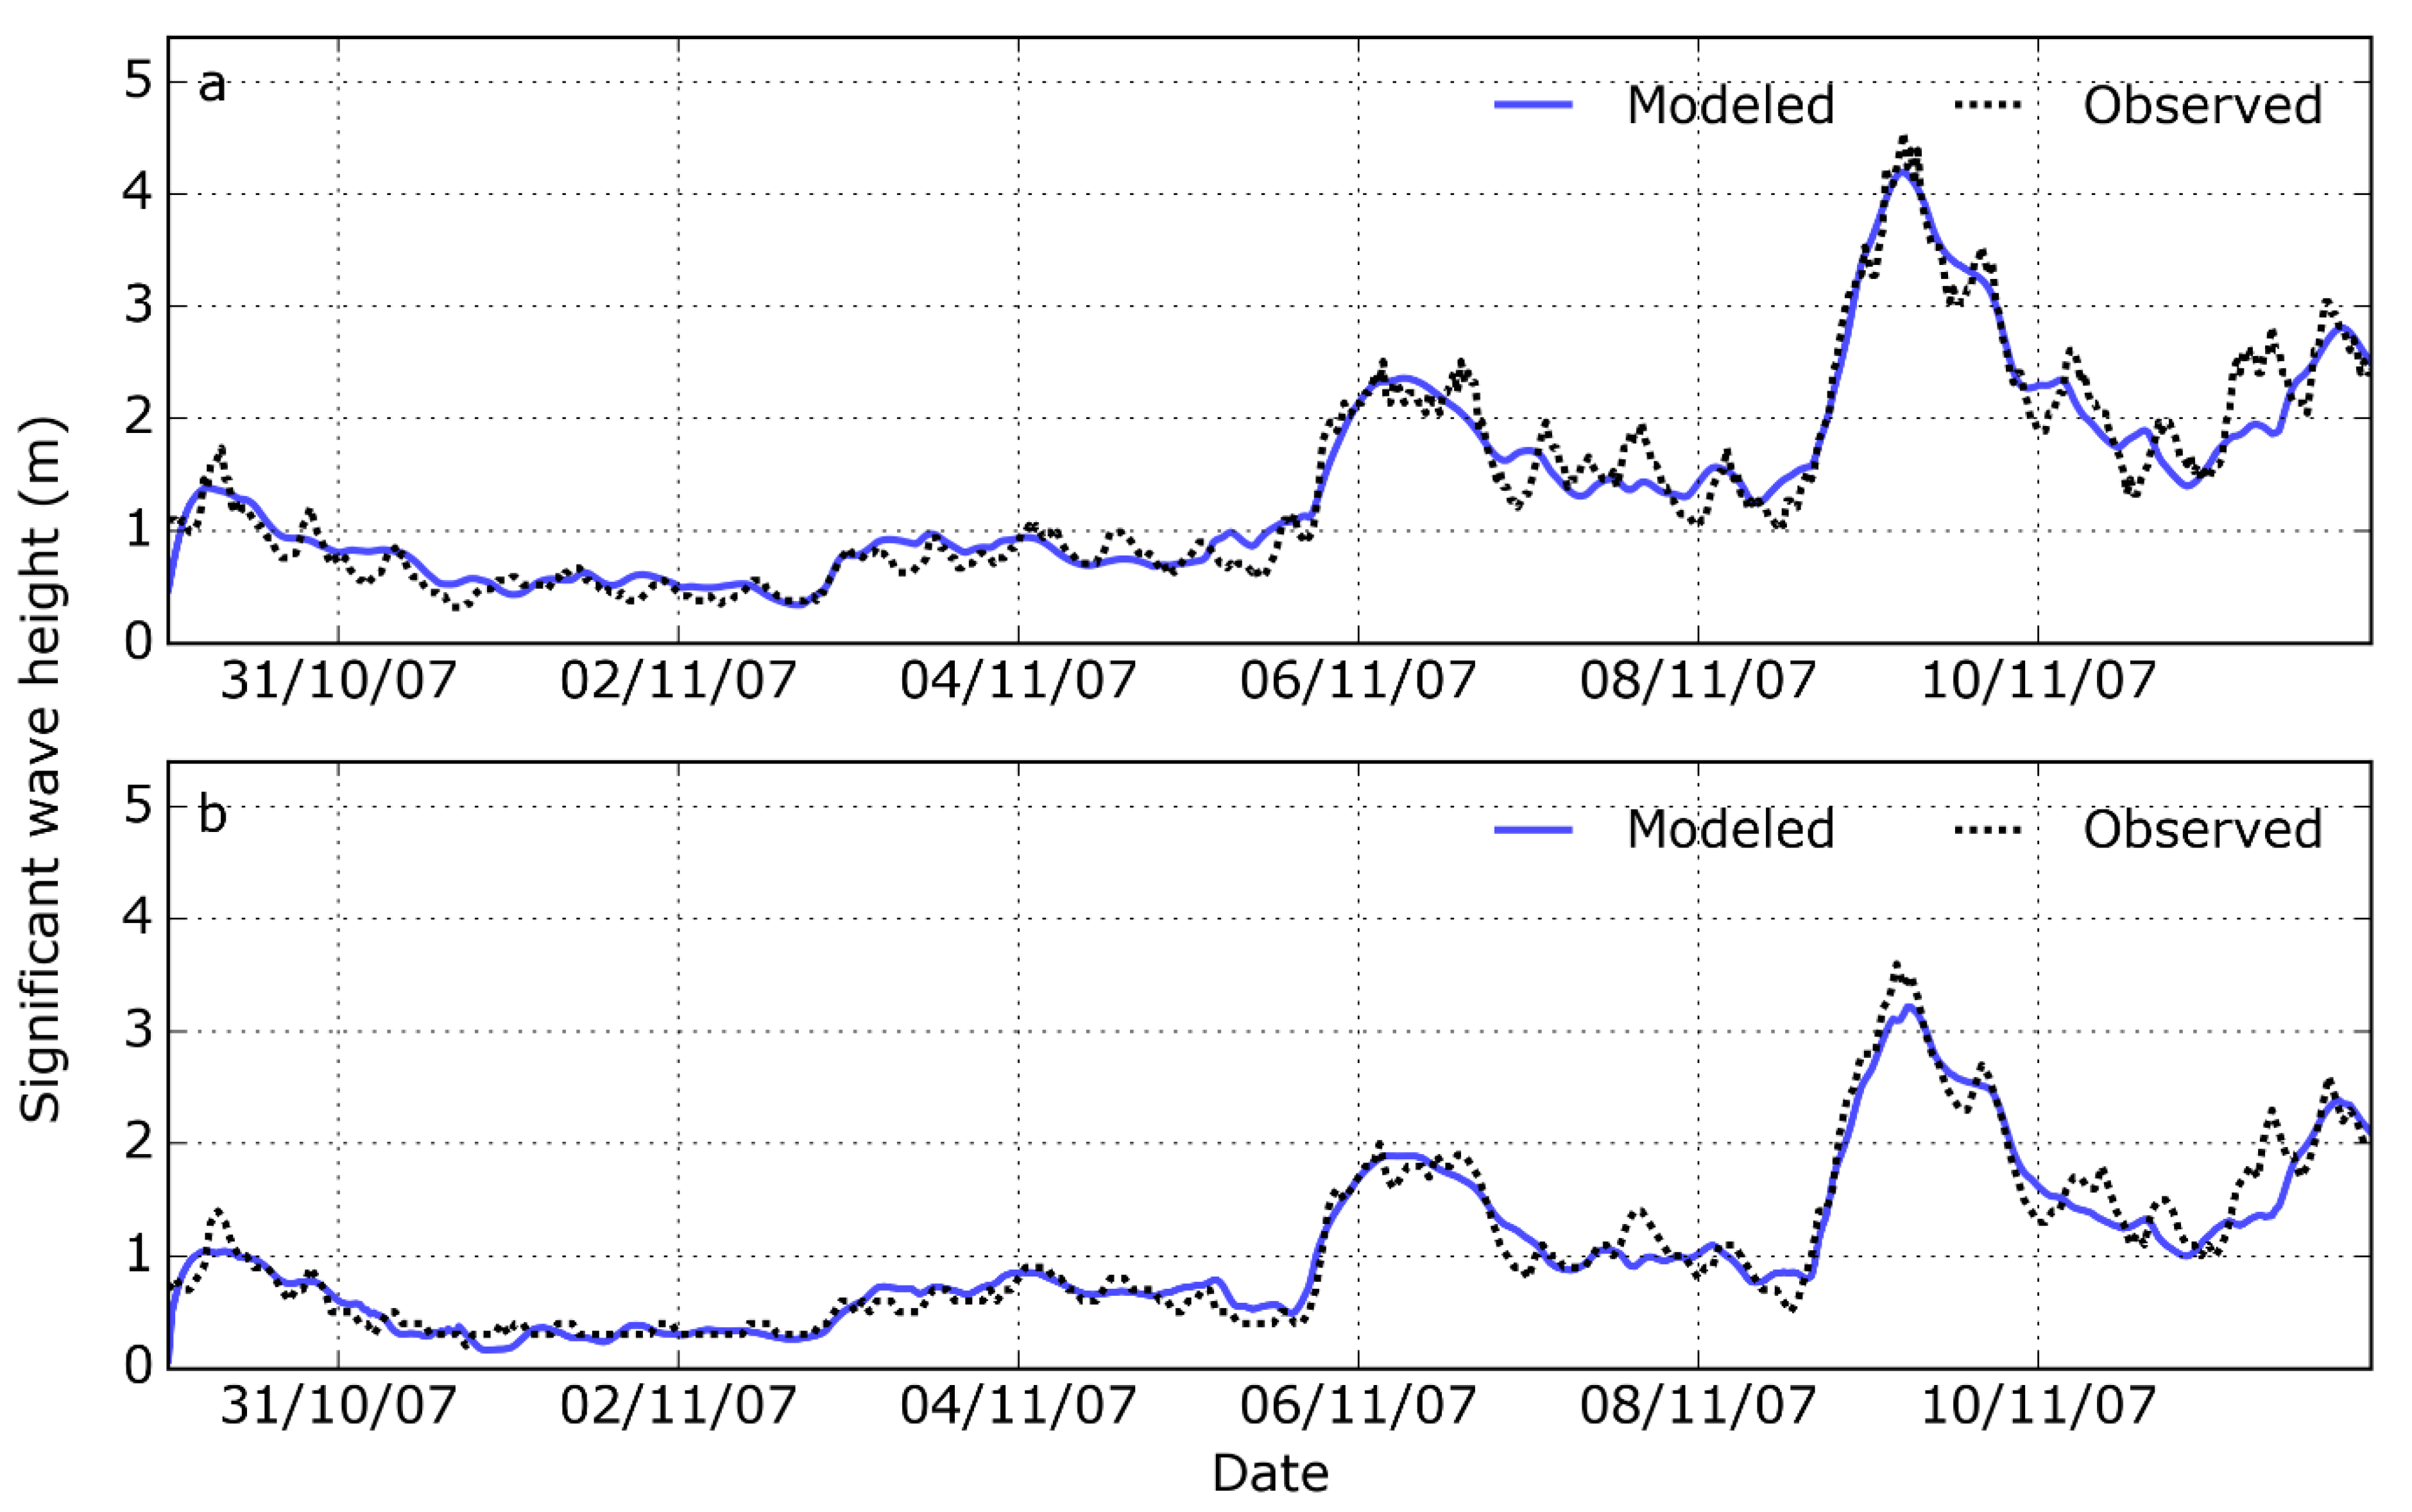
The TELEMAC-2D model was calibrated over a twelve-day period from 30 October 2007 00:00:00 to 11 November 2007 00:00:00 (Figure 4). This period was chosen to coincide with a nearshore wave and tidal monitoring campaign deployed over a three year period (2006–2009) by the Anglian Regional Monitoring Programme [49]. This ensured the availability of wave heights and free surface water elevations for calibration purposes. The twelve-day calibration period captured both calm pre-storm conditions and the 8–11 November 2007 storm surge. This event was the most severe storm surge to impact the North Norfolk coast during the three year monitoring campaign, and has been described as a “near miss” in terms of coastal flooding impacts [53].
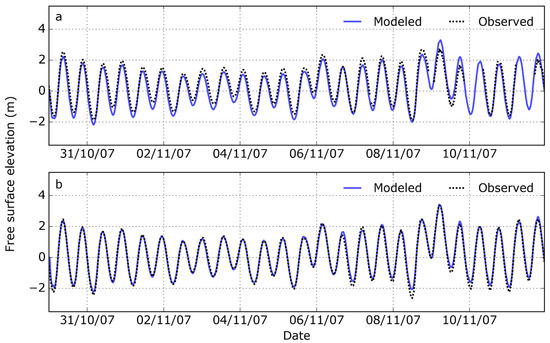
Figure 4.
Comparison of modeled and observed water levels for the period 30 October 2007 00:00:00 to 11 November 2007 00:00:00: (a) Cromer; (b) Cley. RMSE = 0.34 m at Cromer and 0.16 m at Cley. For locations, see Figure 1a,b.
Model calibration was undertaken through a systemic variation of the law of bottom friction and associated friction coefficients, and the Smagorinsky turbulence model was chosen. Model skill was assessed through comparison to instrumented data from the U.K. National Tidal and Sea Level Facility [75] tide gauge at Cromer, 20 km east of the BPBS (Figure 1a), and a shallow water (7 m water depth, 400 m offshore) Acoustic Wave and Current (AWAC) buoy installed at Cley (Figure 1b) over the period 2007–2009 [49]. Calibration runs were judged based on the root mean square error (RMSE; Equation (1)) value for the entire twelve-day period. The Nikuradse law of bottom friction, with a friction coefficient of 0.0125, provided the lowest RMSE values of 0.34 m and 0.16 m at Cromer and Cley, respectively.
For this modeling phase, successive SWAN grids were nested to provide higher accuracy and increased computational efficiency. The larger grid covered 90 × 60 km with a resolution of 5 km while the smaller nested grid covered 32 × 22 km with a resolution of 500 m (Figure 1a). The large SWAN model was forced by wave conditions from the Met Office WaveWatch III North Atlantic European model, which has a spatial resolution of approximately 12 km [76]. Water level and currents were inputted to the large SWAN model from TELEMAC-2D, while water level and currents from the large SWAN model were used as inputs to the small SWAN model using the SWAN nesting facility. Default values were used for the calculation of white-capping, the computation of quadruplets, triad interactions, wave setup, and dissipation by depth-induced wave breaking.
The SWAN model was calibrated for the same period as the TELEMAC-2D model (Figure 5). Outputs from SWAN were calibrated against wave observations recorded at 15-min intervals by the Blakeney Overfalls wave buoy and in the nearshore Cley AWAC buoy (Figure 1b). Outputs from the large computational grid were calibrated against the Blakeney Overfalls buoy, while the outputs of the small grid were calibrated against the Cley AWAC buoy. The Collins wave friction formula, with a coefficient of 0.03, provided the lowest RMSE values of 0.21 m at Blakeney Overfalls and 0.18 m at Cley.
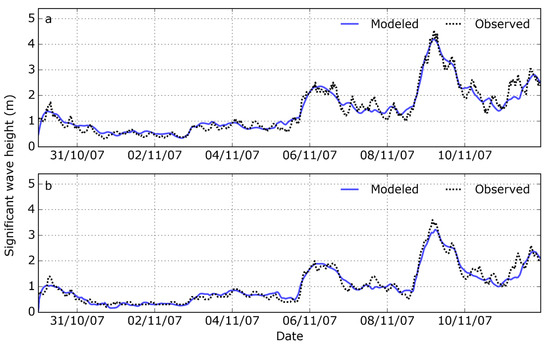
Figure 5.
Comparison of modeled and observed significant wave heights for the period 30 October 2007 00:00:00 to 11 November 2007 00:00:00: (a) Blakeney Overfalls; (b) Cley. RMSE = 0.21 m at Blakeney Overfalls and 0.18 m at Cley. For locations, see Figure 1b.
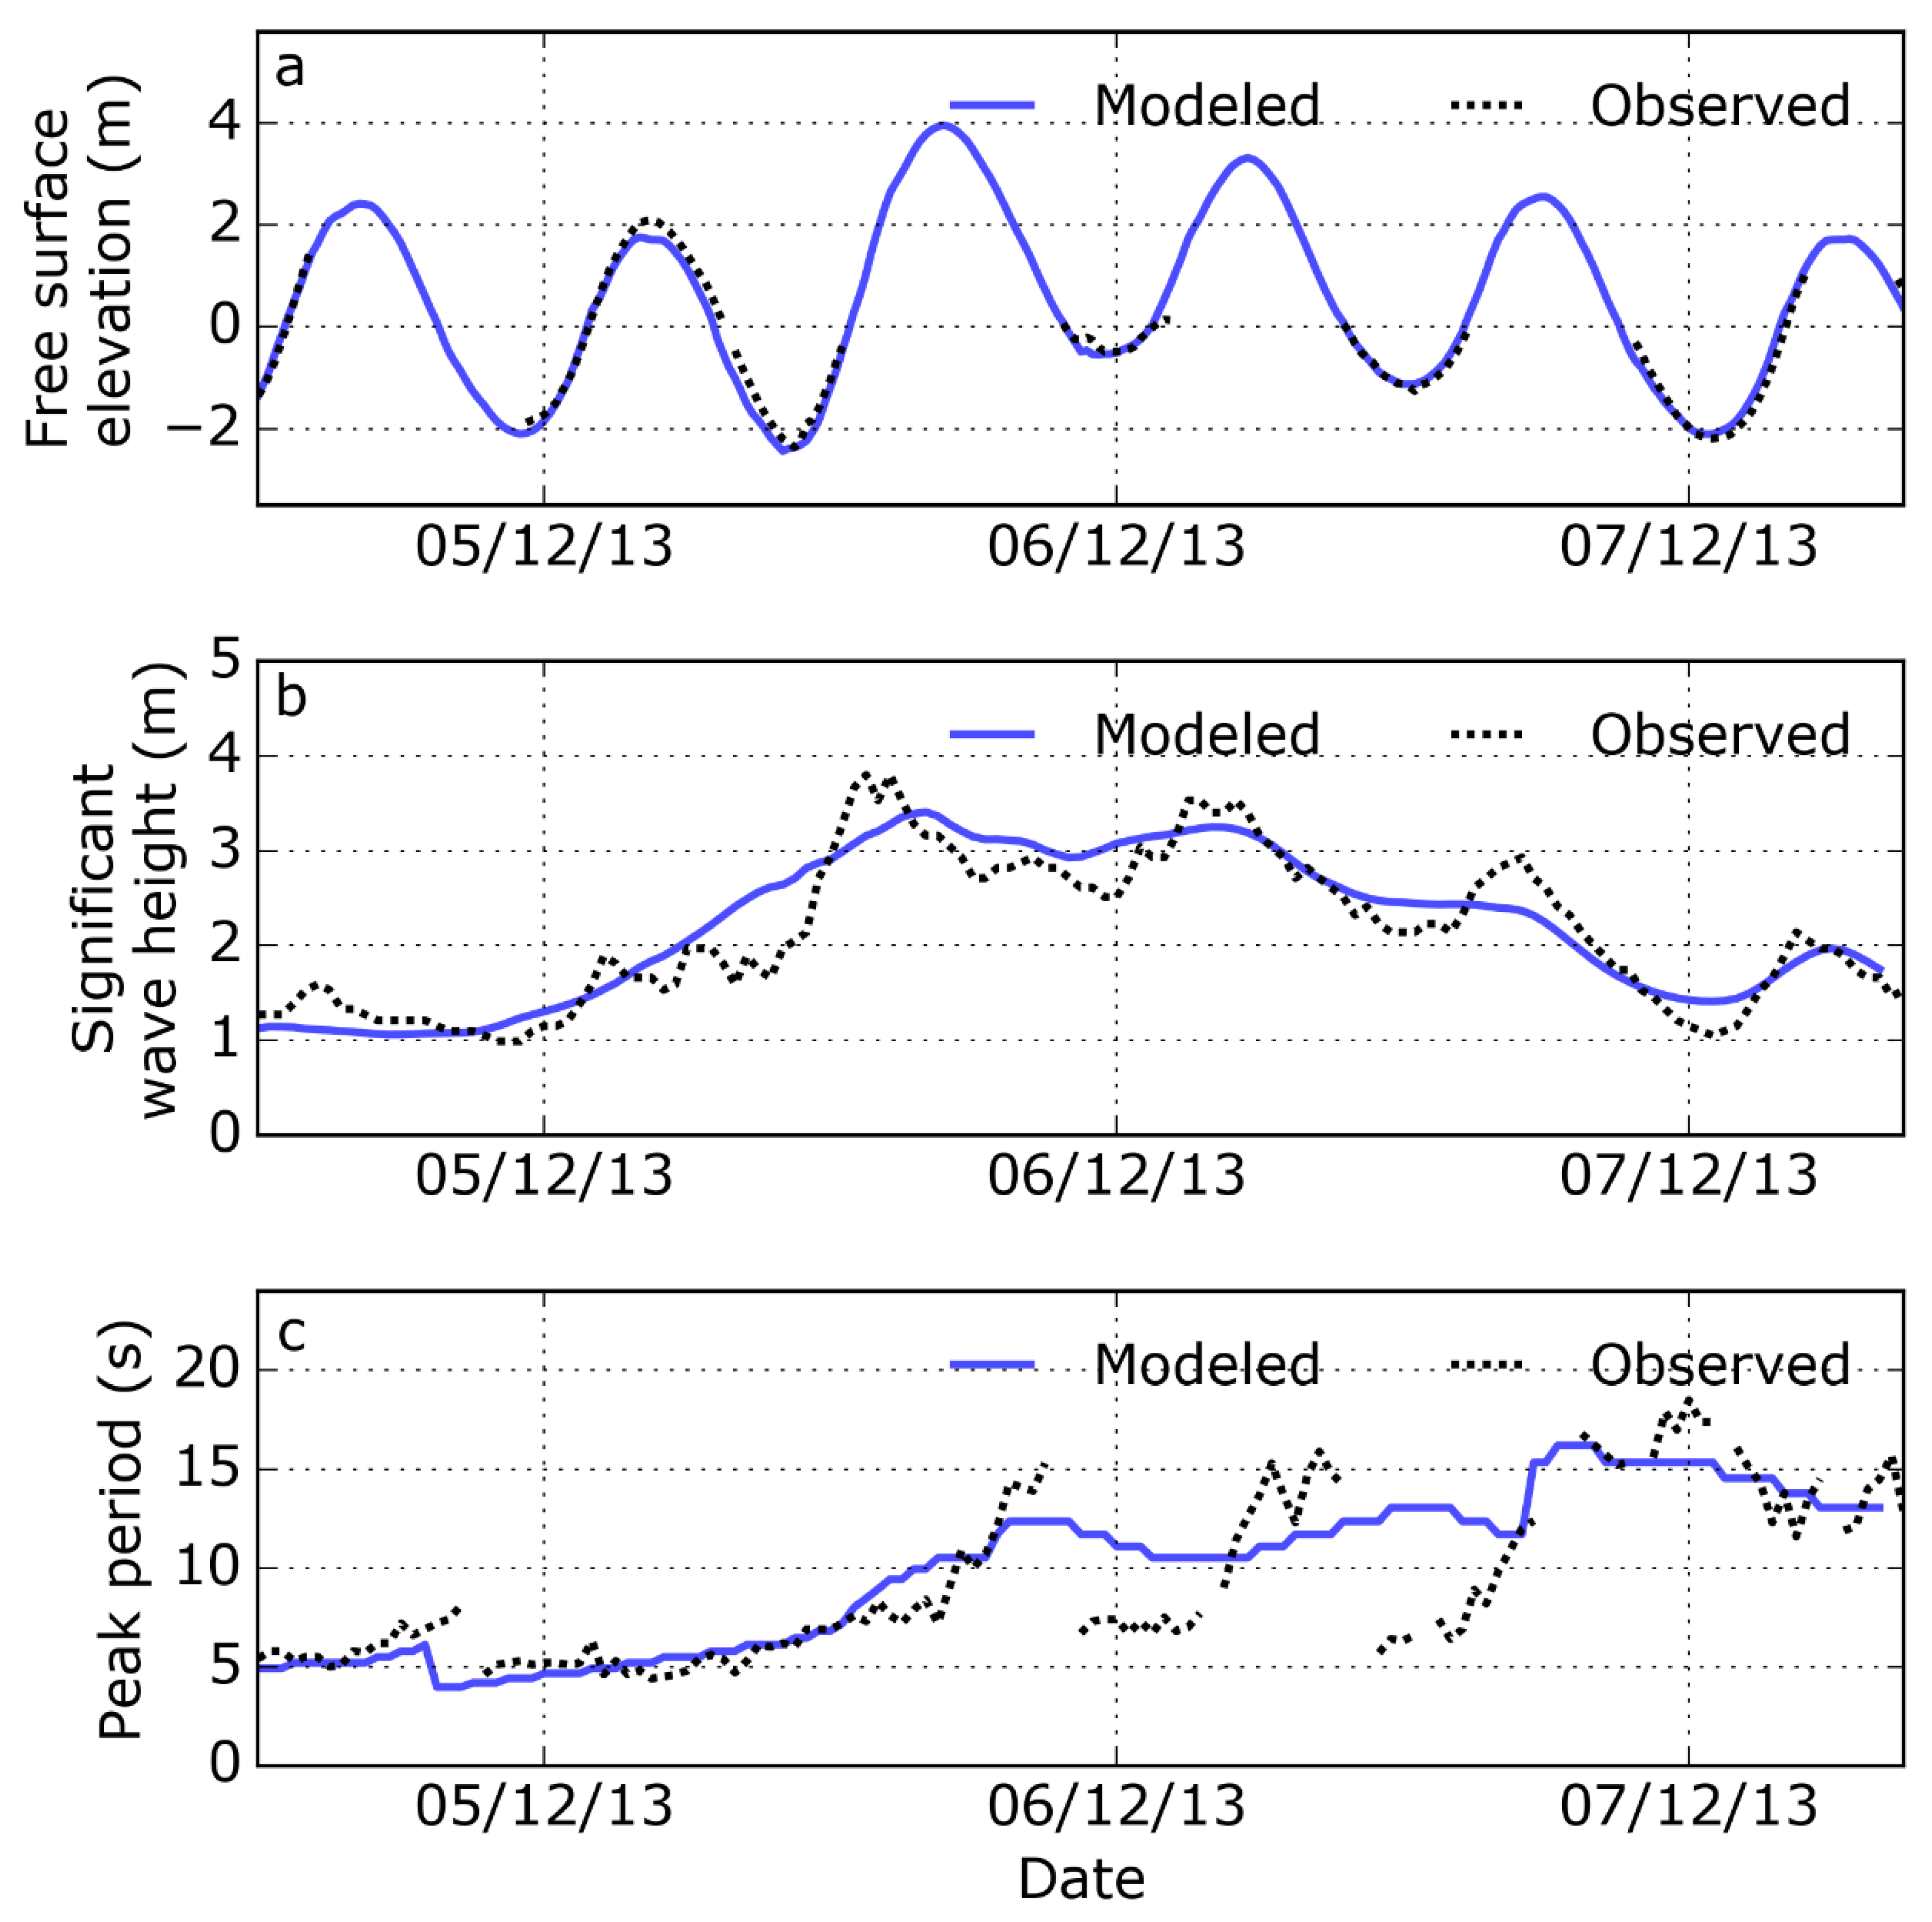
Ideally, the hydrodynamic modeling would have been both calibrated and validated for the December 2013 storm surge. However, this was not possible due to a lack of observational water level data due to damage to the Cromer tide gauge during the storm (Figure 6a). Despite this difficulty, similarities between the November 2007 and December 2013 events confer confidence in the calibration undertaken here.
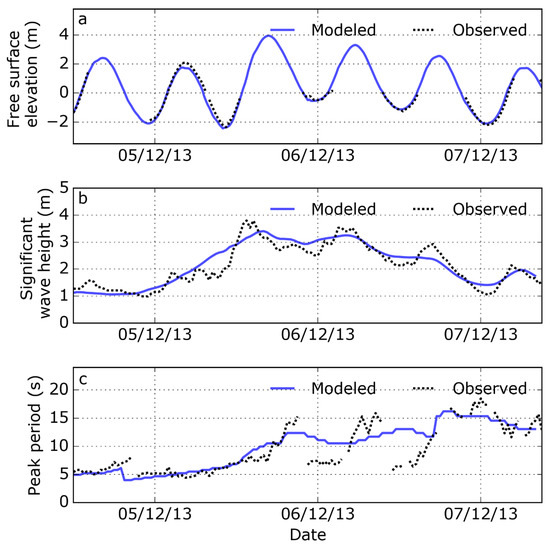
Figure 6.
Comparison of modeled and observed water levels and wave characteristics for the period 4 December 2013 15:00:00 to 7 December 2013 12:00:00: (a) significant water levels at Cromer; (b) significant wave height at Blakeney Overfalls; (c) peak period at Blakeney Overfalls. RMSE = 0.23 m for water levels, 0.30 m for significant wave height, and 2.5 s for wave period. For locations, see Figure 1b.
A water level comparison between the November 2007 and December 2013 events at the Immingham tide gauge (the closest gauge with a complete record for both events) shows maximum still water levels of 3.99 m ODN and 5.22 m ODN for the respective events (see ref [53], Table II). The corresponding maximum surge residual was 1.67 m and 1.97 m for the November 2007 and December 2013 events, respectively. The duration of surge residual > 1 m was 8.75 h in November 2007 and 14 h in December 2013. Wave characteristic comparisons were made at Blakeney Overfalls, revealing maximum wave height and direction of 3.5 m and 4° in November 2007, and 3.8 m and 338° in December 2013. Both events were high-magnitude and low-frequency, involving surge and wave combinations that caused infrastructural damage.
The TELEMAC-2D and SWAN models were run for the December 2013 event to validate the model performance. Data were available for this event from Blakeney Overfalls wave buoy, and from the Cromer tide gauge, though only for limited water levels, as explained above. Figure 6 shows the model performance for this event demonstrating good agreement with observed water levels (RMSE = 0.23 m), wave height (RMSE = 0.30 m) and wave period (RMSE = 2.5 s).
In this application, XBeach-G was forced using water levels from the TELEMAC-2D model and wave spectra from the small SWAN grid. The representative transects were extended to the optimal offshore depth of approximately 20 m using a linear extrapolation. A gradual increase in resolution from the offshore boundary (ca. 3 m) to the shore (0.5 m) ensured that waves were accurately resolved as they approached the shore. To obtain a representative D50 value, a large-scale gravel particle size analysis [77] was undertaken along a cross-shore transect just to the west of representative profile 16 (Figure 1c), resulting in D50 and D90 values of 0.019 m and 0.035 m, respectively. Photographs of the field site are presented in the Supplementary Materials.
The XBeach-G model was calibrated for the duration of the December 2013 storm surge, a period of 15 h and 20 min between 5 December 2013 13:00:00 and 6 December 2013 04:20:00. The calibration used the same cross-shore transect as for the particle size analysis. Model calibration was achieved by systematic variation of two parameters, within the recommended range for gravel environments [20,21]. The infiltration coefficient (kx) (0.001, 0.01, 0.1, 0.2, 0.3, 0.4, 0.5, 0.6, 0.7) and the Manning bed friction coefficient (bfc) (0.02, 0.024, 0.028, 0.032, 0.034) were systematically varied, resulting in a total of 45 calibration runs [65]. Two parameters were used to inform an objective assessment of calibration parameter combinations: the Brier skill score (BSS, Equation (2)), and the difference between observed and modeling post-storm crest height. The BSS incorporates the initial and observed profile change when assessing modeled morphological change. A BSS score of 1 indicates a perfect prediction. If the model prediction is further away from the final measured condition than the baseline prediction, the BSS is negative (Equation (1)). Given that pre- and post-storm LiDAR data were only available for the subaerial portion of the barrier, only this section was used to assess model skill.
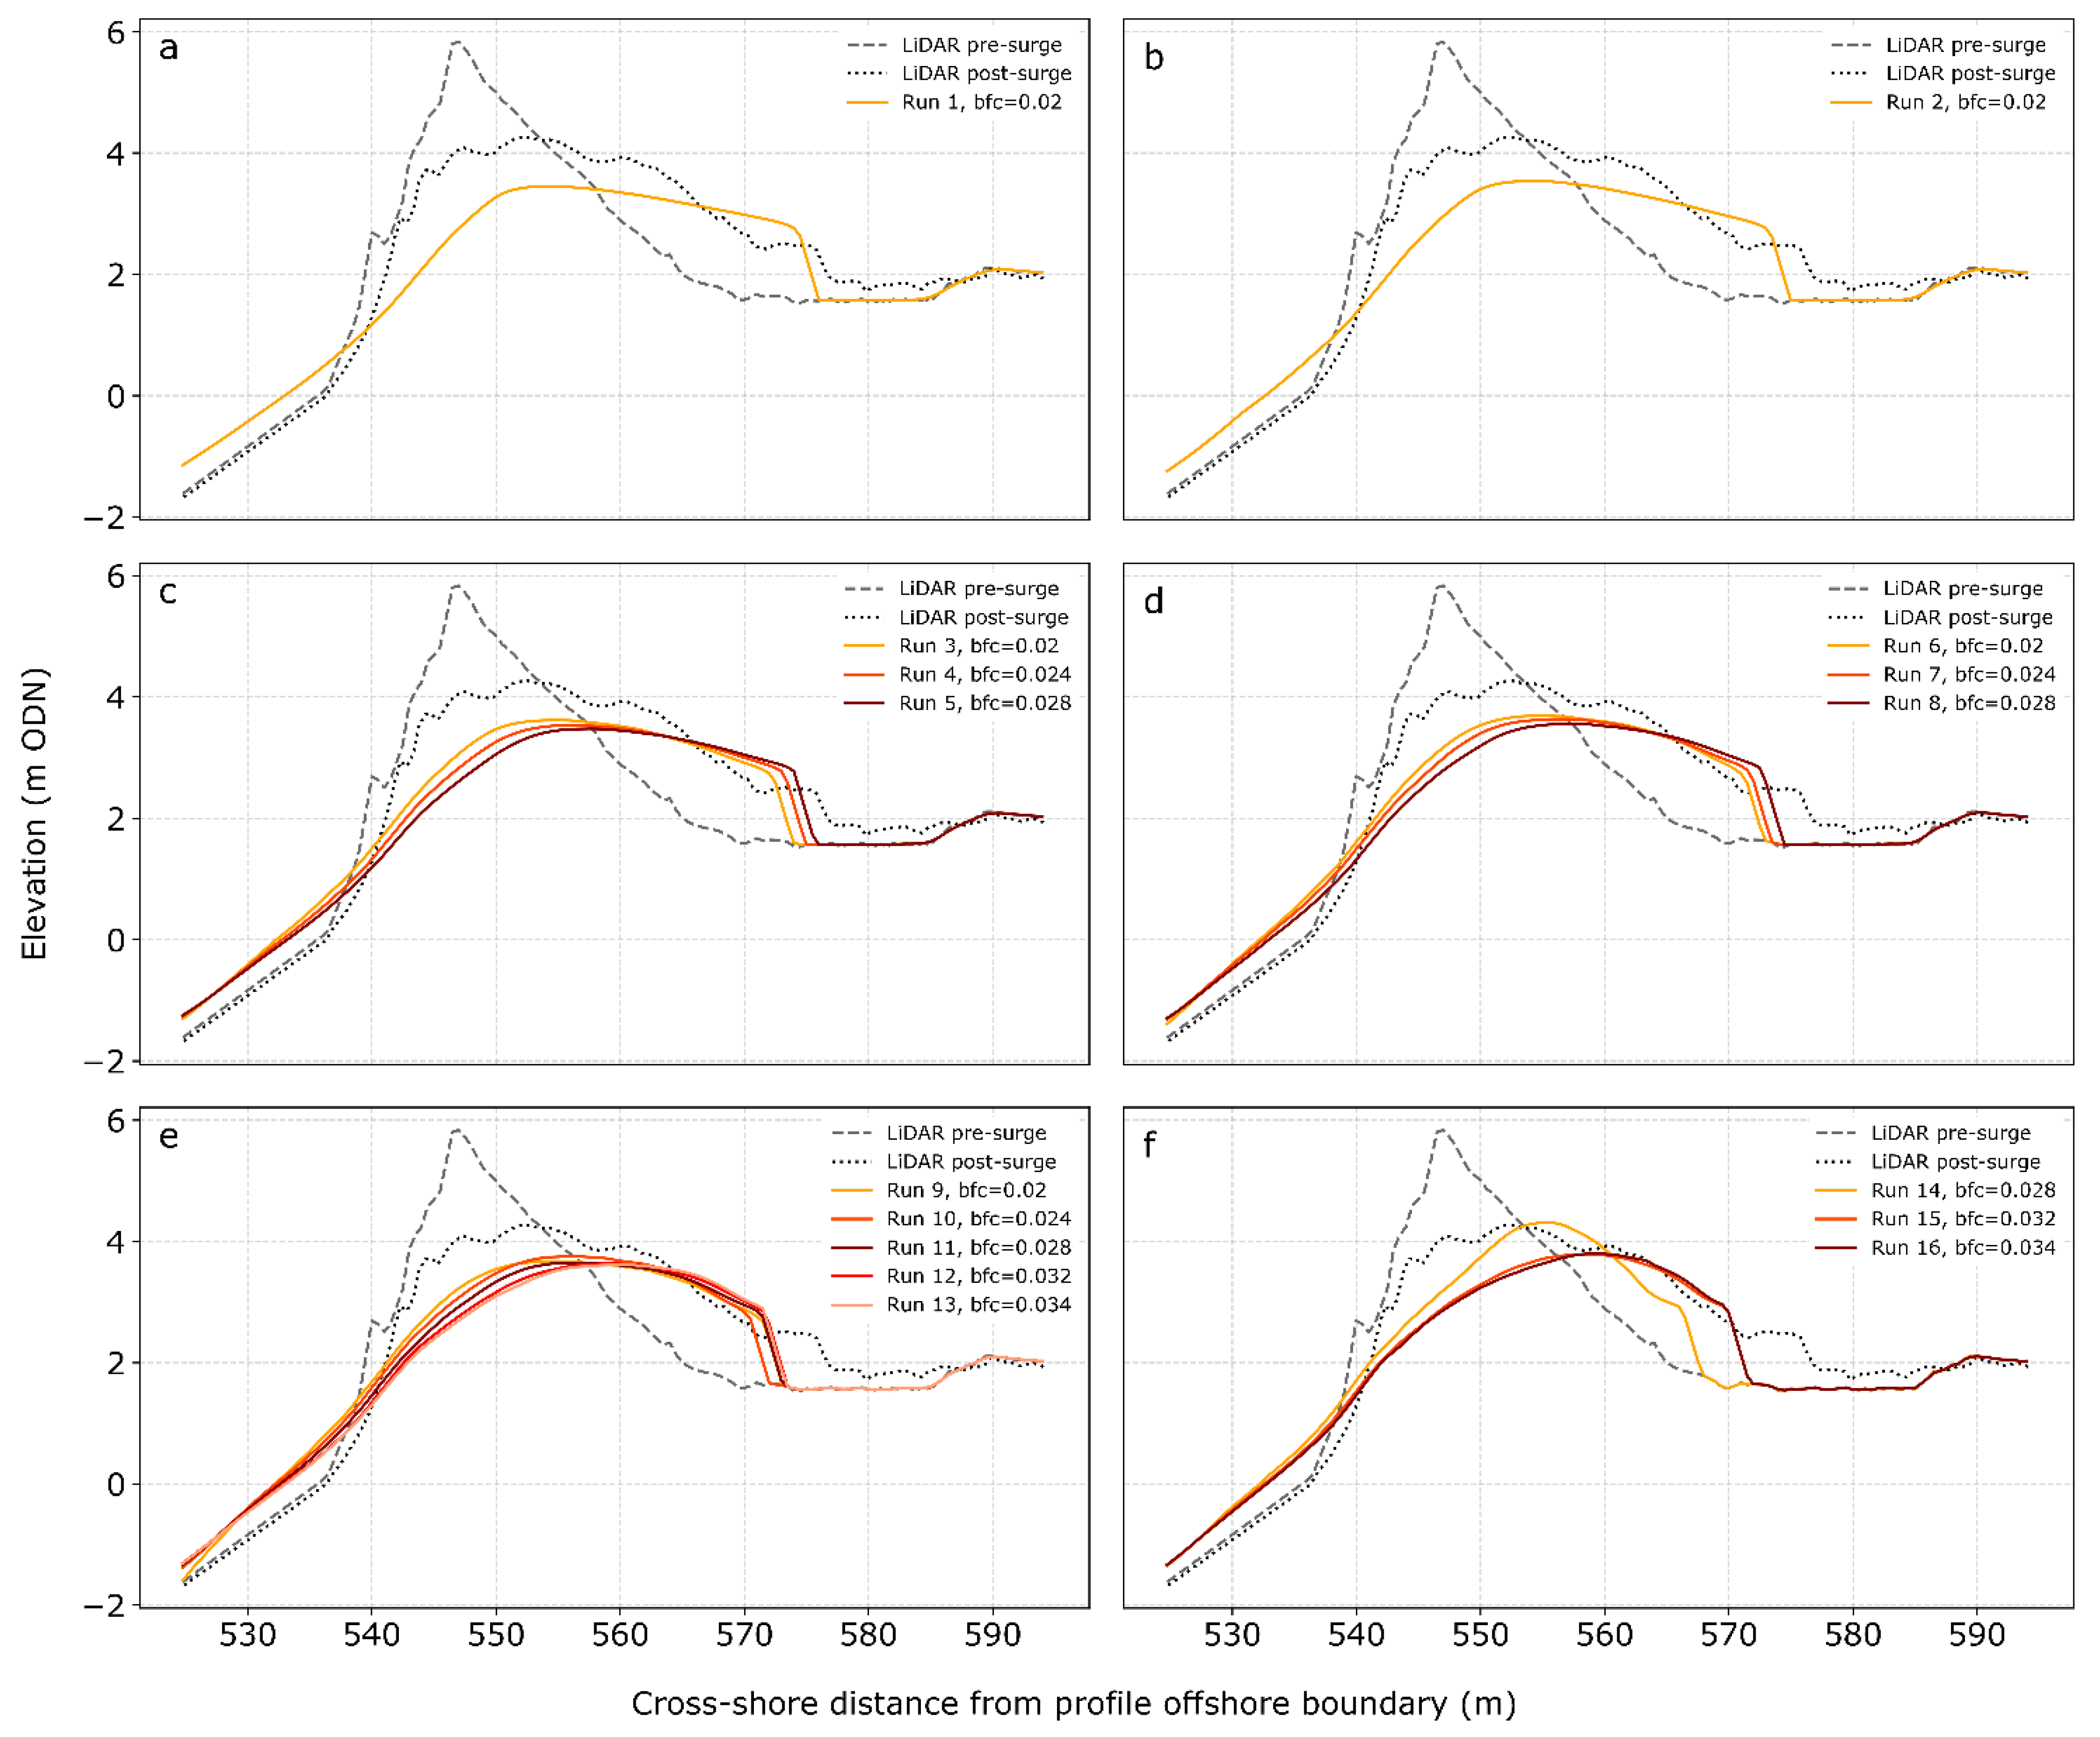
The ability of the model to replicate the post-storm height of the barrier crest was used alongside the BSS, given the importance of barrier crest height in determining overwashing and overtopping processes. Each calibration run was then ranked based on both the BSS and crest height difference. Ranks from each measure were multiplied (applying an equal weighting to BSS and crest height performance) together to obtain an overall rank for each calibration parameter combination. The optimum calibration parameter combination used infiltration coefficient and bed friction coefficient values of 0.4 and 0.02, respectively (Table 2, Figure 7).

Table 2.
XBeach-G model calibration of the profile opposite Salthouse (close to Profile 16, Figure 1c) through systematic variation of free parameters. Assessment of model skill is based on ref [78], the Brier skill score (BSS) can be interpreted with a qualifier: 0.8–1.0 = excellent; 0.6–0.8 = good; 0.3–0.6 = fair; 0–0.3 = poor; <0 = bad. Crest height indicates the difference between modeled and observed post-surge crest height, where negative values indicate that modeled lowering was overestimated. Equals signs indicate a joint rank within the full 45-run calibration set.
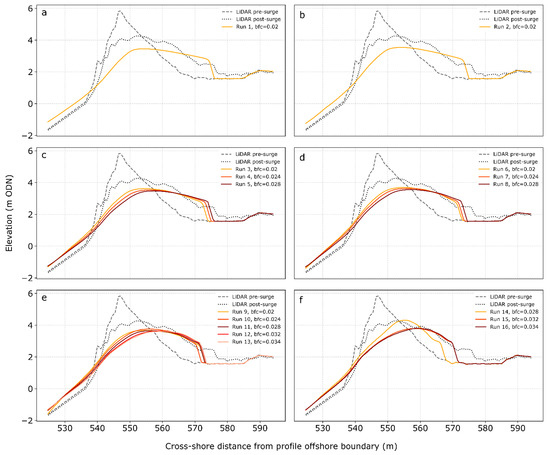
Figure 7.
XBeach-G model calibration through systematic variation of free parameters. Modeled cross-shore profiles from the sixteen free parameter combinations are shown grouped by infiltration coefficient (kx) value, subplots (a–f), and colored by bed friction coefficient (bfc). The pre- and post-storm cross-shore profiles extracted from LiDAR are also shown. The profiles are orientated left (seaward) to right (landward).
The model was run 10 times for each representative profile. In each case, random statistical seeding of the wave timeseries was used. This maintains the essential characteristics of the wave timeseries, whilst ensuring that model results were not overly dependent on a particular set of wave input conditions [79]. This was repeated with and without morphological updating enabled, resulting in a total of 360 model runs. In addition to profile morphology, overtopping volume (volume of water per unit width over the modeled time period) and wave run-up were derived as outputs. Overtopping volume was obtained 5 m landward of the pre-surge profile crest. Wave run-up, as commonly expressed as when the run-up magnitude exceeded two percent of the time, or R2% [80], was computed at a timestep of one minute using the run-up gauge output option in XBeach-G [81]. Run-up values during timesteps where the water level exceeded the barrier crest were filtered out because this water level represents the transition to an overwashing/overtopping regime. Using the filtered run-up dataset, R2% was determined by plotting the cumulative frequency distribution of the wave run-up time series and extracting the 98th percentile.
4. Results
Sampling cross-sectional profiles along the BPBS reveals how alternative coastal management regimes may introduce systemic and enduring alterations to barrier morphological characteristics. Representative profiles derived from LiDAR DTMs before and after the December 2013 event reveal systematic differences in barrier characteristics between the always-unmanaged section and the section managed up until 2005. Profiles sampled in the western unmanaged section of the BPBS varied in height between 5–6 m ODN, with seaward slopes of 10–27.5 degrees (Figure 2). Profiles sampled from the eastern, previously managed section varied in height between 5–9 m ODN, with seaward slopes of 10–35 degrees, omitting the deposits around the glacial drift “eye” of Gramborough Hill (near profile 17, Figure 1c) characterized by a crest height >11 m and a seaward slope of >35 degrees. Profiles from the unmanaged section were characterized by consistently higher barrier cross-sectional area, with a mean value of 139.86 m2. Profiles from the previously managed section had a comparatively lower mean cross-sectional area of 99.01 m2. Profile 8, at the western end of the managed section, was an outlier, characterized by a substantially higher cross-sectional area relative to the remaining profiles from the managed section.
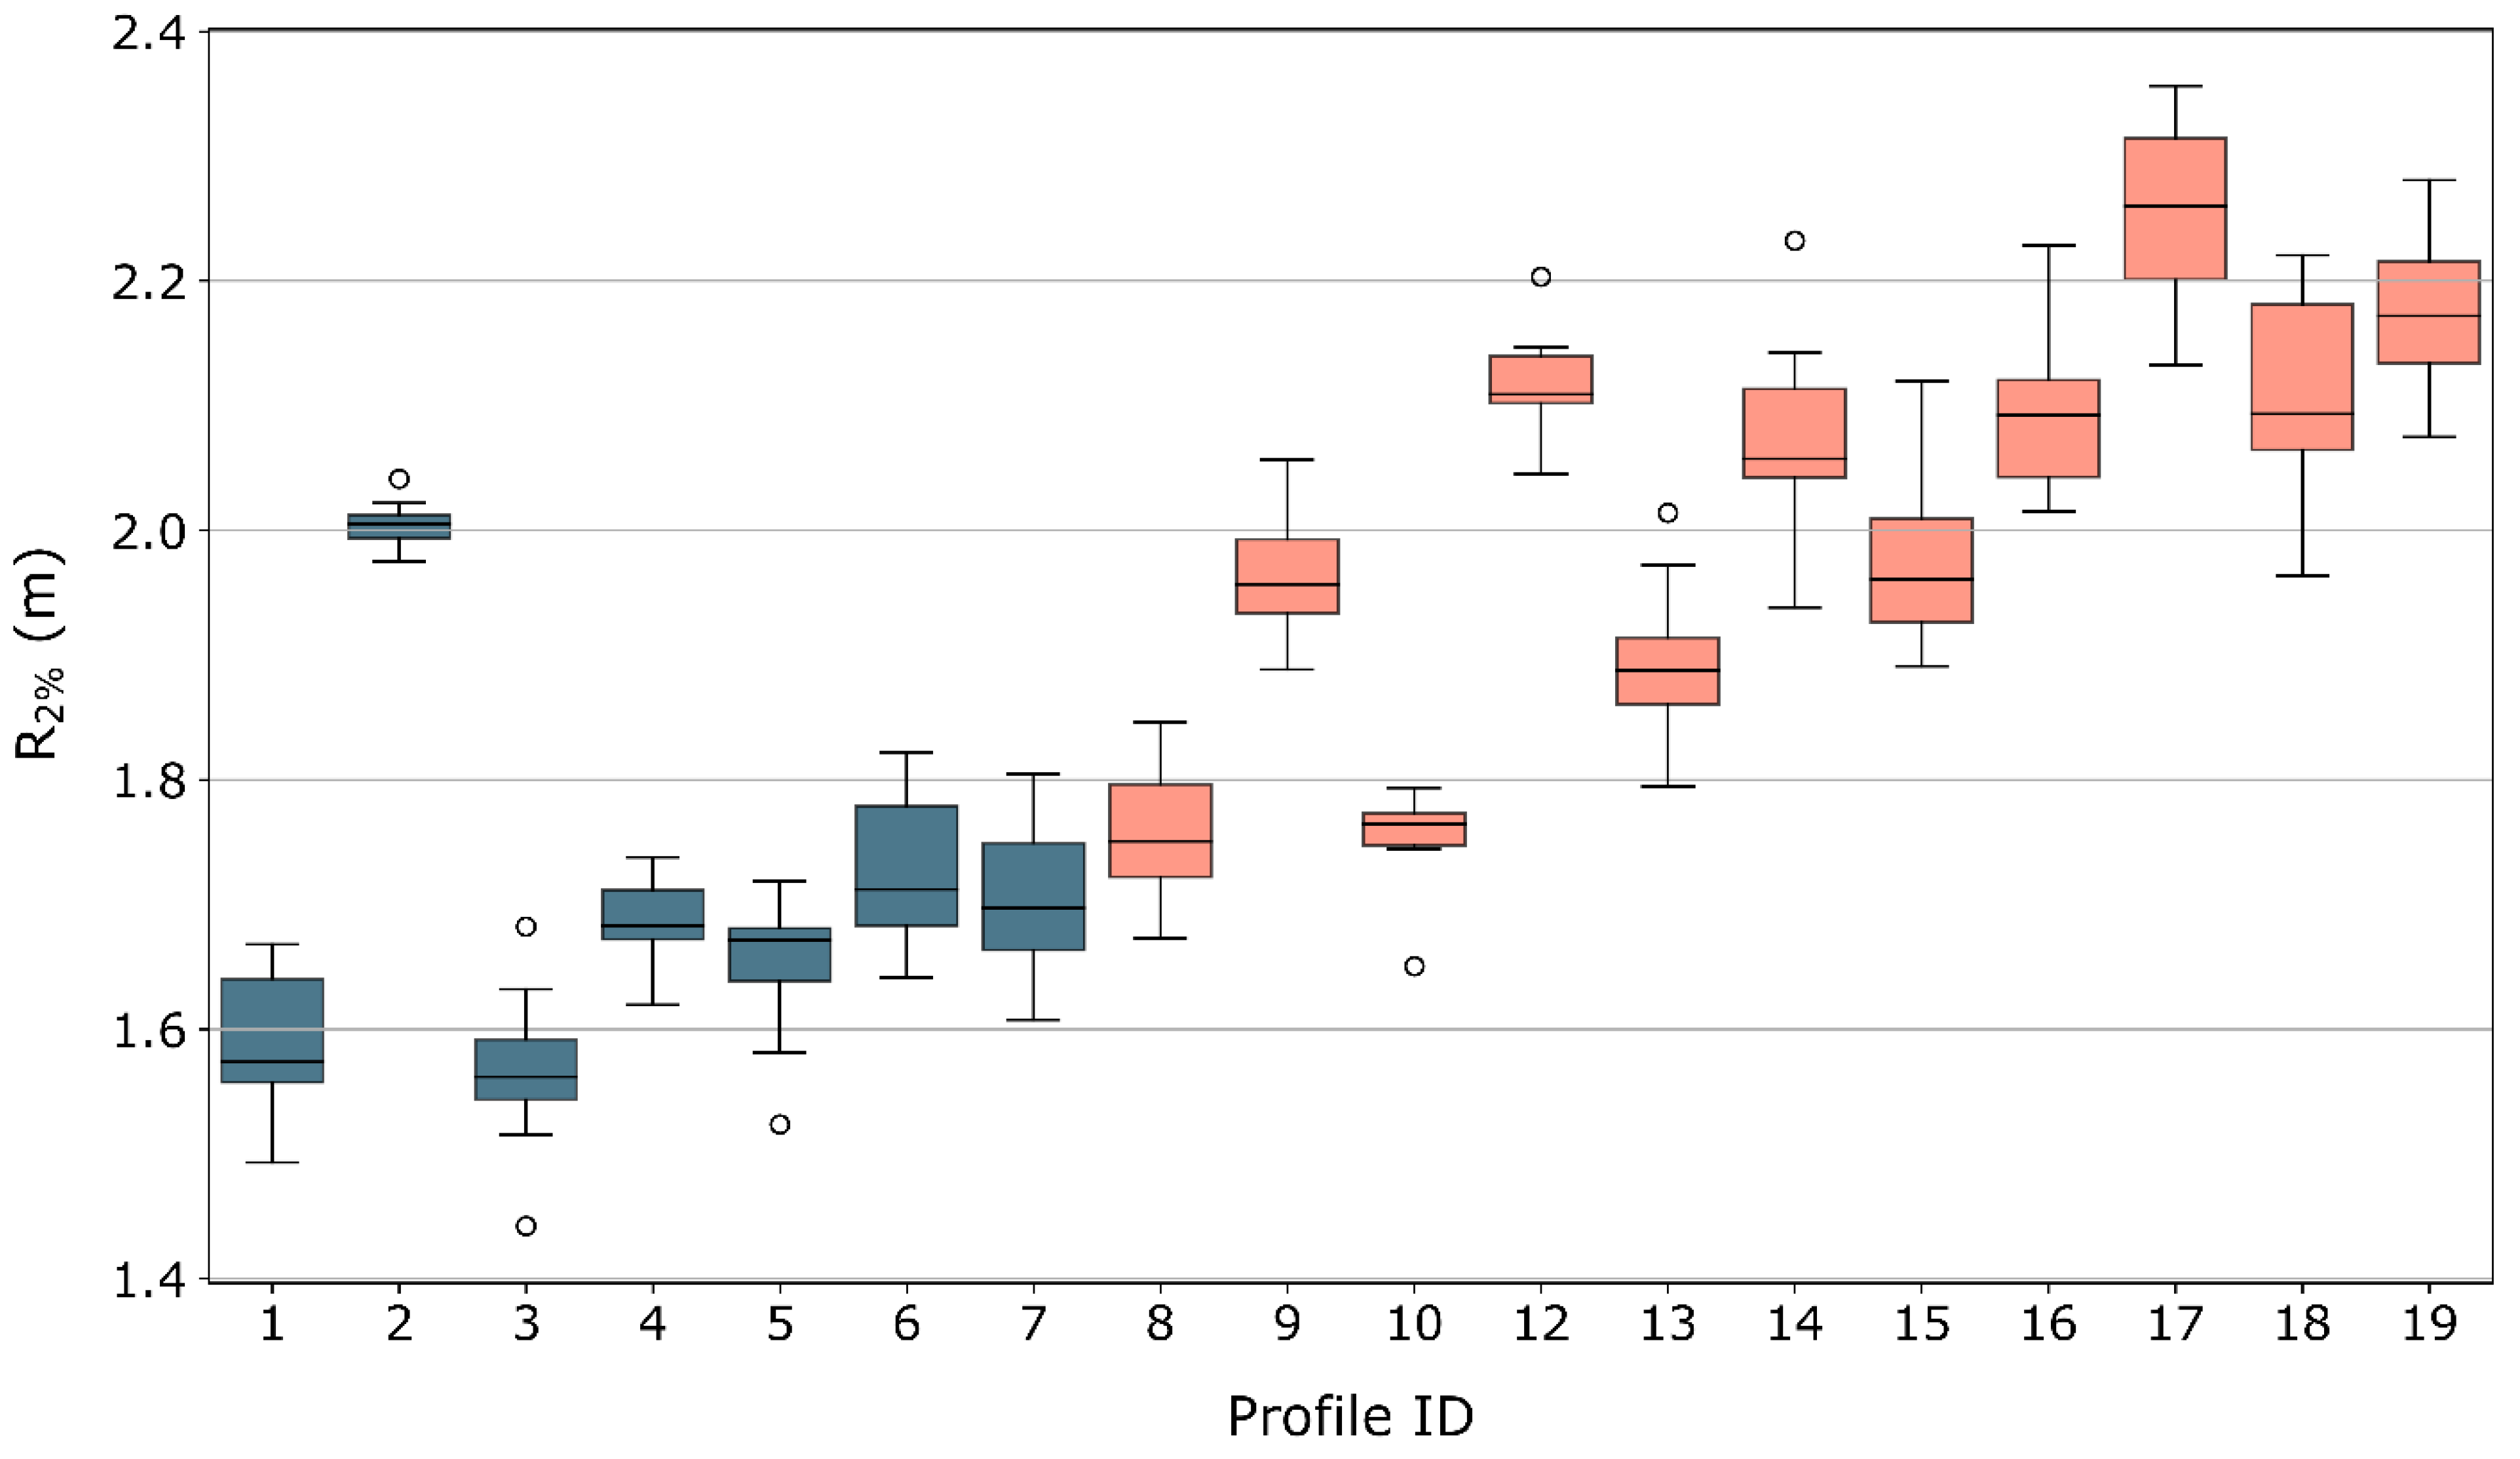
Table 3 presents representative profile characteristics alongside observed and modeled morphological responses to the December 2013 surge. Observed morphological change reveals that representative profiles from the unmanaged western section were characterized by stability or slight crest elevation increase (profiles 5 and 6) and washover with landward rollover (profiles 1, 2, 3, 4, and 7), indicative of overtopping and discrete overwashing, respectively. This likely resulted from relatively low (<6 m ODN) initial crest elevations, low angle seaward slopes (<26 degrees), comparatively large barrier cross-sectional area, and moderate to low R2% values (Figure 8). Representative profiles from the managed eastern section displayed more varied responses, although with none of the natural oscillation between overtopping and overwashing seen in the unmanaged section in the period 2005–2014. Profiles 8 and 10 exhibited washover and landward rollover (with 0.13 m lowering and no crest elevation change, respectively). Profiles 9 and 18 exhibited slightly more extreme washover with crest height lowering of −0.60 m and −0.38 m, respectively. Both profiles intersected with previous locations of washover deposit formation, which likely formed during the November 2007 storm surge [82]. Severe washover formation, the product of sluicing overwash conditions under high wave run-up episodes, characterized the artificially steepened profiles 13, 15 and 16, which exhibited pre-storm crest heights <8 m ODN and barrier cross-sectional area of <80 m2. These profiles showed crest lowerings of −2.45 m, −2.61, and −3.03 m, respectively. Profile 11 underwent crest lowering of −3.03 m; however, due to an initially lower crest height of 6.61 m ODN, this resulted in a post-storm crest elevation below 4 m ODN. This is significant because crest lowering to below 4 m ODN also occurred at locations elsewhere along the BPBS, where breaches formed following the December 2013 storm surge. Profiles 12, 14, 17, and 19 showed minimal change during the December 2013 event. These profiles were all characterized by initial heights greater than 7 m ODN and largely maintained their crest elevations (crest height reductions did not exceed 1 m). The modeled R2% values for these profiles were among the highest of all profiles, with mean values exceeding 2.00 m in all cases.

Table 3.
Representative profiles used for numerical modeling along the BPBS. Barrier profiles and crest heights were measured from LiDAR available before and after the December 2013 storm surge event. XBeach-G modeled crest elevation change also reported. Barrier pre- and post-storm profiles along with XBeach-G morphological output are presented in the Supplementary Materials. Barrier cross-sectional area was calculated from the pre-storm LiDAR survey for each representative profile. Morphological observations were made using LiDAR data and vertical aerial imagery with attention to changes that have taken place since the termination of active re-profiling in winter 2005. For locations, see Figure 1c. ODN, Ordnance Datum Newlyn.
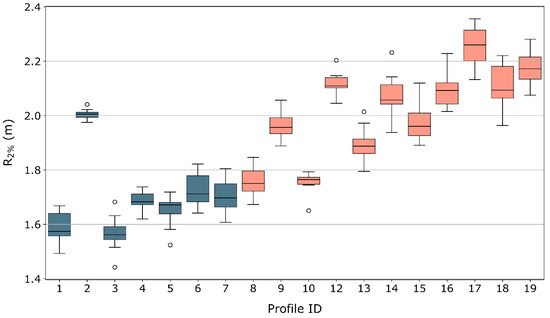
Figure 8.
Run-up magnitude (m) measured as R2% plotted for each representative profile. Box plots represent the distribution of R2% values which arise from the 10 model runs performed for each representative profile. Blue and orange shading of boxes indicates that the profile originates from the unmanaged and managed sections of the BPBS, respectively. Profile 11 has been omitted from this figure because the observed morphological change (breaching) following the December 2013 storm surge could not be simulated.
The ability of XBeach-G to replicate observed morphological change varied by representative profile, with BSS qualifiers ranging from “bad” to “excellent” [78], and RMSE values of 0.20 to 0.79 m (Table 3). In this study, XBeach-G successfully reproduced varied morphological responses to storm surge conditions, including minimal change, washover, and sluicing washover. The model was less successful at reproducing barrier crest accretion and failed to reproduce barrier breaching. Consequently, profile 11, where breaching was observed, was excluded from the subsequent analysis. In those profiles where crest accretion was observed, XBeach-G tended to overestimate crest lowering, in part due to offshore transport of sediment. This may have resulted in an overestimation in overtopping volumes. That said, it is important to note that the post-storm LiDAR was collected approximately two months after the storm, during which time barrier crest rebuilding may have occurred, whereas the XBeach-G outputs reflect immediate post-storm conditions.
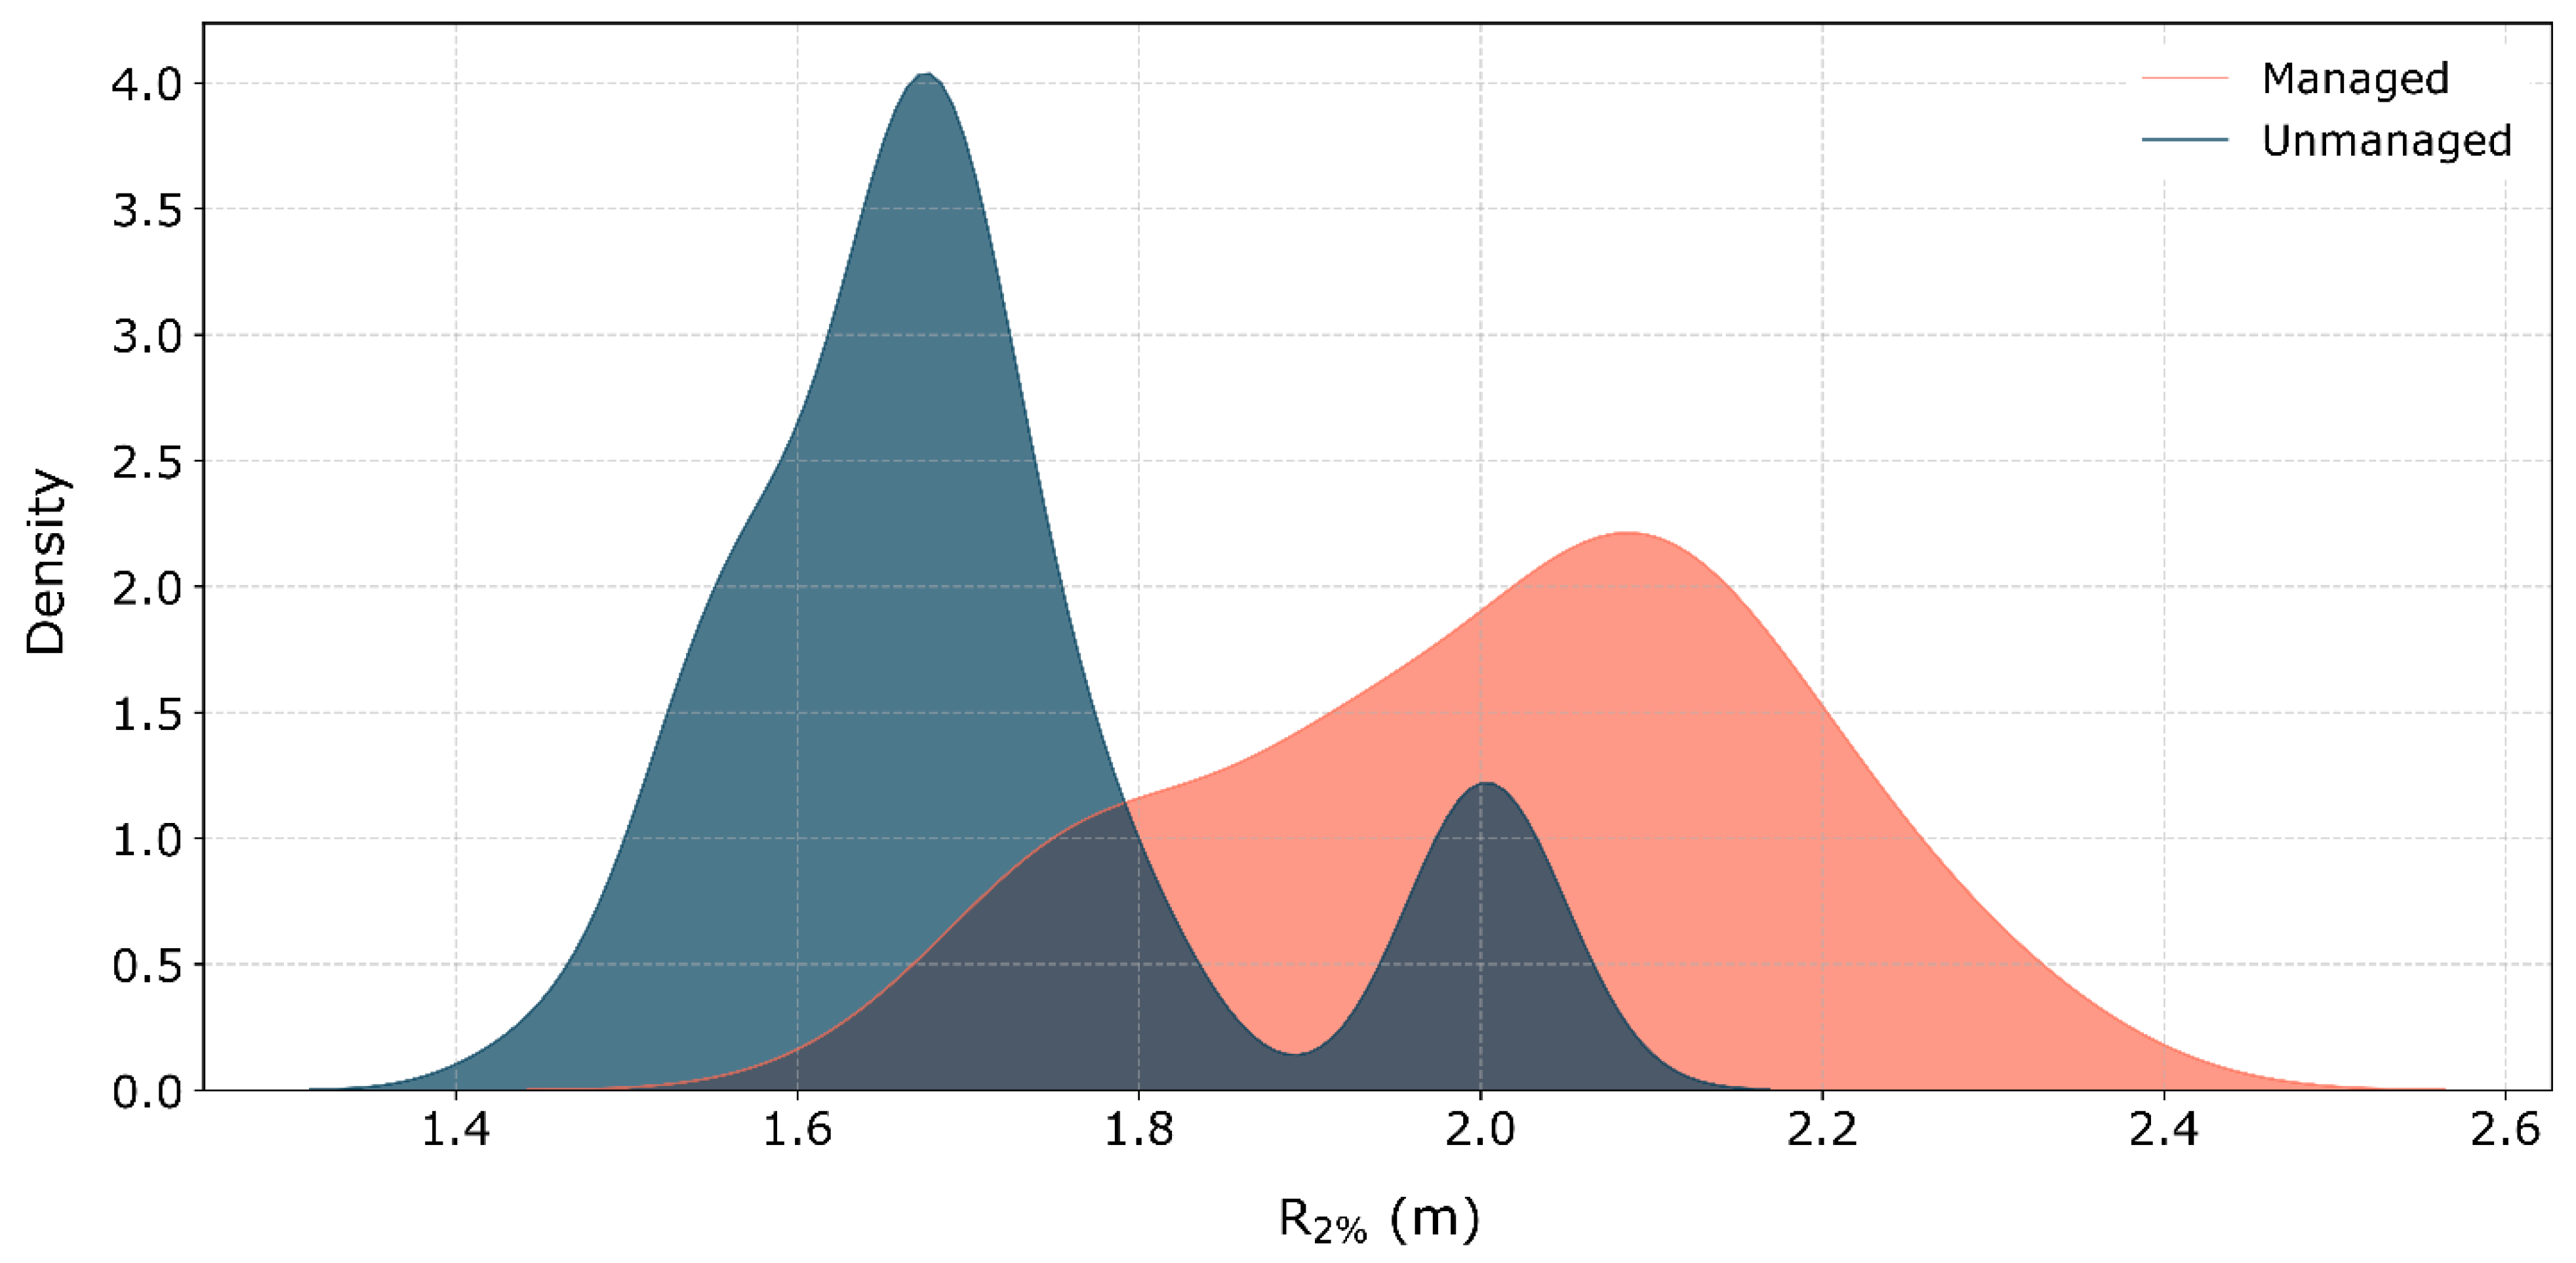
Alongside differences in pre-storm morphology, numerical modeling provided the opportunity to interrogate wave run-up characteristics at each of the representative profiles extracted along the BPBS. Figure 8 displays modeled R2% for each of the ten model runs generated for each representative profile, with morphological updating enabled. Figure 8 shows that R2% for the unmanaged profiles (representative profiles 1–7) was typically lower compared to that of the managed profiles (representative profiles 8–19), with mean R2% run-up values of 1.70 m and 2.01 m for the unmanaged and managed profiles, respectively.
Considering the bulk properties of managed and unmanaged profiles enabled further interrogation of the impact of management regime on run-up magnitude. Figure 9 shows a clear separation in the modal run-up magnitude (as measured by R2%) between managed and unmanaged profiles. Run-up on unmanaged profiles had a modal density around 1.70 m, while for the managed profiles, this value was between 2.00 and 2.20 m.
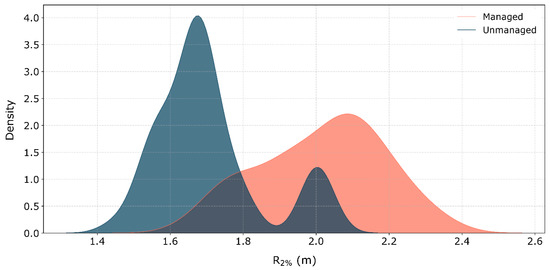
Figure 9.
Run-up magnitude (as measured by R2%) arranged according to representative profile management regime. Mean kurtosis values for the unmanaged and managed profiles were 0.42 and −0.73, respectively. Mean skewness values for the unmanaged and managed profiles were 1.00 and −0.73, respectively.
The run-up distribution for the managed profiles was platykurtic (kurtosis ≤ 0), indicating greater variation in wave run-up distributions. The kurtosis figure for the unmanaged profiles wave run-up distribution was leptokurtic (kurtosis ≥0), suggesting a more consistent wave run-up. This observation helps to explain the more morphologically consistent responses to the December 2013 surge. In the managed profiles, the run-up distribution was moderately negatively skewed (skewness = −0.5 to −1.0), whereas in the unmanaged profiles the run-up distribution was positively skewed (skewness = +0.5 to +1.0) towards larger run-up values.
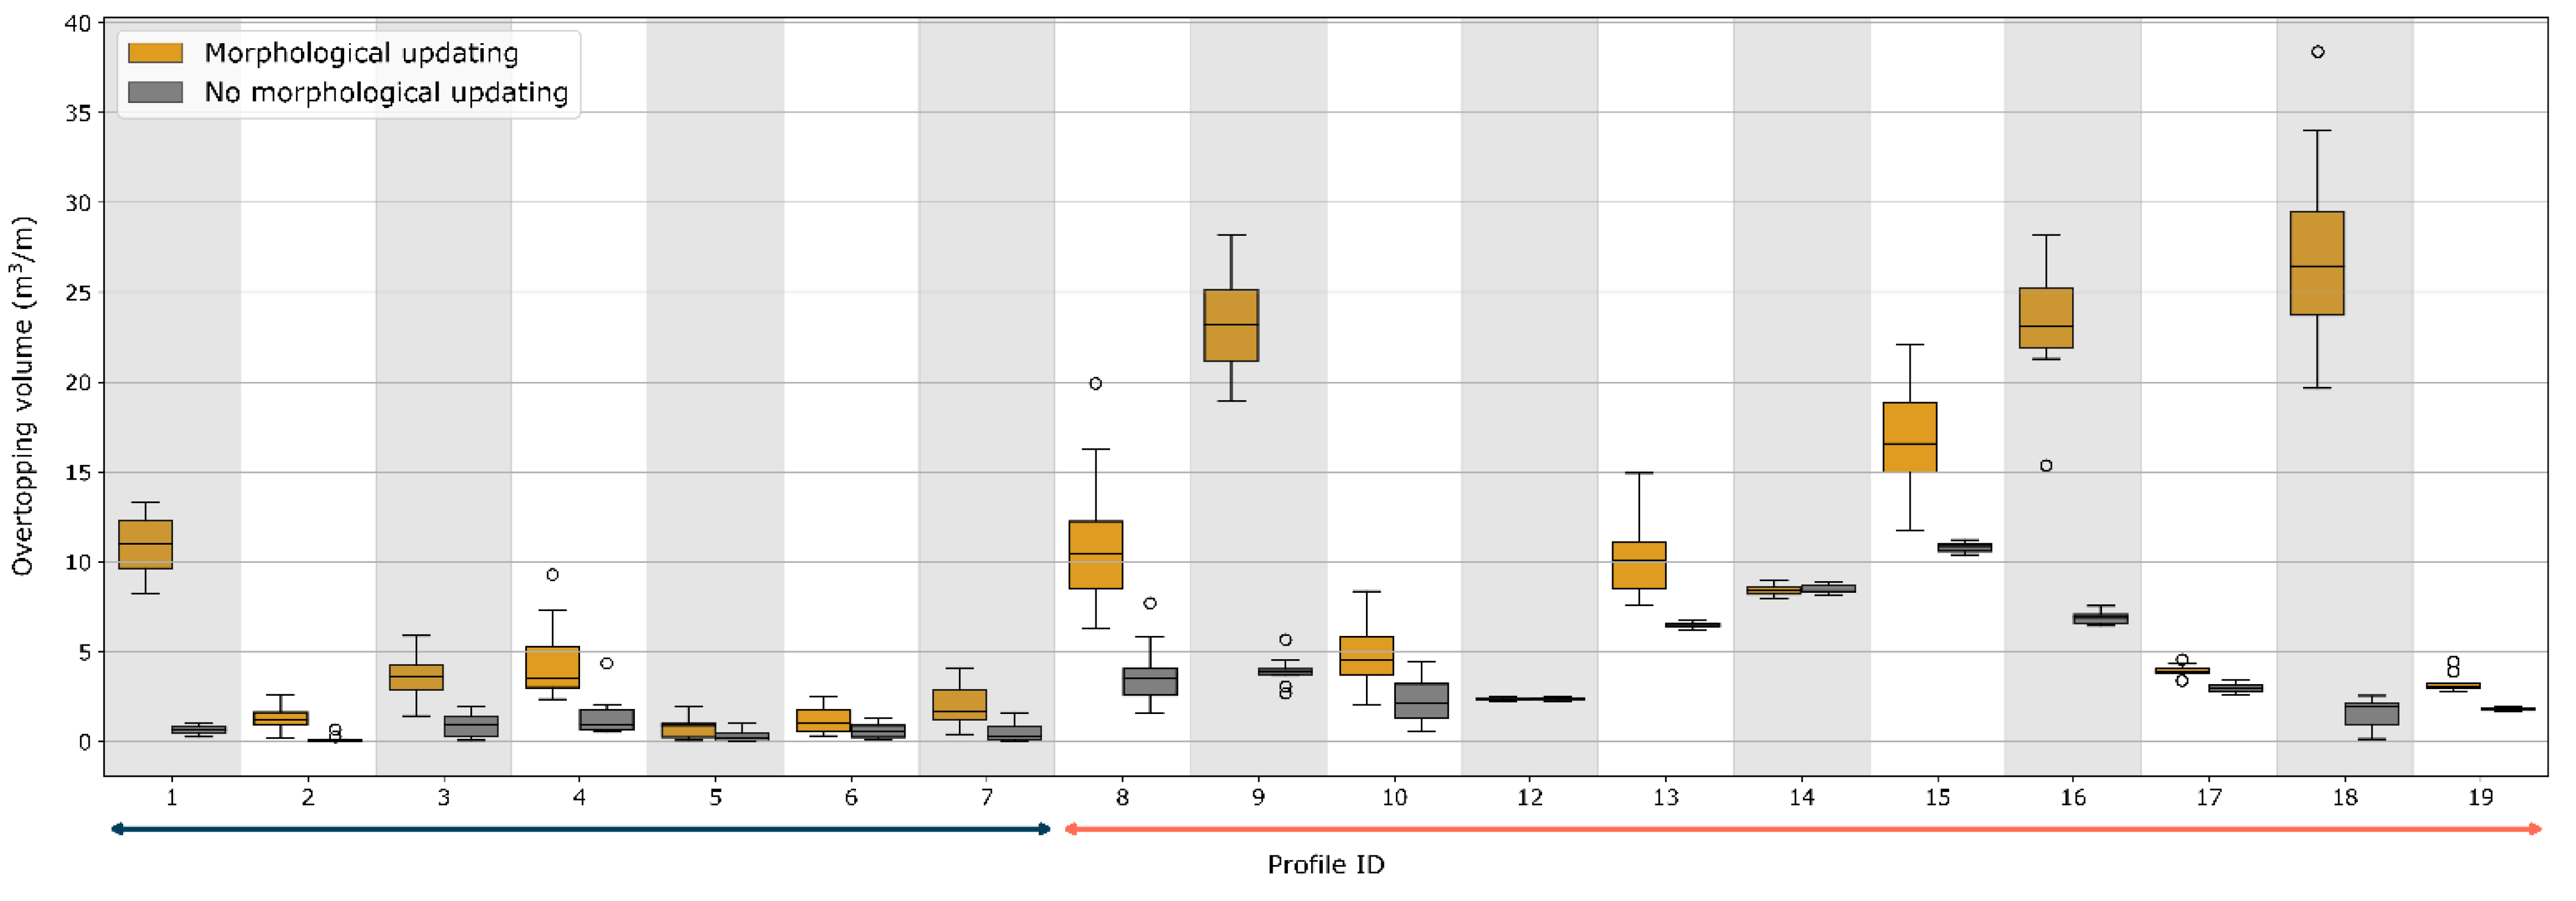
XBeach-G permits morphological updating to be disabled; therefore, it is possible to isolate the contribution of morphological change to landward overtopping water volume. Figure 10 displays total overtopping volume modeled for each of the representative profiles with and without morphological change enabled. The boxplots capture the overtopping volume from the ten model runs generated for each profile. When morphological change was enabled, 16/18 (89%) of the profiles showed an increase in mean overtopping volume during the December 2013 event. When morphological change was disabled, mean total overtopping volume was underestimated, on average, by 57%. The underestimation was greater on profiles from the previously managed eastern section (74%) than on profiles from the unmanaged western section (46%).
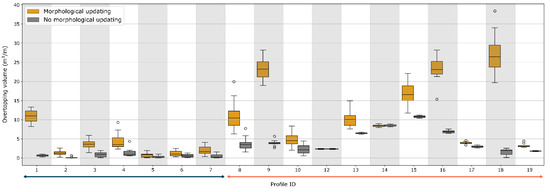
Figure 10.
Influence of morphological change on total overtopping volume. Overtopping volume is the volume of water per unit width over the modeled time period (m3/m). Box plots represent the distribution of overtopping volumes arising from the 10 model runs performed for each representative profile. Unmanaged and managed profiles are indicated with blue and orange arrows, respectively. Identical wave input timeseries were used for comparison of with and without morphological updating enabled. Profile 11 has been omitted from this figure because the observed morphological change following the December 2013 storm surge (breaching) could not be simulated.
5. Discussion
5.1. Management Regime Introduces Systemic Differences in Barrier Pre-Storm Morphology
Focusing on the period 1992–2005, earlier researchers [29] also identified clear differences in profile morphology—lower crest heights and higher cross-sectional areas-when comparing the unmanaged and managed sections of the BPBS. The present study extended this period of observation, revealing that the interventionist management regime affecting this system has been associated with morphological legacies that have extended well beyond the cessation of the intervention. The legacy of management endures along the BPBS partly because of the relatively steep, energy-reflective beach face, and coarse clastic composition of gravel barriers. An appreciation of these characteristics becomes highly relevant to coastal management efforts which seek to restore more natural coastal processes, because it suggests the existence of a substantial lag between the inception of non-interventionist schemes and the realization of benefits arising from a change in management philosophy.
The enduring nature of distinct unmanaged and managed barrier sections beyond the cessation of active management suggests that termination of the interventionist regime alone was insufficient to return the barrier to a pre-managed morphology. Rather, extreme hydrodynamic events (in terms of both water level and wave energy) were also required here to facilitate barrier relaxation towards a more natural state [83]. The finding that the majority of morphological changes have occurred during the extreme events themselves places a premium on understanding the impact of such events.
5.2. Pre-Storm Morphology Influences Morphological Change during Storm Events
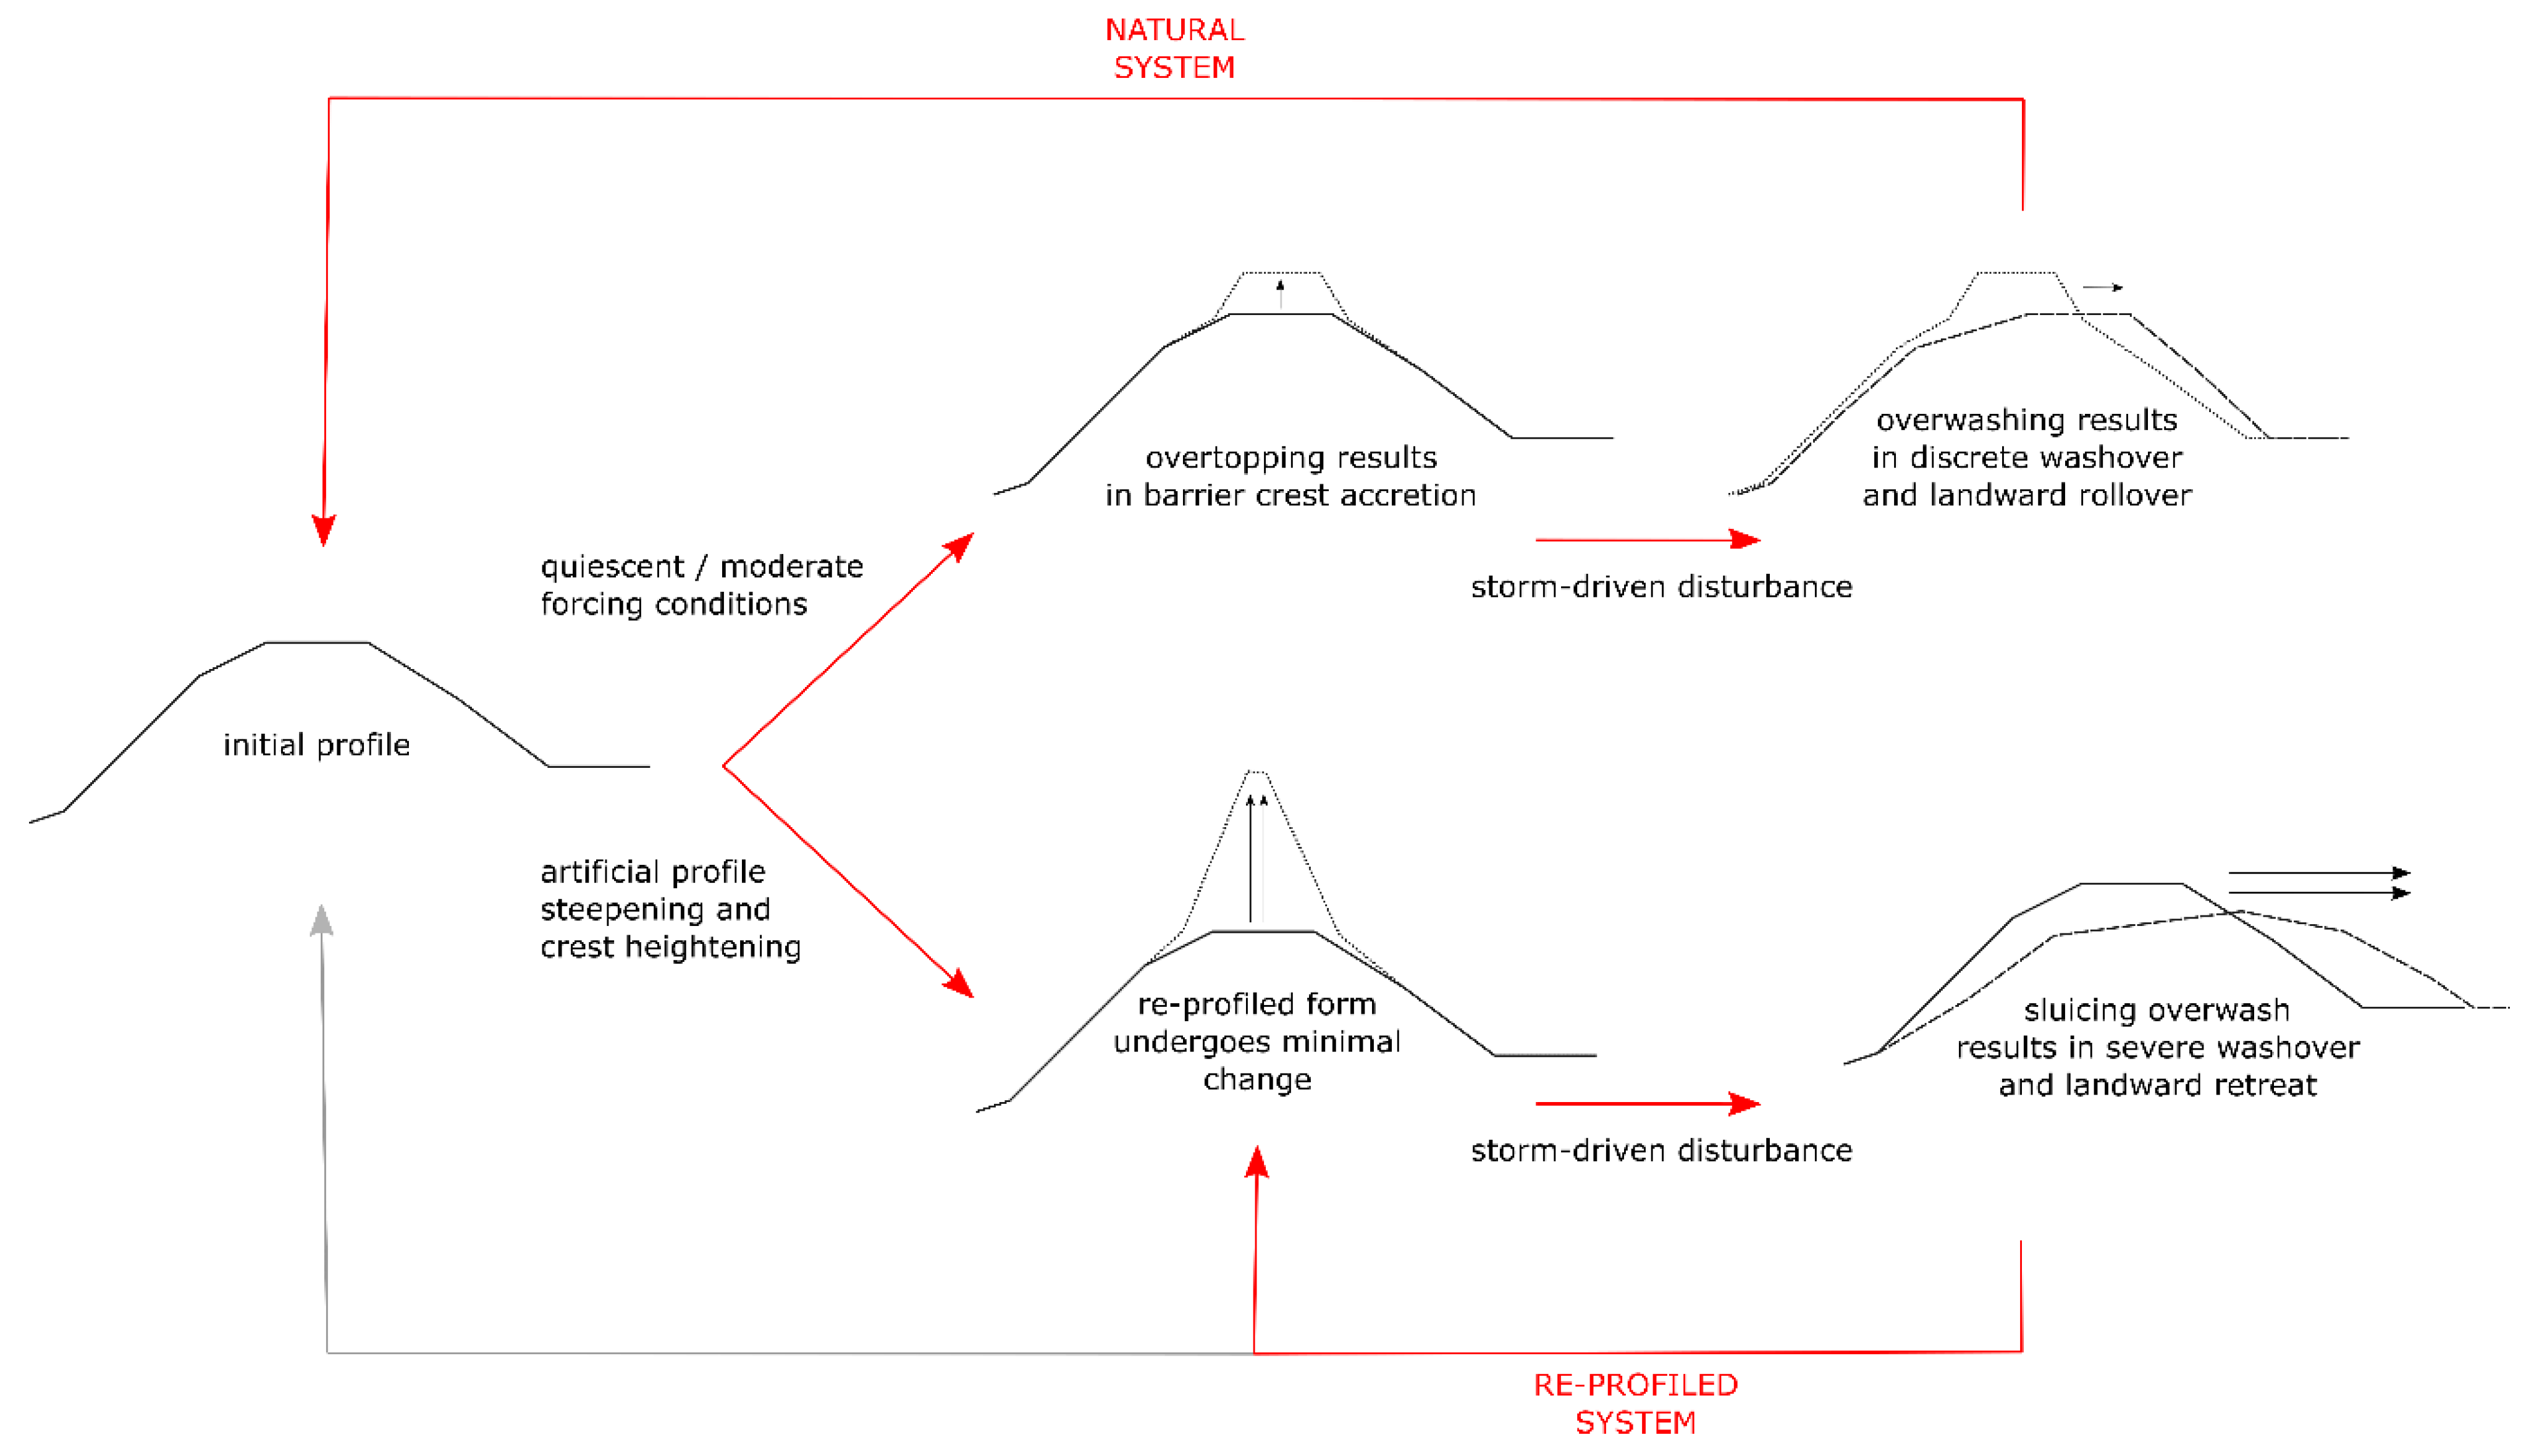
In the absence of human intervention, gravel barriers oscillate between overtopping and overwashing in response to the interaction between sea level change and superimposed extreme water level events. Overtopping encourages vertical accretion, resulting in a steeper, narrower barrier profile which is then more vulnerable to overwashing [10,84]. When overwashing occurs, washovers are formed, transporting sediment landwards, resulting in a lower elevation crest, with a lower angled, more dissipative seaward slope. This in turn reduces wave run-up during future events, encouraging a resumption of the overtopping regime (Figure 11, “natural system”). In the model of ref [85], this interaction results in the punctuated landward rollover of the barrier.
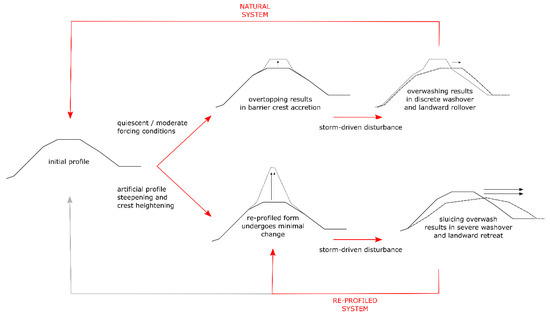
Figure 11.
Management regime influence on barrier hydrodynamics and morphodynamics.
Both conceptual [86] and empirical studies [20,87,88,89,90] have established that the interaction between sediment size, slope angle and swash asymmetry determines the wave run-up extent on gravel barriers. In this study, alongshore variation in sediment size and incoming swash was minimal. As a result, the heightened R2% values recorded along the managed section of the BPBS can largely be attributed to steeper seaward slopes. This finding corroborates modeling work conducted on the south west coast of England, which found that a cliff toe fronted by a sandy dissipative beach experienced less extreme hydrodynamic conditions than a cliff fronted by a steeper reflective beach [91]. The steeper beach was found to enhance wave run-up and wave power, resulting in higher energy conditions at the cliff toe.
Along the eastern section of the BPBS, the active intervention which continued until the winter of 2005 has prevented overwashing up to, and in some places beyond, the December 2013 surge, disrupting the dynamic equilibrium state of switching between overtopping and overwashing. Similar behavior has been observed elsewhere, where active intervention into gravel barrier morphology has been used in an attempt to reduce landward flooding (e.g., at Porlock barrier, U.K. south west coast [28]). At both the Porlock barrier and at Blakeney, the barrier became very narrow, with the artificial increases in barrier height and steepness preventing the landward sediment transport which would normally occur through washover. Furthermore, following re-profiling, barrier crests are positioned in a more seaward location, hence further from morphological equilibrium than locations that have already been overwashed. This means that when overwash does occur, morphological change is extreme, resulting in severe washover (a generalization of these cases is shown in Figure 11, “re-profiled system”).
Despite the distinctly different behaviors illustrated in Figure 11, observations presented in this study and others suggest that parts of the barrier can transition from the “re-profiled” to the “natural” system. Profiles 8 and 10 derive from the previously managed eastern section, however, both profiles are characterized by pre-storm crest heights of around 6 m and moderate slope angles. The characteristics of these profiles suggest that they have already undergone substantial reorganization towards a more natural morphological state, likely as a result of earlier storm surge events [53].
Elsewhere, a reassessment of barrier dynamics over two decades following the cessation of active management suggest that following a period of readjustment (lasting around seven years), the barrier has been characterized by increased stability, as indicated by lower/more consistent rates of landward shoreline retreat along the barrier [44]. The present study suggests that the entire BPBS has not yet achieved this state of increased stability. Continued monitoring is required along the BPBS to determine the number of storms required for the previously re-profiled sections to assume a more natural form, and the accompanying oscillation between overtopping and overwashing.
Linking barrier pre-storm morphologies to extreme event responses enables an understanding of which parts of the barrier are most susceptible to change. Pre-storm crest height, cross-sectional area, and exposure to previous storm events are determinants of barrier responses to future storm surge conditions.
In some locations in this study (see profiles 12,14, and 17, which were each characterized by crest elevations exceeding 8 m ODN), managed profiles underwent minimal change during the December 2013 event, retaining their artificially re-profiled form. As elsewhere, the relatively limited response of these profiles suggests that barrier crest heights in excess of a given threshold may preclude washover occurrence despite high run-up values [92,93,94]. Such thresholds have been identified for gravel barriers elsewhere. For example, observations following extreme event impacts at Sillion de Talbert, Brittany, France suggest that crest lowering below the MHWL is critical because it leaves certain parts of the barrier vulnerable to high tides in addition to infrequent storm events [45].
Alongside crest elevation, barrier cross-sectional area exerts an important control on storm response. In this study, profile 19 did not exhibit washover deposition, despite having a comparable initial crest height to those profiles which did experience severe washover. It was, however, characterized by a cross-sectional area of 90.72 m2 compared to values of <80 m2 for all profiles where severe washover occurred. The proposal that barrier cross-sectional area influences landward retreat processes [18,93] builds on early ideas from ref [95] where the existence of a “critical barrier width” which exerts an influence on overwash occurrence and extent was proposed. Furthermore, it has been suggested that overwashing tends to be slow until a barrier narrows sufficiently, after which the rate of overwash increases [95]. Where barrier cross-sectional area is greater, hydraulic conductivity is enhanced, resulting in increased swash infiltration. This limits wave run-up and resulting overwash.
Establishing the existence of such thresholds more generally represents an important step in quantifying gravel barrier mobility, and the likely envelope of change during extreme events, in any given local setting. Any such threshold will, of course, also depend on storm surge character and local run-up extent for any individual event.
5.3. Morphological Change During Storm Events Influences Overtopping Volume
During extreme events, elevated water levels combine with high energy wave conditions with the potential for severe erosional and flooding impacts [96]. Low-lying mixed sand–gravel environments are typically characterized by high erosion–flooding interactions, with the potential to generate increased risk to landward communities [6,97].
From a coastal management perspective, landward overtopping volume is problematic when it is of high magnitude (and therefore likely to have a greater erosional and flooding impact) or highly unpredictable (which makes it difficult to determine where and when risk reduction measures should be implemented [98]). Given that the core aim of barrier crest re-profiling has been to limit landward flooding, this suggests that, in certain locations, barrier crest re-profiling represents a highly effective management strategy under extreme hydrodynamic forcing. However, for many barriers, given rising sea levels, and the cessation of periodic re-profiling, questions surrounding the longer-term sustainability of such an approach remain [20].
By contrast, unmanaged profiles typically have less pronounced profile cross-sections than re-profiled barriers. Despite having typically lower pre-storm crest elevations, such profiles often exhibit lower overtopping volumes because wave run-up extent is attenuated by the gentler profile forms [99,100,101,102]. These profiles are also generally characterized by greater consistency in the modeled overtopping volume. This is a potentially valuable observation, because barrier morphologies that respond more predictably to storm surges and future sea level rise scenarios are likely more amenable to inclusion in coastal risk management strategies.
6. Conclusions
Along the Blakeney Point Barrier System, exposure to contrasting management regimes up until 2005 has resulted in ongoing systematic differences in the morphology of profiles from the western unmanaged section of the BPBS compared to the eastern previously managed section. The systematic differences in morphology introduce differences in wave run up extent, which in turn influences morphological and hydrodynamic performance of the barrier during extreme storm surge events. Profiles extracted from the western unmanaged section have been shown to be characterized by lower crest elevations, low angle seaward slopes, and greater barrier cross-sectional area. These properties resulted in reduced wave run-up extents (as measured by R2%), helping to explain the morphological response to the December 2013 storm surge, an event that was characterized by overtopping and overwashing with limited elevation loss. Along the previously managed section of the BPBS, pre-storm profiles were morphologically more variable. Although some profiles resembled those found in the unmanaged section of the BPBS, others were characterized by higher elevations, higher-angled seaward slopes, and lower barrier cross-sectional area. In these profiles, increased wave run-up extents contributed to overwash and sluicing overwash during the December 2013 storm surge.
Insights into storm hydrodynamics hold lessons for coastal risk management strategies elsewhere that seek to utilize gravel barriers for their flood risk reduction potential. Through comparing R2% values between the unmanaged and managed profiles, certain morphologies emerge as more vulnerable to increased run-up extents and consequent morphological and flooding impacts. While high, steep barriers can be highly effective at preventing landward flooding; in cases where overwashing does occur, the resultant overtopping volume is typically higher than would be the case for a relatively lower barrier crest with a lower angle seaward slope.
The large-scale development and stability of any gravel barrier is accomplished through the operation of the smaller-scale sediment transport and deposition processes described in this paper. At spatial and temporal scales relevant to coastal management decision-making, barriers may exhibit behaviors that signify persistence (e.g., lower/more consistent positional and/or crest elevation changes) or that indicate potential for rapid breakdown and transformation (e.g., severe washover formation and breaching). Furthermore, this study has shown that where barriers have been actively managed, considerable alongshore variability in barrier characteristics may also be present. Incorporating such barrier behavior, when assessing the ability of gravel barrier landforms to limit landward water flows, is crucial if these features are to be integrated into broader coastal management strategies in such a way that they deliver genuine and reliable risk reduction benefits, even under extreme conditions.
Given future joint-scenarios of rising sea level and increased storminess under accelerated climate change, barriers are now facing uncertain futures. At the global scale, modeling which fails to account for morphological change is likely to underestimate landward water transport, which may, in turn, lead to underestimates of flooding risk. As this study demonstrates, the link between morphological change and landward water volumes is especially acute when a previously managed system has not yet experienced extreme hydrodynamic conditions, and so is likely to be far from morphological equilibrium. Consequently, strategies that assume that features such as gravel barriers will provide constant flood protection throughout the duration of an event are in danger of underestimating the impact of severe storm surge events. An understanding of the interdependencies between barrier morphodynamics and risk reduction function is therefore critical if barriers are to contribute to effective erosion and flood defense over the course of the twenty first century.
Supplementary Materials
The following are available online at https://www.mdpi.com/2077-1312/9/2/147/s1.
Author Contributions
Conceptualization, J.A.P., E.K.C., S.M.B. and T.S.; formal analysis, J.A.P. and E.K.C.; funding acquisition, S.M.B. and T.S.; methodology, J.A.P., E.K.C., S.M.B. and T.S.; supervision, E.K.C., S.M.B. and T.S.; visualization, J.A.P. and E.K.C.; writing—original draft preparation, J.A.P. and E.K.C.; writing—review and editing, J.A.P., E.K.C., S.M.B. and T.S. All authors have read and agreed to the published version of the manuscript.
Funding
This work was funded by the NERC/ESRC Data, Risk and Environmental Analytical Methods (DREAM) CDT, Grant/Award Number: NE/M009009/1. It is also a contribution to the NERC-funded project “Physical and Biological dynamic coastal processes and their role in coastal recovery” (BLUE-coast), Grant Award Numbers: NE/N015924/1 and NE/N015878/1.
Institutional Review Board Statement
Not applicable.
Informed Consent Statement
Not applicable.
Data Availability Statement
The data used to support this article are available at PANGAEA, Data Publisher for Earth & Environmental Science (https://www.pangaea.de/). DOI: https://issues.pangaea.de/browse/PDI-26562.
Conflicts of Interest
The authors declare no conflict of interest.
References
- Stutz, M.L.; Pilkey, O.H. Open-ocean barrier islands: Global influence of climatic, oceanographic, and depositional settings. J. Coast. Res. 2011, 27, 207–222. [Google Scholar] [CrossRef]
- Otvos, E.G. Coastal barriers—Fresh look at origins, nomenclature and classification issues. Geomorphology 2020, 355, 107000. [Google Scholar] [CrossRef]
- McNamara, D.E.; Werner, B.T. Coupled barrier island-resort model: 1. Emergent instabilities induced by strong human-landscape interactions. J. Geophys. Res. Earth Surf. 2008, 113, 1–10. [Google Scholar] [CrossRef]
- Lazarus, E.D.; Ellis, M.A.; Murray, A.B.; Hall, D.M. An evolving research agenda for human–coastal systems. Geomorphology 2016, 256, 81–90. [Google Scholar] [CrossRef]
- Kraus, N.C.; Wamsley, T.V. Coastal Barrier Breaching, Part 1: Overview of Breaching Processes. In Coastal and Hydraulics Engineering Technical Note ERDC/CHL CHETN-IV-56; U.S. Army Engineer Research and Development Center: Vicksburg, MS, USA, 2003; Available online: http://chl.erdc.usace.army.mil/library/publications/chetn/pdf/chetn-iv-56.pdf (accessed on 30 January 2021).
- Grzegorzewski, A.S.; Cialone, M.A.; Wamsley, T.V. Interaction of barrier islands and storms: Implications for flood risk reduction in Louisiana and Mississippi. J. Coast. Res. 2011, 156–164. [Google Scholar] [CrossRef]
- Dornbusch, U. Design requirement for mixed sand and gravel beach defences under scenarios of sea level rise. Coast. Eng. 2017, 124, 12–24. [Google Scholar] [CrossRef]
- Penland, S.; Ramsey, K. Relative sea-level rise in Louisiana and the Gulf of Mexico: 1908–1988. J. Coast. Res. 1988, 6, 323–342. [Google Scholar] [CrossRef]
- Orford, J.; Jennings, S. The importance of different time-scale controls on coastal management strategy: The problem of Porlock gravel barrier, Somerset, UK. In Coastal Defence and Earth Science Conservation; Hooke, J.M., Ed.; Geological Society: London, UK, 1998; p. 270. ISBN 1897799969. [Google Scholar]
- Carter, R.W.G.; Orford, J.D. The morphodynamics of coarse clastic beaches and barriers: A short- and long-term perspective. J. Coast. Res. 1993, Special Issue 15, 158–179. [Google Scholar]
- Jennings, R.; Shulmeister, J. A field based classification scheme for gravel beaches. Mar. Geol. 2002, 186, 211–228. [Google Scholar] [CrossRef]
- Buscombe, D.; Masselink, G. Concepts in gravel beach dynamics. Earth-Science Rev. 2006, 79, 33–52. [Google Scholar] [CrossRef]
- Masselink, G.; Short, A.D. The effect of tide range on beach morphodynamics and morphology: A conceptual beach model. J. Coast. Res. 1993, 9, 785–800. [Google Scholar] [CrossRef]
- Orford, J.D.; G Carter, R.W.; Jennings, S.C. Control domains and morphological phases in gravel-dominated coastal barriers of Nova Scotia. J. Coast. Res. 1996, 12, 589–604. [Google Scholar]
- Billy, J.; Robin, N.; Hein, C.J.; FitzGerald, D.M.; Certain, R. Impact of relative sea-level changes since the last deglaciation on the formation of a composite paraglacial barrier. Mar. Geol. 2018, 400, 76–93. [Google Scholar] [CrossRef]
- Orford, J.D.; Carter, R.W.G.; McKenna, J.; Jennings, S.C. The relationship between the rate of mesoscale sea-level rise and the rate of retreat of swash-aligned gravel-dominated barriers. Mar. Geol. 1995, 124, 177–186. [Google Scholar] [CrossRef]
- Rodriguez, A.B.; Yu, W.; Theuerkauf, E.J. Abrupt increase in washover deposition along a transgressive barrier island during the late nineteenth century acceleration in sea-level rise. In Barrier Dynamics and Response to Changing Climate; Moore, L.J., Murray, A.B., Eds.; Springer: Berlin, Germany, 2018; pp. 121–145. [Google Scholar]
- Forbes, D.L.; Taylor, R.B.; Orford, J.D.; Carter, R.W.G.; Shaw, J. Gravel-barrier migration and overstepping. Mar. Geol. 1991, 97, 305–313. [Google Scholar] [CrossRef]
- Hartstein, N.D.; Dickinson, W.W. Gravel barrier migration and overstepping in Cable Bay, Nelson, New Zealand. J. Coast. Res. 2000, Special Issue 34, 256–266. [Google Scholar]
- Masselink, G.; McCall, R.; Poate, T.; van Geer, P. Modelling storm response on gravel beaches using XBeach-G. Proc. Inst. Civ. Eng. Marit. Eng. 2014, 167, 173–191. [Google Scholar] [CrossRef]
- Brown, S.I.; Dickson, M.E.; Kench, P.S.; Bergillos, R.J. Modelling gravel barrier response to storms and sudden relative sea-level change using XBeach-G. Mar. Geol. 2019, 410, 164–175. [Google Scholar] [CrossRef]
- Stokes, K.; Poate, T.; Masselink, G.; King, E.; Saulter, A.; Ely, N. Forecasting coastal overtopping at engineered and naturally defended coastlines. Coast. Eng. 2021, 164, 103827. [Google Scholar] [CrossRef]
- Orford, J.D.; Carter, R.W.G.; Jennings, S.C. Gravel barrier migration and sea level rise: Some observations from Story Head, Nova Scotia, Canada. J. Coast. Res. 1991, 7, 477–489. [Google Scholar]
- EurOtop. Manual on Wave Overtopping of Sea Defences and Related Structures. An Overtopping Manual Largely Based on European Research, but for Worldwide Application, 2nd ed. 2018. Available online: www.overtopping-manual.com (accessed on 30 January 2021).
- Mason, T.; Coates, T.T. Sediment transport processes on mixed beaches: A review for shoreline management. J. Coast. Res. 2001, 17, 645–657. [Google Scholar]
- Ahrens, J. Dynamic revetments. In Proceedings of the 22nd Conference on Coastal Engineering, Delft, The Netherlands, 2–6 July 1990; Edge, B.L., Ed.; ASCE: Reston, VA, USA, 1990; pp. 1837–1850. [Google Scholar]
- Aminti, P.; Cipriani, L.E.; Enzo, P. “Back to the beach”: Converting sea walls into gravel beaches. In Soft Shore Protection; Goudas, C.L., Ed.; Kluwer Academic Publishers: Dordrecht, The Netherlands, 2003; pp. 261–274. [Google Scholar]
- Jennings, S.; Orford, J.D.; Canti, M.; Devoy, R.J.N.; Straker, V. The role of relative sea-level rise and changing sediment supply on Holocene gravel barrier development: The example of Porlock, Somerset, UK. Holocene 1998, 8, 165–181. [Google Scholar] [CrossRef]
- Bradbury, A.P.; Orford, J.D. Influence of changing management regimes on the morphodynamic response, of a mixed gravel and sand barrier beach. In Proceedings of the Sixth International Symposium on Coastal Engineering and Science of Coastal Sediment Process, New Orleans, LA, 13–17 May 2007; Kraus, N.C., Rosati, J.D., Eds.; ASCE: Dordrecht, The Netherlands, 2007; pp. 1–14. [Google Scholar]
- Bergillos, R.J.; Rodríguez-Delgado, C.; Ortega-Sánchez, M. Advances in management tools for modeling artificial nourishments in mixed beaches. J. Mar. Syst. 2017, 172, 1–13. [Google Scholar] [CrossRef]
- Stéphan, P.; Suanez, S.; Fichaut, B.; Stéphan, P.; Brest-iroise, T.; Copernic, P.N. Long-term morphodynamic evolution of the Sillon de Talbert gravel barrier (Brittany, France). Shore Beach 2012, 80, 19–36. [Google Scholar]
- Stripling, S.; Bradbury, A.P.; Cope, S.N.; Brampton, A.H. Understanding Barrier Beaches; R&D Technical Report FD1924/TR; DEFRA: London, UK, 2008. [Google Scholar]
- André, C.; Boulet, D.; Rey-Valette, H.; Rulleau, B. Protection by hard defence structures or relocation of assets exposed to coastal risks: Contributions and drawbacks of cost-benefit analysis for long-term adaptation choices to climate change. Ocean Coast. Manag. 2016, 134, 173–182. [Google Scholar] [CrossRef]
- Firth, L.B.; Thompson, R.C.; Bohn, K.; Abbiati, M.; Airoldi, L.; Bouma, T.J.; Bozzeda, F.; Ceccherelli, V.U.; Colangelo, M.A.; Evans, A.; et al. Between a rock and a hard place: Environmental and engineering considerations when designing coastal defence structures. Coast. Eng. 2014, 87, 122–135. [Google Scholar] [CrossRef]
- Myatt, L.B.; Scrimshaw, M.D.; Lester, J.N. Public perceptions and attitudes towards a forthcoming managed realignment scheme: Freiston Shore, Lincolnshire, UK. Ocean Coast. Manag. 2003, 46, 565–582. [Google Scholar] [CrossRef]
- Pontee, N.I. Managed realignment in low lying coastal areas: Experiences from the UK. Marit. Eng. J. 2007, 160, 155–166. [Google Scholar] [CrossRef]
- Brown, J.M.; Phelps, J.J.C.; Barkwith, A.; Hurst, M.D.; Ellis, M.A.; Plater, A.J. The effectiveness of beach mega-nourishment, assessed over three management epochs. J. Environ. Manag. 2016, 184, 400–408. [Google Scholar] [CrossRef]
- Dale, J.; Burgess, H.M.; Cundy, A.B. Sedimentation rhythms and hydrodynamics in two engineered environments in an open coast managed realignment site. Mar. Geol. 2017, 383, 120–131. [Google Scholar] [CrossRef]
- Spalding, M.D.; McIvor, A.L.; Beck, M.W.; Koch, E.W.; Möller, I.; Reed, D.J.; Rubinoff, P.; Spencer, T.; Tolhurst, T.J.; Wamsley, T.V.; et al. Coastal ecosystems: A critical element of risk reduction. Conserv. Lett. 2014, 7, 293–301. [Google Scholar] [CrossRef]
- De Vriend, H.; Aarninkhof, S.; van Koningsveld, M. ‘Building with nature’: The new Dutch approach to coastal and river works. In Proceedings of the ICE—Civil Engineering; ICE: London, UK, 2014; Volume 167, pp. 18–24. [Google Scholar]
- Cheong, S.-M.; Silliman, B.; Wong, P.P.; van Wesenbeeck, B.; Kim, C.-K.; Guannel, G. Coastal adaptation with ecological engineering. Nat. Clim. Chang. 2013, 3, 787–791. [Google Scholar] [CrossRef]
- Möller, I. Applying uncertain science to nature-based coastal protection: Lessons from shallow wetland-dominated shores. Front. Environ. Sci. 2019, 7, 49. [Google Scholar] [CrossRef]
- Burgess, H.M.; Kilkie, P. Understanding the physical processes occurring within a new coastal managed realignment site, Medmerry, Sussex, UK. In Proceedings of the ICE Coastal Management; Institute for Civil Engineers: Amsterdam, The Netherlands, 2015; pp. 1–14. [Google Scholar]
- Hudson, C.; Baily, B. Delivering sustainable coasts: Monitoring the long-term stability of a breached barrier beach, Porlock Bay, Somerset, United Kingdom. Ocean Coast. Manag. 2018, 152, 88–99. [Google Scholar] [CrossRef]
- Stéphan, P.; Suanez, S.; Fichaut, B.; Autret, R.; Blaise, E.; Houron, J.; Ammann, J.; Grandjean, P. Monitoring the medium-term retreat of a gravel spit barrier and. Ocean Coast. Manag. 2018, 158, 64–82. [Google Scholar] [CrossRef]
- López de San Román-Blanco, B.; Coates, T.T.; Holmes, P.; Chadwick, A.J.; Bradbury, A.; Baldock, T.E.; Pedrozo-Acuña, A.; Lawrence, J.; Grüne, J. Large scale experiments on gravel and mixed beaches: Experimental procedure, data documentation and initial results. Coast. Eng. 2006, 53, 349–362. [Google Scholar] [CrossRef]
- Robin, N.; Billy, J.; Castelle, B.; Hesp, P.; Nicolae Lerma, A.; Laporte-Fauret, Q.; Marieu, V.; Rosebery, D.; Bujan, S.; Destribats, B.; et al. 150 Years of Foredune Initiation and Evolution Driven by Human and Natural Processes. Geomorphology 2021, 374, 107516. [Google Scholar] [CrossRef]
- Brooks, S.M.; Spencer, T.; Christie, E.K. Storm impacts and shoreline recovery: Mechanisms and controls in the Southern North Sea. Geomorphology 2017, 283, 48–60. [Google Scholar] [CrossRef]
- Environment Agency. Sea State Report Norfolk, Year 3 and Summary for October 2006 September 2009; RP039/N/2014; Environment Agency: Peterborough, UK, 2014.
- Cambers, G. East Anglia Coastal Research Programme: Report 3—Sediment Transport and Coastal Change; University of East Anglia: Norwich, UK, 1975. [Google Scholar]
- Oliver, F.W. Some remarks on Blakeney Point, Norfolk. J. Ecol. 1913, 1, 4–15. [Google Scholar] [CrossRef]
- Hardy, J.R. The movement of beach material and wave action near Blakeney Point, Norfolk. Trans. Pap. 1964, 34, 53–69. [Google Scholar] [CrossRef]
- Brooks, S.M.; Spencer, T.; McIvor, A.; Möller, I. Reconstructing and understanding the impacts of storms and surges, southern North Sea. Earth Surf. Process. Landforms 2016, 41, 855–864. [Google Scholar] [CrossRef][Green Version]
- Hill, T.G.; Hanley, J.A. The structure and water-content of shingle beaches. J. Ecol. 1914, 2, 21–38. [Google Scholar] [CrossRef]
- Oliver, F.W. Report on the Blakeney Point laboratory for the years 1915 and 1916. Trans. Norfolk Norwich Nat. Soc. 1918, 10, 241–255. [Google Scholar]
- Oliver, F.W. Scolt Head Island and Blakeney Point. Trans. Norfolk Norwich Nat. Soc. 1924, 11, 565–577. [Google Scholar]
- Steers, J.A.; Grove, A.T. Shoreline changes on the marshland coast of North Norfolk, 1951–53. Trans. Norfolk Norwich Nat. Soc. 1953, 17, 322–326. [Google Scholar]
- Orford, J.D.; Jennings, S.C.; Pethick, J.S. Extreme storm effect on gravel dominated barriers. In Proceedings of the Coastal Sediments 2003, Clearwater Beach, FL, USA, 18–23 May 2003; Davis, R.A., Sallenger, A., Howd, P., Eds.; World Scientific: Singapore, 2003; pp. 1–14. [Google Scholar]
- Steers, J.A.; Stoddart, D.R.; Bayliss-Smith, T.P.; Spencer, T.; Durbidge, P.M. The storm surge of 11 January 1978 on the East coast of England. Geogr. J. 1979, 11, 453–462. [Google Scholar] [CrossRef]
- White, D.B. The effects of the storm of 11th January 1978 on Blakeney Point. Trans. Norfolk Norwich Nat. Soc. 1979, 25, 267–269. [Google Scholar]
- Spencer, T.; Brooks, S.M.; Evans, B.R.; Tempest, J.A.; Möller, I. Southern North Sea storm surge event of 5 December 2013: Water levels, waves and coastal impacts. Earth Sci. Rev. 2015, 146, 120–145. [Google Scholar] [CrossRef]
- Matthews, T.; Murphy, C.; Wilby, R.L.; Harrigan, S. Stormiest winter on record for Ireland and UK. Nat. Clim. Chang. 2014, 4, 738–740. [Google Scholar] [CrossRef]
- DEFRA. DEFRA Data Services Platform. Available online: http://environment.data.gov.uk/ (accessed on 1 December 2018).
- Jäger, W.S.; Christie, E.K.; Hanea, A.M.; den Heijer, C.; Spencer, T. A Bayesian network approach for coastal risk analysis and decision making. Coast. Eng. 2018, 134, 48–61. [Google Scholar] [CrossRef]
- Hervouet, J.-M. TELEMAC modelling system: An overview. Hydrol. Process. 2000, 14, 2209–2210. [Google Scholar] [CrossRef]
- Booij, N.; Holthuijsen, L.H.; Ris, R.C. The “Swan” wave model for shallow water. In Proceedings of the 25th International Conference on Coastal Engineering 1996, Orlando, FL, USA, 2–6 September 1996; pp. 668–676. [Google Scholar]
- McCall, R.T.; Masselink, G.; Poate, T.G.; Roelvink, J.A.; Almeida, L.P. Modelling the morphodynamics of gravel beaches during storms with XBeach-G. Coast. Eng. 2015, 103, 52–66. [Google Scholar] [CrossRef]
- McCall, R.T.; Masselink, G.; Poate, T.G.; Roelvink, J.A.; Almeida, L.P.; Davidson, M.; Russell, P.E. Modelling storm hydrodynamics on gravel beaches with XBeach-G. Coast. Eng. 2014, 91, 231–250. [Google Scholar] [CrossRef]
- Christie, E.K.; Spencer, T.; Owen, D.; McIvor, A.L.; Möller, I.; Viavattene, C. Regional coastal flood risk assessment for a tidally dominant, natural coastal setting: North Norfolk, southern North Sea. Coast. Eng. 2018, 134, 177–190. [Google Scholar] [CrossRef]
- National Oceanography Centre. National Oceanography Centre: Model Information CS3X. Available online: https://noc.ac.uk/files/documents/business/model-info-CS3X.pdf. (accessed on 1 December 2018).
- UK Met Office. Numerical Weather Prediction Models. Available online: https://www.metoffice.gov.uk/research/approach/modelling-systems/unified-model/weather-forecasting (accessed on 1 December 2018).
- UK Hydrographic Office. Offshore bathymetry products. Available online: https://www.gov.uk/guidance/inspire-portal-and-medin-bathymetry-data-archive-centre#about-the-admiralty-marine-data-portal. (accessed on 1 December 2018).
- Channel Coastal Observatory. Regional Coastal Monitoring Programmes. Available online: http://www.channelcoast.org/ (accessed on 1 December 2018).
- Lessnoff, A. Vertical Offshore Reference Frame UK Model: User Guide. 2008. Available online: https://www.ucl.ac.uk/civil-environmental-geomatic-engineering/research/groups-centres-and-sections/vertical-offshore-reference-frames-vorf (accessed on 1 December 2018).
- UK National Tidal and Sea Level Facility UK National Tide Gauge Network. Available online: https://www.ntslf.org/ (accessed on 1 December 2018).
- Bunney, C.; Saulter, A. An ensemble forecast system for prediction of Atlantic–UK wind waves. Ocean Model. 2015, 96, 103–116. [Google Scholar] [CrossRef]
- Gale, S.J.; Hoare, P.G. Quaternary Sediments: Petrographic Methods for the Study of Unlithified Rocks; The Blackburn Press: Caldwell, NJ, USA, 2011. [Google Scholar]
- Van Rijn, L.C.; Wasltra, D.J.R.; Grasmeijer, B.; Sutherland, J.; Pan, S.; Sierra, J.P. The predictability of cross-shore bed evolution of sandy beaches at the time scale of storms and seasons using process-based profile models. Coast. Eng. 2003, 47, 295–327. [Google Scholar] [CrossRef]
- Roelvink, D.; Van Dongeren, A.; McCall, R.; Hoonhout, B.; van Rooijen, A.; van Geer, P.; de Vet, L.; Nederhoff, K.; Quataert, E. XBeach Technical Reference: Kingsday Release. Model Description and Reference Guide to Functionalities; Deltares: Delft, The Netherlands, 2015. [Google Scholar]
- Holman, R.A. Extreme value statistics for wave run-up on a natural beach. Coast. Eng. 1986, 9, 527–544. [Google Scholar] [CrossRef]
- Phillips, B.T.; Brown, J.M.; Plater, A.J. Modeling impact of intertidal foreshore evolution on gravel barrier erosion and wave runup with xbeach-x. J. Mar. Sci. Eng. 2020, 8, 914. [Google Scholar] [CrossRef]
- Andrews, J. Spit extension and barrier rollover at Blakeney Point and Salthouse: Historic maps and field observations. Bull. Geol. Soc. Norfolk 2019, 69, 1–28. [Google Scholar]
- Orford, J.; Barry, L.; Collins, T. Can coastal gravel-dominated coastal barriers show persistent resilient morphological tuning to extreme storms? Geophys. Res. Abstr. 2018, 20, 6041. [Google Scholar]
- Orford, J.D.; Forbes, D.L.; Jennings, S.C. Organisational controls, typologies and time scales of paraglacial gravel-dominated coastal systems. Geomorphology 2002, 48, 51–85. [Google Scholar] [CrossRef]
- Orford, J.D.; Carter, R.W.G.; Jennings, S.C. Coarse clastic barrier environments: Evolution and implications for quaternary sea level interpretation. Quat. Int. 1991, 9, 87–104. [Google Scholar] [CrossRef]
- Masselink, G.; Puleo, J.A. Swash-zone morphodynamics. Cont. Shelf Res. 2006, 26, 661–680. [Google Scholar] [CrossRef]
- Battjes, J. Surf Similarity. In Proceedings of the 14th International Conference on Coastal Engineering, Copenhagen, Denmark, 24–28 June 1974; pp. 466–480. [Google Scholar]
- Poate, T.; Masselink, G.; Davidson, M.; McCall, R.; Russell, P.; Turner, I. High frequency in-situ field measurements of morphological response on a fine gravel beach during energetic wave conditions. Mar. Geol. 2013, 342, 1–13. [Google Scholar] [CrossRef]
- Poate, T.G.; McCall, R.T.; Masselink, G. A new parameterisation for runup on gravel beaches. Coast. Eng. 2016, 117, 176–190. [Google Scholar] [CrossRef]
- Bujan, N.; Cox, R.; Masselink, G. From fine sand to boulders: Examining the relationship between beach-face slope and sediment size. Mar. Geol. 2019, 417, 1–17. [Google Scholar] [CrossRef]
- Earlie, C.; Masselink, G.; Russell, P. The role of beach morphology on coastal cliff erosion under extreme waves. Earth Surf. Process. Landforms 2018, 43, 1213–1228. [Google Scholar] [CrossRef]
- Schwartz, R.K. Nature and Genesis of Some Storm Washover Deposits; Coastal Engineering Research Center: Springfield, VA, USA, 1975. [Google Scholar]
- Orford, J.D.; Carter, R.W.G.; Jennings, S.C.; Hinton, A.C. Processes and timescales by which a coastal gravel-dominated barrier responds geomorphologically to sea-level rise: Story head barrier, Nova Scotia. Earth Surf. Process. Landforms 1995, 20, 21–37. [Google Scholar] [CrossRef]
- Sallenger, A.H. Storm Impact Scale for Barrier Islands. J. Coast. Res. 2000, 16, 890–895. [Google Scholar] [CrossRef]
- Leatherman, S.P. Migration of Assateague Island, Maryland, by inlet and overwash processes. Geology 1979, 7, 104–107. [Google Scholar] [CrossRef]
- Pollard, J.A.; Brooks, S.M.; Spencer, T.; Christie, E.K.; Möller, I. Flooding-erosion interactions: Implications for coastal risk management. In Proceedings of the Institution of Civil Engineers—Coastal Management; Institute for Civil Engineers: La Rochelle, France, 2019; pp. 1–14. [Google Scholar]
- Cañizares, R.; Irish, J.L. Simulation of storm-induced barrier island morphodynamics and fl ooding. Coast. Eng. 2008, 55, 1089–1101. [Google Scholar] [CrossRef]
- Cowell, P.J.; Zeng, T.Q. Integrating Uncertainty Theories with GIS for Modeling Coastal Hazards of Climate Change. Mar. Geod. 2003, 26, 5–18. [Google Scholar] [CrossRef]
- Ruggiero, P.; Holman, R.A.; Beach, R.A. Wave run-up on a high-energy dissipative beach. J. Geophys. Res. 2004, 109, 1–12. [Google Scholar] [CrossRef]
- Stockdon, H.F.; Holman, R.A.; Howd, P.A.; Sallenger Jr, A.H. Empirical parametization of setup, swash and runup. Coast. Eng. 2006, 53, 573–588. [Google Scholar] [CrossRef]
- Matias, A.; Blenkinsopp, C.E.; Masselink, G. Detailed investigation of overwash on a gravel barrier. Mar. Geol. 2014, 350, 27–38. [Google Scholar] [CrossRef]
- Matias, A.; Rita Carrasco, A.; Loureiro, C.; Masselink, G.; Andriolo, U.; McCall, R.; Ferreira, Ó.; Plomaritis, T.A.; Pacheco, A.; Guerreiro, M. Field measurements and hydrodynamic modelling to evaluate the importance of factors controlling overwash. Coast. Eng. 2019, 152, 1–19. [Google Scholar] [CrossRef]
Publisher’s Note: MDPI stays neutral with regard to jurisdictional claims in published maps and institutional affiliations. |
© 2021 by the authors. Licensee MDPI, Basel, Switzerland. This article is an open access article distributed under the terms and conditions of the Creative Commons Attribution (CC BY) license (http://creativecommons.org/licenses/by/4.0/).

