
Centennial to Multi-Decadal Morphology Change and Sediment Budget Alteration with Consideration of the Impacts of the 2011 Tohoku Earthquake Tsunami along the Nobiru Coast, Japan


Abstract
:1. Introduction
2. Background
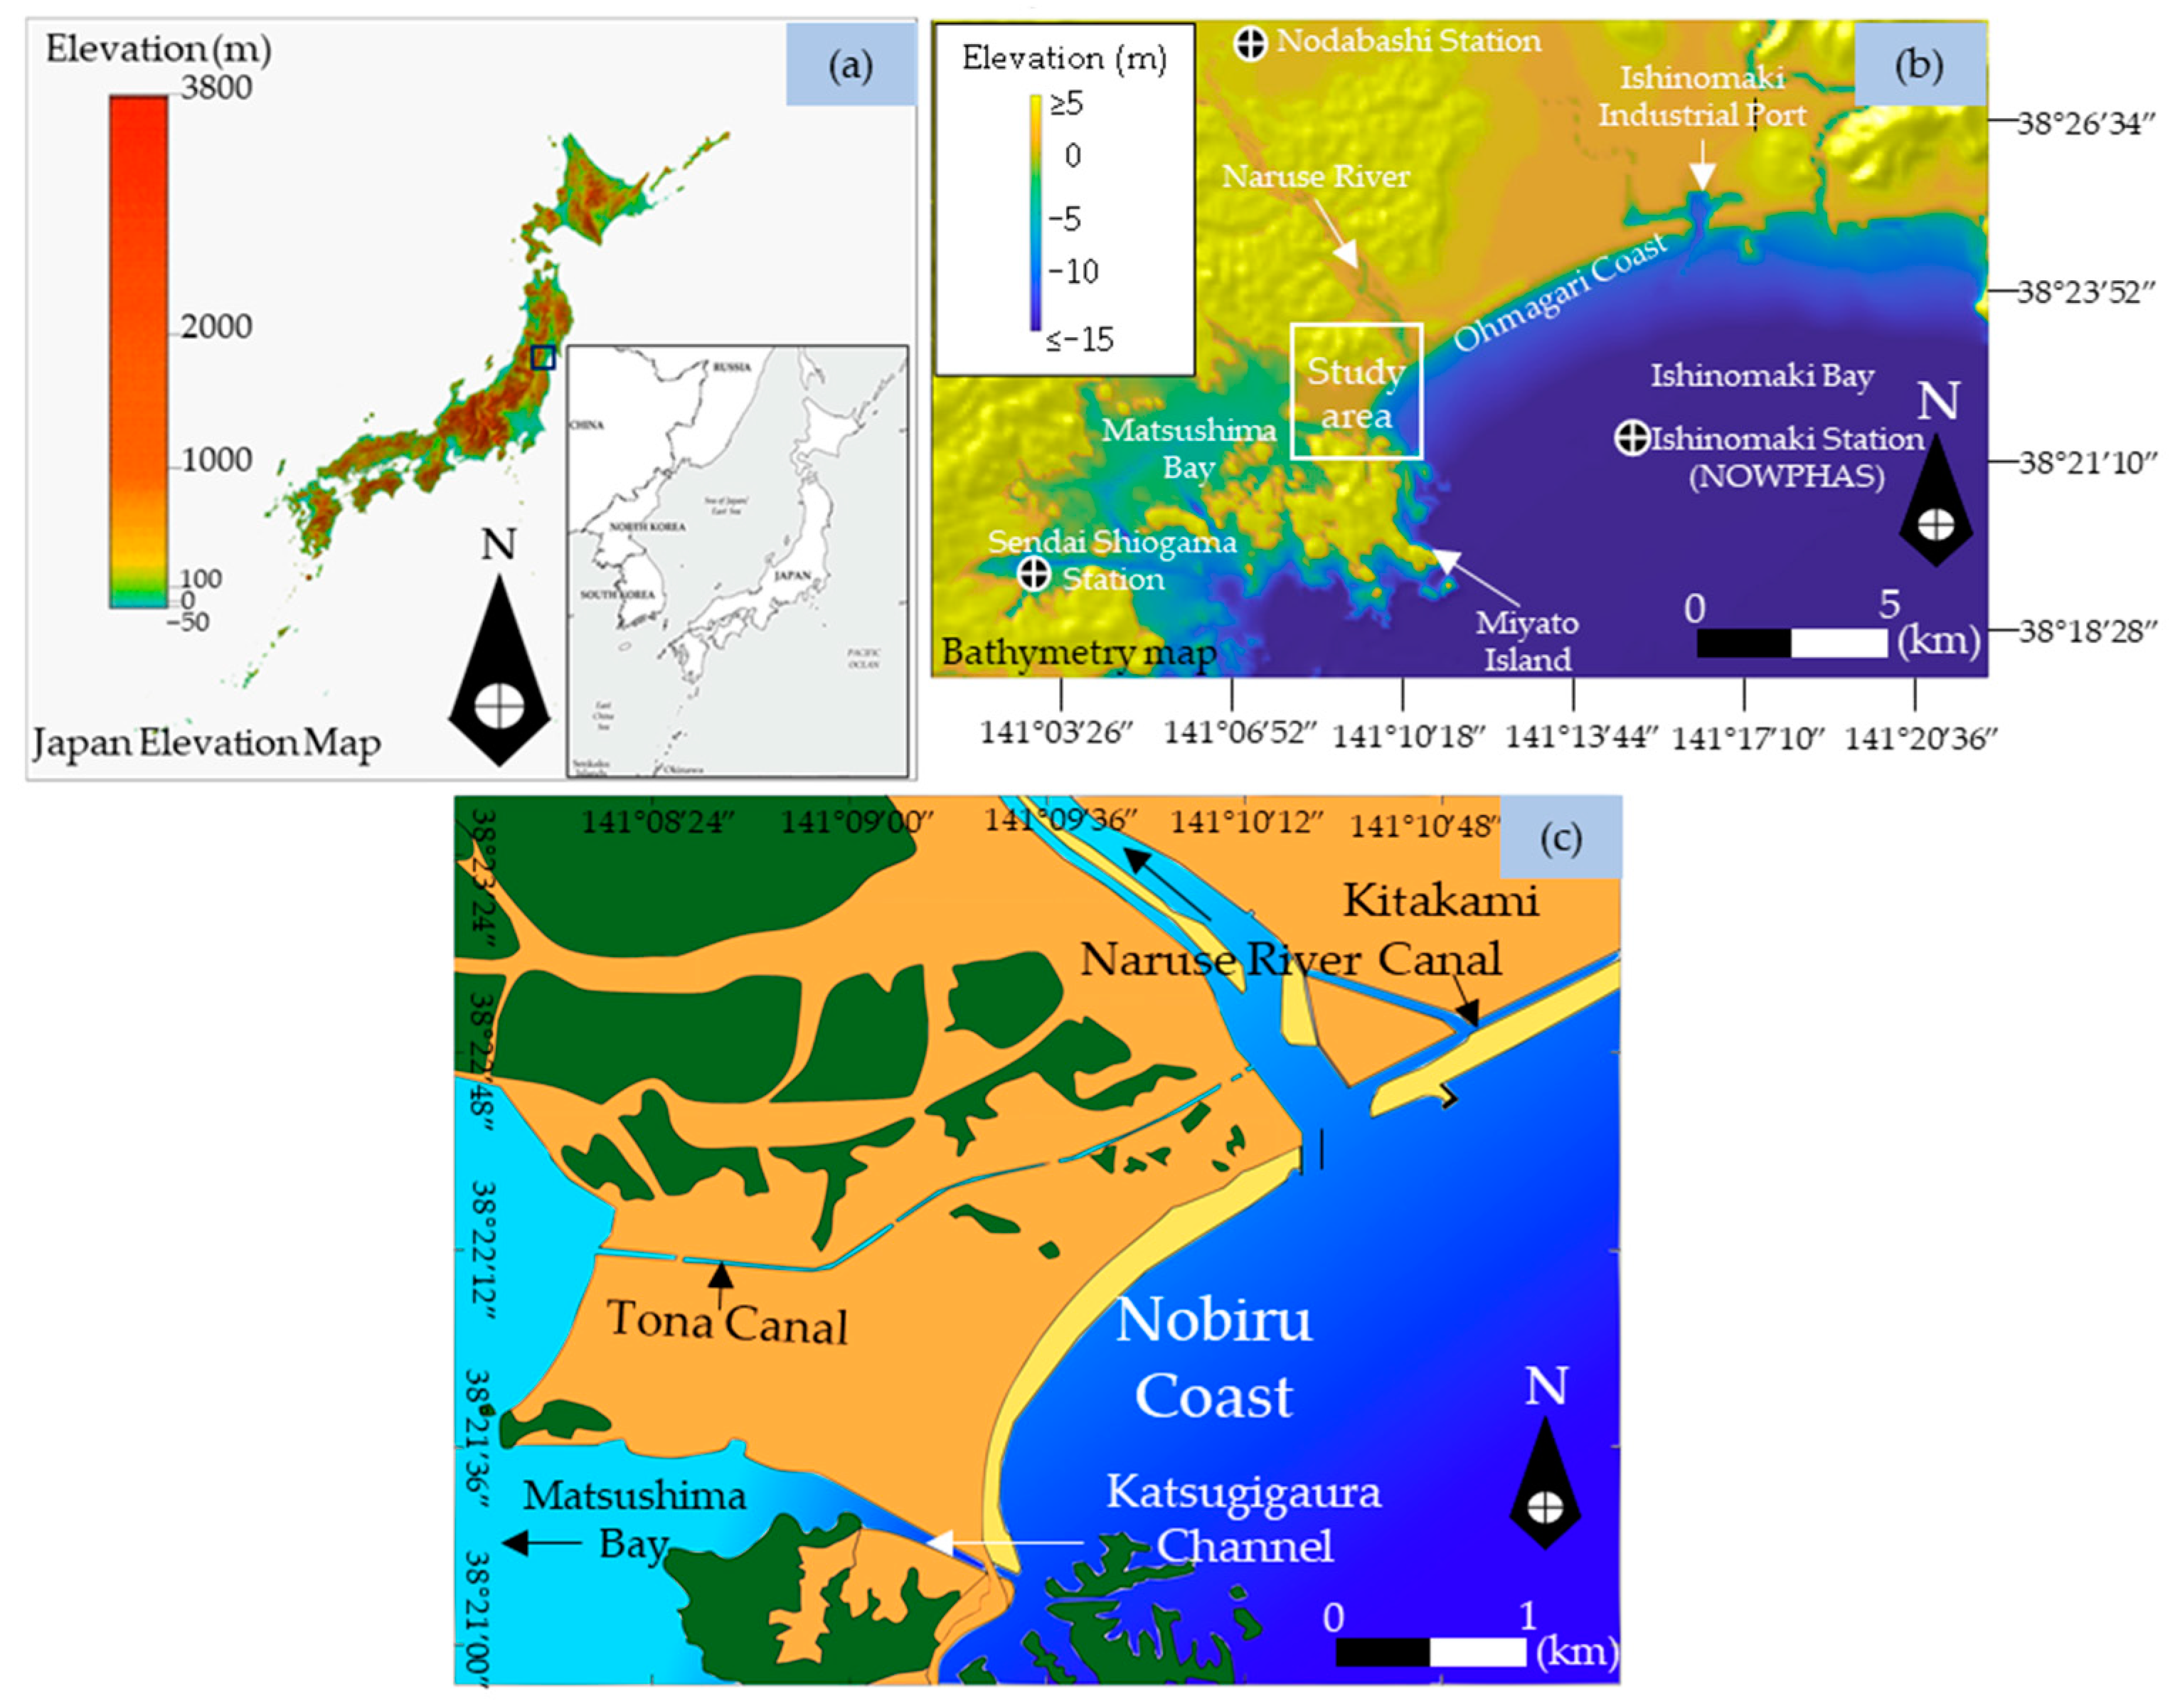
2.1. Study Area
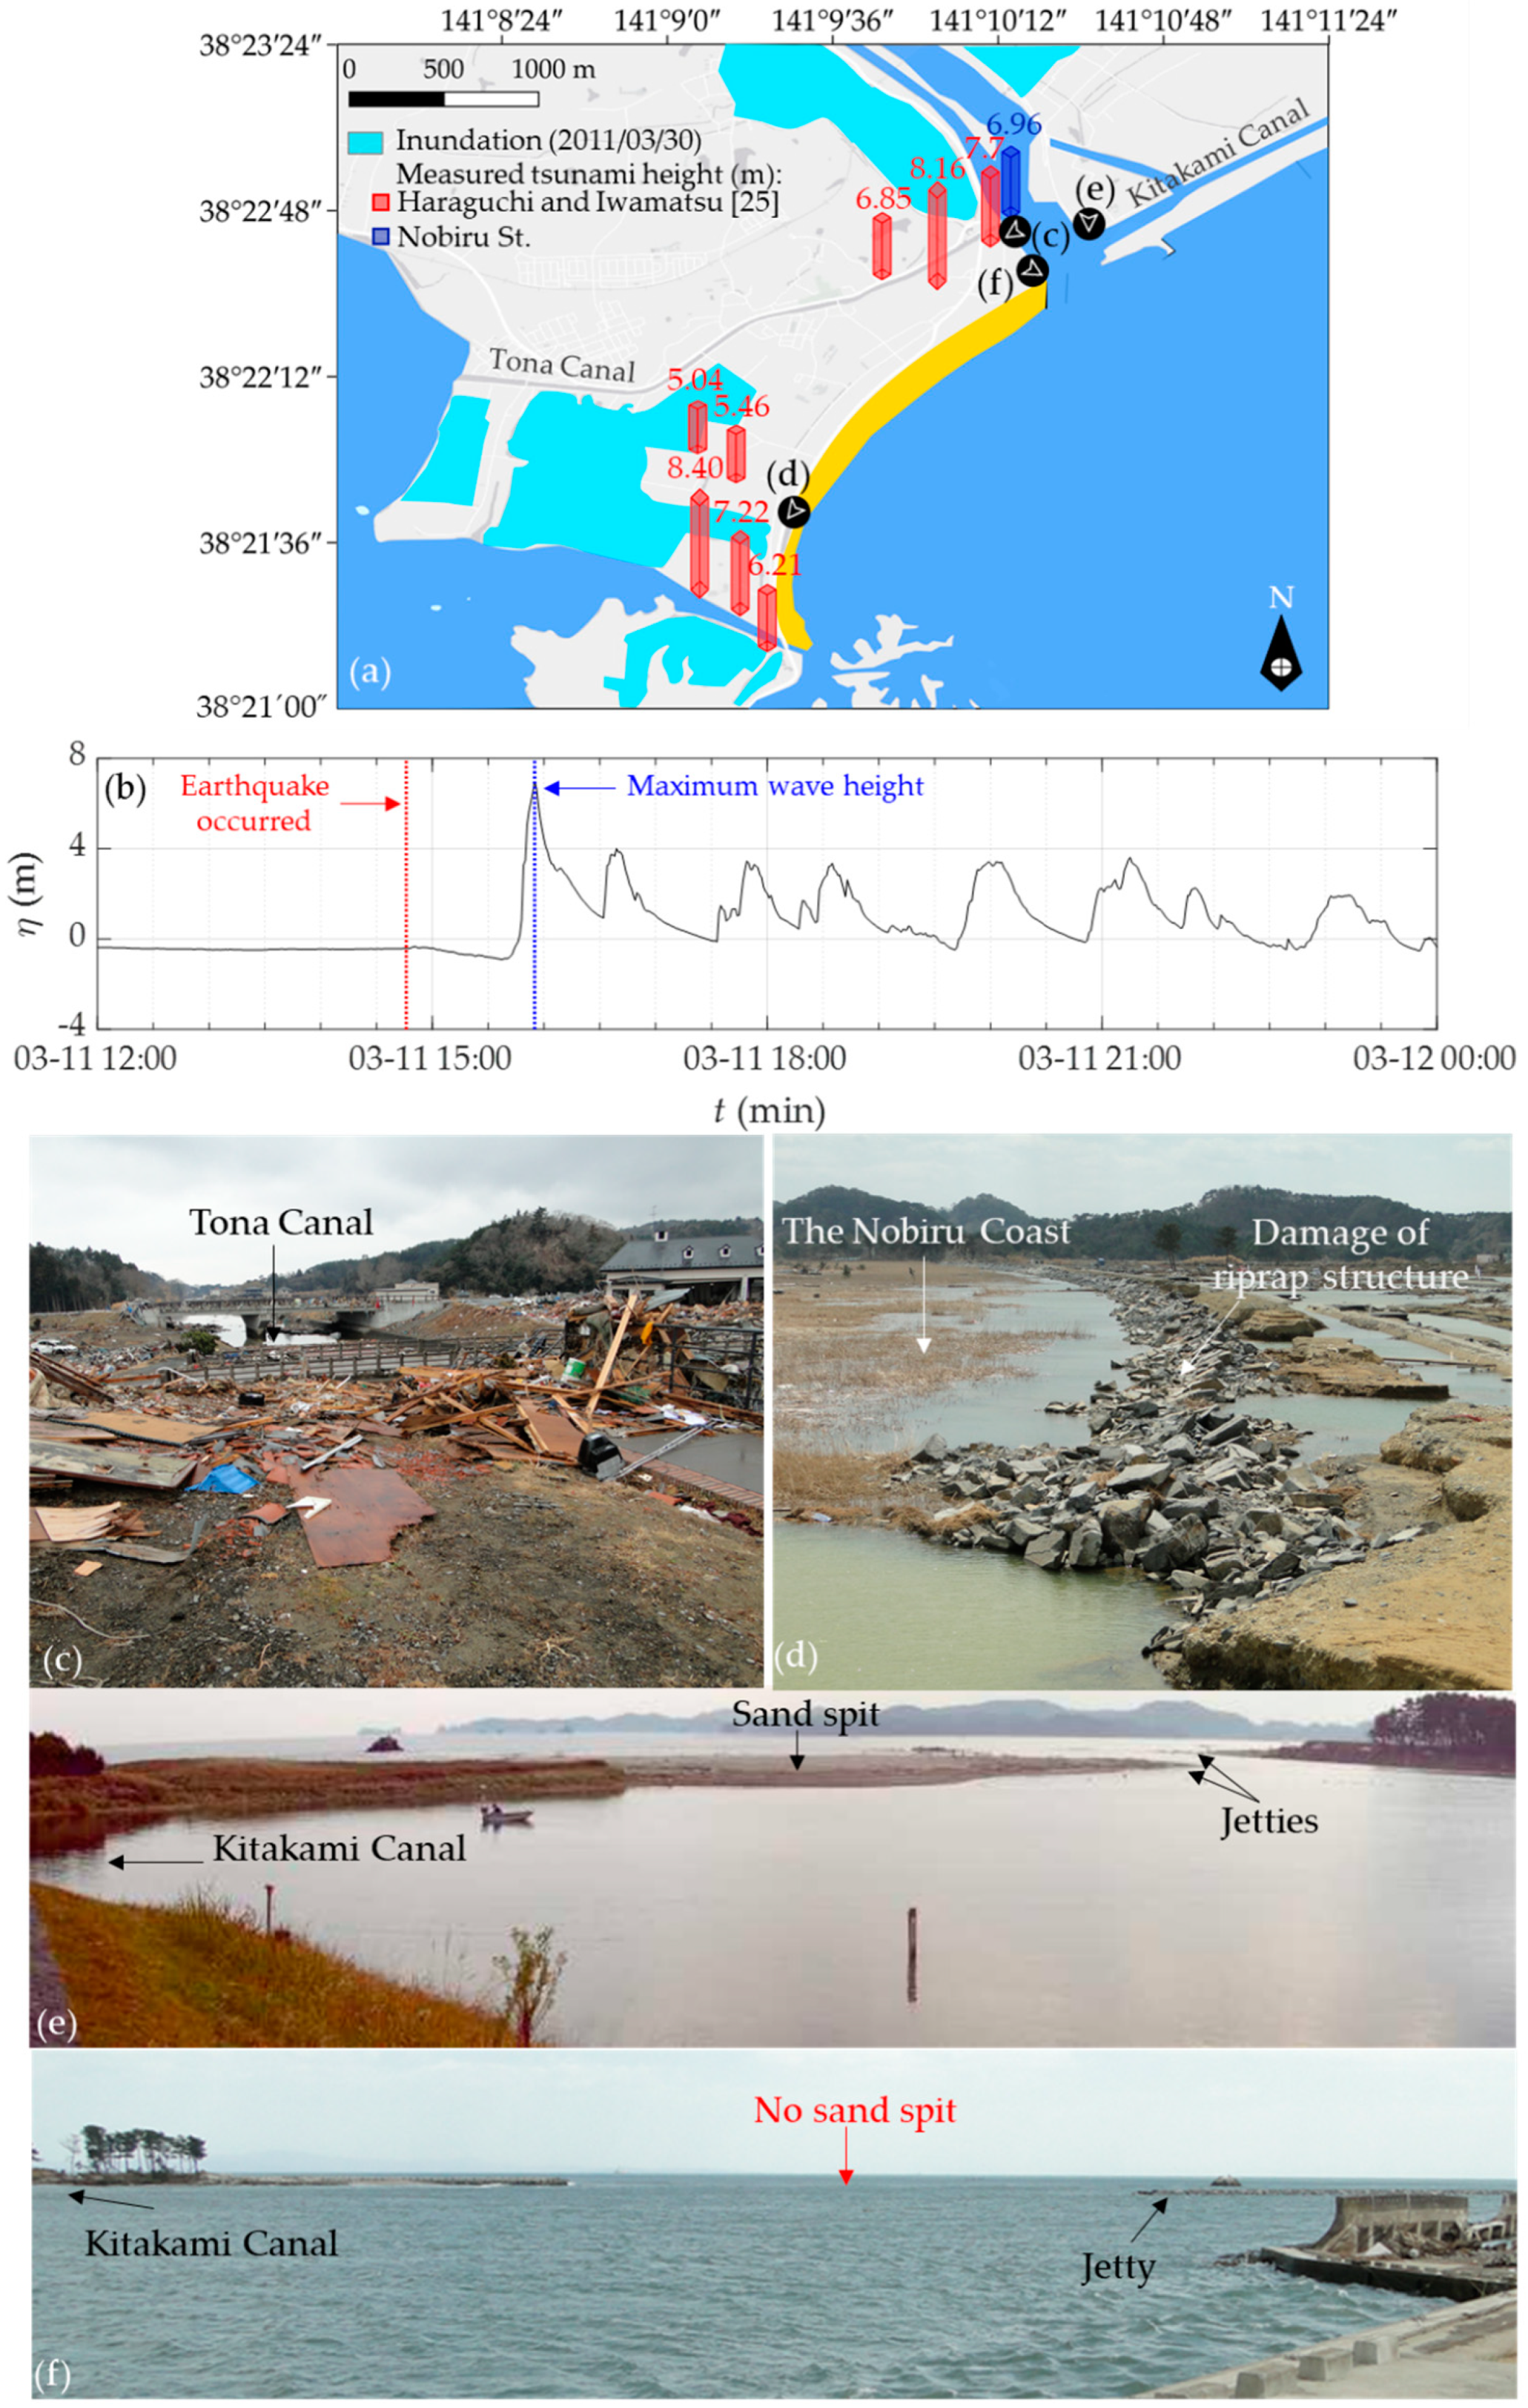
2.2. Impacts of the 2011 Great East Earthquake and Tsunami
3. Materials and Methods
3.1. Historical Shoreline-Change Analysis
3.2. Spatial Behavior of Depth of Closure along the Nobiru Coast
3.3. Sediment Budget
4. Results and Discussion
4.1. Centennial to Multi-Decadal Morphology Change in the Nobiru Coast
4.2. Spatial Offshore Limit of Bathymetry Change along the Nobiru Coast
4.3. Annual Net Sediment Input and Reduction Due to the Disappearance of the Sandspit of the Naruse River Mouth
4.4. Centennial to Decadal Sediment Budget at the Nobiru Coast and Future Management Implication
5. Conclusions
Author Contributions
Funding
Institutional Review Board Statement
Informed Consent Statement
Data Availability Statement
Acknowledgments
Conflicts of Interest
References
- Liu, P.L.F.; Lynett, P.; Fernando, H.; Jaffe, B.E.; Fritz, H.; Higman, B.; Morton, R.; Goff, J.; Synolakis, C. Observations by the international tsunami survey team in SriLanka. Science 2005, 308, 1595. [Google Scholar] [CrossRef]
- Borrero, J.C. Field survey of northern Sumatra and Banda Aceh, Indonesia after the tsunami and earthquake of 26 December 2004. Seismol. Res. Lett. 2005, 76, 312–320. [Google Scholar] [CrossRef]
- Mori, N.; Takahashi, T.; Yasuda, T.; Yanagisawa, H. Survey of 2011 Tohoku earthquake tsunami inundation and run-up. Geophys. Res. Lett. 2011, 38. [Google Scholar] [CrossRef]
- Fritz, H.M.; Petroff, C.M.; Catalán, P.A.; Cienfuegos, R.; Winckler, P.; Kalligeris, N.; Weiss, R.; Barrientos, S.E.; Meneses, G.; Valderas-Bermejo, C.; et al. Field survey of the 27 February 2010 Chile tsunami. Pure Appl. Geophys. 2011, 168, 1989–2010. [Google Scholar] [CrossRef]
- Takahashi, T.; Shuto, N.; Imamura, F.; Asai, D. Modeling sediment transport due to tsunamis with exchange rate between bed load layer and suspended load layer. In Proceedings of the 27th International Conference on Coastal Engineering, Sydney, Australia, 16–21 July 2001; pp. 1508–1519. [Google Scholar]
- Chavanich, S.; Siripong, A.; Sojisuporn, P.; Menasveta, P. Impact of tsunami on the 462 seafloor and corals in Thailand. Coral Reefs. 2005, 24, 535. [Google Scholar] [CrossRef]
- Umitsu, M.; Tanavud, C.; Patanakanog, B. Effects of landforms on tsunami flow in the plains of Banda Aceh, Indonesia, and Nam Khem, Thailand. Mar. Geol. 2007, 242, 141–153. [Google Scholar] [CrossRef]
- Pari, Y.; Ramana Murthy, M.V.; Jaya Kumar, S.; Subramanian, B.R.; Ramachandran, S. Morphological changes at Vellar estuary, India and impact of the December 2004 tsunami. J. Environ. Manag. 2008, 89, 45–57. [Google Scholar] [CrossRef] [PubMed]
- Matsumoto, D.; Naruse, H.; Fujino, S.; Surphawajruksakul, A.; Jarupongsakul, T.; Sakakura, N.; Murayama, M. Truncated flame structures within a deposit of the Indian Ocean Tsunami: Evidence of syn-sedimentary deformation. Sedimentology 2008, 55, 1559–1570. [Google Scholar] [CrossRef]
- Tanaka, H.; Tinh, N.X.; Umeda, M.; Hirao, R.; Pradjiko, E.; Mano, A.; Udo, K. Coastal and estuarine morphology changes induced by the 2011 Great East Japan earthquake tsunami. Coast. Eng. J. 2012, 54, 1250010. [Google Scholar] [CrossRef]
- Suppasri, A.; Koshimura, S.; Imai, K.; Mas, E.; Gokon, H.; Muhari, A.; Imamura, F. Damage characteristic and field survey of the 2011 Great East Japan Tsunami in Miyagi Prefecture. Coast. Eng. J. 2012, 54, 1250010. [Google Scholar] [CrossRef]
- Tappin, D.R.; Evans, H.M.; Jordan, C.J.; Richmond, B.; Sugawara, D.; Goto, K. Coastal changes in the Sendai area from the impact of 2011Tohoku-oki tsunami: Interpretations of time series satellite images, helicopter-borne video footage and field observation. Sediment. Geol. 2012, 282, 151–174. [Google Scholar] [CrossRef]
- Udo, K.; Sugawara, D.; Tanaka, H.; Imai, K.; Mano, A. Impact of the 2011 Tohoku earthquake and tsunami on beach morphology along the northern Sendai Coast. Coast. Eng. J. 2012, 54, 1250009. [Google Scholar] [CrossRef]
- Adityawan, M.B.; Dao, N.X.; Tanaka, H.; Mano, A.; Udo, K. Morphological changes along the Ishinomaki coast induced by the 2011 Great East Japan Tsunami and the relationship with coastal structures. Coast. Eng. J. 2014, 56, 1450016. [Google Scholar] [CrossRef]
- Choowong, M.; Phantuwongraj, S.; Charoentitirat, T.; Chutakositkano, B.; Yumuang, S.; Charusiri, P. Beach recovery after 2004 Indian Ocean tsunami from Phang-Nga Thailand. Geomorphology 2009, 104, 134–142. [Google Scholar] [CrossRef]
- Koiwa, N.; Takahashi, M.; Sugisawa, S.; Ito, A.; Matsumoto, H.; Tanavud, C.; Goto, K. Barrier spit recovery following the 2004 Indian Ocean tsunami at Pakarang Cape, southwest Thailand. Geomorphology 2017, 306, 314–324. [Google Scholar] [CrossRef]
- Tanaka, H.; Adityawan, M.B.; Mano, A. Morphological changes at the Nanakita River mouth after the Great East Japan Tsunami of 2011. Coast. Eng. 2014, 86, 14–26. [Google Scholar] [CrossRef] [Green Version]
- Roh, M.; Tanaka, H.; Mitobe, Y. Morphological characteristics of river mouths after the 2011 Tohoku Tsunami in Miyagi Prefecture. In Tsunamis and Earthquakes in Coastal Environments; Santiago-Fandino, V., Tanaka, H., Spiske, M., Eds.; Springer: Berlin/Heidelberg, Germany, 2016; pp. 137–152. [Google Scholar]
- Udo, K.; Tojo, K.; Takeda, Y.; Tanaka, H.; Mano, A. Characteristics of shoreline retreat due to the 2011 Tohoku Earthquake Tsunami and its recovery after three years. In Tsunamis and Earthquakes in Coastal Environments; Santiago-Fandino, V., Tanaka, H., Spiske, M., Eds.; Springer: Berlin/Heidelberg, Germany, 2016; pp. 113–123. [Google Scholar]
- Tanaka, H.; Hiep, N.T. Decadal morphological recovery of estuaries and coasts after the 2011 Tohoku Tsunami. In Lecture Notes in Civil Engineering; Reddy, J., Wang, C., Luong, V., Le, A., Eds.; Springer: Berlin/Heidelberg, Germany, 2019; Volume 80, pp. 31–41. [Google Scholar]
- Inoue, K.; Tanaka, H.; Izumi, N. Evaluation of long-term longshore sediment transport rate on Ishinomaki Coast. In Proceedings of the Coastal Engineering (JSCE), Kushiro, Japan, 23–25 October 2002; Volume 49, pp. 516–520. (In Japanese). [Google Scholar]
- Takahashi, T.; Tanaka, H. Change in morphology and sediment budget in the vicinity of Ishinomaki Port. In Proceedings of the International Conference on Asian and Pacific Coast, Jeju, Korea, 4–8 September 2005; pp. 797–801. [Google Scholar]
- Mochizuki, T.; Uda, T.; Ohrui, M.; Ohya, Y. Recent topography change on Sendai Bay. In Proceedings of the Coastal Engineering (JSCE), Hachinohe, Japan, 13–15 November 1990; Volume 37, pp. 369–373. (In Japanese). [Google Scholar]
- Sato, S.; Yamamoto, K.; Wada, K.; Izawa, T.; Otani, Y.; Hashimoto, S. Observation of longshore sediment transport around headlands in the Omagari Coast and prediction of beach changes. In Proceedings of the Coastal Engineering (JSCE), Akita, Japan, 13–15 November 1998; Volume 45, pp. 556–560. (In Japanese). [Google Scholar]
- Haraguchi, T.; Iwamatsu, A. Detailed Maps of the Impacts of the 2011 Japan Tsunami; Kokonshoin: Tokyo, Japan, 2011. (In Japanese) [Google Scholar]
- Tanaka, H.; Kayane, K.; Adityawan, M.B.; Roh, M.; Farid, M. Study on the relation of river morphology and tsunami propagation in rivers. Ocean Dyn. 2014, 64, 1319–1332. [Google Scholar] [CrossRef]
- Tolkova, E.; Tanaka, H.; Roh, M. Tsunami observations in rivers from a perspective of tsunami interaction with tide and riverine flow. Pure Appl. Geophys. 2015, 172, 953–968. [Google Scholar] [CrossRef]
- Tanaka, H.; Tinh, N.X.; Hiep, N.T.; Kayane, K.; Roh, M.; Umeda, M.; Sasaki, M.; Kawagoe, S.; Tsuchiya, M. Intrusion distance and flow discharge in rivers during the 2011 Tohoku Tsunami. J. Mar. Sci. Eng. 2020, 8, 882. [Google Scholar] [CrossRef]
- Tanaka, H.; Takahashi, G.; Matsutomi, H.; Izumi, N. Application of old maps for studying long-term shoreline change. In Proceedings of the 30th International Conference on Coastal Engineering, San Diego, CA, USA, 3–8 September 2006; pp. 4022–4534. [Google Scholar]
- Tanaka, H.; Matsutomi, H.; Izumi, N. Analysis of historical shoreline change in Miyagi and Fukushima Prefecture, Japan. In Proceedings of the International Conference on Asian and Pacific Coasts, Jeju, Korea, 4–8 September 2005; pp. 797–801. [Google Scholar]
- Iwamoto, K.; Hein, C.M. Cross-Cultural Engineering: The role of Dutch civil engineering in modern port planning in Japan (1870s–1890s). In Proceedings of the 18th International Planning History Society Conference, Yokohama, Japan, 15–19 July 2018; pp. 2468–6956. [Google Scholar]
- Boak, E.; Turner, I. Shoreline Definition and Detection: A Review. J. Coast. Res. 2005, 21, 688–703. [Google Scholar] [CrossRef] [Green Version]
- Everitt, B.S.; Landau, S.; Leese, M.; Stahl, D. Cluster Analysis, 5th ed.; Wiley: Hoboken, NJ, USA, 2011; p. 330. [Google Scholar]
- Hennig, C.; Meila, M.; Murtagh, F.; Rocci, R. Handbook of Cluster Analysis, 1st ed.; Chapman and Hall/CRC: New York, NY, USA, 2015; p. 753. [Google Scholar]
- Burningham, H.; French, J. Understanding coastal change using shoreline trend analysis supported by cluster-based segmentation. Geomorphology 2017, 282, 131–149. [Google Scholar] [CrossRef]
- Otsu, N. A threshold selection method from gray-level histograms. IEEE Trans. Syst. Man Cybern. Syst. 1979, 20, 62–66. [Google Scholar] [CrossRef] [Green Version]
- Valiente, N.G.; Masselink, G.; Scott, T.; Conley, D.; McCarroll, R.J. Role of waves and tides on depth of closure and potential for headland bypassing. Mar. Geol. 2019, 407, 60–75. [Google Scholar] [CrossRef]
- Anthony, E.J.; Aagaard, T. The lower shoreface: Morphodynamics and sediment connectivity with the upper shoreface and beach. Earth Sci. Rev. 2020, 210, 103334. [Google Scholar] [CrossRef]
- Stive, M.J.F.; de Vriend, H.J.; Nicholls, R.J.; Capobianco, M. Shore nourishment and the active zone: A time scale dependent view. In Proceedings of the 23th International Conference, Venice, Italy, 4–9 October 1992; pp. 2464–2473. [Google Scholar]
- Stive, M.J.F.; Roelvink, D.A.; de Vriend, H.J. Large-scale coastal evolution concept. The Dutch Coast, Paper No. 9. In Proceedings of the 22nd International Conference on Coastal Engineering, Delft, The Netherlands, 2–6 July 1990; p. 13. [Google Scholar]
- Stive, M.J.F.; de Vriend, H.J. Modeling shoreface profile evolution. Mar. Geol. 1995, 126, 235–248. [Google Scholar] [CrossRef] [Green Version]
- Sabatier, F.; Stive, M.J.F.; Pons, F. Longshore variation of depth of closure on a micro-tidal wave-dominated coast. In Proceedings of the 29th International Conference, National Civil Engineering Laboratory, Lisbon, Portugal, 19–24 September 2004; pp. 2327–2339. [Google Scholar]
- Hinton, C.; Nicholls, R.J. Spatial and temporal behavior of depth of closure along the Holland coast. In Proceedings of the 26th International Conference on Coastal Engineering, Copenhagen, Denmark, 22–26 June 1998; pp. 2913–2925. [Google Scholar]
- Sato, Y. Air Travel in Taisho and Early Showa Period: CHOJINKI (Archives of a Birdman) in Sendai and Miyagi; Seiado: Sendai, Japan, 2019; p. 127. (In Japanese) [Google Scholar]
- Dao, N.X.; Adityawan, M.B.; Tanaka, H.; Sundar, V. Sensitivity analysis of relationship between tsunami disaster and coastal embankment structure. J. JSCE (Hydraulic Eng.) 2014, 58, 43–48. [Google Scholar] [CrossRef] [Green Version]
- Uda, T. Beach Erosion in Japan; Sankaido Press: Tokyo, Japan, 1997; p. 242. (In Japanese) [Google Scholar]
- Widyaningtia, H.T.; Kanayama, S. Depth of closure determination in the vicinity of coastal structure. In Proceedings of the 33rd International Conference on Coastal Engineering, Santander, Spain, 1–6 July 2012; p. 15. [Google Scholar]
- Pelnard-Considere, R. Essai de Theorie de l’Evolutio des Form de Rivage en Plage de Sable et de Galets. In Proceedings of the 4th Journees de l’Hydaulique, Les Energies de la Mer, Question III, La Houille Blanche, Grenoble, France, 13–15 June 1956; Volume 1, pp. 289–298. [Google Scholar]
- Rosati, J.D.; Kraus, N.C. Formulation of Sediment Budgets at Inlets. Coastal Engineering Technical Notes CETN IV-15, Vicksburg, Mississippi: Coastal Inlets Research Program; US Army Corps of Engineers: Washington, DC, USA, 1998; p. 16.
- Hiep, N.T.; Tanaka, H.; Tinh, N.X. Post-tsunami recovery and morphology change at Naruse River mouth, Japan. In Proceedings of the 10th International Conference on Asian and Pacific Coasts, Hanoi, Vietnam, 25–28 September 2019; pp. 797–801. [Google Scholar]


Publisher’s Note: MDPI stays neutral with regard to jurisdictional claims in published maps and institutional affiliations. |
© 2021 by the authors. Licensee MDPI, Basel, Switzerland. This article is an open access article distributed under the terms and conditions of the Creative Commons Attribution (CC BY) license (http://creativecommons.org/licenses/by/4.0/).
Share and Cite
Hiep, N.T.; Tanaka, H.; Tinh, N.X. Centennial to Multi-Decadal Morphology Change and Sediment Budget Alteration with Consideration of the Impacts of the 2011 Tohoku Earthquake Tsunami along the Nobiru Coast, Japan. J. Mar. Sci. Eng. 2021, 9, 265. https://doi.org/10.3390/jmse9030265
Hiep NT, Tanaka H, Tinh NX. Centennial to Multi-Decadal Morphology Change and Sediment Budget Alteration with Consideration of the Impacts of the 2011 Tohoku Earthquake Tsunami along the Nobiru Coast, Japan. Journal of Marine Science and Engineering. 2021; 9(3):265. https://doi.org/10.3390/jmse9030265
Chicago/Turabian StyleHiep, Nguyen Trong, Hitoshi Tanaka, and Nguyen Xuan Tinh. 2021. "Centennial to Multi-Decadal Morphology Change and Sediment Budget Alteration with Consideration of the Impacts of the 2011 Tohoku Earthquake Tsunami along the Nobiru Coast, Japan" Journal of Marine Science and Engineering 9, no. 3: 265. https://doi.org/10.3390/jmse9030265