
Morphodynamic Evolution of Post-Nourishment Beach Scarps in Low-Energy and Micro-Tidal Environment

 ,
, 
Abstract
:1. Introduction
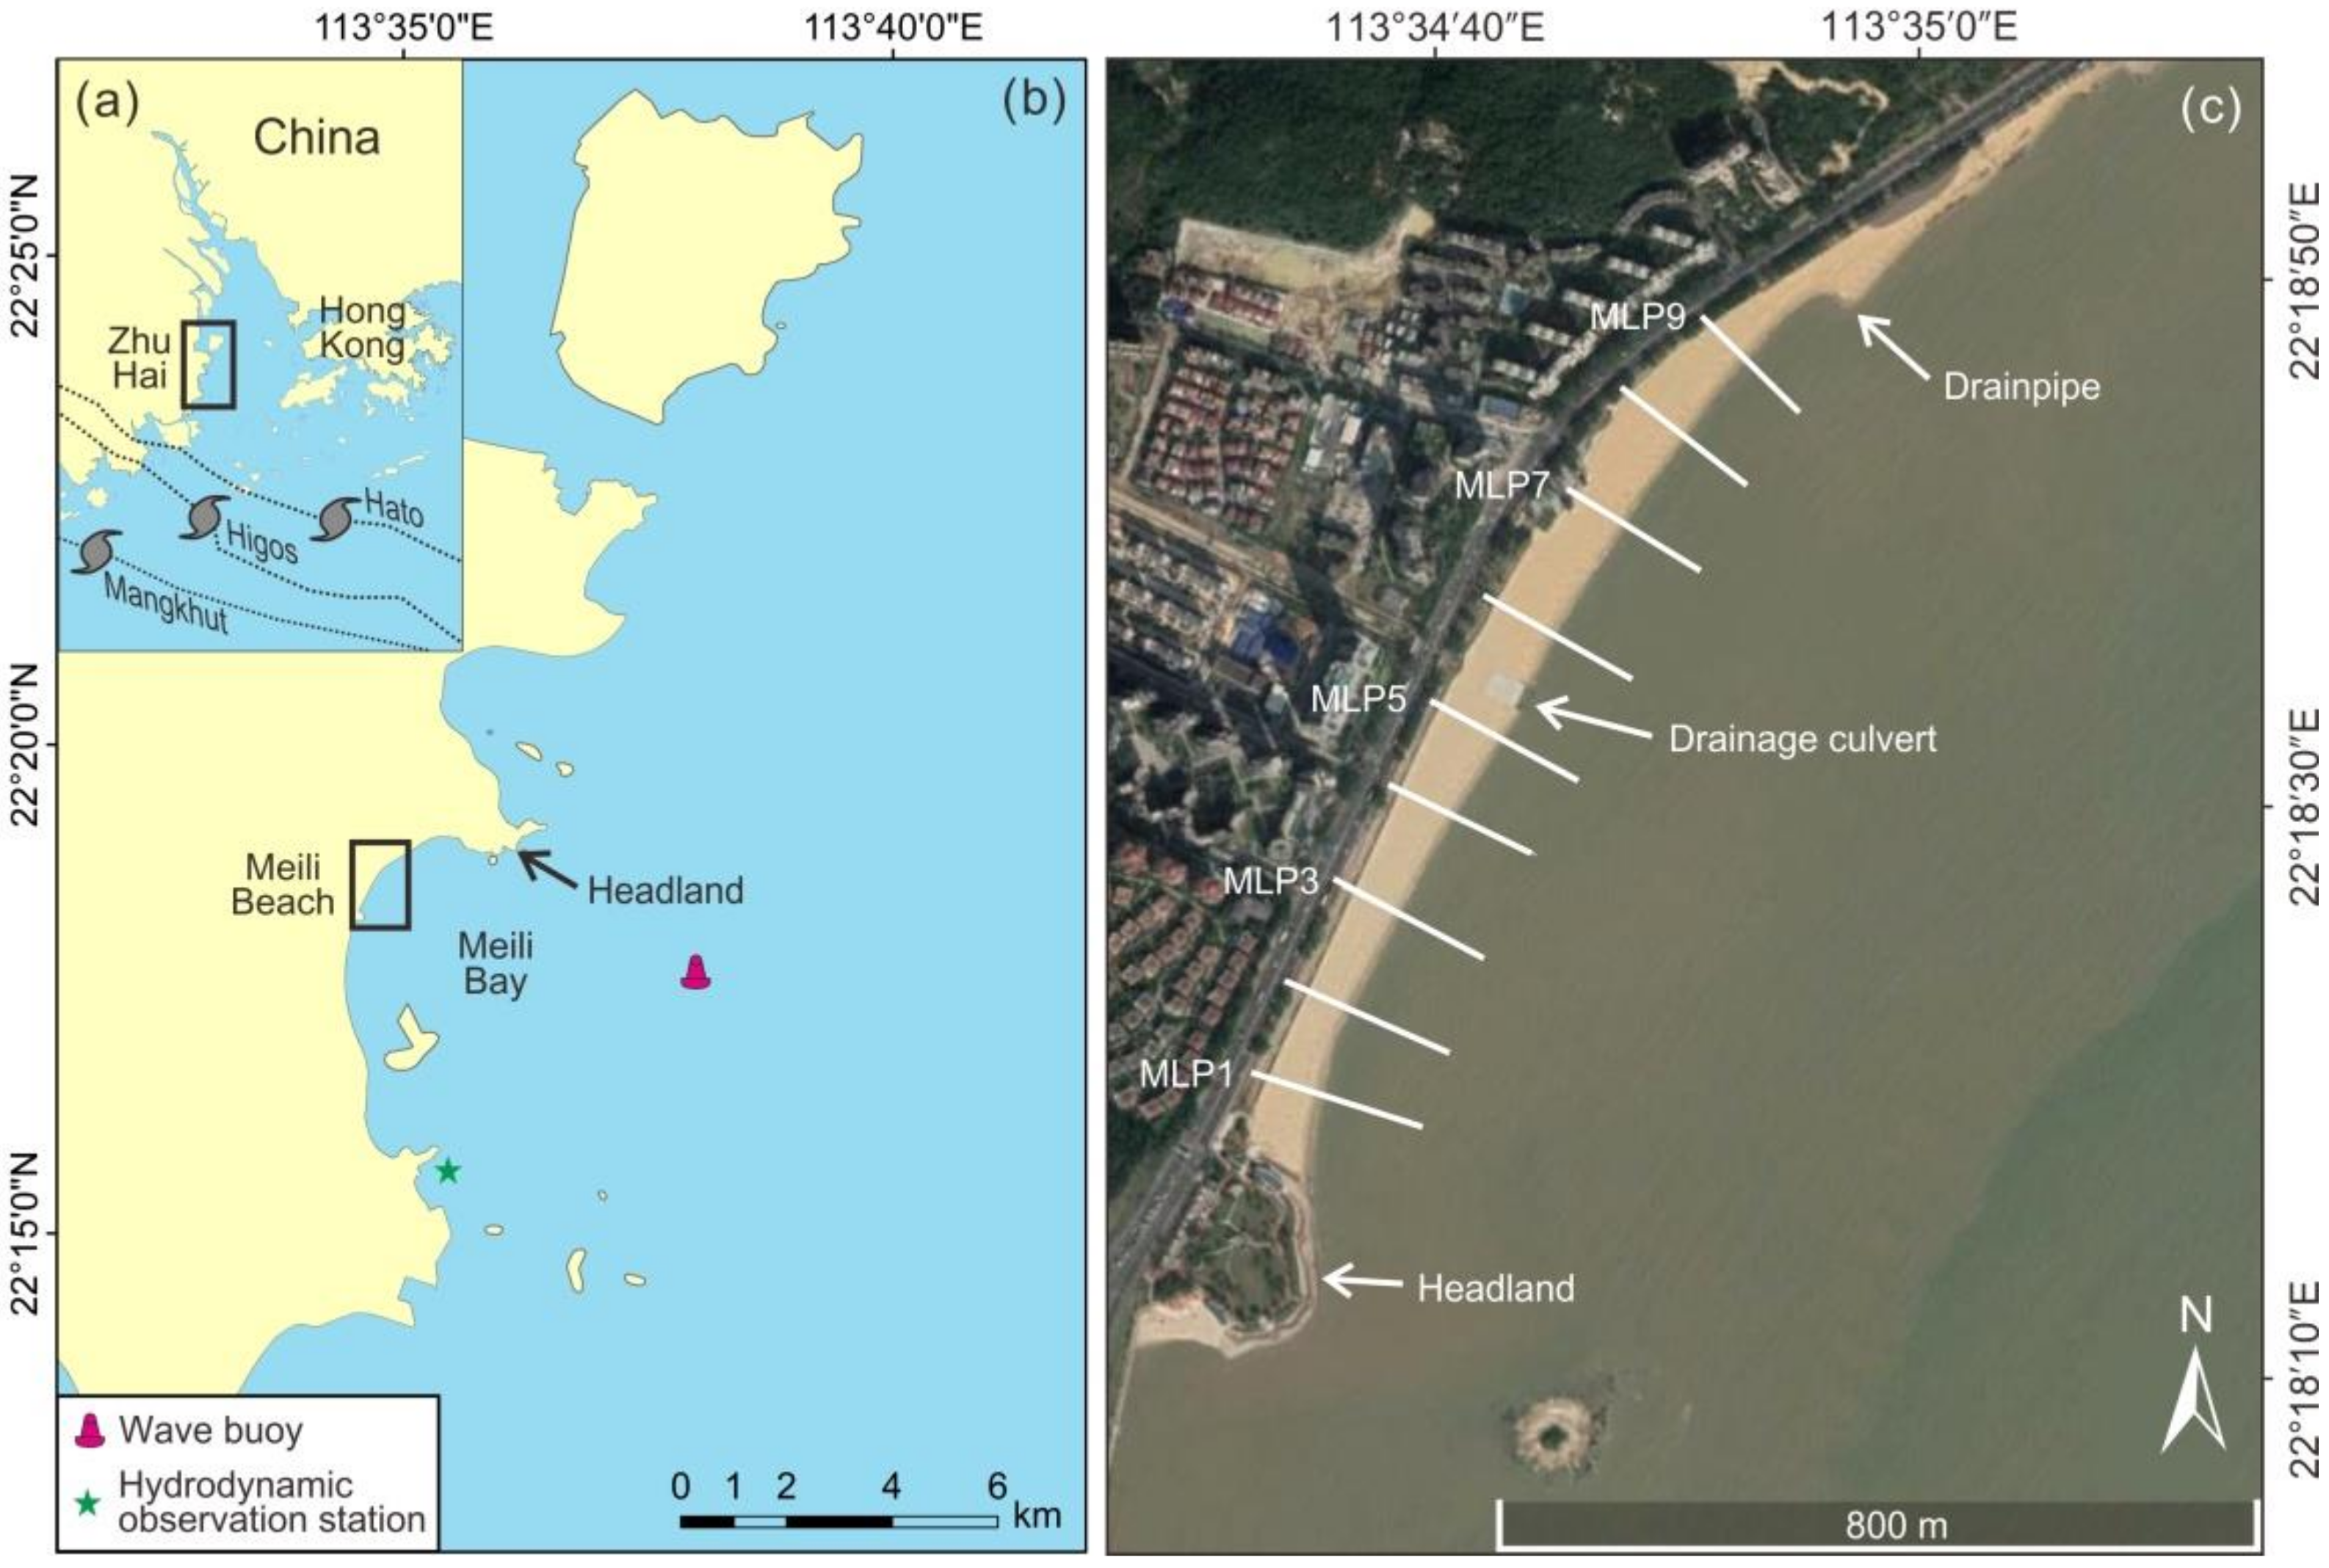
2. Study Site
3. Materials and Methods
3.1. Beach Topography
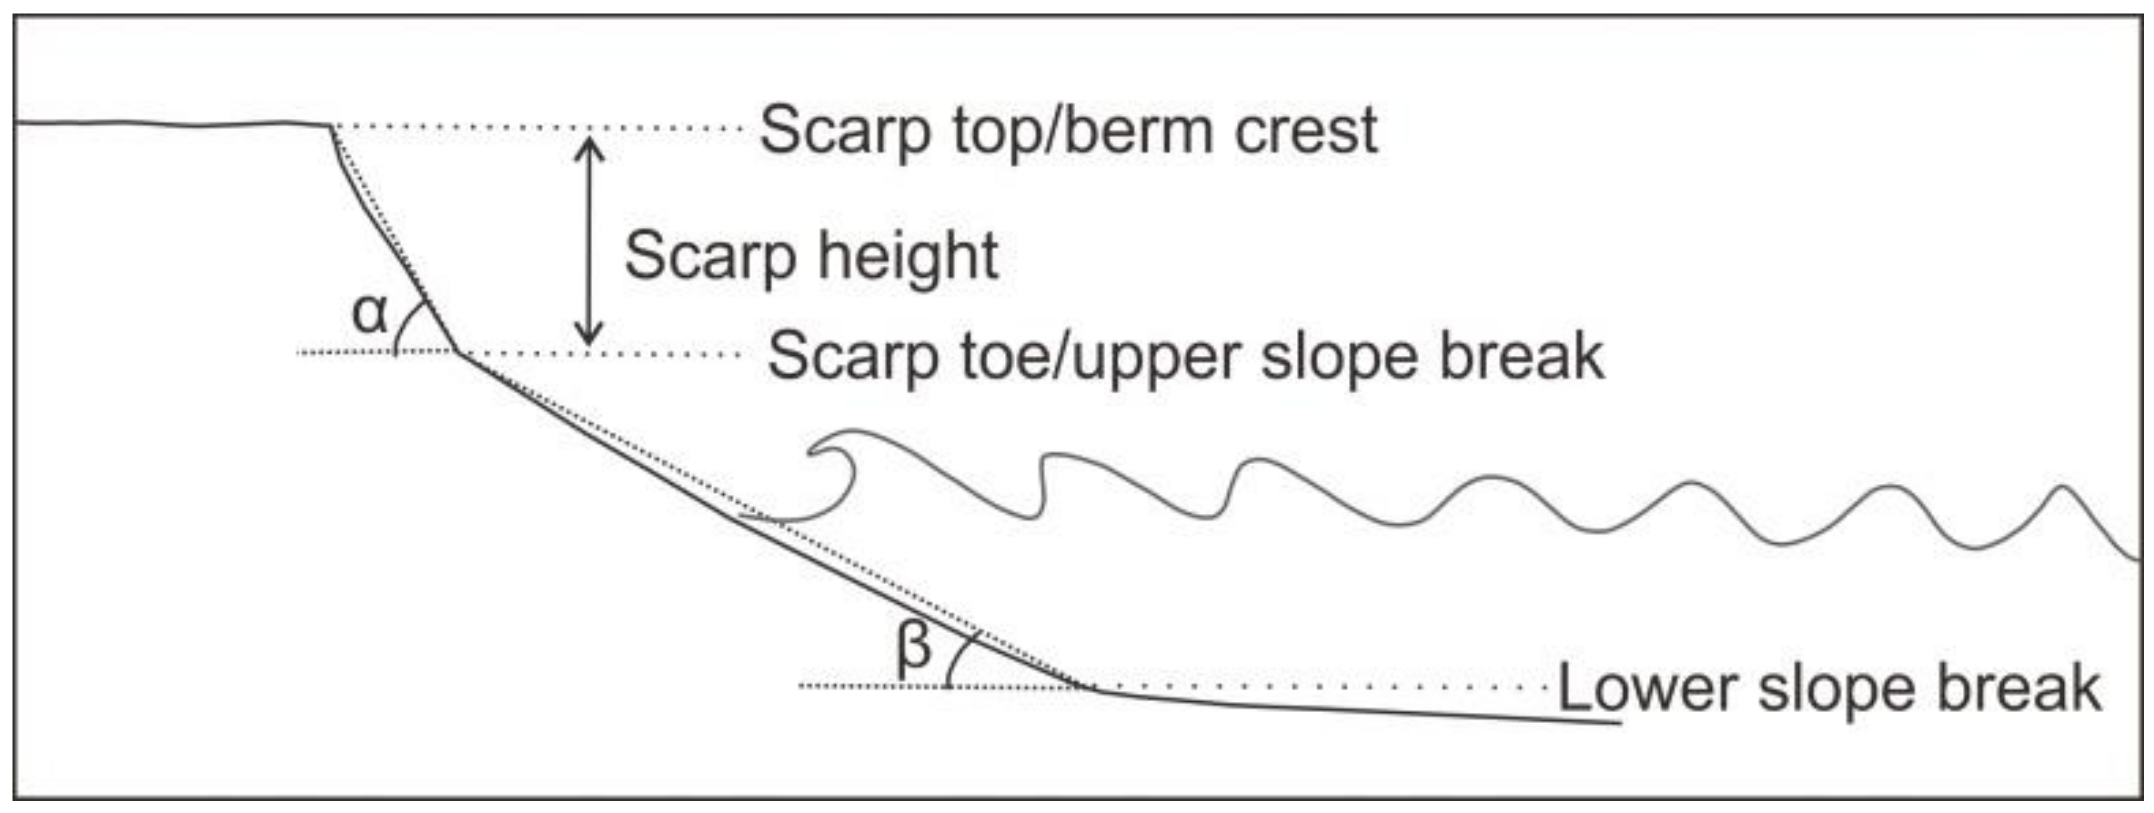
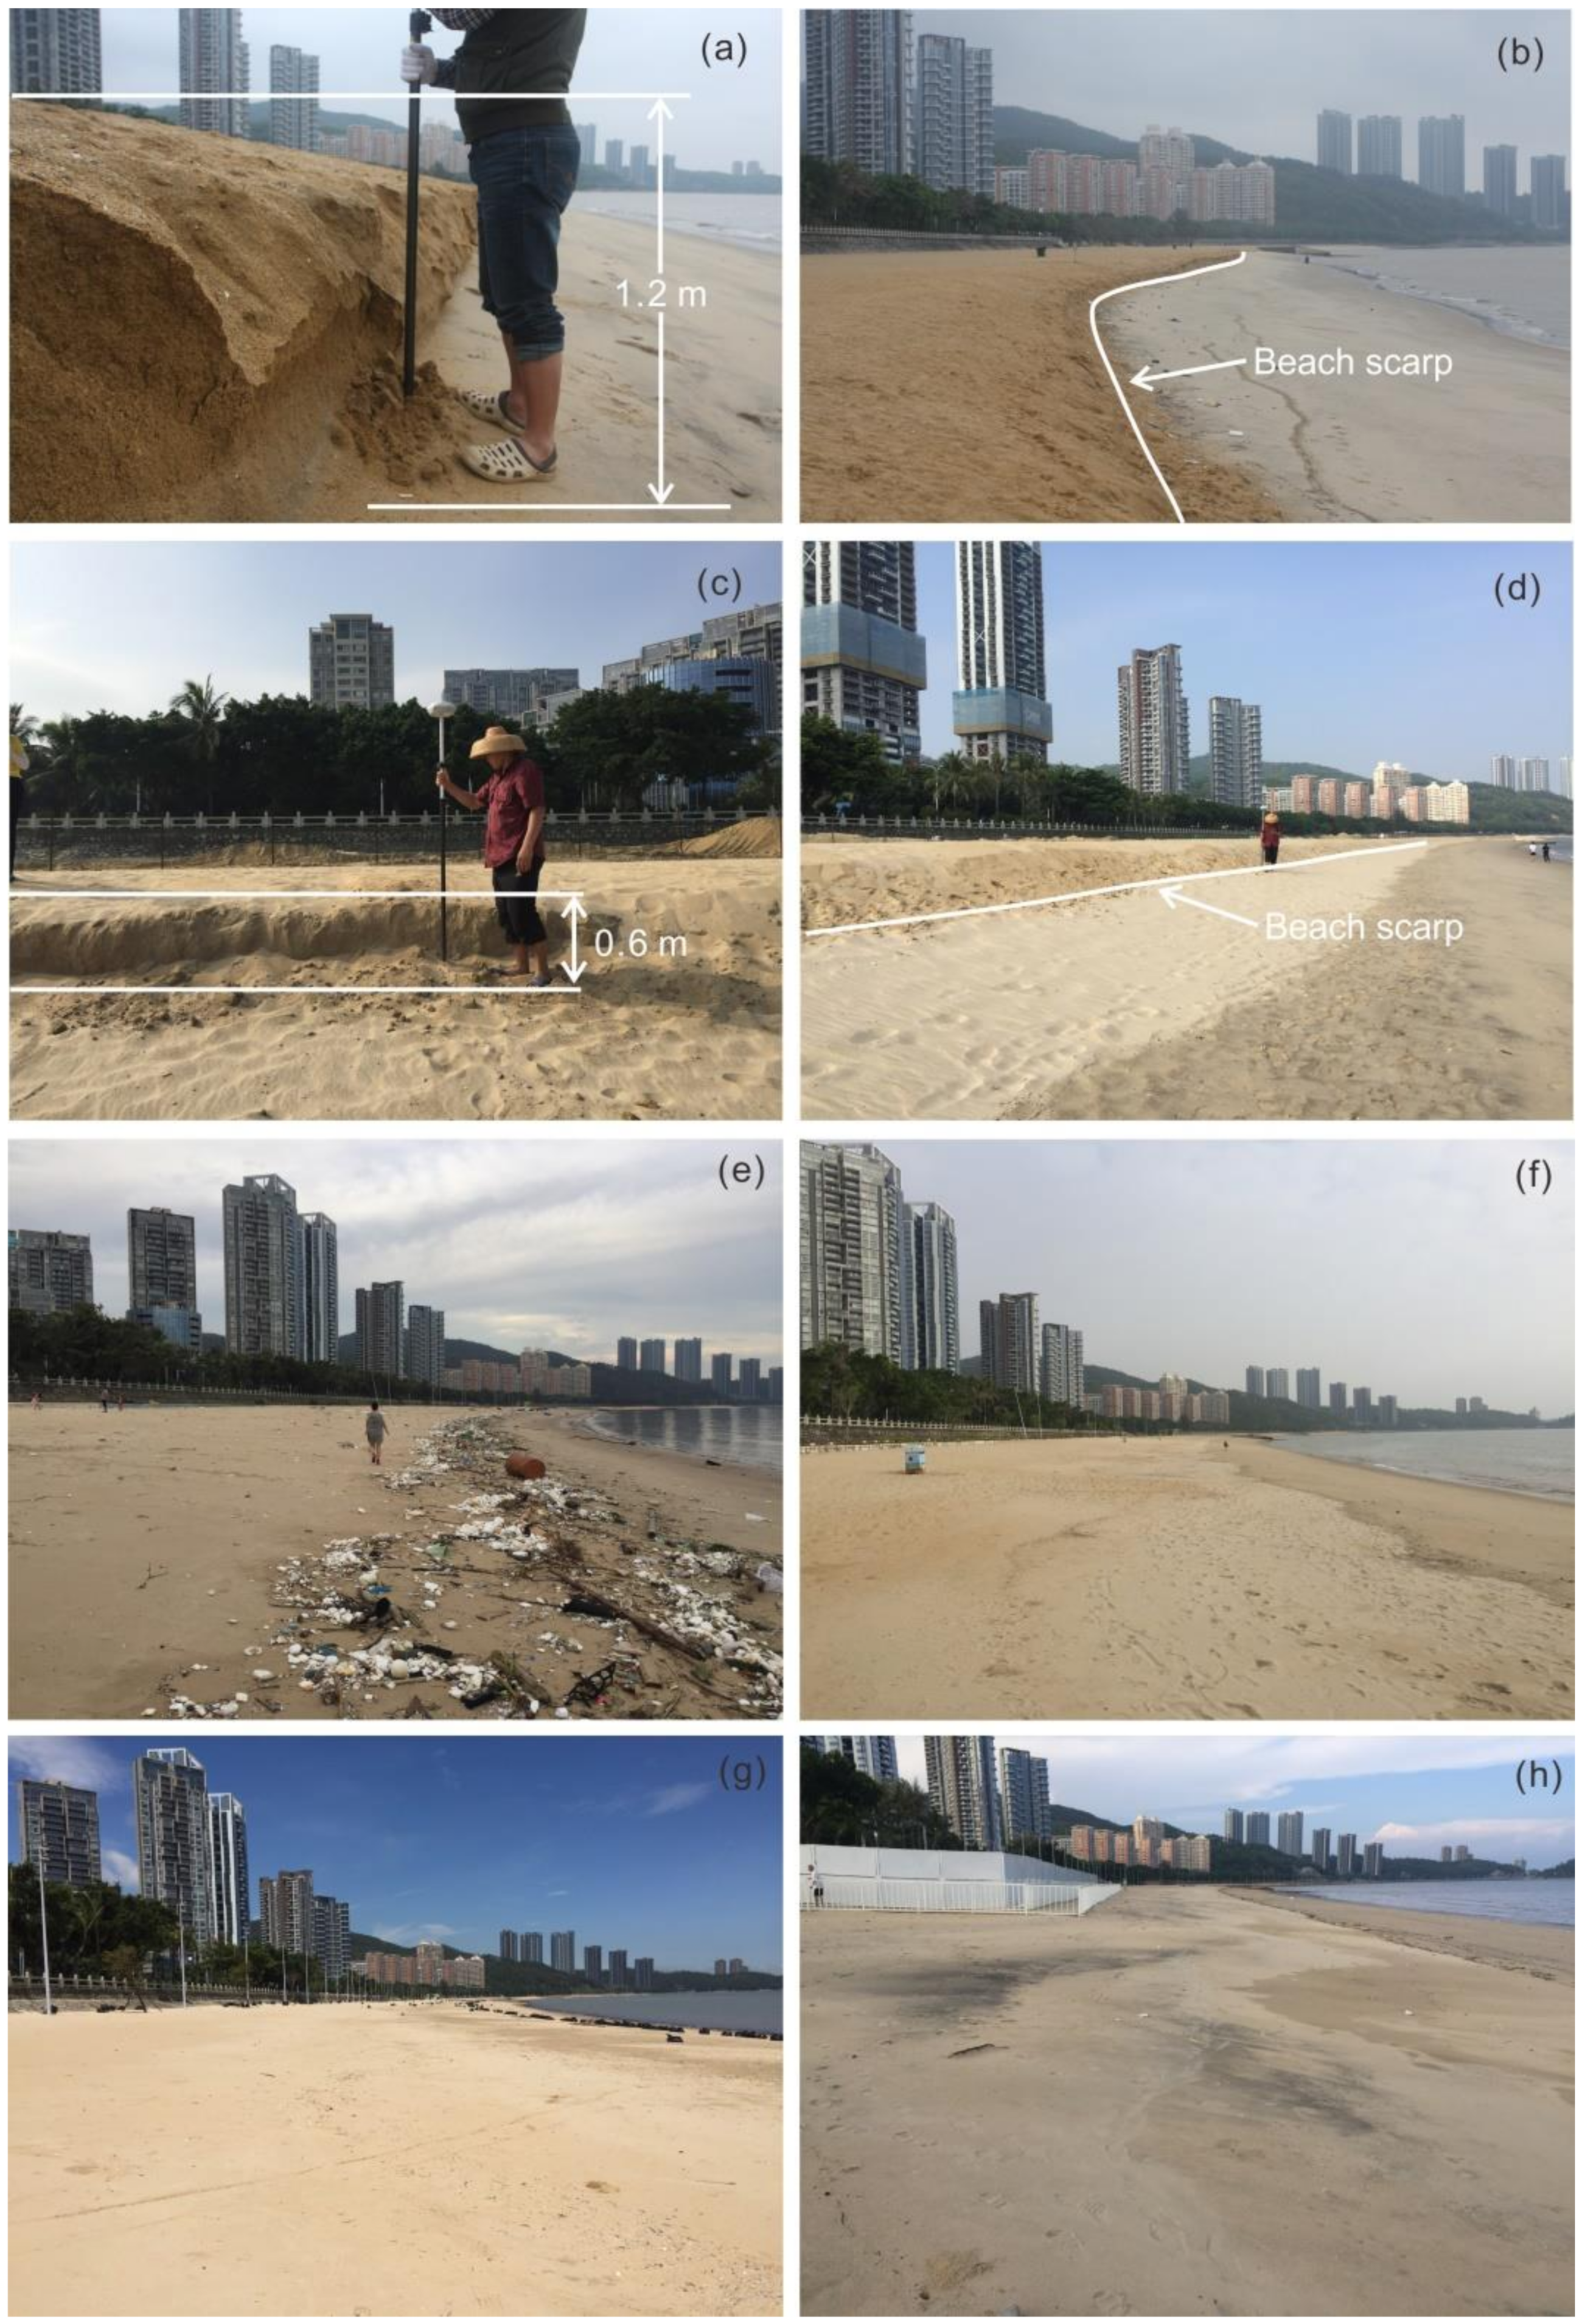
3.2. Beach Scarp Identification
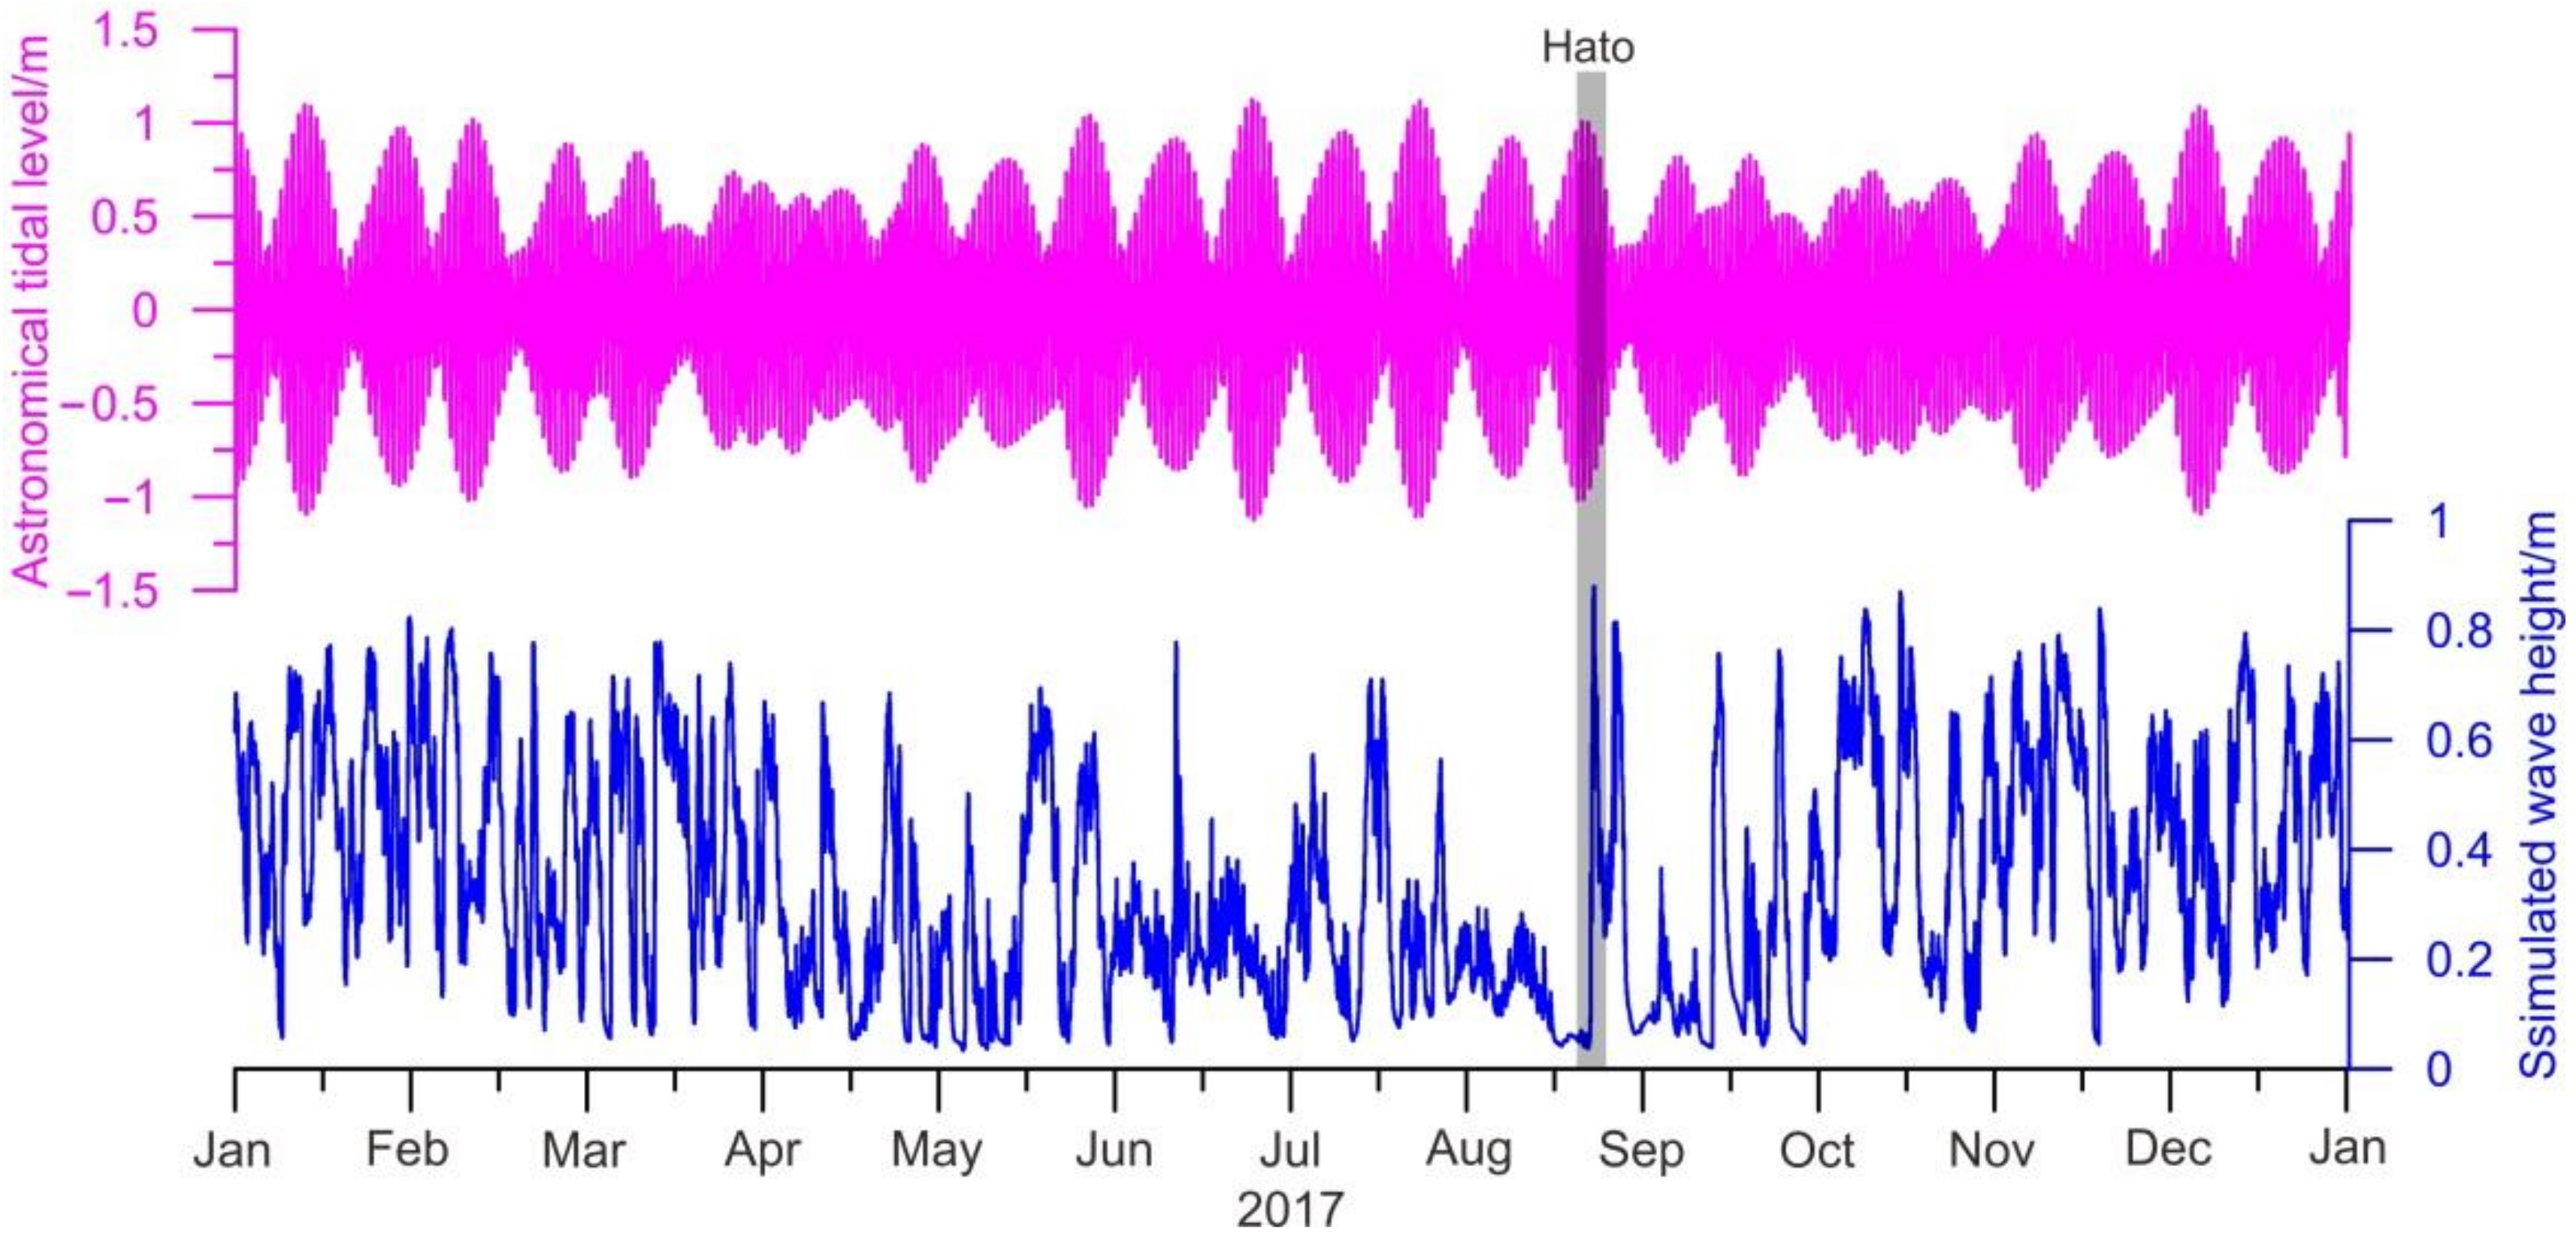
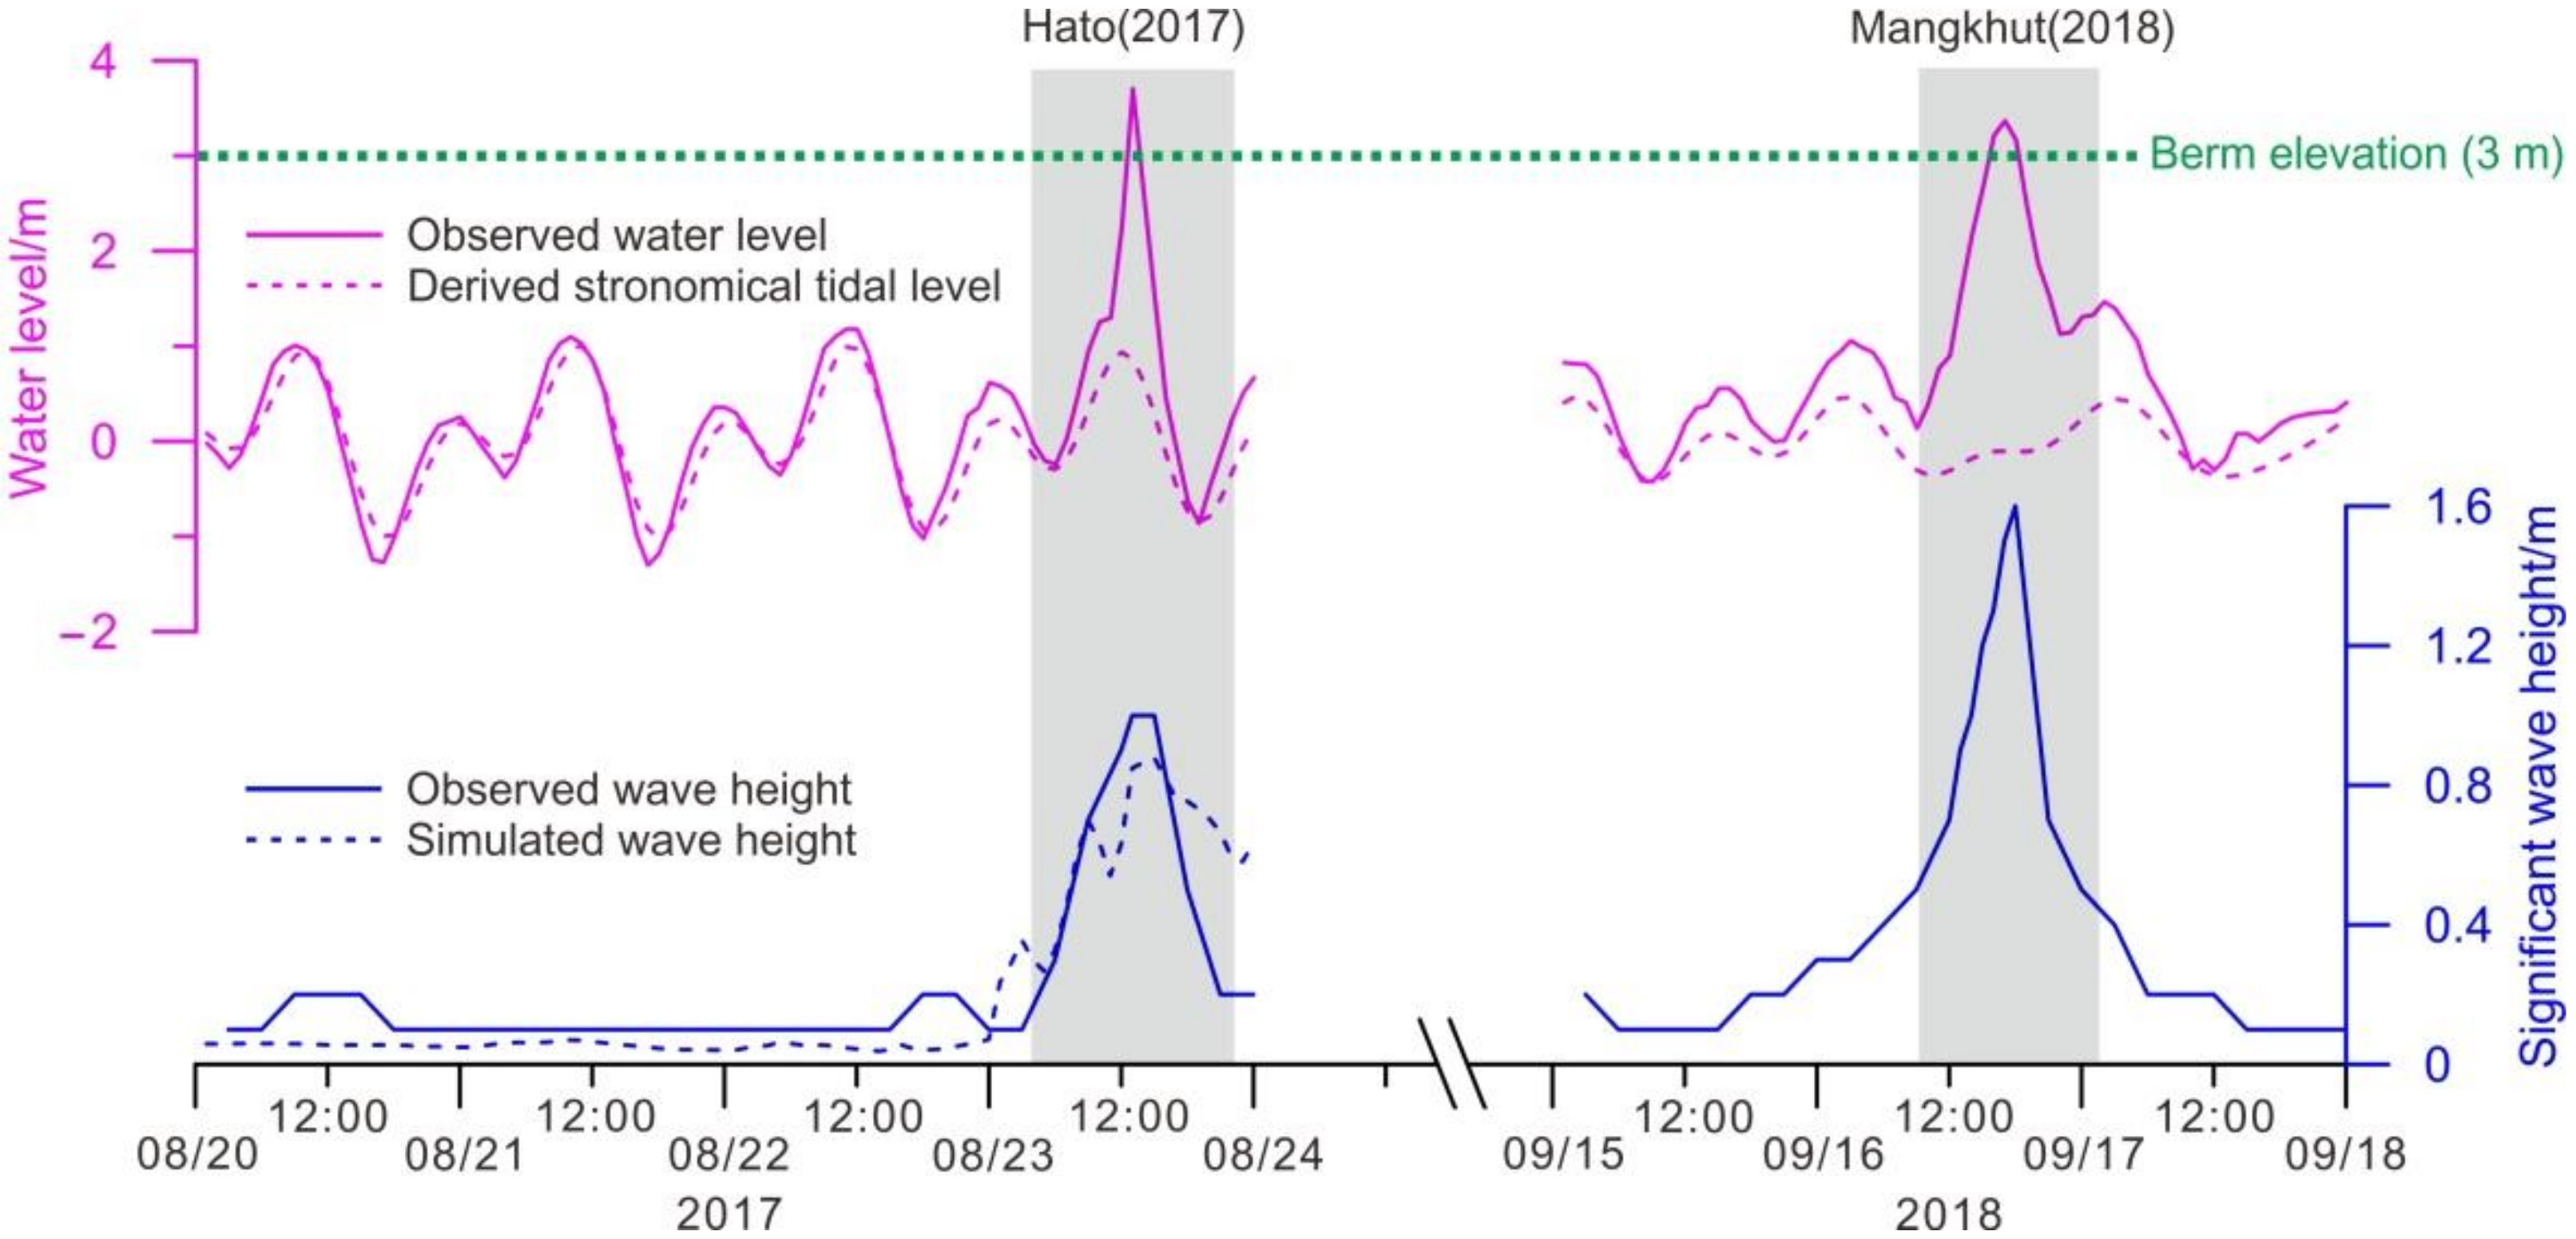
3.3. Hydrodynamic Data
4. Results
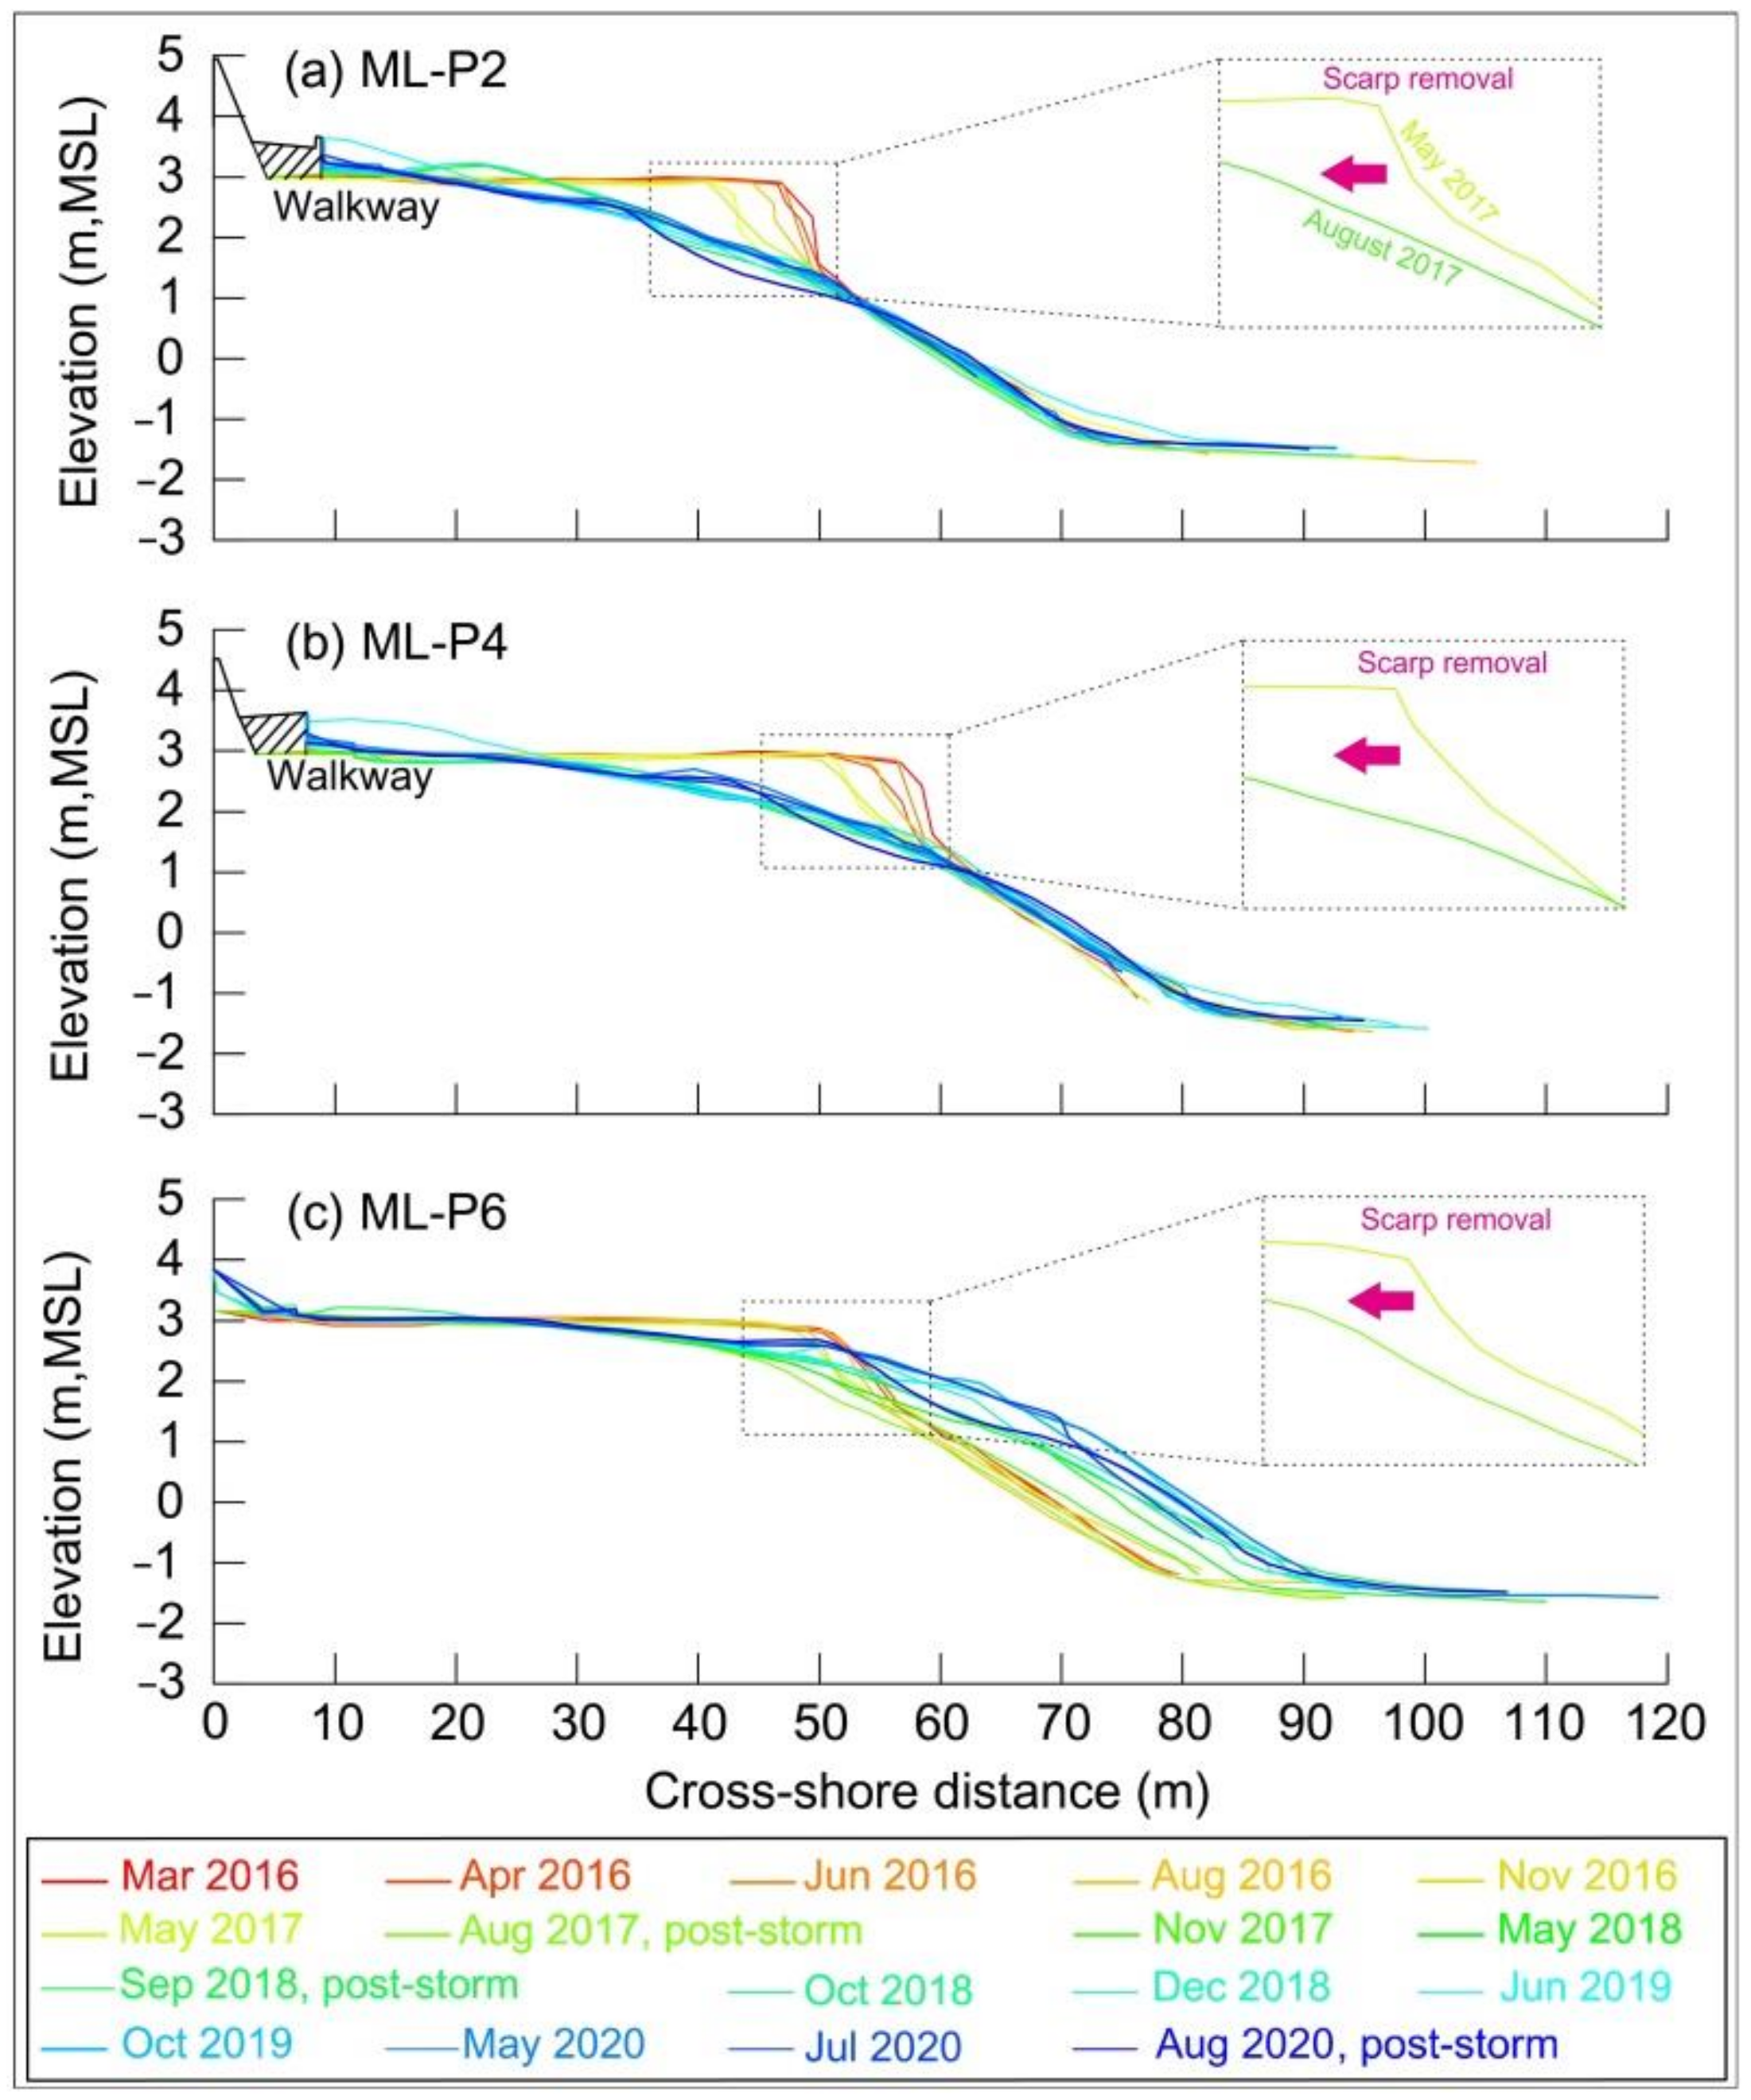
4.1. Beach Profile Changes
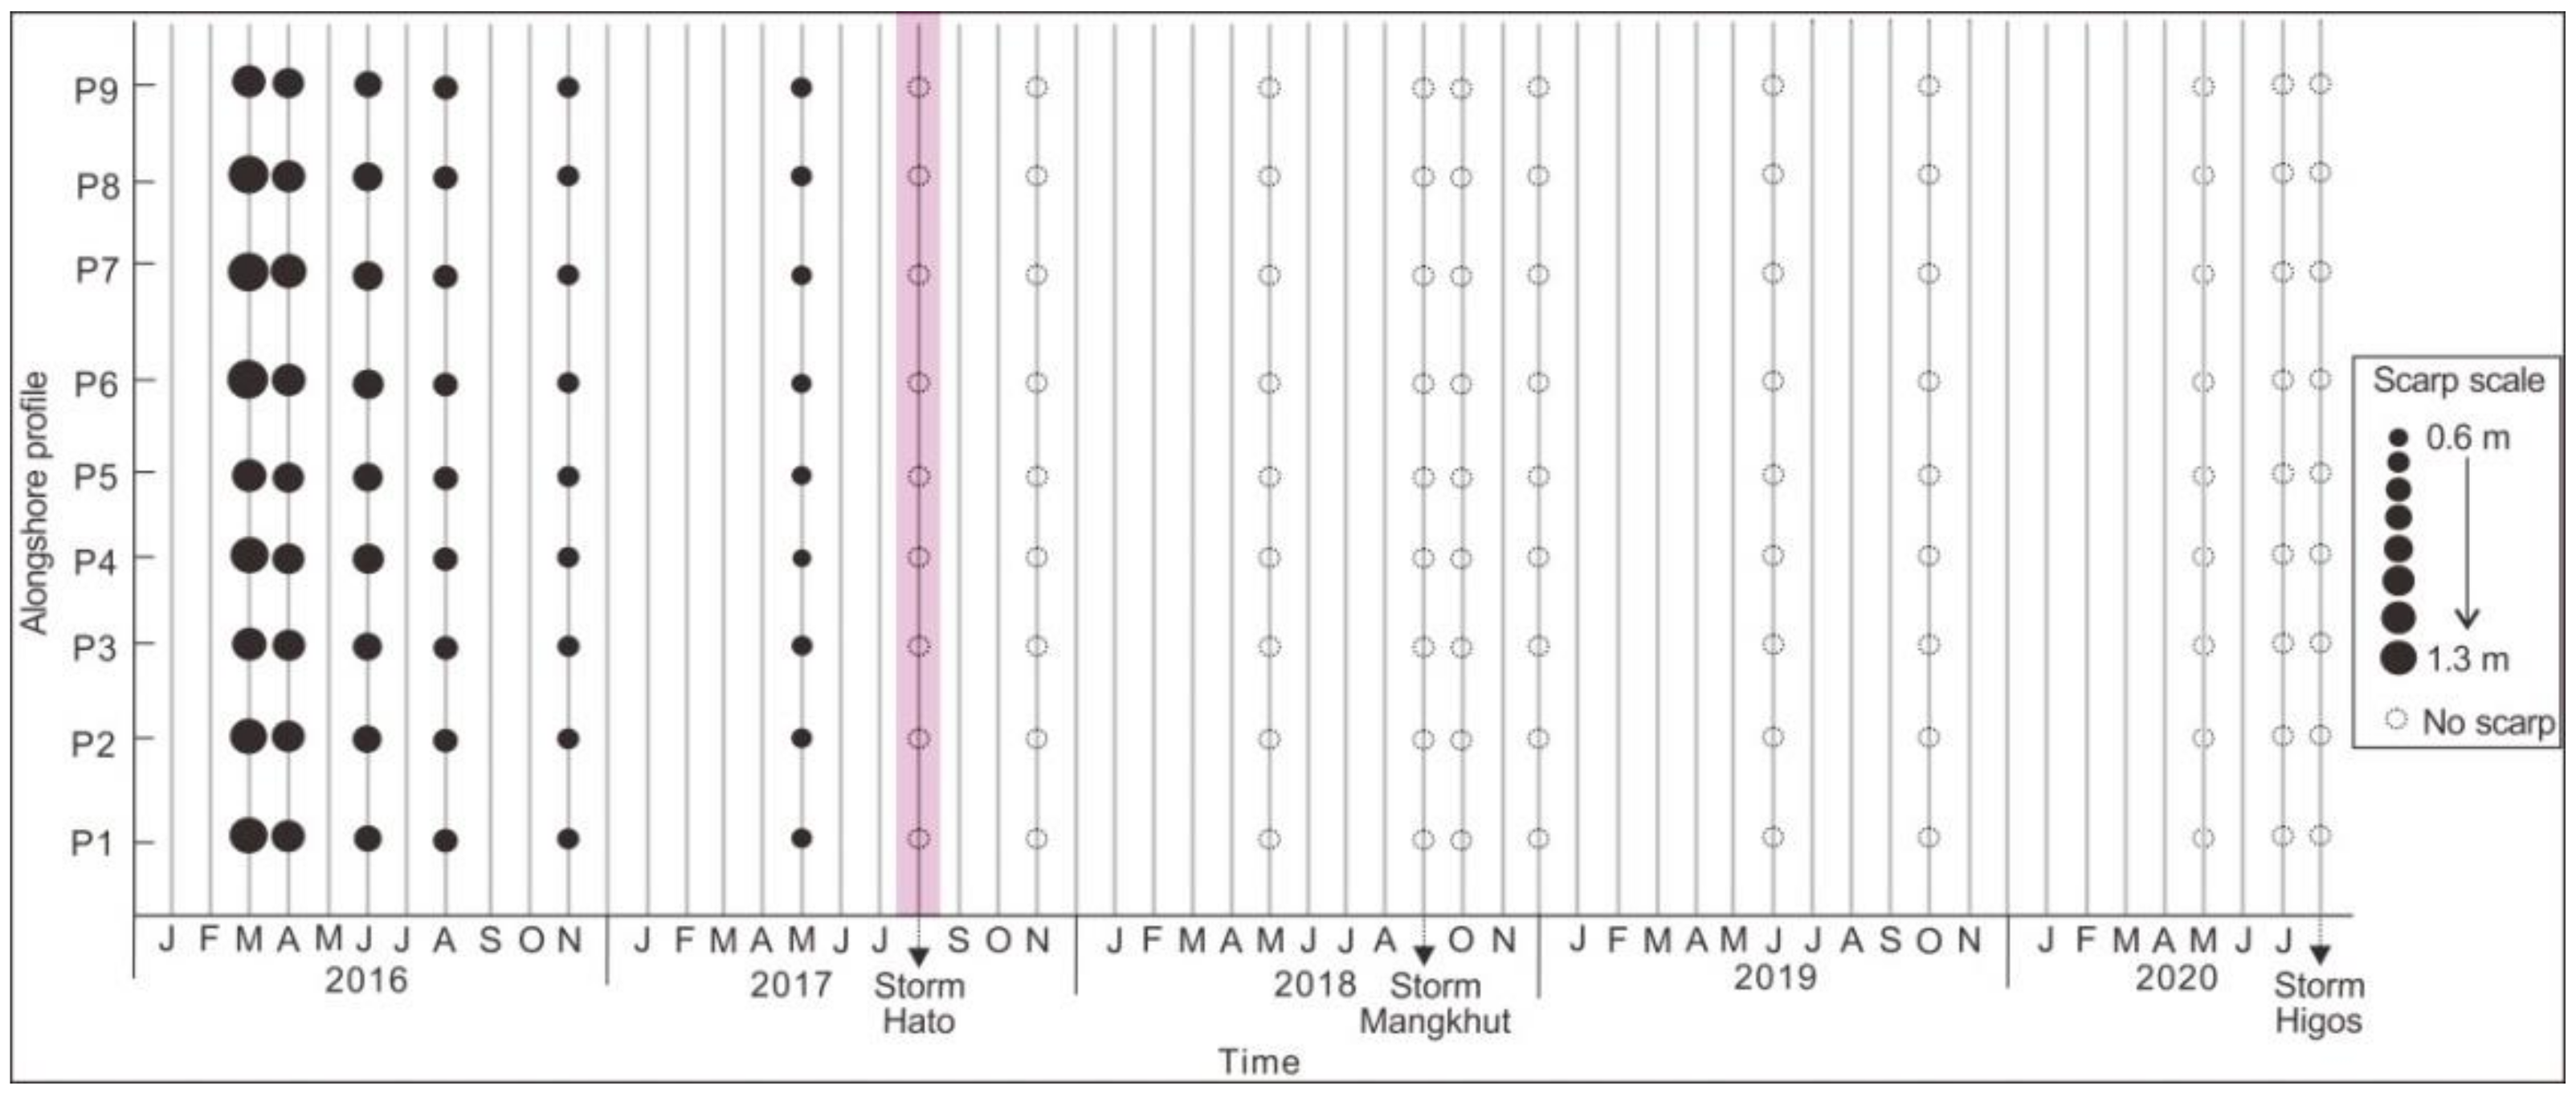
4.2. Beach Scarp Changes
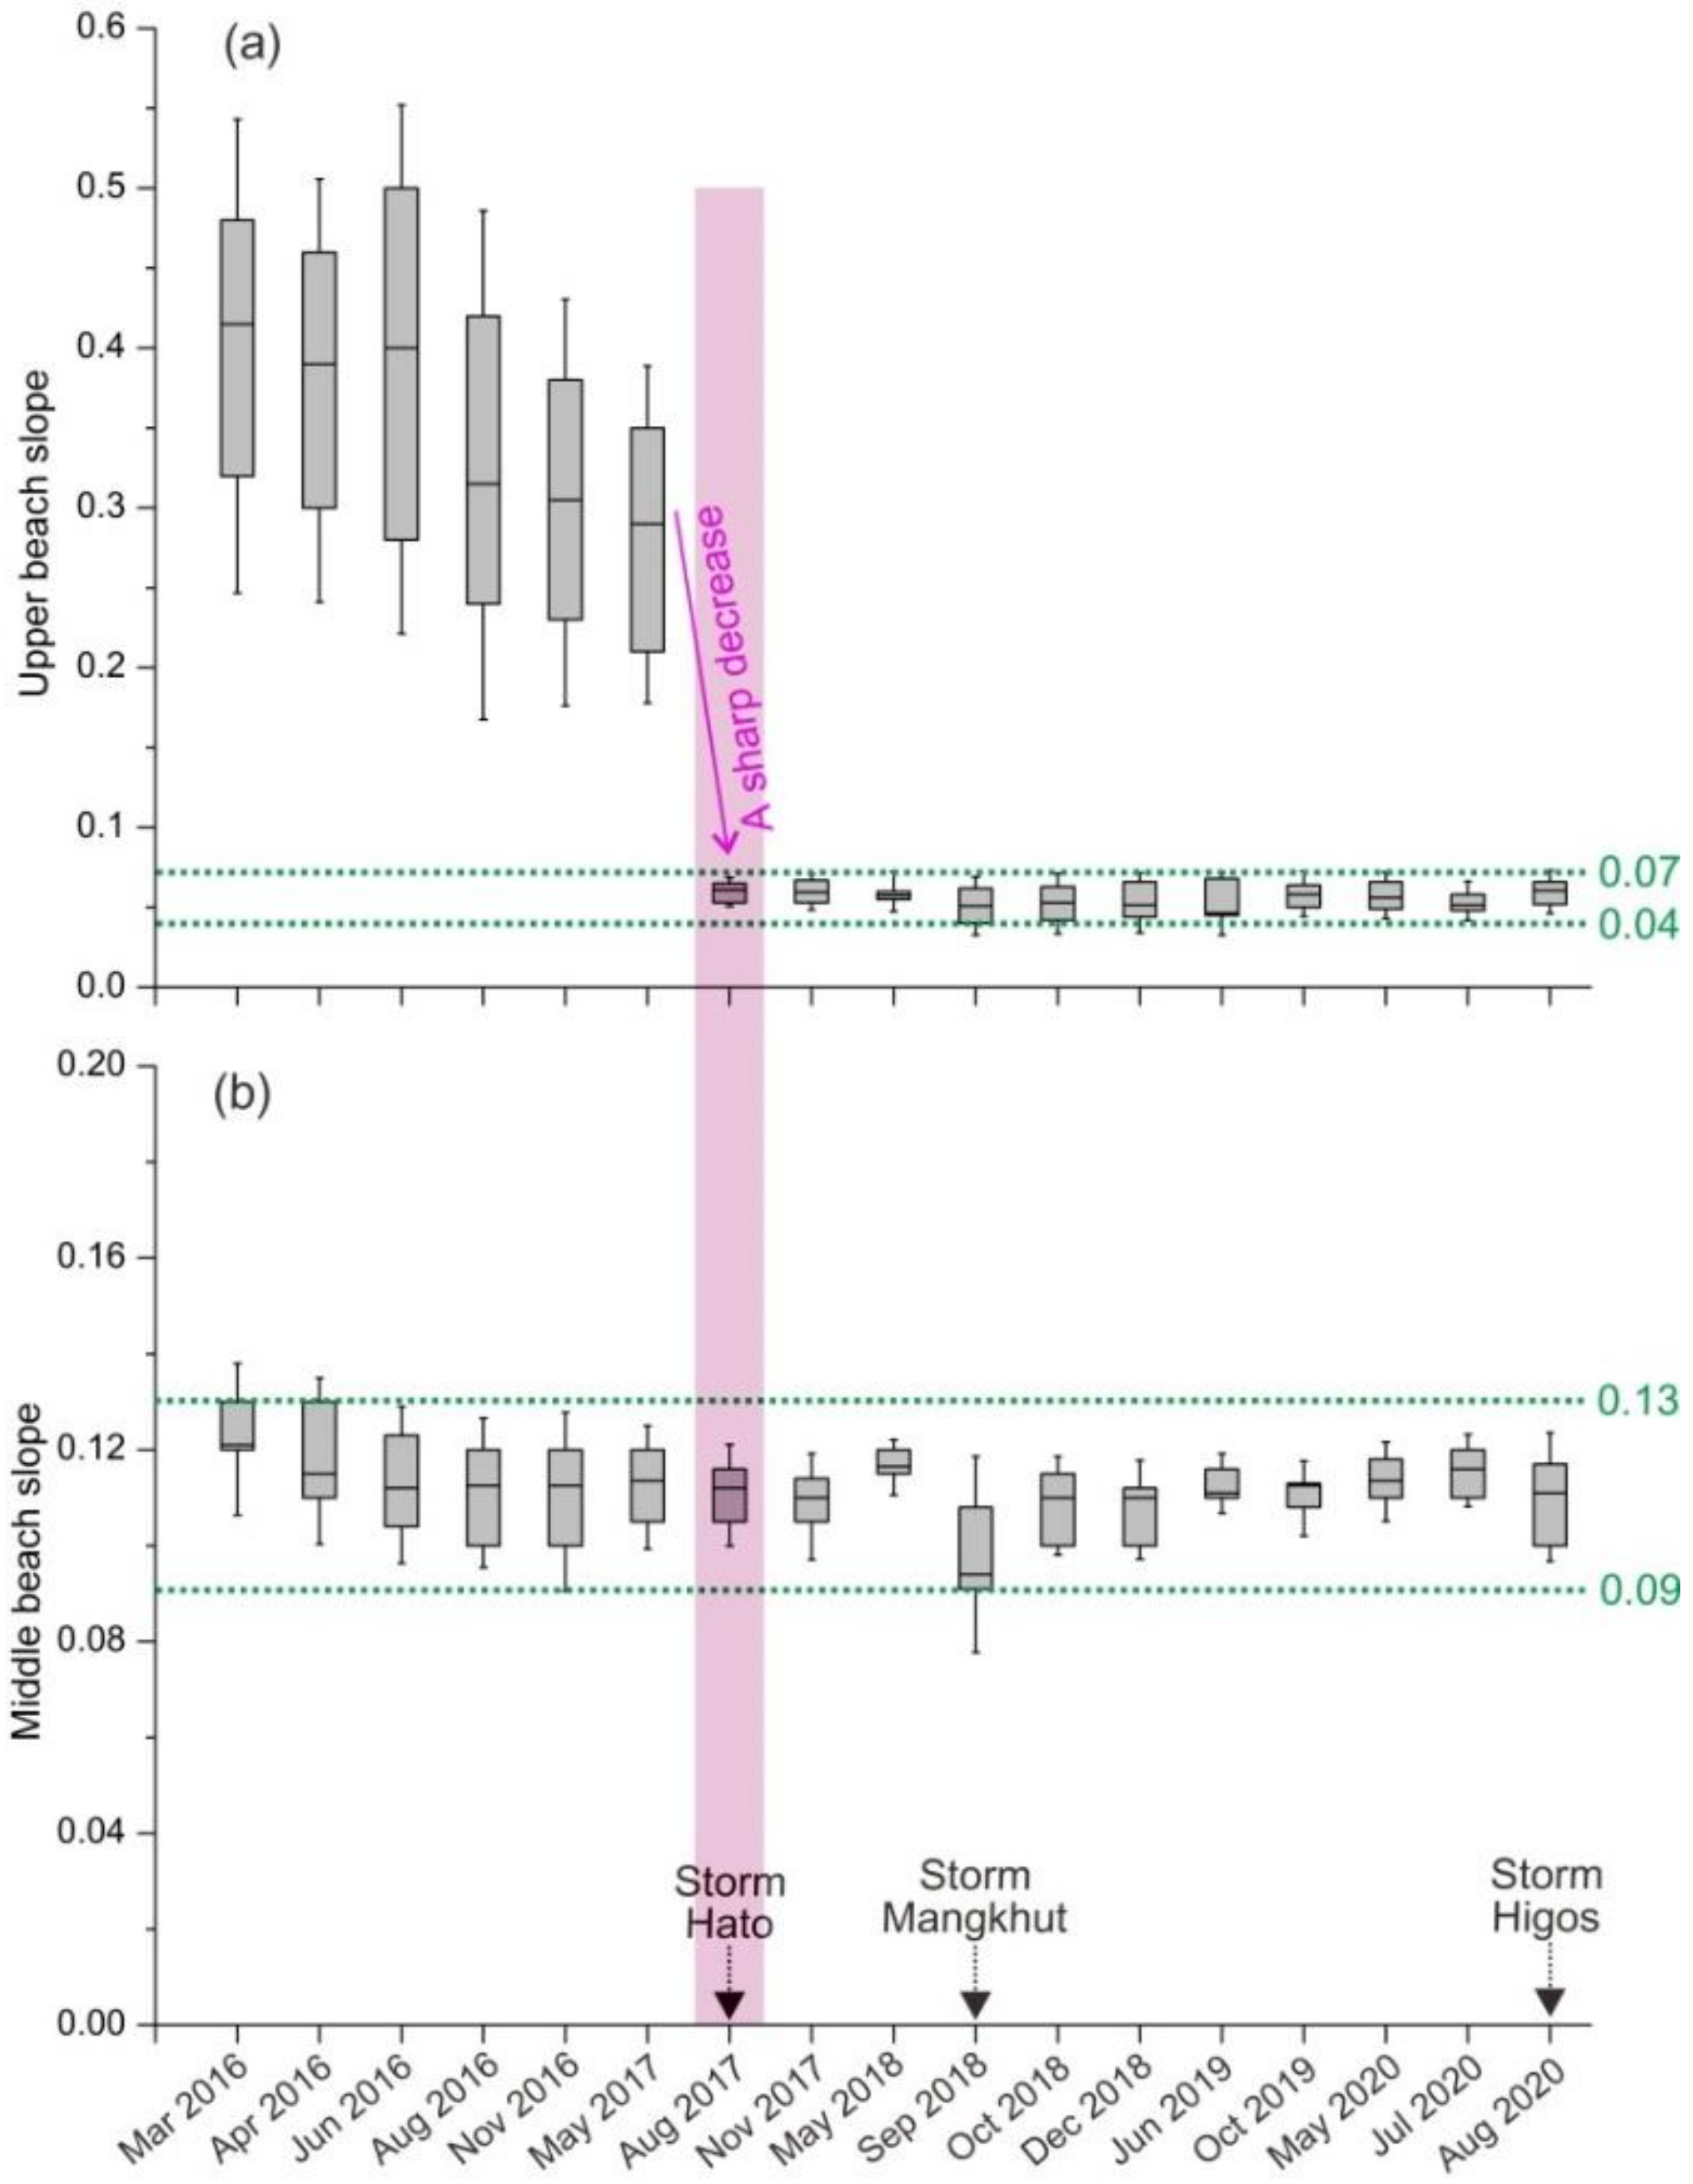
4.3. Beach Slope Changes
4.4. Runup and Total Water Level
5. Discussion
5.1. Mechanism of Scarp Formation, Migration, Destruction and Long-Term Absence
5.2. Implications for Beach Nourishment
6. Conclusions
Author Contributions
Funding
Institutional Review Board Statement
Informed Consent Statement
Data Availability Statement
Acknowledgments
Conflicts of Interest
References
- Sherman, D.; Nordstrom, K.F. Beach scarps. Z. Geomorphol. 1985, 29, 139–152. [Google Scholar]
- Jackson, N.L.; Smith, D.R.; Nordstrom, K. Comparison of sediment characteristics on nourished and unnourished estuarine beaches in Delaware Bay, New Jersey. Geomorphology 2005, 141, 31–45. [Google Scholar]
- Van Bemmelen, C.; De Schipper, M.; Darnall, J.; Aarninkhof, S. Beach scarp dynamics at nourished beaches. Coast. Eng. 2020, 160, 103725. [Google Scholar] [CrossRef]
- Nishi, R.; Sato, M.; Wang, H. Field observation and numerical simulation of beach and dune scarps. In Proceedings of the 24th Coastal Engineering Conference 1994, ASCE, Kobe, Japan, 23–28 October 1994; pp. 2434–2448. [Google Scholar] [CrossRef]
- De Alegria-Arzaburu, A.R.; Mariño-Tapia, I.; Silva, R.; Pedrozo-Acuña, A. Post-nourishment beach scarp morphodynamics. J. Coast. Res. 2013, 65, 576–581. [Google Scholar] [CrossRef]
- Bonte, Y.; Levoy, F. Field experiments of beach scarp erosion during oblique wave, stormy conditions (Normandy, France). Geomorphology 2015, 236, 132–147. [Google Scholar] [CrossRef]
- Van Gaalen, J.F.; Kruse, S.E.; Coco, G.; Collins, L.; Doering, T. Geomorphology observations of beach cusp evolution at Melbourne beach, Florida, USA. Geomorphology 2011, 129, 131–140. [Google Scholar] [CrossRef]
- Vousdoukas, M.; Almeida, L.; Ferreira, O. Modelling storm-induced beach morphological change in a meso-tidal, reflective beach using XBeach. J. Coast. Res. 2011, 64, 1916–1920. [Google Scholar]
- Anfuso, G.; Benavente, J.; Gracia, F.J. Morphodynamic responses of nourished beaches in SW Spain. J. Coast. Conserv. 2001, 7, 71–80. [Google Scholar] [CrossRef]
- Seymour, R.; Guza, R.; O’Reilly, W.; Elgar, S. Rapid erosion of a small southern California beach fill. Coast. Eng. 2005, 52, 151–158. [Google Scholar] [CrossRef]
- Elko, N.A.; Wang, P. Immediate profile and planform evolution of a beach nourishment project with hurricane influences. Coast. Eng. 2007, 54, 49–66. [Google Scholar] [CrossRef]
- Jackson, N.L.; Nordstrom, K.F.; Saini, S.; Smith, D.R. Effects of nourishment on the form and function of an estuarine beach. Ecol. Eng. 2010, 36, 1709–1718. [Google Scholar] [CrossRef]
- De Zeeuw, R.; De Schipper, M.A.; Roelvink, D.; De Vries, S.; Stive, M.J.F. Impact of nourishments on nearshore currents and swimmer safety on the Dutch Coast. Coast. Eng. Proc. 2012, 1, 12. [Google Scholar] [CrossRef]
- Larson, M.; Hanson, H.; Kraus, N.C.; Newe, J. Short- and Long-Term Responses of Beach Fills Determined by EOF Analysis. J. Waterw. Port. Coastal Ocean. Eng. 1999, 125, 285–293. [Google Scholar] [CrossRef]
- Dean, R.G.; Dalrymple, R.A. Coastal Processes with Engineering Applications; Cambridge University Press: Cambridge, UK, 2004; p. 476. [Google Scholar]
- De Schipper, M.A.; Darnall, J.; de Vries, S.; Reniers, A.J.H.M. Beach scarp evolution and prediction. In Proceedings of the Coastal Dynamics 2017, Helsingør, Denmark, 12–16 June 2017; pp. 791–800. [Google Scholar]
- Neshaei, M.A.L.; Ghanbarpour, F. The effect of sea level rise on beach morphology of Caspian Sea Coast. Front. Struct. Civ. Eng. 2017, 11, 369–379. [Google Scholar] [CrossRef]
- Qi, H.; Cai, F.; Lei, G.; Cao, H.; Shi, F. The response of three main beach types to tropical storms in South China. Mar. Geol. 2010, 275, 244–254. [Google Scholar] [CrossRef]
- Lei, G.; Zhu, J.; Cao, H.; Zheng, J.; Liu, J. Engineering Feasibility Study Report on the Beach Nourishment Project at Meili Bay in Zhuhai City; Third Institute of Oceanography, State Oceanic Administration: Xiamen, China, 2015. (In Chinese) [Google Scholar]
- Pranzini, E.; Anfuso, G.; Muñoz-Perez, J.J. A probabilistic approach to borrow sediment selection in beach nourishment projects. Coast. Eng. 2018, 139, 32–35. [Google Scholar] [CrossRef]
- Liu, G.; Cai, F.; Qi, H.; Zhu, J.; Liu, J. Morphodynamic evolution and adaptability of nourished beaches. J. Coast. Res. 2019, 35, 737. [Google Scholar] [CrossRef]
- Chen, Y.; Chen, L.; Zhang, H.; Gong, W. Effects of wave-current interaction on the Pearl River Estuary during Typhoon Hato. Estuar. Coast. Shelf Sci. 2019, 228, 106364. [Google Scholar] [CrossRef]
- ESCAP/WMO Typhoon Committee. Member Report (China). In Proceedings of the 12th Integrated Workshop, Jeju, Korea, 30 October–3 November 2017; Available online: http://www.typhooncommittee.org/12IWS/docs/Members/China20171026_final.pdf (accessed on 10 November 2020).
- Yang, J.; Li, L.; Zhao, K.; Wang, P.; Wang, D.; Sou, I.M.; Yang, Z.; Hu, J.; Tang, X.; Mok, K.M.; et al. A comparative study of Typhoon Hato (2017) and Typhoon Mangkhut (2018)—Their impacts on coastal inundation in Macau. J. Geophys. Res. Oceans 2019, 124, 9590–9619. [Google Scholar] [CrossRef]
- Stockdon, H.F.; Holman, R.A.; Howd, P.A.; Sallenger, A.H. Empirical parametererization of setup, swash and runup. Coast. Eng. 2006, 53, 573–588. [Google Scholar] [CrossRef]
- Van Bemmelen, C.W.T. Beach Scarp Morphodynamics: Formation, Migration, and Destruction. Master’s Thesis, Delft University of Technology, Delft, The Netherlands, 26 February 2018. [Google Scholar]
- Martell, R.; Mendoza, E.; Mariño-Tapia, I.; Odériz, I.; Silva, R. How effective were the beach nourishments at Cancun? J. Mar. Sci. Eng. 2020, 8, 388. [Google Scholar] [CrossRef]
- Willson, K.; Thomson, G.; Briggs, T.R.; Elko, N.; Miller, J. Beach nourishment profile equilibration: What to expect after sand is placed on a beach (ASBPA white paper). Shore Beach 2017, 85, 49–51. [Google Scholar]
- Cai, F.; Liu, J.; Qi, H.; Cao, H.; Lei, G.; Zhang, C.; Zhu, J.; Yu, F. Technical Guide for Beach Nourishment and Restoration; Ministry of Natural Resources: Beijing, China, 2018. (In Chinese)


Publisher’s Note: MDPI stays neutral with regard to jurisdictional claims in published maps and institutional affiliations. |
© 2021 by the authors. Licensee MDPI, Basel, Switzerland. This article is an open access article distributed under the terms and conditions of the Creative Commons Attribution (CC BY) license (http://creativecommons.org/licenses/by/4.0/).
Share and Cite
Liu, G.; Qi, H.; Cai, F.; Zhu, J.; Lei, G.; Liu, J.; Zhao, S.; Cao, C. Morphodynamic Evolution of Post-Nourishment Beach Scarps in Low-Energy and Micro-Tidal Environment. J. Mar. Sci. Eng. 2021, 9, 303. https://doi.org/10.3390/jmse9030303
Liu G, Qi H, Cai F, Zhu J, Lei G, Liu J, Zhao S, Cao C. Morphodynamic Evolution of Post-Nourishment Beach Scarps in Low-Energy and Micro-Tidal Environment. Journal of Marine Science and Engineering. 2021; 9(3):303. https://doi.org/10.3390/jmse9030303
Chicago/Turabian StyleLiu, Gen, Hongshuai Qi, Feng Cai, Jun Zhu, Gang Lei, Jianhui Liu, Shaohua Zhao, and Chao Cao. 2021. "Morphodynamic Evolution of Post-Nourishment Beach Scarps in Low-Energy and Micro-Tidal Environment" Journal of Marine Science and Engineering 9, no. 3: 303. https://doi.org/10.3390/jmse9030303