
Thermogravimetric Analysis of Marine Gas Oil in Lubricating Oil

Abstract
:1. Introduction
2. Materials and Methods
2.1. Sample Preparation
2.2. Instruments and Parameters
3. Results and Discussion
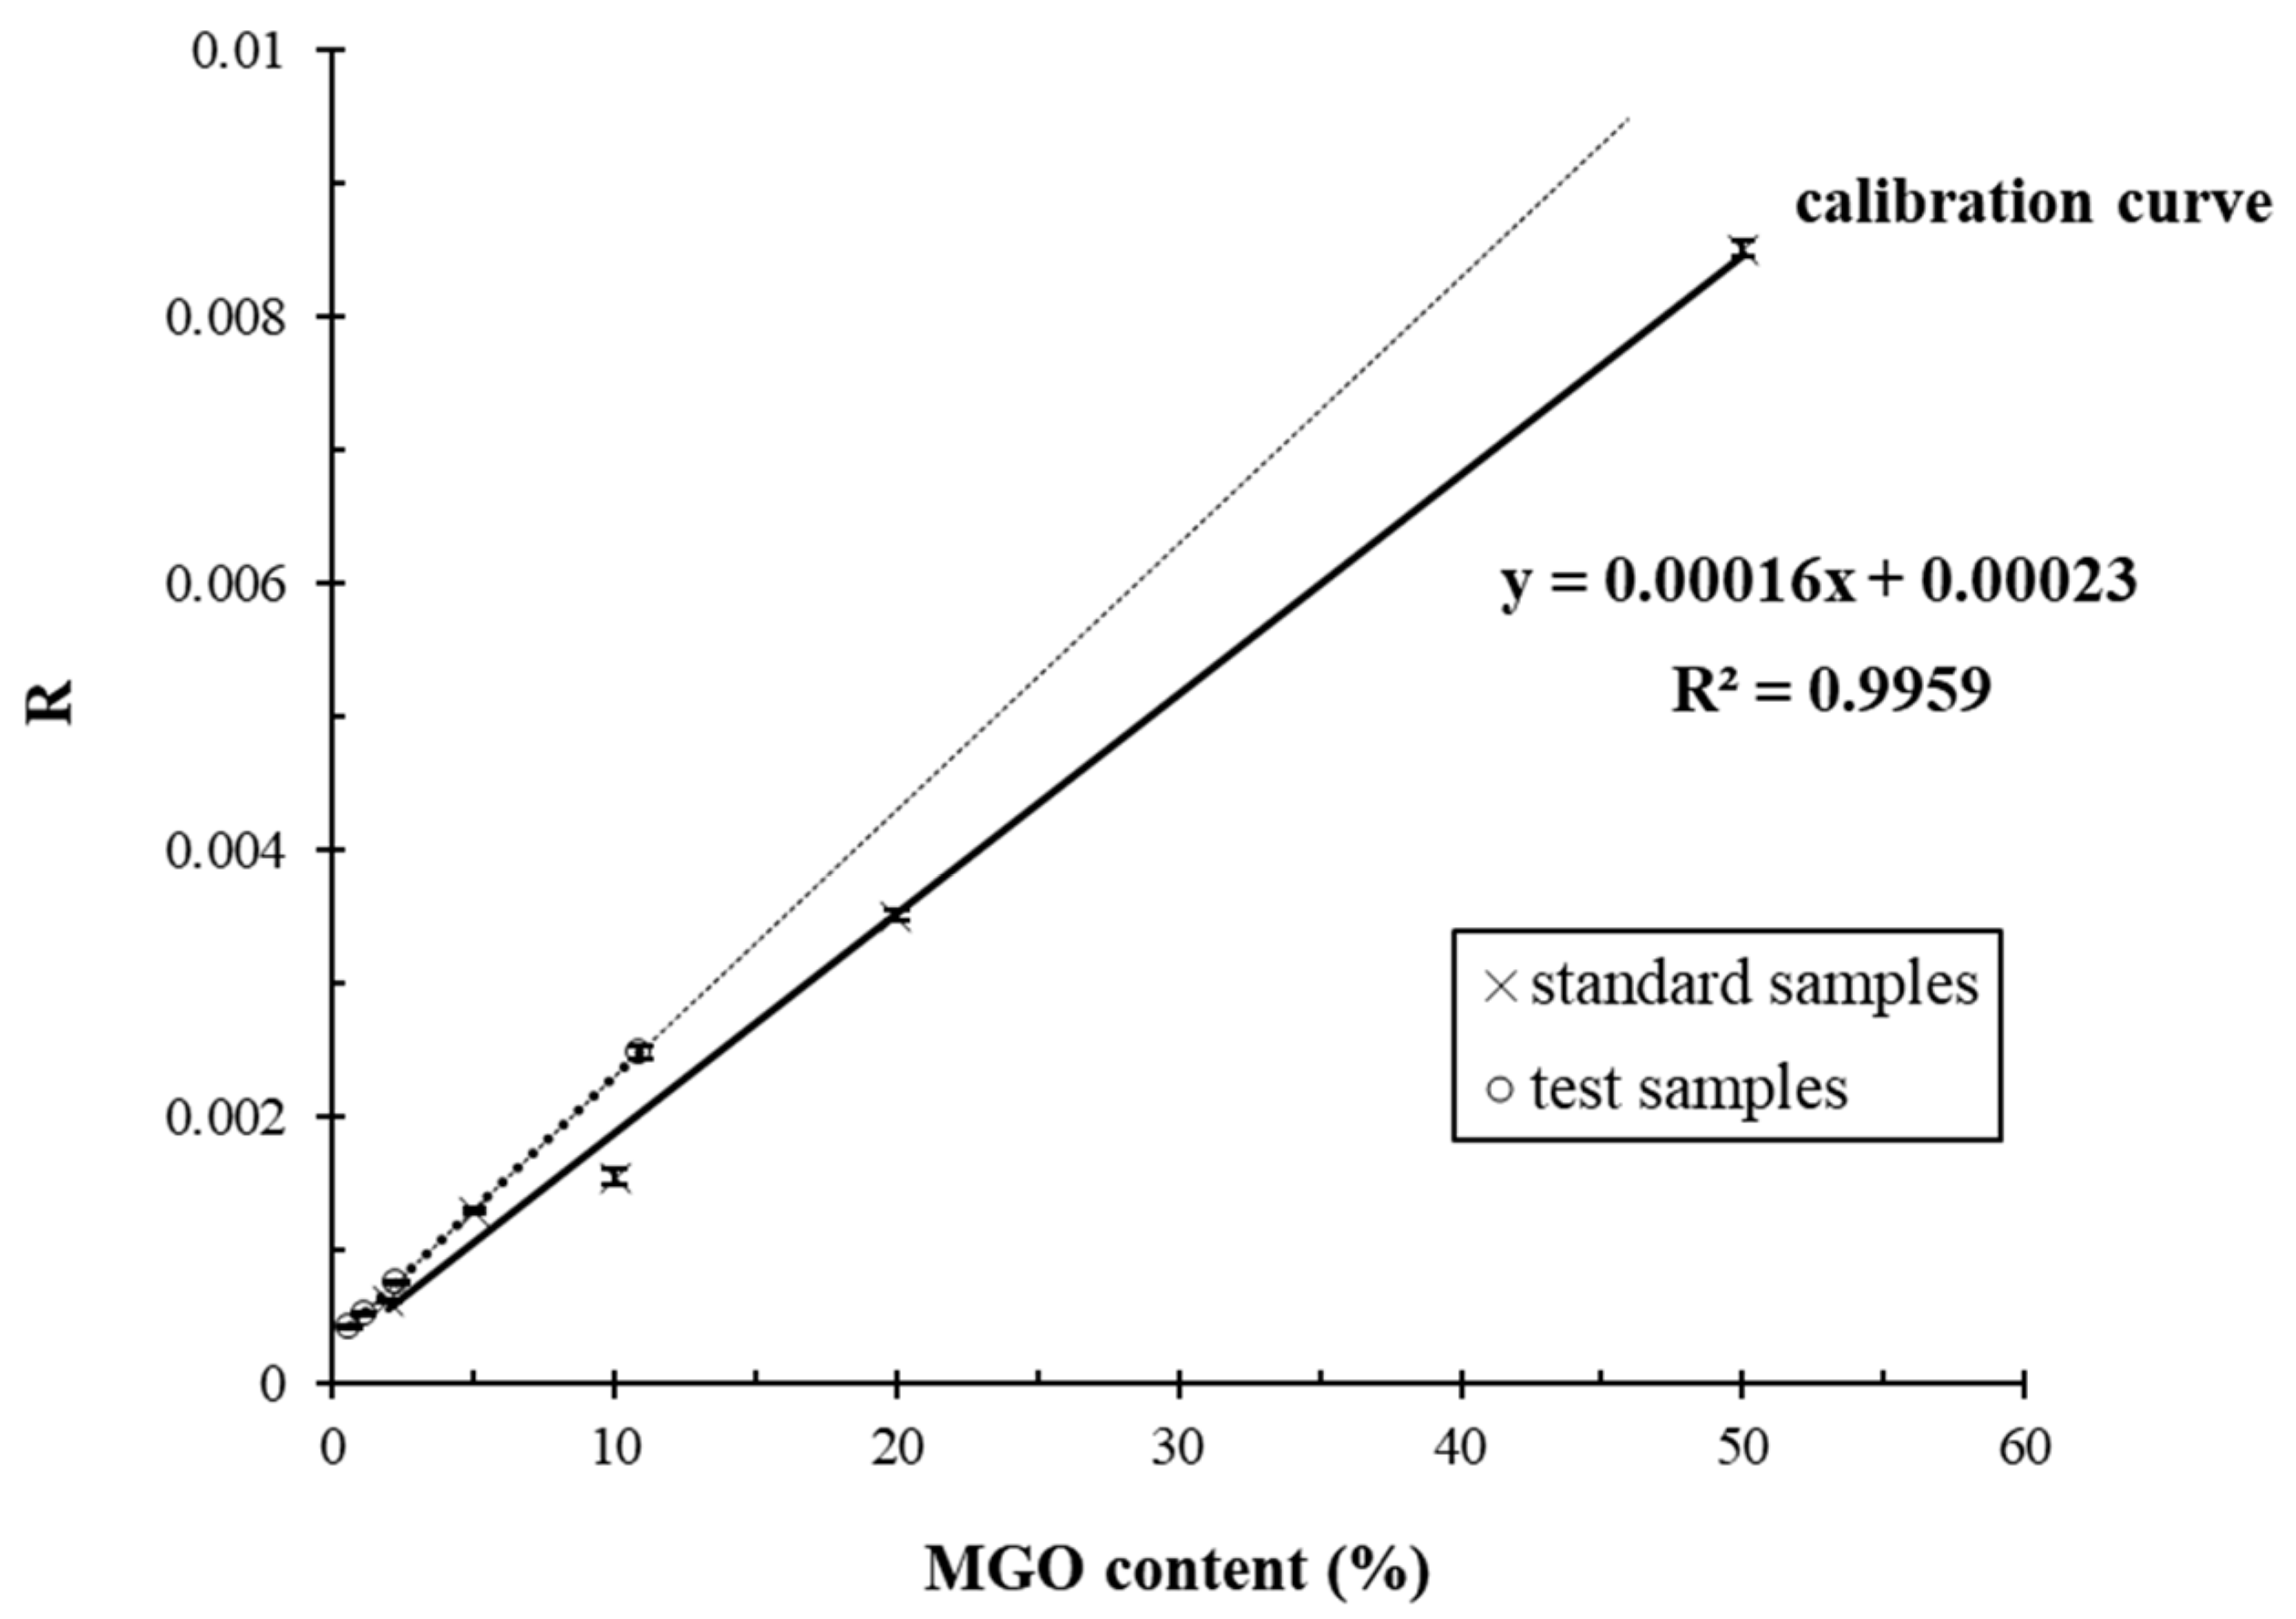
3.1. GC
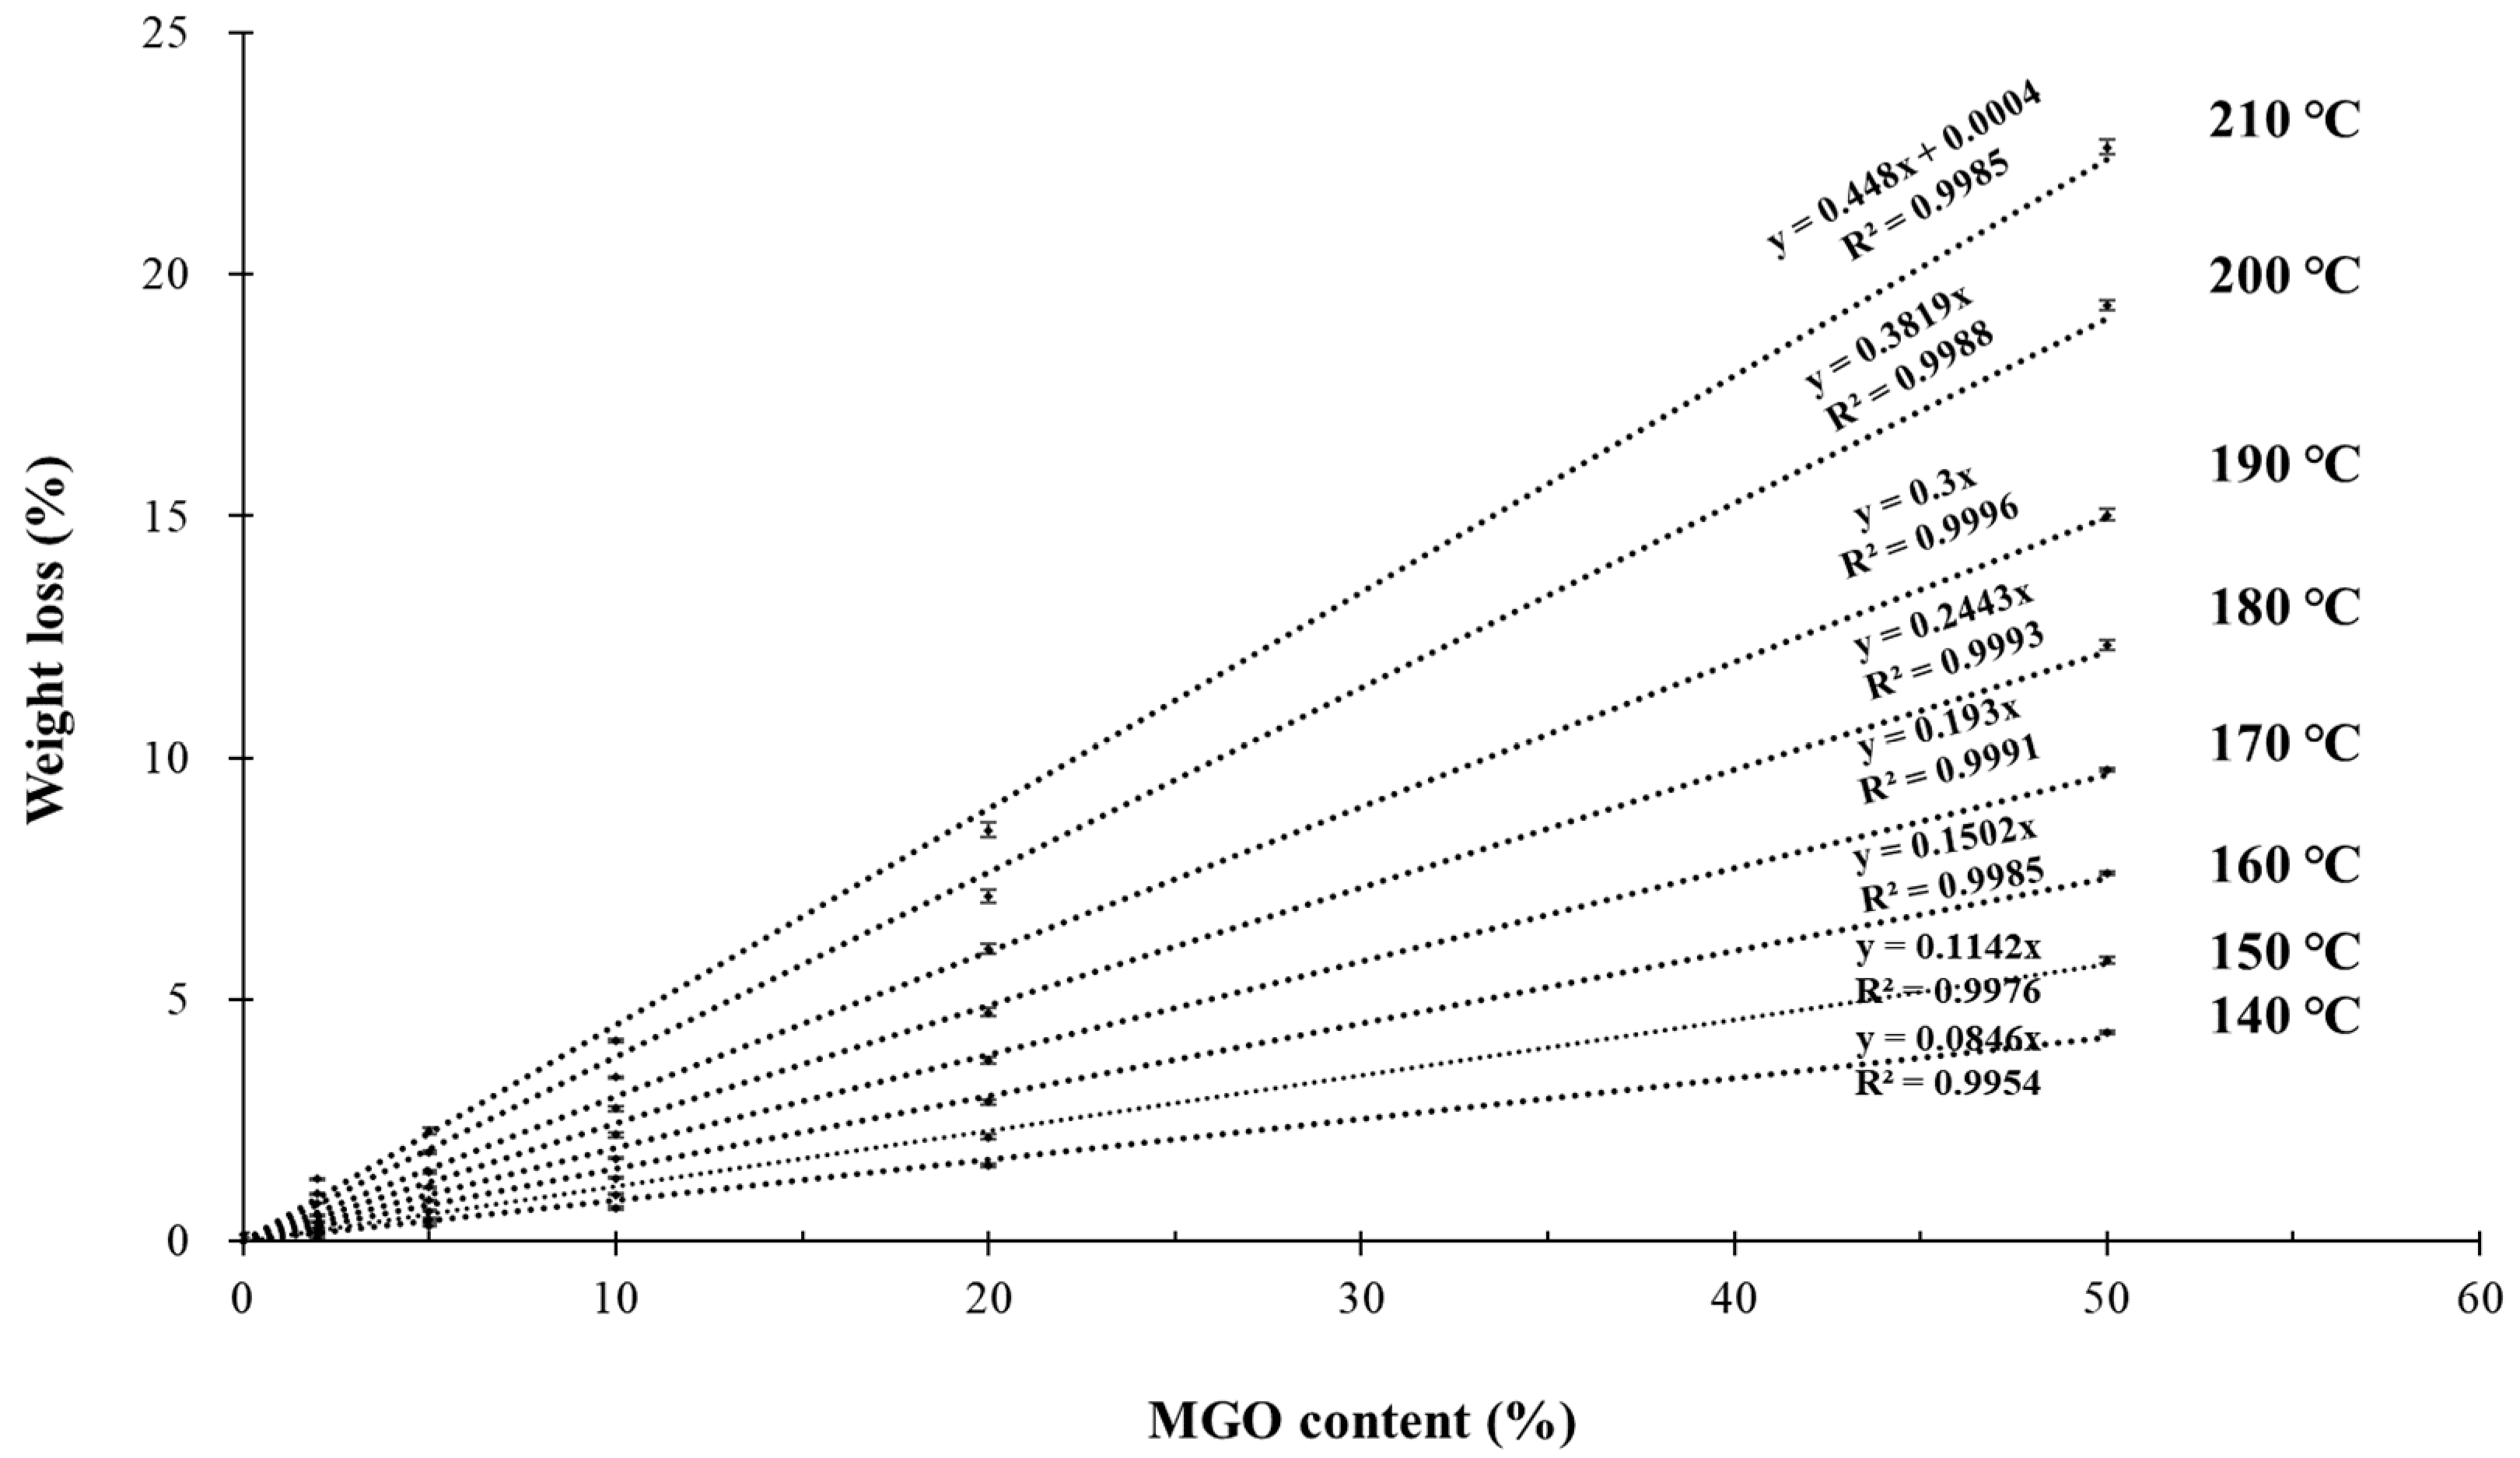
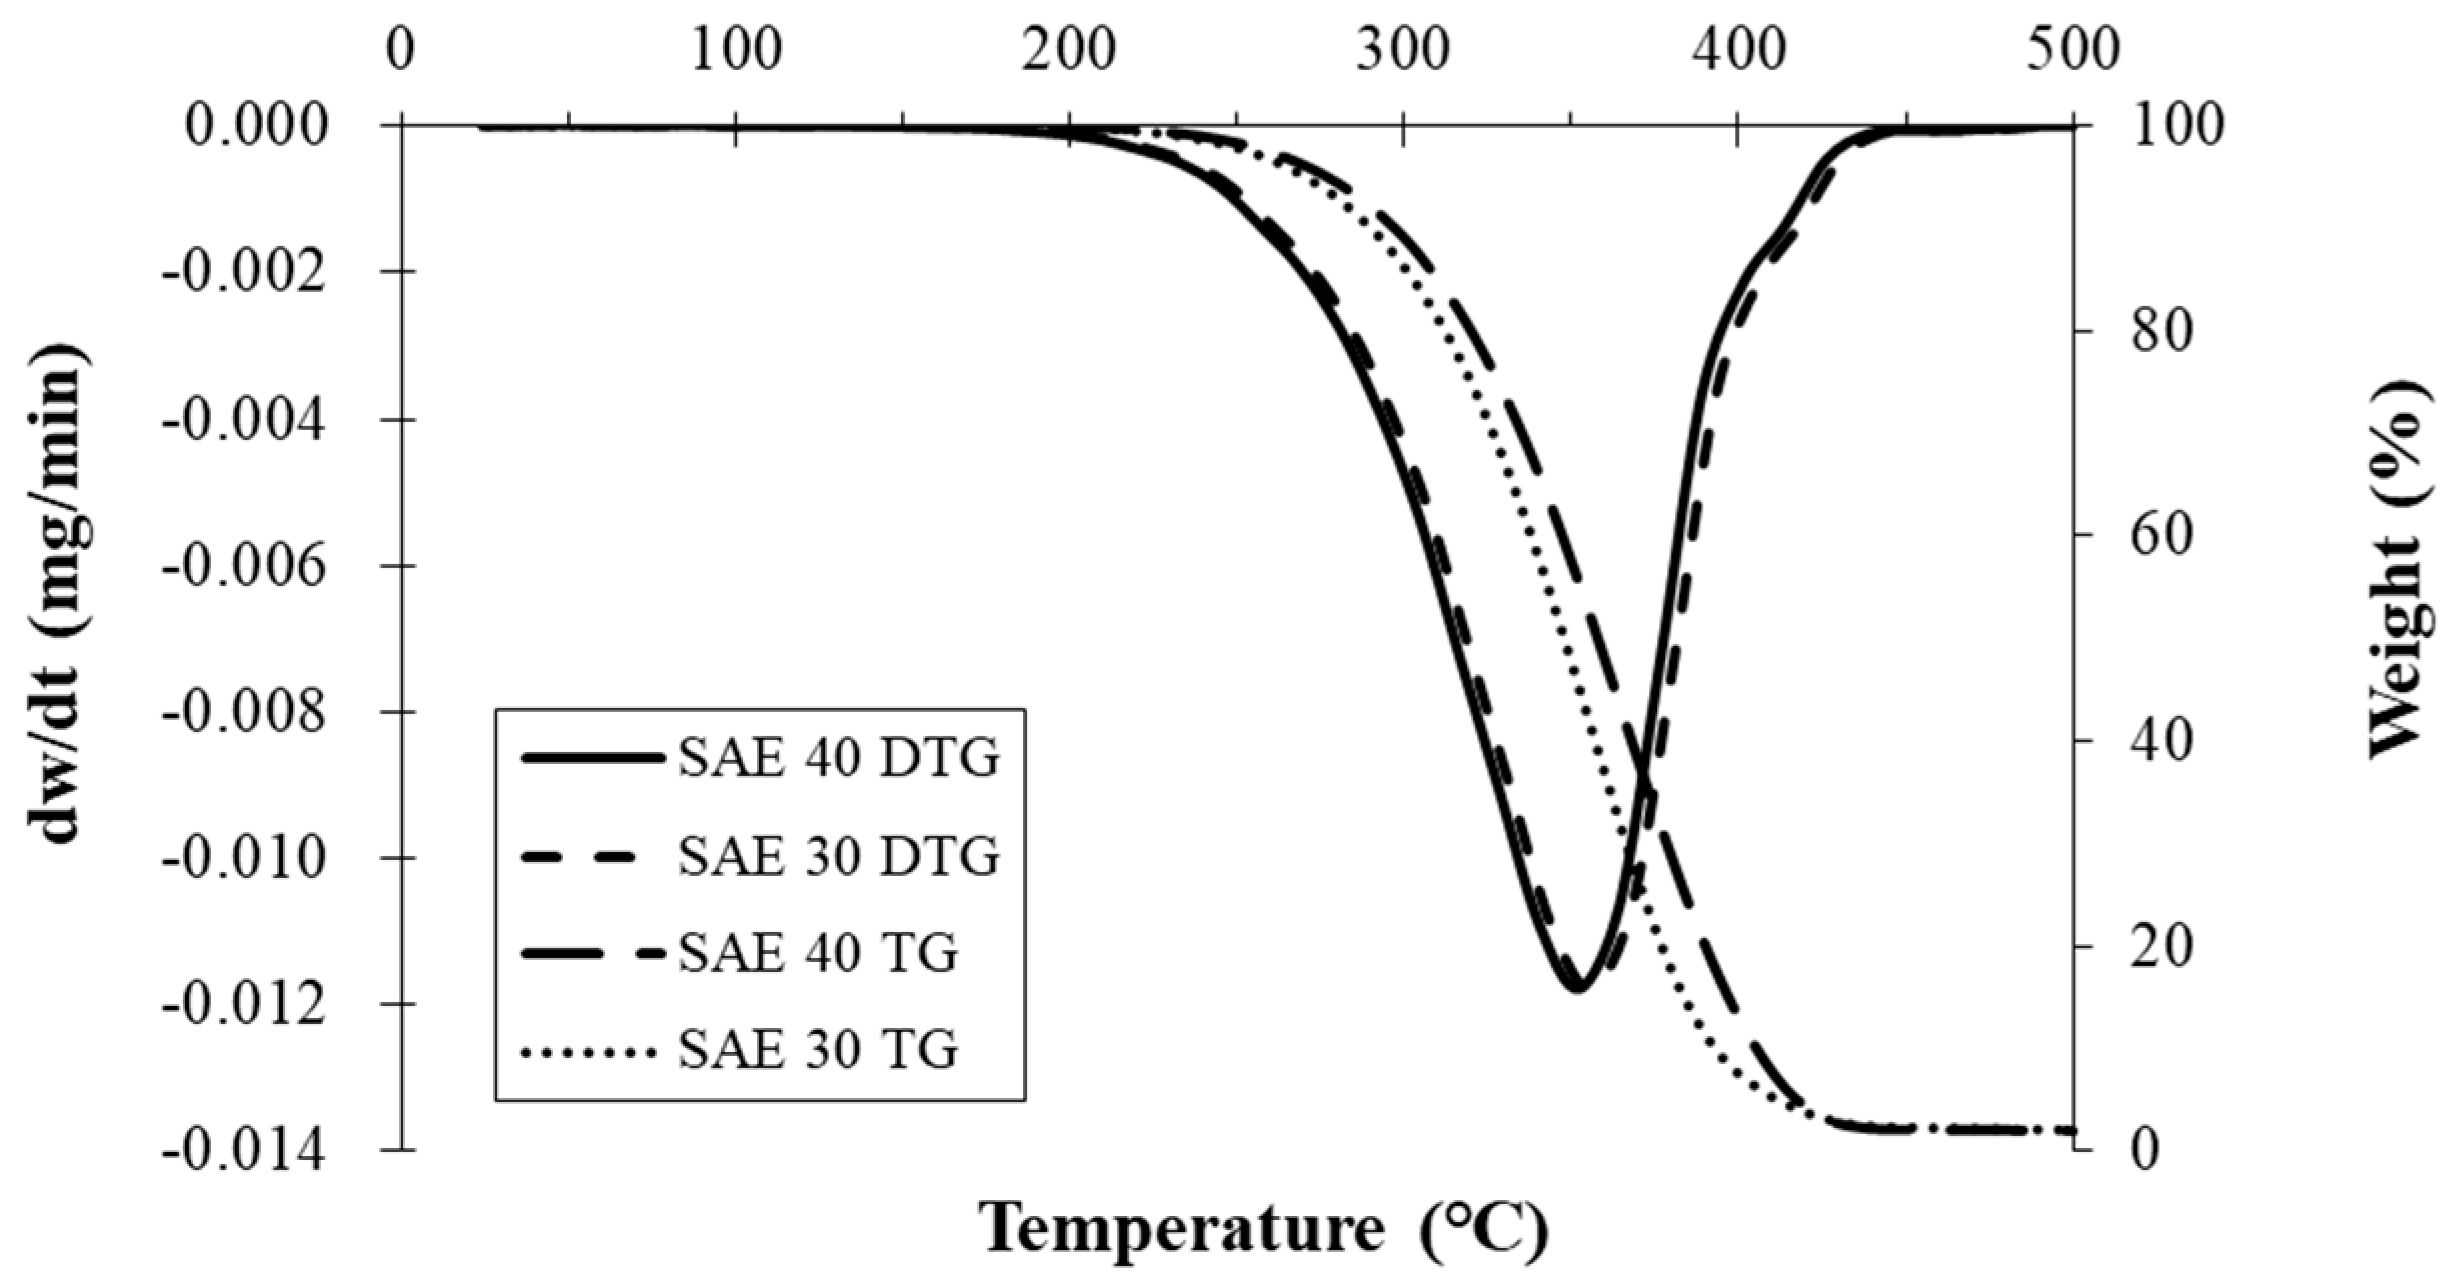
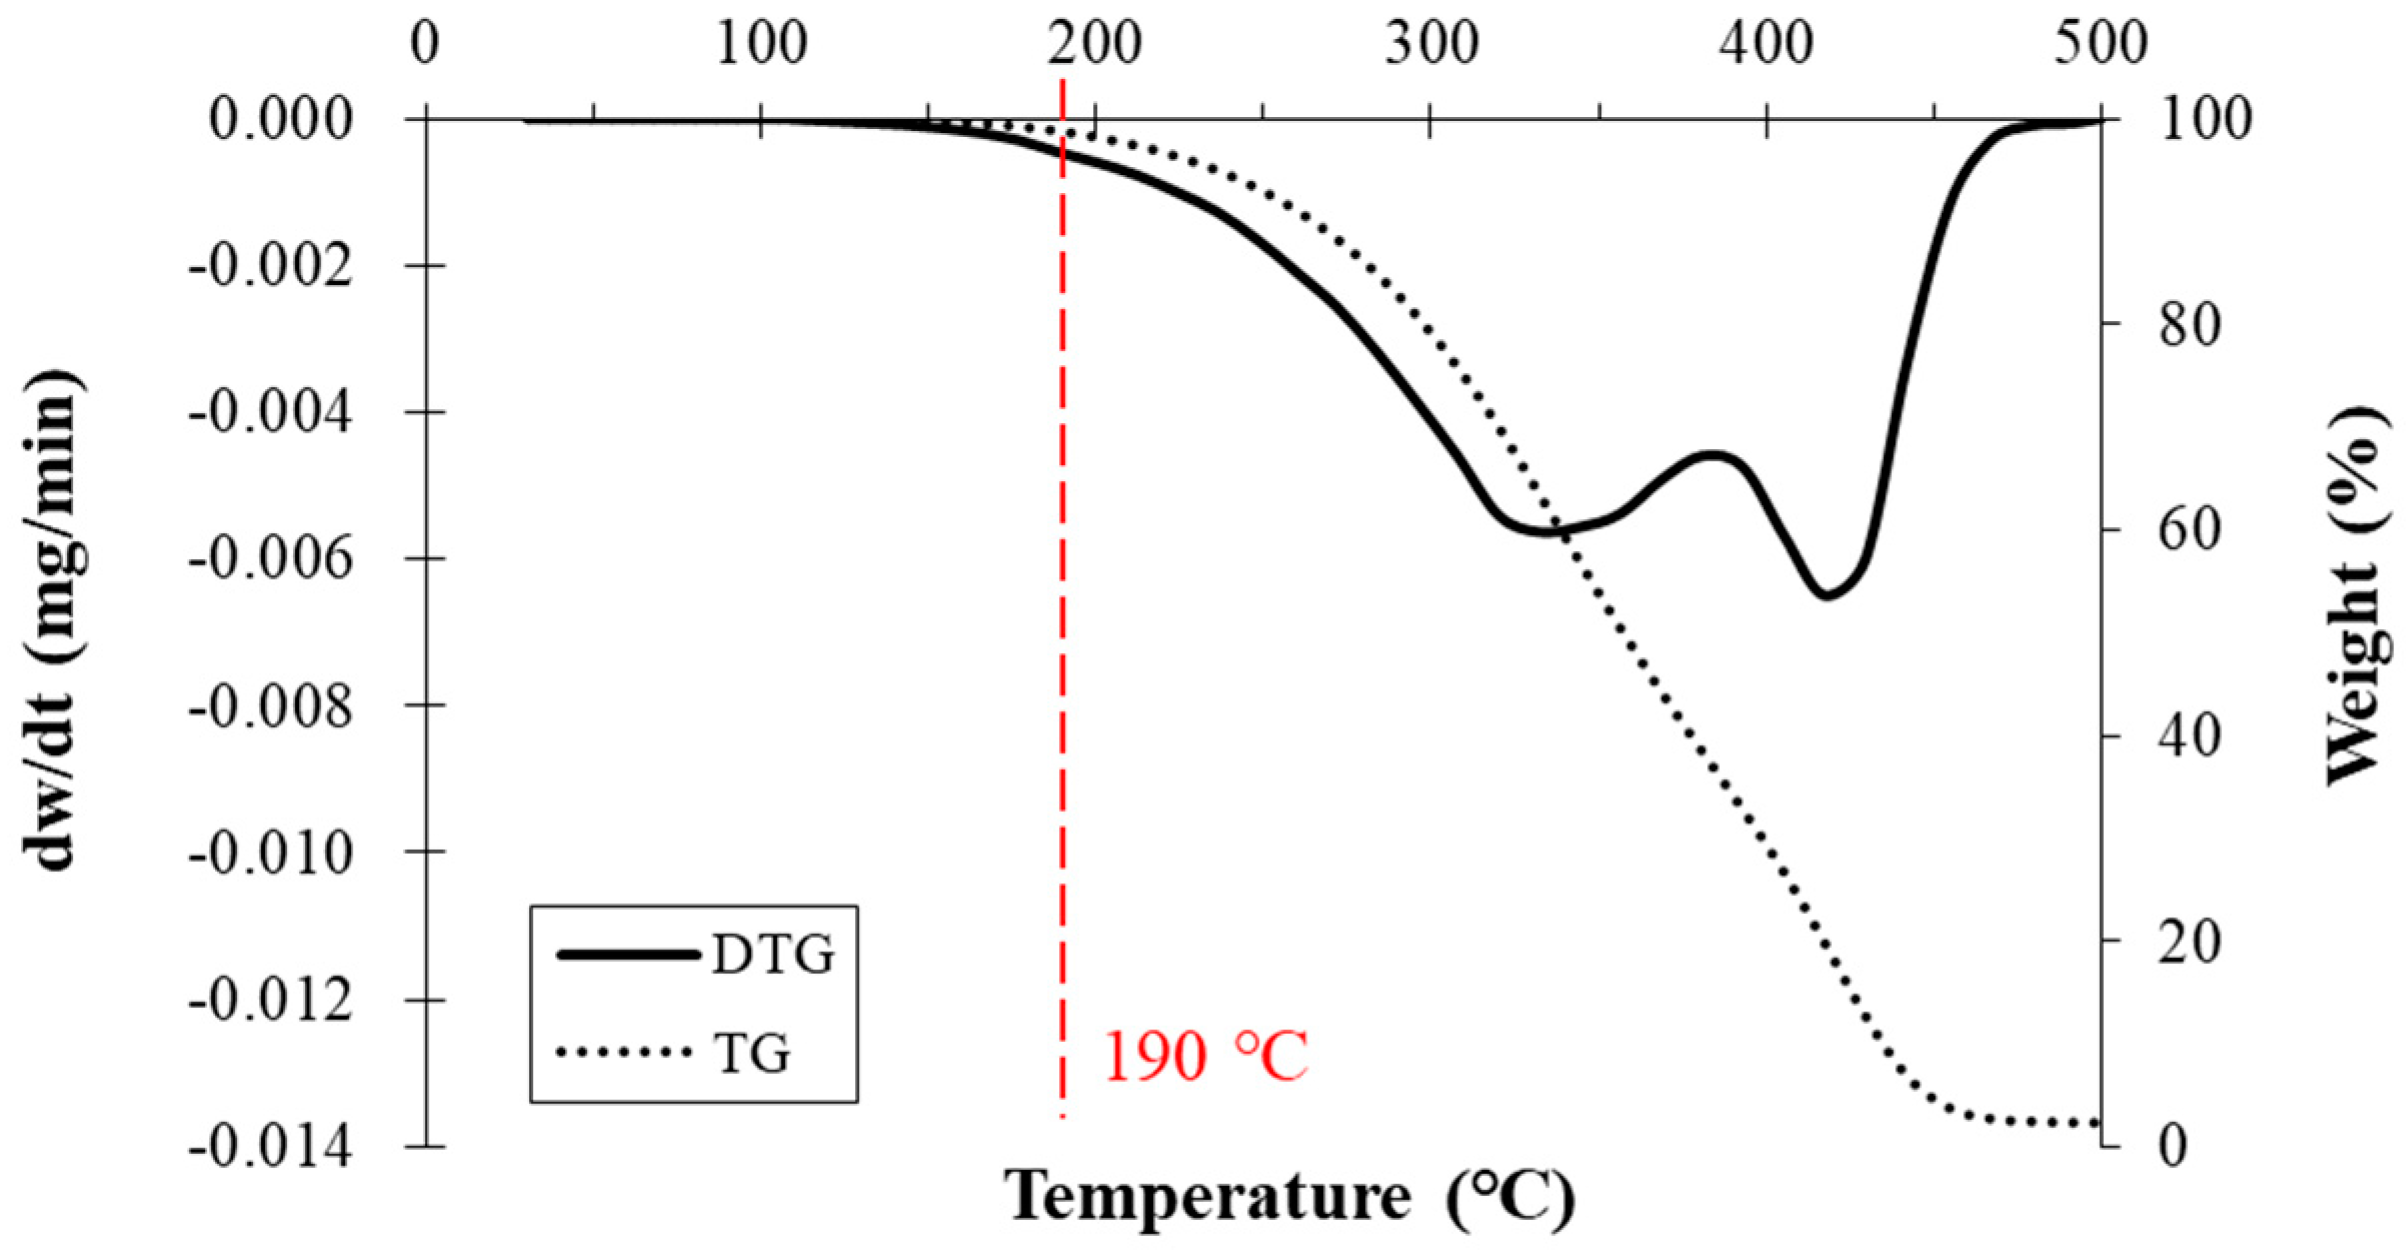
3.2. TGA
3.3. Comparison of GC and TGA Analyses
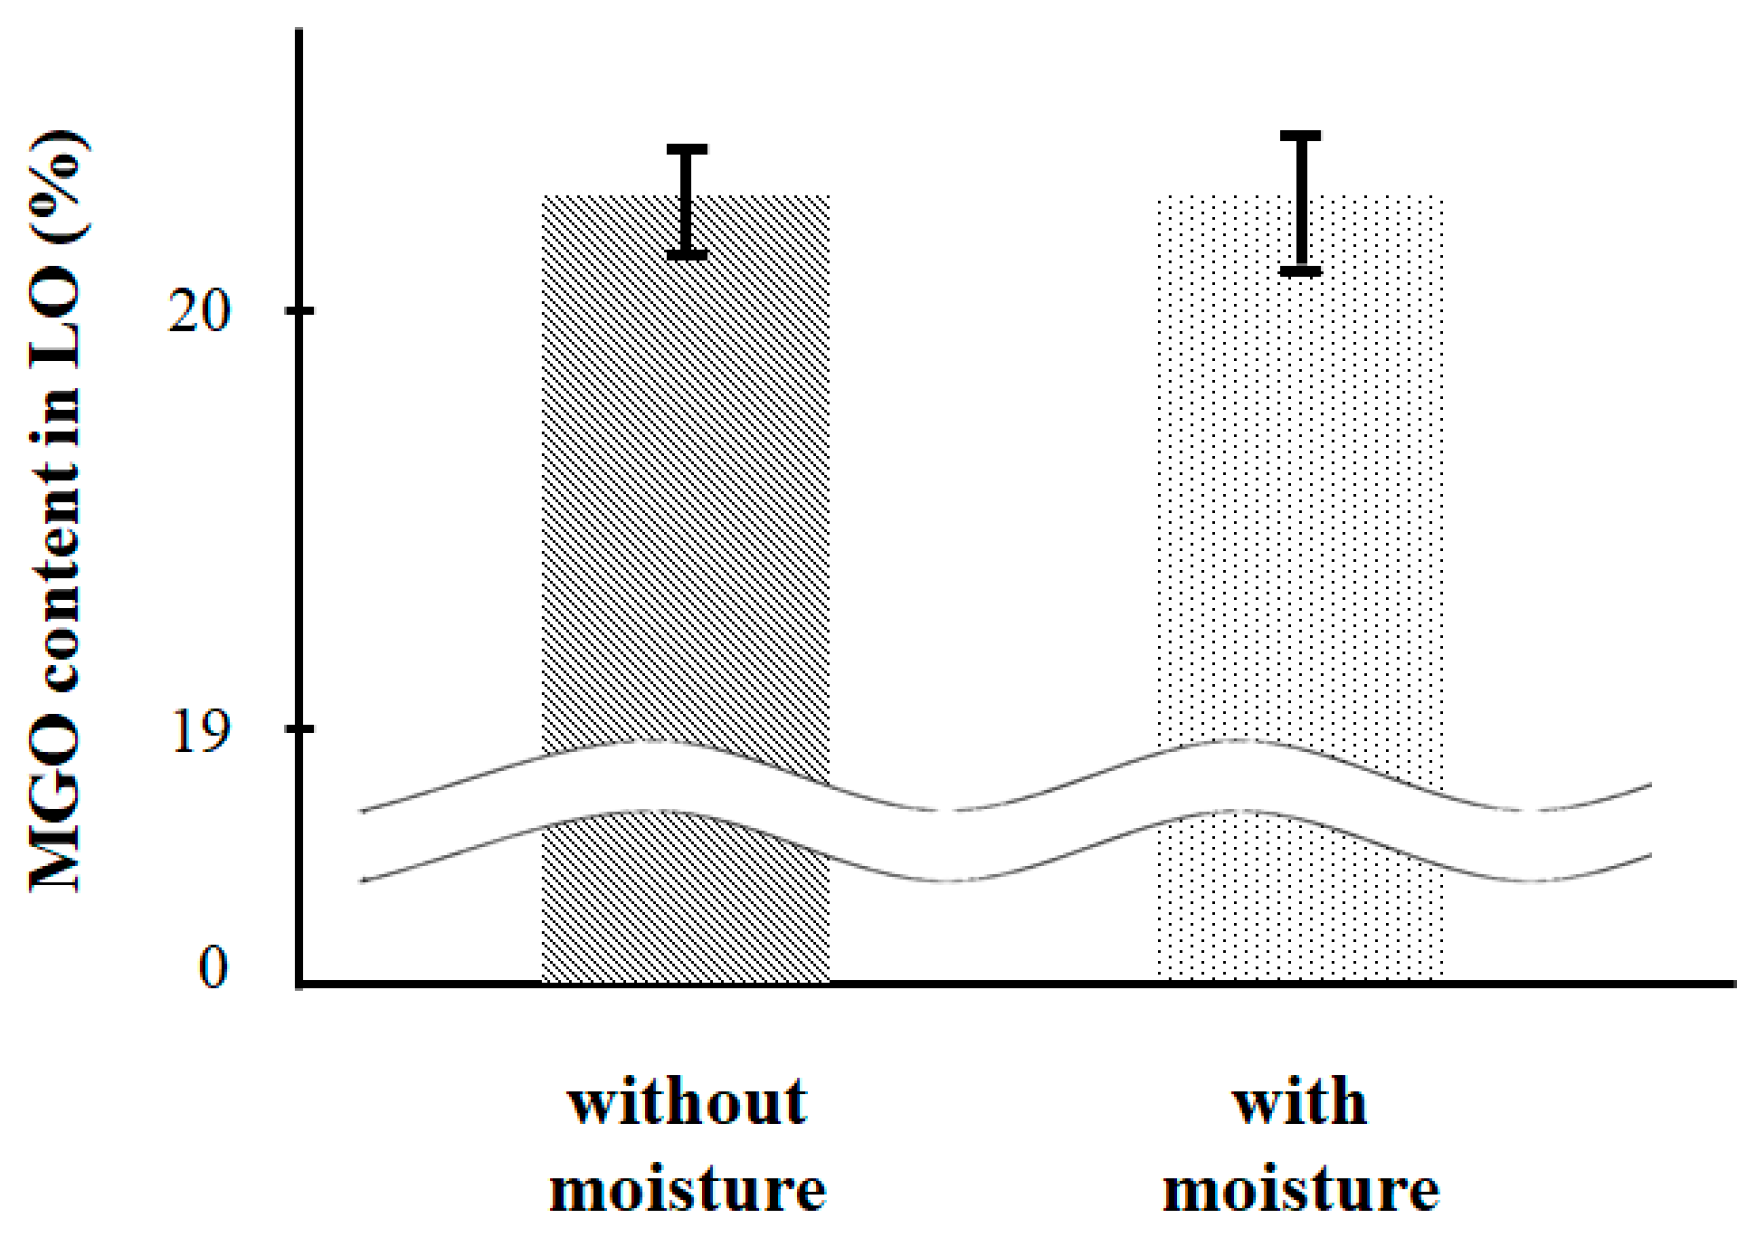
3.4. Application to an Actual Case
4. Conclusions
Author Contributions
Funding
Acknowledgments
Conflicts of Interest
References
- Clark, X.; Dollar, D.; Micco, A. Port Efficiency, Maritime Transport Costs and Bilateral Trade. Port efficiency, maritime transport costs, and bilateral trade. J. Dev. Econ. 2004, 75, 417–450. [Google Scholar] [CrossRef] [Green Version]
- UNCTAD (United Nations Conference on Trade and Development). Review of Maritime Transport 2019; United Nations Publication: New York, NY, USA; Geneva, Switzerland, 2019. [Google Scholar]
- IMO MEPC 72. Initial Strategy on Green House Gas Emissions Reduction for Ships; MEPC/72/17; IMO International Maritime Organisation: London, UK, 2018. [Google Scholar]
- Kovach, J.T.; Tsakiris, E.A.; Wong, L.T. Engine Friction Reduction for Improved Fuel Economy. SAE Tech. Pap. Ser. 1982. [Google Scholar] [CrossRef]
- Kuhn, E.; Balan, C. Experimental procedure for the evaluation of the friction energy of lubricating greases. Wear 1997, 209, 237–240. [Google Scholar] [CrossRef]
- Livanos, G.A.; Kyrtatos, N.P. Friction model of a marine diesel engine piston assembly. Tribol. Int. 2007, 40, 1441–1453. [Google Scholar] [CrossRef]
- Millington, B.W.; Hartles, E.R. frictional losses in diesel engines. SAE Tech. Pap. Ser. 1968. [Google Scholar] [CrossRef]
- Wang, Y.; Liang, X.; Shu, G.; Wang, X.; Bao, J.; Liu, C. Effect of lubricating oil additive package on the characterization of diesel particles. Appl. Energy 2014, 136, 682–691. [Google Scholar] [CrossRef]
- Wilson, R.; Lyon, S. Corrosion in Lubricants/Fuels*. Shreir’s Corros. 2010, 1299–1307. [Google Scholar] [CrossRef]
- Needelman, W.M.; Madhavan, P.V. Review of Lubricant Contamination and Diesel Engine Wear. SAE Tech. Pap. Ser. 1988. Available online: http://citeseerx.ist.psu.edu/viewdoc/download?doi=10.1.1.404.7165&rep=rep1&type=pdf (accessed on 10 March 2001).
- Newell, G.E. Oil analysis cost-effective machine condition monitoring technique. Ind. Lubr. Tribol. 1999, 51, 119–124. [Google Scholar] [CrossRef]
- Standard Test Method for Diesel Fuel Diluent in Used Diesel Engine Oils by Gas Chromatography. Available online: https://www.astm.org/Standards/D3524.html (accessed on 10 March 2001).
- Standard Test Method for Gasoline Fuel Dilution in Used Gasoline Engine Oils by Wide-Bore Capillary Gas Chromatography. Available online: https://www.astm.org/Standards/D3525.htm (accessed on 10 March 2001).
- Standard Test Method for Determination of Fuel Dilution for in Service Engine Oils by Gas Chromatography. Available online: https://www.astm.org/Standards/D7593.htm (accessed on 10 March 2001).
- Agarwal, A.K. Experimental investigations of the effect of biodiesel utilization on lubricating oil tribology in diesel engines. Proc. Inst. Mech. Eng. Part. D J. Automob. Eng. 2005, 219, 703–713. [Google Scholar] [CrossRef]
- Ng, E.-P.; Mintova, S. Quantitative moisture measurements in lubricating oils by FTIR spectroscopy combined with solvent extraction approach. Microchem. J. 2011, 98, 177–185. [Google Scholar] [CrossRef]
- Macián, V.; Tormos, B.; Gómez, Y.A.; Salavert, J.M. Proposal of an FTIR Methodology to Monitor Oxidation Level in Used Engine Oils: Effects of Thermal Degradation and Fuel Dilution. Tribol. Trans. 2012, 55, 872–882. [Google Scholar] [CrossRef]
- ISO 8217:2017 Petroleum Products-Fuels (class F)- Specification of Marine Fuels. Available online: https://www.iso.org/standard/64247.html (accessed on 10 March 2001).
- Shara, S.; Eissa, E.; Basta, J. Polymers additive for improving the flow properties of lubricating oil. Egypt. J. Pet. 2018, 27, 795–799. [Google Scholar] [CrossRef]
- Alam, M.S.; Zeraati-Rezaei, S.; Liang, Z.; Stark, C.; Xu, H.; MacKenzie, A.R.; Harrison, R.M. Mapping and quantifying isomer sets of hydrocarbons (≥ C12) in diesel exhaust, lubricating oil and diesel fuel samples using GC × GC-ToF-MS. Atmos. Meas. Tech. 2018, 11, 3047–3058. [Google Scholar] [CrossRef] [Green Version]
- Idris, S.S.; Rahman, N.A.; Ismail, K.; Alias, A.B.; Rashid, Z.A.; Aris, M.J. Investigation on thermochemical behaviour of low rank Malaysian coal, oil palm biomass and their blends during pyrolysis via thermogravimetric analysis (TGA). Bioresour. Technol. 2010, 101, 4584–4592. [Google Scholar] [CrossRef] [PubMed]


| Property | Fresh LO | MGO | Spent LO | Test Method |
|---|---|---|---|---|
| Density, g/cm3 at 15 °C | 0.8809 | 0.8755 | 0.8833 | ASTM D 4052 |
| Specific gravity | 0.8817 | 0.8763 | 0.8841 | ASTM D 5052 |
| Kinematic viscosity, cSt at 40 °C | 134.27 | 3.8121 | 90.716 | ASTM D 445 |
| Kinematic viscosity, cSt at 100 °C | 14.746 | - | 11.54 | ASTM D 445 |
| Viscosity index (VI) | 110.4 | - | 116.4 | ASTM D 2270 |
| Pour point, °C | −39 | −6 | −43 | ASTM D 97 |
| Flash point, °C | 244 | 72 | 232 | ASTM D 93 |
| TBN, mgKOH/g | 12.8301 | - | 11.2581 | ASTM D 2896 |
| Sulfur content, wt% | - | 0.016 | - | ASTM D 4294 |
| Water content, wt% | 0.01 | N/D | 0.12 | ASTM D 6304 |
| Color, ASTM scale | L 3.5 | L 0.5 | N/A (> 8.0) | ASTM D 1500 |
| Temperature (°C) | MGO Content (%) in LO | |||
|---|---|---|---|---|
| 0.50 | 1.00 | 3.00 | 15.00 | |
| 140 | N/A | N/A | 1.66 | 13.64 |
| 150 | N/A | 0.35 | 1.58 | 14.54 |
| 160 | N/A | 0.60 | 2.00 | 14.58 |
| 170 | N/A | 0.93 | 2.25 | 14.61 |
| 180 | 0.20 | 1.15 | 2.39 | 14.41 |
| 190 | 0.43 | 1.40 | 2.67 | 14.53 |
| 200 | 0.60 | 1.54 | 2.72 | 13.75 |
| 210 | 0.85 | 1.85 | 2.97 | 14.04 |
| Method | MGO Content (%) in LO | |||
|---|---|---|---|---|
| 0.50 | 1.00 | 3.00 | 15.00 | |
| GC (ASTM D 3524) | 0.60 | 1.09 | 2.28 | 10.91 |
| TGA at 190 °C | 0.43 | 1.40 | 2.67 | 14.53 |
Publisher’s Note: MDPI stays neutral with regard to jurisdictional claims in published maps and institutional affiliations. |
© 2021 by the authors. Licensee MDPI, Basel, Switzerland. This article is an open access article distributed under the terms and conditions of the Creative Commons Attribution (CC BY) license (http://creativecommons.org/licenses/by/4.0/).
Share and Cite
Ahn, S.; Seo, J.M.; Lee, H. Thermogravimetric Analysis of Marine Gas Oil in Lubricating Oil. J. Mar. Sci. Eng. 2021, 9, 339. https://doi.org/10.3390/jmse9030339
Ahn S, Seo JM, Lee H. Thermogravimetric Analysis of Marine Gas Oil in Lubricating Oil. Journal of Marine Science and Engineering. 2021; 9(3):339. https://doi.org/10.3390/jmse9030339
Chicago/Turabian StyleAhn, Suhyun, Jeong Mog Seo, and Heejin Lee. 2021. "Thermogravimetric Analysis of Marine Gas Oil in Lubricating Oil" Journal of Marine Science and Engineering 9, no. 3: 339. https://doi.org/10.3390/jmse9030339