
Characteristics of Breaking Wave Forces on Piles over a Permeable Seabed


Abstract
:1. Introduction
2. Numerical Model Implementation
2.1. Fluid Governing Equations
- Continuity equation
- 2.
- Momentum equation
2.2. Free Surface Capture Method
2.3. Permeable Seabed Model
2.4. Validation
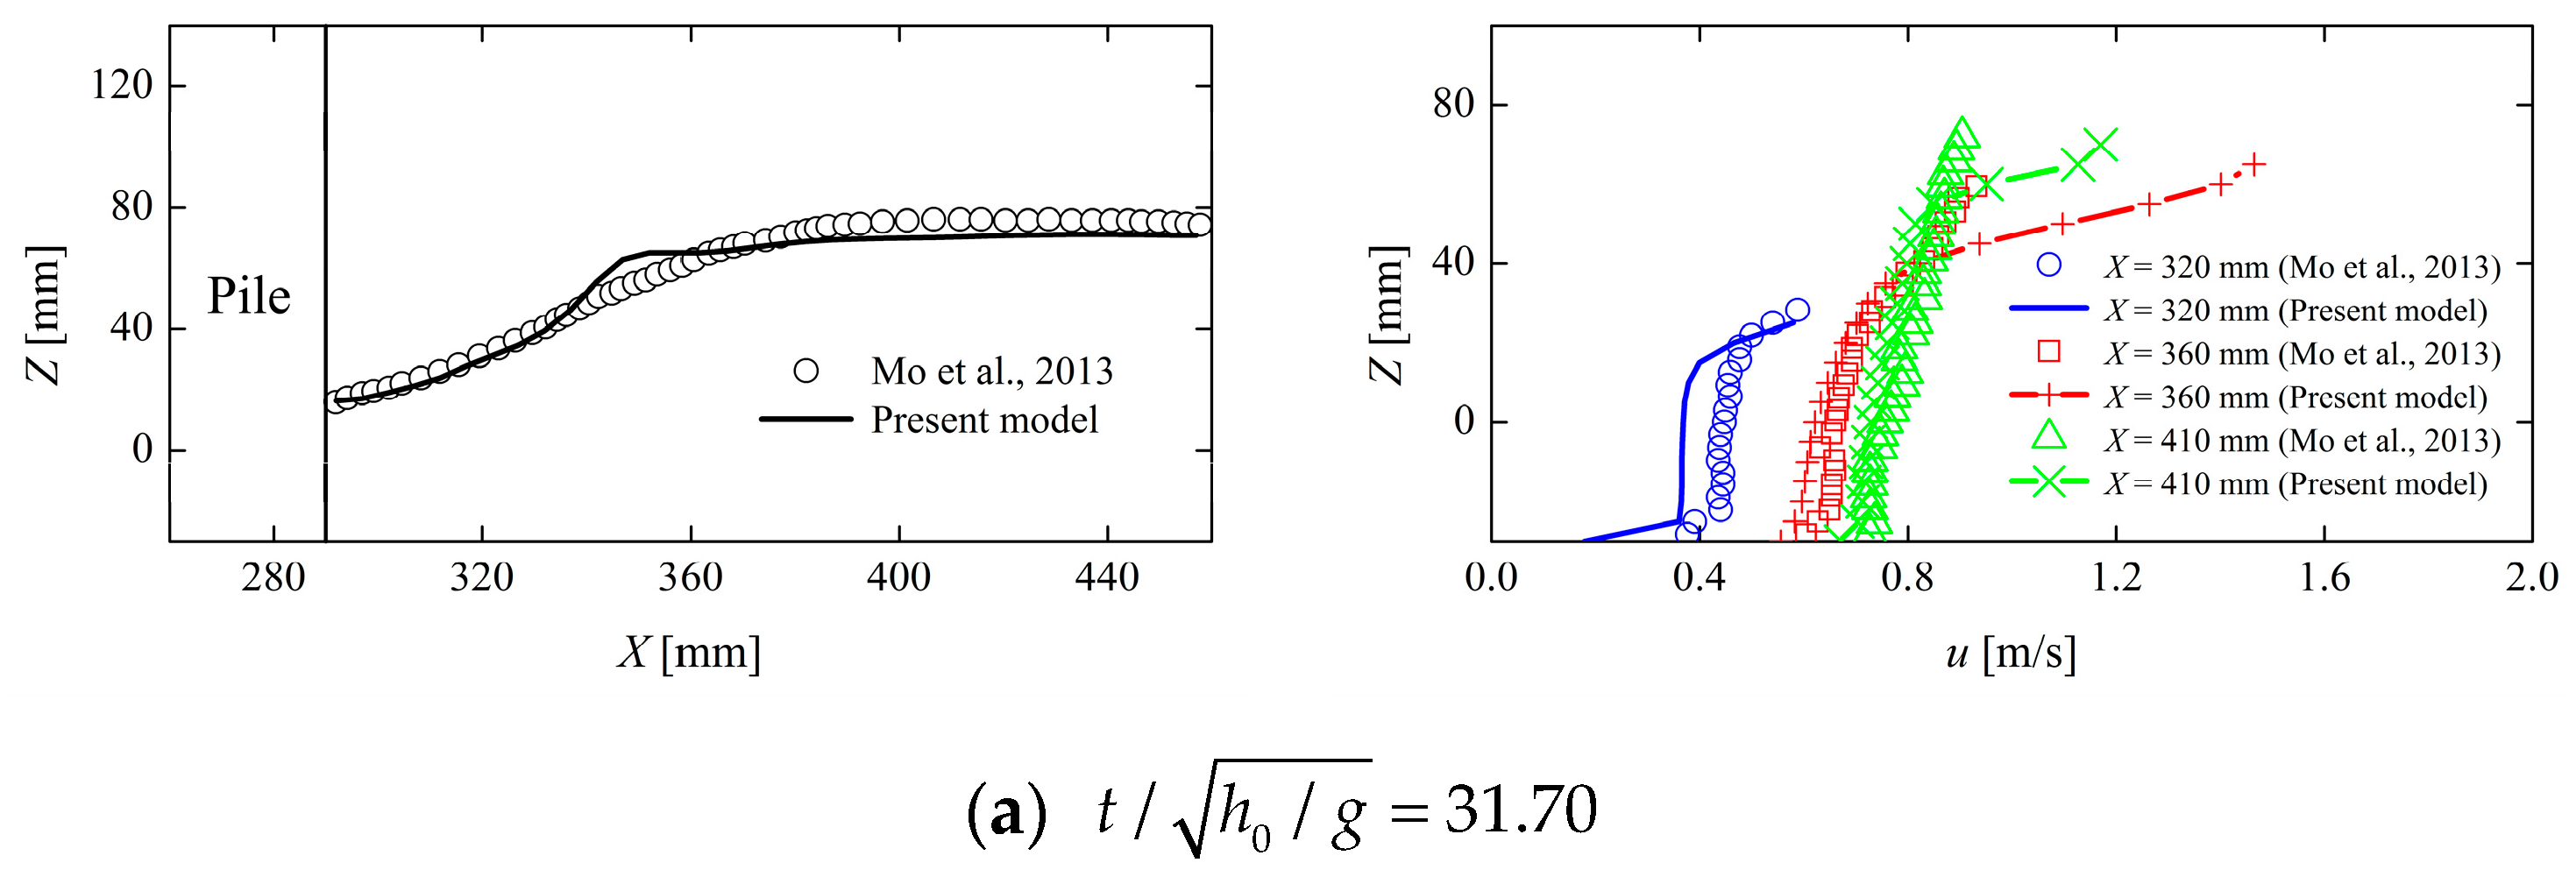
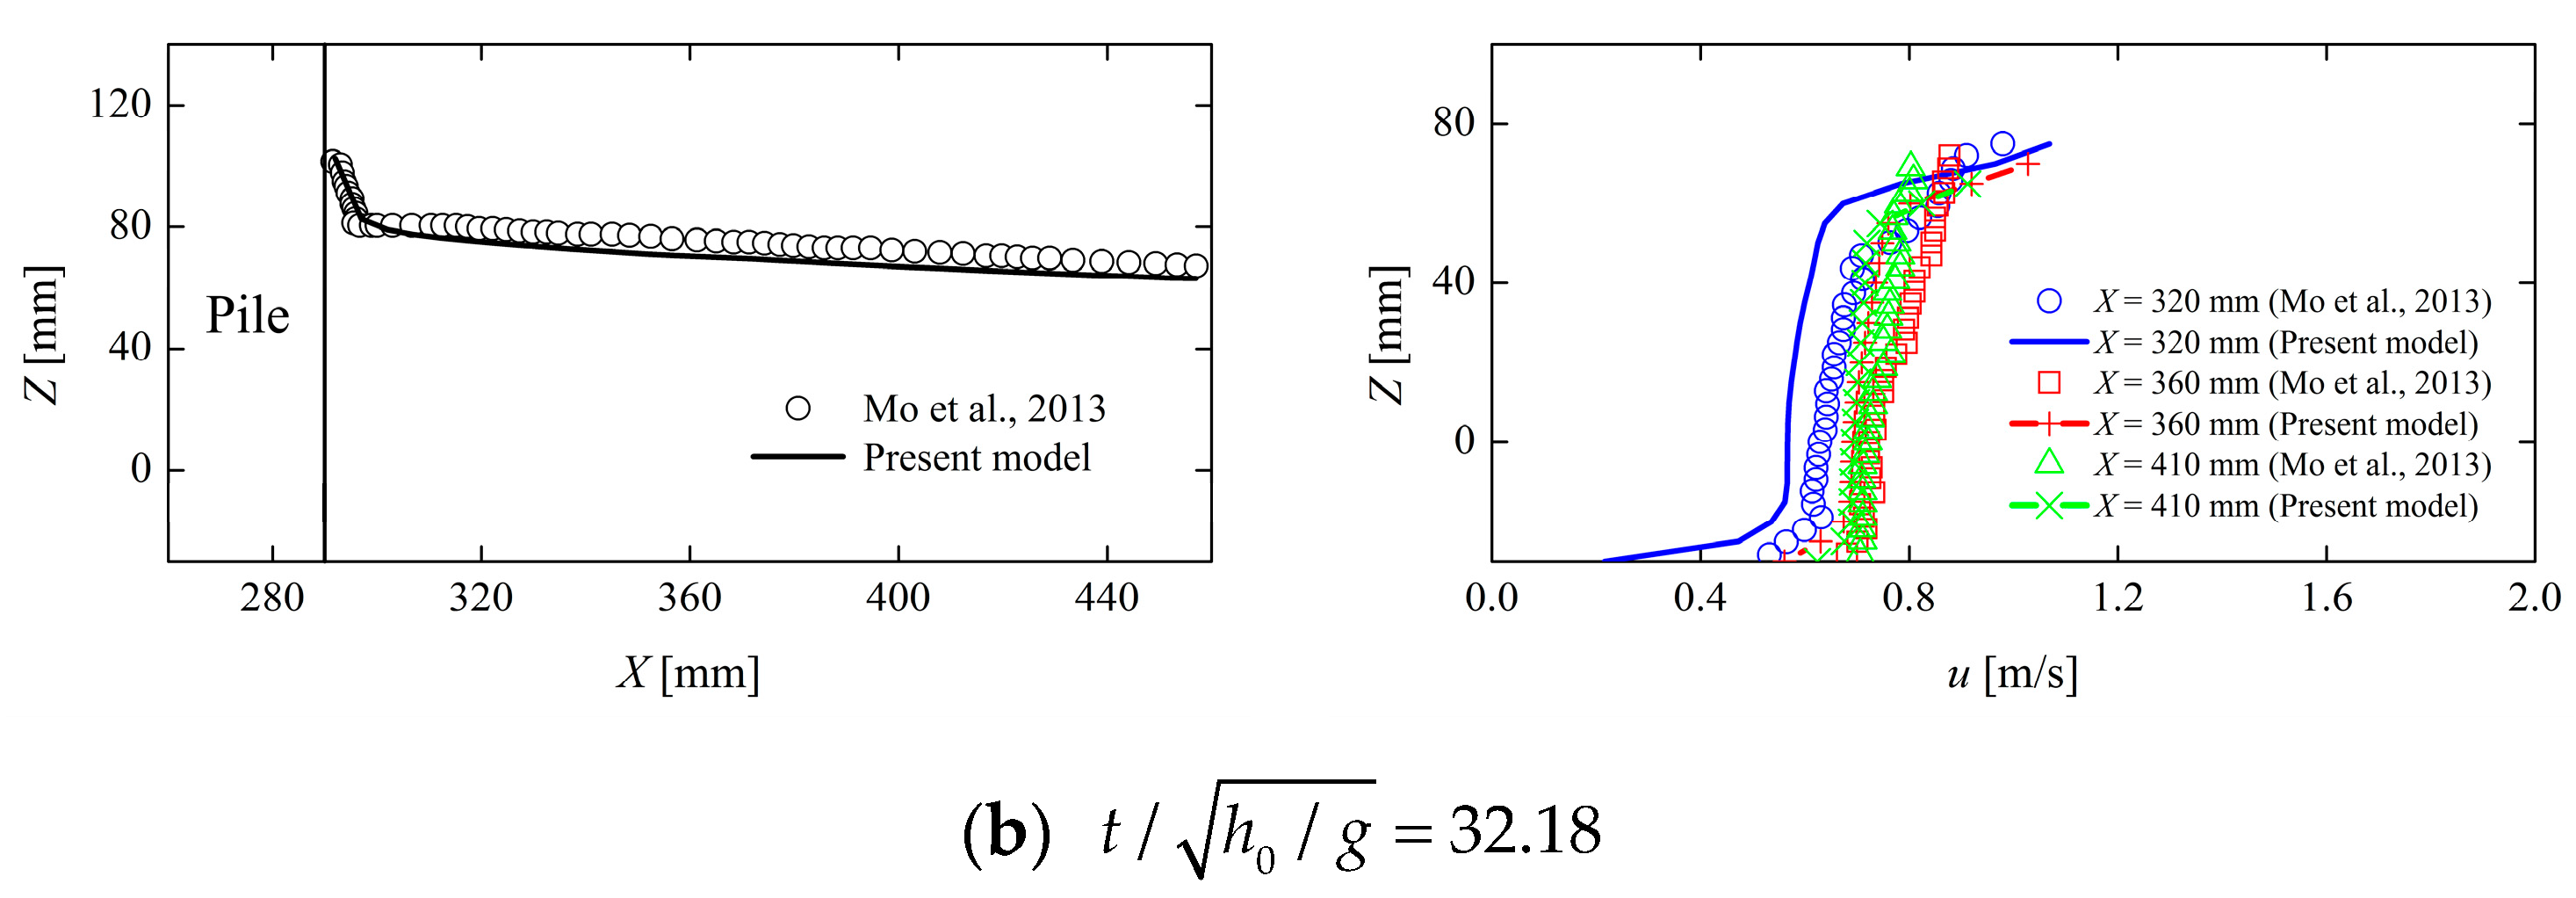
2.4.1. Comparison with Experimental Data on Free Surface Elevations and Velocities of Waves Propagating on an Impermeable Slope
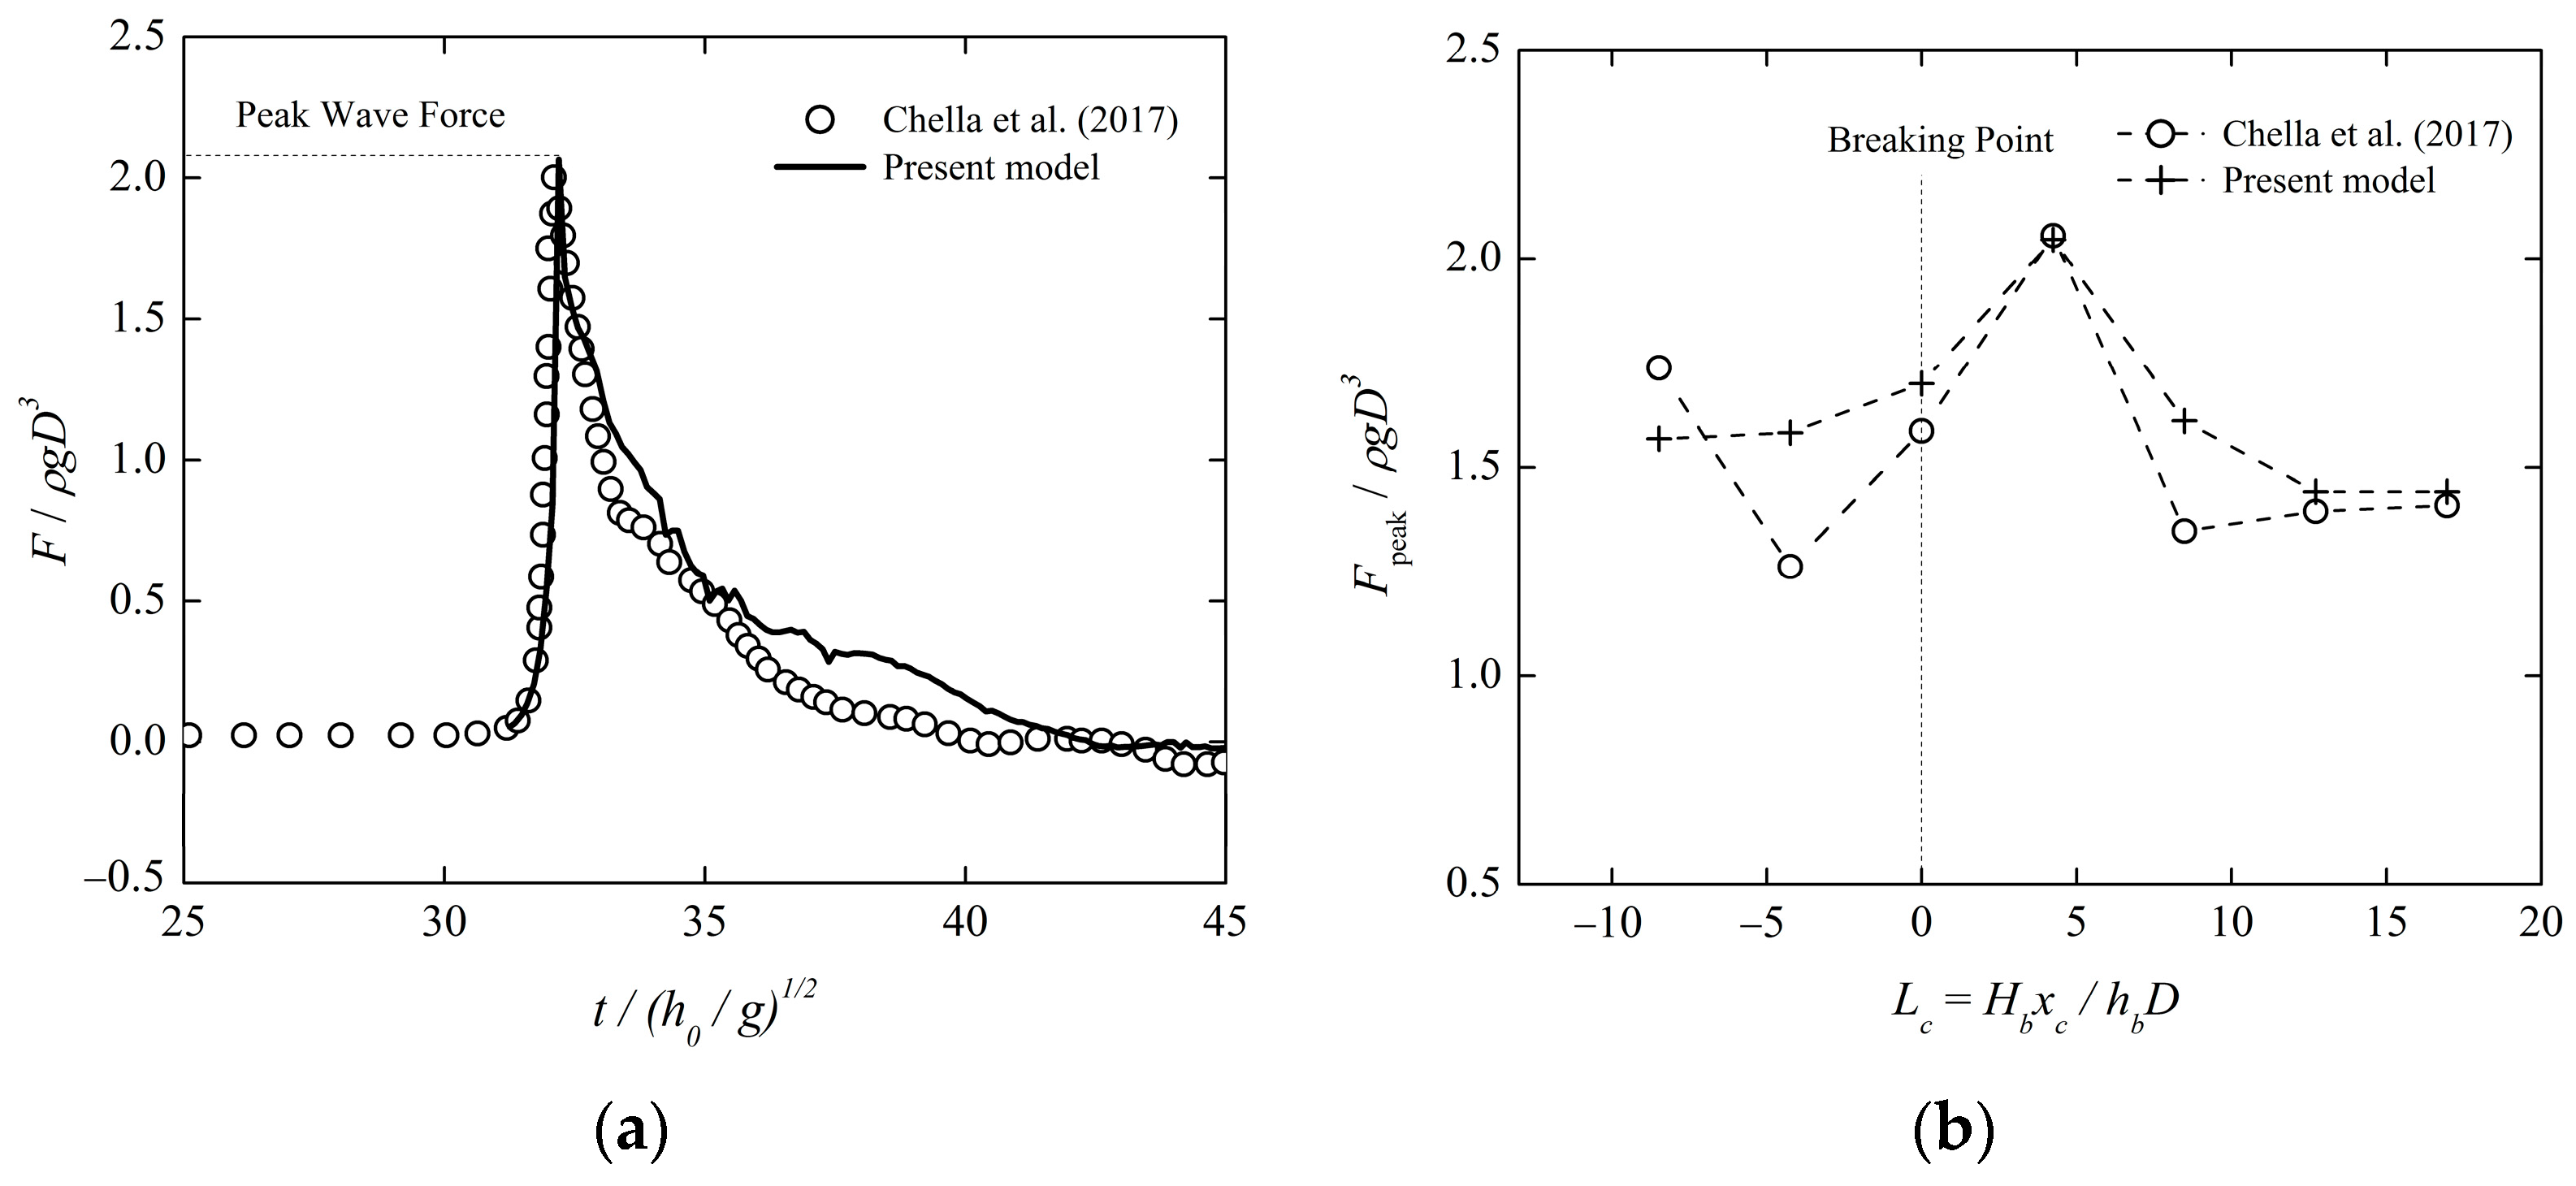
2.4.2. Comparison with Numerical Results on Breaking Wave Forces Acting on a Vertical Cylinder
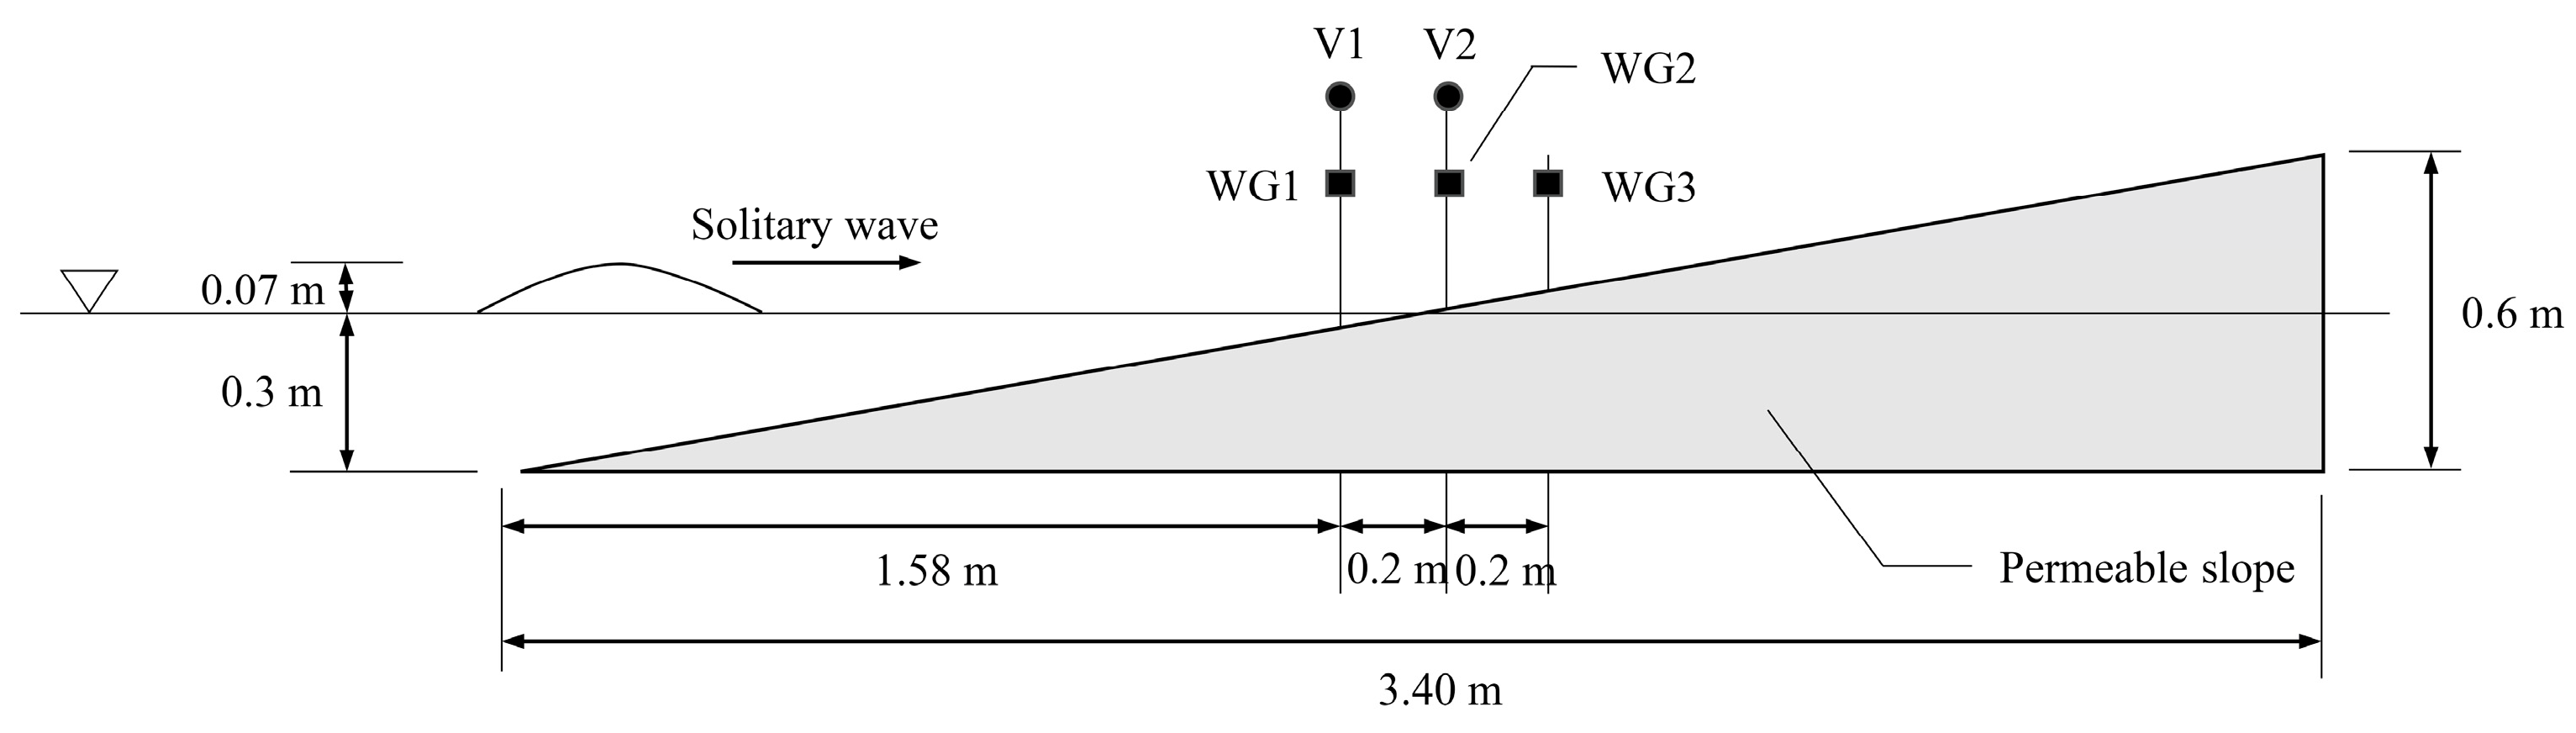
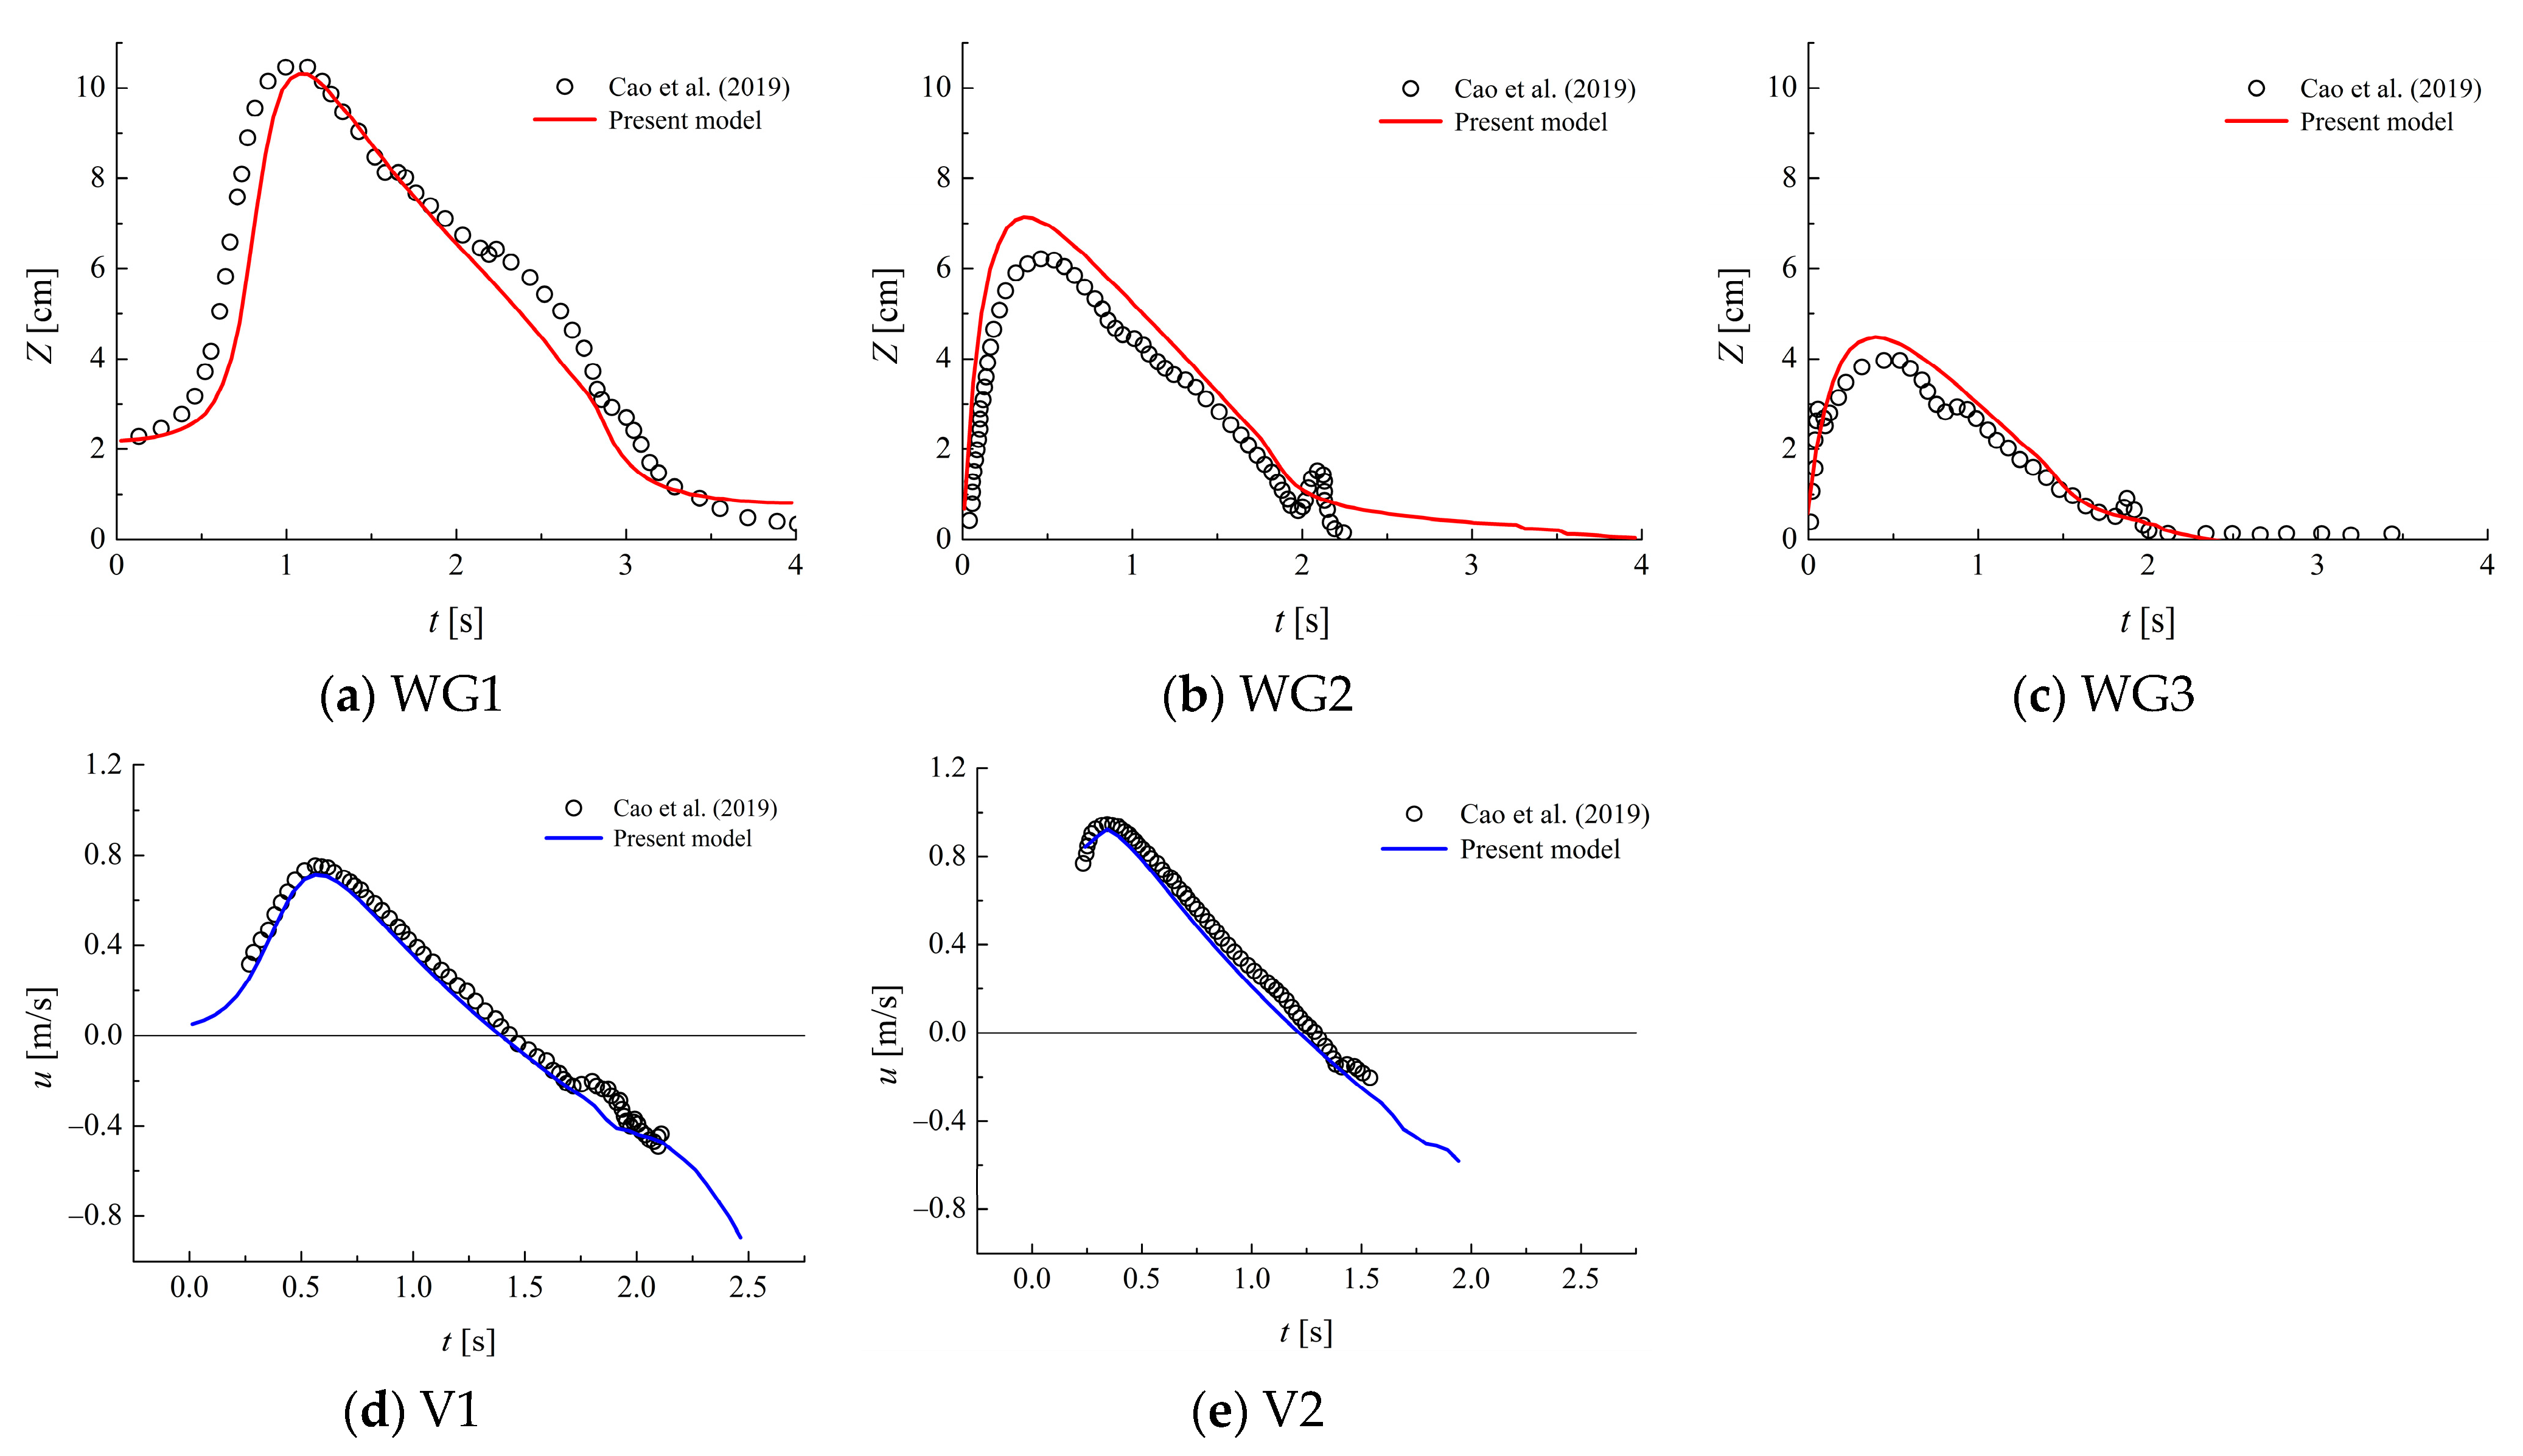
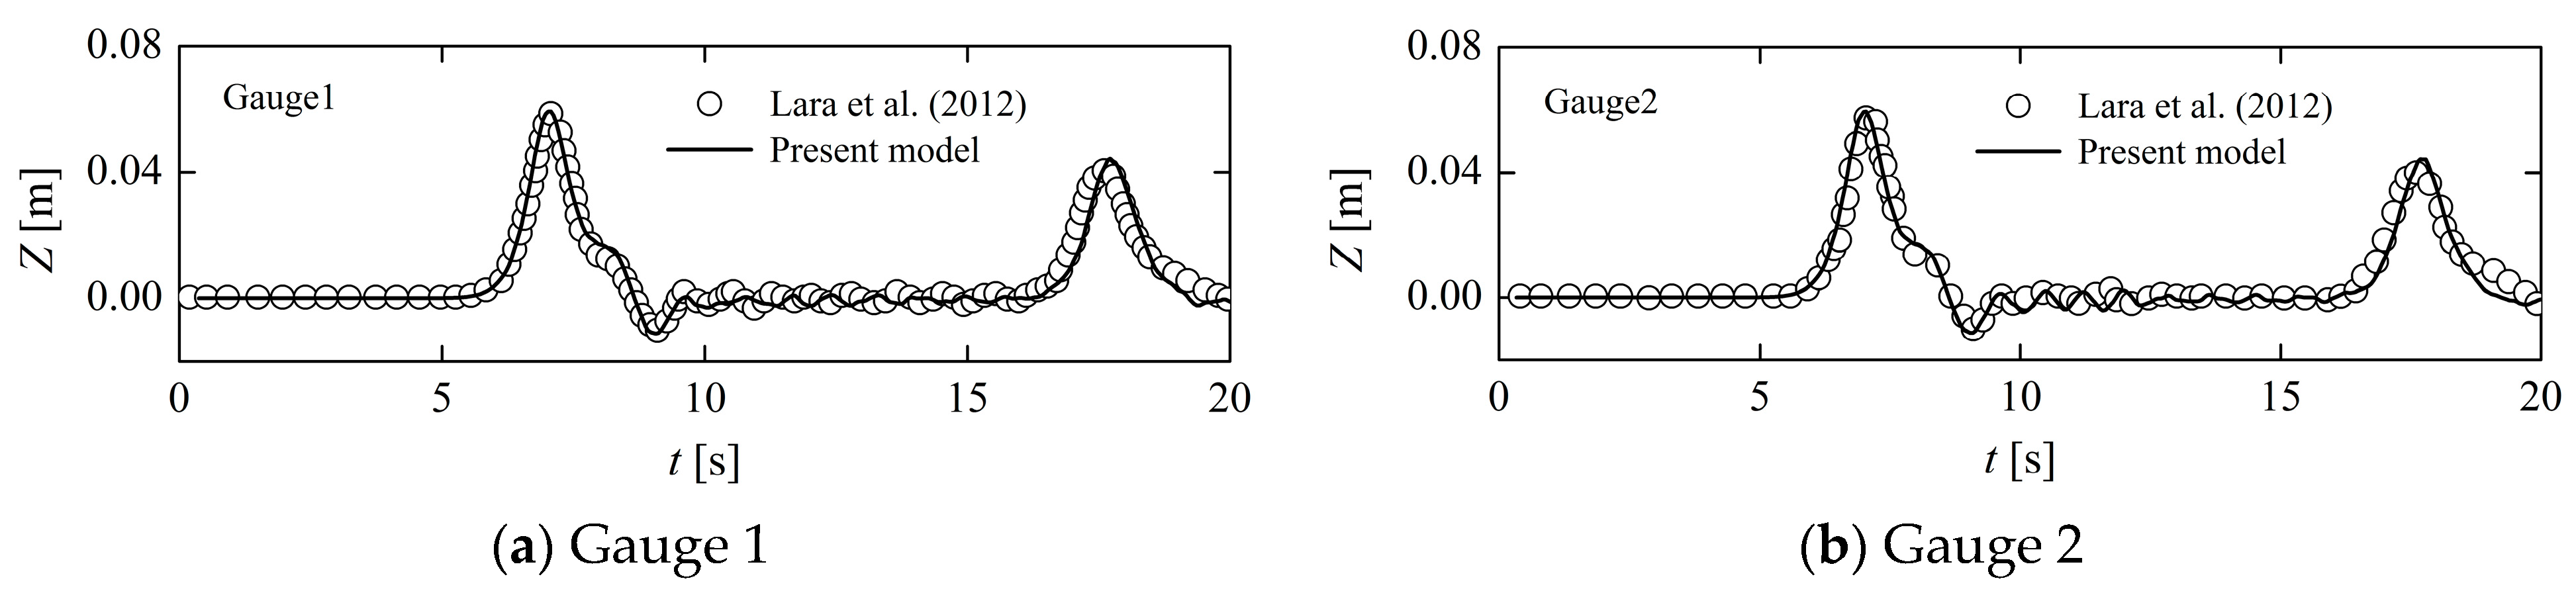
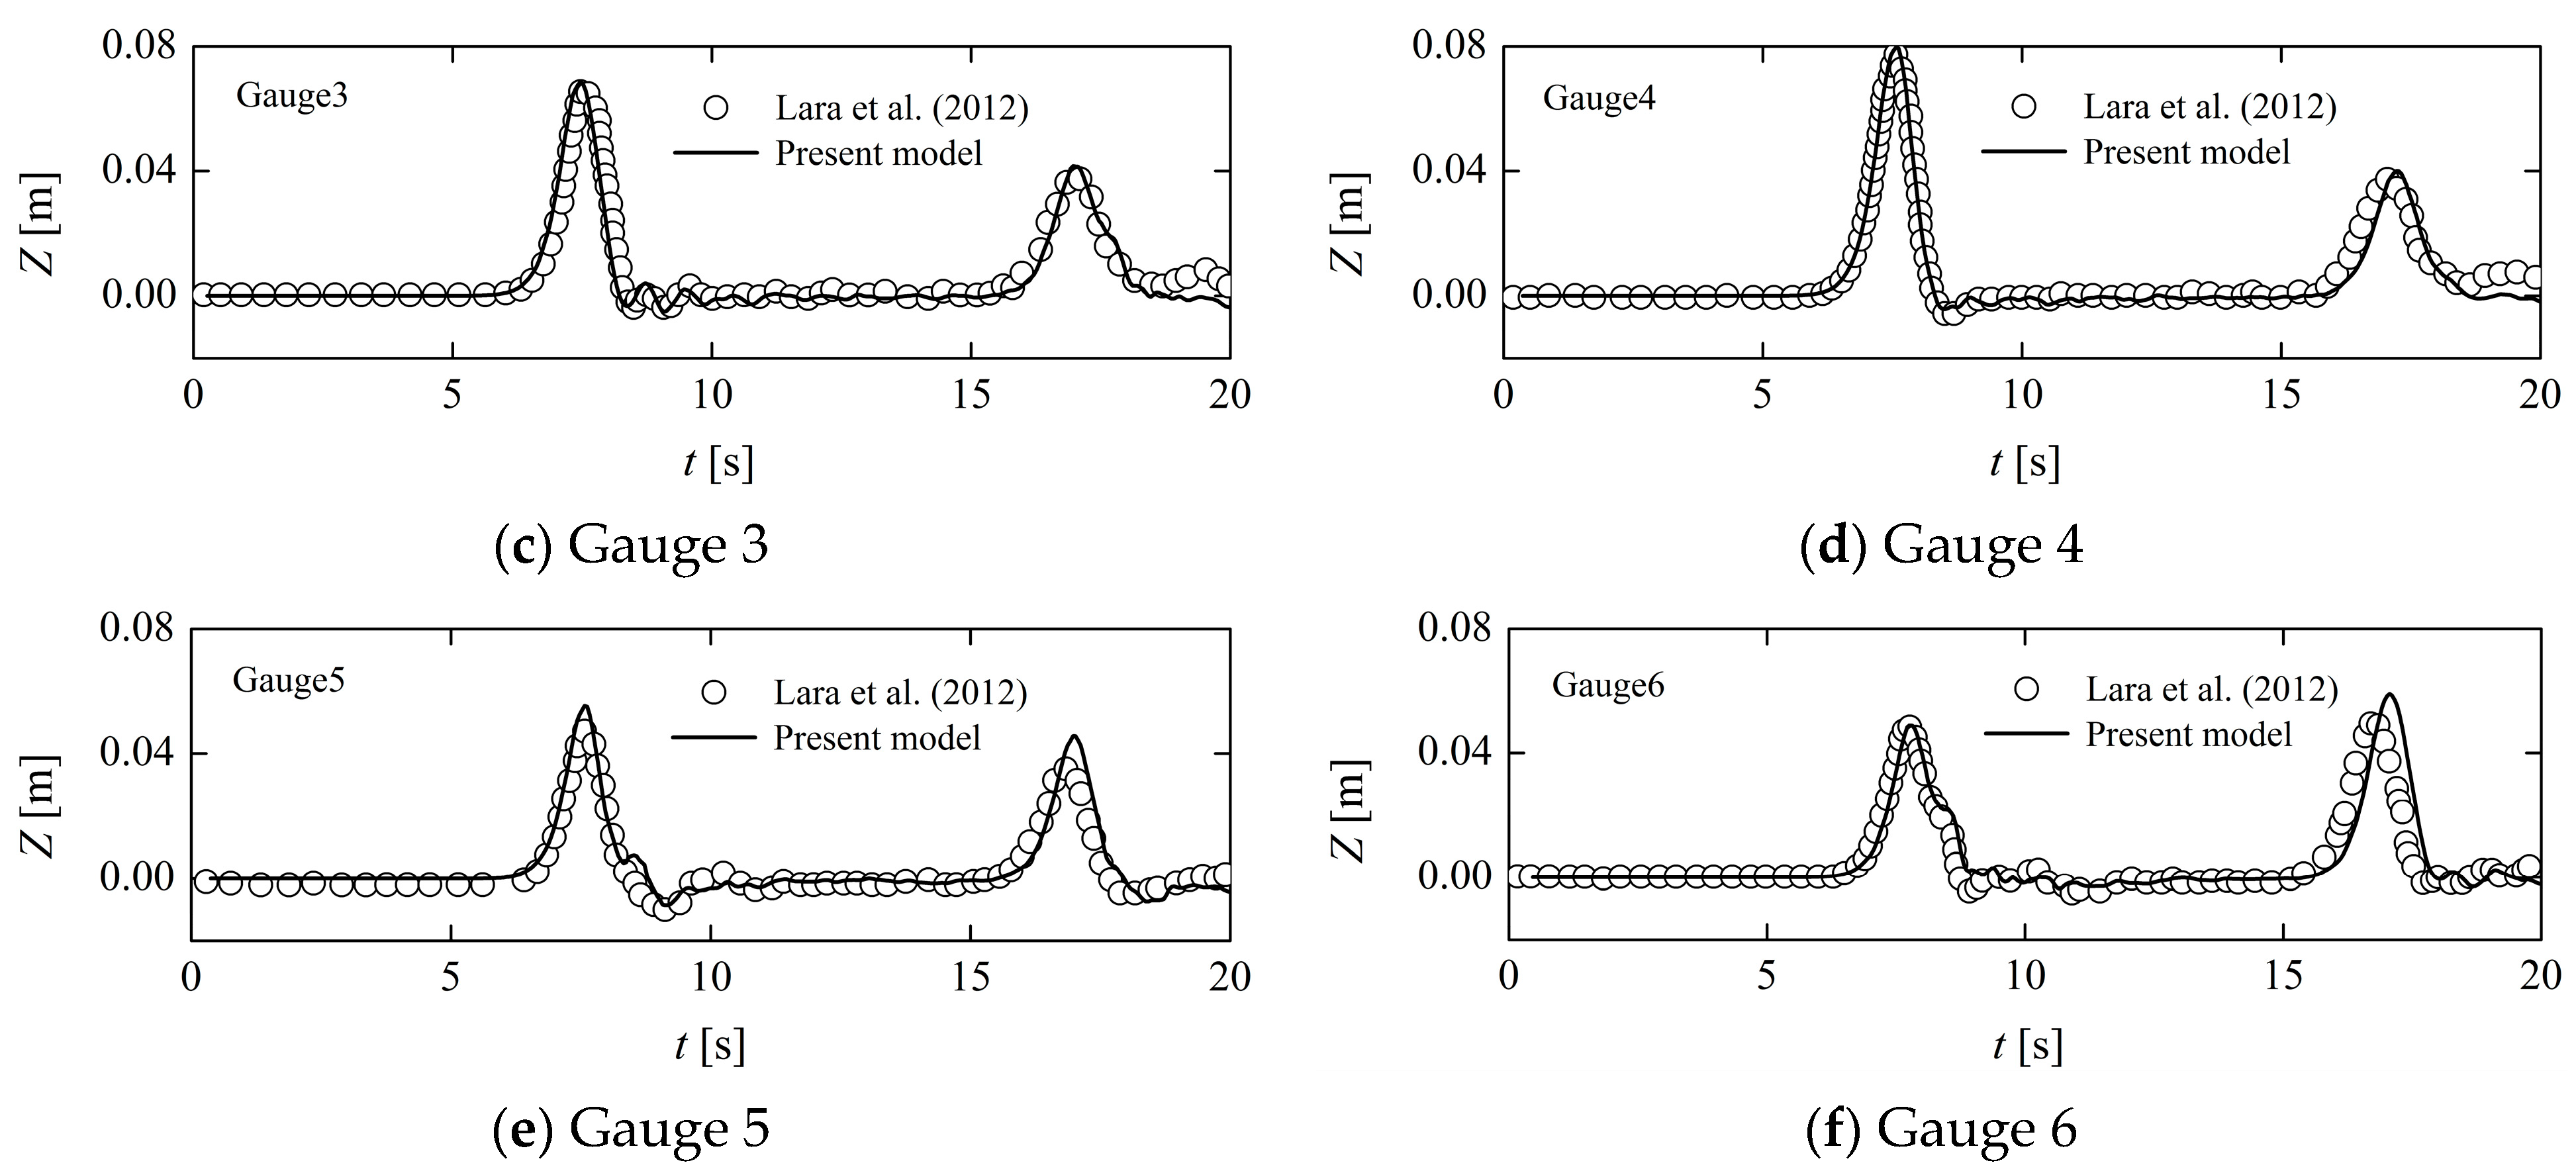
2.4.3. Comparison with Experimental Data on Free Surface Elevations and Velocities of a Solitary Wave Propagating over a Permeable Slope or around a Permeable Structure
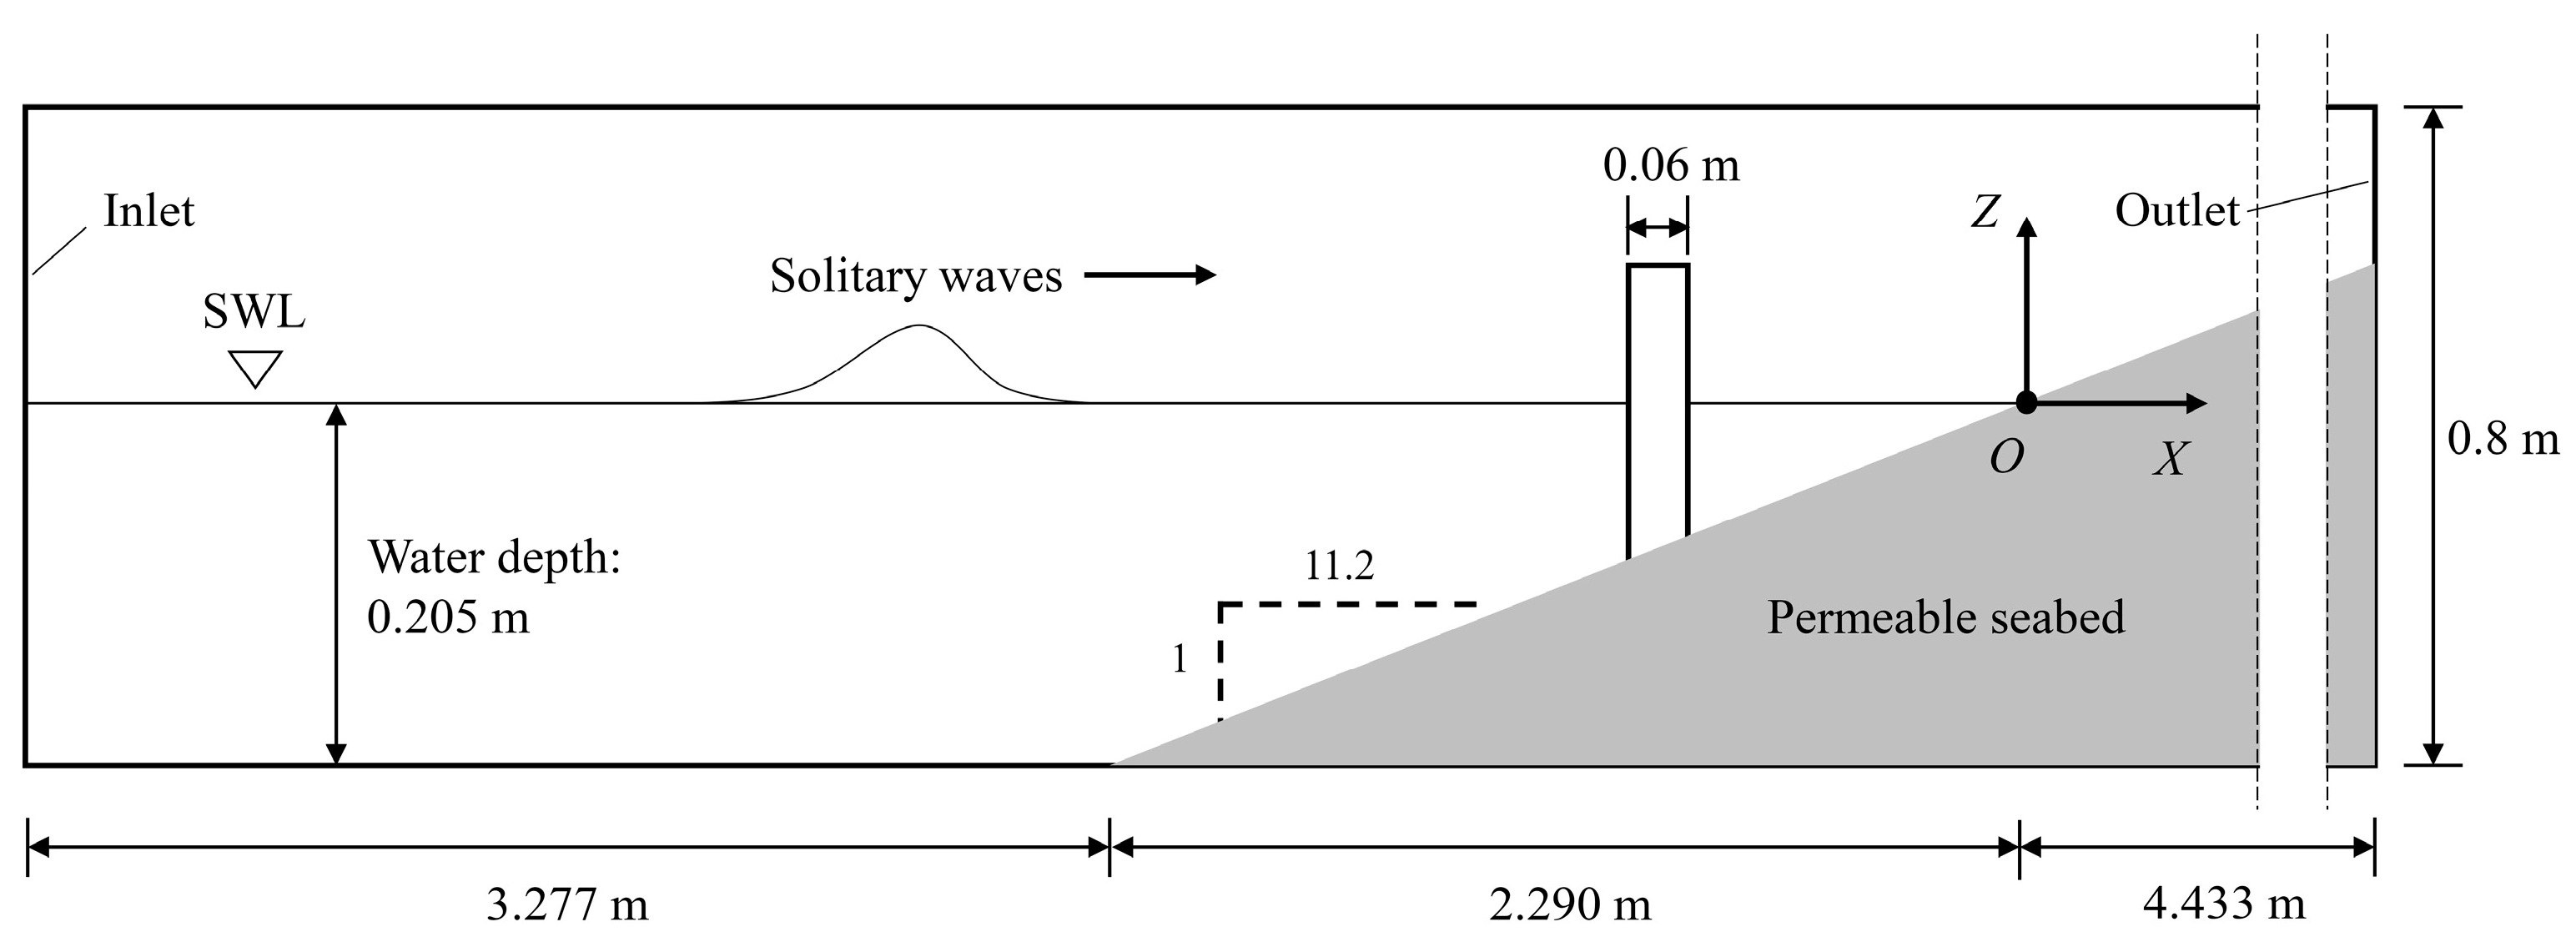
2.5. Model Setup
2.6. Mesh Dependency Analysis
3. Results and Discussion
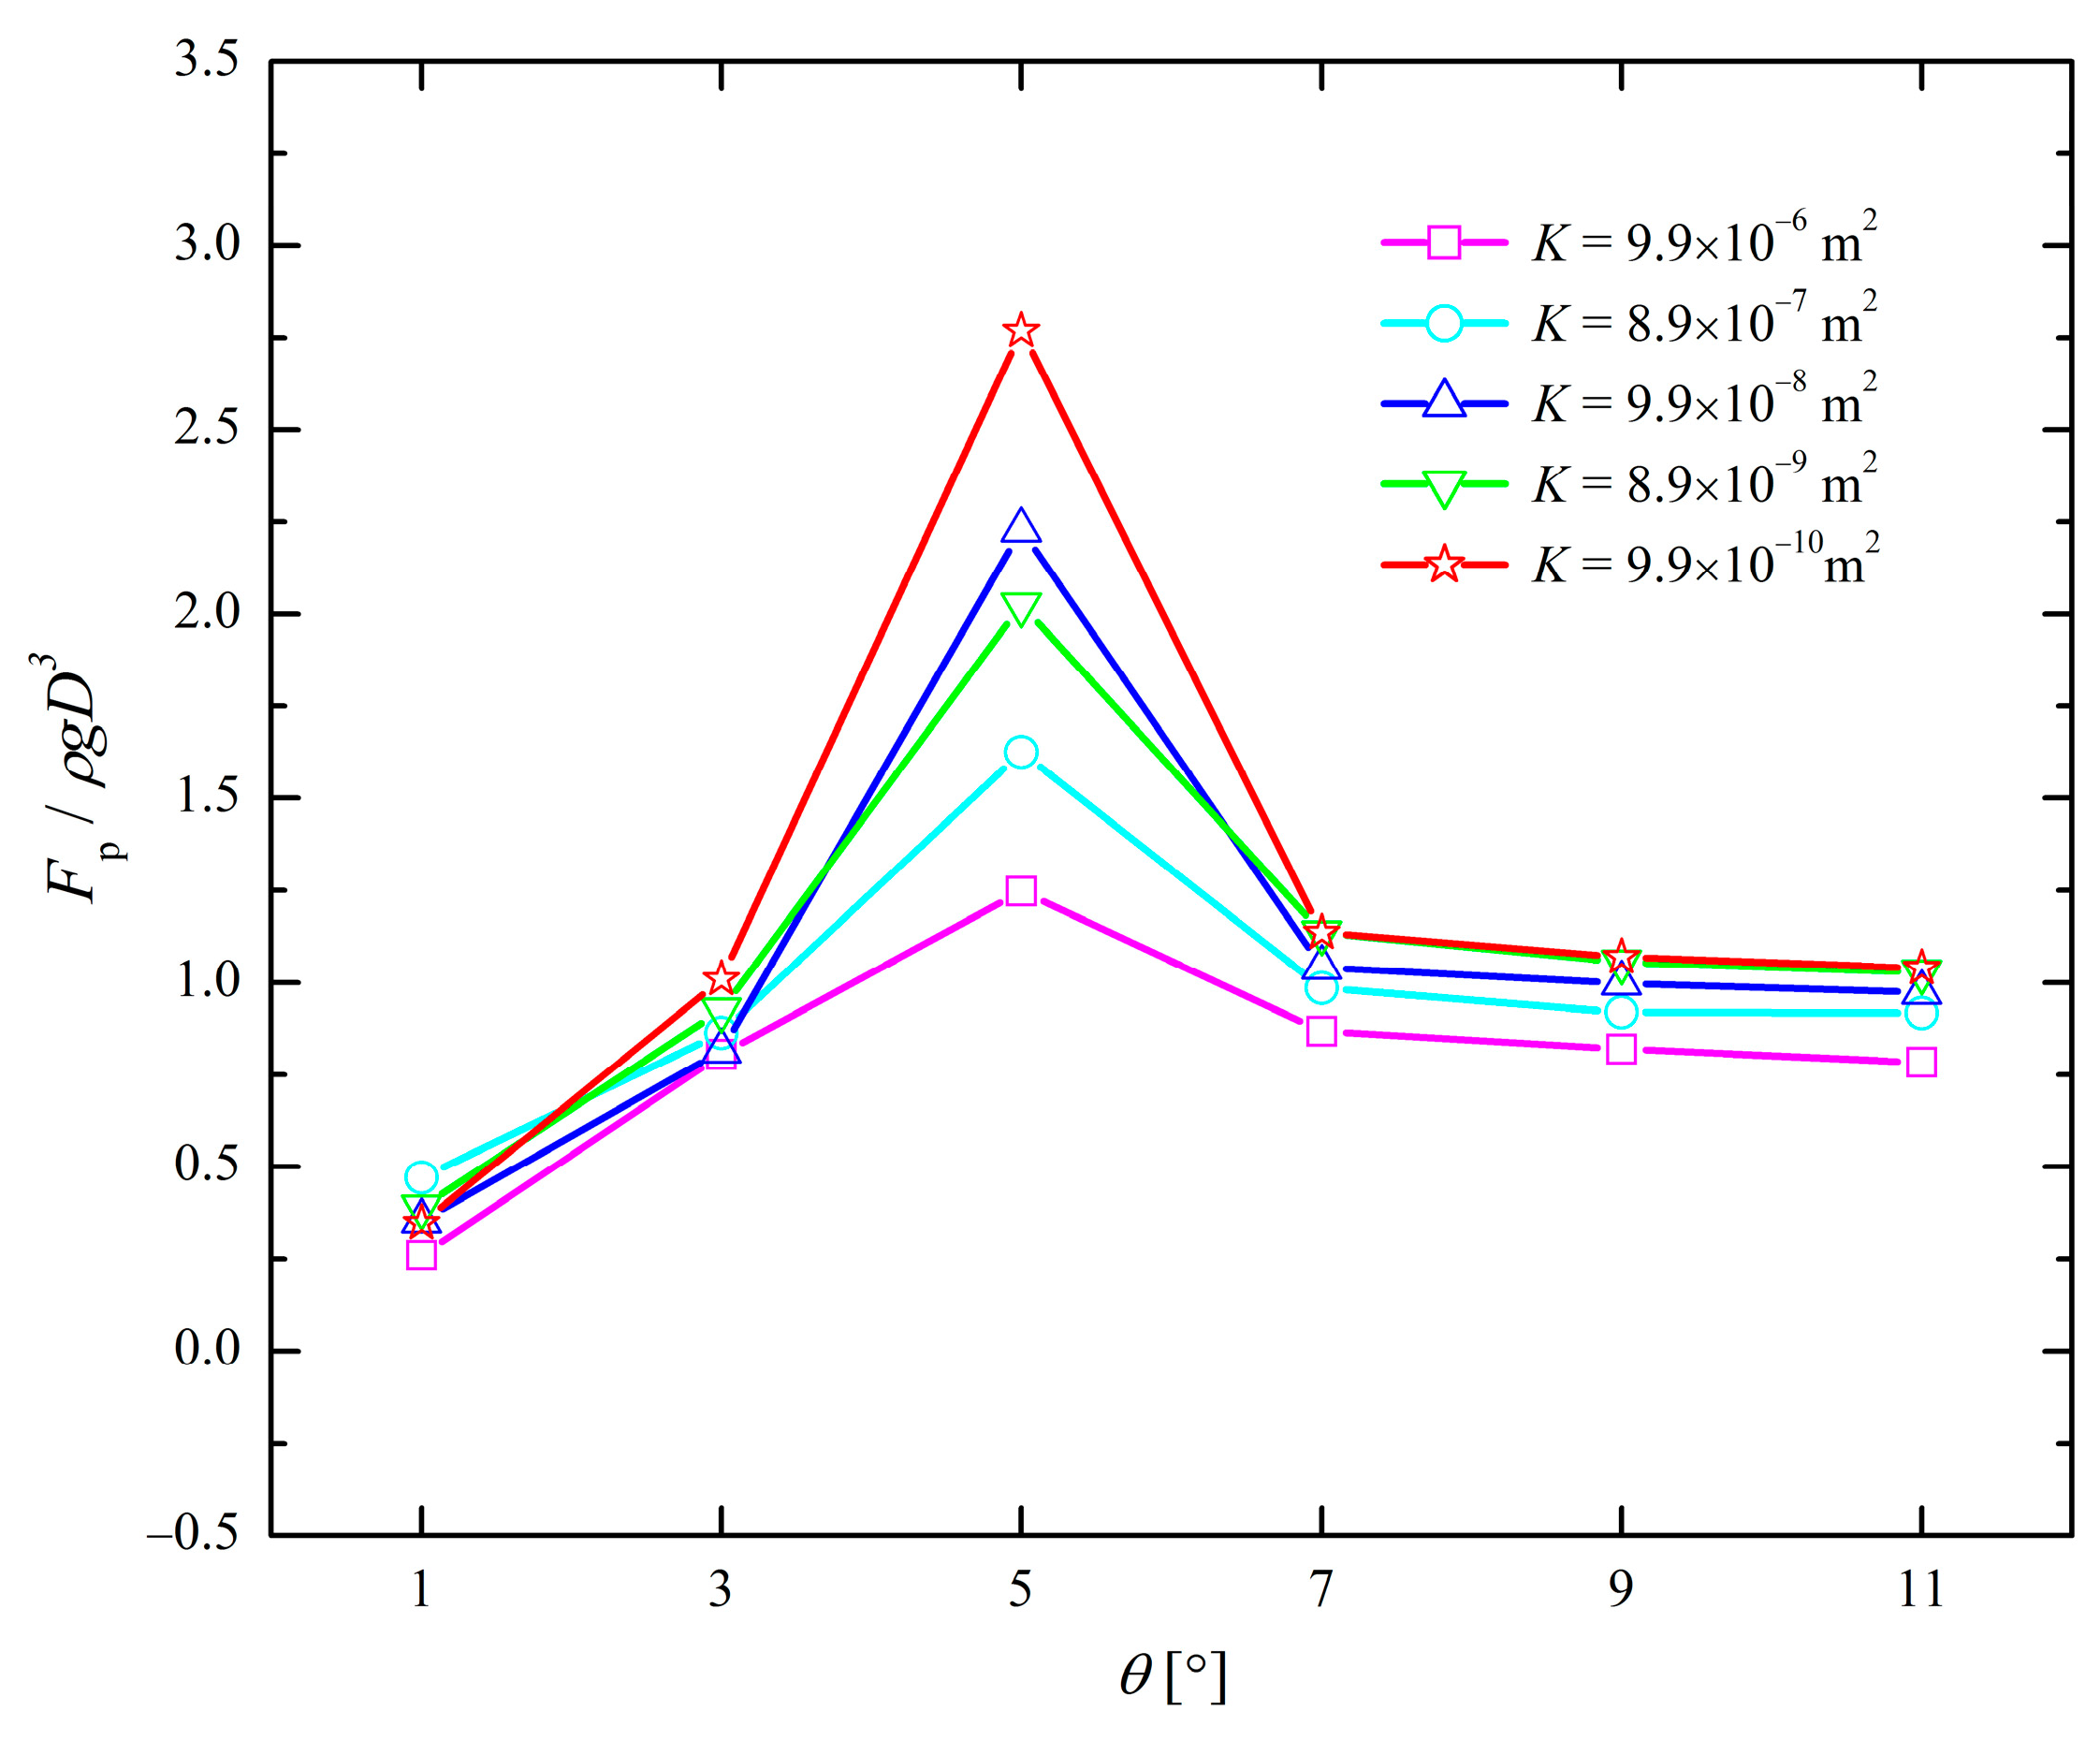
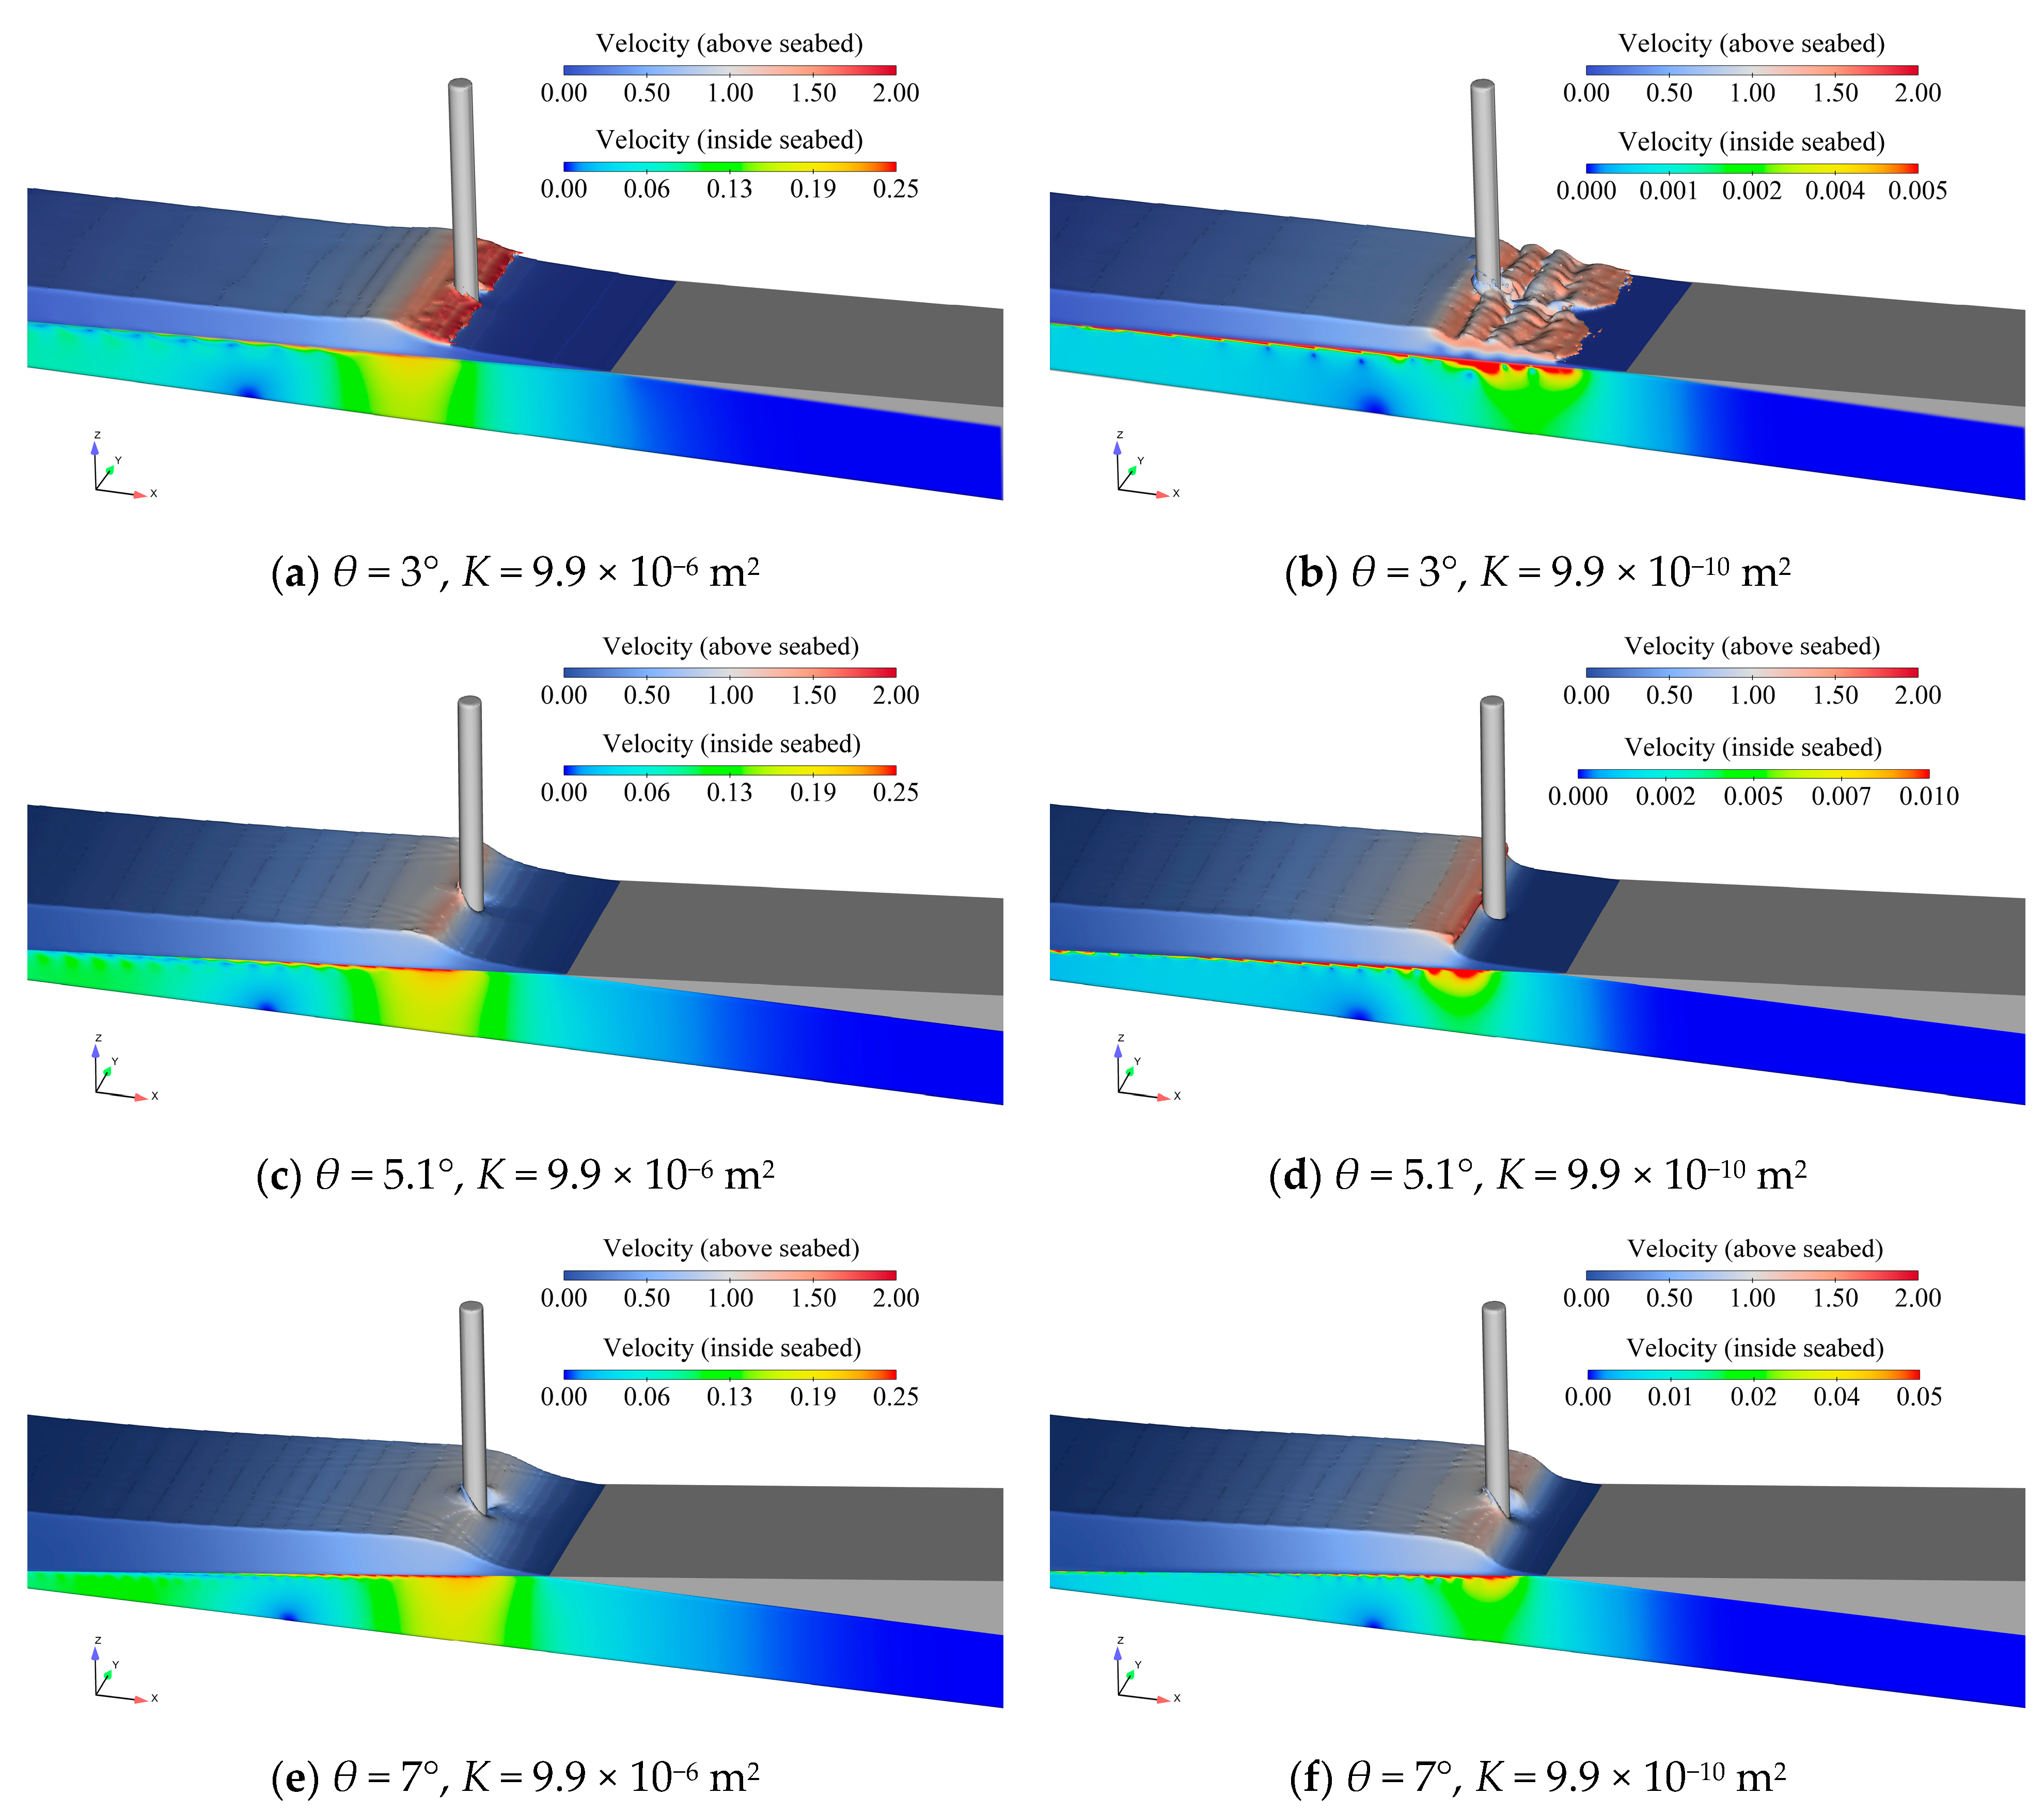
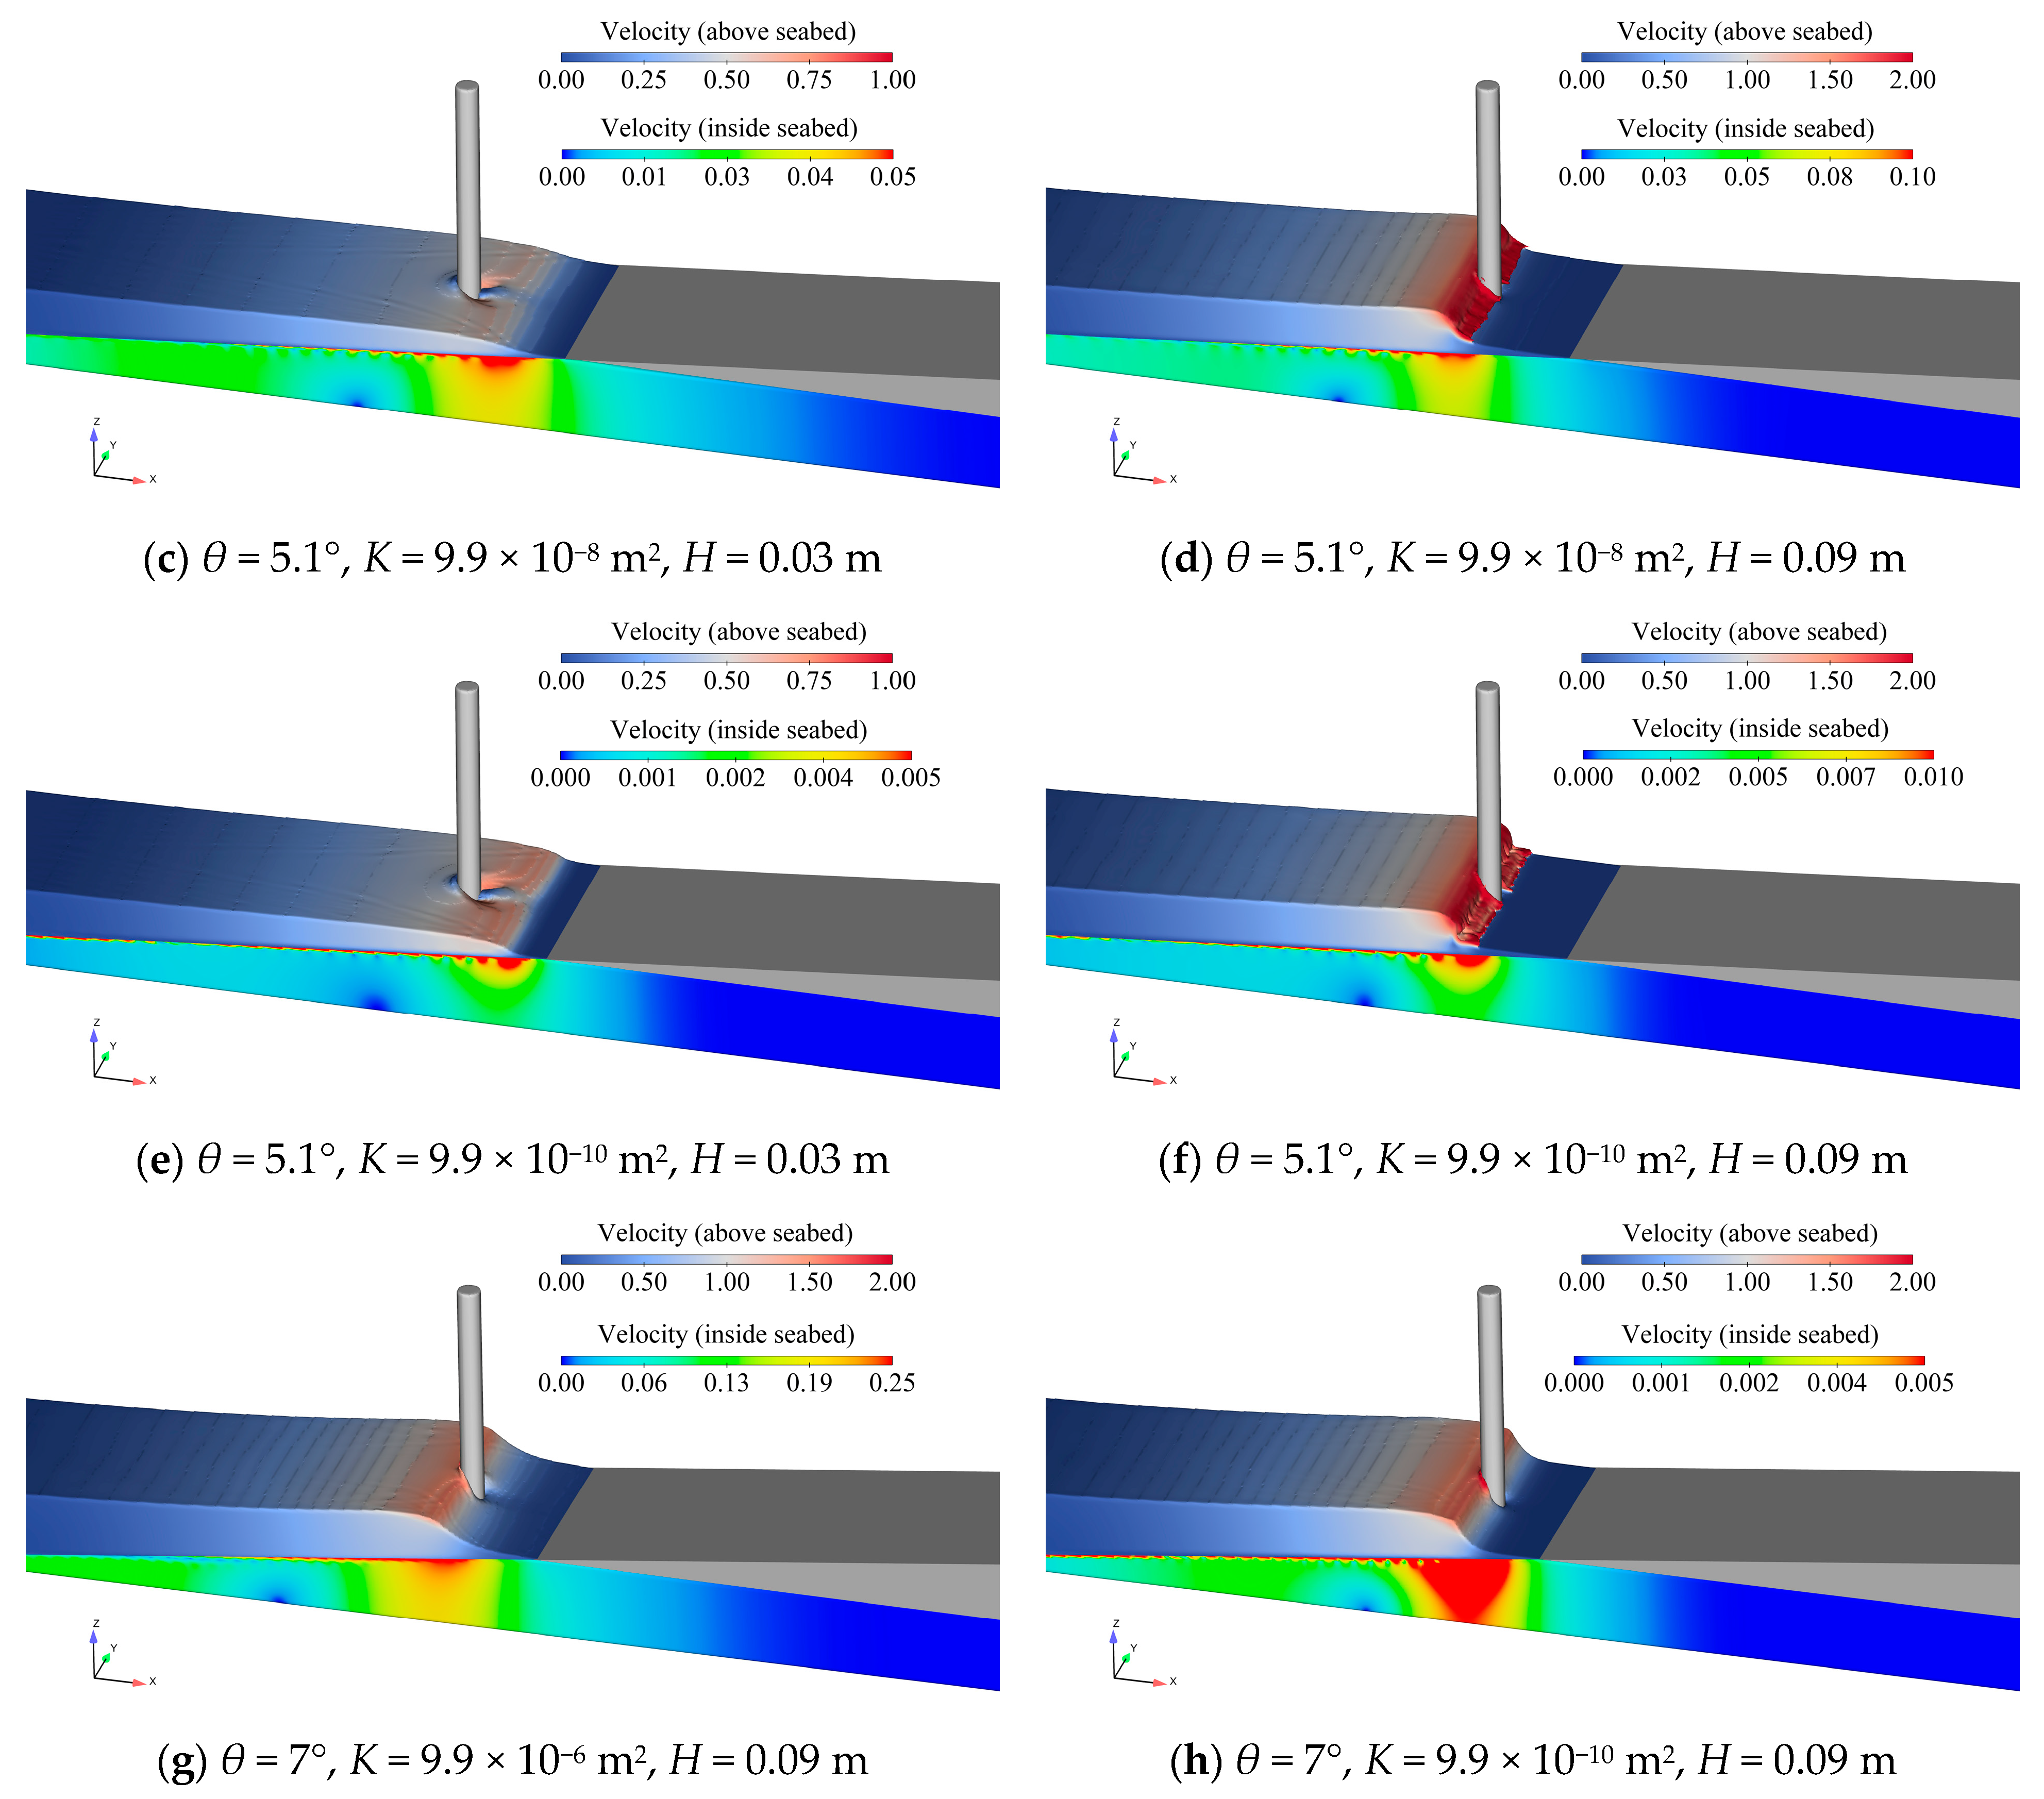
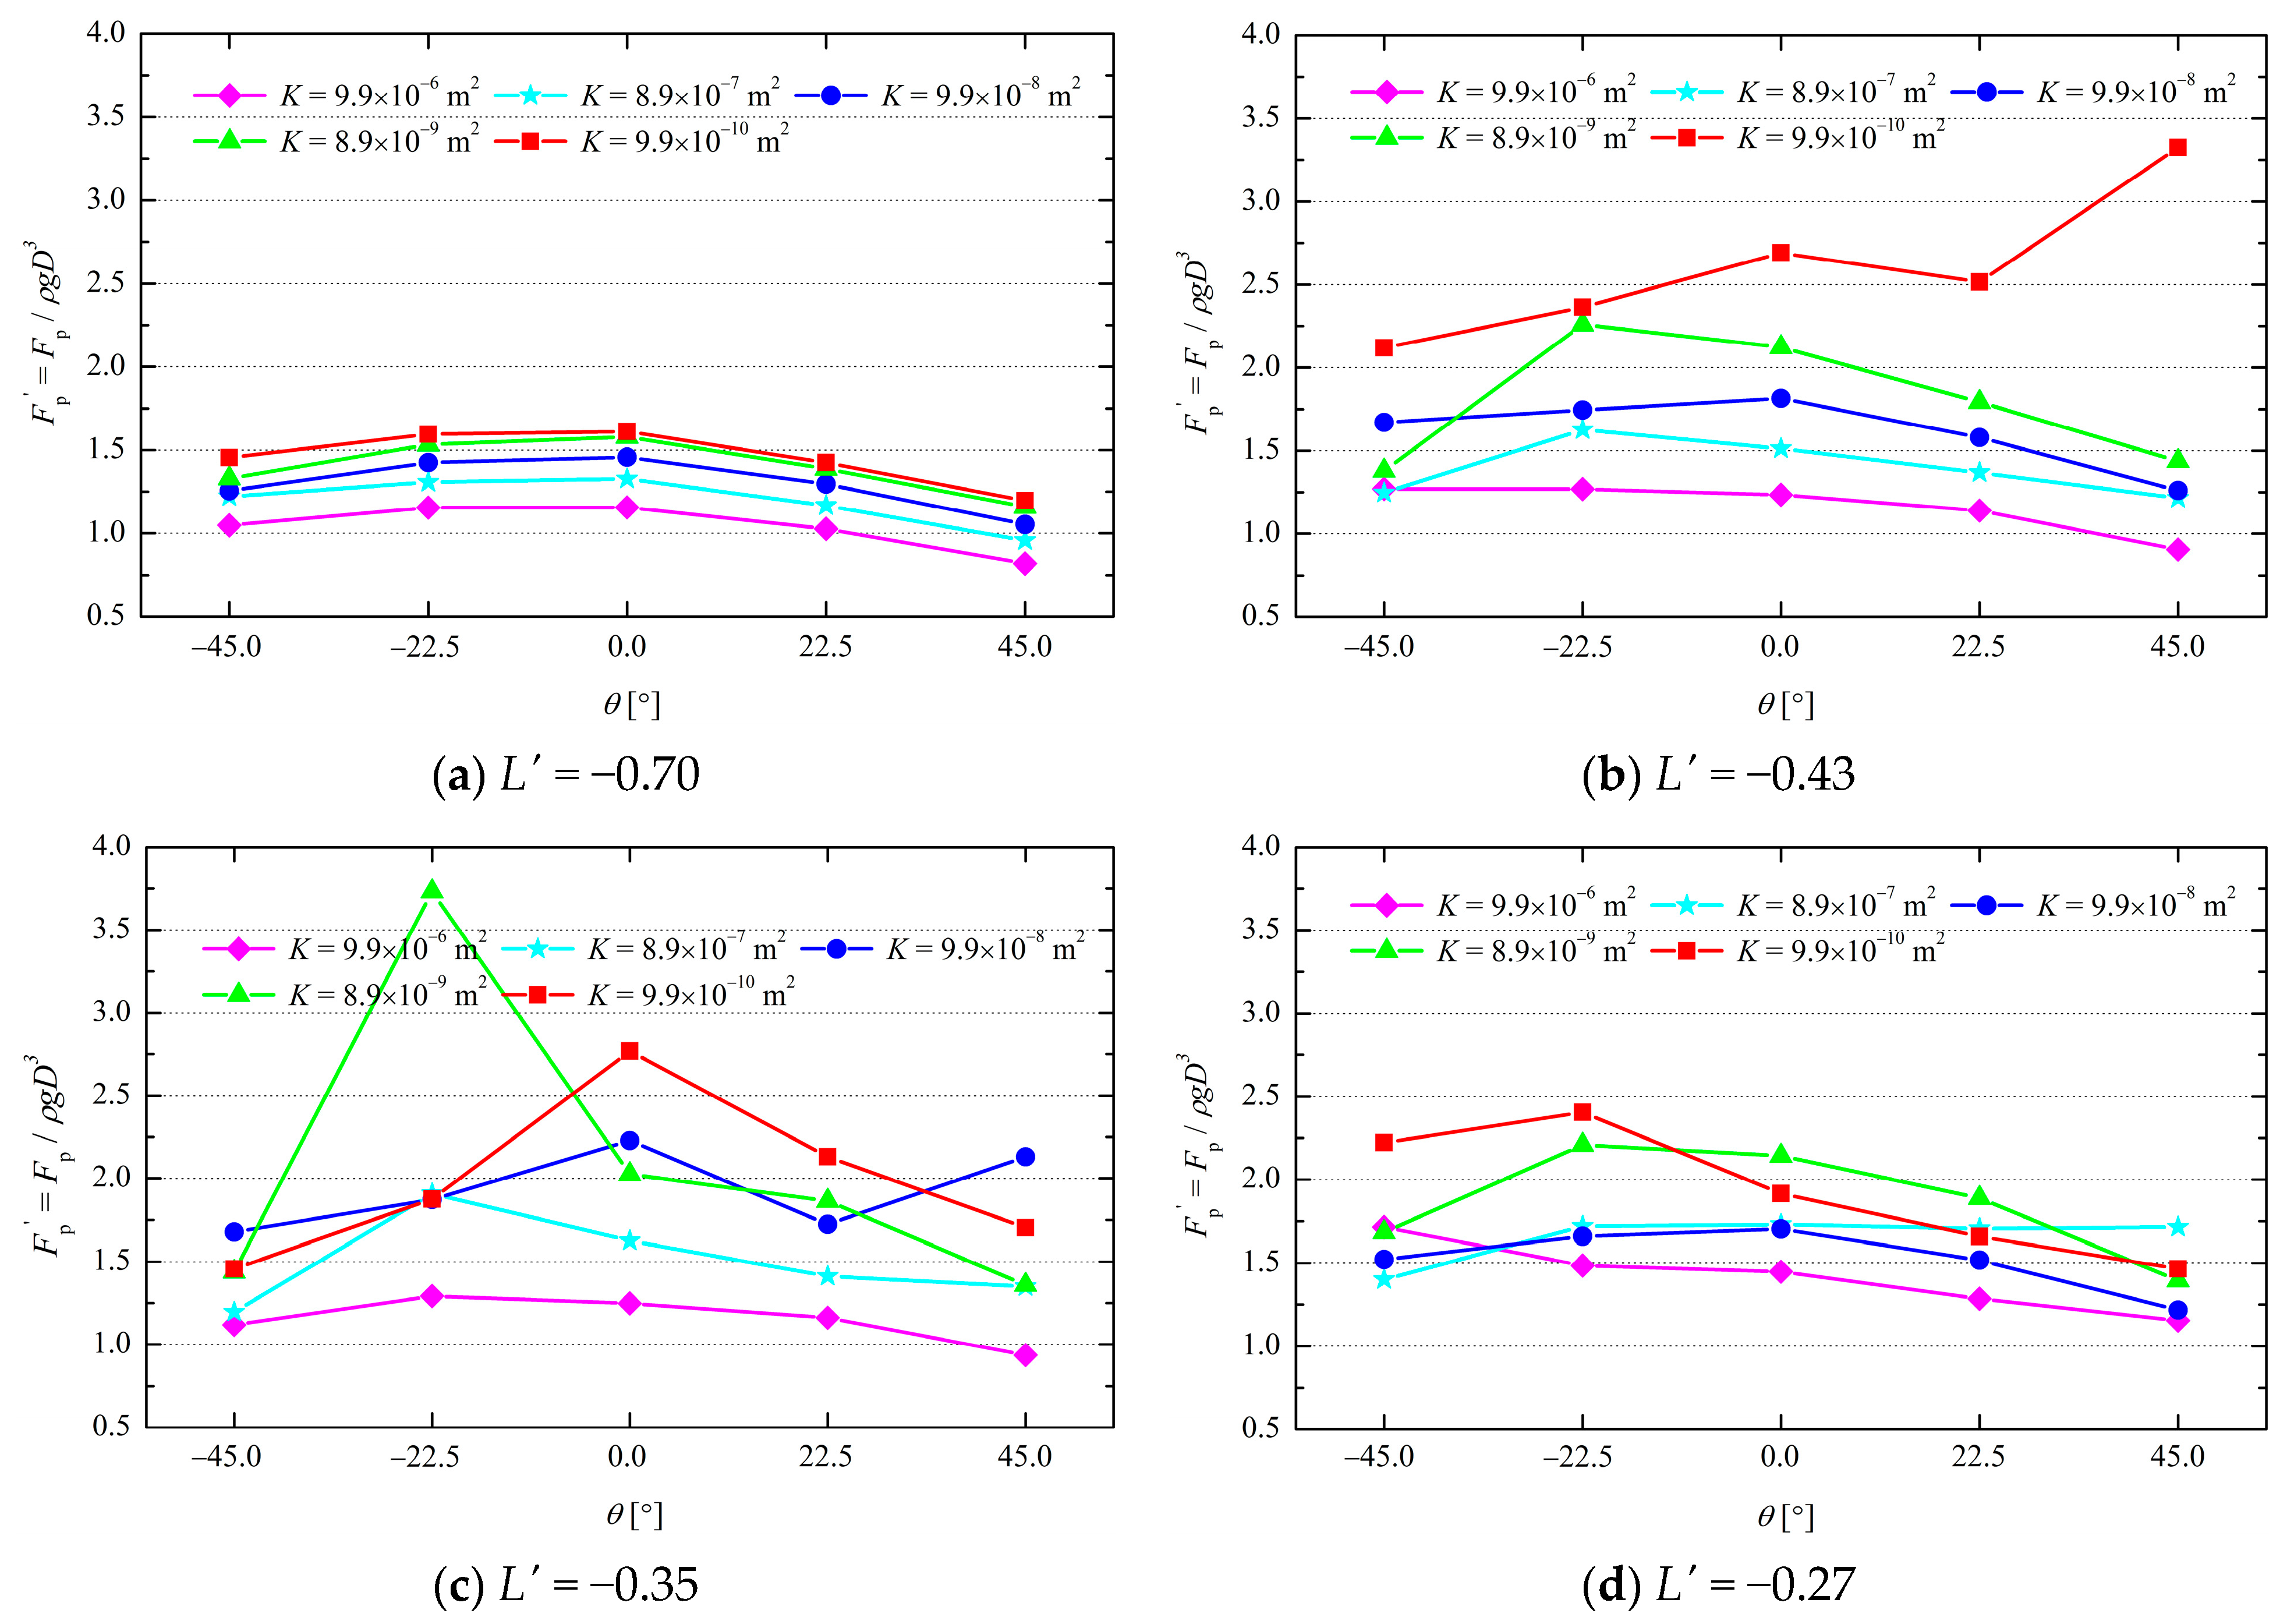
3.1. Slope Angles
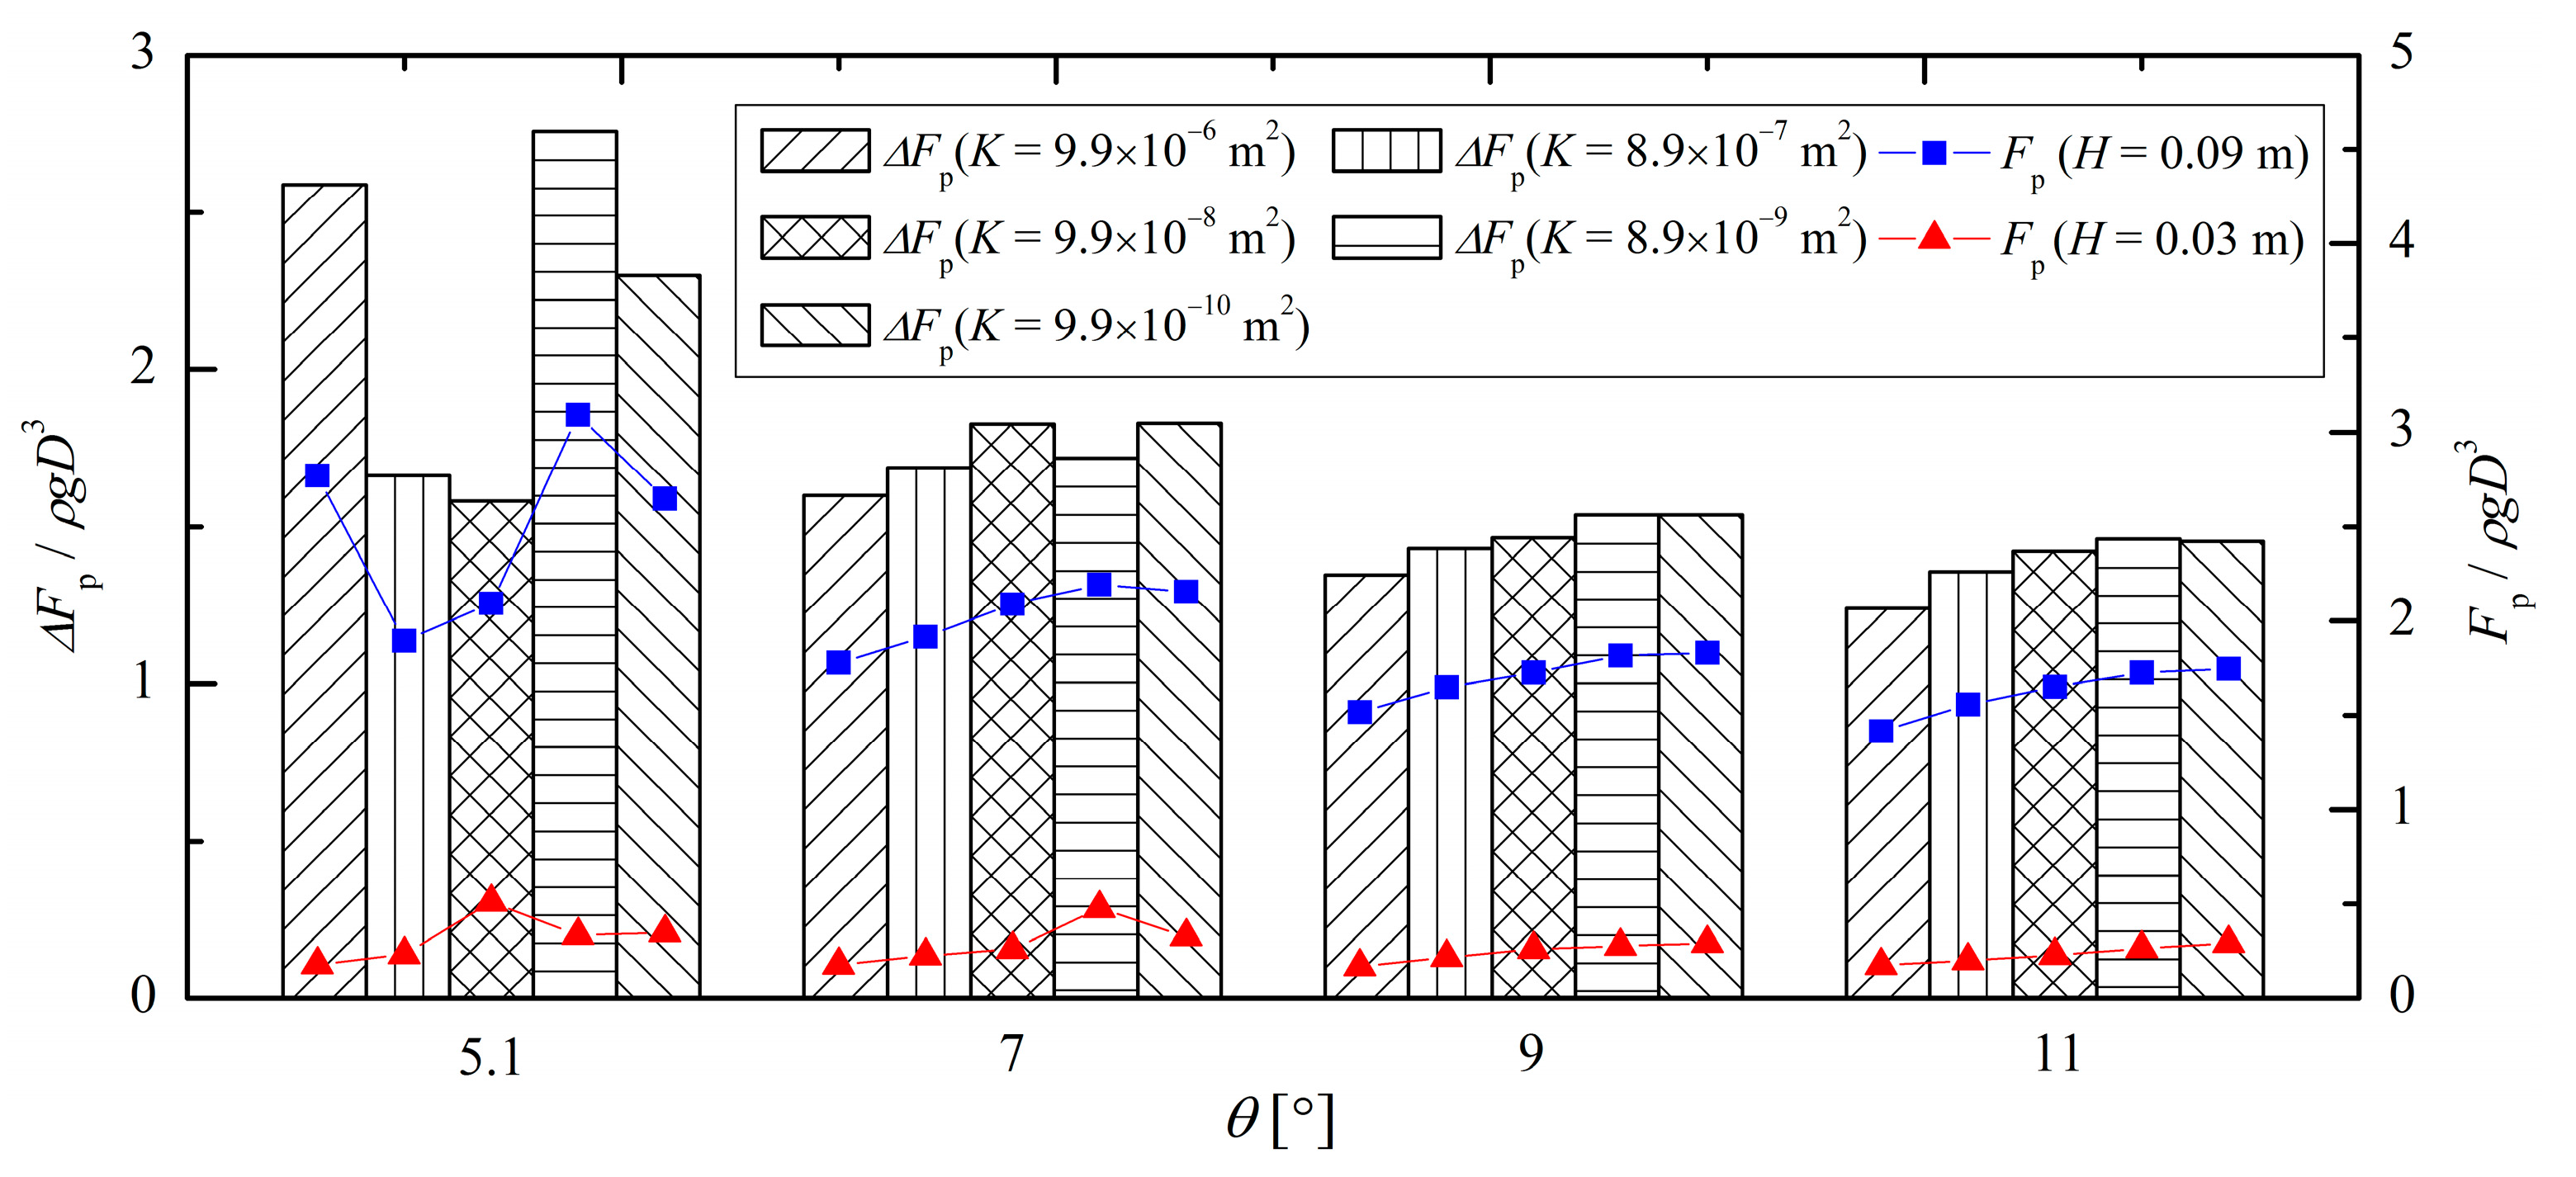
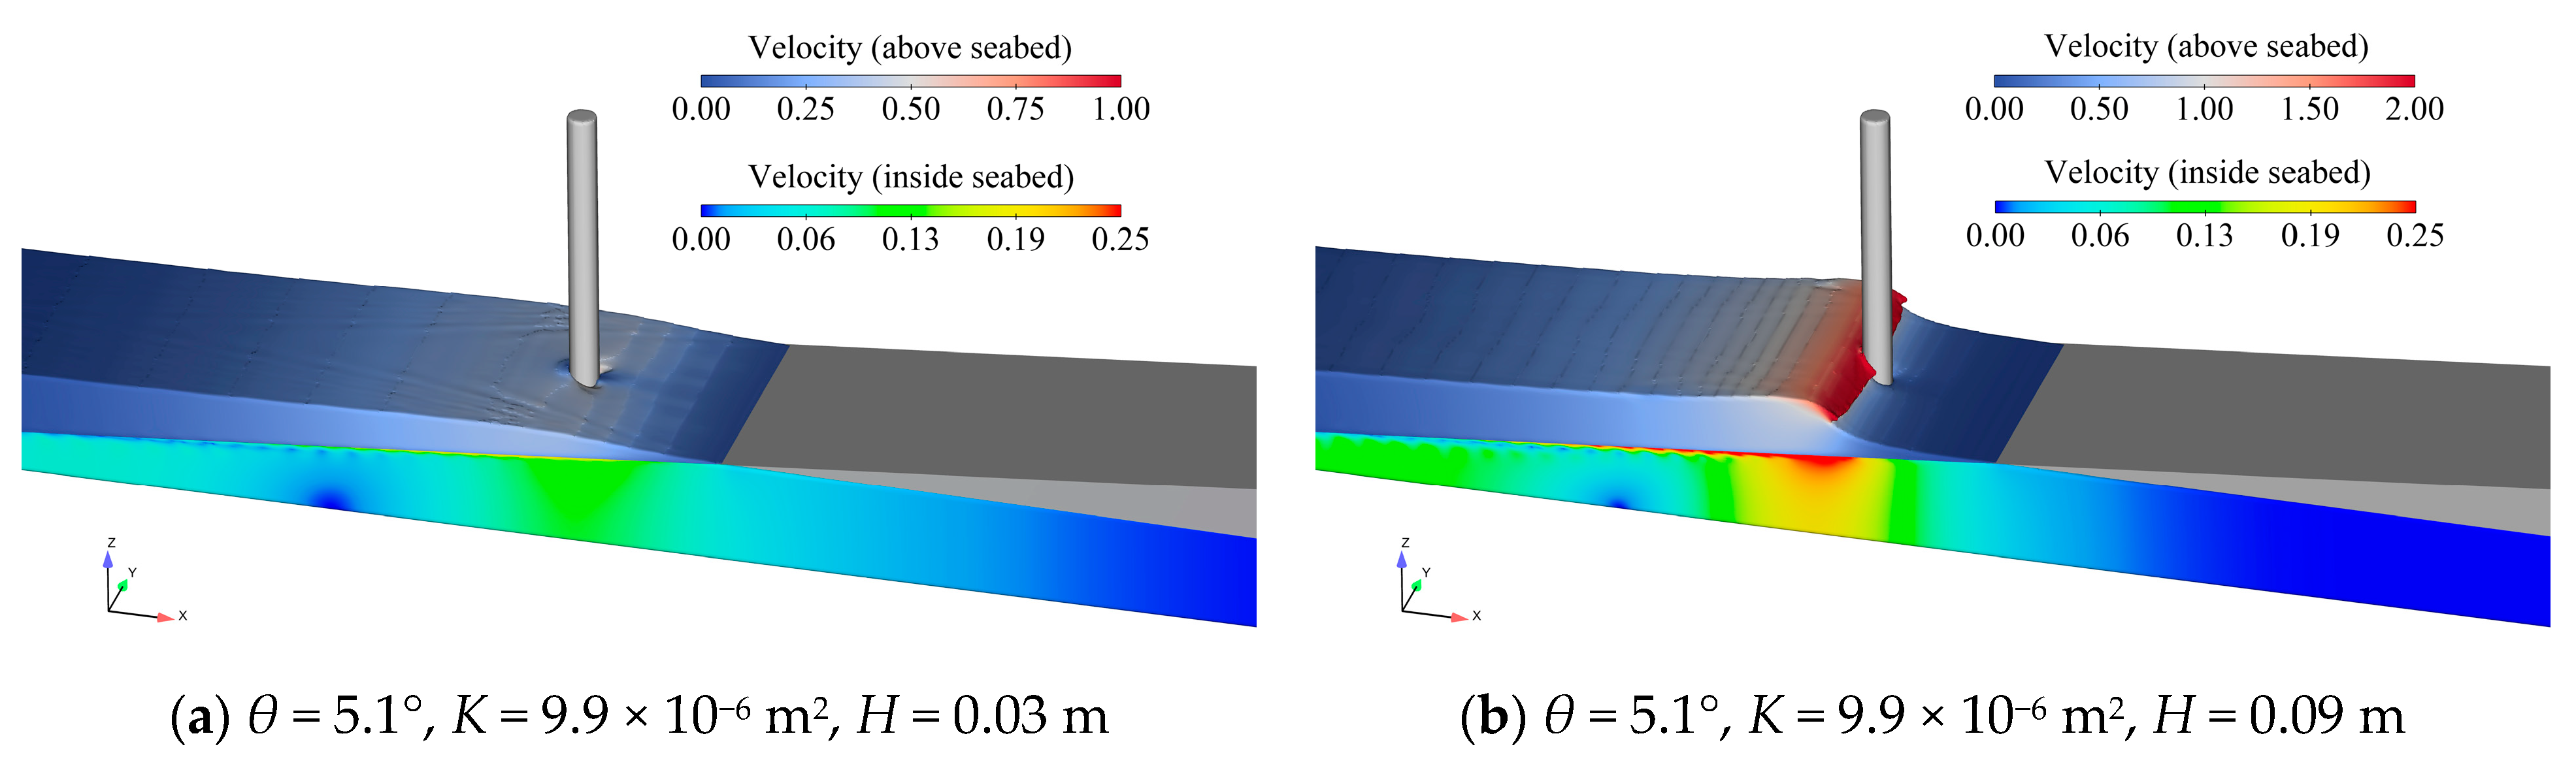
3.2. Wave Heights
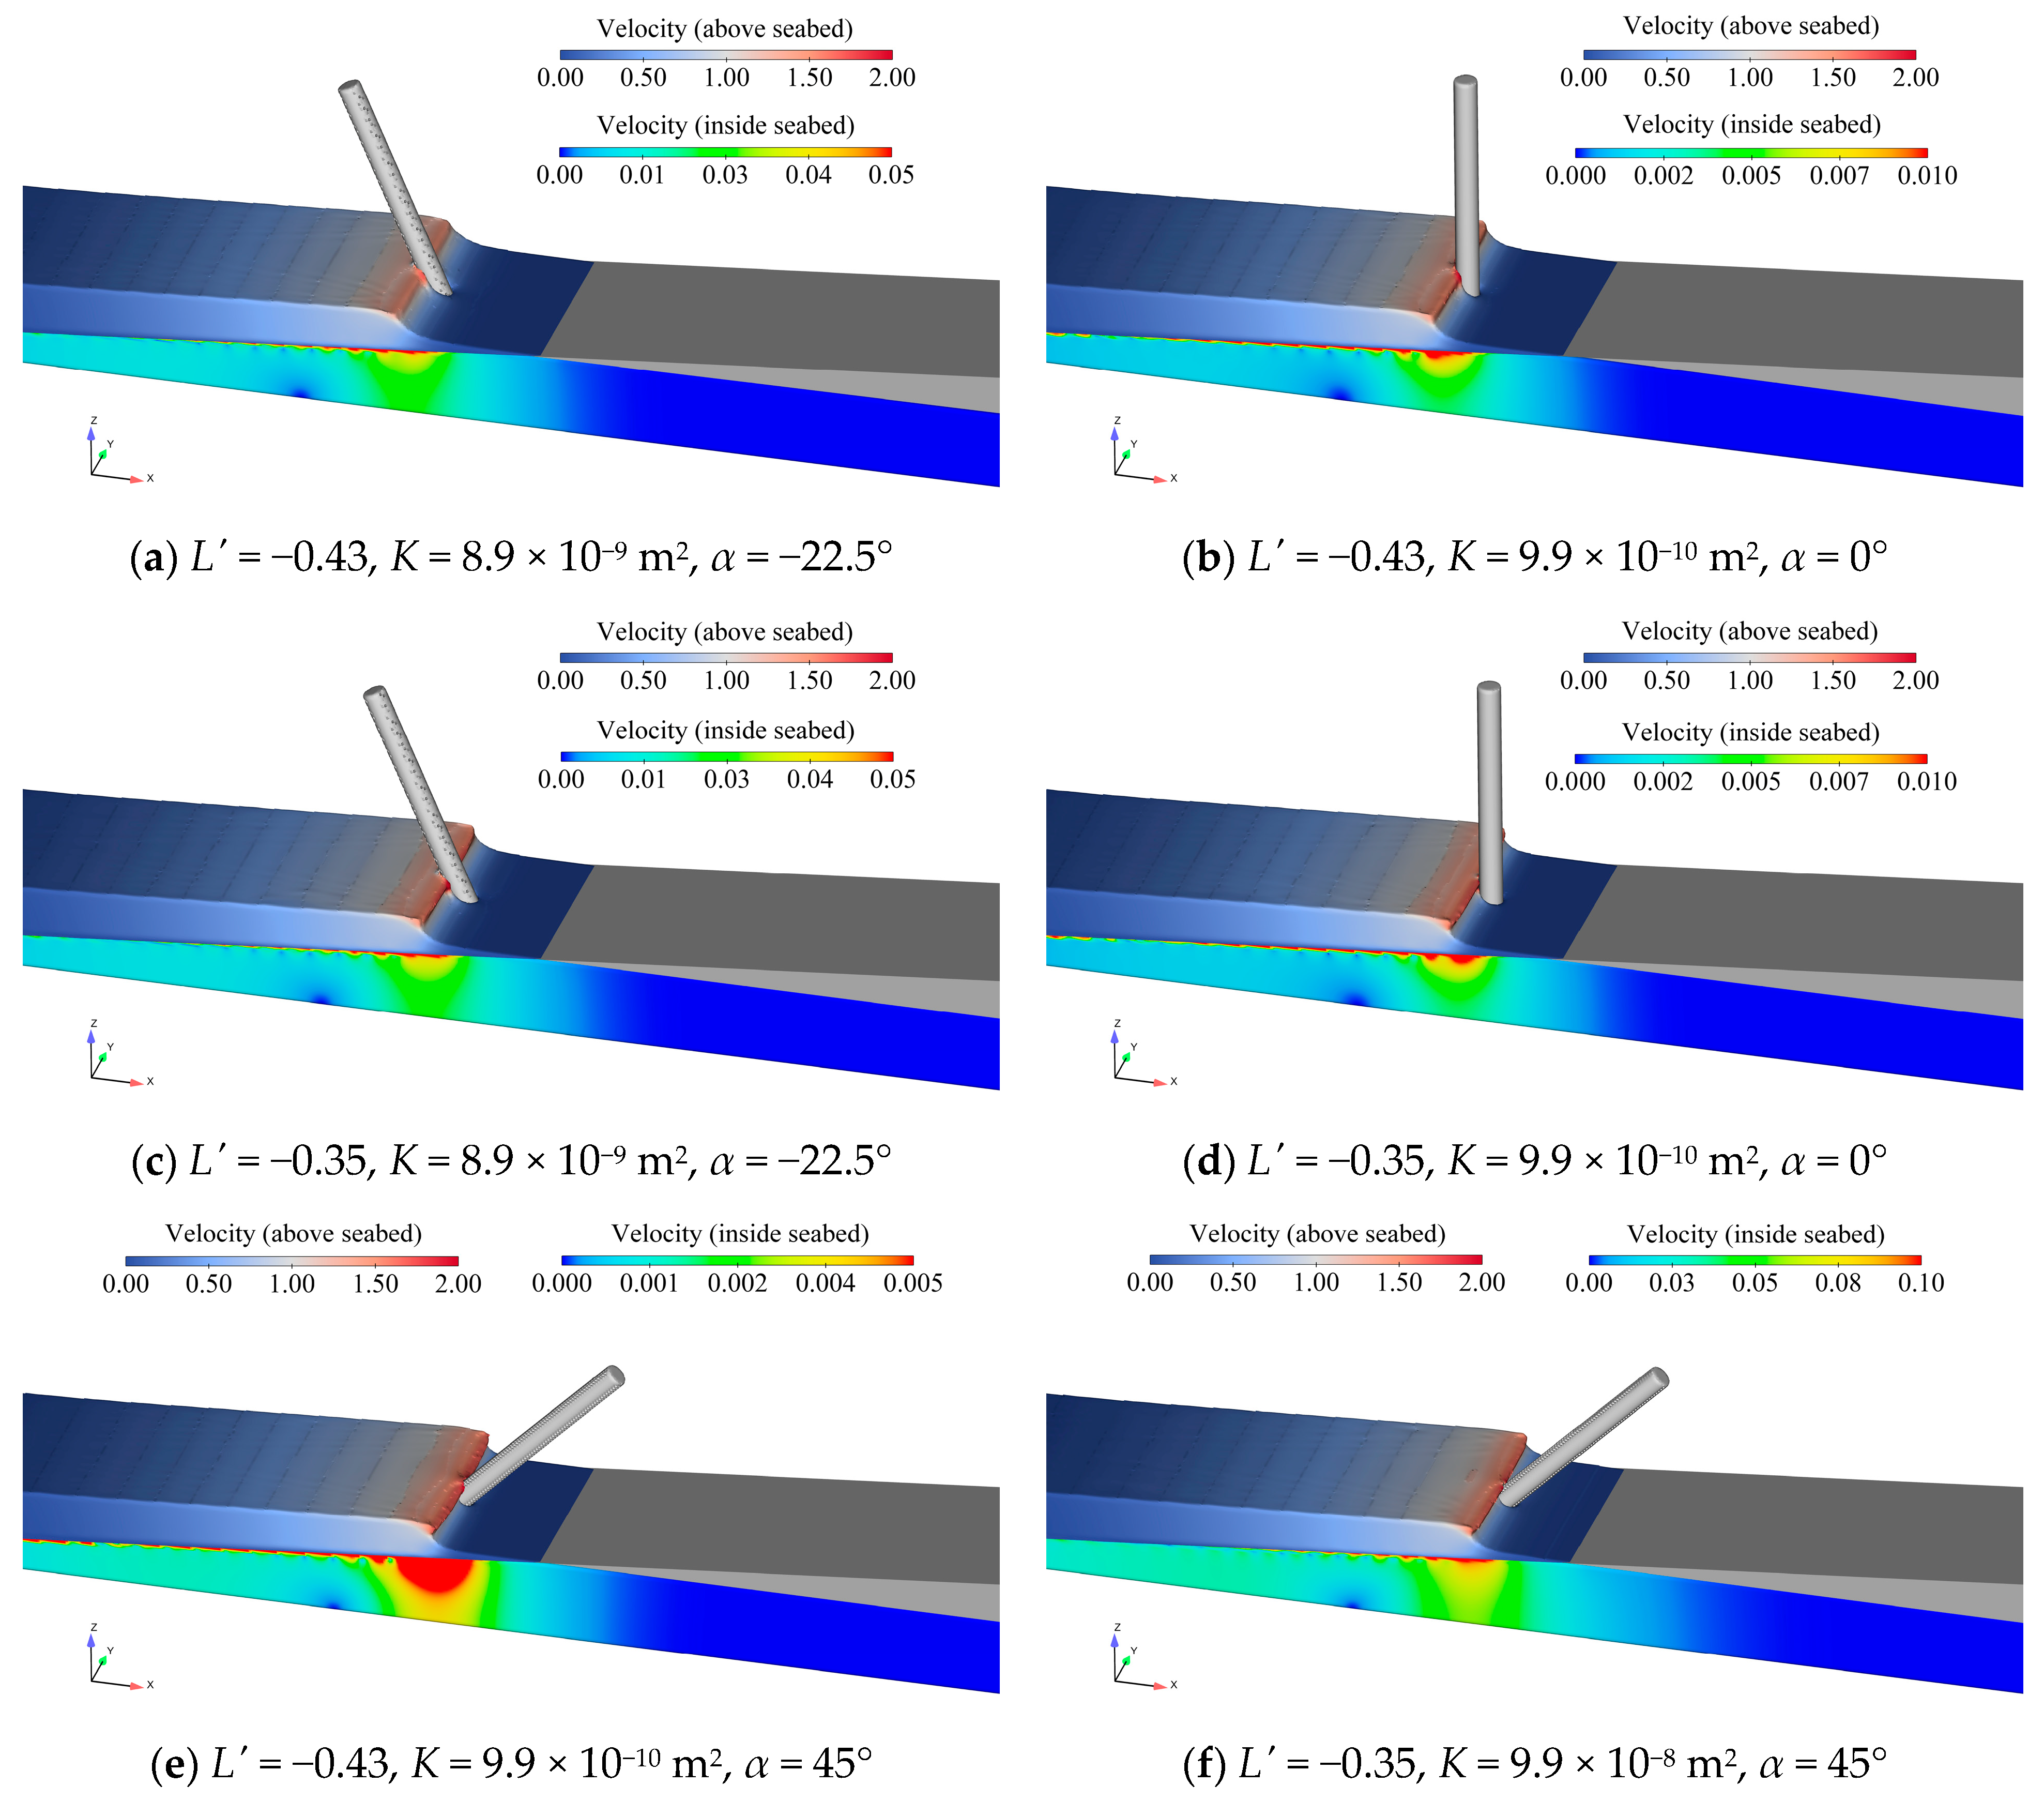
3.3. Pile Positions and Inclination Angles
4. Conclusions
- The slope angles play a dominant role in influencing breaking wave forces on a pile founded on a permeable seabed. The maximum breaking wave force appears when waves break just before the pile. Once waves have broken, the larger slope angles will have a reduced effect on the breaking wave force.
- Breaking wave forces increase with the incident wave height increasing. However, the magnitude of the increase generally decreases as the slope angles and the permeability increase.
- On the permeable seabed, extreme breaking wave forces can also occur when a “secondary wave wall” interacts with the pile after wave breaking.
- Breaking wave forces acting on a pile can be influenced by the inclination angle of the pile significantly, especially when the pile was installed around the wave breaking point. The maximum peak wave forces usually occur at α = −22.5° or α = 0°.
Author Contributions
Funding
Institutional Review Board Statement
Informed Consent Statement
Data Availability Statement
Acknowledgments
Conflicts of Interest
References
- Hallowell, S.; Myers, A.T.; Arwade, S.R. Variability of breaking wave characteristics and impact loads on offshore wind turbines supported by piles. Wind Energy 2016, 19, 301–312. [Google Scholar] [CrossRef]
- Wienke, J.; Sparboom, U.; Oumeraci, H. Breaking wave impact on a slender cylinder. In Coastal Engineering 2000; American Society of Civil Engineers: New York, NY, USA, 2001; Volume 2, pp. 1787–1798. [Google Scholar] [CrossRef]
- WindEurope. Wind Energy in Europe in 2018—trenDs and Statistics. 2019. Available online: https://windeurope.org/about-wind/statistics/european/wind-energy-in-europe-in-2018/# (accessed on 2 May 2021).
- Rui, S.; Wang, L.; Guo, Z.; Cheng, X.; Wu, B. Monotonic behavior of interface shear between carbonate sands and steel. Acta Geotech. 2021, 16, 167–187. [Google Scholar] [CrossRef]
- Rui, S.; Wang, L.; Guo, Z.; Zhou, W.; Li, Y. Cyclic behavior of interface shear between carbonate sands and steel. Acta Geotech. 2021, 16, 189–209. [Google Scholar] [CrossRef]
- Zhou, W.; Wang, L.; Guo, Z.; Liu, J.; Rui, S. A novel t-z model to predict the pile responses under axial cyclic loadings. Comput. Geotech. 2019, 112, 120–134. [Google Scholar] [CrossRef]
- Mo, W.; Jensen, A.; Liu, P.L.-F. Plunging Solitary Wave and Its Interaction with a Slender Cylinder on a Sloping Beach. Ocean Eng. 2013, 74, 48–60. [Google Scholar] [CrossRef]
- Xiao, H.; Huang, W. Three-Dimensional Numerical Modeling of Solitary Wave Breaking and Force on a Cylinder Pile in a Coastal Surf Zone. J. Eng. Mech. 2015, 141, A4014001. [Google Scholar] [CrossRef]
- Choi, S.J.; Lee, K.H.; Gudmestad, O.T. The effect of dynamic amplification due to a structure’s vibration on breaking wave impact. Ocean Eng. 2015, 96, 8–20. [Google Scholar] [CrossRef]
- Kamath, A.; Chella, M.A.; Bihs, H.; Arntsen, Ø.A. Breaking Wave Interaction with a Vertical Cylinder and the Effect of Breaker Location. Ocean Eng. 2016, 128, 105–115. [Google Scholar] [CrossRef]
- Chella, M.A.; Bihs, H.; Myrhaug, D.; Muskulus, M. Breaking solitary waves and breaking wave forces on a vertically mounted slender cylinder over an impermeable sloping seabed. J. Ocean Eng. Mar. Energy 2017, 3, 1–19. [Google Scholar] [CrossRef]
- Chella, M.A.; Bihs, H.; Myrhaug, D. Wave impact pressure and kinematics due to breaking wave impingement on a pile. J. Fluids Struct. 2019, 86, 94–123. [Google Scholar] [CrossRef]
- Johlas, H.M.; Hallowell, S.; Xie, S.; Lomonaco, P.; Lackner, M.A.; Arwade, S.A.; Myers, A.T.; Schmidt, D.P. Modeling breaking waves for fixed-bottom support structures for offshore wind turbines. In Proceedings of the 1st International Offshore Wind Technical Conference, San Francisco, CA, USA, 4–7 November 2018. [Google Scholar] [CrossRef]
- Lomonaco, P.; Myers, A.T.; Arwade, S.A.; Maddux, T.; Bosma, B.; Hallowell, S.; Johlas, H.M.; Schmidt, D.P.; Lackner, M. Physical model testing of wave impact forces on fixed foundations of offshore wind turbines. In Proceedings of the International Ocean and Polar Engineering Conference, Honolulu, HI, USA, 16−21 June 2019. [Google Scholar]
- Gode, Y.; Haranaka, S.; Kitahata, M. Study on Impulsive Breaking Wave Forces on Piles. Report Port and Harbour Technical Research Institute. 1966, pp. 1–30. Available online: https://www.pari.go.jp/en/report_search/detail.php?id=1966040050601 (accessed on 2 May 2021).
- Kriebel, D.L. Nonlinear wave interaction with a vertical circular cylinder: Wave forces. Ocean Eng. 1998, 25, 597–605. [Google Scholar]
- Jose, J.; Choi, S.; Erik, K.; Giljarhus, T.; Tobias, O. A comparison of numerical simulations of breaking wave forces on a pile structure using two different numerical models based on finite difference and finite volume methods. Ocean Eng. 2017, 137, 78–88. [Google Scholar] [CrossRef]
- Tanimoto, K.; Takahashi, S.; Kaneko, T.; Shiota, K. Impulsive breaking wave forces on an inclined pile exerted by random waves. In Coastal Engineering 1986; American Society of Civil Engineers: New York, NY, USA, 1987; Volume 20, pp. 2288–2302. [Google Scholar] [CrossRef]
- Wienke, J.; Oumeraci, H. Breaking wave impact force on a vertical and inclined slender pile—theoretical and large-scale model investigations. Coast. Eng. 2005, 52, 435–462. [Google Scholar] [CrossRef]
- Guo, Z.; Jeng, D.S.; Zhao, H.; Guo, W.; Wang, L. Effect of seepage flow on sediment incipient motion around a free spanning pipeline. Coast. Eng. 2019, 143, 50–62. [Google Scholar] [CrossRef]
- Lara, J.L.; Losada, I.J.; Maza, M.; Guanche, R. Breaking solitary wave evolution over a porous underwater step. Coast. Eng. 2011, 58, 837–850. [Google Scholar] [CrossRef]
- Packwood, A.R.; Peregrine, D.H. The propagation of solitary waves and bores over a porous bed. Coast. Eng. 1979, 3, 221–242. [Google Scholar] [CrossRef]
- Huang, C.-J.; Shen, M.; Chang, H. Propagation of a solitary wave over rigid porous beds. Ocean Eng. 2008, 35, 1194–1202. [Google Scholar] [CrossRef]
- Hammeken, A. Wave Run-Up on Beaches and Coastal Structures. Ph.D. Thesis, University College London, London, UK, 2017. [Google Scholar]
- Jeng, D.S.; Ye, J.H.; Zhang, J.S.; Liu, P.L.F. An integrated model for the wave-induced seabed response around marine structures: Model verifications and applications. Coast. Eng. 2013, 72, 1–19. [Google Scholar] [CrossRef]
- Lara, J.L.; Losada, I.J.; Guanche, R. Wave interaction with low-mound breakwaters using a RANS model. Ocean Eng. 2008, 35, 1388–1400. [Google Scholar] [CrossRef]
- Jianhong, Y.; Dongsheng, J.; Liu, P.L.F.; Chan, A.H.C.; Ren, W.; Changqi, Z. Breaking wave-induced response of composite breakwater and liquefaction in seabed foundation. Coast. Eng. 2014, 85, 72–86. [Google Scholar] [CrossRef]
- Chen, L.; Zhai, H.; Wang, P.; Jeng, D.-S.; Zhang, Q.; Wang, S.; Duan, L.; Liu, Y. Physical modeling of combined waves and current propagating around a partially embedded pile in a porous seabed. Ocean Eng. 2020, 205, 107307. [Google Scholar] [CrossRef]
- Hsieh, C.-M.; Sau, A.; Hwang, R.R.; Yang, W.C. Nonlinear interaction and wave breaking with a submerged porous structure. Phys. Fluids 2016, 28, 126601. [Google Scholar] [CrossRef]
- Lara, J.L.; del Jesus, M.; Losada, I.J. Three-dimensional interaction of waves and porous coastal structures. Coast. Eng. 2012, 64, 26–46. [Google Scholar] [CrossRef]
- Hirt, C.W.; Sicilian, J.M. A porosity technique for the definition of obstacles in rectangular cell meshes. In Proceedings of the International Conference on Numerical Ship Hydrodynamics, Washington, DC, USA, 24–27 September 1985. [Google Scholar]
- Rodi, W. Turbulence Models and Their Application in Hydraulics—A State of the Art Review, 3rd ed.; CRC Press: Rotterdam, The Netherlands, 1984; pp. 27–30. [Google Scholar]
- Hirt, C.W.; Nichols, B.D. Volume of Fluid (Vof) method for the dynamics of free boundaries. J. Comput. Phys. 1981, 39, 201–225. [Google Scholar] [CrossRef]
- Forchheimer, P. Wasserbewegung Durch Boden. Z. Ver. Dtsch. Ing. 1901, 45, 1781–1788. [Google Scholar]
- Panfilov, M.; Fourar, M. Physical splitting of nonlinear effects in high-velocity stable flow through porous media. Adv. Water Resour. 2006, 29, 30–41. [Google Scholar] [CrossRef]
- Cheng, N.S.; Hao, Z.; Tan, S.K. Comparison of quadratic and power law for nonlinear flow through porous media. Exp. Therm. Fluid Sci. 2008, 32, 1538–1547. [Google Scholar] [CrossRef]
- Losada, I.J.; Lara, J.L.; del Jesus, M. Modeling the interaction of water waves with porous coastal structures. J. Waterw. Port Coast. Ocean Eng. 2016, 142, 1–18. [Google Scholar] [CrossRef]
- Kundu, P.; Kumar, V.; Mishra, I.M. Experimental and numerical investigation of fluid flow hydrodynamics in porous media: Characterization of pre-darcy, darcy and non-darcy flow regimes. Powder Technol. 2016, 303, 278–291. [Google Scholar] [CrossRef]
- Chen, L.; Liao, C.; Duan, L.; Zheng, D. Influence of porous seabed characteristics on wave forces acting on monopile. J. Southwest Jiaotong Univ. 2019, 54, 328–335. [Google Scholar] [CrossRef]
- Carman, P.C. fluid flow through granular beds. Trans. Inst. Chem. Eng. 1937, 15, 150–167. [Google Scholar]
- Cao, Z.; Wang, Y.; Guo, Z.; Cai, Y.; Liu, H. Study on the sediment initiation considering the seepage in the swash zone. Shuikexue Jinzhan/Adv. Water Sci. 2019, 30, 568–580. [Google Scholar] [CrossRef]
- Li, K.; Guo, Z.; Wang, L.; Jiang, H. Effect of seepage flow on shields number around a fixed and sagging pipeline. Ocean Eng. 2019, 172, 487–500. [Google Scholar] [CrossRef]
- Kuai, Y.; Qi, M.; Li, J. Analysis of wave forces on bridge substructure in near-shore. J. Zhejiang Univ. 2018, 52, 2356–2364. [Google Scholar] [CrossRef]
- Liu, Z.; Wang, L.; Guo, Z.; Huang, J.; Wu, J. Numerical investigation of breaking solitary wave force on vertical monopile on porous seabed. Haiyang Gongcheng/Ocean Eng. 2019, 37, 57. [Google Scholar] [CrossRef]


| No. | Slope Angle θ [°] | Initial Wave Height H0 [m] | Water Depth at Pile Positions hp [mm] | Pile Inclination Angle α [°] | Number of Cases |
|---|---|---|---|---|---|
| 1 | 1 | 0.067 | 23.20 | 0 | 5 |
| 2 | 3 | 0.067 | 23.20 | 0 | 5 |
| 3 | 5.1 | 0.03/0.05/0.067/0.09 | 23.20 | 0 | 20 |
| 4 | 7 | 0.03/0.05/0.067/0.09 | 23.20 | 0 | 20 |
| 5 | 9 | 0.03/0.05/0.067/0.09 | 23.20 | 0 | 20 |
| 6 | 11 | 0.03/0.05/0.067/0.09 | 23.20 | 0 | 20 |
| 7 | 5.1 | 0.067 | 17.85 | −45/−22.5/0/22.5/45 | 25 |
| 8 | 5.1 | 0.067 | 23.20 | −45/−22.5/0/22.5/45 | 25 |
| 9 | 5.1 | 0.067 | 28.55 | −45/−22.5/0/22.5/45 | 25 |
| 10 | 5.1 | 0.067 | 46.41 | −45/−22.5/0/22.5/45 | 25 |
| No. | Grid Size dx [mm] | Total Grid Number |
|---|---|---|
| 1 | 12.5 | 2.1 × 10⁶ |
| 2 | 10.0 | 4.0 × 10⁶ |
| 3 | 7.5 | 9.5 × 10⁶ |
| 4 | 5.0 | 3.2 × 10⁷ |
| 5 | 3.0 | 1.5 × 10⁸ |
| 6 | 2.0 | 5.0 × 10⁸ |
Publisher’s Note: MDPI stays neutral with regard to jurisdictional claims in published maps and institutional affiliations. |
© 2021 by the authors. Licensee MDPI, Basel, Switzerland. This article is an open access article distributed under the terms and conditions of the Creative Commons Attribution (CC BY) license (https://creativecommons.org/licenses/by/4.0/).
Share and Cite
Liu, Z.; Guo, Z.; Dou, Y.; Zeng, F. Characteristics of Breaking Wave Forces on Piles over a Permeable Seabed. J. Mar. Sci. Eng. 2021, 9, 520. https://doi.org/10.3390/jmse9050520
Liu Z, Guo Z, Dou Y, Zeng F. Characteristics of Breaking Wave Forces on Piles over a Permeable Seabed. Journal of Marine Science and Engineering. 2021; 9(5):520. https://doi.org/10.3390/jmse9050520
Chicago/Turabian StyleLiu, Zhenyu, Zhen Guo, Yuzhe Dou, and Fanyu Zeng. 2021. "Characteristics of Breaking Wave Forces on Piles over a Permeable Seabed" Journal of Marine Science and Engineering 9, no. 5: 520. https://doi.org/10.3390/jmse9050520