1. Introduction
Oceans and marine ecosystems are key elements for life on Earth: they regulate the transportation and storage of carbon dioxide, control the climate, and absorb most of the heat excess from greenhouse gas emissions [
1]. Nevertheless, global climate change is progressing rapidly, and geo-hazards, such as earthquakes, volcanic eruptions, and tsunamis, not only cause large losses of human life and have massive worldwide socioeconomic impacts, but also have disruptive impacts on environments. Enhancing marine environmental monitoring and prediction capabilities will increase our ability to respond adequately to major challenges and efficiently preserve both the environment and ecosystems. Understanding the functioning and assessing the status of the marine environment require the monitoring of multiple stressor impacts with a multi-parametric integration of observations [
2]. There are specific parameters, such as sea surface temperature, sea level, ocean surface currents, near-surface wind, ocean color, and ocean stratification, but also other parameters, such as sea ice, water turbidity, pH, nutrients, and oxygen concentrations, which affect the distribution of marine species and the functioning of marine ecosystems [
3,
4,
5]. For all these reasons, the scientific community has recently launched the UN Decade of Ocean Science for Sustainable Development (2021–2030). This aims to create a common framework for the sustainable development of the oceans, which should lead to an integrated system for science-based solutions. This will include building on existing technology and partnerships to “provide ocean science, data, and information to inform policy for a well-functioning ocean in support of all sustainable development goals of the Agenda 2030” and “to generate scientific knowledge and underpinning infrastructure and partnerships” [
2,
6]. Holistic marine environmental characterization is essential for data-driven decision making across the science and engineering aspects. The characterization of such complex oceanographic processes is more difficult compared to inland features because of the difficulty in obtaining observations from often remote and hazardous locations [
7]. Due to the risk and difficult environment, more than 80% of the oceans are presently still unexplored and unmapped. Moreover, specific marine environment is characterized by the presence of transient phenomena, particular events that occur in very localized points in space and in time intervals that are very short. The transient character of these events is related to the fact that they are not repeatable and not completely predictable. Despite the obvious practical difficulties, there is considerable interest in the observation and identification of these phenomena, both from the point of view of marine sciences and for the possible consequences in terms of hazards they can generate. Traditional techniques of point sampling and observation in the environment do deliver high-information content, but they are expensive and often do not provide adequate spatial and temporal coverage, while remote sensing can provide cost-effective solutions as well as data for locations where there is no or only limited information but can also have insufficient time/space resolution [
8]. In this context, novel technologies have an important role in making new solutions available: advances in ocean robotics, for example, and the combination of remote and in situ ocean observations offer new opportunities and reduce operational costs (European Marine Board, 2019). New sensors, platforms and monitoring strategies are required to address an increasing number of variables, in particular for the assessment of the status of the environment [
2].
In this work we focus on transient phenomena that occur in dynamic, sensitive, and fragile areas, often difficult or impossible to reach due to the prohibitive environmental and climatic situations that make them critical and the traditional methods of observations inadequate. These distinctive features require the development of dedicated observation procedures, which on the one hand take into account the constraints imposed by the environment in which operations take place, and on the other hand are able to satisfy the requests in terms of spatial and temporal resolution and accuracy necessary to record these transient events. In parallel with the development of specific observation procedures, it is necessary to use instruments and tools that can overcome the limitations associated with traditional methods of observing critical marine environments. In this perspective, the use of autonomous robotic platforms characterized by ease of assembly and adaptability, equipped with instrumentation capable of operating even in demanding working conditions, is of fundamental importance.
The critical environmental conditions may present some risks for the data acquisition but can also constitute a limit from a metrological point of view: very often it is not possible to perform repeated measurements due to adverse conditions and therefore measurements referring to the observations of different phenomena are paired even if they are not directly comparable from a metrological point of view. In this context, it is essential to apply multidisciplinary and coordinated measurement procedures to gather data that have metrological traceability, thus ensuring compatibility [
9].
In this paper two case studies are described: water mass stratification with possible presence of plume of meltwater from glaciers in Svalbard and seabed methane emissions in the Tyrrhenian sea. The critical conditions to which the measuring instruments are subject, the dangers to which operators may be exposed, and the constraints on data acquisition means operations in the two environments chosen as case studies are certainly different. Although each of the two environments has specific criticality linked to the particular working conditions, both are dynamic, sensitive, and fragile areas subject to the presence of transient phenomena strongly localized in space and time, not repeatable and not completely predictable, which require very high performance from the operators and instruments in terms of spatial and temporal resolution. For these reasons, the approach followed for the observation and study of these phenomena was common to both case studies: specific observation methodologies, using autonomous vehicles and procedures connected to the principles of metrology and adapted to the particular environment, give the possibility to achieve important results with high effectiveness, overcoming various practical difficulties.
1.1. Oceanographic Processes from Tidewater Glacier in Kongsfjorden (Svalbard)
The first case study concerns the complex and fragile Arctic environment, which includes specific processes for the study of the current state of our environment and its future evolution. To give better estimates of the future changes within a relatively short time, regions with a large natural climate gradient and where processes sensitive to the expected changes are particularly important should be studied [
10,
11]. Svalbard and the surrounding ocean areas fulfill all these criteria: they are located in a region with a very large climate gradient, being alternately influenced by cold central Arctic or mild marine climate conditions at time scales of weeks to years [
12,
13,
14]. The processes that take place in this area should be studied considering the climatic and meteorological, geological, and geomorphological as well as oceanographic and sedimentological framework in which they are inserted. All these factors are fundamental to understand the processes taking place there. This environment, so important for its richness of phenomena, is however still characterized by a lack of data due to the numerous logistic difficulties in collecting them, increased by the severity of climatic and environmental conditions, typical of polar areas. This fact is especially true when considering the data to study oceanographic processes near the fronts of tidewater glaciers: in situ data are typically coming from moorings and casts adjacent to the glacier fronts [
15,
16,
17]. However, these data, while essential to reconstruct the time series of the recorded variables, are related to a static point and therefore insufficient to characterize larger areas, especially the ones close to the glacier front and with high spatial resolutions not reachable even with satellite data.
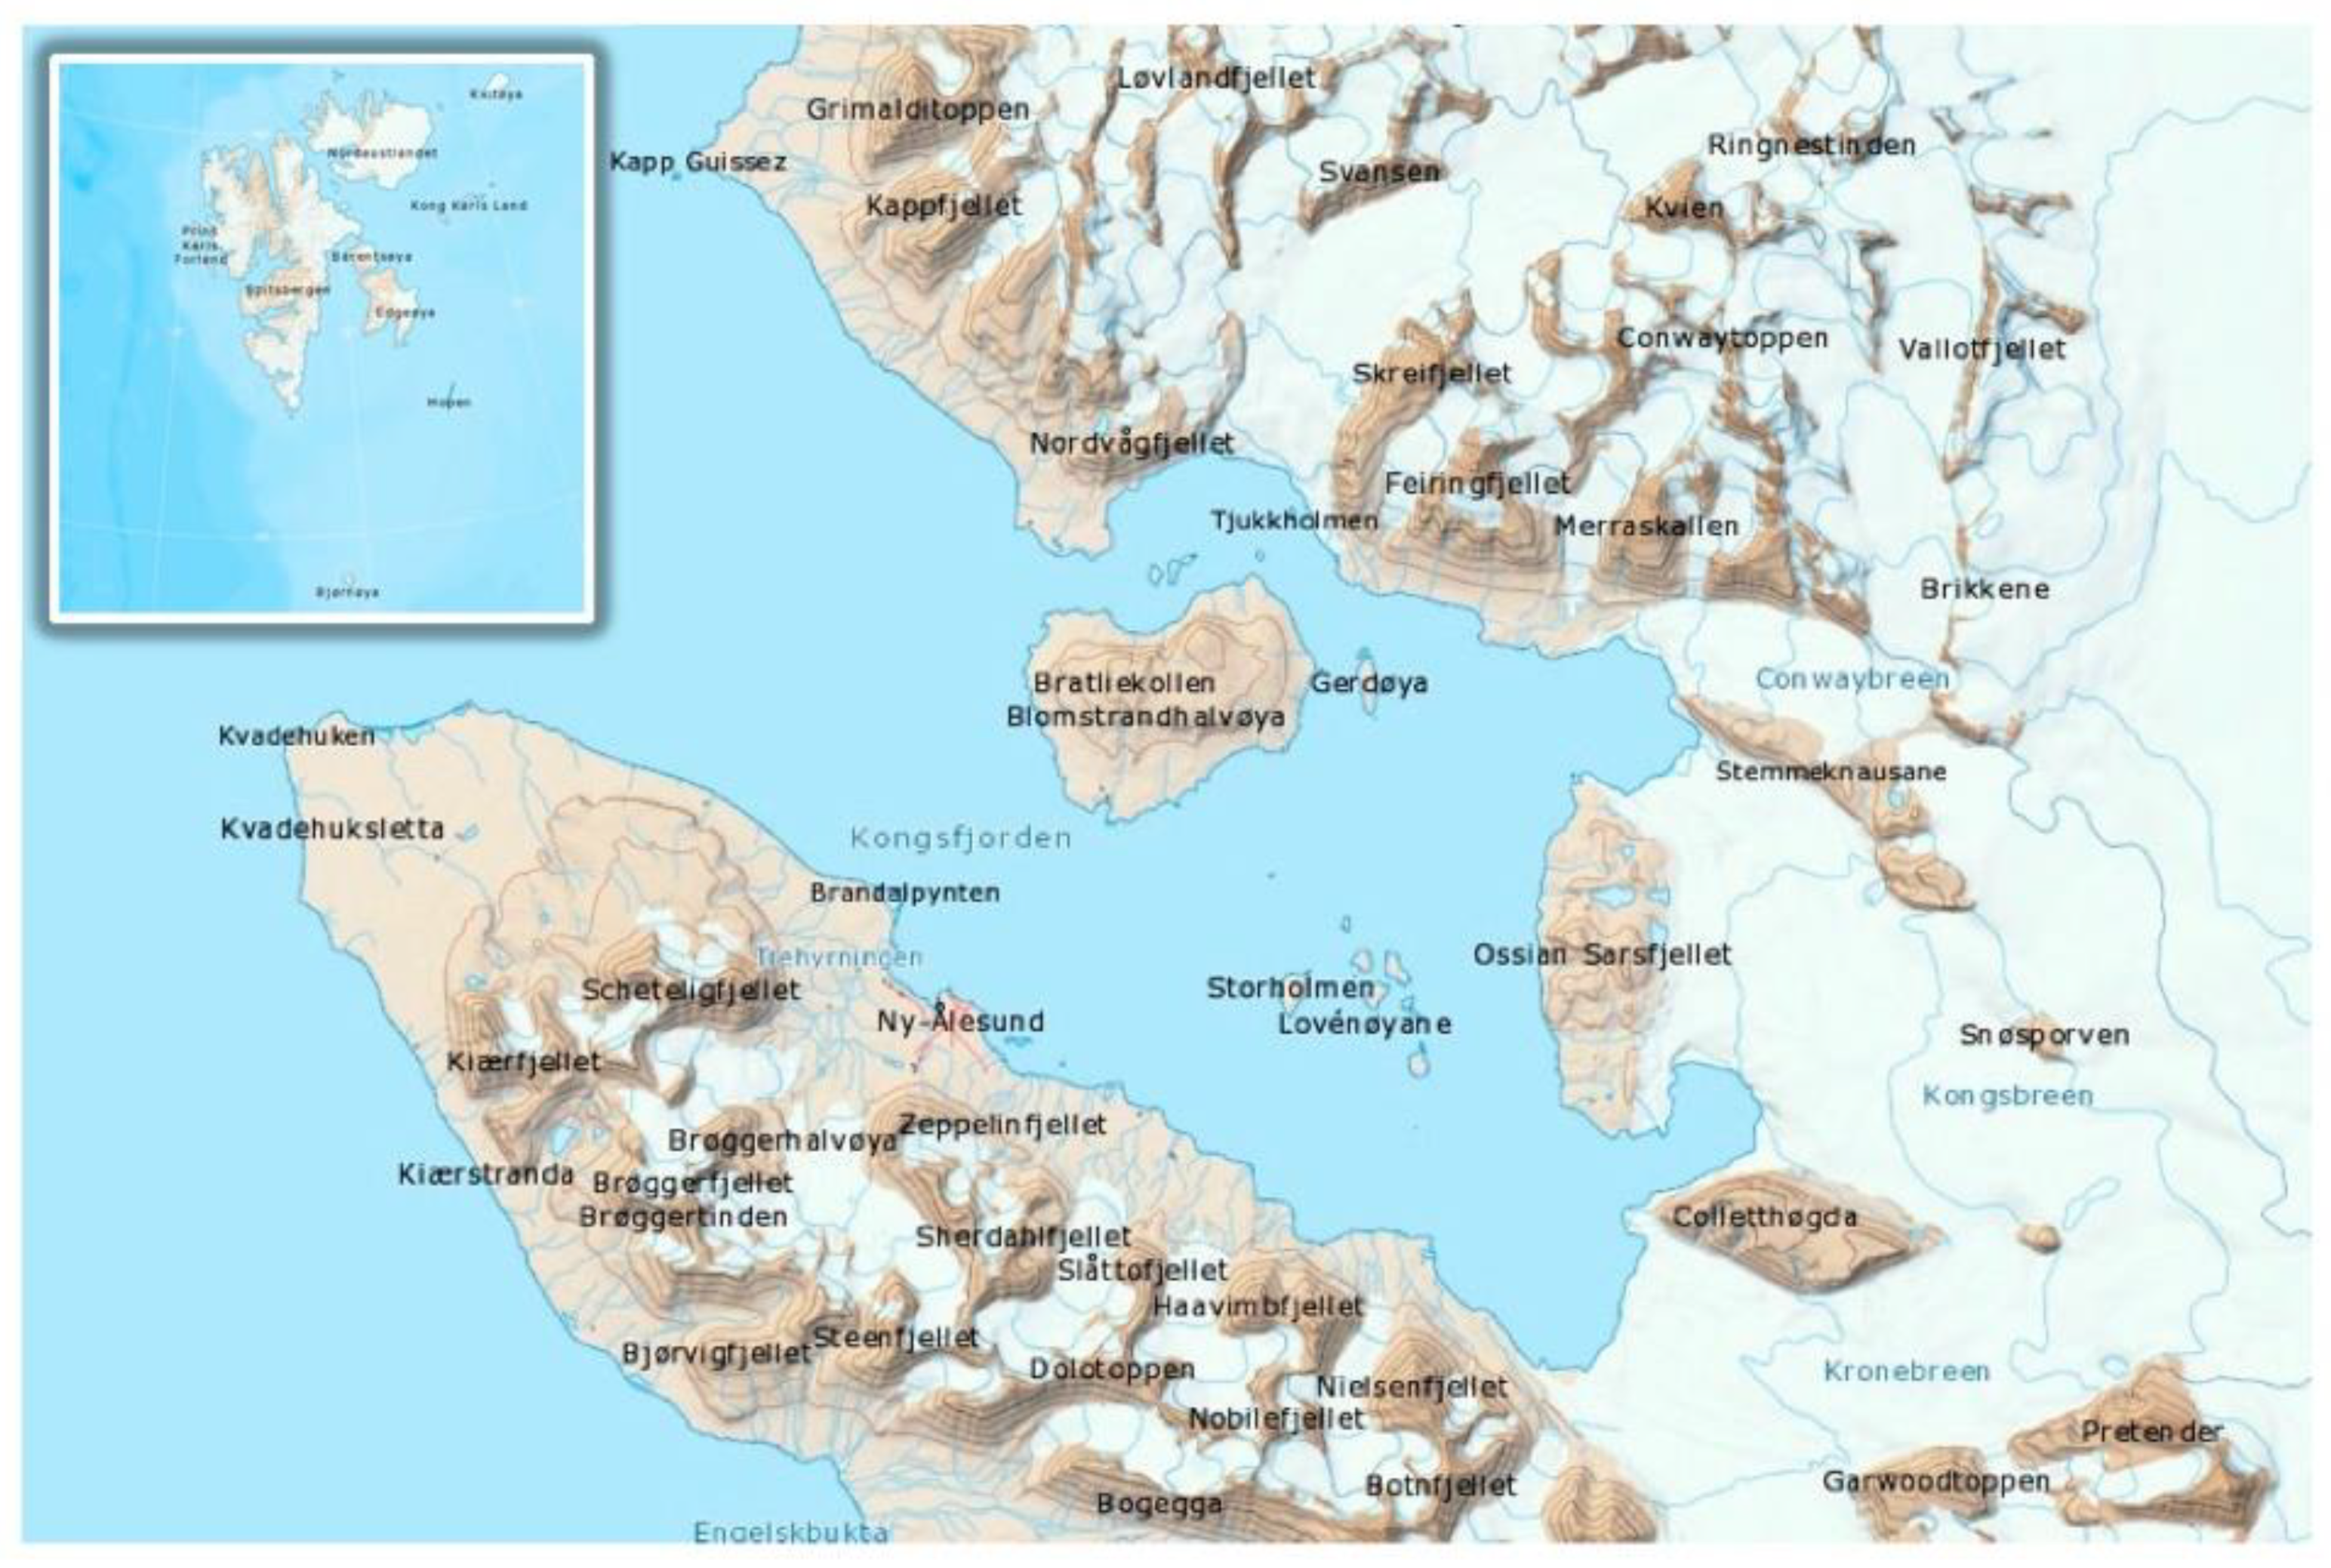
In this work, the data collected allow us to concentrate on a very short time scale within which instantaneous and strongly localized in space phenomena occur but with consequences on the ecosystem of a fjord that also extends over longer time scales. These phenomena are related to the introduction of melt water from the tidewater glaciers present in the Kongsfjorden (
Figure 1) and to the formation of plumes which, once they reach the surface of the water, mix with the water of the fjord. Through the analysis of specific variables, it is possible to identify the distribution of the water mass and the presence, at some points, of the meltwater plume coming from the glacier before the mixing with the fjord water. In addition to the water component due to the melting of the glacier, in the late spring period during which the tests were carried out (beginning of June 2018), there was also a component of water that originated outside the study area but which, due to the global dynamics of the ocean circulation, was pushed into the fjord itself. The two main water masses originating outside the study areas are the Atlantic water (AW) element of the West Spitsbergen Current (WSC) and Arctic water (ArW) of the coastal current. Both these currents flow northward along the west Spitsbergen margin, steered by the slope edge topography [
18,
19]. Recent years have been characterised by an increase in the temperature and frequency of warm AW incursions into west Spitsbergen fjords, alongside an increase in the temperature of the WSC [
12]. In addition to the waters of external origin, different types of water originating inside the fjord can be also identified, as found in literature [
12,
14,
19,
20].
1.2. Shallow Seabed Gas Emissions in the Scoglio d’Affrica (Tyrrhenian Sea)
The second case study is related to the phenomena of seabed gas emissions taking place in the northern Tyrrhenian Sea (
Figure 2). Despite the apparent diversity, the phenomena of water mass stratification with the possible presence of plume of meltwater from glaciers in Svalbard and seabed methane emissions in the Tyrrhenian sea are both events strongly localized in space and time, non-repeatable, and not completely predictable. These distinctive features require the development of dedicated observation procedures, which on the one hand take into account the constraints imposed by the environment in which operations take place, and on the other hand are able to satisfy requests in terms of spatial and temporal resolution and accuracy necessary to record these transient events. Seepage represents an important route of transport for methane (CH
4) and other hydrocarbon gases from Earth’s subsurface to the oceans and the atmosphere. When CH
4 comes in contact with seawater it provides energy to drive chemosynthetic microbial activity. Escaping CH
4 can then contribute to the atmospheric CH
4 pool where it acts as a strong greenhouse gas. Finding the locations of CH
4 seepage, estimating its amount, tracing the origin of the CH
4, and identifying abiotic vs. biotic processes occurring at CH
4 seeps is therefore of fundamental importance for understanding the global carbon cycle and its interaction with the biosphere [
21].
Cold gas emissions from the seabed characterize the area between the Scoglio d’Affrica, the island of Pianosa, and the island of Elba. Surveys to observe gas emissions in the area of the Scoglio d’Affrica were carried out by the Geological Service in the 1960s and 1970s and were described in [
22]. These identified the presence of morphological terraces, structures affected by fault dislocations and structural lineations potentially capable of conveying deep fluids. Direct observations indicated a widespread and continuous degassing activity, and the gas was found to be mainly methane [
23]. The seabed gas emissions in the area of the Scoglio d’Affrica have been studied since the 60s and recently they returned to great interest due to an episode that occurred in March 2017 when fishermen reported that an outburst of gas rose about 10 m near their boat. The phenomenon persisted for about 15 min and then decreased, transforming into emissions of “clear water” bubbles. After this episode, numerous data acquisition campaigns were carried out by various subjects (public and private research centers) interested in the study of the phenomena that occur in the area. One of the most recent scientific campaigns is the one coordinated in June 2019 by Italian Navy Hydrographic Office (IIM) in collaboration with the National Institute of Geophysics and Volcanology (INGV), the Institute of Marine Engineering (INM), Genoa of the CNR, University of Ferrara (UniFe), and University La Sapienza (Roma1) in order to continue the annual monitoring program already started in 2017.
In the following paragraphs, the combined use of newly designed robotic vehicles and of acquisition procedures specifically conceived to cope with the criticality of the operating environment are described.
2. Materials and Methods
Knowledge of the environment, also for the purpose of a correct management of resources to preserve the environment itself, is often limited by the ability of human beings to make complete observations in many locations due to the remoteness, the hardness, and the geographical extension of the oceanic environment. Furthermore, knowledge is often limited by the considerable extent of the time scales on which observations must be made and by the high demand in terms of spatial data resolution [
24]. In this scenario, unmanned autonomous platforms are important tools to make the necessary observations possible. The application of these in situ observation capabilities must be performed comprehensively, integrated with other elements of an ocean observation system, including models and satellite remote sensing. The trend in recent decades has been to develop integrated observation systems, such as the Framework for Ocean Observing [
25], which uses requirements drivers, technological maturity, and impact on society to identify essential ocean variables (EOV). Autonomous platforms already provide key observations for some EOVs. Further advances in autonomous systems are required to meet the growing ocean observation needs in different scientific fields like biology, biogeochemistry, and ecology as well as for seabed mapping, deep ocean exploration, and the growing needs for real-time data [
26]. New observation technologies and techniques will advance our understanding particularly of transient events, such as harmful algal blooms [
27], tsunamis, underwater volcanic eruptions, and gas hydrate plumes [
28], which require better and faster observation techniques. While ship-based in situ observations offer great flexibility and are essential for the maintenance of buoys and casts observatories, they are increasingly limited by the cost of operations [
29] and by insufficient temporal and spatial coverage. For all these reasons the trend in marine observations has been toward increasing the application of autonomous buoys, moorings, autonomous underwater vehicles (AUVs), and unmanned aerial vehicles (UAVs) [
30]: robotic systems are employed as fundamental data-gathering tools by scientists, allowing new perspectives and a greater understanding of the planet and its environmental processes, also taking advantage of the possibility to mount sets of tools on board for a complete characterization of the environment, even critical, with spatial and temporal resolutions not otherwise obtainable. A further and important step forward for autonomous vehicles (and for the entire observation of the marine environment) is to have significantly improved interoperability of sensors, systems, and data. The increased cooperation between the elements of the system was noted as an advantage of the Global Ocean Observing System (GOOS) [
31]. Moreover, the use of standards and of best practices for observations make it easier to operate efficiently, share results, and exploit existing data, favoring the interoperability and reproducibility of the results obtained. Autonomous platforms already make observations over a wide range of time and space scales, measuring salinity, temperature, nitrate, pressure, oxygen, biomass, and many other parameters [
26]. This means better comparability as well as lower uncertainty and a larger volume of high-quality stable standards and reference materials that meet the global demand for data quality. To reach higher effectiveness, it is essential to combine the expertise achieved in the individual, traditional fields of metrology into new interdisciplinary and multidisciplinary strategies to be developed and embraced also by national metrology institutes (NMI) [
32]. Collaborations between communities are needed to develop improved measurement standards, to perform comparisons, and to establish metrological guidelines and operating procedures for observational networks [
33].
2.1. The Environment as Driver of Technological Innovation and New Observation Methods
Risk mitigation and the necessity of collecting data not otherwise available consequently leads to the development of new technological solutions both in terms of autonomous vehicles and on-board instrumentation. They are the primary and fundamental aspects, but not the only ones to consider. The other major issue linked to the limitations and constraints given by the environment where the measuring operations take place is the methodologies according to which these observations are performed. These aspects are of fundamental importance for the Arctic area but can generally be used to develop an integrated system for observing the marine environment which, starting from the inputs (e.g., essential ocean variables) and the measurement needs, determines which tools and procedures to implement (observations and maintenance) in order to obtain the desired outputs (data and products). The process obviously provides feedback on what were the initial target inputs and therefore an iterative process is generated that gradually leads to improving the quality of the procedures and results [
31].
The close link between the specific application, characterized by certain environmental constraints and specific outputs to be obtained and the development of technological tools and operating procedures to be implemented, is clear. Autonomous operations in hardly accessible areas, such as the polar regions or in hazardous areas, like the ones characterized by seabed gas outflows, require specific designs and ad hoc studied solutions. Usually, different requirements must be met, like for example providing an accurate assessment of conditions in a relatively short time, ensuring repeatability, high positioning precision, and a high degree in the control of the system. To satisfy all the numerous requests, sometimes in conflict with each other, it is necessary to mediate and find solutions that constitute the best compromise. To do this, it is necessary to develop research work that naturally leads to technological innovation and which in turn can improve the application from which the process originated. This approach, based on the application that drives research and leads to innovation, was applied in the design phases for the development of the autonomous vehicles described in the following paragraphs.
2.2. Innovative Surveys Strategies Using Autonomous Robotic Platforms in Critical Areas
The traditional approach to obtaining ocean measurements is costly, labor intensive, and provides limited data. Moreover, a deep understanding of the numerous processes connected to changes in the Arctic climate, sea ice, and ocean is needed for better forecasting models and improved risk assessment and is thus a key to improved safety and sustainability of all Arctic operations [
34]. The innovative procedures of observing the Arctic environment can be defined as “data driven” as the choice on how to operate during the acquisition campaigns is dictated by the final data required and in turn linked to the information that is extracted from the data. The focus is therefore on the type of measurements that are made, on the phenomenon that is observed, and on the temporal and spatial scale required. The need to take a step forward compared to the methods traditionally used in order to contribute to fill the gap of data that still persists in the area facing the fronts of Arctic tidewater glaciers and the implementation of innovative observing procedures strongly connected with metrology and international standards leads to the employment of autonomous vehicles in our field campaigns. The connection with metrological principles is related to the multidisciplinary approach to measure key variables for environmental studies with high accuracy and resolution of measurements, comparability, stability, and coherence of the results. In this work, we focus on the observation of water column parameters, like temperature, salinity, chlorophyll-a, and turbidity, that are considered essential climate variables (ECV) and essential ocean variables. Observation procedures were planned to meet the requirements for ECV and EOV observations concerning resolution and uncertainty.
PROTEUS (Portable RObotic TEchnology for Unmanned Surveys) is a fully electric vehicle developed by CNR marine robotics researchers based on their experience in polar applications. [
35,
36]. It is characterized by its versatility and adaptability in order to be suitably modified according to the environmental constraints in which it operates: the prototype was designed and built as a portable (45–70 kg weight, 1.5 m long, 0.35–0.5 m wide, and 0.35–1.5 m high), highly modular, and reconfigurable vehicle and its open-frame torpedo-shaped structure is transformable into different kinds of autonomous marine vehicles (ROV—Remotely Operated Vehicle, USSV—Unmanned Semi-Submersible Vehicle, and AUV—Autonomous Underwater Vehicle) by adding or removing various modules. PROTEUS’s core can be operated as an ROV when tethered to a mothership. It can also be transformed into a USSV by removing the tether cable; adding a battery pack below the vehicle; installing on its top a module composed of foam, a GPS, and a radio communication system; and moving the vertical thrusters to a horizontal surge configuration. During the 2018 campaign, PROTEUS was mainly used in the USSV configuration, and it was equipped with different sensors, samplers, and tools (
Figure 3).
The final goal in terms of space-time resolution of the data leads to the development of precise procedures for their acquisition: the operations carried out in the Kongsfjorden highlighted how the use of a robotic surface platform with the ability to perform profiles along the water column using a bunch of sensors allowed researchers to obtain data that were unique for their characteristics of accuracy, resolution, and precision, making it possible to study the physical and bio-optical properties of the water masses of the fjord in general and of the areas close to the tidal glacier front in particular, and thus capture particular processes of stratification of the waters inside the fjord that occur in these areas otherwise difficult or impossible to reach and observe. The choices of the specific variables to monitor is derived from the indications developed by international communities working on the definition of variables that are considered fundamental to characterize the climate system and its changes. In this work, we focus on specific parameters that are listed as essential climate variables defined by the Global Climate Observing System (GCOS) and in particular in some of the EOV defined by the GOOS. Salinity and temperature of seawater measured with depth, turbidity, and concentration of chlorophyll-a pigment in the water are variables also defined as “core data” in the Svalbard Integrated Observing System (SIOS). Moreover, the connection with the essential variable schemes can provide guidelines and criteria for the definition of requirements for temporal and spatial coverage for the different variables that can also depend on the specific scientific question to be answered [
37].
The acquisitions were performed in the stretch of sea facing different glaciers of the Kongsfjorden (e.g., Blomstrandbreen, Kongsbreen, Kronebreen, and Conwaybreen), with the robot moving away from the glacier along paths almost perpendicular to the glacier fronts. During the 2018 campaign, data were collected not only on the surface but also along the water column to understand the complex phenomena that occur near the front of the glaciers. from an operational point of view, the first phase of data acquisition involved the approach of PROTEUS to the front of the glacier until it touched it. Once it reached this point, the vehicle was stopped and made sure that it maintained its position. The PROTEUS control system provides three main control modes to the pilot: Manual, semi-automatic, and automatic. In manual mode, the pilot can directly operate on motor thrusts and he/she is in charge to keep the desired heading, speed, etc. for the vehicle. In semi-automatic mode, the PROTEUS control system allows one to automatically follow references of heading (auto-heading), speed (auto-speed), etc. In automatic mode, the vehicle is completely autonomous and, for example, can autonomously reach and keep a desired GPS position [
35]. While the vehicle was in position, measurements of biogeochemical and physical parameters along the water column were performed, releasing the set of instruments by means of a winch down to depth of 35–40 m. In particular, the following sensors were employed: a multi-parametric Idronaut 305 Plus CTD type probe (conductivity, temperature, depth, pH, redox, and oxygen), the ArLoC multi-sensor, a fluorimeter, and a turbidimeter. ArLoC (Arctic Low-Cost probe) is a tool used for the acquisition of parameters relating to sea water designed by the University of Tuscia to be flexible, adaptable, low cost, and equipped with sensors for depth, temperature, and chlorophyll-a fluorescence [
38]. The management of the underwater winch was performed by using an altimeter to prevent the possibility of grounding and deadlock of the sensors. The use of the robotic vehicle for data acquisition, equipped with the Microstrain 3DM-GX3-35 for the positioning system, made it possible to locate and georeference the physical parameters of the water with horizontal position accuracy <2.5 m. During water column sampling, the underwater position of the bunch of sensors is estimated at a point which, for shallow depths (and little current), can be considered within the uncertainty of the GPS measurement but which obviously degrades with increasing depth and current. All data collected by the cluster of instruments released underwater were synchronized and saved by an ad hoc developed system named MPDACS (Multi-Purpose Data Acquisition Control System).
These operating procedures were used to record the variation of the parameters as a function of the depth at a fixed point, and therefore to study possible effects due to currents, to the introduction of substances by the water coming from the glacial ice melting, and to characterize the area near the front of the glacier from a physical point of view. Once the measurements along the water column were completed, the winch was rewound and PROTEUS was directed to the next sampling point at a distance gradually greater from the front of the glacier. Even during the transfer phases from one sampling point to the next, the measurements of biogeochemical and physical parameters were recorded in the surface layer of the water [
9]. In this work, the data collected allowed us to focus on the study of phenomena related to the introduction of melt water from the tidal glaciers present in the Kongsfjorden and the formation of plumes. These events are placed on a very short time scale, almost instantaneous, and on a very localized spatial scale but with consequences on the entire ecosystem of the fjord as these masses of water, once they reach the surface, spread by mixing with the water of the fjord.
Similar innovative sampling strategies, with the use of autonomous vehicles, were also implemented in the northern Tyrrhenian area to characterize gaseous emissions from the seabed. For the Scoglio d’Affrica campaign, due to the complexity of degassing events from the seabed, an integrated study was necessary: acquiring data from different points of view (geological, morphological, and chemical-physical) and video images were necessary in order to characterize the site being tested in an interdisciplinary way. The coordinated action between the different entities took place with the goal of 3D mapping the area with the identification of targets of interest and of classifying the nature of the seabed, developing a rapid environmental characterization procedure in case of exceptional events, environmental monitoring, and risk management as well as in support of civil protection. To this end, the ROV e-URoPe (e-Underwater Robotic Pet) of the CNR-INM had been embarked on the ITS Magnaghi (Italian navy ship) and was used to investigate shallow water areas that could not be reached by the ship itself. The robotic platform e-URoPe of CNR-INM is a second example of the process of technological innovation driven by environmental constraints. The e-URoPe is a hybrid ROV/AUV system (
Figure 4) characterized by an open and reconfigurable structure: following the needs coming from the different types of missions and the actual indications arising from the environment, it is possible to easily change the position of sensors and cameras mounted onboard, to add more payload, modify the frame, and even change the propulsion layout [
39].
During the 2019 Scoglio d’Affrica campaign, the basic instrumentation for the autonomous navigation of e-URoPe included a system of attitude and orientation measurement (AHRS), a positioning system (GPS), a CTD probe (electrical conductivity, temperature, and depth), a Doppler effect velocimeter (DVL), a fiber optic gyroscope (FOG), an ultrashort baseline transponder (USBL) for underwater acoustic positioning, and two altimeters. The e-URoPe can operate in hovering mode, provided by an automatic control scheme based on adaptive compensation of the vehicle displacement with respect to the desired position. The vehicle position is provided by the GNSS measures (when surfaced) and by the USBL measures when operating underwater; the measures are suitably filtered in order to smooth the position signal and remove identified outliers. The dynamic positioning module then provides the transfer to the desired location, optimizing the convergence trajectory and the station keeping, counteracting sea currents. Since in this specific case study it was not possible to use the USBL, the underwater position of the vehicle was recalculated with the dead reckoning method using the DVL and FOG data.
Moreover, three analog cameras installed at the stern and bow offered the pilot a subjective panoramic view of the operating environment. In addition to the navigation instruments, instruments for the characterization of the seabed had been installed, in particular a single-beam sonar operating at 200 kHz and a vertically mounted ethernet camera that allowed researchers to acquire high-resolution images of the area under the vehicle.
Data acquisition was divided in classic hydro-oceanographic mapping of the whole area of interest using the high resolution multibeam echosounder (MBES) mounted on the ITS Magnaghi and on its support boats. The data collected using the e-URoPe ROV were acquired in a sub-area of the area investigated by the ITS Magnaghi, that is part of an elongated main NNW-SSE ridge that rises 30 m from the surrounding seabed, not far from the Scoglio d’Affrica site, already observed in the high-resolution bathymetric data collected subsequent to the 2017 gas outburst. The ridge is made up of two mounds whose tops are located at about 8 m and 10 m water depths, respectively [
40]. The ROV collected video images of the gaseous emissions from the seabed (methane gas) during five dives at as many points of interest as possible. Between one observation point and another, the vehicle was towed by a support rubber dinghy to speed up transfer operations and maximize data acquisition time. The graph in
Figure 5 shows the time on the
x-axis (in the format hours, minutes, seconds) and the
y-axis shows the depth value of the vehicle with respect to the water surface as measured by the depth sensor of the CTD. Observing this graph, it is possible to see the different immersion phases of the ROV, as highlighted by the horizontal red arrows.
The overall operations with the ROV lasted about five and a half hours, during which dives of different durations were made: from the shortest, lasting about twenty minutes, to the longest, lasting more than an hour. Note: Dive three and four are considered a single dive as they took place at the same point of interest. There was no transfer between the two dives but only the ROV, which rose to the surface and then re-submerged.
Regarding the navigation of the ROV, the problems related to the underwater positioning initially encountered were solved in a second instance by integrating the information from the ROV telemetry with the acoustic data from the multibeam survey. The vehicle’s positions obtained from dead reckoning algorithms were subsequently integrated with video and MBES data, allowing the different seafloor features observed in the videos to be associated with the distinct morphologies acoustically identified on the mounds. This made it possible to obtain results with a resolution in space (less than 1 m) and time (from minutes up to hours) that can allow for both the instantaneous interpretation of the data, for alert purposes in the event of a hazard, and long-term interpretation, to study the evolution of the degassing events taking place in the area surrounding the Scoglio d’Affrica. In this way, the inclusion in the data acquisition procedures of inspections of the seabed by the ROV allows researchers to obtain data characterized by a reproducibility, accuracy, and precise georeferencing higher than those obtainable by human operators.
4. Discussion
In this section, the results obtained and showed above are discussed and interpreted from the perspective of previous studies, and the valuable scientific outcomes are underlined.
Recent years have been characterized by an increase in the temperature and frequency of warm AW incursions into west Spitsbergen fjords alongside an increase in the temperature of the WSC [
12]. Due to the dynamic nature of cross-shelf transport, there is an annual cycle where water of Arctic origin dominates through winter and Atlantic water dominates through summer [
12,
20]. A recent study of the Kronebreen–Kongsvegen glacier [
47] suggests that the high concentration of suspended sediment discharged in a surface water plume is the result of a subglacial river. The presence of these focused, concentrated discharges of sediment-rich meltwater can strongly influence the ecosystem of the fjord and lead to subsequent consequences for the benthos and biogeochemistry of the environment [
19]. In addition to the aforementioned waters of external origin, it is possible to classify different types of water originating inside the fjord; one of these is the surface water (SW), which derives from the dissolution of cryospheric components (snow, ice, and melting of glaciers). The thickness of this surface layer is generally greater in the inner parts of the fjords and then decreases toward the mouth of the fjord. The water in this layer has a very wide range of salinities and temperatures, as shown in
Table 1 [
19]. Numerous tests have been carried out to characterize the masses of water present in the Kongsfjorden and study their characteristics. For example, in [
15], a 6-year time series (2010–2016) of physical parameters and particle fluxes collected by an oceanographic mooring in Kongsfjorden are shown, providing an extraordinary opportunity to investigate seasonal and multiyear changes in the inner fjord. The results suggest that, as the Arctic temperature rises in a warming scenario, the flux of glacier-derived material will increase accordingly. Furthermore, water column stratification modulated by the inflow of warm Atlantic waters, especially in winter, will progressively hamper the exchange of nutrients from the bottom waters [
15,
16]. In [
17] is a report on the hydrology and ocean heat content (OHC) in Kongsfjorden, especially focusing on its innermost part. OHC estimates were based on calculations of the volume of water in the major basins of Kongsfjorden as inferred by a dedicate and accurate bathymetric survey and by CTD casts. from these two examples, chosen among the many available in the literature, it is observed that typically the studies for the characterization of the water masses inside the Kongsfjorden are carried out using instruments installed on moorings and casts. In this work, a different approach was presented based on the use of robotic platforms, paying particular attention to the acquisition procedures and to the data itself, also highlighting the close link with metrology and the possibility to observe phenomena on a very detailed scale.
The sampling of these specific water parameters, inserted in a more general context regarding the study of water masses and their dynamics, is a particularly complex subject that must consider various factors on different time scales. For what concerns the Svalbard area, there are instant components (ice-collapsing and calving events), seasonal and annual components (influence of water coming from ocean currents, seasonal temperature variations, wind, etc.), and also components on much longer time scales (pluri-annual, decennial, and even secular) that can be studied by also analyzing the morphology of the seabed and the sediments at the water-bottom interface. Numerous published works deal with the study of the relationships between the morphology of the seabed and the oceanographic processes that occur near the fronts of the glaciers [
10,
19,
48,
49,
50,
51]. In the work of Howe et al. (2019) [
19], models of the glacier fronts and seabed based on AUV observations are presented, combining the oceanography with the bathymetric setting. These models suggest that bathymetry provides a strong control on glacier behavior, driving the water mass structure in the glacier front environment. It is interesting to compare the models regarding the different water masses identified in the Kongsfjorden, described by [
19], with the results obtained analyzing the data acquired during the 2018 EXCELLABUST campaign and described in this work. Our data were collected at the end of Mayand the beginning of June 2018 (late spring), while those of article [
19] were collected in the first half of August 2017, therefore in summer. The seasonality conditions can justify some differences found in the results obtained but they are not the only causes behind them.
The observation of the SSW mass, not mentioned in other works, can be related to the measurement procedures and the instrumentation used in the 2018 campaign. Investigations near glacier fronts are typically performed using AUVs. These tools are characterized by a high degree of autonomy and the ability to map the environment in a three-dimensional way. On the other hand, they have a lower capacity to discriminate punctual measurements and are also affected by higher uncertainties on positioning as they use underwater acoustic systems, less precise than systems operating in the air. In the campaign described in this work, on the other hand, a robotic system that operates in the water surface was used but with capabilities to acquire parameters also along the water column, thus guaranteeing high positioning accuracy. This allowed us to observe new transient phenomena, characterized by non-repeatability, with high precision, like for example the aforementioned observation of the water masses stratification not only along the vertical profile but also at increasing distance from the glacier front, in correspondence with a particular seabed morphology that creates a boundary effect on the distribution of the water masses.
The complexity of the surface water layer (SW + SSW) must also be interpreted by considering the state of the fjord’s waters as a whole. The measurements of the 2018 campaign, in fact, were made between the end of May and the beginning of June. In this period, the fjord is characterized by more than a month of open waters, as confirmed by the Sentinel 2 images, which show how the surface layer of ice opened in April, making the effect due to the intrusion of warmer Atlantic water almost negligible when the measurements were made (
Figure 12). In this condition, the melting processes, highlighted by the presence of high turbidity values in the surface layer, continue to take place at the edge of the glaciers.
The added value of this work was therefore the ability to record these transient variations in the trend of the variables of interest at a level of resolution that allows for an extremely detailed discrimination of the processes that occur at the edge of the glacier front not directly related to the seasonality effects but due to the internal processes that take place inside the fjord, like freshwater runoff, surface heat fluxes, vertical mixing, and wind forcing, to name a few of them. Generally speaking, with this work it was possible to record phenomena showing that the dynamic of the water masses in the fjord system is influenced by numerous factors, generating both vertical movements (differences in temperature and salinity together with differences in density also influenced by parameters such as turbidity and chlorophyll-a) and horizontal movements (external forcing due to the wind and internal due to the morphology of the seabed). from the observation of the results related to this data acquisition campaign, there seems to be a prevalence of the vertical movement, driven by the intrinsic characteristics of the water masses, compared to external forces causing horizontal movements. Being able to observe and record the interactions between the physical and biogeochemical parameters of water in the context of the critical Svalbard environment at such a level of both spatial and temporal detail is essential to understand these water masses movements, study their origin, and follow their effects. Using PROTEUS, it was therefore possible to carry out a complete characterization of the environment near the glacier front, acquiring in situ data with space/time resolutions not obtainable with traditional observation methods and highlighting fundamental phenomena related to the water mass stratification not previously recorded at such a level of detail.
As for the results obtained from the campaign on the Scoglio d’Affrica, it was previously shown that integrating data from different sources (video images, telemetry of the robotic platform, and acoustic MBES data) make it possible to identify different types of seabed and observe whether there are associated gaseous emissions or not. All these observations, summarized in
Figure 11 and in
Table 2, were used to elaborate the following figure (
Figure 13). This thematic map was created by integrating information from different sources: the bathymetric map obtained from the processing of acoustic data from MBES acquired by the Hydrographic Institute of the Italian Navy (IIM), the map showing the classification of the morphologies of the seabed as described in [
40], and the morphological information at a high level of detail obtained from the video images acquired with the ROV. The interpretation of the map is supported by the results obtained from the geochemical analysis carried out in the area [
44]. The presence of specific morphological structures can help in understanding the origin of the emissions, typically in the sediment and not from fractures in the rock, and also to retrieve information about the porosity of the seabed, as for the same type of seabed and substrate the emissions are different according to it.
From this thematic map it is possible to make some assumptions about the age of the morphological structures observed in this area, Points A, B, C and F, located near the summit of the volcanoes (shallowest area) consist of recently formed morphologies. Point E, in an area at an intermediate depth, is made up of older sediments that flowed along the slope. Point D, on the other hand, is made up of much older sediments, now completely covered with Posidonia oceanica. Moreover, from a geochemical point of view, there is a detailed analysis of the area surrounding point F, described in [
44]. As previously stated, this point is located near the northern mound in an area characterized by a sandy bottom with large scattered rocky blocks. Observations made in 2018 showed that the gas was emitted as large bubbles (up to 15 cm in diameter) from conical mud mounds. In the mud volcano area, porewater and seawater samples did not show significant differences from the water samples taken outside the area. The pH was around 8.00 and salinity was about 38 PSU [
44]. In addition, the gas chemistry of the collected samples was typical of mud volcanoes ([
52,
53]), with methane as the prevalent gas component (>95 vol%) and minor gases, including carbon dioxide, nitrogen, and heavier alkanes and helium, whereas CO was present in trace amounts. To assess the origin of the hydrocarbon gases, the stable isotopes as well as the molecular composition were analyzed. δ
13C CH
4 values from −30‰ to −50‰ were interpreted as thermogenic gases. Moreover, the samples collected at Scoglio d’Affrica were extremely depleted in
3He, with
3He/
4He ratio values showing typical values for a gas crustal emitted from a geological setting in which the radiogenic helium component is strongly dominant [
44]. Carrying out our observations in the same area but one year later, we still saw emissive activities but of a different nature: the bubbles were intermittent and of reduced size. The type of emission depends on both the porosity of the bottom and the amount of gas in the substrate. from the comparative analysis between the results known in the literature and the observations made with the ROV, it is possible to advance some hypotheses on the temporal evolution of the emissive sites that can evolve either toward a depletion of the emission activity with time (fewer and smaller bubbles emitted), or toward an accumulation of gas in the substrate that increasingly struggles to find a way out and which could then again manifest itself suddenly with a violent explosive activity. In the latter case, the system could have much greater emissive capacities than those observed experimentally with the ROV and this could be an important source of hazard. For all these reasons, continuous and integrated monitoring of these emission sites is of fundamental importance. Moreover, from the analysis of the video data it was possible to obtain a semiquantitative analysis of the emissions by estimating the amount of gas emitted. This fact creates an added value to the ROV data compared to the observations made through the use of human operators: by using the ROV in hovering mode, in fact, it is possible to lengthen the time spent at each point of interest in order to acquire data for an estimate of the emission volumes.
Summarizing, the observing and monitoring activities carried out in complex and critical environments like the ones described above underline that two main aspects are fundamental:
- -
the choice of the instruments and sensors to be mounted on the robotic platforms must be able to guarantee certain performances (in time and space) and at the same time must be able to operate even in demanding conditions and with power requirements that are sustainable;
- -
the implementation of sampling procedures that are flexible and that can be adapted according to the specific working environment and the measurements to be obtained.
The preliminary results described above are very important because they show that, even in situations far from the “ideal operating conditions”, it is still possible to characterize the environment and detect the presence of transient phenomena that in specific cases can be interpreted as hazard precursors for the implementation of alarm procedures.
5. Conclusions
The work described in this paper has an interdisciplinary value as it analyzes the difficult task of carrying out measurements and observations of transient phenomena in critical environmental conditions from different points of view. The metrological approach is a central point of this work as it is fundamental to characterize the measurements and necessary to give an interpretation of the results obtained in a rigorous way in terms of comparability, consistency, and traceability and to identify specific phenomena that can be seen as “anomalies” in the trend of the data.
From a metrological point of view, specific characteristics are also required in terms of repeatability, accuracy, and resolution of the measurements made. This is a particularly critical point and very often it is not possible to reach certain minimum levels necessary to obtain valuable results from the collected data, especially if traditional methods applied in critical contexts are used. A possible solution to this problem derives from the introduction of robotic autonomous vehicles: these can be exploited to obtain data with characteristics of precision and resolution that allow researchers to obtain valuable information on the observed processes that are very often not obtainable otherwise. The development of acquisition procedures adapted to the use of robotics and guided by critical environmental constraints constitute the other fundamental element for the observation of transient processes. The two examples presented as case studies in this paper show the importance of the methods used for the acquisition of the data with a focus on measurements and their interpretation from the point of view of environmental science. By applying the methodologies developed and described in this work, valuable results were obtained: stratification processes of the water masses, highlighting internal effects due to the morphology of the seabed that created boundary effects, were observed with an unprecedented level of detail. These processes refer to the case study in Svalbard but, suitably adapted and integrated with geochemical and acoustic data, they can be applied to the identification of gaseous emissions in the Tyrrhenian Sea.
In addition, the methodological and data analysis approach used can be extended and also applied in other case studies and in other environmental situations where the quality of the data and its interpretation, also from a metrological point of view, are fundamental. An example of this possible adaptation of the observing methodologies used can be the identification of the presence of Posidonia oceanica on the seabed. The presence of this plant on the seafloor can be identified as an “anomaly” in the captured video images or in the acoustic spectra compared to the data acquired in areas where the Posidonia is not present. The identification approach, in principle, has characteristics similar to that used to identify the presence of a plume of melt water from a glacier or the presence of gas bubbles in the water column. This example shows, once again, how the work described and proposed in this paper provides an approach to the observation of the environment focused on the measurement and its interpretation, in order to obtain the characterization of extremely localized events in space and time with extremely high levels of detail.
Despite autonomous platforms already providing key observations for environmental assessment, further advances in autonomous systems are required to meet the growing ocean observation needs in different scientific fields like biology and biogeochemistry as well as seabed mapping and deep ocean and Polar exploration, together with the growing needs for real-time data. The development of new observation technologies and techniques will advance our understanding particularly of transient events, such as the ones described in this work, but are also extendable to other kind of marine phenomena that require better and faster observation techniques. The use of robotic systems as fundamental data-gathering tools by scientists allows for new perspectives and a greater understanding of the planet and its processes by also taking advantage from the possibility to mount sets of tools on board for a complete characterization of environments, even critical ones, with spatial and temporal resolutions not otherwise obtainable, as extensively described in this paper.
A further and important step forward toward an integrated observation of the marine environment is to have significantly improved interoperability of sensors, systems, and data. The use of standards and best practices for observations make it easier to operate efficiently, share results, and exploit existing data, promoting interoperability and reproducibility of the results obtained. In this perspective, the use of autonomous platforms, already used in a wide range of time and spatial scales for the measurement of physical and biogeochemical variables, allows for the acquisition of a greater volume of standardized and high-quality data, improving comparability and reducing uncertainty. To effectively achieve this goal, it is necessary to combine the skills acquired in the traditional fields of metrology with the new interdisciplinary and multidisciplinary environmental observation strategies, fostering collaborations between communities to develop better measurement standards, perform comparisons, and establish metrological guidelines and operating procedures for observation networks.


