Article

Hydro-Saline Dynamics of a Shallow Mediterranean Coastal Lagoon: Complementary Information from Short and Long Term Monitoring

1
Tour du Valat Research Institute, Le Sambuc, 13200 Arles, France
2
Mediterranean Institute of Oceanography (MIO), Université de Toulon AMU, CNRS/INSU, IRD, UM 110 Toulon, France
3
Université de Pau, Pays Adour-E2S UPPA, SIAME, Anglet, France
4
Université Aix Marseille, CNRS, IRD, INRA, Coll France, CEREGE, Aix-en-Provence, France
5
National Nature Reserve of Camargue, National Society for Nature Protection (SNPN), La Capeliere, 13200 Arles, France
*
Author to whom correspondence should be addressed.
J. Mar. Sci. Eng. 2021, 9(7), 701; https://doi.org/10.3390/jmse9070701
Submission received: 2 April 2021 / Revised: 12 June 2021 / Accepted: 22 June 2021 / Published: 25 June 2021

Abstract

:
The Vaccarès Lagoon System, located in the central part of the Rhône Delta (France), is a complex shallow coastal lagoon, exposed to a typical Mediterranean climate and a specific hydrological regime affected by man-controlled exchanges with the sea and agricultural drainage channels. In this article, we report the results obtained by a series of monitoring programs, with different spatial and temporal resolutions. Long-term datasets from 1999 to 2019 with data collected on a monthly basis and a high spatial resolution highlighted the significant spatial heterogeneity in salinity regimes, and helped to determine the long-term evolution of the total mass of dissolved salt. High-frequency surveys allowed to characterize the water levels and salinity dynamics seasonal response to (i) the exchanges with the Mediterranean Sea, (ii) the exchanges with agricultural drainage channels, and (iii) the rain and evaporation. In addition, wind effects on salinity variations are also explored. This work shows how different spatial and temporal monitoring strategies provide complementary information on the dynamic of such a complex system. Results will be useful and provide insight for the management of similar lagoon systems, accommodating for both human activities and ecological stakes in the context of global change.

1. Introduction

Coastal lagoons are generally defined as shallow water bodies, separated from the sea by a barrier, and connected to the sea by one or more restricted inlets (channels, hydraulic structure) [1,2]. They occupy around 13% of the coastline worldwide and about 5% of the European coast, where they are particularly prevalent around the Mediterranean Sea [3]. Mediterranean coastal lagoons are highly productive ecosystems and are considered to be the most valuable systems of the Mediterranean coastal area, with crucial ecological, historical, and socio-economical importance [4,5].
Coastal lagoons are complex systems that can exhibit strong temporal and spatial variations in water levels, flows, and salinities. These variations are the result of the interaction between freshwater and seawater inflows, rain, evaporation, and wind-driven forces, which vary over a wide range of time-scales. These interactions largely control the biogeochemical behavior of coastal lagoons, with consequences for (i) the ecological functioning of these systems [6,7,8,9,10,11] and for (ii) human activities, such as commercial fishing, aquaculture, recreation, and tourism [4].
The freshwater inflow from the watershed and the temporary or permanent nature of the exchanges with the marine environment, in addition to the high evaporation rates in this area, give Mediterranean lagoon waters a variable salinity ranging from oligohaline to hyperhaline waters [12]. Hypersalinity occurs in coastal lagoons that have limited connectivity with the sea and in which freshwater input is lower than the evaporation rate. Examples in the world include Lagao de Araruama in Brazil [13], Laguna Madre in the USA [7], the Caimanero-Huizache lagoon system in Mexico [14], Mar Menor lagoon in Spain [15], and Coorong lagoon in Australia [16]. High salinities are particularly favored by the confined nature of some lagoons, especially for choked lagoons [17].
Mediterranean coastal lagoons have been identified as hotspots of climate change and vulnerability to environmental and anthropogenic pressures [18], which can deeply modify the ecological status of these transitional areas [19]. In order to implement sustainable management practices of these lagoons, it is of primary importance to study their hydro-saline dynamics given their impact on their ecological functioning. It is in particular critical to understand the influence of climatic and anthropogenic stressors on these dynamics, considering all the short-, medium- and long-terms stakes. Due to the interannual variability of the Mediterranean climate, studying the hydro-saline dynamics of a Mediterranean coastal lagoon and its responses to different anthropogenic and climatic stressors implies acquiring data over several years or decades. Moreover, given the spatial variability often encountered in these lagoons in terms of water levels and salinity, it is necessary to implement monitoring programs providing the best possible spatial resolution. Due to temporal and spatial constraints, the sustainability of such monitoring programs over the long term is often conditioned by the implementation of measurement protocols that are simple and economically viable in terms of human resources necessary for their implementation, the purchasing and maintenance cost, as well as the lifespan of the equipment used. Long-term hydro-saline monitoring programs exist in several lagoons [20,21]. However, such programs on choked lagoons are rare [22], due to several challenges. The significant evaporation and limited exchanges with the sea often result in the drying up of large surface areas within these lagoons, in addition to large areas displaying reduced water heights (i.e., <10 to 20 cm). Hence, under windy conditions, wave height can become equivalent to the height of the water column. These lagoons also exhibit very large variations in salinity, with the possible crystallization of salt in certain areas. The low water heights combined with high salinities complexify the implementation of certain types of conventional monitoring, such as the use of CTD (“Conductivity, Temperature, Depth”) probes, which may become emerged or exposed to salinity levels outside of their measuring range. Acquiring data to study the hydro-saline dynamics of this type of lagoon, therefore, requires finding a compromise between different types of monitoring.
Using the example of a shallow and choked Mediterranean coastal lagoon, namely the Vaccarès Lagoon System, this article illustrates how combining different types of monitoring programs, with diverse spatial and temporal resolutions, allows the study of hydro-saline variations and provides a first analysis on the influence of the various anthropogenic and climatic stressors.
The paper is organized as follows: Section 2 presents the study area, the data, and the methodology used to assess the hydro-saline dynamics of the Vaccarès Lagoon System in terms of water level, salinity, and mass of dissolved salt. Section 3 outlines the results of these different measurements, and their contribution to the understanding of the hydro-saline dynamics of this lagoon, as well as the influence of various anthropogenic and climatic factors. Section 4 takes advantage of the results to provide recommendations, as to the implementation of field measurements on this type of lagoon to characterize its hydro-saline dynamics. Results are also exploited to derive recommendations for the sustainable management of this type of environment on different time scales.

2. Materials and Methods
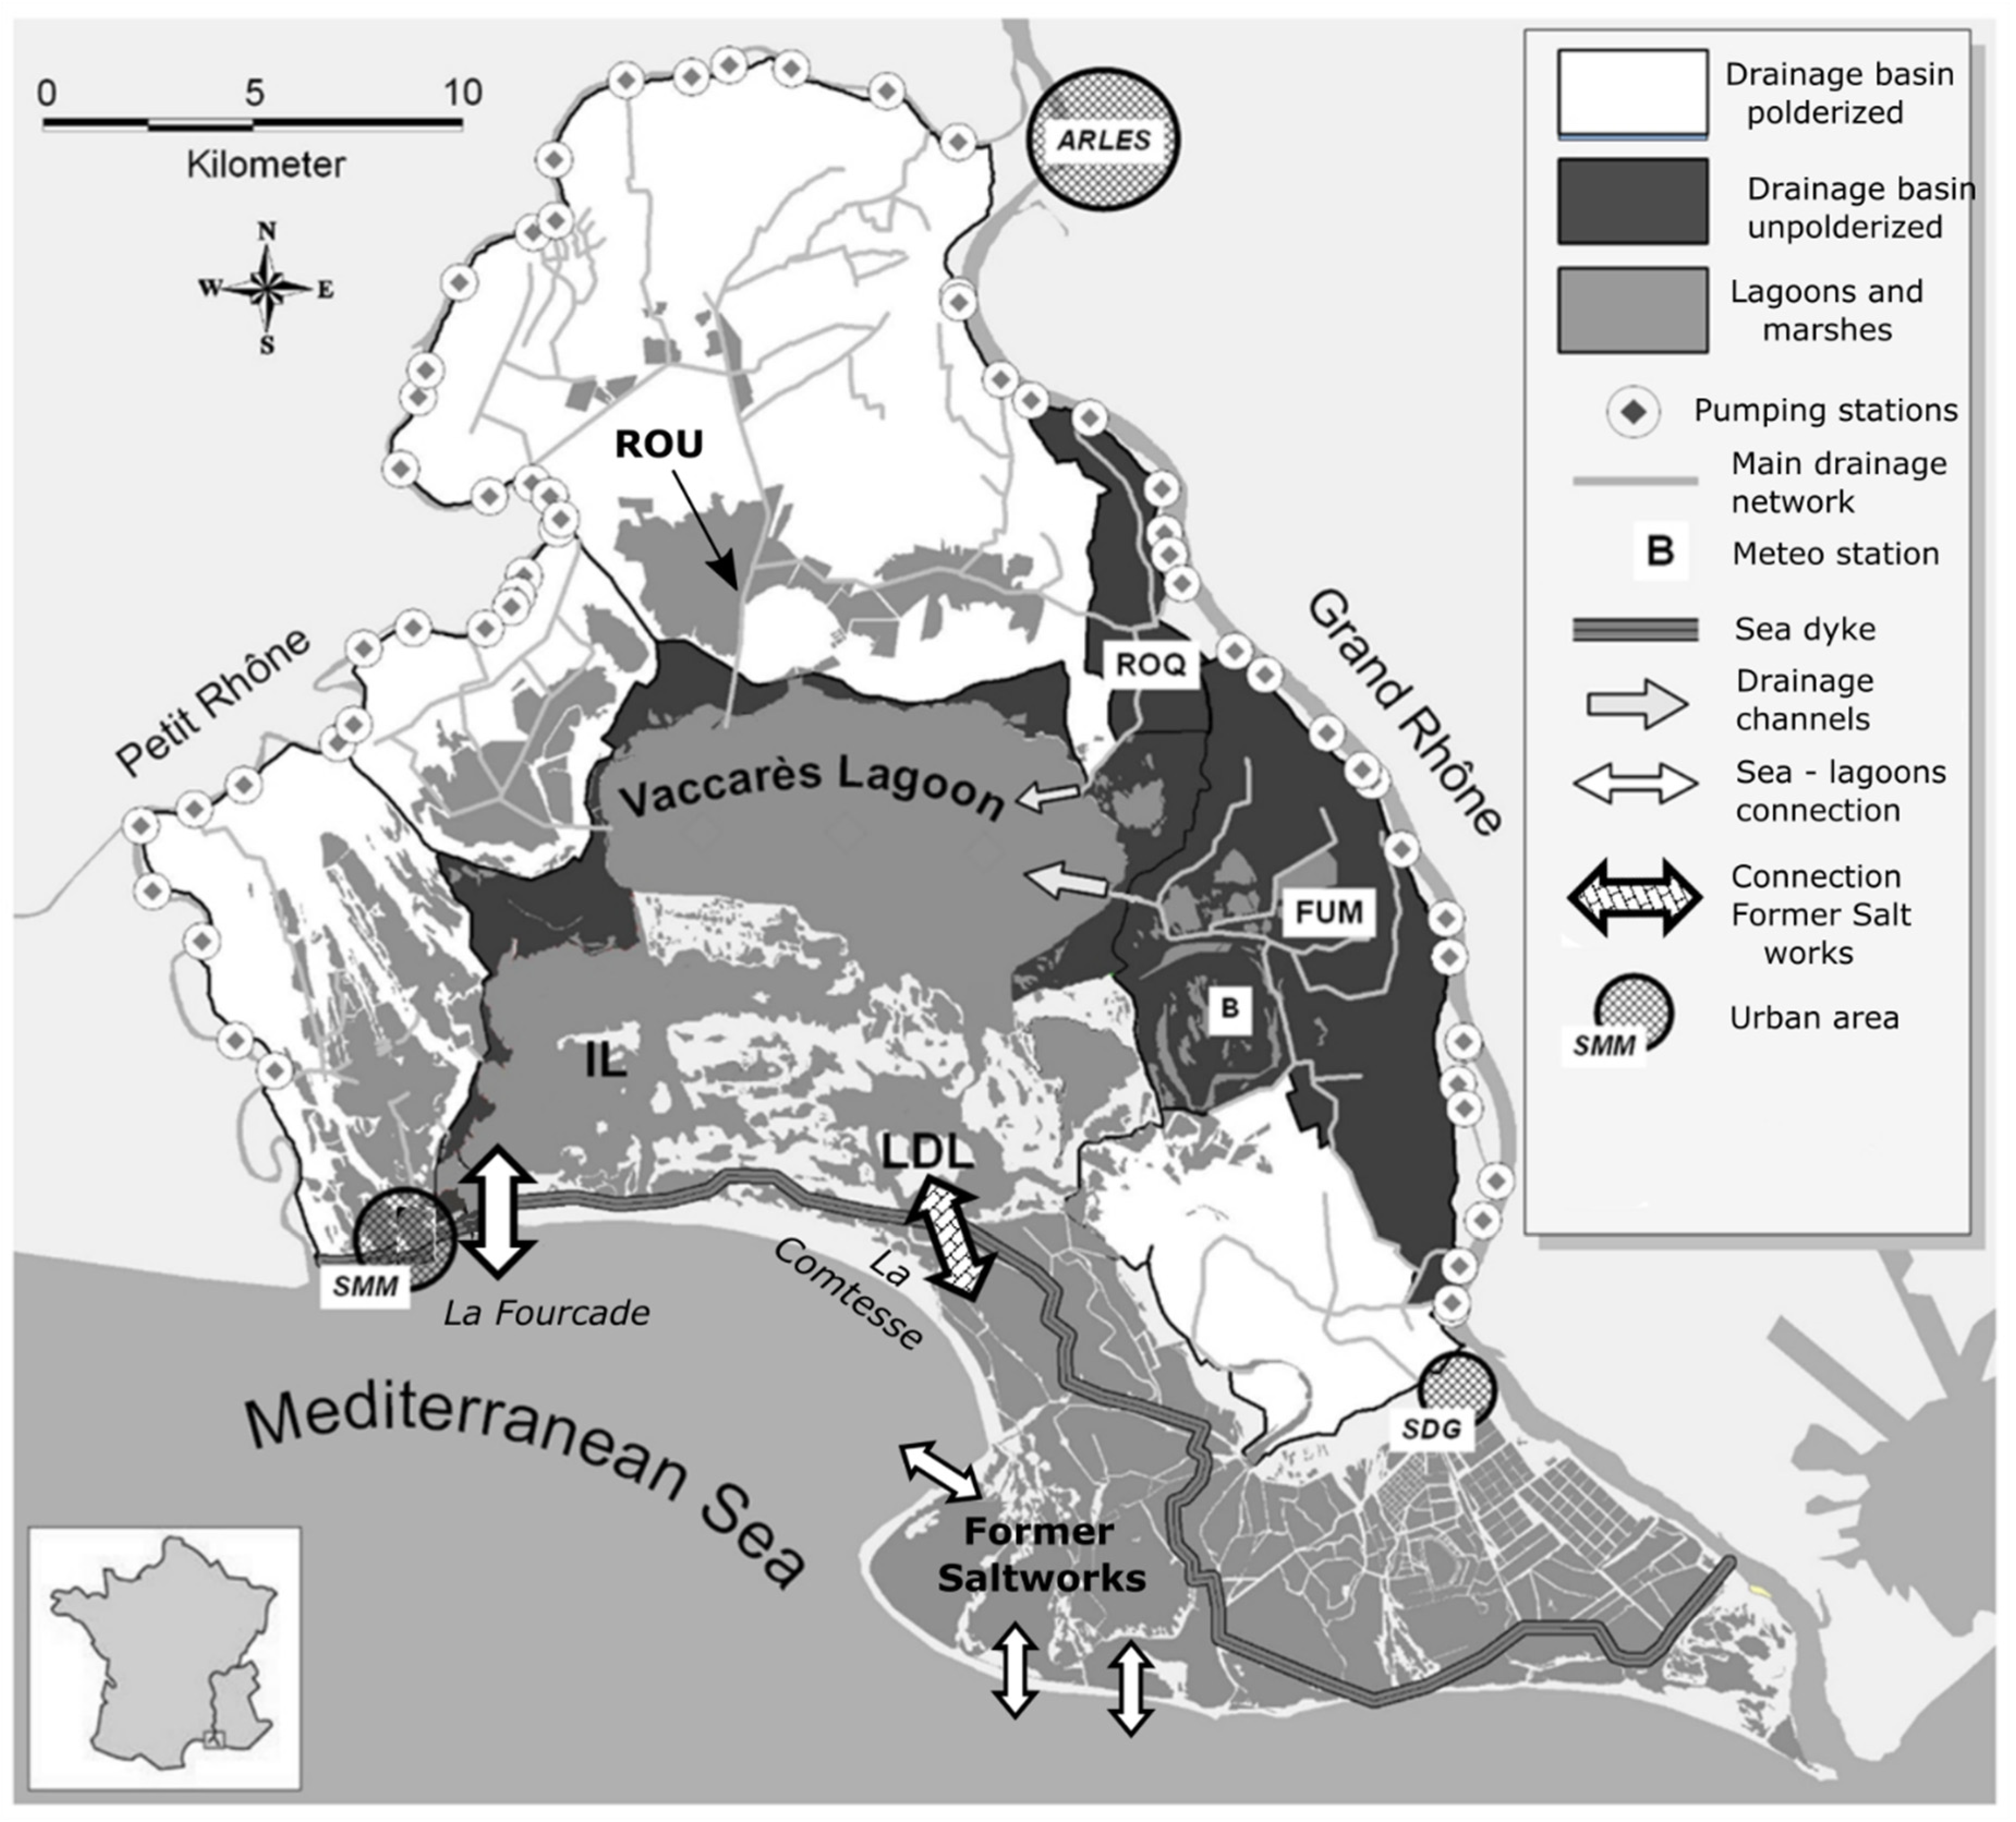
2.1. Study Area

The Ile de Camargue basin is the central part of the Rhône Delta in the South of France, situated between the two branches of the Rhône River (see Figure 1). The high-lying parts of this 800 km2 area are devoted to agriculture (420 km2) consisting mainly of rice fields, whereas wetlands, brackish lagoons, and marshes occupy the low-lying areas [23]. The aquatic ecosystem in the center of this area is internationally recognized as a biosphere reserve as part of UNESCO’s Man and Biosphere Programme, and as a Ramsar site. It is of international significance for nesting, staging, and wintering waterbirds [24]. This ecosystem includes three interconnected lagoons, which form the Vaccarès Lagoon System. These interconnected lagoons consist of the Vaccarès lagoon (65.9 km2, average 1999–2019 salinity 16 PSU), the Impériaux lagoon (IL on Figure 1; 36 km2, average 1999–2019 salinity 33 PSU), and the Lion/Dame lagoon complex (LDL on Figure 1; 8.3 km2, average 1999–2019 salinity 25 PSU).
The Vaccarès Lagoon System is separated from the Mediterranean Sea by a dyke (Figure 1). Direct exchange with the Mediterranean Sea only occurs in the Impériaux lagoon (IL), through a hydraulic structure at La Fourcade, which consists of 13 manually operated sluice gates of relatively moderate size (individual widths ranging from 1 to 1.2 m). The management of these gates is complex, involving a range of different stakes, in particular fish recruitment, storm surge management, and salinity. Throughout the year, a specific water management commission meets about every 2 months to define the sluice gates’ management rules to be applied according to current hydro-saline conditions in the lagoons. This commission is composed of representatives of the state, managers of the different lagoons pertaining to the Vaccarès Lagoon System, and a range of users (professional fishermen, farmers, ...). To give an order of magnitude, averages calculated from 2010 to 2020 indicate that all sluice gates are closed for about 40% of the year (147 days), up to two sluice gates are opened about 28% of the year (101 days), and at least three sluice gates are opened for about 32% of the year (117 days). Over the 1999–2007 period, the “sea to lagoons” daily average volume is about 39,000 m3·day−1, and the “lagoons to sea” daily average volume is about 48,000 m3·day−1.
Although the seashore of the Rhône Delta is subject to a micro-tidal regime (the difference between the lowest and highest value of astronomic tide is 0.42 m, see [25]), the “Vaccarès lagoon system” is not impacted by a tidal regime, [26], due to the small size of the sluice gates in comparison with the area of the Vaccarès Lagoon System, and to their management, with the opening of more than five sluices carried out to decrease water level and mass of salt into the lagoons (flows from the lagoons into the sea).
The Lion/Dame lagoon can exchange water with another complex of lagoons, “the Former Saltworks” [27], through a hydraulic structure at La Comtesse (Figure 1), which consists of eight manual sluice gates of relatively moderate size (individual width of 1.5 m). Prior to July 2010, all the sluice gates of this structure were permanently maintained closed. Since July 2010, one sluice gate has generally been open, except during storm surges when it is closed. “The Former Saltworks” are composed of several lagoons, most of which are connected to each other by hydraulic structures. Several openings (locally known as “graus”) into the Mediterranean Sea exist in the southernmost parts of the Former Saltworks (Figure 1). Hence, under certain conditions (opening of all the hydraulic works of the Saltworks and entry of sea water in their southernmost part), indirect exchanges between the Lion/Dame lagoon and the sea can occur.
Agricultural land borders the lagoons to the north and southeast, and is mostly devoted to intensive flooded rice cultivation. The rice fields are irrigated by pumping stations located on both arms of the Rhône River during the cropping season (from mid-April/early May, to mid-September/early October). In the unpolderized agricultural area (112 km2) in the northeastern part of the Ile de Camargue and around the Vaccarès lagoon, the runoff from the rice paddies is discharged directly into the lagoon system through two drainage channels (Fumemorte (FUM) and Roquemaure (ROQ), see Figure 1). Over the 1999–2007 period, the daily average volume discharged into the Vaccarès lagoon via the Fumemorte channel was about 115,000 m3·day−1. In contrast, in the northern and southeastern parts, the runoff from 310 km2 of polderized rice paddies is pumped back to the Rhône River or to the Mediterranean Sea. Occasionally, a portion of the runoff from the polderized rice paddies can be discharged directly into the lagoon system through the Rousty channel (ROU), see Figure 1.
Water management in the Vaccarès Lagoon System is very complex, involving many stakeholders whose interests can diverge. The main objectives of the management implemented are the following: With regard to salt dynamics, management practices aim to avoid a sustained increase in the total mass of dissolved salt in the lagoons, seeking to remain around a threshold value. Regarding water levels, management aims to both (i) prevent water levels from being too high to prevent flooding of surrounding areas and erosion of the lagoon banks, as well as to facilitate agricultural drainage, and (ii) prevent water levels from being too low (and salinities too high) to allow fishing activities to carry on in the lagoons. Finally, the management implemented seeks to carry on having a variability of water levels and salinities typical of Mediterranean wetlands, particularly in response to rainfall and evaporation. Due to variations in rainfall and evaporation from year to year, typical of the Mediterranean climate, to the shallow depths of the Vaccarès Lagoon System, and to the complexity of its hydro-saline functioning, some management objectives may not be met in certain years, creating regular tensions around water management in this area, which is still subject to debate.

2.2. Hydro-Saline Dynamic Assessment

The hydro-saline dynamic of the Vaccarès Lagoon System was investigated through the spatial and temporal variations of: (i) water level, (ii) salinity, and (iii) total mass of dissolved salt in the different lagoons of this system.
The total mass of dissolved salt was included in the variables studied for several reasons. It is a quantity that will increase or decrease depending on the exchange of water between the lagoon and the sea, and, for some lagoons, also depending on underground flows. Evaporation and precipitation will not directly change this mass. Conversely, for a given mass of salt in a lagoon, the salinities measured in a particular year will be strongly linked to evaporation and rainfall observed in that year, as well as to the water inlets of the lagoon’s channels or rivers. The mass of dissolved salt and salinity then provides complementary information when dealing with the saline dynamic assessment of Mediterranean coastal lagoons.
The mass of dissolved salt gives information on the medium and long-term evolution of the salt dynamics, and on the dynamics of the exchanges with the sea. The knowledge of the evolution of this mass also allows, in the case where the exchanges between the lagoon and the sea are managed by man, to study the consequences of management choices on the saline dynamics of these lagoons. The knowledge of the evolution of salinity, more easily measurable than the mass of dissolved salt because it does not require the knowledge of the volumes in the lagoon, will allow to bring elements on the spatial saline dynamics of lagoons. In addition, there are usually no known relationships between the tolerance of animal (fish) or plant species to the mass of dissolved salt, while these relationships are often known for salinity, whether in terms of average value or tolerance threshold.
Knowledge of the evolution of both the mass of dissolved salt and salinities also provides information on the parameters that influence the lagoons’ saline dynamics. For example, if a lagoon shows changes in salinity over several years, while the mass of dissolved salt varies little, the explanations will be sought in the dynamics of rainfall and evaporation, or unsalted water inflows from channels or rivers connected to the lagoon. On the other hand, if the mass of dissolved salt also varies over the period considered, the observed variations in salinity will surely be partly linked to the modification of exchanges with the sea or groundwater.
Water level, salinity, and total mass of dissolved salt in the different lagoons were either obtained directly from field measurements or calculated from these measurements. The different datasets and calculation methods used for their estimate are detailed below.

2.2.1. Water Level and Salinity Variations in the Lagoons

Regarding water level and salinity in the different lagoons, several datasets with different spatial and temporal resolutions were used:
(i)
Salinity measured monthly from 1999 to 2019 at locations 1 to 11 (see Figure 2). For these field campaigns, conductivity was measured with a WTW TetraCon 325 conductivity meter about 20 cm below the water surface and converted to salinity using the international oceanographic table [28]. For conductivities exceeding 60,000 µS/cm, one or several successive dilutions were performed with distilled water to fall within the validity range of the equation to derive salinity from conductivity.
(ii)
Data from field instruments recording every 5–15 min and averaged on an hourly basis between 1999 and 2019 at three locations close to the connections with: (i) the Sea (location 12, Figure 2), (ii) “the Former Saltworks” (location 15, Figure 2) and (iii) the Fumemorte drainage channel (location 14, Figure 2). During this period, water levels were monitored using float-operated Thalimedes Shaft Encoders with integral data logger from OTT Hydrometry, with the exception of location 12 where an OTT Hydrometry R 20 scrolling paper water level gauge was used for 1999 and 2000.
(iii)
Water level and salinity data recorded by CTD probes from OTT Hydrometry recording every 5–15 min and averaged on an hourly basis between 2017 and 2019 (with the exception of several periods of non-operation due to either water levels being too low for the conductivity sensor to remain immersed, salinity values being outside the instruments’ range, or instrumental problems such as clogging of the probe or internal battery problems), at five locations in the lagoons (locations 18, 19, 20, 21, and 22, Figure 2). Another CTD probe was installed in 2019 in one sluice gate of the Comtesse hydraulic structure to measure the salinity of the corresponding flow (location 17, Figure 2). All CTD probes were located about 10 cm above the bottom of the lagoons or of the sluice gate.

2.2.2. Total Volume and Dissolved Salt Mass Variations

To evaluate the total volume of water in the lagoons from the water levels, we generated a Digital Elevation Model (DEM) of the Vaccarès Lagoon System using the existing bathymetric data.
The bathymetric data was obtained from successive field campaigns between 1999 and 2013 conducted on the different lagoons, and completed in 2010 by one terrestrial LiDAR campaign for the outer edges of the lagoons and the inner islands. The total number of measured points was approximately 14,500. The 10 m resolution DEM (Figure 3) was obtained by interpolating between individual measurements using a TIN interpolation (ArcGIS 10.4 raster interpolation tool, from ESRI).
The total volume of water in the lagoons V t o t (in m3) was calculated for the period 1999–2019 with Equation (1):
V t o t = i = 1 N max ( W L Z F i ; 0 ) A i
with:
-
N the total number of cells of the DEM;
-
W L the mean water level in the Vaccarès Lagoon System, which is the average value of the water levels measured at the locations 12, 14, and 15 (see Figure 2);
-
Z F i the interpolated bathymetry of cell number i; and
-
A i the area of cell number i.
The total mass of dissolved salt in the Vaccares Lagoon System M t o t (in kg) was calculated with Equation (2):
M t o t = i = 1 N max ( W L Z F i ; 0 ) S a l i A i
with S a l i the salinity of cell number i.
For each cell of the DEM, the local salinity S a l i was obtained by using the Spline with barrier interpolation tool (ArcGIS 10.4) between the monthly salinity measurements (see Figure 2).

2.2.3. Water Fluxes between the Vaccarès Lagoon System and (i) the Mediterranean Sea, (ii) “the Former Saltworks”

To study the influence of “Sea-lagoon” and “Former Saltworks-lagoon” exchanges on the hydro-saline dynamics, and knowing that in the management implemented, each sluice gate is either totally closed or totally open, we estimated the hourly volumes of water exchanged through the hydraulic structures at La Fourcade and La Comtesse, with the flow Equation (3) (originally presented in [6]) and Equation (4):
Q i = ( 2 3 ) 3 2 K i L i g H i 3 2 [ 1 ( H i H i ) 3 2 ] 0.385
when the sluice gate is totally open.
Q = i = 1 13 Q i
with:
-
Q i the flow of the sluice gate i (m3·s−1);
-
L i the width of the sluice number i (m);
-
H i the upstream water height above the sill of the sluice gate i (m);
-
H i the downstream water height above the sill of the sluice gate i (m); and
-
K i the discharge coefficient of the sluice number i (−). Values of the different K i were determined for the Fourcade and Comtesse structures with flow measurement campaigns, using an electromagnetic digital current meter (NAUTILUS C 2000, from OTT Hydrometry).
-
Q is the total flow estimated for the 13 sluice gates (m3·s−1),

Water Level and Sluice Gates Opening Data for the Fourcade Structure

For H and H’, we used for the sea level data the measurements obtained from two probes successively located in the Sea near the structure (location 13, Figure 2). The first probe was a OTT Hydrometry R 20 scrolling paper water level gauge, with measurements in 1999 and 2000. The second probe was a float-operated Thalimedes Shaft Encoders with integral data logger from OTT Hydrometry, with measurements every 5 min from 2001 to 2019. Water level data in the lagoons are those recorded by the probes at location 12, see Section 2.2.1.
Opening data of the 13 sluices gates of the Fourcade structure were provided by the technical services of the town of Saintes-Maries de la Mer (SMM in Figure 1), in charge of their management.
These data were used to calculate the hourly discharge through the hydraulic structures at La Fourcade with Equations (3) and (4).

Water Level and Sluice Gates Opening Data for the Comtesse Structure

For H and H’, we used for the water level data in the southern part of the Comtesse structure the measurements obtained from the probe in location 16 (Figure 2), located about 1 m from the structure. The probe was a float-operated Thalimedes Shaft Encoder with integral data logger from OTT Hydrometry, with measurements in 2019 every 15 min and averaged on an hourly basis. Water level data in the lagoons are those recorded by the probes at location 15, see Section 2.2.1.
Opening data of the sluice gates of the Comtesse structure were provided by the National Society for Nature Protection (SNPN), in charge of their management.
These data were used to calculate the hourly discharge through the hydraulic structures at La Comtesse with Equations (3) and (4).

2.2.4. Water Fluxes between the Vaccarès Lagoon System and the Agricultural Drainage Channels

Water flows from the Fumemorte drainage channel into the Vaccarès lagoon were monitored every 30 min from 1999 to 2007 using an automatic ultrasonic flowmeter “UF 2100 CO” from Ultraflux. For the Roquemaure channel, no equivalent measuring device was installed during this period. However, [29,30] estimated that the flow of this channel was no more than 20% of that of the Fumemorte.
In this study, the Fumemorte channel, which is the main contributor to the entrance of drainage water in the lagoons, was then considered to be representative of the influence of drainage water on the hydro-saline dynamics of the lagoons.

2.2.5. Evaporation and Rainfall

During the period from 1999 to 2019, wind (speed and direction), air temperature, precipitation, solar irradiance, relative humidity, and duration of insolation were measured continuously at station B operated by Meteo France (see Figure 1). All these variables were measured on an hourly basis.
Daily evaporation intensity was derived from these measurements using the Penman method [31]. Daily evaporated volumes were then estimated from the daily evaporation intensity and the water-covered surface area on the corresponding day. This water-covered surface area was estimated using the average water level measured with probes at locations 12, 14, and 15 (Figure 2), and the DEM developed in this study.

2.2.6. Estimation of the Order of Magnitude of All Unmonitored Water Inputs and Outputs

To estimate an order of magnitude of the “unknown” water inflows and outflows of the system, we computed a volume balance. In the case of the Vaccarès Lagoon System, these unquantified volumes, referred as “Other” in the paper, include:
-
agricultural drainage inflows through the Roquemaure and Rousty channels (“ROQ” and “ROU” in Figure 1);
-
seasonal and short-lived agricultural drainage inflows from private estates, located mainly around the Vaccarès lagoon and west of the Impériaux (in dark gray in Figure 1);
-
rainfall runoff from areas along the Vaccarès, Impériaux, and Lion/Dame lagoons;
-
seasonal and short-lived drainage of surrounding marshes into the lagoons; and
-
exchanges of groundwater and surface water.
These volumes were estimated with Equation (5). This estimate was carried out on several periods of the years 1999–2007, for which we had the most data available. Since some of the physical quantities considered were only available on a daily time scale (evaporation), the terms in Equation (5) were computed on a daily basis.
i = 1 N V O t h e r s i = Δ V l a g o o n s i = 1 N V p r e c i p i t a t i o n s i + i = 1 N V e v a p o r a t i o n i i = 1 N V S e a > L a g o o n s i + i = 1 N V L a g o o n s > S e a i i = 1 N V F u m i
With:
-
N the duration of the considered period in days (typically a year),
-
i = 1 N V O t h e r s i (m3): the cumulative volumes, over the N days, that are not due to precipitation, evaporation, sea-lagoon exchanges, and Fumemorte inflows.
-
Δ V l a g o o n s (m3): the change in volume in the Vaccarès Lagoon System between the beginning and the end of the period of N days, calculated as the difference between the volume at the end and at the beginning of the period. To limit the uncertainty in its estimation, we chose periods beginning and ending on days when the water levels at locations 12, 14, and 15 were nearly equal (often corresponding to windless days). This allowed to limit the uncertainties on the estimation of the average water level in the Vaccarès from these three measurements, and consequently on the estimation of the corresponding volume. As much as possible, we have chosen beginning and ending dates allowing to cover a period close to one year
-
i = 1 N V p r e c i p i t a t i o n s i (m3): the cumulative volumes of rain over the N days,
-
i = 1 N V e v a p o r a t i o n i (m3): the cumulative volumes of evaporation over the N days,
-
i = 1 N V S e a > L a g o o n s i (m3): the cumulative volumes from the sea into the lagoons over the N days
-
i = 1 N V L a g o o n s > S e a i (m3): the cumulative volumes from the lagoons into the sea over the N days, and
-
i = 1 N V F u m i (m3): the cumulative volumes from the Fumemorte channel over the N days.

3. Results

3.1. Effect of Temporal Monitoring Strategy on Salinity Dynamics Assessment

For each of the three lagoons of the Vaccarès Lagoon System, the salinities measured each month were compared with those measured by the CTD probes every 5–15 min, and averaged on an hourly or daily basis.

3.1.1. Vaccarès Lagoon

For the Vaccarès lagoon, CTD probes measurements highlight that salinity can fluctuate greatly over short periods of time (Figure 4c). These variations could not be detected with the monthly data, which only provide a snapshot of the salinity at a given time (Figure 4c). Different dynamics are observed. During the rice cultivation period, as illustrated in Boxes 1 and 2 (Figure 4c), a gradient of decreasing salinity is observed from West to East. Both monthly and CTD probes data allow this gradient detection. In the western part of the Vaccarès lagoon, the salinity data from CTD probe 21 displays a dynamic close to the one that could be derived from monthly data at location 1 (Figure 2). In contrast, in the eastern part of this lagoon, the salinity data recorded by the CTD probe 22 shows large variations over short periods of time (hours, days) that monthly data from location 3 entirely fails to detect. The West to East salinity gradient, detected both by monthly and CTD probes data, is due to the entrance of freshwater from the Fumemorte channel, which is particularly significant during the rice cultivation period (Figure 4b). The high salinity variations at short time scale (hours, days) in the eastern parts are due to the additional effect of water flows and recirculation areas induced by wind in the Vaccarès lagoon, as investigated in [6]. These variations could only be detected with CTD probes data.
Outside the rice cultivation season, the dynamics are different, as illustrated in Boxes 3 and 4 (Figure 4c). Over this period, salinities are more homogenous between the western and eastern parts of the lagoon, showing a similar average value, and the gradient previously observed is no longer present. However, the salinity range in the eastern part of the lagoon is much greater than in the West. Once again, these more pronounced variations are due to the entrance of freshwater water from the Fumemorte channel, which, during this period, corresponds to rainwater drainage from its watershed (Figure 4a,b).

3.1.2. Lion/Dame Lagoons

The Lion/Dame lagoon exhibits high salinity variability over short time scales, which could not be detected with the monthly data (Figure 5). Different dynamics are observed between locations 18 and 19. Both locations show similar monthly dynamics, with simultaneous increases and decreases over monthly periods, but salinity at site 18 displays a much greater variability within short time frames than it does at site 19 (Figure 5).
This greater variability on short time scales at location 18 is evidently due to the water and salt fluxes through the Comtesse sluice gate, as evidenced in Figure 6. Salinity measured at location 18 is clearly directly affected by water and salt flows at La Comtesse, whereas this influence, although existing, is much less pronounced at location 19.

3.1.3. Impériaux Lagoon

As for the Vaccarès and Lion/Dame lagoons, data from the CTD probe at location 20 in the Impériaux lagoon provide insightful information when compared to monthly measurements, highlighting the high salinity variability in the Impériaux lagoon over short time periods, which could not be detected with the monthly data (Figure 7). For this lagoon, the instrument data presented in this study did not allow to clearly identify the drivers of these short time scales’ variations, which will need to be further investigated by the installation of additional probes in this lagoon, and the implementation of hydro-saline hydrodynamic modelling.

3.2. Specific Information from Monthly long-Term Salinity Monitoring

3.2.1. Spatial Variations in Salinity

The synthesis of salinity variations, calculated from monthly sampling data from 1999 to 2019 (Figure 8), illustrates quite well that the Vaccarès Lagoon System is very spatially heterogeneous in terms of salinity. The Vaccarès lagoon is the one with the lowest average salinities (locations 1, 2 and 3, Figure 2). The highest average salinities are found in the western and southwestern areas of the Impériaux lagoon (locations 7, 8 and 9). In the Lion/Dame lagoon, average salinities are also high and appear to be slightly lower than in the Imperial lagoon (locations 10 and 11), although this should be confirmed by additional points of measurements within this lagoon. Interestingly, a salinity gradient seems to exist between the Vaccarès and the Impériaux lagoons (locations 4, 5 and 6).
Regarding the salinity variations, sampling locations 1, 2, 3, and to a lesser extent location 4, present the lowest variations. In comparison, sampling locations 5–11 have the highest variations, with similar ranges.

3.2.2. Monthly Salinity Temporal Variations per Lagoons

Considering the monthly variations in the average salinity from 1999 to 2019 for the Vaccarès, the Impériaux and the Lion/Dame lagoons, different dynamics can be observed (Figure 9). Regarding the Impériaux and Lion/Dame lagoons, very significant variations in salinity appear each year, with a peak observed in summer. The dynamics for the Vaccarès lagoon appear to be different and show much less variation. The area between the Vaccarès and Impériaux lagoons has a similar dynamic to that of the Impériaux and Lion/Dame lagoons, but with much lower amplitudes of variation.

3.3. Complementary Contributions of Monthly and Hourly Measurements in Understanding the Hydrosaline Dynamics of the Vaccarès Lagoon System: Water Volume and Total Dissolved Salt Mass Evolution

3.3.1. Water Volumes Exchanged with the Sea, the Atmosphere and the Agricultural Watersheds, Influence on Salinity

Changes in the monthly average volumes exchanged between the Vaccarès Lagoon System and (i) the Sea, (ii) atmosphere, and (iii) agricultural watershed of the Fumemorte, illustrate quite well the influence of water management on the hydrological functioning of the Vaccarès Lagoon System (Figure 10).
The influence of agricultural activities is clearly visible, highlighted by the volumes entering the lagoons through the Fumemorte drainage channel (Figure 10a). These volumes are the highest during the rice cultivation period (from mid-April/early May, to September/early October), with maximum volumes reached in July and August. Apart from the period of rice cultivation, the volumes of water entering the lagoons through the Fumemorte channel are due to the drainage of rainfall from the watershed [32].
Management rules of the 13 manual sluice gates of the Fourcade structure are defined by a specific water management commission (see Section 2.1 of this paper) and can be adapted from year to year, but in most cases one to three sluices gates are left open as much as possible in spring and summer, to (i) allow fish recruitment in the lagoons [33], and (ii) try to maintain water levels in the lagoons suitable for professional fishing. However, considering the differences between sea and lagoons water levels during these months (see Figure 10b), this opening of sluice gates favors water flows, which are mainly from the sea into the lagoons, resulting in a significant input of salt in the Vaccarès Lagoon System over these periods. The management plan of the Vaccarès Lagoon System [34] identifies a maximum mass of dissolved salt threshold of 2.5 Mt that should not be exceeded over several years to sustain the ecological functioning of the system. Hence, when the mass of dissolved salt in the lagoons increases too much and exceeds this value, the decision may be taken to close all the sluice gates. To counterbalance this increase in the mass of dissolved salt in the lagoons in spring and summer, water exchanges from the lagoons to the sea are generally favored from mid-November to March/April (Figure 10a) to reduce it. Particular attention is paid, however, not to have too much water flowing out of the lagoons into the sea during these months, in order to maintain sufficiently high water levels in the lagoons that will allow counterbalancing the evaporation during the following spring and summer, and to have salinity and water levels compatible with the various uses during this period (Figure 10a–c). During storm surges, the sluice gates are closed, preventing the water levels in the lagoons from becoming too high in order to limit the erosion of the lagoon banks, as well as the risk of flooding in the surrounding areas.
Between 1999 and 2007, the monthly salinity variations for the Impériaux and Lion/Dame lagoons are clearly influenced by the dynamics of precipitation and evaporation. For these lagoons, salinity starts to increase regularly from February, with a much more pronounced increase from June until the end of August, these 3 months corresponding to the period when evaporation is maximal, and precipitation minimal. For these two lagoons, salinity variations globally follow water level variations (Figure 10b,c). Salinity dynamics for the Vaccarès lagoon are different. During high evaporation months, and especially in June, July, and August, salinity in the Vaccarès increases only slightly relative to the increase observed in the Impériaux and Lion/Dame lagoons (Figure 10c). This is mainly due to the high quantities of freshwater drained into the Vaccarès lagoon by the Fumemorte channel during rice-growing season (Figure 10a), which tend to attenuate the increase of salinity in this lagoon. As illustrated in Figure S1 in the Supporting Information, it is interesting to see that the Vaccarès lagoon represents on average about 82% of the total volume contained in the Vaccarès Lagoon System, the Impériaux lagoon about 15%, and the Lion/Dame lagoon about 3%. Due to the position of the agricultural drainage channels to the east and northeast parts of the Vaccarès lagoon, freshwater inputs from these channels tend to mainly impact this lagoon, especially during periods of low water levels. Preliminary hydrodynamic modelling studies conducted on this system suggest that water residence times are much greater in the Vaccarès lagoon than in the Imperial and Lion/Dame lagoons [35]. The location of the Vaccarès as a receptacle for unsalted water from the channels ensuring the drainage of the agricultural watersheds, in combination with its longer residence times, tend to favor the retainment of these waters in this lagoon, and explain why the salinities are less reactive to evaporation there than in the Impériaux and Lion/Dame lagoons.
The area connecting the Vaccarès lagoon to the Impériaux lagoon (locations 4, 5, and 6, Figure 2) displays salinity dynamics similar to the Impériaux and Lion/Dame lagoons, but with lower amplitudes, due to the relative buffering provided by the connection with the Vaccarès lagoon.

3.3.2. Long Term Evolution of the Total Dissolved Salt Mass in the Vaccarès Lagoon System

The total mass of dissolved salt has varied significantly over the 1999–2019 period, reaching a minimum of 1.284 Mt in March 2012, and a maximum of 4.176 Mt in August 2019. The evolution of this dissolved salt mass does not follow any annual pattern. Overall, different trends can be observed over the 1999–2019 period. From 1999 to 2005, the mass varies slightly compared to other periods, with an average value of 1.8 Mt. From 2006 to 2008, the mass of dissolved salt dramatically increases from 1.76 Mt in February 2006 to 3.34 Mt in December 2008 (total increase of 1.58 Mt). This is followed by a significant decrease, from 3.34 Mt in December 2008 to 1.284 Mt in March 2012 (total decrease of 2.05 Mt).
From March 2012, the mass increases steadily again by approximately 1.44 Mt, to reach about 2.72 Mt in November 2014. Then, over the course of 2 months, from November 2014 to January 2015, the mass decreases very sharply, to reach an average value of 1.6 Mt with few variations until June 2016. From July 2016 to November 2018, the mass shows its greatest increase over the 1999–2018 period, with an increase of nearly 2.22 Mt. The year 2019 exhibits the highest values, with the salt mass reaching a 20-year peak at 4.176 Mt in August 2019. As illustrated in Figure S2 in the Supporting Information, it is interesting to see that the Vaccarès lagoon represents on average about 71% of the total mass of dissolved salt contained in the Vaccarès Lagoon System, the Impériaux lagoon about 25%, and the Lion/Dame lagoon about 4%.
The evolution of the dissolved salt mass in the lagoons is complex and depends on many climatic factors and water management decisions. A detailed understanding of the drivers behind this dynamic is beyond the scope of this study. However, in a simplified approach, we can see that over the last 20 years, significant increases in the dissolved salt mass have been observed mostly concurrent to low water levels in the lagoons (Figure 11b), and sea-level exceeding the water level in the lagoons for the greatest part of the year (Figure 11c). During these periods of low levels (Figure 11b) combined with high salinities (Figure 4), fishing activities cannot be sustained. The maintenance of this activity implies maintaining both sufficient water levels in the lagoons, and salinity levels compatible with aquatic life. The only available option for this is to bring seawater into the lagoons, inevitably importing high quantities of salt. Given the differences in water level between the lagoons and the sea throughout these years (Figure 11c), it appears very complicated under these conditions to decrease the dissolved salt mass by discharging water from the lagoons into the Sea, explaining the high increase in the dissolved salt mass over these years.

3.4. Estimation of the Order of Magnitude of All Unmonitored Water Inputs and Outputs

The balance in terms of volumes (Table 1) confirms the results of Figure 10 and leads to additional observations. In agreement with what has already been discussed (Figure 10), evaporation and precipitation, which correspond to natural factors not related to management choices, have a major influence in the hydrological dynamics of the Vaccarès. Water exchanges with the sea, in the current management of the Fourcade sluice gates (“regulation-induced factors”), have a less pronounced influence in terms of volumes. The influence of agricultural drainage water from the Fumemorte channel, linked to agricultural practices, has a more pronounced influence, which for two of the nine periods studied (from 17 January 2006 to 10 January 2007 and from 10 January 2007 to 29 December 2007) can even generate water inflows greater than those attributable to precipitation.
Referring to our results, it seems that the cumulative volumes referred to as “Other” are positive. This means that, although this term can incorporate water outflows from the Vaccarès Lagoon System (infiltration, …), the elements that cannot be quantified by the existing measurement network are rather elements related to water inflows into the system. Except for one period (2005), these volumes are always higher than the cumulative volume of precipitation.

4. Discussion

The Vaccarès Lagoon System is a Mediterranean coastal lagoon that illustrates well the importance of implementing different monitoring strategies to understand the hydro-saline functioning of choked lagoons. These strategies differ whether (i) short-term (e.g., “What water management should be implemented immediately to make fishing possible this year?”) or (ii) long-term (e.g., “Will future hydro-saline conditions not be permanently altered by current water management?”) stakes are considered. They relate to the spatial and temporal distribution of sampling, as well as the parameters considered to characterize the hydro-saline dynamics of these environments (salinity vs. mass of dissolved salt, etc.).
Depending on the nature (hydraulic works, natural connection) and the characteristics of their connections with the sea, their watersheds or surrounding rivers, shallow coastal lagoons can exhibit very significant spatial and temporal heterogeneity in both salinity and water level. The Vaccarès Lagoon System illustrates perfectly the complexity of monitoring the hydro-saline dynamics for such lagoons, and in particular for those that can be classified as choked. Due to its narrow connection to the sea, its shallow depth and extensive surface area resulting in large volumes of evaporated water, the Vaccarès Lagoon System presents large areas displaying reduced water heights (i.e., <10 to 20 cm) and can exhibit very high salinity with salt crystallization in areas drying out. The low water height combined with high salinity complexify the implementation of certain types of conventional monitoring, such as the use of CTD probes, which may become emerged or exposed to salinity levels outside of their measuring range. Hence, considering the large area of the Vaccarès Lagoon System and its great spatial heterogeneity, the implementation of a spatially representative continuous monitoring program using CTD probes over several decades would require a considerable effort in terms of human and financial resources. Moreover, it would present a high probability of having data gaps at some monitoring sites due to the low water height and high salinity over months presenting the highest evaporation rate. An approach consisting of monthly in situ field measurements, more perennial and more easily implemented, seems to be relevant for the long-term monitoring of the dynamics of this type of environment. However, our work shows that monthly measurements failed to detect salinity variations over short periods of time. Hence, this type of measurement, although allowing to follow the hydro-saline dynamics over the medium and long term, does not allow to study the influence of some anthropogenic or climatic stressors having an influence on a short time scale, such as wind events.
The Vaccarès study illustrates perfectly the differences in hydro-saline dynamics that can be observed within different areas of a same lagoon system. The measurements carried out on this system show differences in the hydro-saline dynamics between the Vaccarès, the Impériaux, and Lion/Dame, whether over periods of a few days or several weeks. For the Mediterranean lagoons, these differences in dynamics are related to many phenomena, such as the location of the exchange areas with the sea and with the outlets of the watersheds, and the geomorphological characteristics of the different areas of these lagoons (depth), which will make them more or less reactive to the wind, and give them a more or less confined character. The establishment of an optimal measurement network of the hydro-saline dynamics for this type of lagoon, with the best possible strategy between different spatial and temporal resolutions, is therefore an iterative process, which must be regularly updated, as knowledge of the hydro-saline functioning improves. As an example, for the Vaccarès Lagoon System, the use of two CTDs in the Vaccarès lagoon and two CTDs in the Lion/Dame lagoon seems appropriate and adequate. On the other hand, the use of a single probe in the Imperiaux does not seem relevant and should be complemented by other probes.
In addition, monthly periodic measurements do not allow to quantify water and salt fluxes at the boundaries of the lagoons with (i) the sea, (ii) the watershed, (iii) the groundwater, and (iv) the atmosphere (rain and evaporation). The quantification of these fluxes, which is crucial in understanding the influence of anthropogenic and climatic factors on the hydro-saline dynamics, requires continuous monitoring, with the long-term deployment as example CTD probes or flow meters. In addition, these continuous measurements will allow the acquisition of critical data for the development, calibration, and validation of hydrodynamic models that will provide additional information on the hydro-saline functioning of these lagoons and their responses to anthropogenic and climatic stressors [15,36,37,38].
As is the case for the Vaccarès Lagoon System, we advocate the integration of the evolution of the total mass of dissolved salt when studying the hydro-saline dynamics of coastal lagoons submitted to high evaporation rates, and particularly for confined lagoons. This variable indeed provides complementary relevant information to the monitoring of the evolution of salinity. However, studying the evolution of this salt mass has implications for monitoring strategies. It requires, in addition to the monitoring of salinities that takes into account their spatial heterogeneities, to be able to estimate the evolution of the total water volume in the system as a function of time. This implies (i) acquiring bathymetry data for the lagoon, and (ii) carrying out water level measurements that are representative of the spatial and temporal variations of these levels in the lagoon.
Acquiring bathymetry data on coastal lagoons is a substantial task, mobilizing significant human and financial resources. Moreover, for lagoon systems with strong hydro-sedimentary dynamics, which is not the case of the Vaccarès Lagoon System [39], these bathymetry data must be regularly updated.
Due to their shallow depth, Mediterranean coastal lagoons are generally strongly impacted by the wind in terms of water levels [23]. The duration and intensity of the variations of these levels can be more or less important, depending on the geomorphological characteristics of the lagoons considered, and on the local wind dynamics [26]. The time scales of these tilts generally range from several hours to a few days, requiring continuous monitoring ensured by the use of probes in different locations of the lagoon. The density of probes to be deployed to correctly estimate spatial variations in water levels is site-specific. In the case of the Vaccarès Lagoon System, an improvement that should be made to the monitoring strategy would consist of installing a greater number of level measurement probes.
Regarding the volume balance of the Vaccarès Lagoon System presented in this study, some of the estimated volumes should be considered with caution, in particular the estimates of the “Other” volumes. In Table 1, the term referred to as “Others” includes a part of the uncertainties inherent to the quantification of all other, “known”, processes (precipitation, evaporation, exchanges with the sea, water inlet of the Fumemorte channel). Among these uncertainties, those inherent to the determination of rainfall and evaporation volumes should be given careful attention. Precipitation volumes were in particular estimated based on data recorded from a single weather station. However, rainfall can be spatially heterogeneous in the Rhone delta, especially during heavy rainfall events. The uncertainties related to these rainfall volumes are thus potentially significant. They could not be estimated in this project and would require the installation of several additional rain gauges, especially in the western part of the Vaccarès Lagoon System. This recommendation to densify the precipitation measurement network applies to many coastal Mediterranean lagoons, and more globally to the existing weather station network.
There is also a large uncertainty in the estimation of evaporated volumes, which play a key role in hydrological dynamics (Table 1). This uncertainty is partly explained by the spatial heterogeneity of the wind fields [23], but mainly by the important influence of salinity on evaporation, not taken into account in this study. Indeed, the evaporated volumes were calculated using Penman’s method [31], which considers a water with salinity equal to zero. However, salinity is negatively correlated to evaporation as shown by many studies [40,41,42,43,44], which implies that evaporated volumes are consequently overestimated in our volume balance when considering the salinity of this particular system. As shown in this study, salinities in the Vaccarès Lagoon System can show significant variations over a few days. Monthly salinity measurements thus do not allow to accurately take into account the influence of salinity on evaporation for these lagoons. Given the importance of evaporation on the dynamics of coastal Mediterranean lagoons, and in particular of confined lagoons, the use of a network of continuous measurements of these salinities is essential to the development of accurate balances of volumes. However, with the limitations previously mentioned concerning the lack of reliable instrument data for shallow waters and/or heavily increased salinities, monthly salinity measurements must be continued in a system like the Vaccarès Lagoon System to provide information when CTDs salinity measurements are not available. In the specific case of the Vaccarès Lagoon System, at least one additional CTD probe should be installed in the Impériaux lagoon.
Preliminary modeling studies [45] suggest that an absence of regulation on the Vaccarès Lagoon System, including the permanent opening of the 13 sluice gates of the Fourcade, would lead to high water levels in the lagoons. In combination with the influence of wind [23,26], these high water levels would cause bank erosion and regular flooding of the surrounding areas. This work also suggests that it would lead to a significant and long-term increase in the dissolved salt mass and overall salinities. With such management practices, the system will however remain very reactive to wind on an hourly timescale [45], in terms of salinity and water levels dynamics. In cases where such management practices were to be implemented, the existing monitoring strategies, consisting of coupling monthly and continuous measurements, would then remain relevant, even if a new balance could be found between these two measurement approaches.
Continuous and periodic monitoring strategies have variable operational costs, considering both the acquisition of instruments and the human resources required to carry out the measurements (periodic measurement campaigns, regular maintenance of continuous probes and flowmeters...). An efficient and sustainable monitoring of the hydro-saline dynamics of this type of lagoon must therefore be a compromise between all these different criteria. The work presented in this article illustrates how a functional and hybrid monitoring strategy can be implemented to study the hydro-saline dynamics of a shallow Mediterranean coastal lagoon like the Vaccarès Lagoon System, and the anthropogenic factors that influence it.
The results of the different monitoring programs carried out over the 1999–2019 period show the major influence of human management on the hydro-saline functioning of the Vaccarès Lagoon System. In particular, it illustrates the impact of (i) the management of the structure connecting the system to the sea, and (ii) the influence of agricultural drainage water, resulting from the intensity of agricultural activities in the different surrounding watersheds [46]. The results also show that rainfall and evaporation are two major drivers of these dynamics. The evolution of the hydro-saline functioning of this system will therefore be very sensitive to climate change, in particular to sea-level rise, combined with the subsidence of the Rhône delta. In addition, the changes in rainfall and evaporation dynamics, with forecasts of earlier and more severe droughts in summer, will most likely affect water levels and salinity in the Vaccarès Lagoon System. The hydro-saline functioning will also be very sensitive to changes in agricultural activities in the Rhône delta, such as changes in the type of agricultural crops and their corresponding culture area, which in turn depend on various external factors (e.g., economic support). Notably, the uncertainty about future agricultural water inputs, which can be impacted by changes in the European Common Agricultural Policy, will most certainly further affect these dynamics.
With future sea-level rise and increase in evaporation, several options must be explored to limit the consequences of the associated increase in salinity in the lagoons. These options include increasing the connections between the system and the sea, in order to deconfine it, and/or bringing additional freshwater from the watersheds into the lagoons. There are however legitimate concerns about the water quality from these agricultural drainage channels, especially in terms of pesticides and nutrient inputs [47,48,49]. Increasing the amount of freshwater from these agricultural watersheds into the lagoons must therefore be associated with programs to improve the water quality of their channels. The possibility of creating new connections between the Vaccarès Lagoon System and the Rhône river, subject to predetermined flow and water level thresholds, should also be considered. Such developments would tend to resemble the functioning of a natural delta permanently connected with the sea and the river. There are, however, no easy solutions: both trade-offs and adaptive management are required. The future management of the Vaccarès Lagoon System should be based on a synthetic multidisciplinary approach aiming towards its ecological balance and socio-economical sustainability. The results presented in this article will be useful to natural resources managers and stakeholders to take management decisions not only focusing on short-terms stakes, but also considering mid- and long-term ones, accommodating for both human activities and ecological stakes in the context of global change.

Supplementary Materials

The following are available online at https://www.mdpi.com/article/10.3390/jmse9070701/s1: Figure S1: Percentage of volume contained in the (i) Vaccarès, (ii) Impériaux and (iii) Lion/Dame lagoons, in comparison with the total volume contained in the Vaccarès Lagoon System. Figure S2: Percentage of mass of dissolved salt contained in the (i) Vaccarès, (ii) Impériaux and (iii) Lion/Dame lagoons, in comparison with the total mass of dissolved salt contained in the Vaccarès Lagoon System.

Author Contributions

Conceptualization, O.B., C.P., E.L.-L., V.R., D.S., S.M. and E.M.; methodology, O.B., E.L.-L., C.P. and E.M.; software, O.B. and E.L.-L.; validation, O.B., E.L.-L., C.P., P.C., V.R., D.S., S.M., E.M., Y.C. and A.C.; formal analysis, O.B. and E.L.-L.; investigation, O.B. and E.L.-L.; resources, O.B., E.L.-L., P.C., E.M., Y.C. and A.C.; data curation, O.B., E.L.-L., P.C., E.M. and Y.C.; writing—original draft preparation, O.B., E.L.-L., P.C., C.P., V.R., D.S., S.M., E.M., Y.C. and A.C.; writing—review and editing, O.B., E.L.-L., P.C., C.P., V.R., D.S., S.M., E.M., Y.C. and A.C.; visualization, O.B., E.L.-L.; supervision, O.B.; project administration, O.B., P.C., E.M., Y.C. and A.C.; funding acquisition, O.B. and D.S. All authors have read and agreed to the published version of the manuscript.

Funding

The authors would like to thank the MAVA and PRO VALAT Foundations for funding.

Institutional Review Board Statement

Not applicable.

Informed Consent Statement

Not applicable.

Conflicts of Interest

The authors declare no conflict of interest.

References

  1. Kjerfve, B. Chapter 1 Coastal Lagoons. In Coastal Lagoon Processes; Elsevier Oceanography Series; 1994; Volume 60, pp. 1–8. [Google Scholar]
  2. Pérez-Ruzafa, A.; Pérez-Ruzafa, I.M.; Newton, A.; Marcos, C. Chapter 15—Coastal Lagoons: Environmental Variability, Ecosystem Complexity, and Goods and Services Uniformity. In Coasts and Estuaries The Future; 2019; pp. 253–276. ISBN 978-0-12-814003-1. [Google Scholar]
  3. Cromwell, J.E. Barrier Coast Distribution: A World Survey. In Proceedings of the Abstract Volume of the Second National Coastal and Shallow Water Research Conference, Baton Rouge, LA, USA; 1971; p. 50. [Google Scholar]
  4. Pérez-Ruzafa, A.; Marcos, C.; Pérez-Ruzafa, I.M. Mediterranean Coastal Lagoons in an Ecosystem and Aquatic Resources Management Context. Phys. Chem. Earth Parts A/B/C 2011, 36, 160–166. [Google Scholar] [CrossRef]
  5. Pérez-Ruzafa, A.; Marcos, C.; Pérez-Ruzafa, I.M.; Pérez-Marcos, M. Coastal Lagoons: “Transitional Ecosystems” between Transitional and Coastal Waters. J. Coast. Conserv. 2011, 15, 369–392. [Google Scholar] [CrossRef]
  6. Le Fur, I.; De Wit, R.; Plus, M.; Oheix, J.; Simier, M.; Ouisse, V. Submerged Benthic Macrophytes in Mediterranean Lagoons: Distribution Patterns in Relation to Water Chemistry and Depth. Hydrobiologia 2018, 808, 175–200. [Google Scholar] [CrossRef]
  7. Quammen, M.L.; Onuf, C.P. Laguna Madre: Seagrass Changes Continue Decades after Salinity Reduction. Estuaries 1993, 16, 302. [Google Scholar] [CrossRef]
  8. Lirman, D.; Deangelo, G.; Serafy, J.; Hazra, A.; Smith Hazra, D.; Herlan, J.; Luo, J.; Bellmund, S.; Wang, J.; Clausing, R. Seasonal Changes in the Abundance and Distribution of Submerged Aquatic Vegetation in a Highly Managed Coastal Lagoon. Hydrobiologia 2008, 596, 105–120. [Google Scholar] [CrossRef]
  9. Steinhardt, T.; Selig, U. Influence of Salinity and Sediment Resuspension on Macrophyte Germination in Coastal Lakes. J. Limnol. 2011, 70, 11. [Google Scholar] [CrossRef]
  10. Paton, D.C.; Rogers, D.J.; Hill, B.M.; Bailey, C.P.; Ziembicki, M. Temporal Changes to Spatially Stratified Waterbird Communities of the Coorong, South Australia: Implications for the Management of Heterogenous Wetlands. Anim. Conserv. 2009, 12, 408–417. [Google Scholar] [CrossRef]
  11. Rodríguez-Climent, S.; Caiola, N.; Ibáñez, C. Salinity as the Main Factor Structuring Small-Bodied Fish Assemblages in Hydrologically Altered Mediterranean Coastal Lagoons. Sci. Mar. 2013, 77, 37–45. [Google Scholar] [CrossRef] [Green Version]
  12. Venice System. The Venice System for the Classification of Marine Waters According to Salinity. Limnol. Oceanogr. 1958, 3, 346–347. [Google Scholar] [CrossRef]
  13. Kjerfve, B.; Schettini, C.A.F.; Knoppers, B.; Lessa, G.; Ferreira, H.O. Hydrology and Salt Balance in a Large, Hypersaline Coastal Lagoon: Lagoa de Araruama, Brazil. Estuar. Coast. Shelf Sci. 1996, 42, 701–725. [Google Scholar] [CrossRef] [Green Version]
  14. Moore, N.H.; Slinn, D.J. The Physical Hydrology of a Lagoon System on the Pacific Coast of Mexico. Estuar. Coast. Shelf Sci. 1984, 19, 413–426. [Google Scholar] [CrossRef]
  15. De Pascalis, F.; Pérez-Ruzafa, A.; Gilabert, J.; Marcos, C.; Umgiesser, G. Climate Change Response of the Mar Menor Coastal Lagoon (Spain) Using a Hydrodynamic Finite Element Model. Estuar. Coast. Shelf Sci. 2012, 114, 118–129. [Google Scholar] [CrossRef]
  16. Webster, I.T. The Hydrodynamics and Salinity Regime of a Coastal Lagoon—The Coorong, Australia—Seasonal to Multi-Decadal Timescales. Estuar. Coast. Shelf Sci. 2010, 90, 264–274. [Google Scholar] [CrossRef]
  17. Kjerfve, B.; Magill, K.E. Geographic and Hydrodynamic Characteristics of Shallow Coastal Lagoons. Mar. Geol. 1989, 88, 187–199. [Google Scholar] [CrossRef]
  18. Newton, A.; Icely, J.; Cristina, S.; Brito, A.; Cardoso, A.C.; Colijn, F.; Riva, S.D.; Gertz, F.; Hansen, J.W.; Holmer, M.; et al. An Overview of Ecological Status, Vulnerability and Future Perspectives of European Large Shallow, Semi-Enclosed Coastal Systems, Lagoons and Transitional Waters. Estuar. Coast. Shelf Sci. 2014, 140, 95–122. [Google Scholar] [CrossRef]
  19. Ferrarin, C.; Bajo, M.; Bellafiore, D.; Cucco, A.; De Pascalis, F.; Ghezzo, M.; Umgiesser, G. Toward Homogenization of Mediterranean Lagoons and Their Loss of Hydrodiversity. Geophys. Res. Lett. 2014, 41, 5935–5941. [Google Scholar] [CrossRef]
  20. Schumann, R.; Baudler, H.; Glass, Ä.; Dümcke, K.; Karsten, U. Long-Term Observations on Salinity Dynamics in a Tideless Shallow Coastal Lagoon of the Southern Baltic Sea Coast and Their Biological Relevance. J. Mar. Syst. 2006, 60, 330–344. [Google Scholar] [CrossRef]
  21. Derolez, V.; Soudant, D.; Malet, N.; Chiantella, C.; Richard, M.; Abadie, E.; Aliaume, C.; Bec, B. Two Decades of Oligotrophication: Evidence for a Phytoplankton Community Shift in the Coastal Lagoon of Thau (Mediterranean Sea, France). Estuar. Coast. Shelf Sci. 2020, 241, 106810. [Google Scholar] [CrossRef]
  22. Santhanam, H.; Amal Raj, S. Spatial and Temporal Analyses of Salinity Changes in Pulicat Lagoon, a Transitional Ecosystem, during 1996–2015. Water Sci. 2019, 33, 93–104. [Google Scholar] [CrossRef] [Green Version]
  23. Boutron, O.; Bertrand, O.; Fiandrino, A.; Höhener, P.; Sandoz, A.; Chérain, Y.; Coulet, E.; Chauvelon, P. An Unstructured Numerical Model to Study Wind-Driven Circulation Patterns in a Managed Coastal Mediterranean Wetland: The Vaccarès Lagoon System. Water 2015, 7, 5986–6016. [Google Scholar] [CrossRef] [Green Version]
  24. Scott, D.A.; Rose, P.M. Atlas of Anatidae Populations in Africa and Western Eurasia; Wetlands International: Wageningen, The Netherlands, 1996; Volume 41. [Google Scholar]
  25. SHOM. Ouvrage de Marée. Références Altimétriques Maritimes. Ports de France Metropolitaine et d’outre-Mer. Cotes Du Zéro Hydrographique et Niveaux Caractéristiques de La Marée; SHOM: 13 rue du Chatellier, 29200 Brest, France; ISBN 978-2-11-097286-6.
  26. Paugam, C.; Sous, D.; Rey, V.; Meulé, S.; Faure, V.; Boutron, O.; Luna-Laurent, E.; Migne, E. Wind Tides and Surface Friction Coefficient in Semi-Enclosed Shallow Lagoons. Estuar. Coast. Shelf Sci. 2021, 257, 107406. [Google Scholar] [CrossRef]
  27. De Wit, R.; Vincent, A.; Foulc, L.; Klesczewski, M.; Scher, O.; Loste, C.; Thibault, M.; Poulin, B.; Ernoul, L.; Boutron, O. Seventy-Year Chronology of Salinas in Southern France: Coastal Surfaces Managed for Salt Production and Conservation Issues for Abandoned Sites. J. Nat. Conserv. 2019, 49, 95–107. [Google Scholar] [CrossRef]
  28. Unesco. Joint Panel on Oceanographic Tables and Standards. International Oceanographic Tables: Volume 3; Unesco: Paris, France, 1981. [Google Scholar]
  29. Chauvelon, P.; Tournoud, M.-G.; Sandoz, A. Integrated Hydrological Modelling of a Managed Coastal Mediterranean Wetland (Rhone Delta, France): Initial Calibration. Hydrol. Earth Syst. Sci. Discuss. 2003, 7, 123–132. [Google Scholar] [CrossRef] [Green Version]
  30. Loubet, A. Modélisation de l’hydrosystème Vaccarès: Contribution à Une Gestion Adaptative Des Ressources En Eau Dans Le Delta Du Rhône, France. Ph.D. Thesis, Aix-Marseille University, Marseille, France, 2012. [Google Scholar]
  31. Penman, H.L. Natural Evaporation from Open Water, Bare Soil and Grass. In Proceedings of the Royal Society of London. Series A. Mathematical, Physical and Engineering Sciences; The Royal Society, 6-9 Carlton House Terrace: London, England, 1948; Volume 193, pp. 120–145. [Google Scholar]
  32. Chauvelon, P. A Wetland Managed for Agriculture as an Interface between the Rhône River and the Vaccares Lagoon (Camargue, France): Transfers of Water and Nutrients. Hydrobiologia 1998, 373–374, 181–191. [Google Scholar] [CrossRef]
  33. Crivelli, A.J.; Auphan, N.; Chauvelon, P.; Sandoz, A.; Menella, J.-Y.; Poizat, G. Glass Eel Recruitment, Anguilla anguilla (L.), in a Mediterranean Lagoon Assessed by a Glass Eel Trap: Factors Explaining the Catches. Hydrobiologia 2008, 602, 79–86. [Google Scholar] [CrossRef]
  34. Vandewalle, P.; Coulet, E.; Chérain, Y. Plan de Gestion 2001–2005 de La Réserve Nationale de Camargue. Section B: Évaluation Du Patrimoine et Définition Des. Objectifs. Société Nationale de Protection de La Nature—Réserve Naturelle Nationale de Camargue, 2001.
  35. Boutron, O.; Luna-Laurent, E.; Chérain, Y. Etude de L’équilibre Hydrologique Entre les Apports d’eau Douce et d’eau Salée dans le Système Vaccarès et les Etangs et Marais des Salins de Camargue; Tour du Valat Research Institute: Arles, France, 2021; p. 65. [Google Scholar]
  36. Umgiesser, G.; Ferrarin, C.; Cucco, A.; De Pascalis, F.; Bellafiore, D.; Ghezzo, M.; Bajo, M. Comparative Hydrodynamics of 10 Mediterranean Lagoons by Means of Numerical Modeling. J. Geophys. Res. Oceans 2014, 119, 2212–2226. [Google Scholar] [CrossRef]
  37. Ferrarin, C.; Umgiesser, G. Hydrodynamic Modeling of a Coastal Lagoon: The Cabras Lagoon in Sardinia, Italy. Ecol. Model. 2005, 188, 340–357. [Google Scholar] [CrossRef]
  38. Ferrarin, C.; Ghezzo, M.; Umgiesser, G.; Tagliapietra, D.; Camatti, E.; Zaggia, L.; Sarretta, A. Assessing Hydrological Effects of Human Interventions on Coastal Systems: Numerical Applications to the Venice Lagoon. Hydrol. Earth Syst. Sci. 2013, 17, 1733–1748. [Google Scholar] [CrossRef] [Green Version]
  39. Minghelli, A.; Vadakke-Chanat, S.; Chami, M.; Guillaume, M.; Migne, E.; Grillas, P.; Boutron, O. Estimation of Bathymetry and Benthic Habitat Composition from Hyperspectral Remote Sensing Data (BIODIVERSITY) Using a Semi-Analytical Approach. Remote Sens. 2021, 13, 1999. [Google Scholar] [CrossRef]
  40. Akridge, D.G. Methods for Calculating Brine Evaporation Rates during Salt Production. J. Archaeol. Sci. 2008, 35, 1453–1462. [Google Scholar] [CrossRef]
  41. Ali, H.; Madramootoo, C.A.; Abdel Gwad, S. Evaporation Model of Lake Qaroun as Influenced by Lake Salinity. Irrig. Drain. 2001, 50, 9–17. [Google Scholar] [CrossRef]
  42. Calder, I.R.; Neal, C. Evaporation from Saline Lakes: A Combination Equation Approach. Hydrol. Sci. J. 1984, 29, 89–97. [Google Scholar] [CrossRef]
  43. Kokya, B.A.; Kokya, T.A. Proposing a Formula for Evaporation Measurement from Salt Water Resources. Hydrol. Process. 2008, 22, 2005–2012. [Google Scholar] [CrossRef]
  44. Martínez-Alvarez, V.; Gallego-Elvira, B.; Maestre-Valero, J.F.; Tanguy, M. Simultaneous Solution for Water, Heat and Salt Balances in a Mediterranean Coastal Lagoon (Mar Menor, Spain). Estuar. Coast. Shelf Sci. 2011, 91, 250–261. [Google Scholar] [CrossRef]
  45. Boutron, O. Modélisation de Scénarios de Gestion Prospectifs Du Vaccarès. Action CS14 Du Contrat de Delta: “Suivi et Amélioration de La Qualité de l’eau Du Vaccarès”; Tour du Valat Research Institute: Arles, France, 2020; p. 30. [Google Scholar]
  46. Chauvelon, P.; Sandoz, A.; Heurteaux, V.; Berceaux, A. Satellite Remote Sensing and GIS Used to Quantify Water Input for Rice Cultivation (Rhône Delta, France). In Proceedings of the Remote Sensing and Hydrology 2000; IAHS: Santa Fe, NM, USA, 2001; Volume 276, pp. 446–450. [Google Scholar]
  47. Espel, D.; Diepens, N.J.; Boutron, O.; Buffan-Dubau, E.; Chérain, Y.; Coulet, E.; Grillas, P.; Probst, A.; Silvestre, J.; Elger, A. Dynamics of the Seagrass Zostera Noltei in a Shallow Mediterranean Lagoon Exposed to Chemical Contamination and Other Stressors. Estuar. Coast. Shelf Sci. 2019, 222, 1–12. [Google Scholar] [CrossRef] [Green Version]
  48. Comoretto, L.; Arfib, B.; Chiron, S. Pesticides in the Rhône River Delta (France): Basic Data for a Field-Based Exposure Assessment. Sci. Total Environ. 2007, 380, 124–132. [Google Scholar] [CrossRef]
  49. Chiron, S.; Comoretto, L.; Rinaldi, E.; Maurino, V.; Minero, C.; Vione, D. Pesticide By-Products in the Rhône Delta (Southern France). The Case of 4-Chloro-2-Methylphenol and of Its Nitroderivative. Chemosphere 2009, 74, 599–604. [Google Scholar] [CrossRef]
Figure 1. General Map of the Ile de Camargue basin delimited by the two arms of the Rhône river (Petit Rhône to the West, Grand Rhône to the East). SMM and SDG represent the coastal towns of Saintes-Maries de la Mer and Salin-de-Giraud, France. FUM, ROQ and ROU represent the Fumemorte, Roquemaure, and Rousty channels, respectively. Adapted from [23].
Jmse 09 00701 g001
Figure 2. Localization of salinity, water level, and water flow measurements used in this study.
Jmse 09 00701 g002
Figure 3. Digital Elevation Model of the Vaccarès Lagoon System generated in this study, with a pixel size of 10 m × 10 m. Total number of pixels: 1,101,438.
Jmse 09 00701 g003
Figure 4. (c) Daily averaged salinity measured at locations 21 and 22 (Figure 2) from 13 April 2017 to 31 December 2019. Monthly in situ salinity measurements are also represented. (b) Volume of water entering the Vaccarès lagoon through the Fumemorte channel, measured with the flowmeter at location 23. (a) Precipitation data. Regarding the salinity data of the two CTD probes, the absence of a line indicates missing data, due to instrumental problems (probe clogging) or water levels too low for the conductivity sensor to remain immersed.
Jmse 09 00701 g004
Figure 5. Daily averaged salinity measured at locations 18 and 19 (Figure 2) from 18 December 2018 to 31 December 2019. Monthly in situ salinity measurements at locations 10 and 11 are also represented. Regarding the salinity data of the two CTD probes, the absence of a line indicates missing data, due to an instrumental problem (probe clogging) or water levels too low for the conductivity sensor to remain immersed.
Jmse 09 00701 g005
Figure 6. (a) Daily averaged salinity measured at locations 17, 18, and 19 (Figure 2) from 30 October 2019 to 21 November 2019. (b) Cumulative daily volume of water through the sluice gate at La Comtesse. A positive volume corresponds to a flow entering the Lion/Dame lagoon. The purple line is informative, to highlight the zero value in figure (b).
Jmse 09 00701 g006
Figure 7. Hourly salinity measured at location 20 (Figure 2) from 26 January 2018 to 23 May 2018. Monthly in situ salinity measurements at location 9 are also represented.
Jmse 09 00701 g007
Figure 8. Salinity statistics, from 1999 to 2019, at locations 1–11 of the Vaccarès Lagoon System. The box and whisker plots (total range and 50% quartile) describe the salinity variations; the red squares represent the average salinities, and the blue lines the median values.
Jmse 09 00701 g008
Figure 9. Monthly variations in the average salinity from 1999 to 2019, for (i) the Vaccarès lagoon (“S123”: average value of the salinities measured at the locations 1, 2, and 3 (Figure 2)); (ii) the Impériaux lagoons (“S789”: average value of the salinities measured at the locations 7, 8, and 9); (iii) the Lion/Dame lagoon (“S10_11”: average value of the salinities measured at the locations 10 and 11); and (iv) the area between the Vaccarès and Impériaux lagoons (“S456”: average value of the salinities measured at locations 4, 5, and 6).
Jmse 09 00701 g009
Figure 10. (a) Average total volumes exchanged during each month between the Vaccarès Lagoon System and (i) the Sea, at the Fourcade connection (“Lagoons- > Sea” and “Sea- > Lagoons”); (ii) the atmosphere (“Evaporation” and “Precipitations”); and (iii) the agricultural watershed of the Fumemorte (“Drainage”). Averages calculated over the 1999–2007 period, during which all data sources were available. (b) Average water level in the Vaccarès Lagoon System (average value of the water levels measured at the locations 12, 14, and 15). Average Sea level is also shown (measured at location 13). (c) Average monthly salinities for the period 1999–2007. Purple: average salinities from locations 1, 2, and 3 (Figure 2). Blue: average salinities from locations 4, 5, and 6. Red: average salinities from location 7, 8, and 9. Green: average salinities from locations 10 and 11. Months are represented on the X-axis (1: January; 12: December).
Jmse 09 00701 g010
Figure 11. (a) Total dissolved salt mass in the Vaccarès Lagoon System from 1999 to 2019, calculated as described in part 2.2.2. (b) Mean water level in the Vaccarès Lagoon System, which is the average value of the water levels measured at locations 12, 14, and 15 (see Figure 2). (c) Annual percentage of time with water level in the Vaccarès Lagoon System exceeding sea level (measured at location 13).
Jmse 09 00701 g011
Table 1. Precipitation, evaporation, sea to lagoons, lagoons to sea, Fumemorte, and “Other” cumulative volumes calculated over nine periods with Equation (5). For the sake of readability, all volumes are divided by the number of days N of the period over which they have been calculated, and divided by 104. (unity: 104 m3·day−1). Each calculation period is close to the duration of a full year. The term “Others”, refers to all variations in the volume of the Vaccarès Lagoon that are not due to precipitation, evaporation, Sea-lagoon exchanges, and Fumemorte inflows or outflows. The second line recalls the corresponding terms in Equation (5), divided by N.
PrecipitationEvaporationSea- > LagoonsLagoons- > SeaFumemorteOthers
1 N i = 1 N V p r e c i p i t a t i o n s i 1 N i = 1 N V e v a p o r a t i o n i 1 N i = 1 N V S e a > L a g o o n s i 1 N i = 1 N V L a g o o n s > S e a i 1 N i = 1 N V F u m i 1 N i = 1 N V O t h e r s i
1999 115.8−44.32.1−4.410.522.5
2000 215.8−46.50.8−0.611.221.5
2001 316.3−50.51.5−6.210.823.9
2002 419.2−48.81.8−2.911.426.9
2003 521.4−48.22.9−13.29.127.8
2004 614.0−44.04.6−7.010.214.9
2005 720.6−44.44.6−3.515.113.2
2006 810.8−46.08.0−4.512.211.3
2007 911.5−47.48.7−0.913.413.4
Average values16.2−46.73.9−4.811.519.5
1 Calculations from 23 January 1999 to 23 January 2000; 2 Calculations from 23 January 2000 to 15 January 2001; 3 Calculations from 15 January 2001 to 11 January 2002; 4 Calculations from 11 January 2002 to 02 January 2003; 5 Calculations from 02 January 2003 to 16 January 2004; 6 Calculations from 16 January 2004 to 17 January 2005; 7 Calculations from 17 January 2005 to 17 January 2006; 8 Calculations from 17 January 2006 to 10 January 2007; 9 Calculations from 10 January 2007 to 29 December 2007.
Publisher’s Note: MDPI stays neutral with regard to jurisdictional claims in published maps and institutional affiliations.

