Article

Effect of Depth-Induced Breaking on Wind Wave Simulations in Shallow Nearshore Waters off Northern Taiwan during the Passage of Two Super Typhoons

1
Department of Hydraulic and Ocean Engineering, National Cheng Kung University, Tainan City 70101, Taiwan
2
National Science and Technology Center for Disaster Reduction, New Taipei City 23143, Taiwan
*
Author to whom correspondence should be addressed.
J. Mar. Sci. Eng. 2021, 9(7), 706; https://doi.org/10.3390/jmse9070706
Submission received: 20 April 2021 / Revised: 17 June 2021 / Accepted: 24 June 2021 / Published: 26 June 2021
(This article belongs to the Special Issue Storm Tide and Wave Simulations and Assessment II)

Abstract

:
Super Typhoons Maria (2018) and Lekima (2019) were adopted for this case study, although they only passed the northern offshore waters of Taiwan without making landfall. A direct modification technique was employed to create the atmospheric conditions for a wave-circulation model to hindcast large typhoon-driven waves. The radius of the modified scale (Rtrs) for a hybrid typhoon wind plays an important role in the significant wave height (SWH) simulations during the passage of typhoons. The maximum increment in peak SWH reached 3.0 m and 5.0 m in the deep ocean for Super Typhoons Maria (2018) and Lekima (2019), respectively if the Rtrs was increased from 4 × Rmax (radius of the maximum wind) to 7 × Rmax. The SWHs induced by the typhoon winds in the surf zone were more sensitive to different wave-breaking formulations used in the wave-circulation model. The maximum difference in peak SWH reached 2.5 m and 1.2 m for Super Typhoons Maria (2018) and Lekima (2019), respectively, when the wave-breaking formulations of BJ78 (proposed by Battjes and Janssen in 1978) and CT93 (proposed by Church and Thornton in 1993) were introduced to the wave-circulation model. The SWH simulations in the surf zone were insensitive to the wave-breaking criterion (γ) during the passage of typhoons. In shallow nearshore waters, the utilization of a constant γ for the wave-circulation model always produces peak SWHs that are smaller than those using γ based on local steepness or peak steepness.

1. Introduction

Ocean surface wind waves are a dominant process in coastal, nearshore and offshore regions worldwide. Understanding the characteristics of cyclone-driven extreme waves, their variability and historical and projected future changes are important considerations for the sustainable development of coastal and offshore infrastructures and the management of coastal resources and ecosystems. The energy in ocean surface waves is transmitted from the wind. The wind patterns above the ocean surface have been affected as the upper ocean has warmed, consequently resulting in stronger ocean waves. According to the report from Reguero et al. [1], the energy of ocean waves, i.e., wave height, has grown over the past seven decades, which could have significant implications for coastal communities and ecosystems. Since the contributions of ocean surface waves to extreme total water levels are substantial at open coasts, they have mostly been considered in many local studies [2,3,4,5].
Predicting wave heights accurately in coastal and nearshore areas is essential for a number of human activities there, such as renewable energy applications, aquaculture, maritime transport and infrastructure; furthermore, information on both swells and wind seas is important to coastal applications. For example, the prediction of locally generated wind seas is essential for high-speed passenger ferries, whereas information about the propagation of low-frequency swells in coastal areas and fjords is critical for the design of coastal structures or in the planning of marine operations.
Depth-induced wave breaking is one of the most dominant hydrodynamic processes occurring in coastal regions. This wave breaking not only controls the amount of wave energy impacting our coastlines and coastal defenses but also plays a crucial role in driving many nearshore processes, such as sediment transport, bottom morphology [6] and turbulence, which has been shown to be very important for local ecology [7]. Wave breaking also induces radiation stresses that drive wave-induced setup and currents [8], both of which are important for coastal engineering design and management. However, despite the importance and relevance toward our knowledge of wave hydrodynamics, depth-induced wave breaking is still poorly understood, which is partially due to its highly nonlinear nature; therefore, it is heavily parameterized in most wind wave models.
Many parameterizations for the wave-breaking index have been proposed and reported in previous studies. These parameterizations include dependencies of the wave-breaking index on the offshore wave steepness [9,10], a dissipation rate based on a normalized surf zone width [11], the offshore wave height and the inverse Iribarren number [12]. Ruessink et al. [13] also introduced a parameterization of the wave-breaking index that linearly increases with the local nondimensional depth based on the peak period.
This study provides a critical and objective assessment of three specialized depth-induced wave-breaking models and wave-breaking criteria, which are based on state-of-the-art breaking wave formulations. The aim of this paper is to study the effect of the depth-induced wave-breaking formulation and wave-breaking criteria on the hindcasts of SWH in shallow nearshore waters off northern Taiwan during the passage of Super Typhoons Maria in 2018 and Lekima in 2019, as well as to better understand which hindcast is more influential in wave height hindcasting inside the surf zone. The details of the materials and methods are presented in the following section, and the results of model validation and a series of designed model experiments are described in Section 3. A discussion and uncertainties of the present study are given in Section 4. Finally, Section 5 summarizes and concludes the paper.

2. Materials and Methods

2.1. Description of the Study Cases

Super Typhoon Maria was a powerful tropical cyclone that affected Guam (the United States), the Ryukyu Islands (Japan), Taiwan and East China in early July 2018. Maria became a tropical storm and passed the Mariana Islands on July 4 and rapidly intensified the next day due to favorable environmental conditions. Maria reached its first peak intensity on 6 July, and a second stronger peak intensity with 1-min sustained winds of 270 km/h (equivalent to category 5 super typhoon status on the Saffir-Simpson scale) and a minimum pressure of 915 hPa was reached on 9 July. Maria finally made landfall over the Fujian Province, China, early on 11 July after crossing the Yaeyama Islands and passing the northern offshore waters of Taiwan on 10 July. Figure 1a demonstrates the track and arrival times of Super Typhoon Maria in 2018.
Super Typhoon Lekima originated from a tropical depression that was developed in the eastern Philippines on 30 July 2019. Lekima became a tropical storm and was named on 4 August. Under favorable environmental conditions, Lekima intensified and reached its peak with 1-min sustained winds of 250 km/h (equivalent to a category 4 super typhoon status on the Saffir-Simpson scale) and a minimum pressure of 925 hPa on 8 August. Lekima made landfall in the Zhejiang Province, China, on late 9 August and made its second landfall in the Shandong Province, China, on 11 August after moving across eastern China. The track and arrival times of Super Typhoon Lekima are illustrated in Figure 1b.

2.2. Information on Offshore Wave Buoys

Three wave buoys, namely, Fuguijiao, Longdong and Suao, located in the northern and northeastern offshore waters of Taiwan, were selected for model validation because they are closest to the tracks of Super Typhoons Maria in 2018 and Lekima in 2019 (as shown in Figure 1). The sampling frequency of wave buoys is 2 Hz for 10 min at the beginning of each hour with an accuracy of ±10 cm for the SWH measurements according to the annual buoy observation data report from the CWB. Information on the coordinates of the three wave buoys and their corresponding water depths is listed in Table 1.

2.3. Direct Modification of Typhoon Winds from ERA5

Since the mid-1960s, many parametric cyclone wind models have been proposed [14,15] and widely used to mimic the wind distribution of typhoons [16,17,18,19] because of their simplicity. Parametric cyclone wind models could be used to accurately reconstruct the wind distributions near the center of the typhoon; however, they are unable to accurately reproduce wind speeds in regions far from the center of the typhoon. In contrast, reanalysis wind data obtained from the dynamical model with data assimilation show a superior performance for hindcasting the winds outside of the typhoon’s center but are generally inferior for the hindcasts of maximum typhoon wind speed [20,21,22,23,24]. A direct modification technique recommended by Pan et al. [20] was applied in the present study to take advantage of combining the parametric cyclone wind model and reanalysis wind data and maintain a reliable structure for the entire typhoon wind field.
W D M = { W E R A 5 [ r R max ( W B m a x W E m a x 1 ) + 1 ] r < R max W E R A 5 [ R t r s r R t r s R max ( W B m a x W E m a x 1 ) + 1 ] R max r R t r s   W E R A 5 r > R t r s
where WDM is the wind speed at an arbitrary grid within the model domain through direct modification, WERA5 is the wind speed extracted from ERA5 (the fifth-generation reanalysis of the European Centre for Medium-Range Weather Forecasts for the global climate and weather) at an arbitrary point in the computational grid, WBmax is the maximum wind speed of the best track typhoon issued by the Regional Specialized Meteorological Center (RSMC) Tokyo-Typhoon Center, WEmax is the maximum wind speed of the typhoon among the hourly ERA5 wind fields, r is the radial distance from an arbitrary grid within the model domain to the eye of the typhoon, Rtrs is the radius of the modified scale (also known as the radius of the transitional zone) and Rmax is the radius at the maximum typhoon wind speed. Rmax can be expressed as a function of WBmax and the latitude of the typhoon’s center:
R max = m 0 + m 1 × W B m a x + m 2 ( ϕ 25 )
where ϕ is the latitude of the typhoon’s center. In Equation (2), m0, m1 and m2 were set to 38.0 (in n·mi), −0.1167 (in n·mi·kt−1) and −0.0040 (in n·mio−1), respectively, according to the results derived from Knaff et al. [25] for the Western Pacific typhoon basin. Rtrs is considered to be a key factor in determining the accuracy of wind fields; therefore, various Rtrs will be employed to create hybrid typhoon wind fields to better understand their effect on wind wave hindcasting.

2.4. Configuration of the Wave-Circulation Modeling System

A seamless cross-scale hydrodynamic model based on an unstructured grid and triangular mesh served as the ocean circulation model in the wave-circulation modeling system. The hydrodynamic model is called SCHISM (semi-implicit cross-scale hydroscience integrated system model), which has been implemented by Zhang et al. [26] and other developers around the world. Similar to the SELFE (semi-implicit Eulerian-Lagrangian finite element/volume model, the predecessor of the SCHISM developed by Zhang and Baptista [27]), the SCHISM also avoids the severest stability constraints in the numerical model by means of a highly efficient semi-implicit scheme [28]. Hence, the high-performance calculations can be performed even when a very high spatial resolution mesh is used in the SCHISM. The splitting between internal and external modes could derive a numerical error [29], which is eliminated through the no-mode-splitting technique implemented in the SCHISM. A depth-averaged (two-dimensional (2D)) ocean circulation model is sufficient for simulating typhoon-driven hydrodynamics. Additionally, fewer computing resources and execution times are required for a 2D model. Therefore, a 2D model, i.e., SCHISM-2D, is selected for wind wave modeling in the present study. The SCHISM and its predecessor SELFE are multipurpose models that have been widely applied to the simulation of hydrodynamics and water quality transportation in coastal and estuarine environments in Taiwan, e.g., evaluation of storm tide-induced coastal inundation [30,31], assessment of tidal stream energy [32,33], transport of suspended sediment and fecal coliform [34,35]. The Manning coefficient and time step were set as 0.025 and 120 s for the barotropic ocean model, respectively, according to the geological characteristics of the seafloor in the waters surrounding Taiwan and the numerical stability of the SCHISM-2D.
The WWM-III is a derivative work from the original WWM-II (wind wave model version III, developed by Roland [36]). The WWM-III is a third-generation spectral wave model that is able to simulate and predict the ocean surface sea state [37]. The wave action balance equation governing the WWM-III is solved by the fractional step method on an unstructured grid. The number of directional bins is 36 with a minimum of 0° and a maximum direction of 360°. The number of frequency bins is 36, the lowest limit of the discrete wave frequency is 0.04 Hz and a highest frequency limit of the discrete wave period is 1.0 Hz. The peak enhancement factor is specified as 3.3 for the JONSWAP (Joint North Sea Wave Project, [38]) spectra, while the wave breaking coefficients for the constant and bottom friction coefficients are 0.78 and 0.067, respectively, in WWM-III.
To enhance the information exchange efficiency between the ocean circulation and wind wave models and to eliminate the interpolation errors from the two models, SCHISM-2D and WWM-III take advantage of sharing the same subdomains and parallelization through the same domain decomposition scheme. Additionally, time steps of 120 s and 600 s were used in the SCHISM-2D and WWM-III models, respectively, to improve the computational performance of the coupled model, SCHISM-WWM-III. The fully coupled SCHISM-WWM-III modeling system has been applied to predict, simulate and hindcast typhoon-driven storm tides and waves [21,22,23,24,39], as well as long-term wave energy resources in the offshore waters of Taiwan [40,41,42].
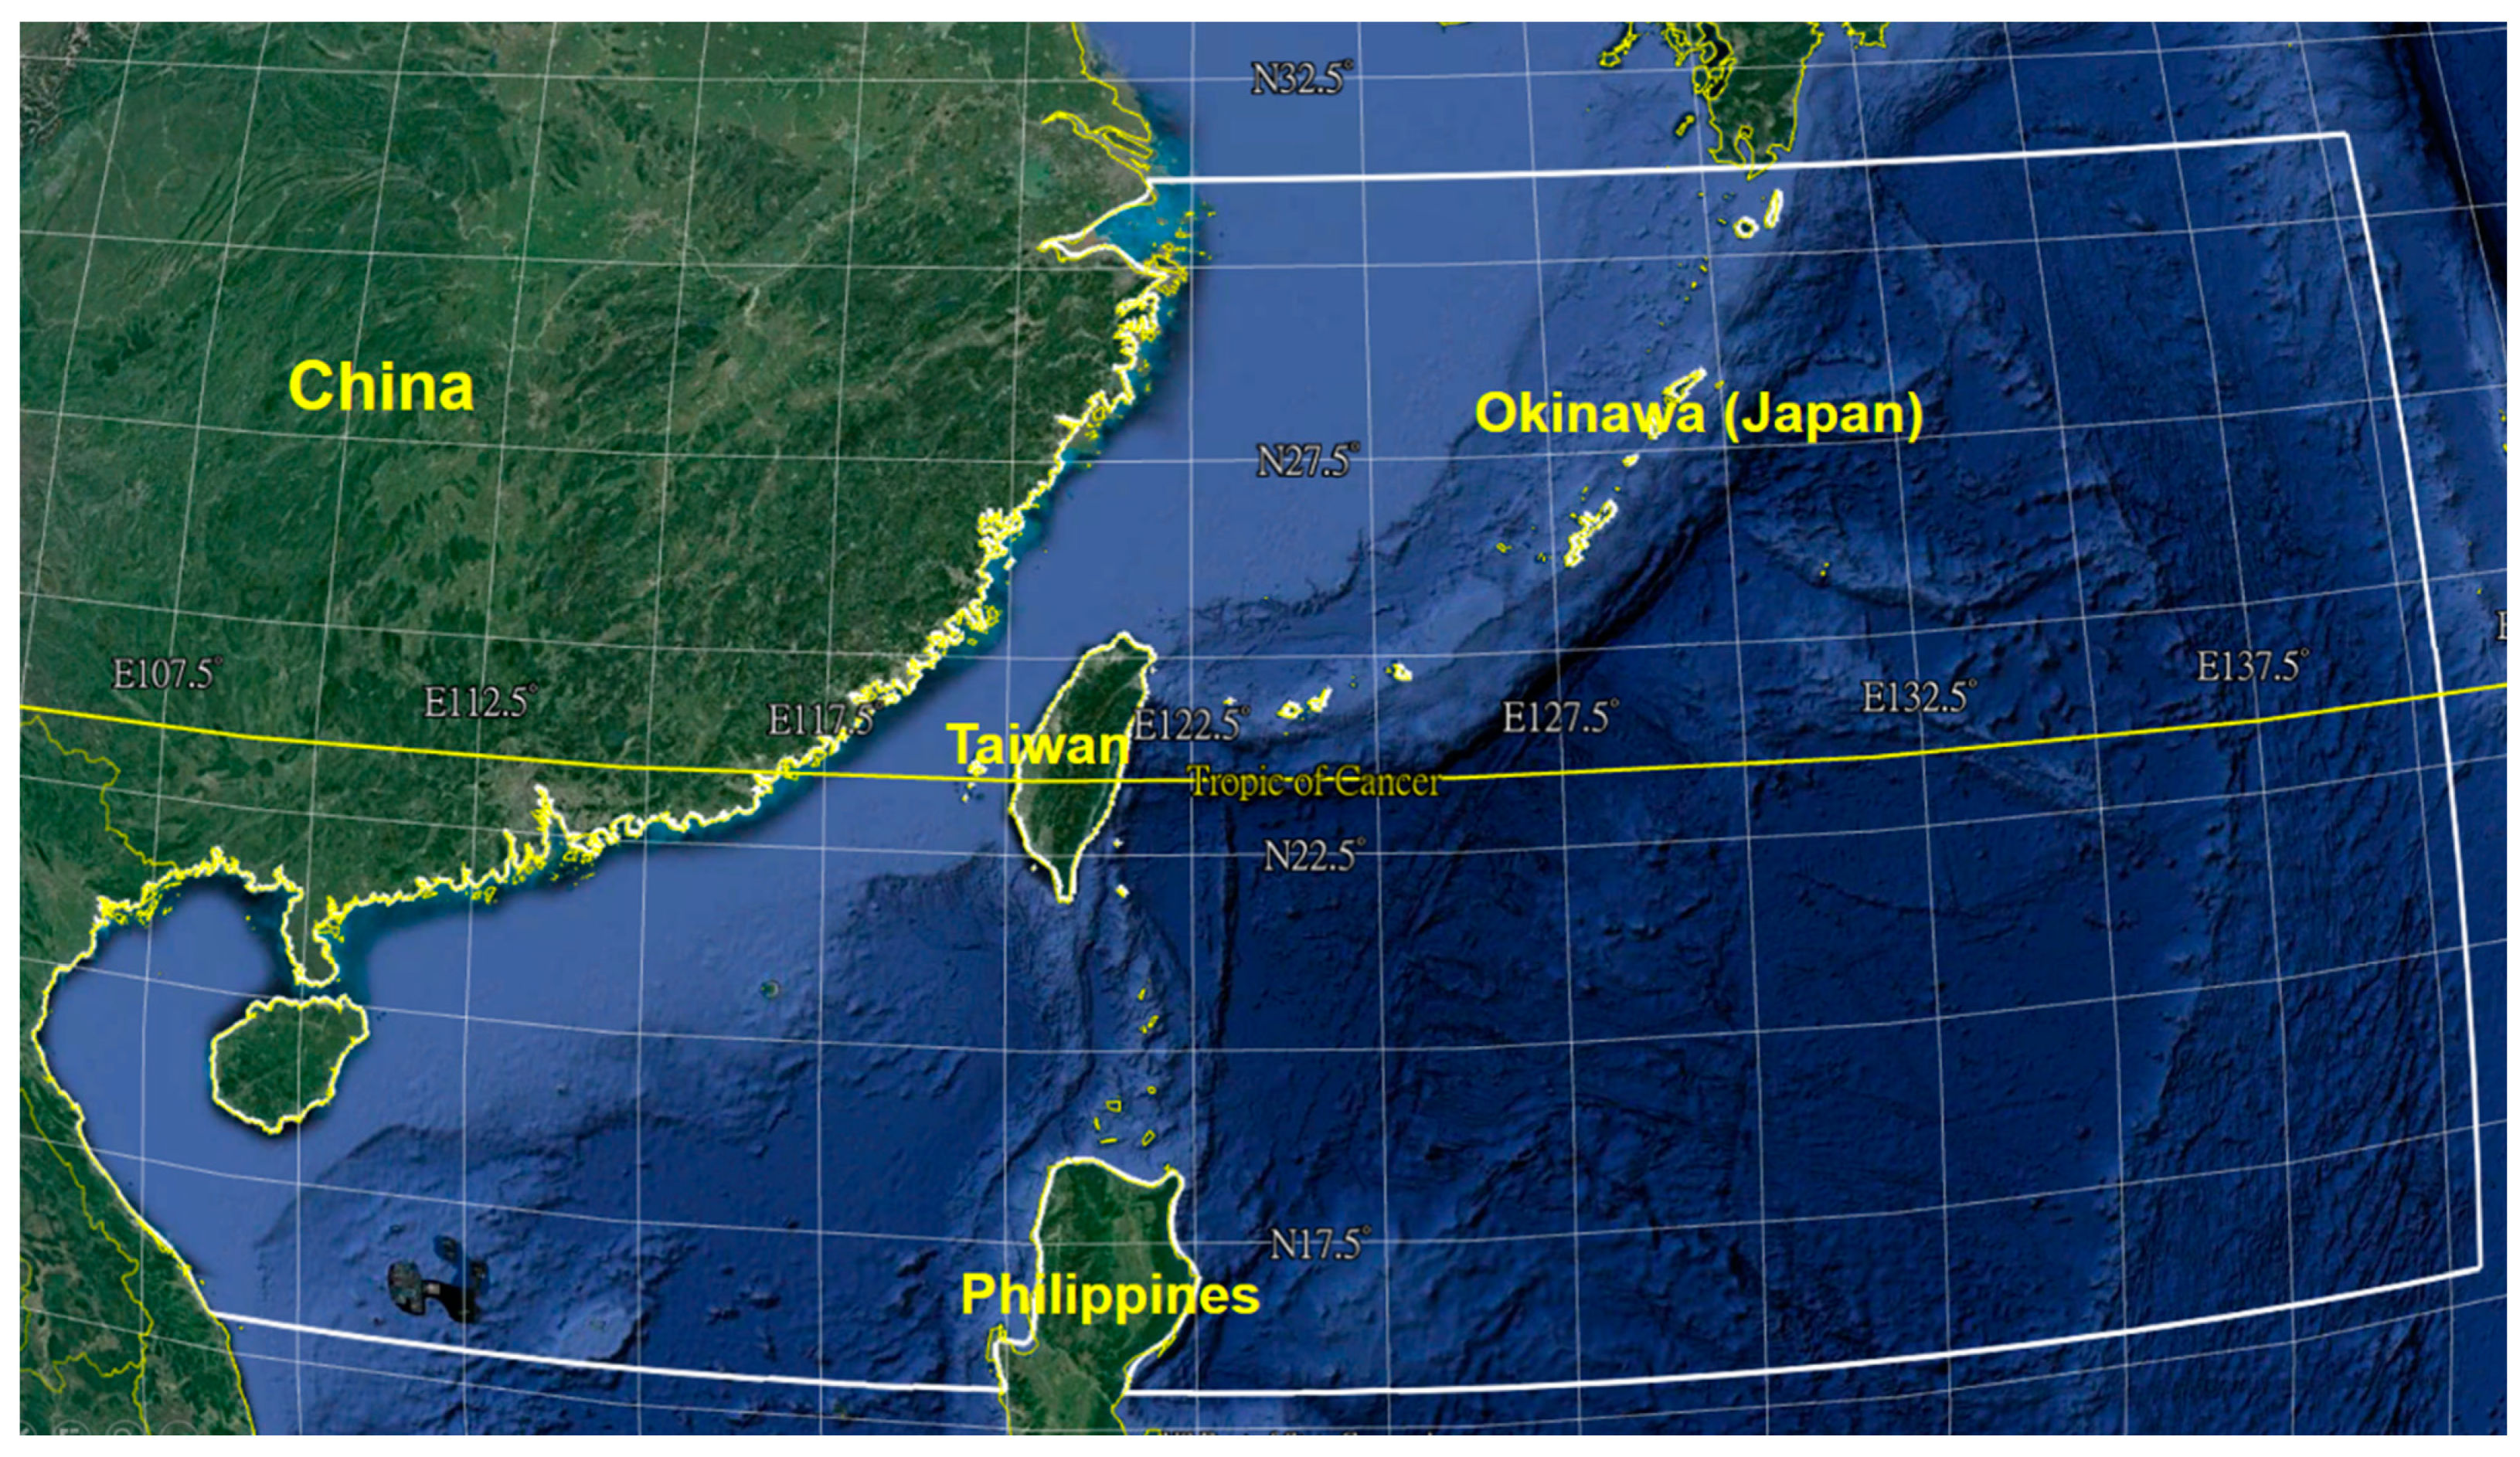
For a successful storm surge, tide and wave modeling, the size of the computational domain must be large enough to accommodate the full typhoon; otherwise, the simulations would be affected by the boundary conditions [43,44]. The present study developed a computational domain spanning east longitudes from 105° to 140° and north latitudes from 15° to 31° (as shown in Figure 2). This large domain is composed of 540,510 nonoverlapping triangular elements and 276,639 unstructured grid points. A local-scale bathymetric dataset covering the area from east longitude 100° to 128° and north latitude from 4° to 29° with a spatial resolution of 200 m was provided by the Department of Land Administration and the Ministry of the Interior, Taiwan. The latest global-scale bathymetric product released from the General Bathymetric Chart of the Oceans (GEBCO), GEBCO_2020 Grid, was employed to incorporate a local-scale bathymetric dataset (as mentioned above) to construct the gridded bathymetric data in the SCHISM-WWM-III modeling system.
Eight main tidal constituents (M2, S2, N2, K2, K1, O1, P1 and Q1) extracted from a regional inverse tidal model (China Seas and Indonesia [45]) were utilized to generate the tidal elevation and horizontal velocity at the ocean boundaries of the SCHISM-WWM-III. The inverse barometric effect for tidal elevation at the boundary nodes was also considered. Since wave-generating typhoons were completely within the computational domain in the present study, open boundary conditions for the waves were not always required [42,46].

2.5. Parameterization of Depth-Induced Wave Breaking

Three widely used parameterizations for characterizing depth-induced wave breaking in nearshore shallow waters were adopted in the present study and are briefly reviewed in this section. Battjes and Beji [47] proposed that the total energy dissipation can be distributed over the wave spectrum in proportion to the spectral density based on extensive laboratory experiments; hence, the wave-induced wave breaking (Sbreak) in the wave action density function is calculated as follows:
S b r e a k ( σ , θ ) = D t o t a l E ( σ , θ ) E t o t a l
where Sbreak,θ) is the wave-induced wave breaking in spectral space (σ, θ), Dtotal is the total energy dissipation rate due to depth-induced wave breaking, E(σ,θ) is the wave energy in spectral space (σ, θ) and Etotal is the total wave energy.

2.5.1. BJ78 Model

In the BJ78 model (proposed by Battjes and Janssen [48]), the total energy dissipation due to depth-induced wave breaking, D t o t _ B J 78 is given as follows:
D t o t _ B J 78 = 1 4 α B J Q b f ¯ H max 2
where α B J is the proportionality parameter, Q b represents the fraction of breaking waves, f ¯ is the averaged frequency and H max represents the maximum individual wave height and is defined as a proportion of the water depth in the local area (d):
H max = γ d
where γ is the wave-breaking index. The fraction of breaking waves, Q b is determined by the Rayleigh distribution truncated at an upper limit with H max (maximum wave height). Therefore, the fraction of breaking waves is implicitly expressed as follows:
1 Q b ln Q b = ( H r m s H max ) 2
where H r m s is the root-mean-square wave height.

2.5.2. TG83 Model

The TG83 model can be considered a variant of BJ78, and the total energy dissipation due to depth-induced wave breaking in the TG83 model (proposed by Thornton and Guza [49]), D t o t _ T G 83 is formulated as follows:
D t o t _ T G 83 = B 3 4 f ¯ d 0 H 3 p b ( H ) d H
where B is the proportionality coefficient, H is the wave height and p b ( H ) is the fraction of breaking waves at each wave height. In which, p b ( H ) can be given as follows:
p b ( H ) = W ( H ) p ( H )
where p ( H ) is the Rayleigh wave height probability density function and can be expressed as follows:
p ( H ) = 2 H H r m s 2 exp [ ( H H r m s ) 2 ]
The weighting function, W ( H ) is defined as in the TG83 model:
W ( H ) = ( H r m s γ T G d ) n
where the calibration parameter n = 4, γ T G is the wave-breaking index for the TG83 model and is set to 0.42 according to Thornton and Guza [49,50].

2.5.3. CT93 Model

The total energy dissipation due to the depth-induced wave breaking implemented in the CT93 model (proposed by Church and Thornton [51]) is related to H r m s through periodic linear bore theory, which can be given as follows:
D t o t _ CT 93 = 3 π 16 f ¯ B 3 H r m s 3 d M [ 1 1 [ 1 + ( H r m s / γ d ) 2 ] 5 / 2 ]
in which M is expressed as follows:
M = 1 + tanh [ 8 ( H r m s γ 1.0 ) ]

2.6. Parameterization of the Wave-Breaking Index

2.6.1. Constant Wave Breaking Criterion (γ)

The parameter γ , given in Equation (4), is an adjustable coefficient that allows for the effects of the bottom slope on the waves and is one of the important parameters in the energy dissipation formulation. Miche [52] derived the theoretical value of γ = 0.88 for a flat bottom. Based on the average of several reasonable wave breaking observations, Battjes and Janssen [48] suggested a constant breaker index of γ = 0.8. The values for the breaking index γ range from 0.60 to 0.83; however, γ = 0.73 has been used in the most operational third-generation wave models, which is taken as the averaged value over a larger data set [9]. In the present study, a value of γ = 0.78 was specified for the SWH simulation following the results from Chen et al. [21] and Hsiao et al. [22,23,24] if the wave-circulation model adopted a constant breaker index.

2.6.2. Wave Breaking Criterion Based on Local Steepness or Peak Steepness

The wave breaking process in shallow nearshore waters is affected by the seafloor profile (i.e., bottom slope) and incident wave steepness. Battjes and Stive [9] found that a hyperbolic tangent function could be used for predicting the SWHs in shallow-water coastal areas and a relationship between the breaking index γ and the wave steepness s 0 :
γ = 0.5 + 0.4 tanh ( 33 s 0 )
in which s 0 can be expressed as follows:
s 0 = H r m s 0 / λ 0
where H r m s 0 is the root-mean-square wave height in deep waters, λ 0 is the wavelength and is defined as λ 0 = g d / f , f is the wave period and g is the acceleration of gravity. The wave breaking criterion in Equation (13) is regarded as the local steepness or peak steepness based on f .

3. Results

The wind fields during Super Typhoon Maria from 1–15 July in 2018 and Super Typhoon Lekima from 1–15 August in 2019 were extracted from the ERA5 reanalysis and were corrected by the direct modification method expressed in Equation (1). The hybrid typhoon winds derived from Equation (1) with various Rtrs values were imposed in the SCHISM-WWM-III modeling system to compare the performance of the resulting storm wave hindcast. The effect of the wave-breaking formulation and wave-breaking criterion on the simulation of the SWH in the shallow nearshore waters off northern Taiwan during the passage of Super Typhoons Maria and Lekima was investigated by conducting several designed model experiments, as listed in Table 2.

3.1. Validation for Typhoon-Driven SWHs with Various Rtrs

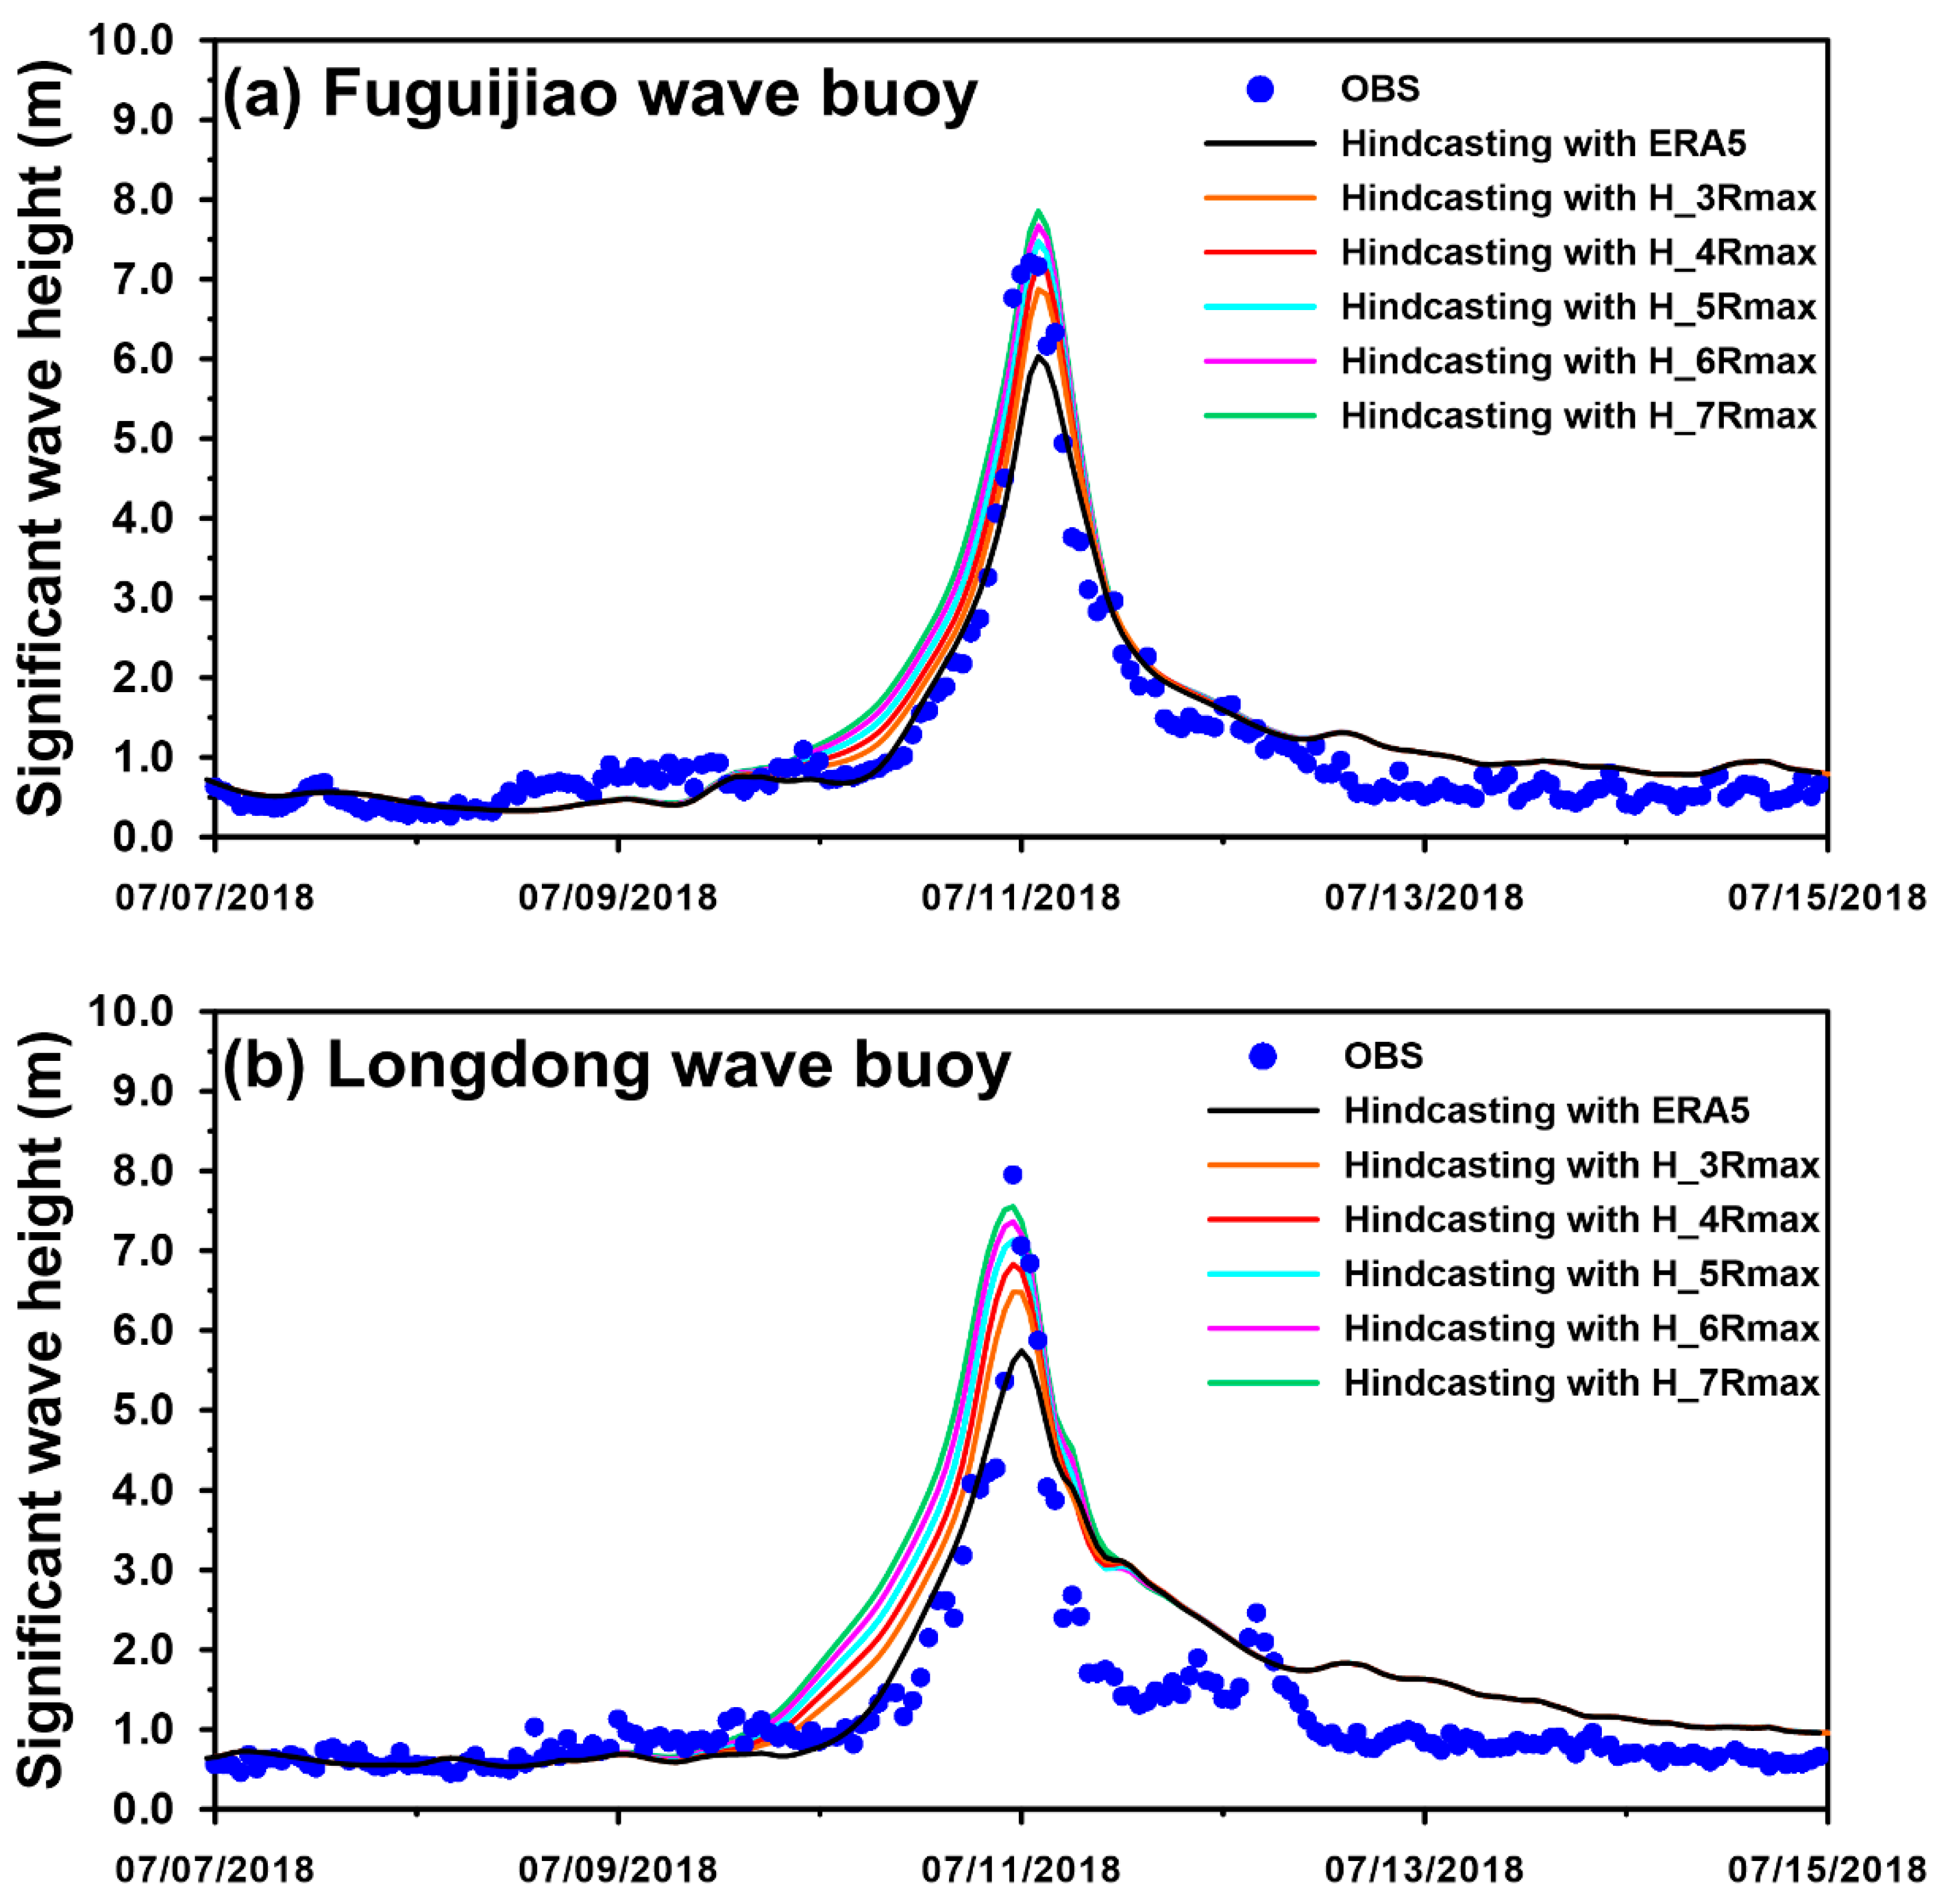
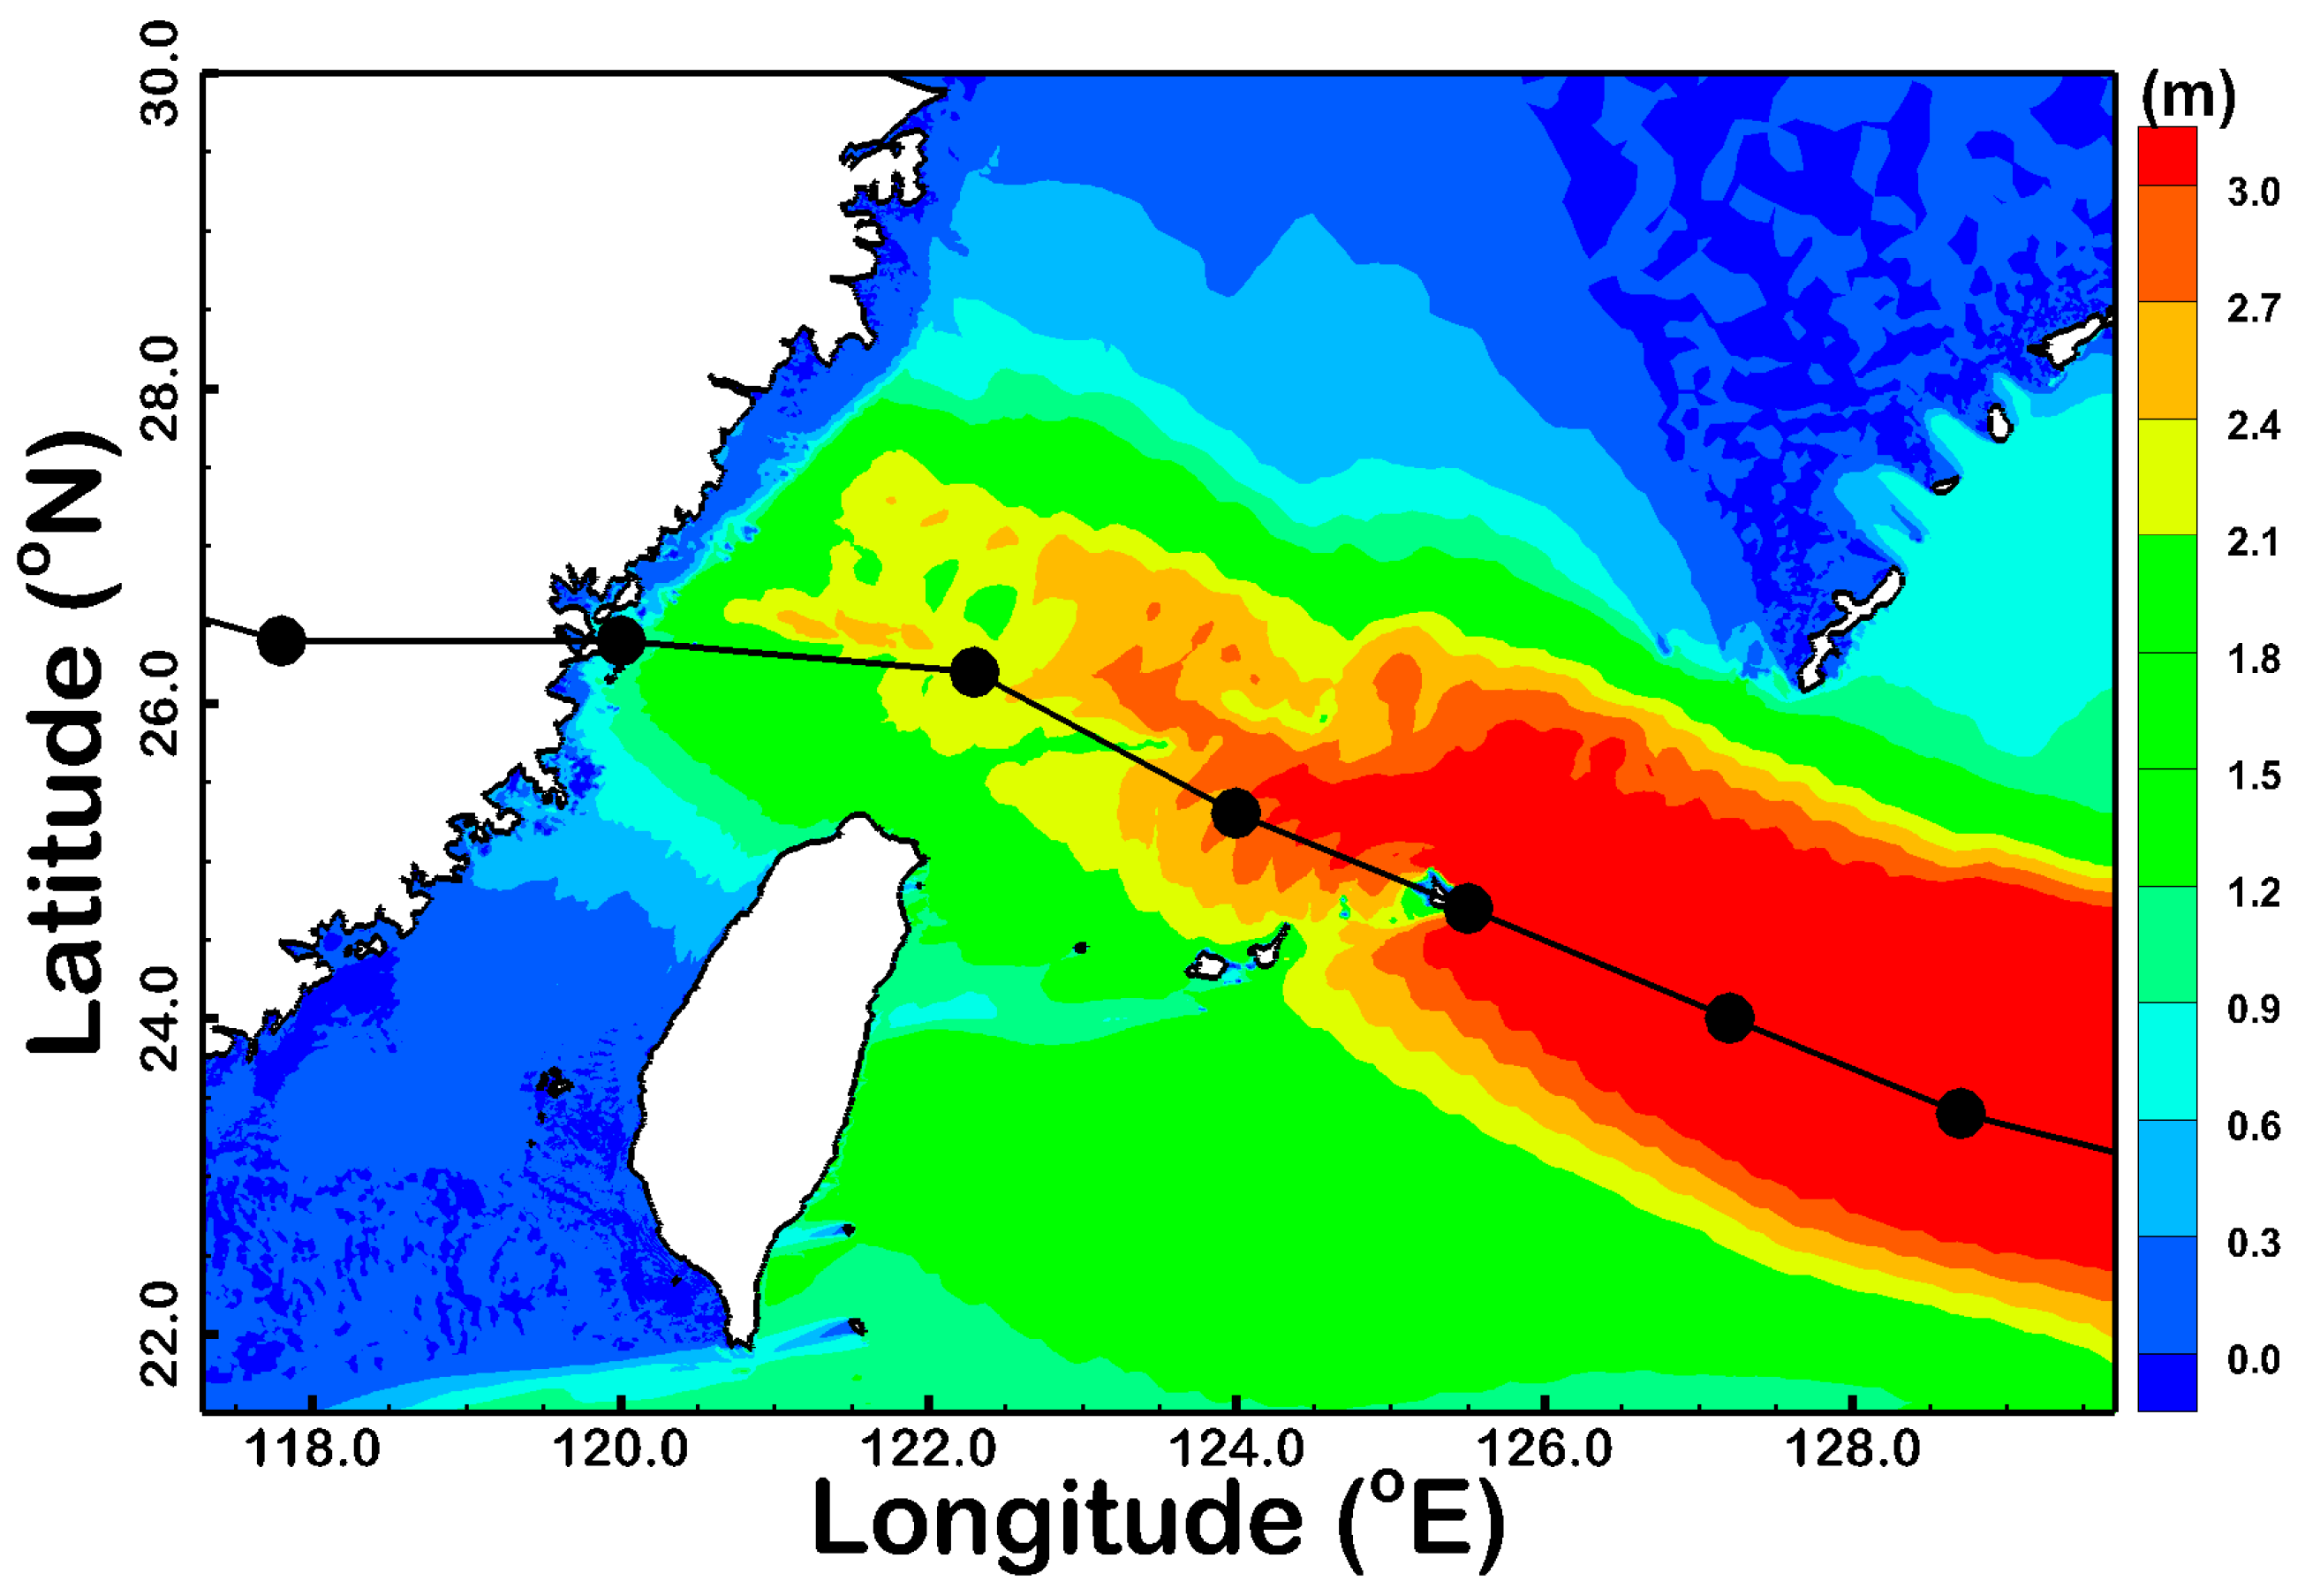
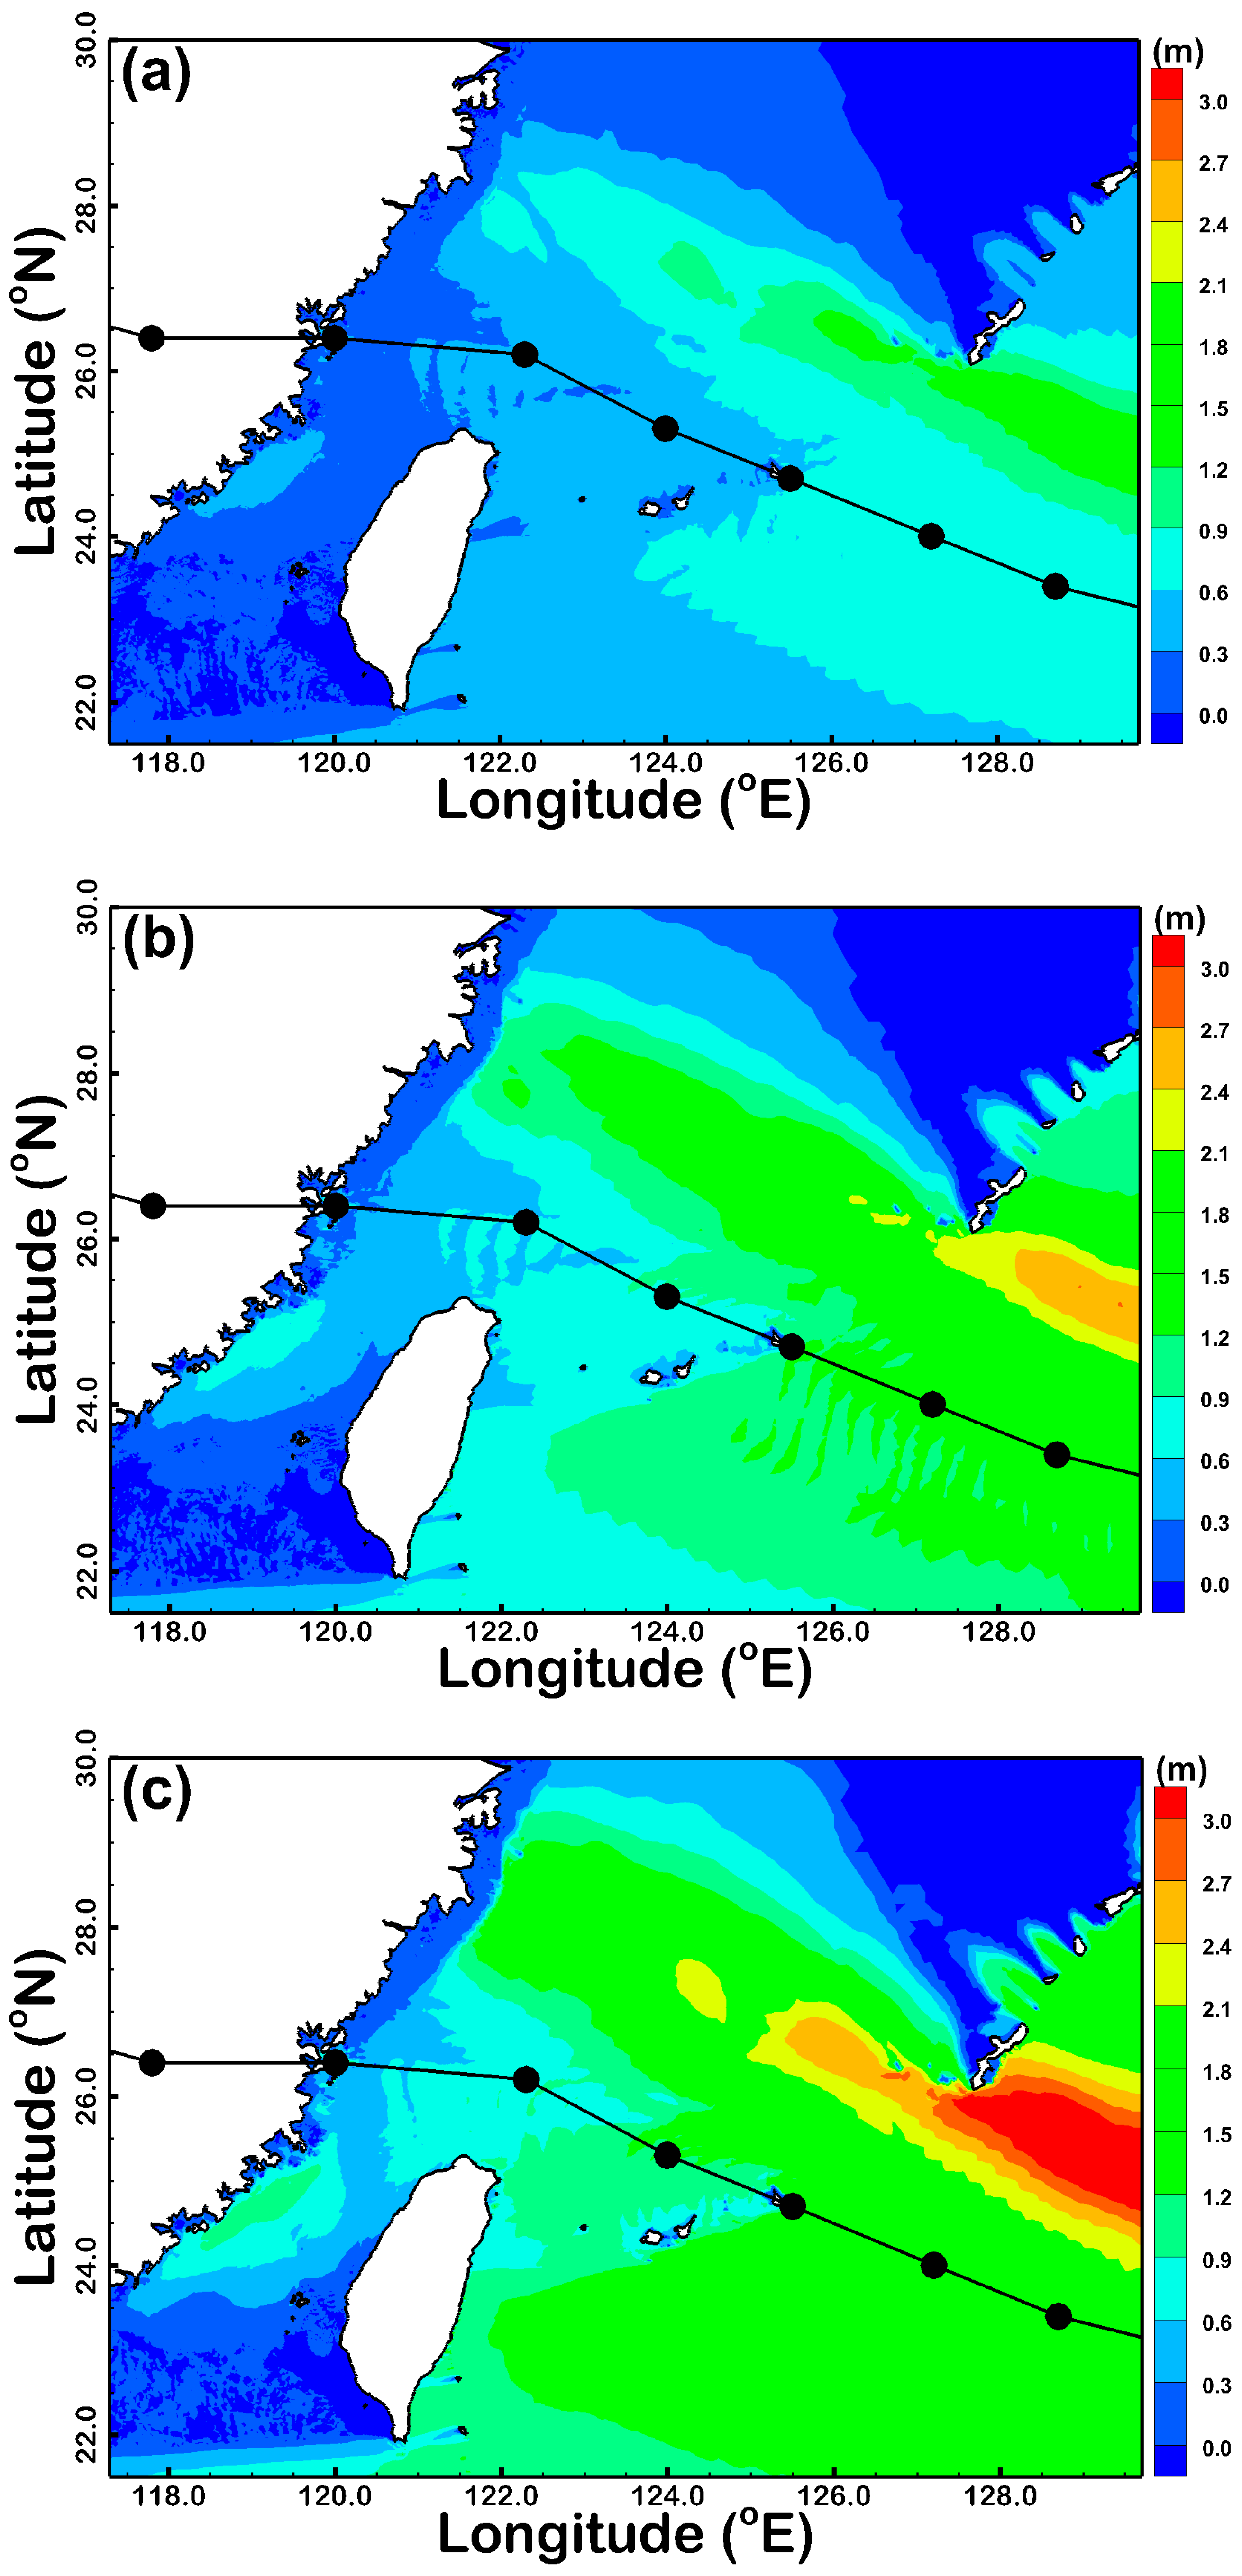
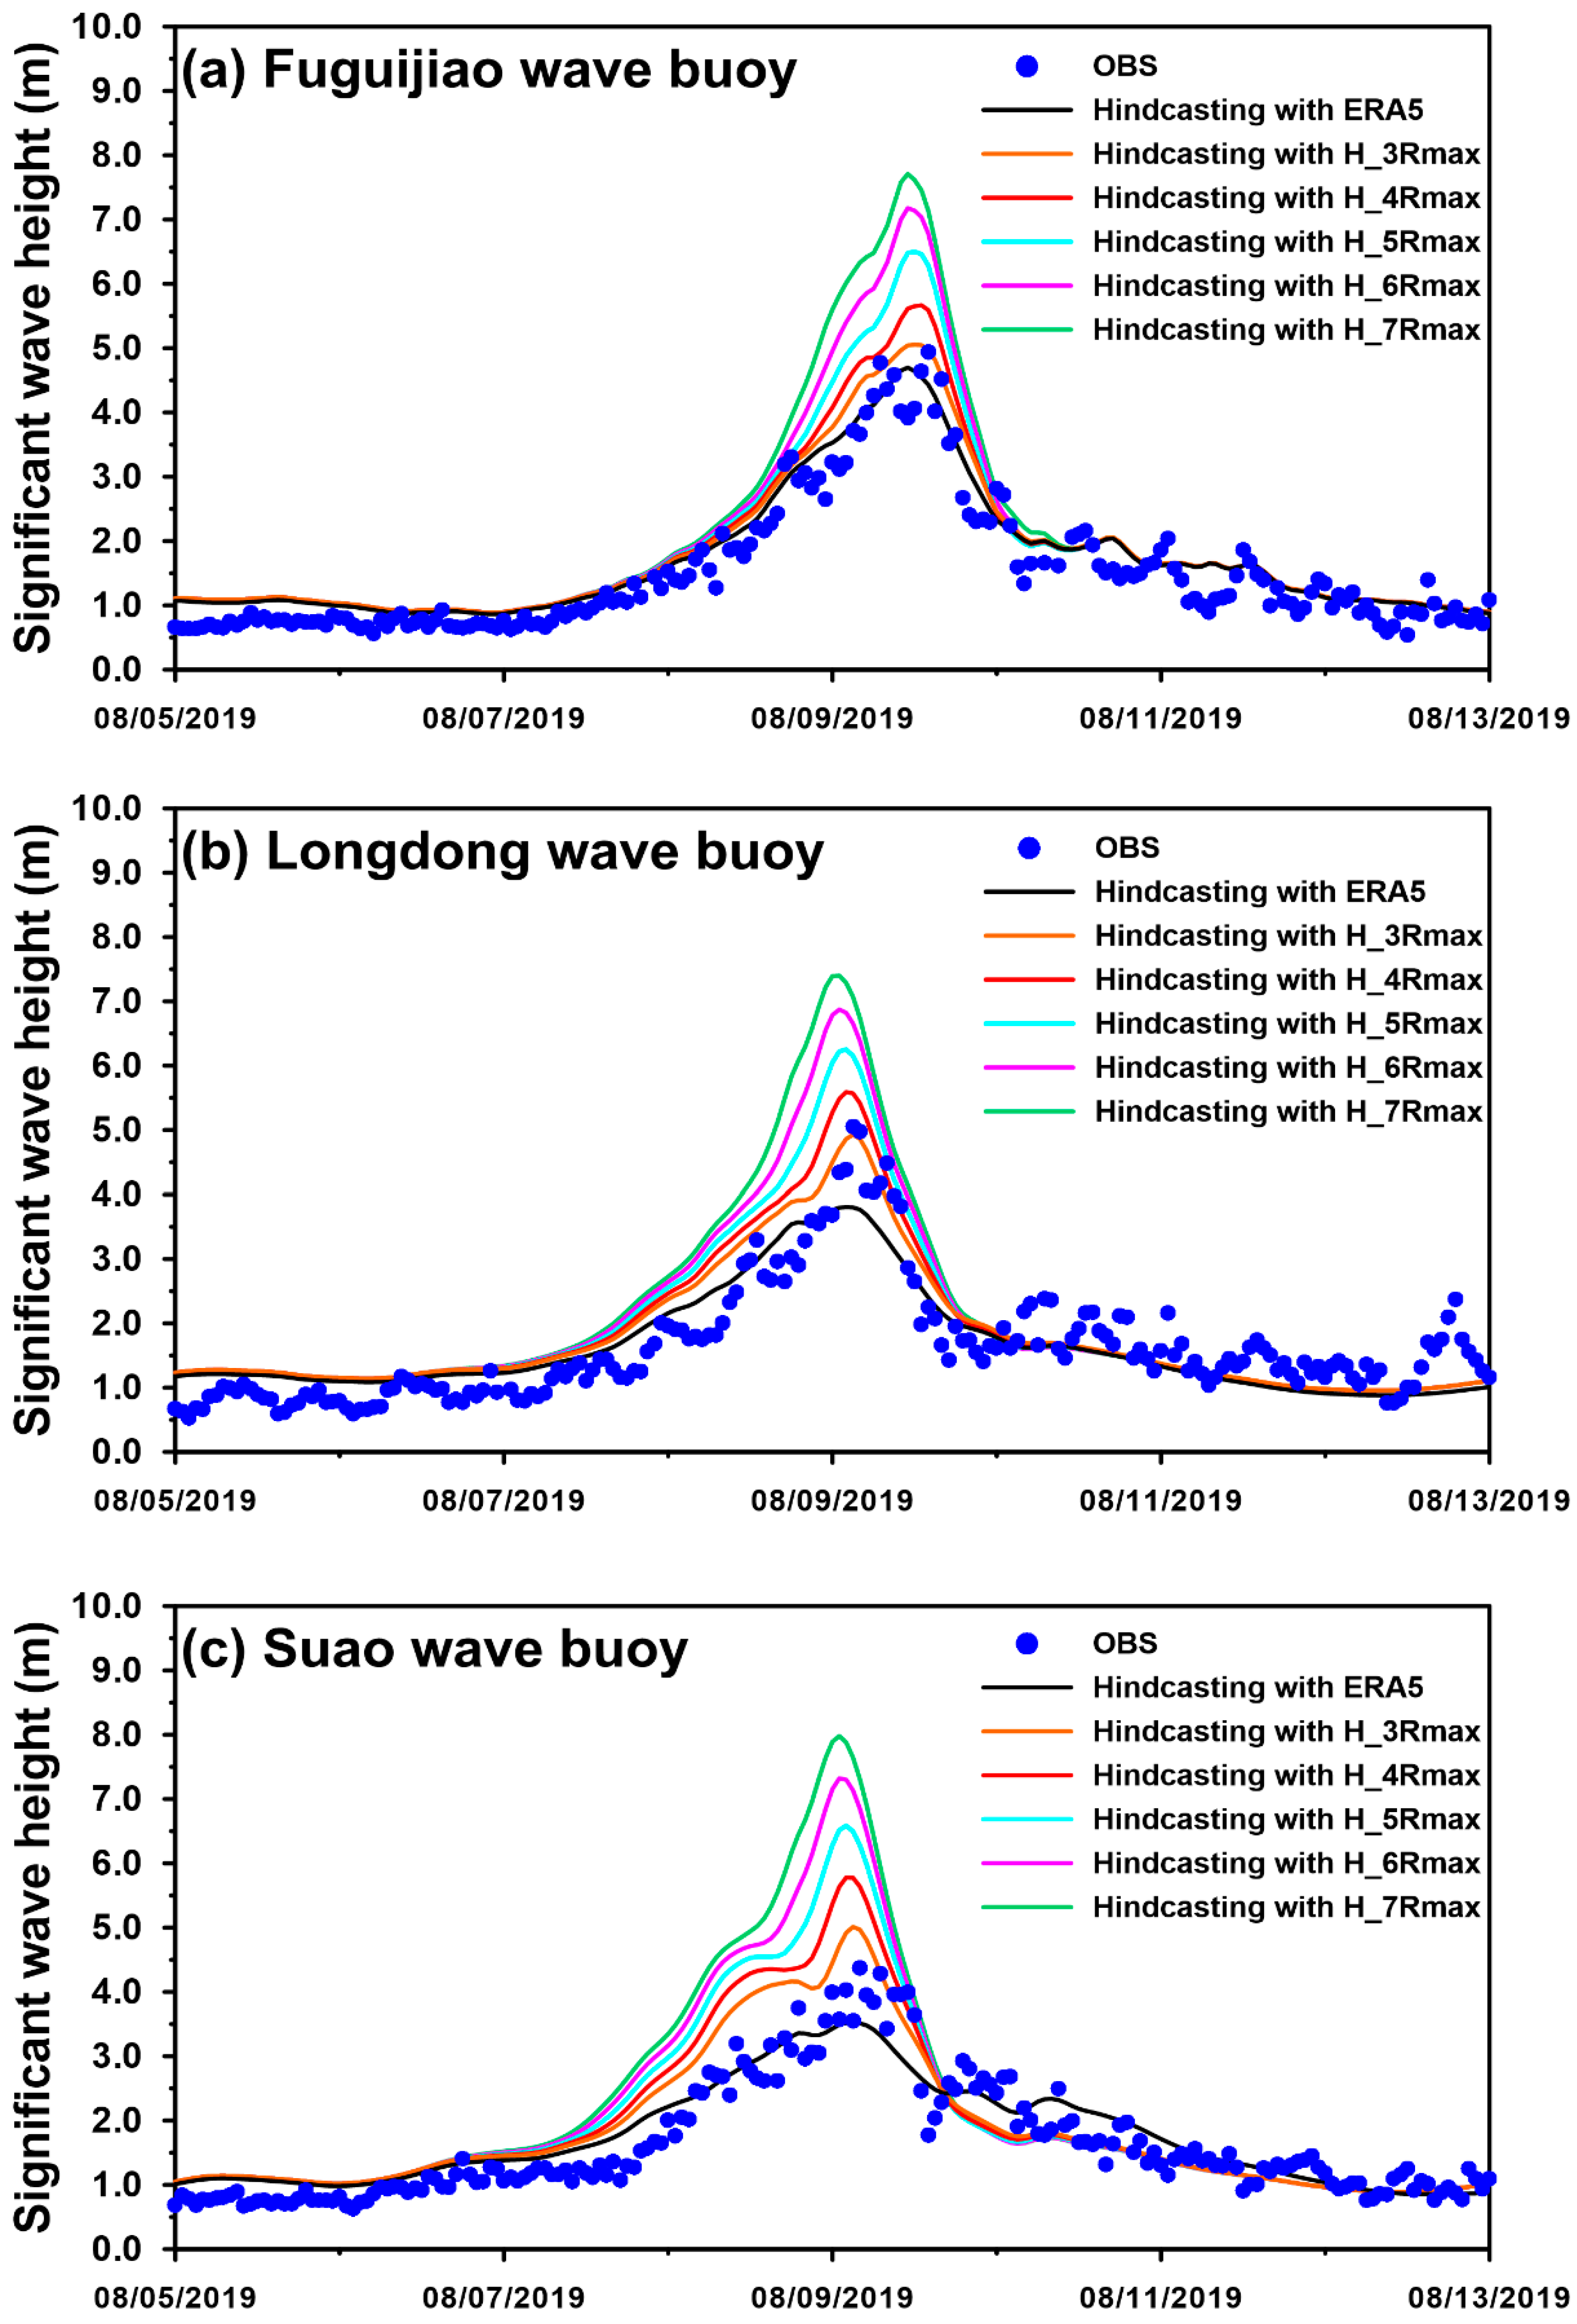
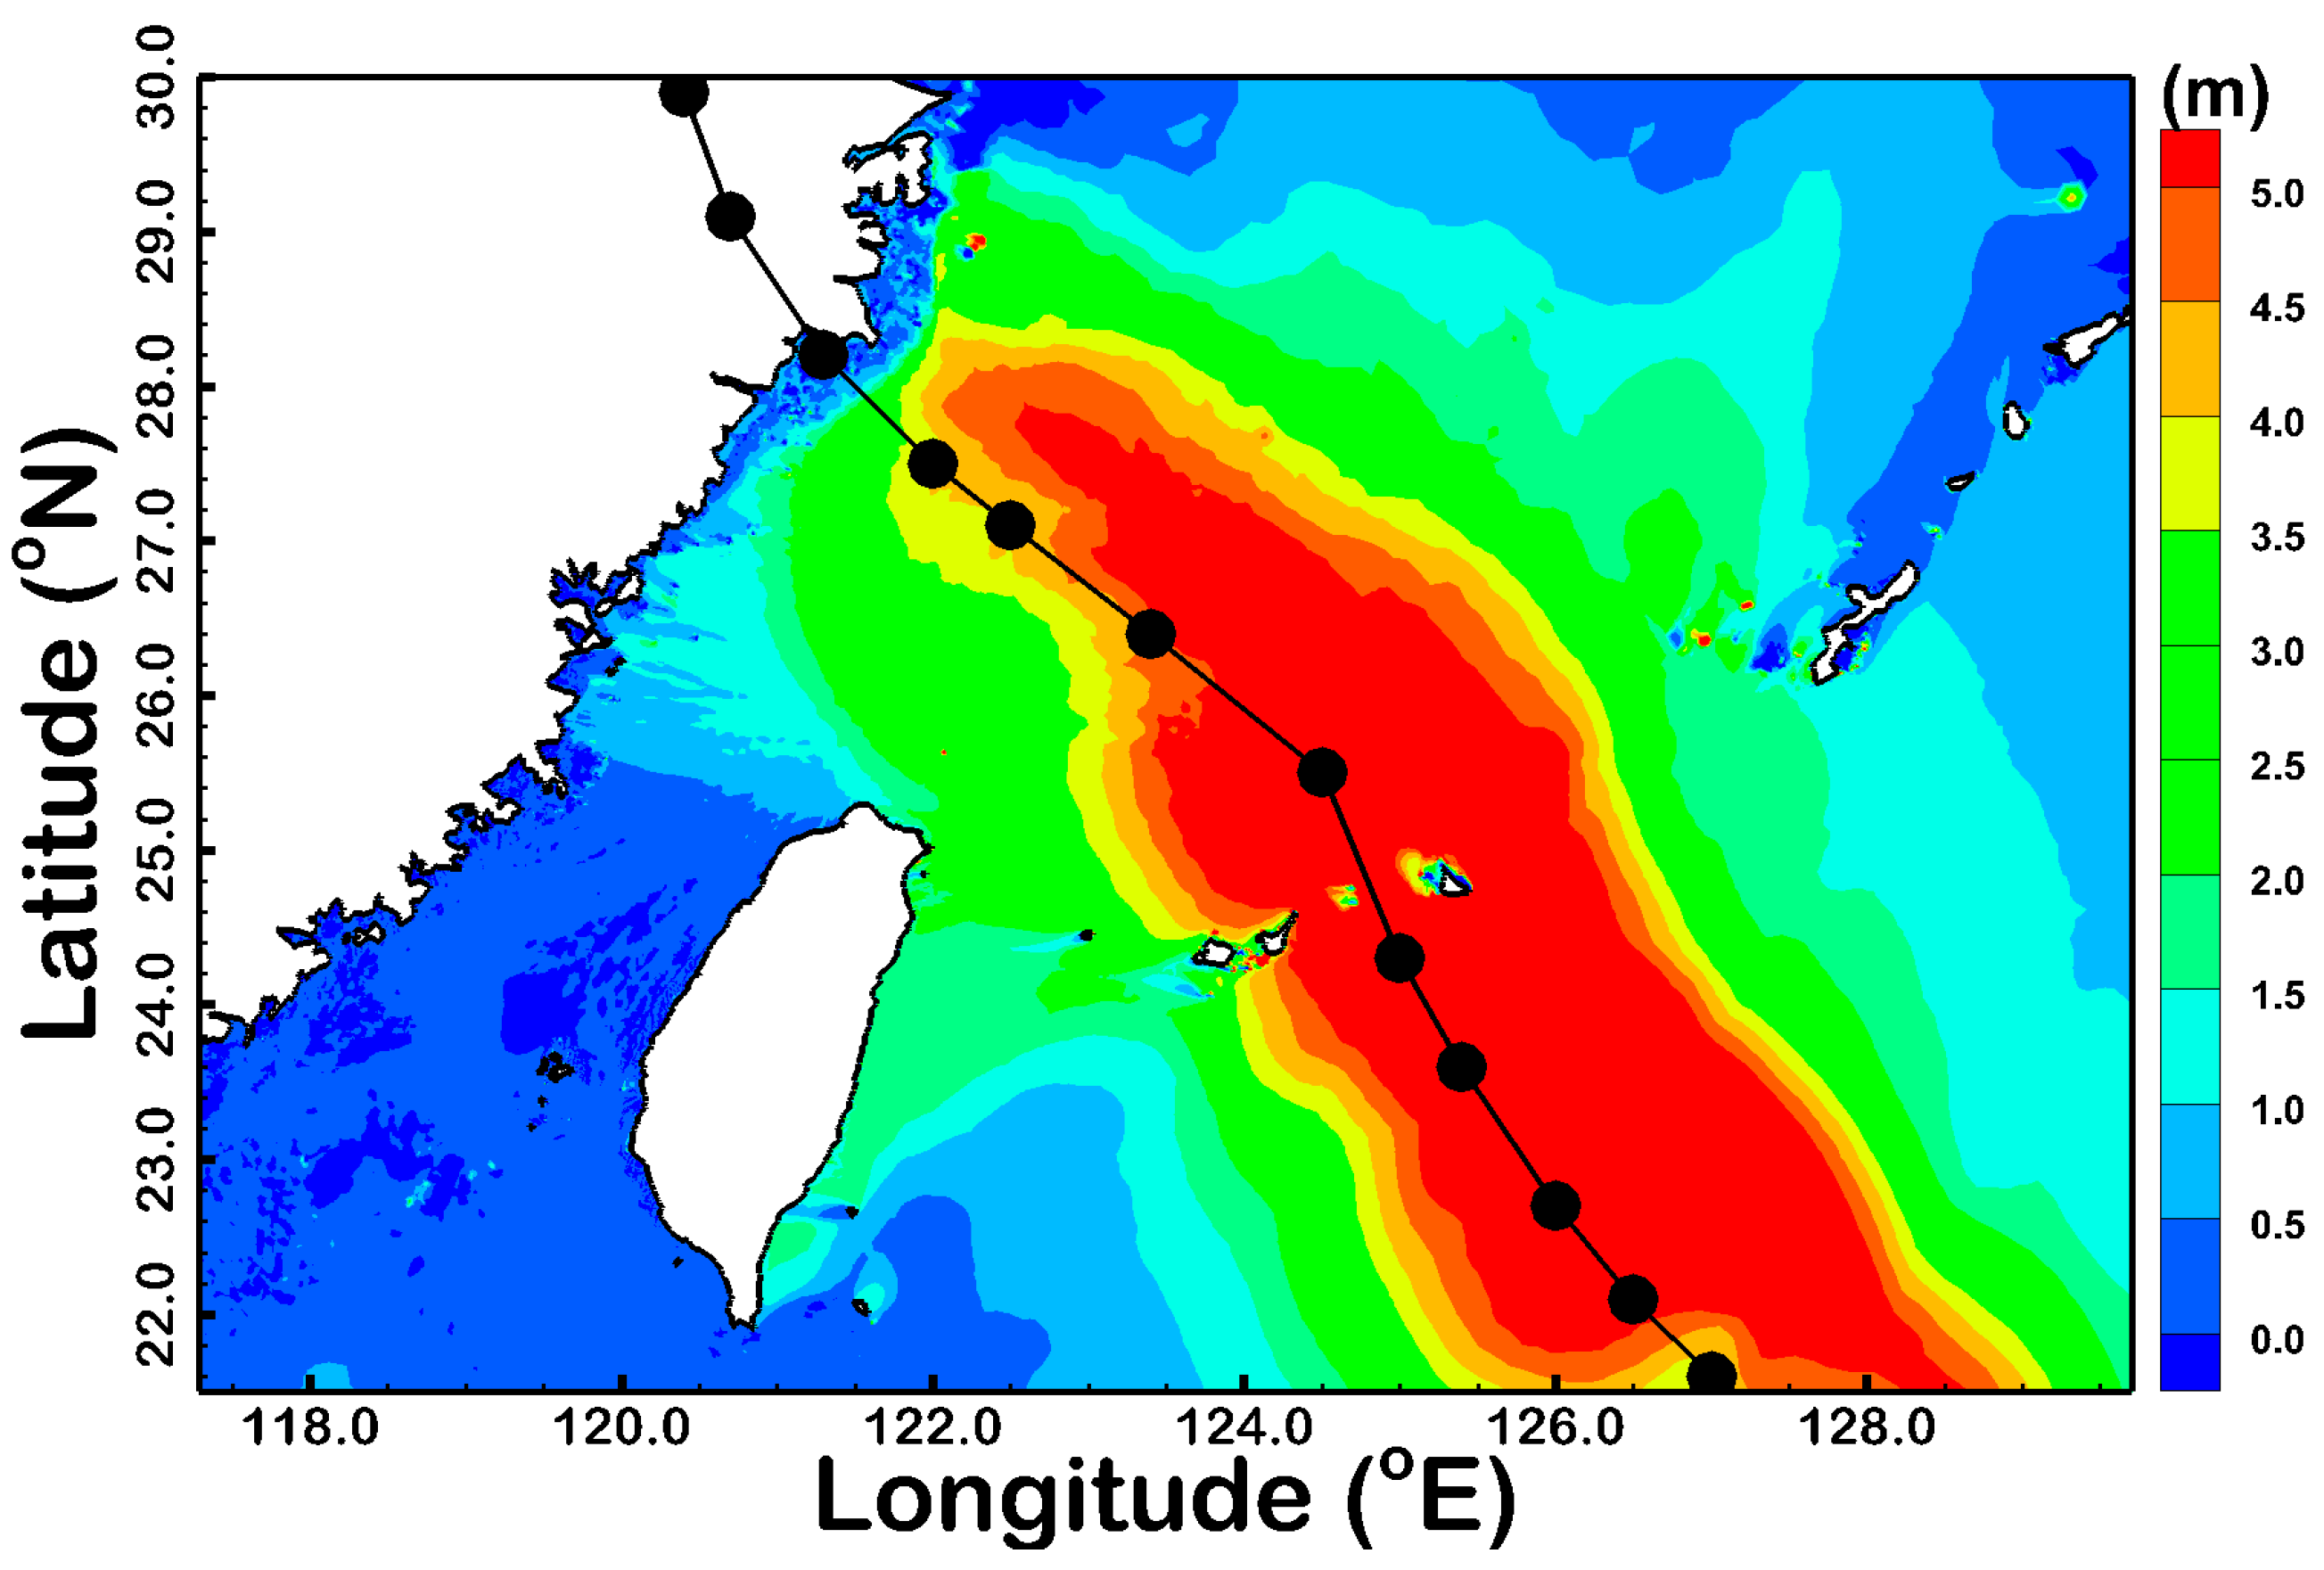
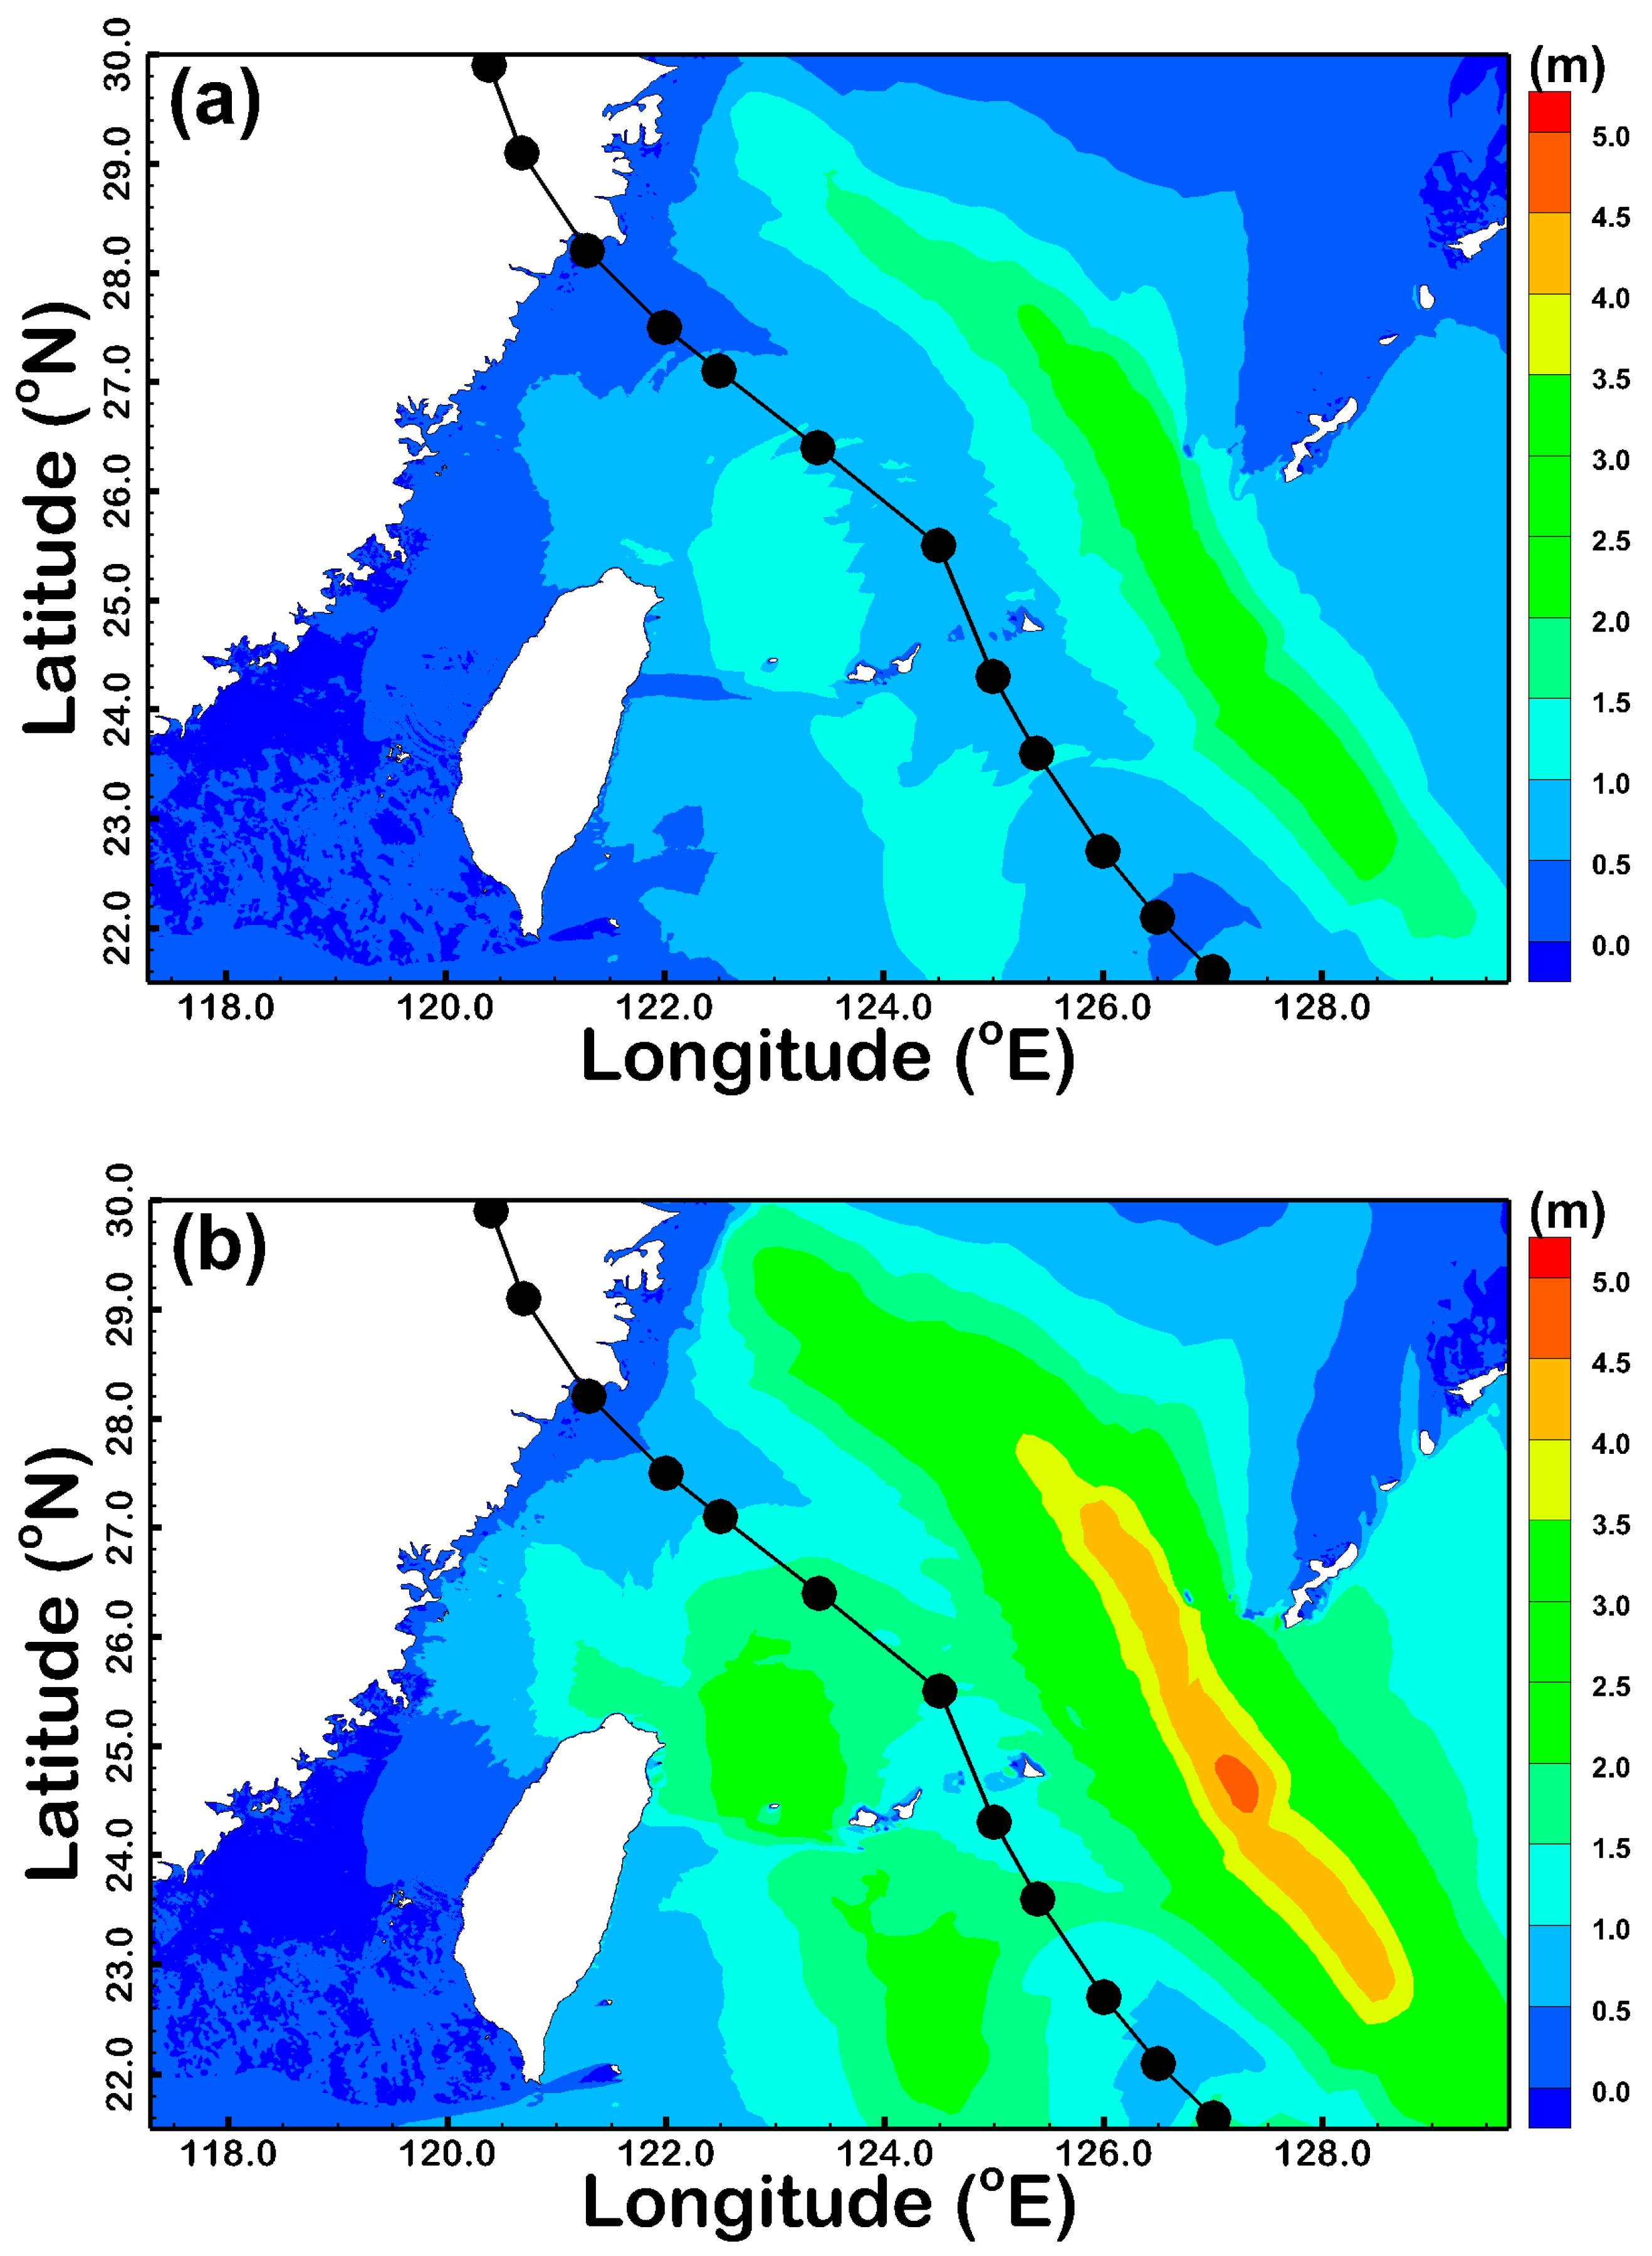
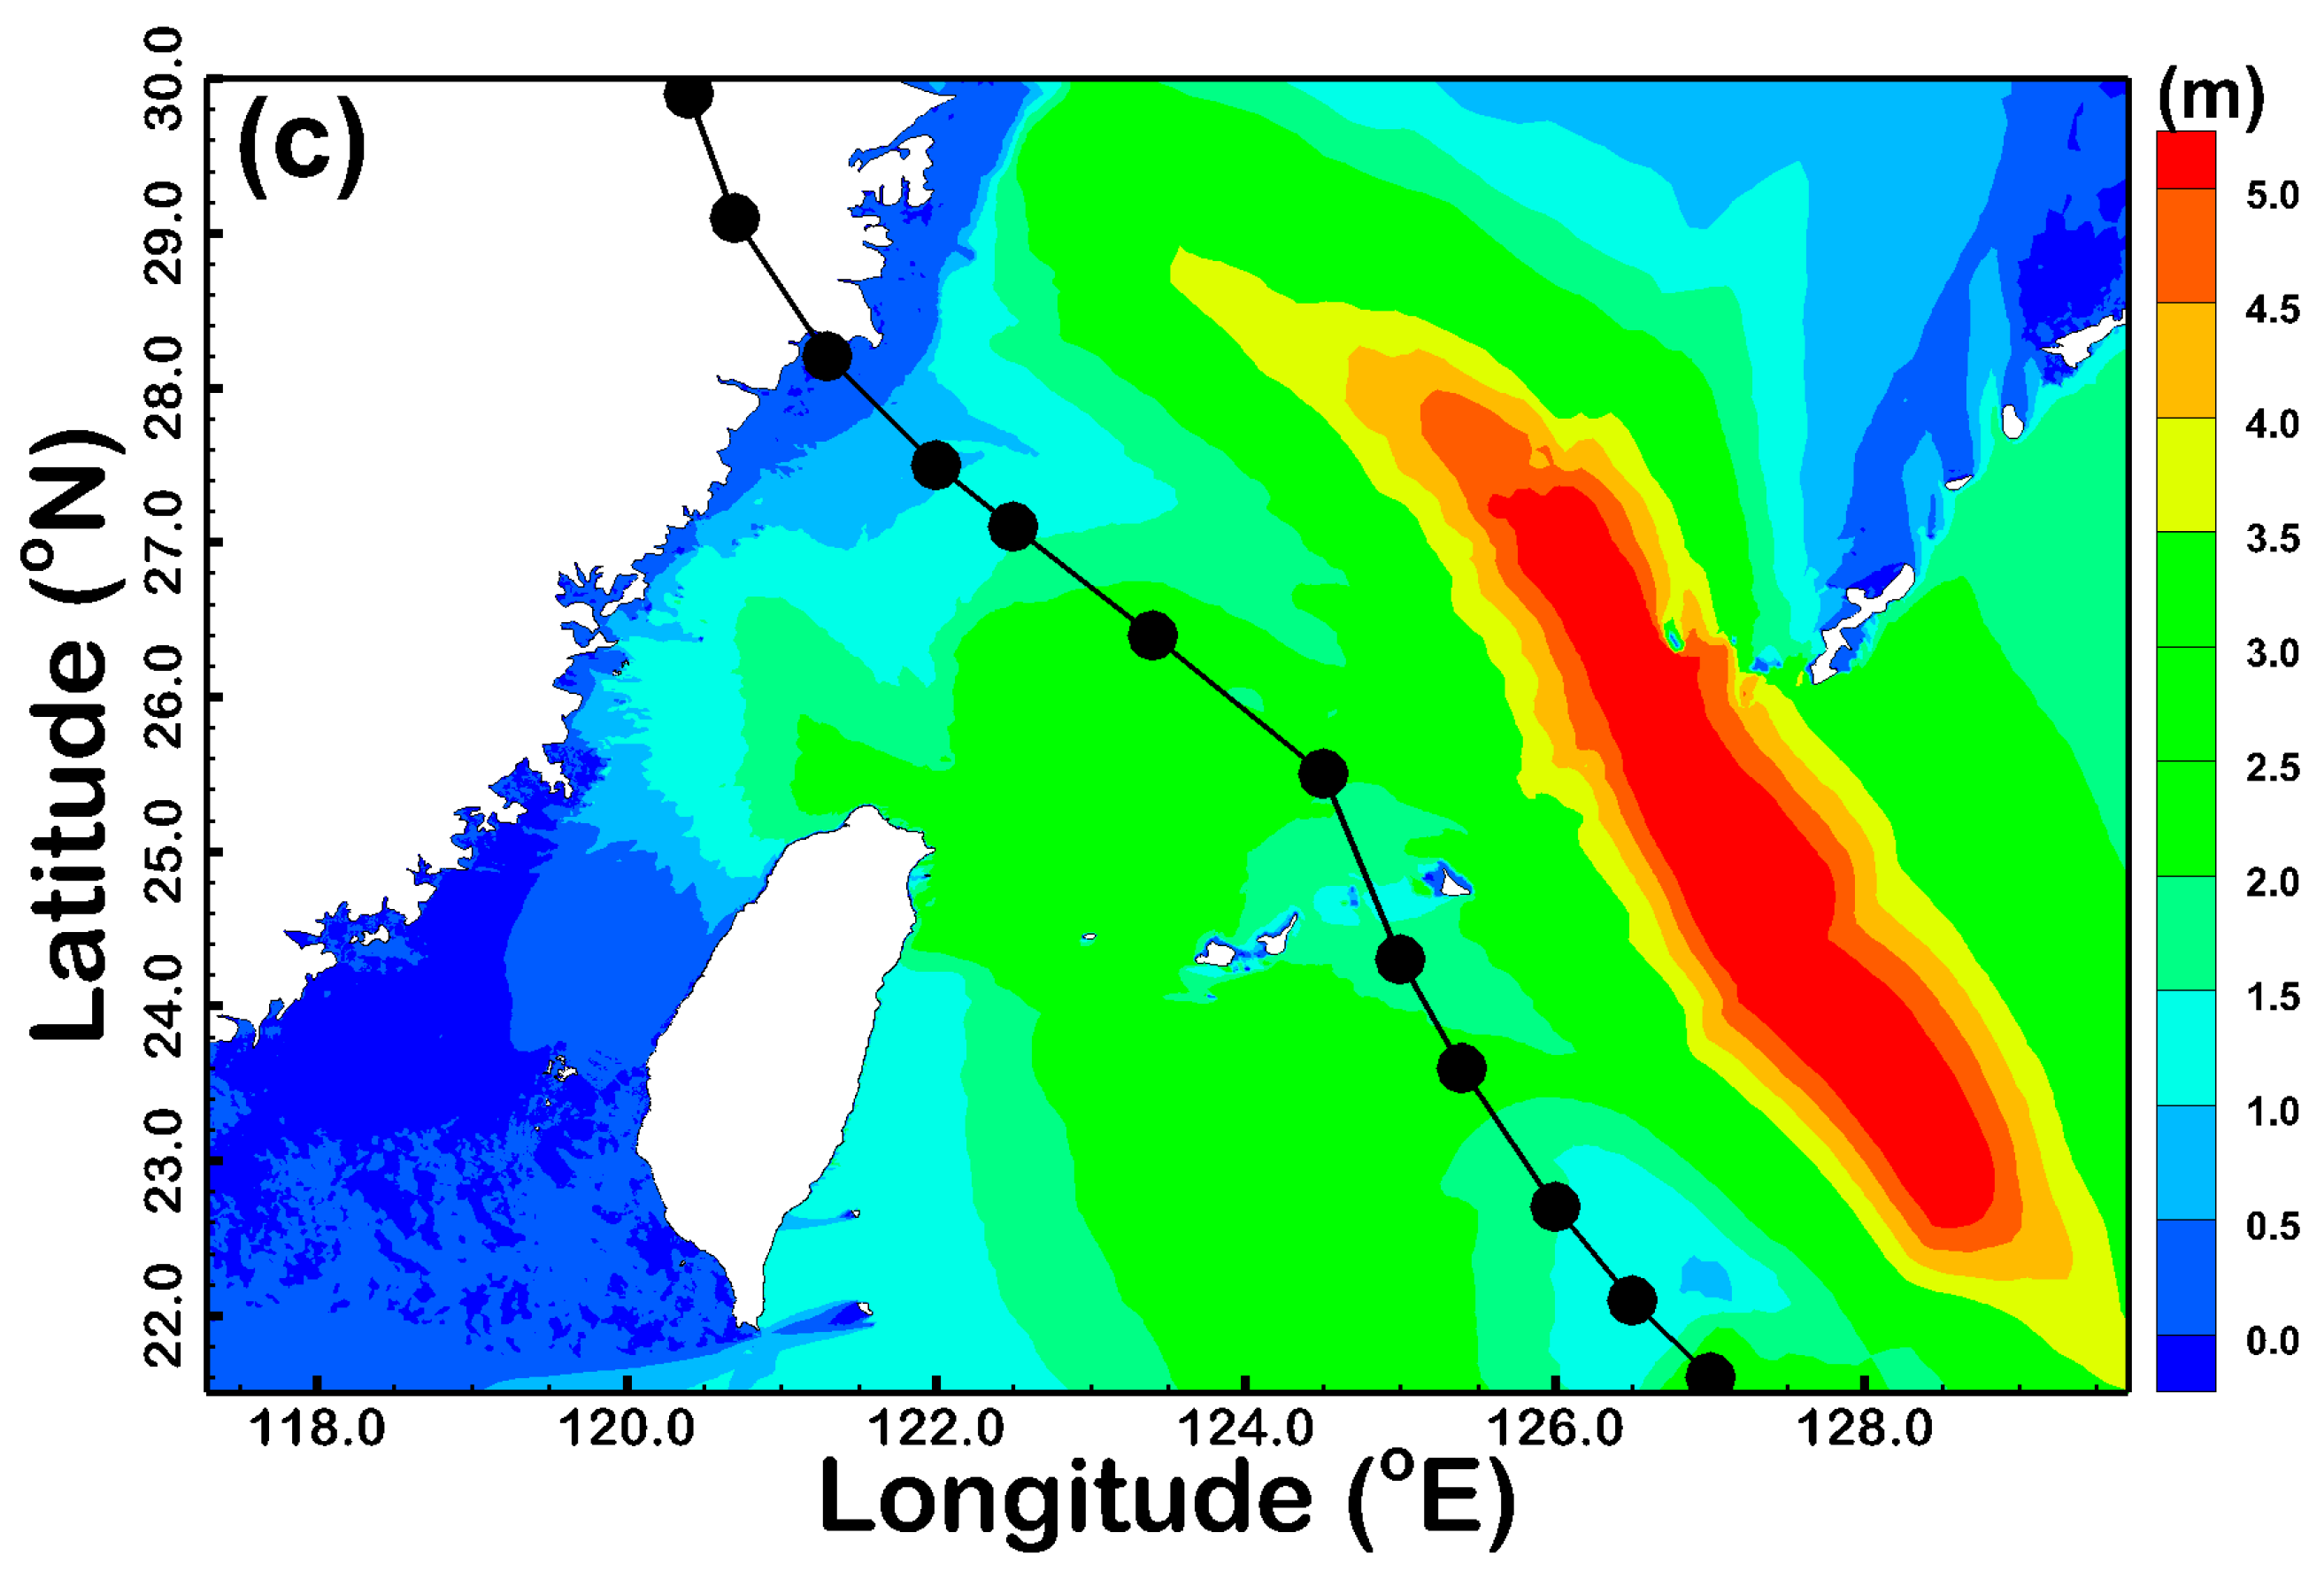
The inverse distance weighting method was employed to convert the hourly ERA5 and hybrid typhoon winds from the structured grid (at a horizontal resolution of 31 km) to the unstructured grid for the SCHISM-WWM-III modeling system. Comparisons of the SWH time series between model hindcasts using the different radii of the modified scale (Rtrs) and the corresponding measurements are depicted in Figure 3a–c for the Fuguijiao (Figure 3a), Longdong (Figure 3b) and Suao (Figure 3c) buoys during the passage of Super Typhoon Maria in 2018. The hindcasted peak wave heights are underestimated by 1.5 m and 2.0 m for the Fuguijiao and Longdong wave buoys, respectively, when the original ERA5 winds are used in the SCHISM-WWM-III modeling system but slightly overestimate the peak wave height within 0.5 m for the Suao buoy. Modified ERA5 winds with various Rtrs were imposed on the SCHISM-WWM-III modeling system to improve the performance of typhoon wave hindcasts. The hybrid winds with Rtrs = 3Rmax, Rtrs = 4Rmax, Rtrs = 5Rmax, Rtrs = 6Rmax and Rtrs = 7Rmax are called the H_3Rmax, H_4Rmax, H_6Rmax, H_6Rmax and H_7Rmax winds, respectively. As shown in Figure 3a–c, the hindcasted peak wave heights for all three wave buoys increased when using a larger Rtrs value. For instance, the hindcasted peak wave height was raised to 7.5 m for the Fuguijiao wave buoy by exerting H_4Rmax winds on the SCHISM-WWM-III modeling system (as shown in Figure 3a). Similar phenomena can be found in Figure 3b (for the Longdong wave buoy) and Figure 3c (for the Suao wave buoy). The hindcasted peak wave heights were always underestimated for the Fuguijiao wave buoy even though H_7Rmax winds were utilized. However, the SCHISM-WWM-III modeling system overestimated the peak wave height for the Suao wave buoy once the hybrid typhoon winds were used for the meteorological boundary conditions. Figure 4 illustrates the spatial distribution of the difference in the maximum hindcasted SWH between adopting the winds from H_4Rmax and the original ERA5 for Super Typhoon Maria in 2018. Significant differences can be detected along the track of Super Typhoon Maria, and the extents with differences exceeding 3.0 m occurred in the deep ocean. The spatial distributions of the difference in maximum hindcasted SWH between employing the winds from H_5Rmax and H_4Rmax, H_6Rmax and H_4Rmax and H_7Rmax and H_4Rmax are demonstrated in Figure 5a–c, respectively. The difference in maximum hindcasted SWH using different winds increased when Rmax was enlarged. The maximal differences were always distributed over the right side of Super Typhoon Maria in 2018, where the wind speed was highest (as shown in Figure 5a–c). The same validation process was conducted to verify the SWH hindcasts for Super Typhoon Lekima in 2019. Figure 6 presents the comparisons of the SWH time series between model hindcasts using the different Rtrs values and the corresponding measurements or the Fuguijiao (Figure 6a), Longdong (Figure 6b) and Suao (Figure 6c) buoys during the period of Super Typhoon Lekima in 2019. The hindcasts from the use of the H_3Rmax and H_4Rmax winds are more satisfactory for all three wave buoys. The improvements in the hindcasted peak SWH for Super Typhoon Lekima in 2019 are obvious; for example, the difference in the maximum hindcasted SWH between inputting the winds from H_4Rmax and the original ERA5 were up to 5 m in the deep ocean (as shown in Figure 7). The spatial distributions of the difference in maximum hindcasted SWH between applying the winds from H_5Rmax and H_4Rmax, H_6Rmax and H_4Rmax and H_7Rmax and H_4Rmax for Super Typhoon Lekima in 2019 are shown in Figure 8a,c, respectively. Similar to the hindcasts of Super Typhoon Maria in 2018, maximal differences were also detected on the right side of Super Typhoon Lekima in 2019, where the wind speed was strongest and increased with the increase in Rtrs. According to the resulting storm wave hindcasts of Super Typhoons Maria in 2018 and Lekima in 2019, the hybrid wind field with Rtrs = 4Rmax, i.e., H_4Rmax winds, was adopted as the atmospheric forcing for the SCHISM-WWM-III modeling system to conduct a series of numerical experiments.

3.2. Effect of the Wave-Breaking Formulation on the Typhoon-Driven SWH Simulation in the Surf Zone

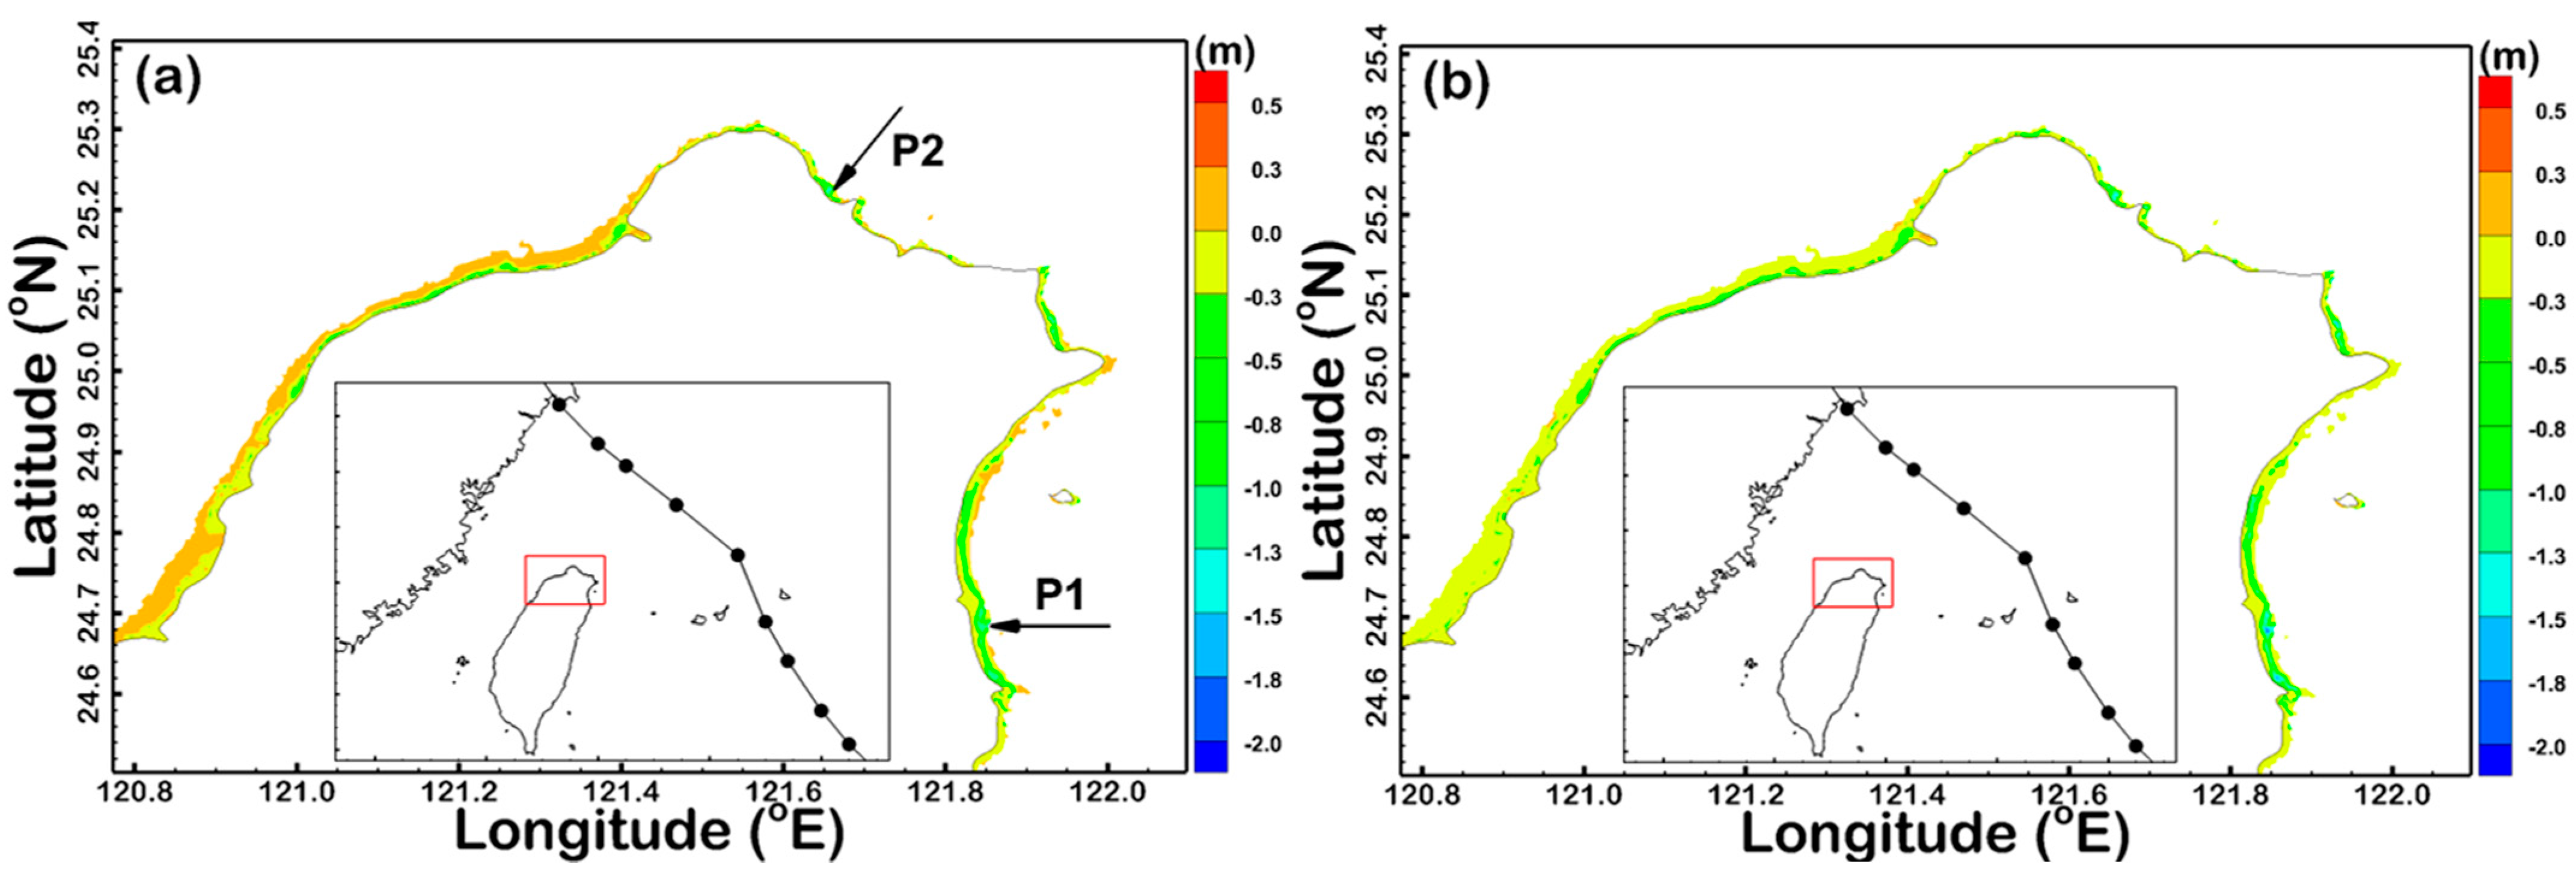
To assess the effects of different wave-breaking formulations on the wave hydrodynamics in shallow nearshore waters, three depth-induced wave-breaking parameterizations, introduced in Section 2.5, were applied to hindcast the typhoon waves with the constant wave breaking criterion (γ) and same wind forcing (Rtrs = 4Rmax winds). As listed in Table 2, the designed numerical experiments refer to S_NO1 and S_NO3 for the BJ87 and CT93 wave-breaking models, respectively, with a constant γ of 0.78. A wave-breaking index of 0.42, namely, γGT, is specified for the TG83 model in the present study, which is labeled S_NO2 in Table 2. The spatial distribution of the difference in the maximum SWH between the scenarios of S_NO1 and S_NO2 and S_NO1 and S_NO3 during passage Super Typhoon Maria in 2018 are depicted in Figure 9. Figure 9a,b illustrate the differences in S_NO1 and S_NO2 and S_NO1 and S_NO2, respectively. Large storm waves were generated in the deep ocean and subsequently dissipated due to the decrease in water depth across a surf zone toward the shore. Although the surf zone usually lies in a shallow area where the water depth ranges from 5 to 10 m below sea level, nearshore areas with water depths greater than −20 m are shown in Figure 9 to effectively distinguish among the difference in hindcasted SWHs by different wave-breaking models. The surf zones along the north and northeast coasts of Taiwan are quite narrow because these areas are characterized by a very steep sloping seafloor. The differences in the maximum SWH between the S_NO1 and S_NO3 scenarios (Figure 9b) are more significant than those between the S_NO1 and S_NO2 (Figure 9a) scenarios. Two points, namely, P1 and P2, located in the north and northeastern shallow nearshore waters, were selected to compare the time series of hindcasted SWHs for the S_NO1, S_NO2 and S_NO3 scenarios. The comparison results are presented in Figure 10a for P1 and Figure 10b for P2. The differences between the three scenarios can only be found during the passage of Super Typhoon Maria in 2018, i.e., from midday on 10 July to midday on 11 July in 2018. The maximal difference in the hindcasted SWH is approximately 2.5 m between the S_NO1 and S_NO3 scenarios for P2 (as shown in Figure 10b). However, the maximal difference in hindcasted SWH is within 1.0 m between the S_NO2 and S_NO3 scenarios for both P1 and P2 (as shown in Figure 10a,b). Similar results are also shown in Figure 11 (spatial distribution) and Figure 12 (time series comparison) for Super Typhoon Lekima in 2019. The maximal differences in hindcasted SWH in the shallow nearshore waters were smaller for Super Typhoon Lekima in 2019 than those for Super Typhoon Maria in 2018. The maximal difference in hindcasted SWH is approximately 1.5 m at P2 during the passage of Super Typhoon Lekima in 2019 (as shown in Figure 12b).

3.3. Effect of the Wave-Breaking Criterion on the Typhoon-Driven SWH Simulation in the Surf Zone

Many parameterizations of the wave-breaking criterion have been implemented within wind wave spectral models to yield substantial improvements in model hindcasts, simulations and forecasts. Hence, three scenarios, called S_NO1, S_NO4 and S_NO5, exploiting the BJ87 wave-breaking model with Rtrs = 4Rmax wind forcing and different wave-breaking criteria (γ), were applied to hindcast storm waves in the shallow nearshore waters of northern Taiwan during the passage of Super Typhoon Maria in 2018 and Lekima in 2019. The spatial distributions of the difference in the maximum SWH hindcasted by S_NO1 and S_NO4 and S_NO1 and S_NO5 during the passage of Super Typhoon Maria in 2018 are illustrated in Figure 13a,b, respectively. The differences caused by different wave-breaking criteria γ are smaller than those caused by different wave-breaking formulations. Figure 14a,b demonstrate the time series of hindcasted SWHs for P1 and P2 using the S_NO1, S_NO4 and S_NO5 scenarios during the passage of Super Typhoon Maria in 2018. The maximal difference is within 1.0 m at P2 (as shown in Figure 14b) but is less than 0.5 m at P1 (Figure 14a). The same phenomena were also detected in both the spatial distribution (as shown in Figure 15a,b) and time series of the hindcasted SWHs (as shown in Figure 16a,b) during the passage of Super Typhoon Lekima in 2019. Interestingly, the SWHs hindcasted by a constant γ (S_NO1 scenario) are usually smaller than those hindcasted by γ based on local steepness (S_NO4 scenario) and peak steepness (S_NO5 scenario).

4. Discussion and Uncertainty

Hindcasting an accurate storm wave height is highly dependent on the accuracy of the typhoon wind fields. Reanalysis wind products underestimate typhoon winds, e.g., Çalışır et al. [53] evaluated the quality of ERA5 and CFSR (Climate Forecast System Reanalysis) winds and the contribution of reanalysis wind products to a wave modeling performance in a semi-closed sea. Their results revealed that ERA5 and CFSR tend to underestimate wind speeds, and ERA5 performs worse than CFSR at higher wind speeds (such as typhoon winds) and better at lower wind speeds. Thus, the utilization of hybrid winds through the superposition method (the combination of reanalysis wind products and parametric cyclone wind models) or the direct modification method (the combination of reanalysis wind products and the maximum wind speeds of typhoons from the best track data) is the most advantageous to consider storm wave hindcasting in both near-field and far-field regions of the typhoon’s center. However, uncertainty remains to be clarified; that is, the radius of the modified scale (Rtrs) cannot be formulated universally for each typhoon. Owing to the WBmax is higher than WEmax, the area with stronger winds of a typhoon is extended as Rtrs increases (according to Equation (1)). This expansion allows the hindcasted SWHs to grow earlier and attenuate later (i.e., larger) than the measurements (as shown in Figure 3 and Figure 6). Additionally, as shown in Figure 3b,c, the measured peak SWH at the Suao wave buoy occurred two hours earlier than that at the Longdong wave buoy. However, the occurrence time of hindcasted peak SWH at the Suao wave buoy coincided with that at the Longdong wave buoy. This phenomenon might be due to the low spatial resolution of the original ERA5 winds (at roughly 31 km), and the periphery circulation of a typhoon cannot be resolved with such a coarse spatial resolution. Although the wind field derived from Rtrs = 4Rmax is employed for designing a series of model experiments based on limited case studies, further studies are still needed to verify it.
Fully coupled ocean circulation and spectral wave numerical modeling systems are undergoing widespread use for all types of regional applications, such as operational predictions, wave climate evaluations, extreme storm waves and surge analyses. However, the wave-induced hydrodynamics during the period of typhoons in shallow nearshore waters simulated by these modeling systems remain uncertain. The scarcity of field observations for wave parameters in the surf zone to verify the modeling systems is one of the most important factors leading to uncertainty.
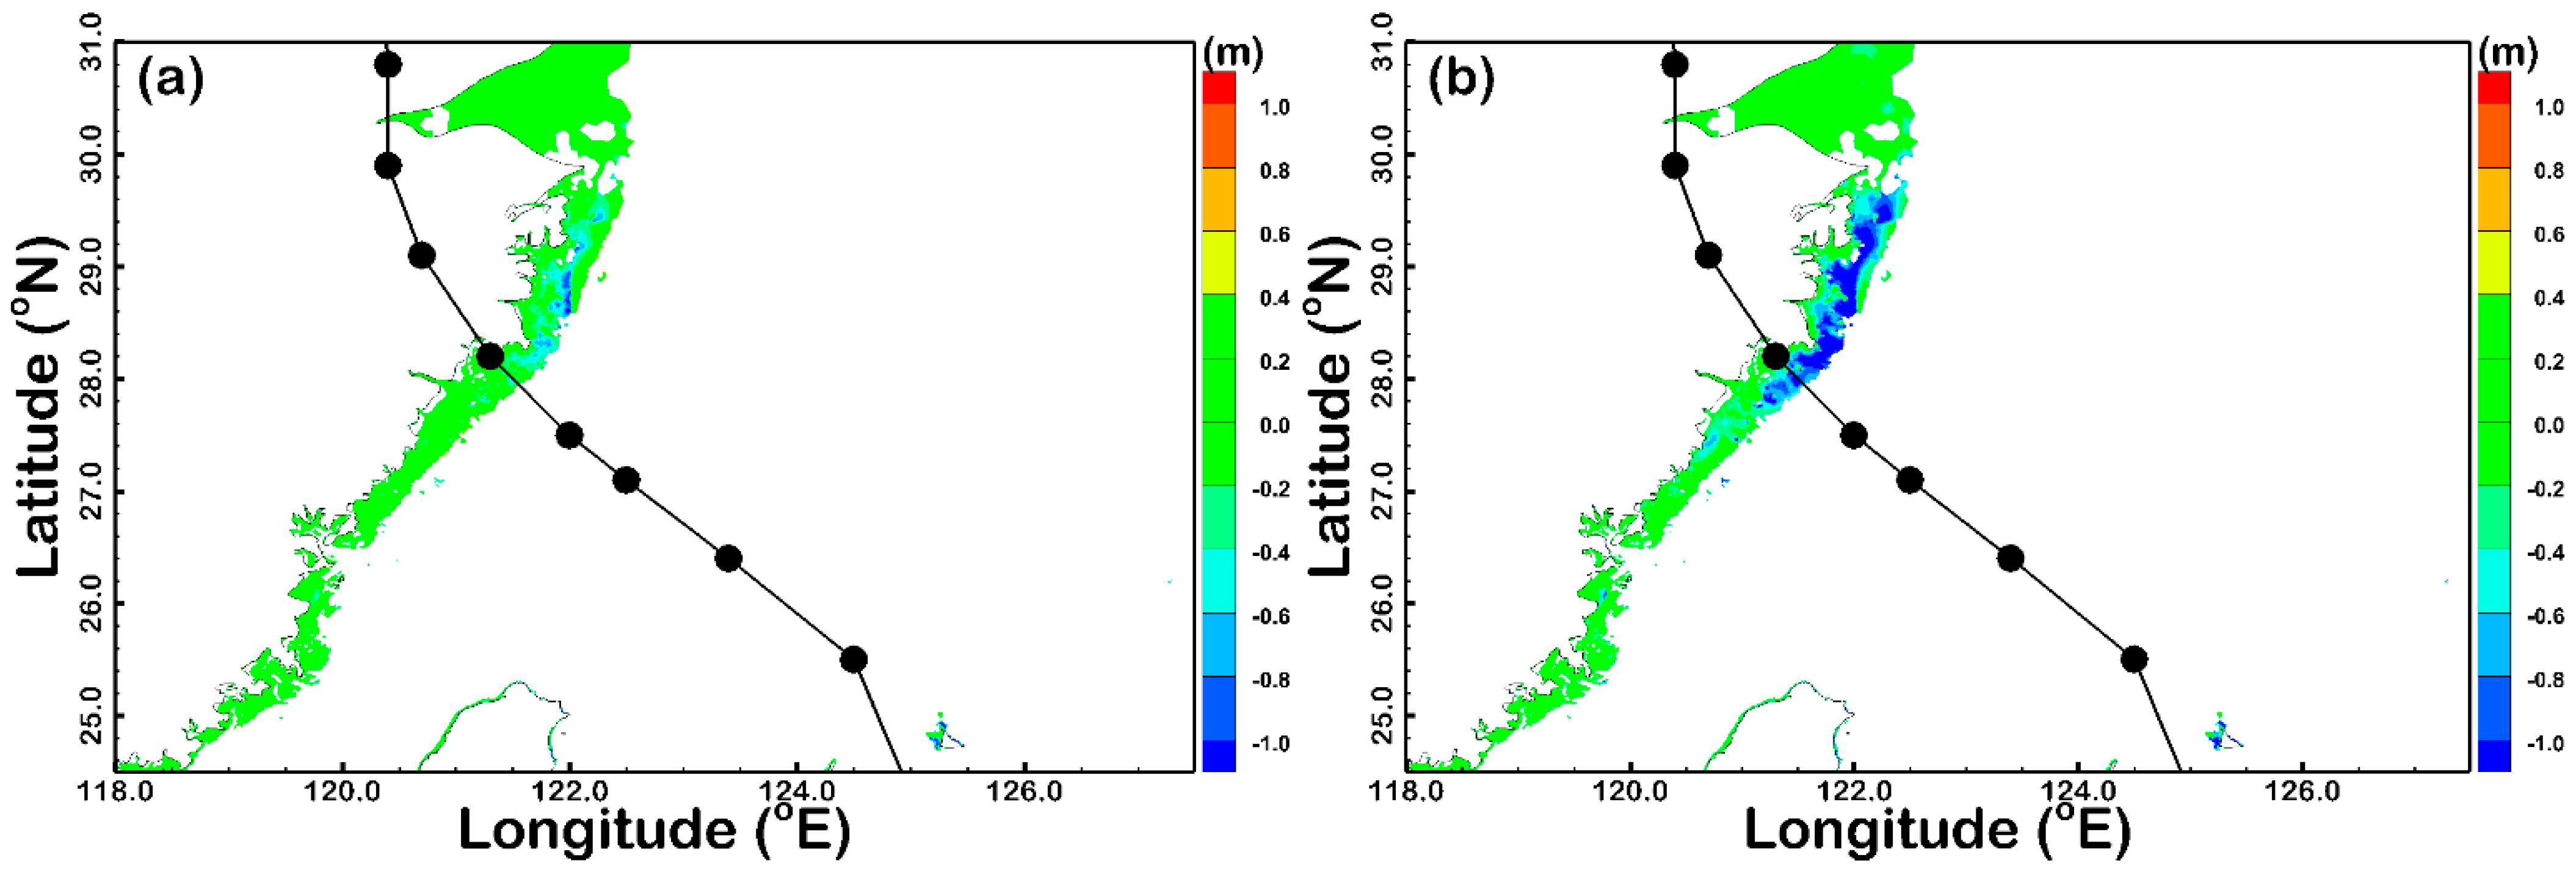
The SWH simulations in the surf zone are more sensitive to the various wave-breaking formulations than the various wave-breaking criteria. To reconfirm the result obtained from Section 3.2, the spatial distribution of the difference in the maximum SWH between the scenarios of S_NO1 (wave-breaking formulation of BJ87 with constant wave-breaking criteria) and S_NO2 (wave-breaking formulation of TG83 with constant wave-breaking criteria) and S_NO1 and S_NO3 (wave-breaking formulation of CT93 with constant wave-breaking criteria) in the surf zone (sea areas with water depths greater than −20 m are shown) of southeastern China for Super Typhoons Maria in 2018 and Lekima in 2019 are shown in Figure 17 and Figure 18, respectively. As seen in Figure 17 and Figure 18, the differences in maximum SWH between the S_NO1 and S_NO3 scenarios (Figure 17b and Figure 18b) are higher than those between the S_NO1 and S_NO2 scenarios (Figure 17a and Figure 18a) for both typhoons. Additionally, the surf zones with significant differences in maximum SWH resulting from the various wave-breaking formulations occur on the right side of the typhoons where the wind speeds are stronger. These findings are identical to the result derived from Section 3.2 and the reports from previous studies [54,55,56,57].

5. Summary and Conclusions

In this paper, the effects of wave breaking formulations and wave breaking criteria in hindcasting typhoon-driven storm waves are investigated for shallow nearshore waters off northern Taiwan. A fully coupled high-resolution, unstructured grid wave-circulation modeling system, SCHISM-WWM-III, with a large computational domain was applied to hindcast the wind waves caused by the passages of Super Typhoon Maria in 2018 and Super Typhoon Lekima in 2019. The ERA5 reanalysis product were merged with the maximum wind from the best track dataset, and the hybrid typhoon wind created and served as the meteorological conditions for the SCHISM-WWM-III modeling system through a direct modification technique. The hindcasted SWHs during the typhoon period were more sensitive to the radius of the modified scale, Rtrs and this phenomenon was more pronounced at the peak SWH. Rtrs equal to four times Rmax (the radius at the maximum typhoon wind speed) is an adequate radius of the modified scale for simulating the storm waves induced by Super Typhoon Maria in 2018 and Super Typhoon Lekima in 2019 via model validations. A series of numerical experiments were conducted using the SCHISM-WWM-III modeling system incorporated with modified typhoon winds to better understand the wave hydrodynamics in the shallow nearshore waters off northern Taiwan. The results derived from the designed numerical experiments reveal that the wave breaking formulations influence the hindcast of storm waves in the surf zone of northern Taiwan. The maximum difference in peak SWH could reach 2.5 m and 1.2 m for Super Typhoons Maria (2018) and Lekima (2019), respectively, when the wave-breaking formulations of BJ78 and CT93 were introduced to the SCHISM-WWM-III modeling system. Regarding the wave-breaking criterion on the hindcast of typhoon waves in the surf zone of northern Taiwan, compared with the wave-breaking formulation, the maximum difference in peak SWHs was relatively non-sensitive to the wave-breaking criterion. The maximum difference in peak SWH is only 0.5 m using the constant breaking criterion, the breaking criterion based on local steepness or the breaking criterion based on peak steepness. Another important finding is that the utilization of the BJ78 wave-breaking formulation usually underpredicts the typhoon-generated SWHs in shallow nearshore waters than other parametrizations (i.e., TG83 and CT93). In future research, it will be important to acquire measurements in the surf zone where wave hydrodynamics are more sensitive to wave-breaking formulations and criteria during the passage or landfall of typhoons.

Author Contributions

Conceptualization, S.-C.H. and W.-B.C.; data curation, H.-L.W. and W.-D.G.; formal analysis, W.-D.G.; investigation, W.-B.C.; methodology, H.-L.W. and W.-B.C.; software, C.-H.C. and W.-R.S.; supervision, S.-C.H.; writing–original draft, W.-B.C.; Writing–review and editing, S.-C.H. All authors have read and agreed to the published version of the manuscript.

Funding

This research was supported by the Ministry of Science and Technology (MOST), Taiwan, grant No. MOST 109-2221-E-865-001.

Institutional Review Board Statement

Not applicable.

Informed Consent Statement

Not applicable.

Data Availability Statement

Publicly available datasets were analyzed in the present study. The data can be found here: https://ocean.cwb.gov.tw/V2/ (accessed date on 26 June 2021).

Acknowledgments

The authors thank the Central Weather Bureau, Ministry of Transportation and Communications, Taiwan, for providing the survey data and Joseph Zhang at the Virginia Institute of Marine Science, College of William and Mary, for kindly sharing his experiences using the numerical model.

Conflicts of Interest

The authors declare no conflict of interest.

References

  1. Reguero, B.G.; Losada, I.J.; Méndez, F.J. A recent increase in global wave power as a consequence of oceanic warming. Nat. Commun. 2019, 10, 205. [Google Scholar] [CrossRef] [Green Version]
  2. Stockdon, H.F.; Sallenger, A.H.; Holman, R.A.; Howd, P.A. A simple model for the spatially-variable coastal response to hurricanes. Mar. Geol. 2007, 238, 1–20. [Google Scholar] [CrossRef]
  3. Hoeke, R.K.; McInnes, K.L.; Kruger, J.C.; McNaught, R.J.; Hunter, J.R.; Smithers, S.G. Widespread inundation of Pacific islands triggered by distant-source wind-waves. Glob. Planet. Chang. 2013, 108, 128–138. [Google Scholar] [CrossRef] [Green Version]
  4. Wadey, M.; Brown, S.; Nicholls, R.J.; Haigh, I. Coastal flooding in the Maldives: An assessment of historic events and their implications. Nat. Hazards 2017, 89, 131–159. [Google Scholar] [CrossRef] [Green Version]
  5. Melet, A.; Almar, R.; Hemer, M.; le Cozannet, G.; Meyssignac, B.; Ruggiero, P. Contribution of wave setup to projected coastal sea level changes. J. Geophys. Res. Ocean. 2020, 125, e2020JC016078. [Google Scholar] [CrossRef]
  6. Hoefel, F.; Elgar, S. Wave-induced sediment transport and sandbar migration. Science 2003, 299, 1885–1887. [Google Scholar] [CrossRef] [PubMed] [Green Version]
  7. Feddersen, F. Scaling surf zone turbulence. Geophys. Res. Lett. 2012, 39, L18613. [Google Scholar] [CrossRef] [Green Version]
  8. Longuet-Higgins, M.S.; Stewart, R.W. Radiation stresses in water waves; a physical discussion, with applications. Deep Sea Res. 1964, 11, 529–562. [Google Scholar] [CrossRef]
  9. Battjes, J.A.; Stive, M.J.F. Calibration and verification of a dissipation model for random breaking waves. J. Geophys. Res. 1985, 90, 9159–9167. [Google Scholar] [CrossRef]
  10. Nairn, R.B. Prediction of Cross-Shore Sediment Transport and Beach Profile Evolution. Ph.D. Thesis, Imperial College London, London, UK, 1990. [Google Scholar]
  11. Holthuijsen, L.H.; Booij, N. Experimental Wave Breaking in SWAN. In Coastal Engineering 2006; McKee Smith, J., Ed.; American Society of Civil Engineers: New York, NY, USA, 2006; pp. 392–402. [Google Scholar]
  12. Apotsos, A.; Raubenheimer, B.; Elgar, S.; Guza, R.T. Testing and calibrating parametric wave transformation models on natural beaches. Coast. Eng. 2008, 55, 224–235. [Google Scholar] [CrossRef] [Green Version]
  13. Ruessink, B.G.; Walstra, D.J.R.; Southgate, H.N. Calibration and verification of a parametric wave model on barred beaches. Coast. Eng. 2003, 48, 139–149. [Google Scholar] [CrossRef]
  14. Jelesnianski, C.P. A numerical calculation of storm tides induced by a tropical storm impinging on a continental shelf. Mon. Weather Rev. 1965, 93, 343–358. [Google Scholar] [CrossRef] [Green Version]
  15. Jelesnianski, C.P. Numerical computations of storm surges without bottom stress. Mon. Weather Rev. 1996, 94, 379–394. [Google Scholar] [CrossRef]
  16. Dube, S.K.; Sinha, P.C.; Roy, G.D. The numerical simulation of storm surges along the Bangladesh coast. Dyn. Atmos. Ocean. 1985, 9, 121–133. [Google Scholar] [CrossRef]
  17. Ginis, I.; Sutyrin, G. Hurricane-generated depth-averaged currents and sea surface elevation. J. Phys. Oceanogr. 1995, 25, 1218–1242. [Google Scholar] [CrossRef] [Green Version]
  18. Lee, T.L. Back-propagation neural network for the prediction of the short-term storm surge in Taichung harbor, Taiwan. Eng. Appl. Artif. Intell. 2008, 21, 63–72. [Google Scholar] [CrossRef]
  19. Chen, W.-B.; Liu, W.-C.; Hsu, M.H. Computational investigation of typhoon-induced storm surges along the coast of Taiwan. Nat. Hazards 2012, 64, 1161–1185. [Google Scholar] [CrossRef]
  20. Pan, Y.; Chen, Y.P.; Li, J.X.; Ding, X.L. Improvement of wind field hindcasts for tropical cyclones. Water Sci. Eng. 2016, 9, 58–66. [Google Scholar] [CrossRef] [Green Version]
  21. Chen, W.-B.; Chen, H.; Hsiao, S.-C.; Chang, C.-H.; Lin, L.-Y. Wind forcing effect on hindcasting of typhoon-driven extreme waves. Ocean Eng. 2019, 188, 106260. [Google Scholar] [CrossRef]
  22. Hsiao, S.-C.; Chen, H.; Chen, W.-B.; Chang, C.-H.; Lin, L.-Y. Quantifying the contribution of nonlinear interactions to storm tide simulations during a super typhoon event. Ocean Eng. 2019, 194, 106661. [Google Scholar] [CrossRef]
  23. Hsiao, S.-C.; Chen, H.; Wu, H.-L.; Chen, W.-B.; Chang, C.-H.; Guo, W.-D.; Chen, Y.-M.; Lin, L.-Y. Numerical Simulation of Large Wave Heights from Super Typhoon Nepartak (2016) in the Eastern Waters of Taiwan. J. Mar. Sci. Eng. 2020, 8, 217. [Google Scholar] [CrossRef] [Green Version]
  24. Hsiao, S.-C.; Wu, H.-L.; Chen, W.-B.; Chang, C.-H.; Lin, L.-Y. On the Sensitivity of Typhoon Wave Simulations to Tidal Elevation and Current. J. Mar. Sci. Eng. 2020, 8, 731. [Google Scholar] [CrossRef]
  25. Knaff, J.A.; Sampson, C.R.; Demaria, M.; Marchok, T.P.; Gross, J.M.; Mcadie, C.J. Statistical Tropical Cyclone Wind Radii Prediction Using Climatology and Persistence. Weather Forecast. 2007, 22, 781–791. [Google Scholar] [CrossRef]
  26. Zhang, Y.J.; Ye, F.; Stanev, E.V.; Grashorn, S. Seamless cross-scale modelling with SCHISM. Ocean Modell. 2016, 102, 64–81. [Google Scholar] [CrossRef] [Green Version]
  27. Zhang, Y.J.; Baptista, A.M. SELFE: A semi-implicit Eulerian-Lagrangian finite-element model for cross-scale ocean circulation. Ocean Modell. 2008, 21, 71–96. [Google Scholar] [CrossRef]
  28. Zhang, Y.J.; Ye, F.; Yu, H.; Sun, W.; Moghimi, S.; Myers, E.; Nunez, K.; Zhang, R.; Wang, H.; Roland, A.; et al. Simulating compound flooding events in a hurricane. Ocean Dyn. 2020, 70, 621–640. [Google Scholar] [CrossRef]
  29. Shchepetkin, A.F.; McWilliams, J.C. The regional oceanic modeling system (ROMS): A split-explicit, free-surface, topography-following-coordinate, oceanic model. Ocean Model. 2005, 9, 347–404. [Google Scholar] [CrossRef]
  30. Chen, W.-B.; Liu, W.-C. Modeling flood inundation induced by river flow and storm surges over a river basin. Water 2014, 6, 3182–3199. [Google Scholar] [CrossRef] [Green Version]
  31. Chen, W.-B.; Liu, W.-C. Assessment of storm surge inundation and potential hazard maps for the southern coast of Taiwan. Nat. Hazards 2016, 82, 591–616. [Google Scholar] [CrossRef]
  32. Chen, W.-B.; Liu, W.-C.; Hsu, M.-H. Modeling evaluation of tidal stream energy and the impacts of energy extraction on hydrodynamics in the Taiwan strait. Energies 2013, 6, 2191–2203. [Google Scholar] [CrossRef] [Green Version]
  33. Chen, W.-B.; Chen, H.; Lin, L.-Y.; Yu, Y.-C. Tidal Current Power Resource and Influence of Sea-Level Rise in the Coastal Waters of Kinmen Island, Taiwan. Energies 2017, 10, 652. [Google Scholar] [CrossRef] [Green Version]
  34. Chen, W.-B.; Liu, W.-C.; Hsu, M.-H.; Hwang, C.-C. Modeling investigation of suspended sediment transport in a tidal estuary using a three-dimensional model. Appl. Math. Model. 2015, 39, 2570–2586. [Google Scholar] [CrossRef]
  35. Chen, W.-B.; Liu, W.-C. Investigating the fate and transport of fecal coliform contamination in a tidal estuarine system using a three-dimensional model. Mar. Pollut. Bull. 2017, 116, 365–384. [Google Scholar] [CrossRef]
  36. Roland, A. Development of WWM II: Spectral Wave Modeling on Unstructured Meshes. Ph.D. Thesis, Technology University Darmstadt, Darmstadt, Germany, 2009. [Google Scholar]
  37. Komen, G.J.; Cavaleri, M.; Donelan, K.; Hasselmann, S.; Hasselmann, P.A.E.; Janssen, M. Dynamics and Modelling of Ocean Waves; Cambridge University Press: Cambridge, UK, 1994; p. 532. [Google Scholar]
  38. Hasselmann, K.; Barnett, T.P.; Bouws, E.; Carlson, H.; Cartwright, D.E.; Enke, K.; Ewing, J.A.; Gienapp, H.; Hasselmann, D.E.; Kruseman, P.; et al. Measurements of Wind-Wave Growth and Swell Decay during the Joint North Sea Wave Project (JONSWAP); Deutsches Hydrographisches Institut: Berlin, Germany; Hamburg, Germany, 1973. [Google Scholar]
  39. Chen, W.-B.; Lin, L.-Y.; Jang, J.-H.; Chang, C.-H. Simulation of typhoon-induced storm tides and wind waves for the northeastern coast of Taiwan using a tide-surge-wave coupled model. Water 2017, 9, 549. [Google Scholar] [CrossRef]
  40. Su, W.-R.; Chen, H.; Chen, W.-B.; Chang, C.-H.; Lin, L.-Y.; Jang, J.-H.; Yu, Y.-C. Numerical investigation of wave energy resources and hotspots in the surrounding waters of Taiwan. Renew. Energy 2018, 118, 814–824. [Google Scholar] [CrossRef]
  41. Shih, H.-J.; Chang, C.-H.; Chen, W.-B.; Lin, L.-Y. Identifying the Optimal Offshore Areas for Wave Energy Converter Deployments in Taiwanese Waters Based on 12-Year Model Hindcasts. Energies 2018, 11, 499. [Google Scholar] [CrossRef] [Green Version]
  42. Hsiao, S.-C.; Cheng, C.-T.; Chang, T.-Y.; Chen, W.B.; Wu, H.-L.; Jang, J.-H.; Lin, L.-Y. Assessment of Offshore Wave Energy Resources in Taiwan Using Long-Term Dynamically Downscaled Winds from a Third-Generation Reanalysis Product. Energies 2021, 14, 653. [Google Scholar] [CrossRef]
  43. Orton, P.; Georgas, N.; Blumberg, A.; Pullen, J. Detailed modeling of recent severe storm tides in estuaries of the New York City region. J. Geophys. Res. Ocean. 2012, 117, C09030. [Google Scholar] [CrossRef] [Green Version]
  44. Zheng, L.; Weisberg, R.H.; Huang, Y.; Luettich, R.A.; Westerink, J.J.; Kerr, P.C.; Donahue, A.S.; Grane, G.; Akli, L. Implications from the comparisons between two- and three-dimensional model simulations of the Hurricane Ike storm surge. J. Geophys. Res. Ocean. 2013, 118, 3350–3369. [Google Scholar] [CrossRef] [Green Version]
  45. Zu, T.; Gana, J.; Erofeevac, S.Y. Numerical study of the tide and tidal dynamics in the South China Sea. Deep Sea Res. Part I 2008, 55, 137–154. [Google Scholar] [CrossRef]
  46. Liu, Z.; Wang, H.; Zhang, Y.J.; Magnusson, L.; Loftis, J.D. Cross-scale Modeling of Storm Surge, Tide and inundation in Mid-Atlantic Bight and New York City during Hurricane Sandy, 2012. Estuar. Coast. Shelf Sci. 2020, 233, 106544. [Google Scholar] [CrossRef]
  47. Battjes, J.A.; Beji, S. Breaking Waves Propagating over a Shoal. In Coastal Engineering 1992, Proceedings of the 23rd International Conference on Coastal Engineering, Venice, Italy, 4–9 October 1992; ASCE: Reston, VA, USA, 1992; pp. 42–50. [Google Scholar]
  48. Battjes, J.A.; Janssen, J.P.F.M. Energy Loss and Set-Up Due to Breaking of Random Waves. In Coastal Engineering 1978, Proceedings of the 16th International Conference on Coastal Engineering, Hamburg, Germany, 27 August–3 September 1978; ASCE: Reston, VA, USA, 1978; pp. 569–587. [Google Scholar]
  49. Thornton, E.B.; Guza, R.T. Transformation of wave height distribution. J. Geophys. Res. 1983, 88, 5925–5938. [Google Scholar] [CrossRef] [Green Version]
  50. Thornton, E.B.; Guza, R.T. Energy saturation and phase speeds measured on a natural beach. J. Geophys. Res. 1982, 87, 9499–9508. [Google Scholar] [CrossRef]
  51. Church, J.C.; Thornton, E.B. Effects of breaking wave induced turbulence within a longshore current model. Coast. Eng. 1993, 20, 1–28. [Google Scholar] [CrossRef]
  52. Miche, R. Mouvements ondulatoires des mers en profondeur constante ou décroissante. Annales des Ponts Chaussees 1944, 369–406. [Google Scholar]
  53. Calisir, E.; Soran, M.B.; Akpinar, A. Quality of the ERA5 and CFSR winds and their contribution to wave modelling performance in a semi-closed sea. J. Oper. Oceanogr. 2021. [Google Scholar] [CrossRef]
  54. Van der Westhuysen, A.J. Modeling of depth-induced wave breaking under finite depth wave growth conditions. J. Geophys. Res. Ocean 2009, 115, C01008. [Google Scholar] [CrossRef]
  55. Salmon, J.E.; Holthuijsen, L.H. Modeling depth-induced wave breaking over complex coastal bathymetries. Coast. Eng. 2015, 105, 21–35. [Google Scholar] [CrossRef]
  56. Lin, S.; Sheng, J. Assessing the performance of wave breaking parameterizations in shallow waters in spectral wave models. Ocean Modell. 2017, 120, 41–59. [Google Scholar] [CrossRef]
  57. Pezerat, M.; Bertin, X.; Martins, K.; Mengual, B.; Hamm, L. Simulating storm waves in the nearshore area using spectral model: Current issues and a pragmatic solution. Ocean Modell. 2021, 158, 101737. [Google Scholar] [CrossRef]
Figure 1. Tracks and arrival times of (a) Super Typhoon Maria in 2018 and (b) Lekima in 2019. The locations of wave buoys adopted in the present study are marked in cyan (Data source: Regional Specialized Meteorological Center (RSMC) Tokyo-Typhoon Center).
Jmse 09 00706 g001
Figure 2. Coverage of the computational domain for the wave-circulation modeling system.
Jmse 09 00706 g002
Figure 3. Comparison of the time series of the SWH between the wave simulation that used the winds from the original ERA5, from the hybrid winds with various Rtrs and the corresponding observations for the (a) Fuguijiao, (b) Longdong and (c) Suao wave buoys during the passage of Super Typhoon Maria in 2018.
Jmse 09 00706 g003aJmse 09 00706 g003b
Figure 4. Spatial distribution of the difference in maximum SWH using the winds from H_4Rmax and the original ERA5 during the passage of Super Typhoon Maria in 2018.
Jmse 09 00706 g004
Figure 5. Spatial distribution of the difference in maximum SWH using the winds from (a) H_5Rmax and H_4Rmax, (b) H_6Rmax and H_4Rmax and (c) H_7Rmax and H_4Rmax during the passage of Super Typhoon Maria in 2018.
Jmse 09 00706 g005
Figure 6. Comparison of the time series of the SWH between the wave simulation that used the winds from the original ERA5, from the hybrid winds with various Rtrs, and the corresponding observations for the (a) Fuguijiao, (b) Longdong and (c) Suao wave buoys during the passage of Super Typhoon Lekima in 2019.
Jmse 09 00706 g006
Figure 7. Spatial distribution of the difference in maximum SWH using the winds from H_4Rmax and the original ERA5 during the passage of Super Typhoon Lekima in 2019.
Jmse 09 00706 g007
Figure 8. Spatial distribution of the difference in maximum SWH using the winds from (a) H_5Rmax and H_4Rmax, (b) H_6Rmax and H_4Rmax and (c) H_7Rmax and H_4Rmax during the passage of Super Typhoon Lekima in 2019.
Jmse 09 00706 g008aJmse 09 00706 g008b
Figure 9. Spatial distribution of the difference in maximum SWH between the scenarios of (a) S_NO1 and S_NO2 and (b) S_NO1 and S_NO3 during the passage of Super Typhoon Maria in 2018. The areas with water depths greater than −20 m are shown.
Jmse 09 00706 g009
Figure 10. Time series of hindcasted SWHs for (a) P1 and (b) P2 using the S_NO1, S_NO2 and S_NO3 scenarios during the passage of Super Typhoon Maria in 2018.
Jmse 09 00706 g010
Figure 11. Spatial distribution of the difference in the maximum SWH between the scenarios of (a) S_NO1 and S_NO2 and (b) S_NO1 and S_NO3 during the passage of Super Typhoon Lekima in 2019. The areas with water depths greater than −20 m are shown.
Jmse 09 00706 g011
Figure 12. Time series of hindcasted SWHs for (a) P1 and (b) P2 using the S_NO1, S_NO2 and S_NO3 scenarios during the passage of Super Typhoon Lekima in 2019.
Jmse 09 00706 g012
Figure 13. Spatial distribution of the difference in the maximum SWH between the scenarios of (a) S_NO1 and S_NO4 and (b) S_NO1 and S_NO5 during the passage of Super Typhoon Maria in 2018. The areas with water depths greater than −20 m are shown.
Jmse 09 00706 g013
Figure 14. Time series of hindcasted SWHs for (a) P1 and (b) P2 using the S_NO1, S_NO4 and S_NO5 scenarios during the passage of Super Typhoon Maria in 2018.
Jmse 09 00706 g014
Figure 15. Spatial distribution of the difference in the maximum SWH between the scenarios of (a) S_NO1 and S_NO4 and (b) S_NO1 and S_NO5 during the passage of Super Typhoon Lekima in 2019. The areas with water depths greater than −20 m are shown.
Jmse 09 00706 g015
Figure 16. Time series of hindcasted SWHs for (a) P1 and (b) P2 using the S_NO1, S_NO4 and S_NO5 scenarios during the passage of Super Typhoon Lekima in 2019.
Jmse 09 00706 g016
Figure 17. Spatial distribution of the difference in maximum SWH between the scenarios of (a) S_NO1 and S_NO2 and (b) S_NO1 and S_NO3 when Super Typhoon Maria (2018) made landfall on the southeast coast of China. The areas with water depths greater than −20 m are shown.
Jmse 09 00706 g017
Figure 18. Spatial distribution of the difference in maximum SWH between the scenarios of (a) S_NO1 and S_NO2 and (b) S_NO1 and S_NO3 when Super Typhoon Lekima (2019) made landfall on the southeast coast of China. The areas with water depths greater than −20 m are shown.
Jmse 09 00706 g018
Table 1. Information on wave buoys.
Buoy NameLongitude (°E)Latitude (°N)Water Depth (m)
Fuguijiao121.533625.303630
Longdong121.922525.097827
Suao121.875824.624723
Data source: The Central Weather Bureau and Water Resource Agency of Taiwan.
Table 2. Designed numerical experiments in the present study.
ScenarioWave-Breaking FormulationWave-Breaking CriterionRtrs
S_NO1BJ87 γ = 0.784Rmax
S_NO2TG83 γ G T = 0.424Rmax
S_NO3CT93 γ = 0.784Rmax
S_NO4BJ87Based on Local Steepness4Rmax
S_NO5BJ87Based on Peak Steepness4Rmax
Publisher’s Note: MDPI stays neutral with regard to jurisdictional claims in published maps and institutional affiliations.