Abstract
The ablation of Arctic sea ice makes seasonal navigation possible in the Arctic region, which accounted for the apparent influence of sea ice concentration in the navigation of the Arctic route. This paper uses Arctic sea ice concentration daily data from January 1, 2000, to December 31, 2019. We used a sea ice concentration threshold value of 40% to define the time window for navigating through the Arctic Northeast Passage (NEP). In addition, for the year when the navigation time of the NEP is relatively abnormal, we combined with wind field, temperature, temperature anomaly, sea ice age and sea ice movement data to analyze the sea ice conditions of the NEP and obtain the main factors affecting the navigation of the NEP. The results reveal the following: (1) The sea ice concentration of the NEP varies greatly seasonally. The best month for navigation is September. The opening time of the NEP varies from late July to early September, the end of navigation is concentrated in mid-October, and the navigation time is basically maintained at more than 30 days. (2) The NEP was not navigable in 2000, 2001, 2003 and 2004. The main factors are the high amount of multi-year ice, low temperature and the wind field blowing towards the Vilkitsky Strait and sea ice movement. The navigation time in 2012, 2015 and 2019 was longer, and the driving factors were the high temperature, weak wind and low amount of one-year ice. The navigation time in 2003, 2007 and 2013 was shorter, and the influencing factors were the strong wind field blowing towards the Vilkitsky Strait. (3) The key navigable areas of the NEP are the central part of the East Siberian Sea and the Vilkitsky Strait, and the Vilkitsky Strait has a greater impact on the NEP than the central part of the East Siberian Sea. The main reason for the high concentration of sea ice in the central part of the East Siberian Sea (2000 and 2001) was the large amount of multi-year ice. The main reason for the high concentration of sea ice in the Vilkitsky Strait (2000 to 2004 and 2007, 2013) was the strong offshore wind in summer, all of which were above 4 m s−1, pushing the sea ice near the Vilkitsky Strait to accumulate in the strait, thus affecting the opening of the NEP.
1. Introduction
In the past 30 years, Arctic sea ice has changed rapidly [1,2], with a warming rate of about 0.6 ± 0.07 °C per 10 years [3]. The annual average extent of Arctic sea ice also showed a decreasing trend, with the decreasing rate rising from 3% to 10% per 10 years [4], the thickness of sea ice has become thinner [5,6], and the melting season has been extended [7]. Studies have shown that, up to 2019, the average global temperature for 2015 to 2019 is on track to be the warmest of any equivalent period on record, and the four lowest values of winter sea ice extent occurred in these five years [8]. Significantly climate warming strengthened the ablation of polar sea ice and improved the ability of seasonal navigation in the Arctic. The change of Arctic sea ice showed an apparent influence on the navigation of the NEP. Factors such as solar radiation, temperature, wind field and other natural factors can always affect the melting process and freezing time of sea ice. Therefore, the navigation time of the NEP shows highly uncertain. Among many Arctic routes, the NEP has significant advantages, which can save 15–50% of the voyage [9,10], greatly shortening the transportation distance from Western Europe to Northeast Asia.
Smith et al. [11] obtained the best route in the Arctic seas based on the data of Arctic sea ice concentration and thickness in September. Rodrigues [12] used sea ice concentration data from 1979 to 2007 to study the sea ice coverage and the length of the ice-free season in the Arctic marginal area. Ruibo et al. [13] used remote sensing data from 1979 to 2012 to study the interannual and seasonal spatial variations of sea ice in the Northwest Passage (NWP), and found that the navigation period of the NWP increased by 32 days in 32 years. Dawei et al. [14] used NSIDC sea ice products to study the kinematic characteristics of sea ice in the Arctic Fram Strait and the northern part of the NEP. It was found that the opening period of the NEP has a significant relationship with the northward speed of the sea ice in the north. Polona et al. [15] used airborne sea ice thickness data from the floating ice areas in the southeast of the Laptev Sea in winter and found that the export volume of sea ice in winter strengthens the ablation of summer sea ice in the Laptev Sea. Chen et al. [16] look at future scenarios in a modeling experiment, but they also focused on the NEP and (at times) the Vilkitsky Strait. Zhiyuan Li [17] analyzed the characteristics of the Arctic ice conditions in summer and modified the risk index of polar business limit assessment to evaluate the navigation risk. Yangjun Wang [18] developed a new model to study the influence of sea ice conditions on the navigation of the NEP from 2020 to 2030, and found that the concentration and thickness of sea ice are the key factors for the navigation of icebreakers. Yu et al. [19] notes the importance of wind direction on determining whether sea ice is advected into or away from Vilkitsky Strait. Long Ma et al. [20] used sea ice concentration data from 2006 to 2015 and the first voyage route of the “Yongsheng” NEP in 2013 to obtain the 10-year navigation window of the NEP and analyze the navigation situation of the sea area through which the NEP passes. Xinqing et al. [21] used sea ice concentration data from 2002 to 2013 to study the sea ice distribution characteristics and navigation of the Vilkitsky Strait in the Arctic, which shows that the navigation time of the strait is basically more than 40 days per year, and the opening time varies from July to September. The ending time is relatively concentrated in October. Shang Meng et al. [22] used sea ice concentration data to analyze the sea ice variations and navigation conditions in the NEP, and concluded that the NEP is most likely to be opened in September. Most of the research is based on the data of sea ice concentration in the past 10 years or the study of navigation conditions in a small range of Arctic waters. The space-time span of the study is relatively small, and the abnormal years of channel opening are not analyzed.
Sea ice concentration is a crucial factor for studying variations in sea ice conditions and route navigation. In this study, we used SSM/I (Special Sensor Microwave/Imager) and SSMIS (Special Sensor Microwave Imager/Sounder) sea ice concentration data from 2000 to 2019, combined with Arctic summer wind field, temperature, temperature anomalies, sea ice age and sea ice movement data, to analyze the characteristics of annual, seasonal and monthly sea ice variations in the NEP of the Arctic in the past 20 years, extracted the navigation window of the NEP in the past 20 years, and analyzed the ice conditions in the years of abnormal navigation. How to safely use the Arctic sea ice window to cross the Arctic is the focus of current research. Through the analysis of this article, we can have a more comprehensive understanding of the temporal and spatial variations of sea ice and navigation conditions of the NEP in the last 20 years, and provide certain references for the future development and utilization of the NEP.
2. Study Region, Data and Methods
2.1. Study Region
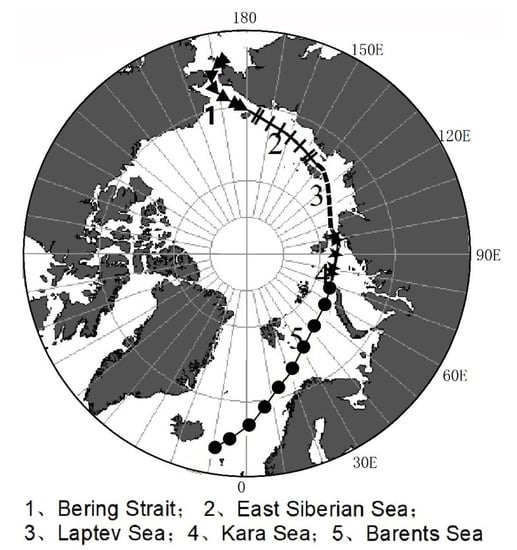
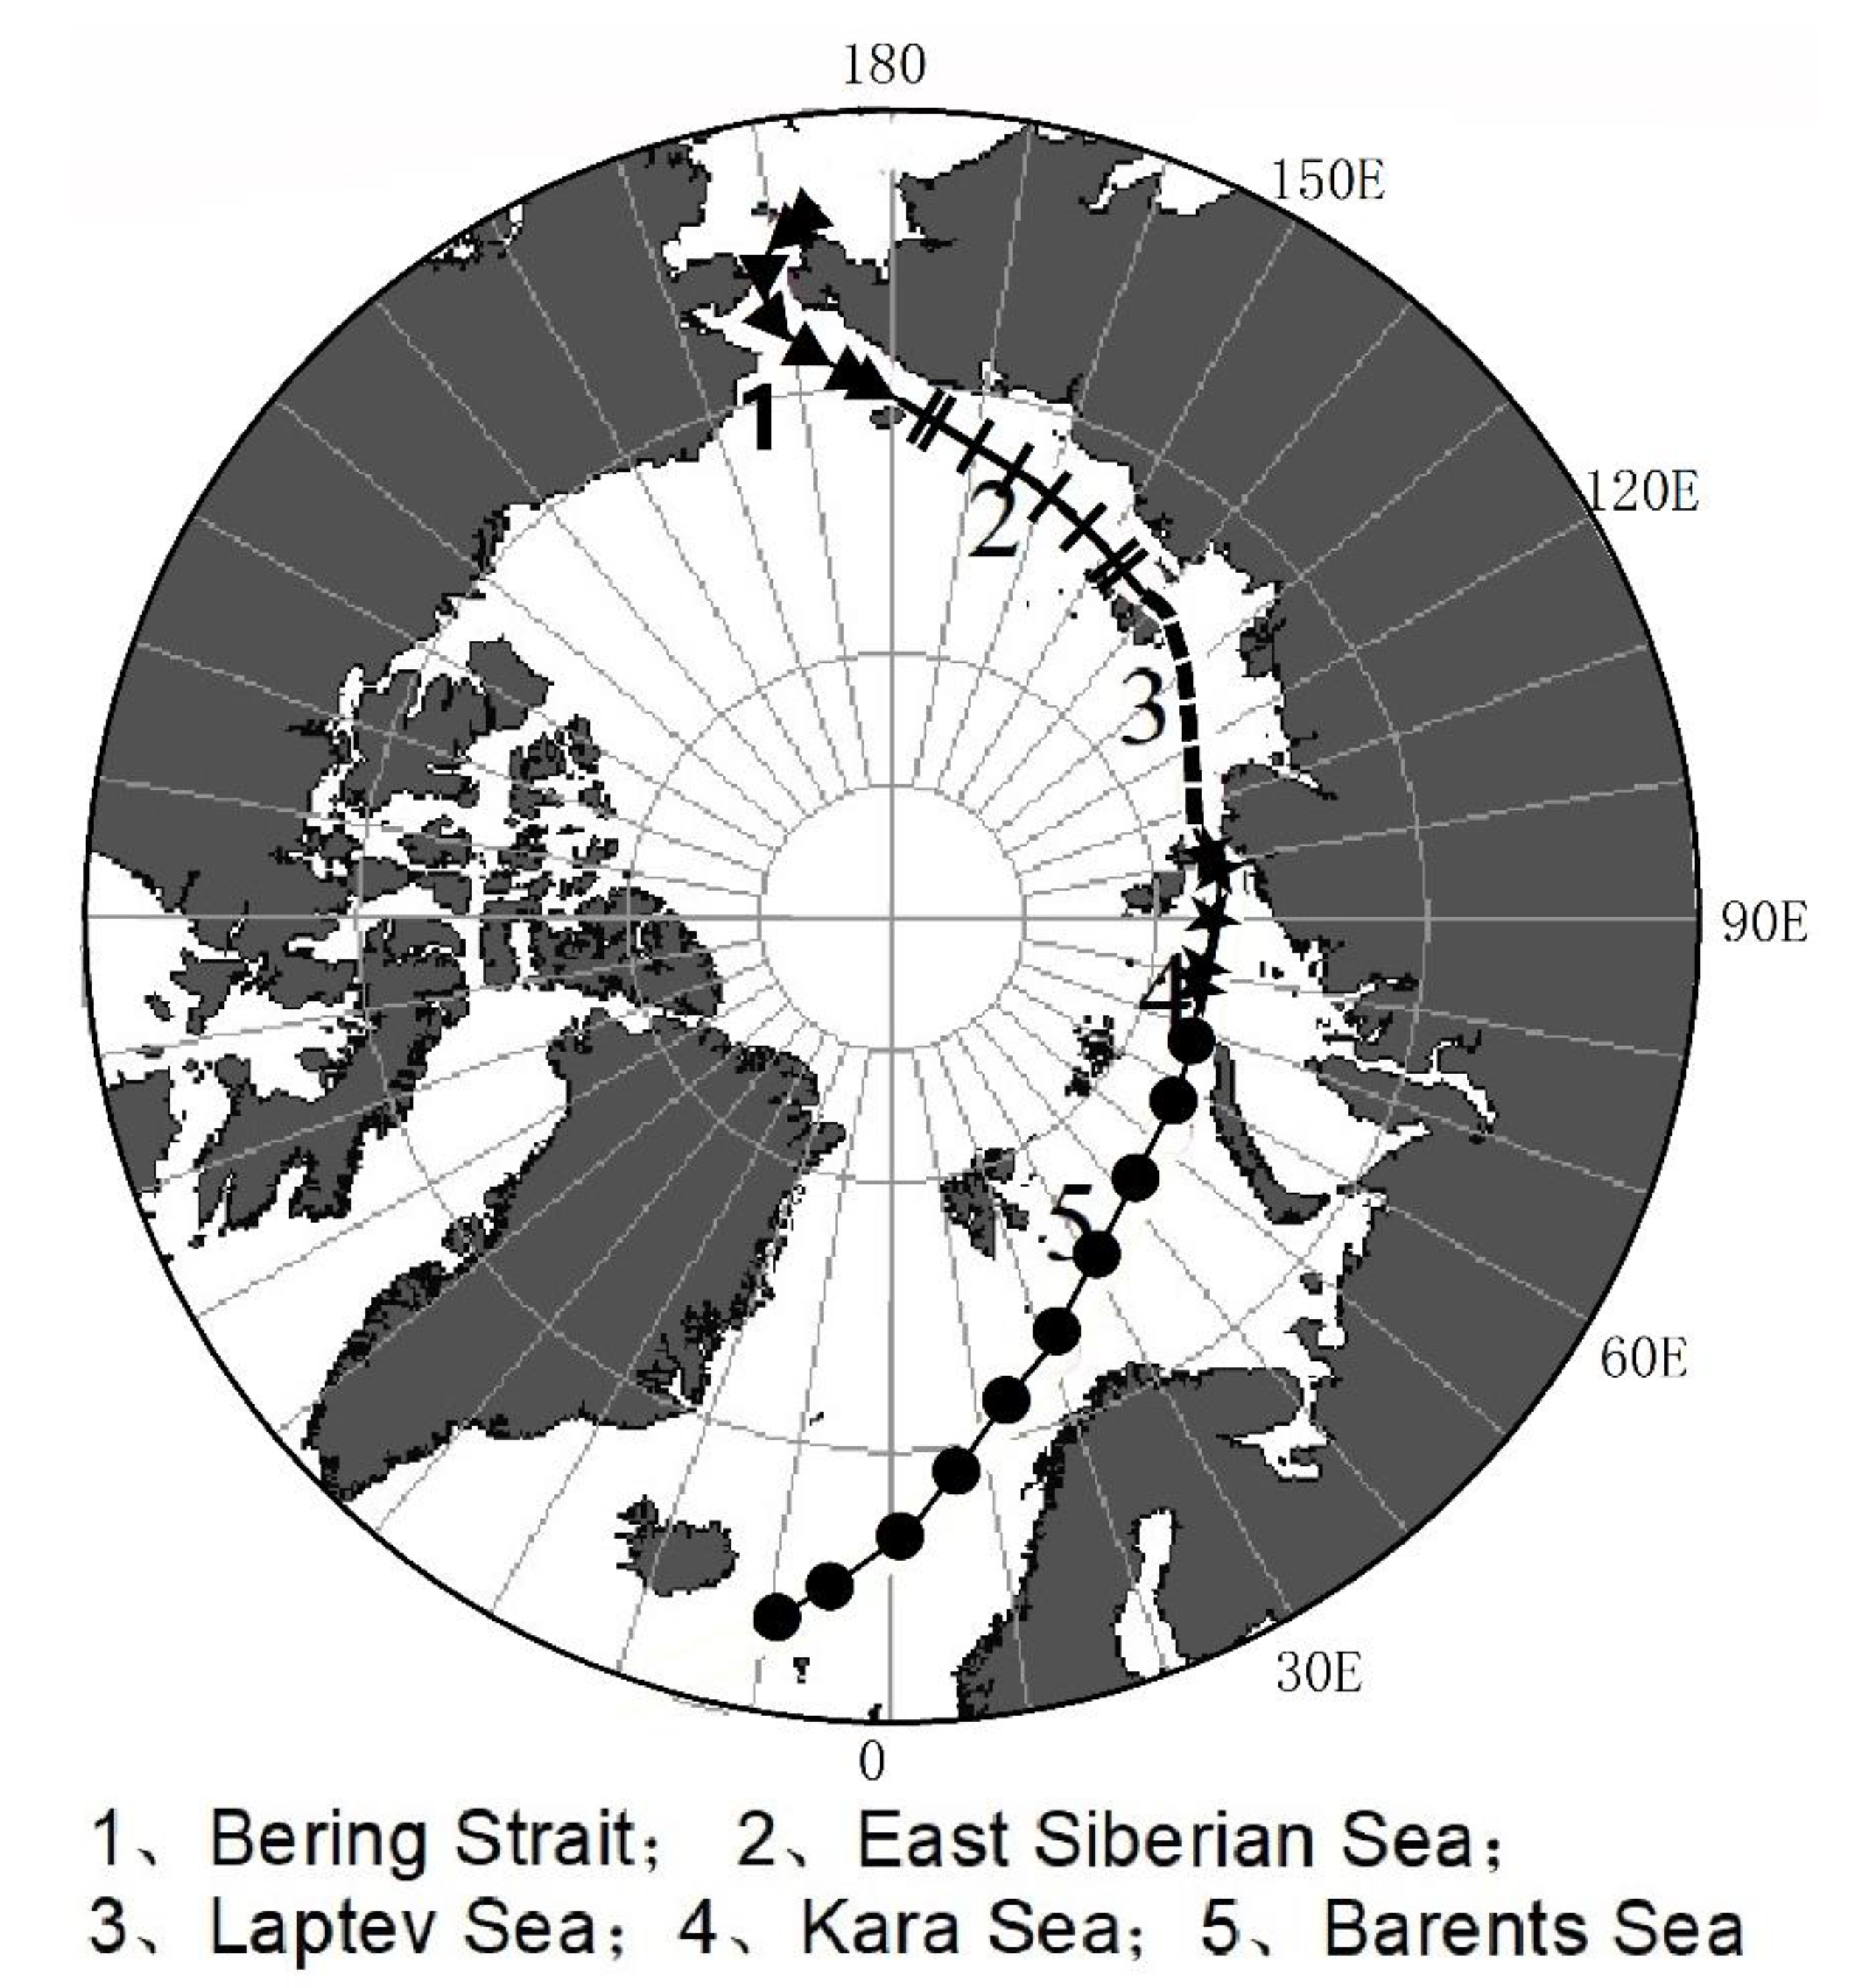
We selected the NEP as the study area, which runs through the Arctic region and is one of the crucial Arctic routes. The NEP is a passage starting from the Norwegian Sea, passing through the Barents Sea, Kara Sea, Laptev Sea and East Siberian Sea to the Bering Strait. As shown in Figure 1, the starting point of the route in this article we focused on is the Bering Strait (central geographic coordinates: 53.5° N, 170.3° E), with a total length of 5246.86 nautical miles: 0–1311.71 nautical miles is the Bering Strait, 1311.71–2098.74 nautical miles is the East Siberian Sea, 2098.74–2885.77 nautical miles is the Laptev Sea, 2885.77–3410.46 nautical miles is the Kara Sea, and 3410.46–3935.14 nautical miles is the Barents Sea. Between November and April, the NEP may be covered by sea ice completely. In May, the sea ice on the NEP begins to melt, and the melting continues until September, when the sea ice concentration on the NEP reaches a minimum. During the Arctic summer, sea ice concentrations decrease due to sea ice melt. There can be short periods of ice-free time in the NEP, which provides convenience to the merchant ships scheduling the voyage, and the commercial value of the NEP has become increasingly prominent.
2.2. Data
2.2.1. Sea Ice Concentration Data
In this article, we use the sea ice concentration data of SSM/I-SSMIS (Special Sensor Microwave/Imager–Special Sensor Microwave Imager/Sounder) provided by the National Snow and Ice Data Center (NSIDC). The data set is Sea Ice Concentrations from Nimbus-7 SMMR and DMSP SSM/I-SSMIS Passive Microwave Data (https://nsidc.org/data/nsidc-0051; accessed on 25 November 2020) [23], the version is Version 1. The spatial resolution of the data is 25 km, the temporal resolution is 1 day, and the time span is 1978–2020. The data are provided in the polar stereographic projection at a grid cell size of 25 × 25 km. The data set has a long time span, wide coverage and completeness, which is convenient for sea ice analysis for nearly 20 years. Since the data obtained in this article is in November 2020, we select the sea ice concentration data on the NEP of the Arctic from 1 January 2000 to 31 December 2019 in the data set for the analysis of this article.
2.2.2. Auxiliary Data
In this article, we use the seasonal average data of wind field, temperature, temperature anomaly, sea ice age and sea ice movement in the Arctic summer (July–September) for analysis, including the summer seasonal average maps of 2000, 2001, 2003, 2004, 2012, 2015 and 2019, as well as the monthly average maps for the July to September months of 2002, 2007 and 2013. The 10 m surface wind field map comes from the reanalysis grid data set ERA5 of the University of Maine’s reanalysis plotter (https://climatereanalyzer.org/reanalysis/monthly_maps/; accessed on 25 November 2020) [24], the time resolution is 1 month and the grid resolution is 0.5° * 0.5°. The time span is from January 1950 to May 2021, and the version of the dataset is Version 5. The temperature distribution of 2 m and the temperature anomaly of 2 m are from the reanalysis grid data set ERA5 (ESRL, https://psl.noaa.gov/repository/model/compare; accessed on 25 November 2020) [25] of the NOAA Earth System Research Laboratory, the time resolution is 1 month and the grid resolution is 0.25° * 0.25°. The time span is from 1979 to 2021, and the version of the dataset is Version 5. The temperature anomaly here is based on the average value from 2000 to 2019. The sea ice age comes from the grid data set EASE-Grid Sea Ice Age (NSIDC, https://nsidc.org/data/NSIDC-0611/versions/4; accessed on 25 November 2020) [26] of National Snow and Ice Data Center, the spatial resolution is 25 km × 25 km, and the time resolution is 7 days. The time span is 1 January 1984 to 31 December 2020, and the version of the dataset is Version 4. The sea ice motion comes from the grid data set Polar Pathfinder Daily 25 km EASE-Grid Sea Ice Motion Vectors (NSIDC, https://nsidc.org/data/NSIDC-0116/versions/4; accessed on 25 November 2020) [27] of NSIDC, with a spatial resolution of 25 km × 25 km. The time resolution is 7 days, and the time span is from 25 October 1978 to 31 December 2020. The version of the dataset is Version 4.
2.3. Methods
2.3.1. Sea Ice Concentration Extraction on the NEP
We use the latitude and longitude coordinates of the sea ice concentration product itself and superimpose it with the NEP in the same coordinate system. Then, we perform interpolation analysis on the original sea ice concentration data of the NEP, and generate new interpolated raster data. Then, the average sampling point is extracted on the NEP, and the concentration value of the point is extracted from the interpolation data with the coordinates of the sampling point to obtain the sea ice concentration of the NEP.
2.3.2. Sea Ice Age and Sea Ice Movement
We obtain the netCDF weekly data of sea ice age and sea ice movement for the required years from NSIDC. For the sea ice age, we use MATLAB to read the NetCDF data, and then superimpose the 13-week ice age data in the summer (July to September) of 2000, 2001, 2003, 2004, 2012, 2015 and 2019, and superimpose the monthly ice age in July (4 weeks), August (5 weeks) and September (4 weeks) of 2002, 2007 and 2013, and calculate the seasonal average ice age value in summer and monthly average ice age value. Finally, the average ice age obtained is rounded up to the nearest integer.
For the sea ice movement, we use Matlab to read the u and v components of the ice motion data, and superimpose the values of u and v of the ice motion in the time span required in this article, to obtain the average values of u and v, respectively. When u is positive, it represents sea ice moving eastward. When v is positive, it represents sea ice moving northward. Formula (1) is used to get the speed and magnitude of the average sea ice movement.
3. Sea Ice Concentration Analysis
3.1. Annual Average Variation
Based on the SSMI/SSMIS sea ice concentration data from 1 January 2000 to 31 December 2019, we calculated the annual average sea ice concentration of each location on the NEP of the Arctic and was shown in Figure 2. According to Figure 2, we can more intuitively get the sea ice concentration at the navigable nodes in each year, and find the choke points that affected the navigability of the NEP that year.
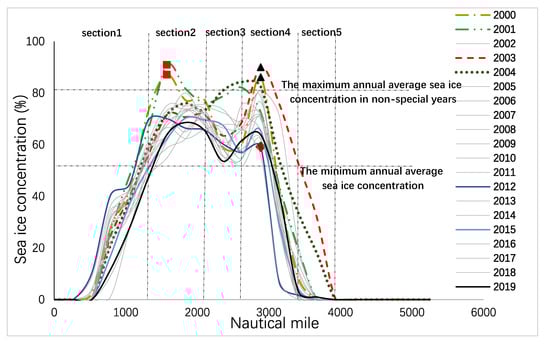
Figure 2.
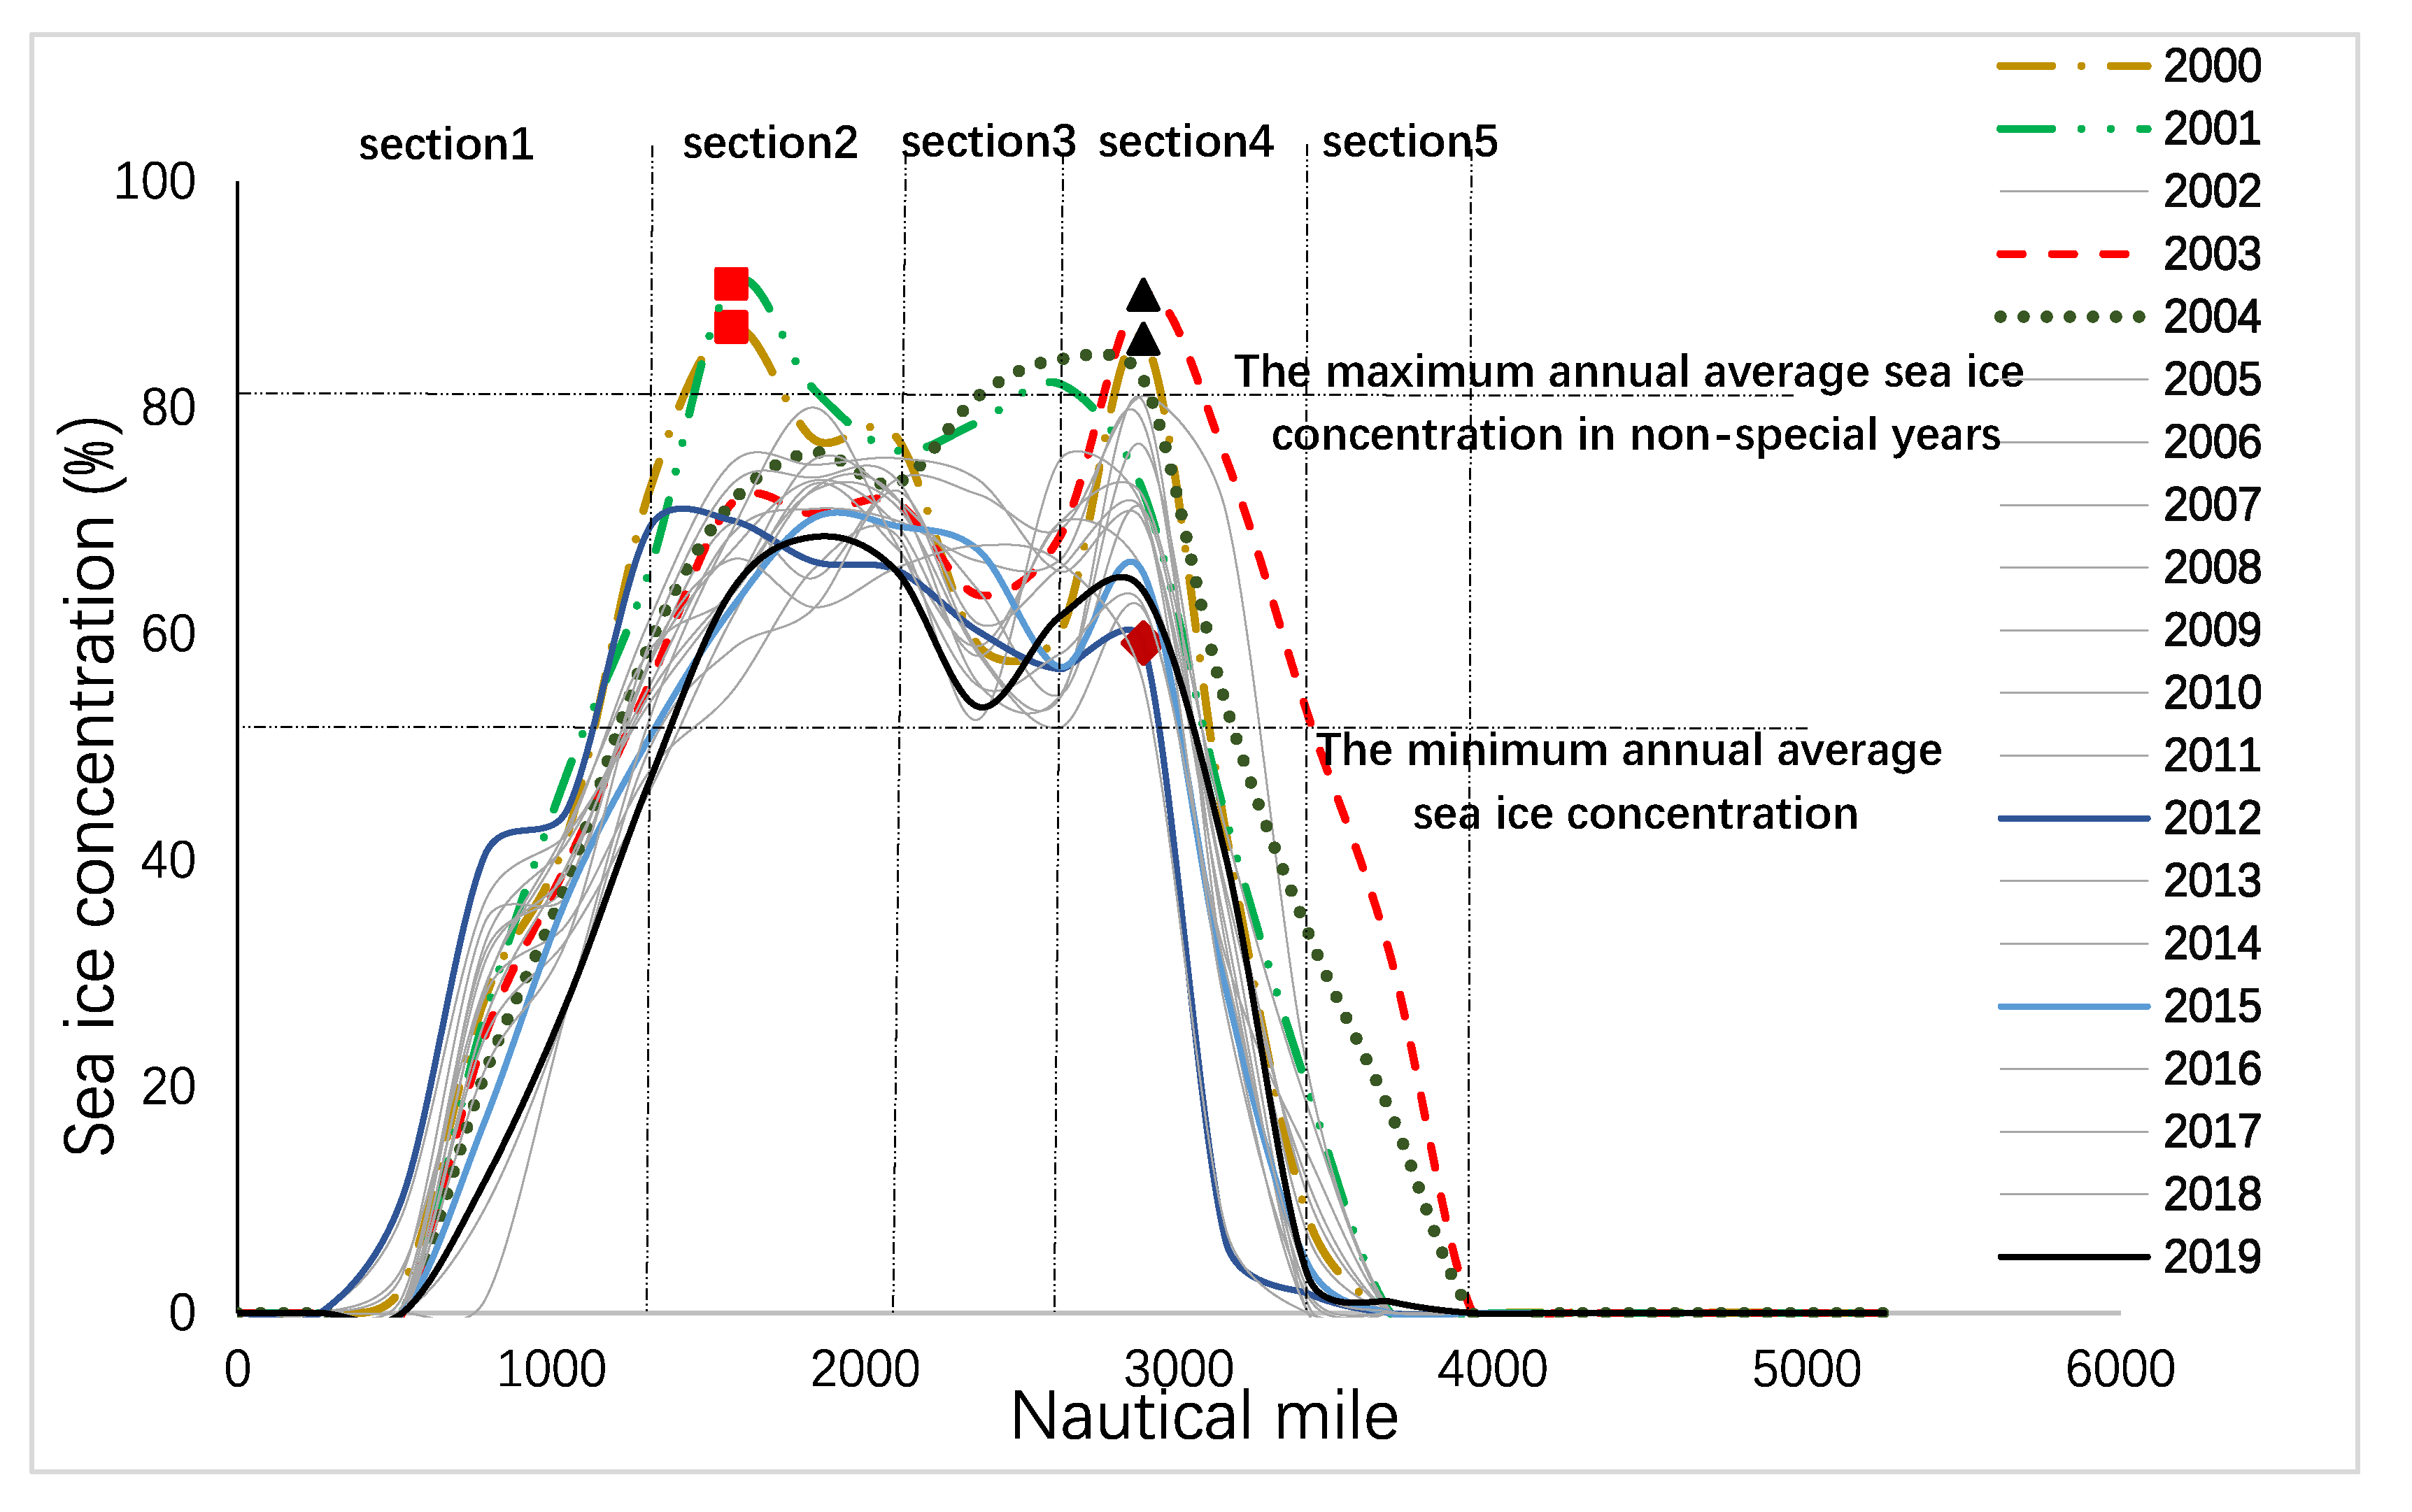
Average annual sea ice concentration of the NEP from 2000 to 2019. Among them, the red squares indicate that at 1574 nautical miles, the sea ice concentration in 2001 and 2000 were the top two places, respectively. The black triangles indicate that at 2885 nautical miles, the sea ice concentration in 2003 and 2000 were the top two places, respectively. The red diamond indicates that at 2885 nautical miles, the sea ice concentration in 2012 was the lowest.
As shown in Figure 2, the areas with high sea ice concentration in the NEP from 2000 to 2019 were mainly concentrated between Section 2 and Section 4, that is, 1311.71–3410.46 nautical miles. At Section 1, the annual average sea ice concentration of the NEP increases with distance. At 1574 nautical miles, it can be clearly seen that the sea ice concentration in 2001 was anomalous, as high as 90%, followed by 2000. At Section 2 and Section 3, the annual average sea ice concentration first declines and then increases, around 2885 nautical miles, the annual average sea ice concentration in 2003 was extremely high, followed by 2000, while the sea ice concentration in 2012 reached a record low, only 60%, which was the lowest value of the peak sea ice concentration in the past 20 years. At Section 4 and Section 5, the average sea ice concentration on the route decreases until it drops to 0%. Combining the results of Figure 2 with the geography, it can be seen that the middle section of the route (about 1000–3000 nautical miles) is located in high latitudes, close to the North Pole, and the sea ice concentration is high, the risk of ship navigation is greater. The beginning and end of the NEP are located in the mid to high latitudes, where the sea ice concentration is low and the navigation risk is smaller.
In the recent 20 years annual average sea ice concentration in Figure 2, it can be seen that the annual average sea ice concentration peaks on the NEP in 2000, 2001, 2003 and 2004 were all higher than 85%, and the annual sea ice concentration changed greatly. In 2012, 2015 and 2019, the annual average sea ice concentration changed relatively greatly, with no considerable abrupt changes. Therefore, we select seven special years including 2000, 2001, 2003, 2004, 2012, 2015 and 2019 for research (here, the year of shorter navigation periods is not considered for the time being). Except for special years, the sea ice concentration of the remaining 13 years is averaged for the following analysis.
3.2. Seasonal Average Variation
Based on the daily average sea ice concentration data of the NEP, the average sea ice concentration variations of four seasons in each year were calculated and shown in Figure 3. In order to distinguish between special years and non-special years, the monthly average sea ice concentration of each year in the 7 special years and the monthly average sea ice concentration of the remaining 13 years are shown in Figure 3. We divide the seasons: January–March is regarded as winter, April–June is regarded as spring, July–September is regarded as summer, and October–December is autumn.
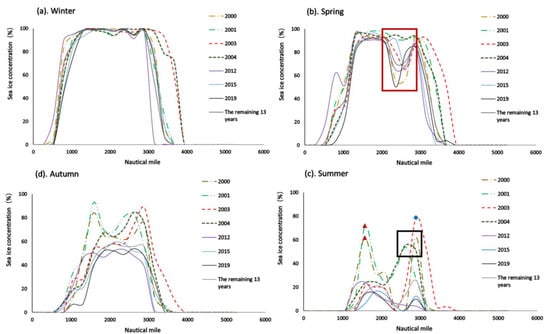
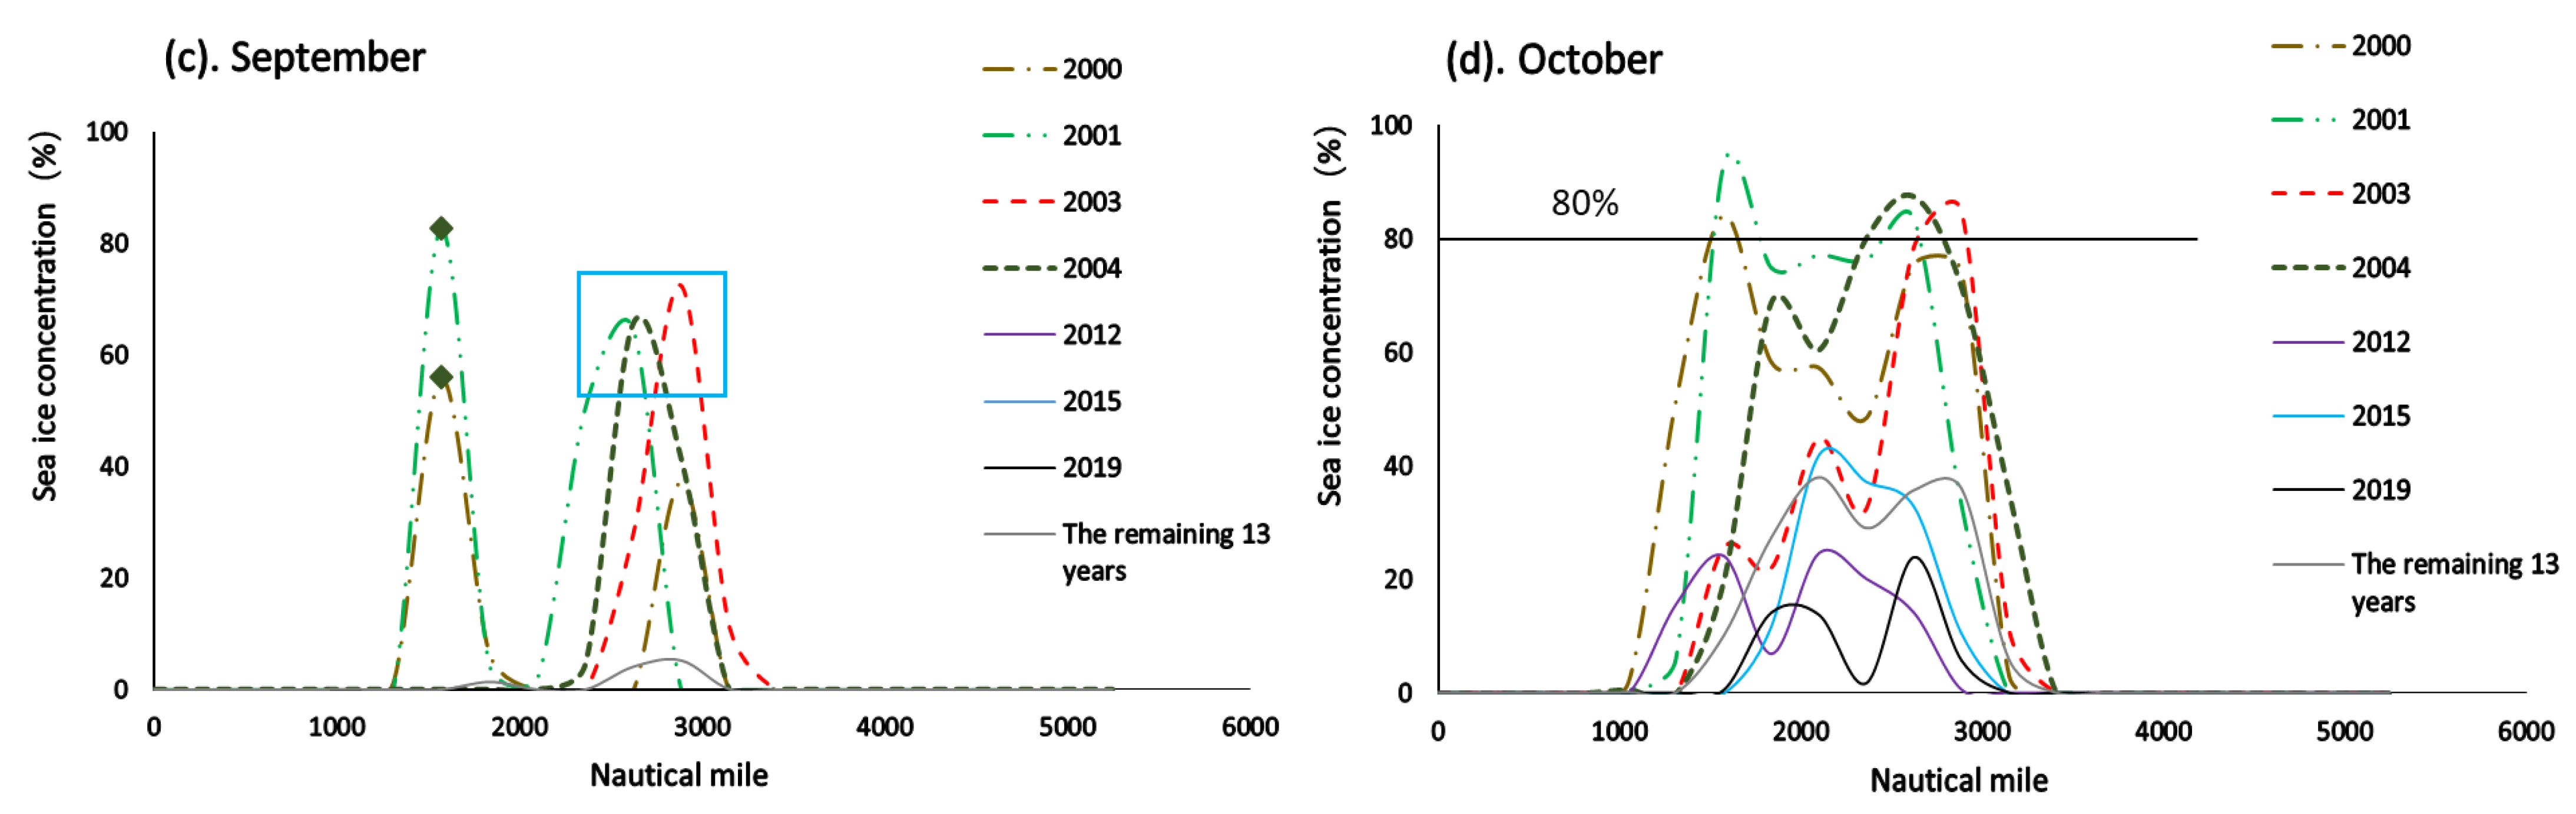
Figure 3.
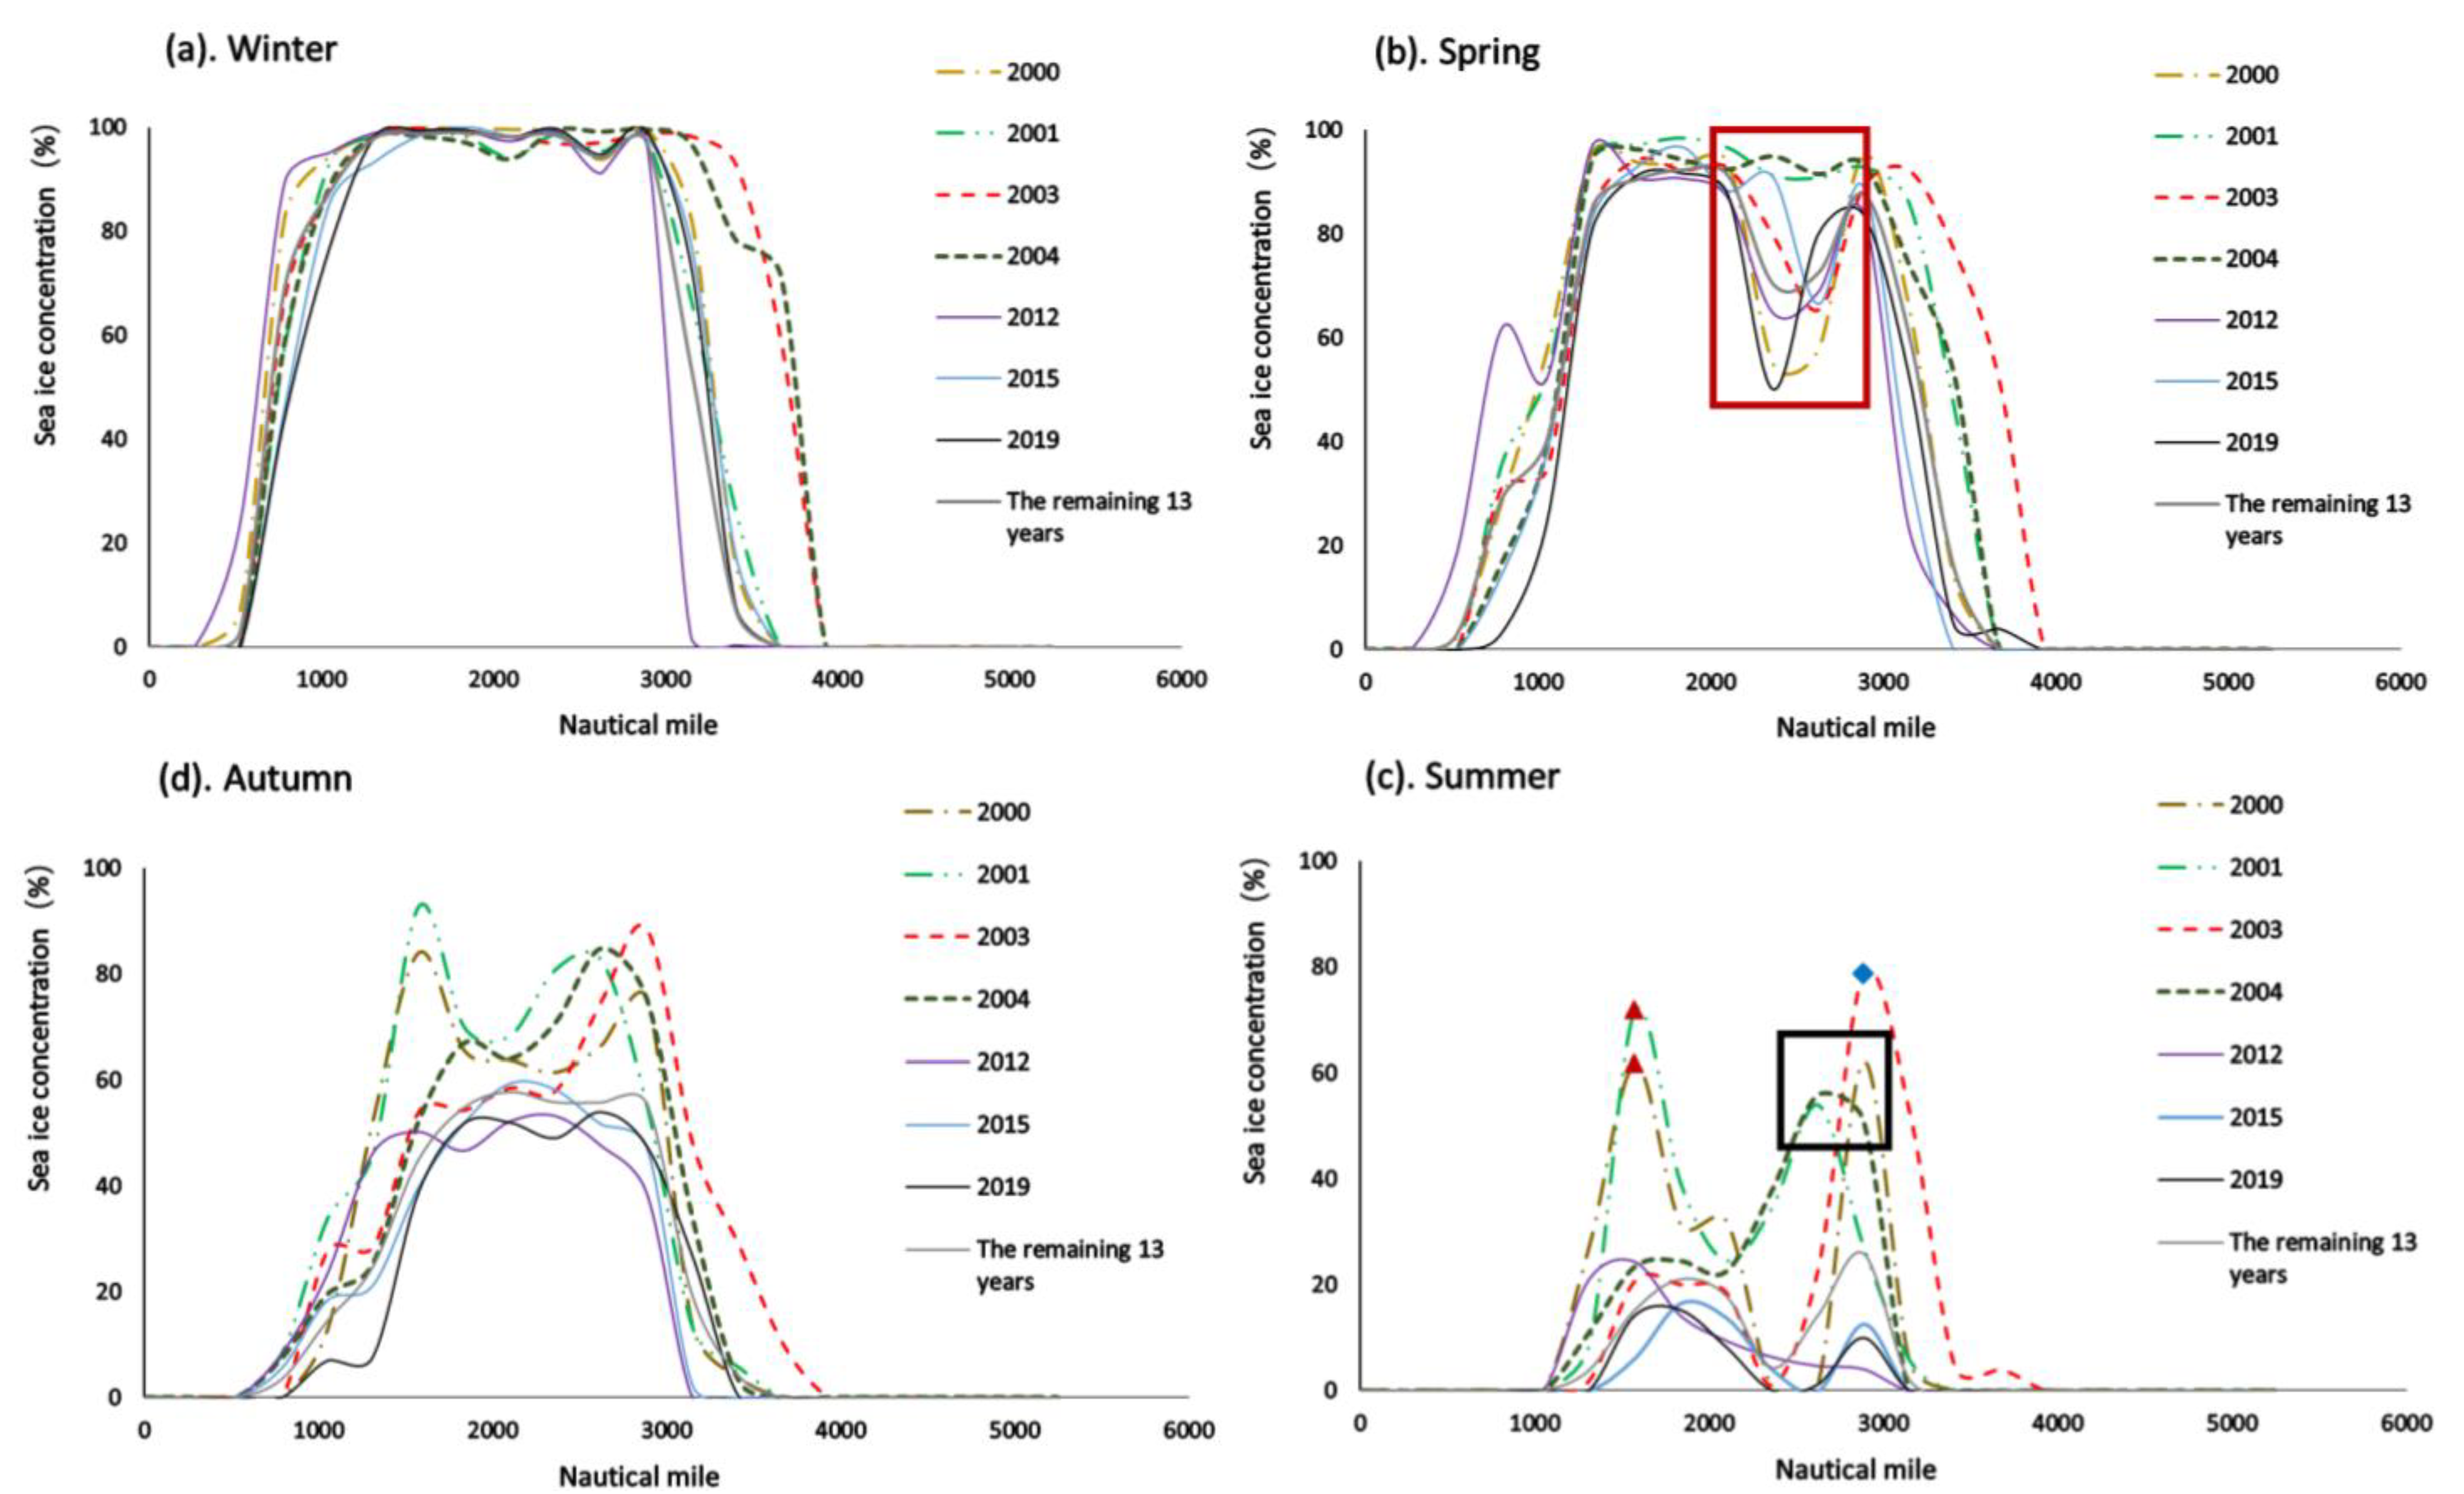
The average sea ice concentration of the NEP from 2000 to 2019, (a) is winter, (b) is spring, (c) is summer, and (d) is autumn. Among them, the red box in (b) represents the variation in the average sea ice concentration in spring in the Laptev Sea. In (c), the red triangles indicate that the sea ice concentration in the East Siberian Sea in 2000 and 2001 was higher than 60%, the blue diamond indicates that the sea ice concentration in the Vilkitsky Strait in 2003 was higher than 80%, and the black box indicates that the sea ice concentration in the Vilkitsky Strait in 2000, 2004 and 2001 was respectively above 50%.
Figure 3 reveals the variation in the average seasonal sea ice concentration of the NEP from 2000 to 2019. It can be seen from Figure 3 that the variations of sea ice concentration in the four seasons mainly reveal four characteristics. First, the ice section of the NEP is from 787 nautical miles to 3410 nautical miles, and there are perennial ice-free areas at the beginning and end of the route. Second, the sea ice concentration of the NEP has a relatively considerable seasonal characteristic. In winter (Figure 3a), the Arctic temperature is low and the sea is frozen. The sea ice concentration of the NEP reaches its maximum, which is above 95%, and the difference between the years is small. Entering spring (Figure 3b), the temperature in the northern hemisphere begins to rise, and the sea ice concentration in the Laptev Sea (2098.74–2623.43 nautical miles) decreases. Compared with winter, the Laptev Sea (red box) has the largest amount of variation in sea ice concentration. In the spring, sea ice along the NEP absorbs solar radiation and begins to melt. During summer the sea ice continues to retreat northwards, and the sea ice concentration of the NEP drops to a minimum or even zero, and an ice-free section appears. The Bering Strait and the Barents Sea occasionally contain a small amount of floating ice of less than 20%. Except in 2000, 2001, 2003 and 2004, the sea ice concentration of the East Siberian Sea, the Laptev Sea and the Kara Sea in summer is generally less than 50%. In autumn (Figure 3d), the Arctic sea ice enters the freezing period, and the sea ice expands southward. The sea ice concentration in each sections on the NEP gradually increases. The amount of sea ice in the NEP continues to increase, reaching its maximum in winter. Third, it can be seen in Figure 3 that the sea ice concentration of the NEP in 2000, 2001, 2003 and 2004 was more abnormal than other years. Especially in summer (Figure 3c), the sea ice concentration of the East Siberian Sea (1574 nautical miles) reached more than 60% in 2000 and 2001 (red triangle), which was at a high level, and the risk of navigation was high. In the Vilkitsky Strait (2623–2885 nautical miles), the sea ice concentration reached 80% in 2003 (blue diamond) and more than 50% in 2000, 2004 and 2001 (black box). In the summer of 2012, 2015 and 2019, the sea ice concentration of the NEP was lower, which was below 30%, and the risk of navigation was small.
It can be seen from the above analysis that the seasonal variation of the average sea ice concentration of the NEP is quite different. The NEP is often covered by sea ice, and the influence of sea ice should be taken into account when sailing. In summer (July–September), the NEP has the least sea ice concentration, which is the best time for navigating ships, and marine operations are not easy in winter and spring.
3.3. Monthly Average Variation
The NEP is feasible for navigation in summer. Since the sea ice cover minimum usually occurs in September each year, and it takes a while to grow the sea ice back, the sea ice concentration in the NEP is not high in October. Therefore, in this section, we put October in the summer for analysis. The spatial variability along the NEP is shown in Figure 4.
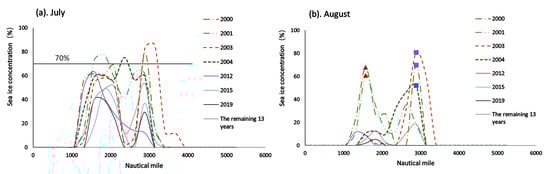
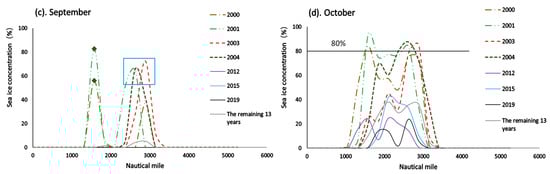
Figure 4.
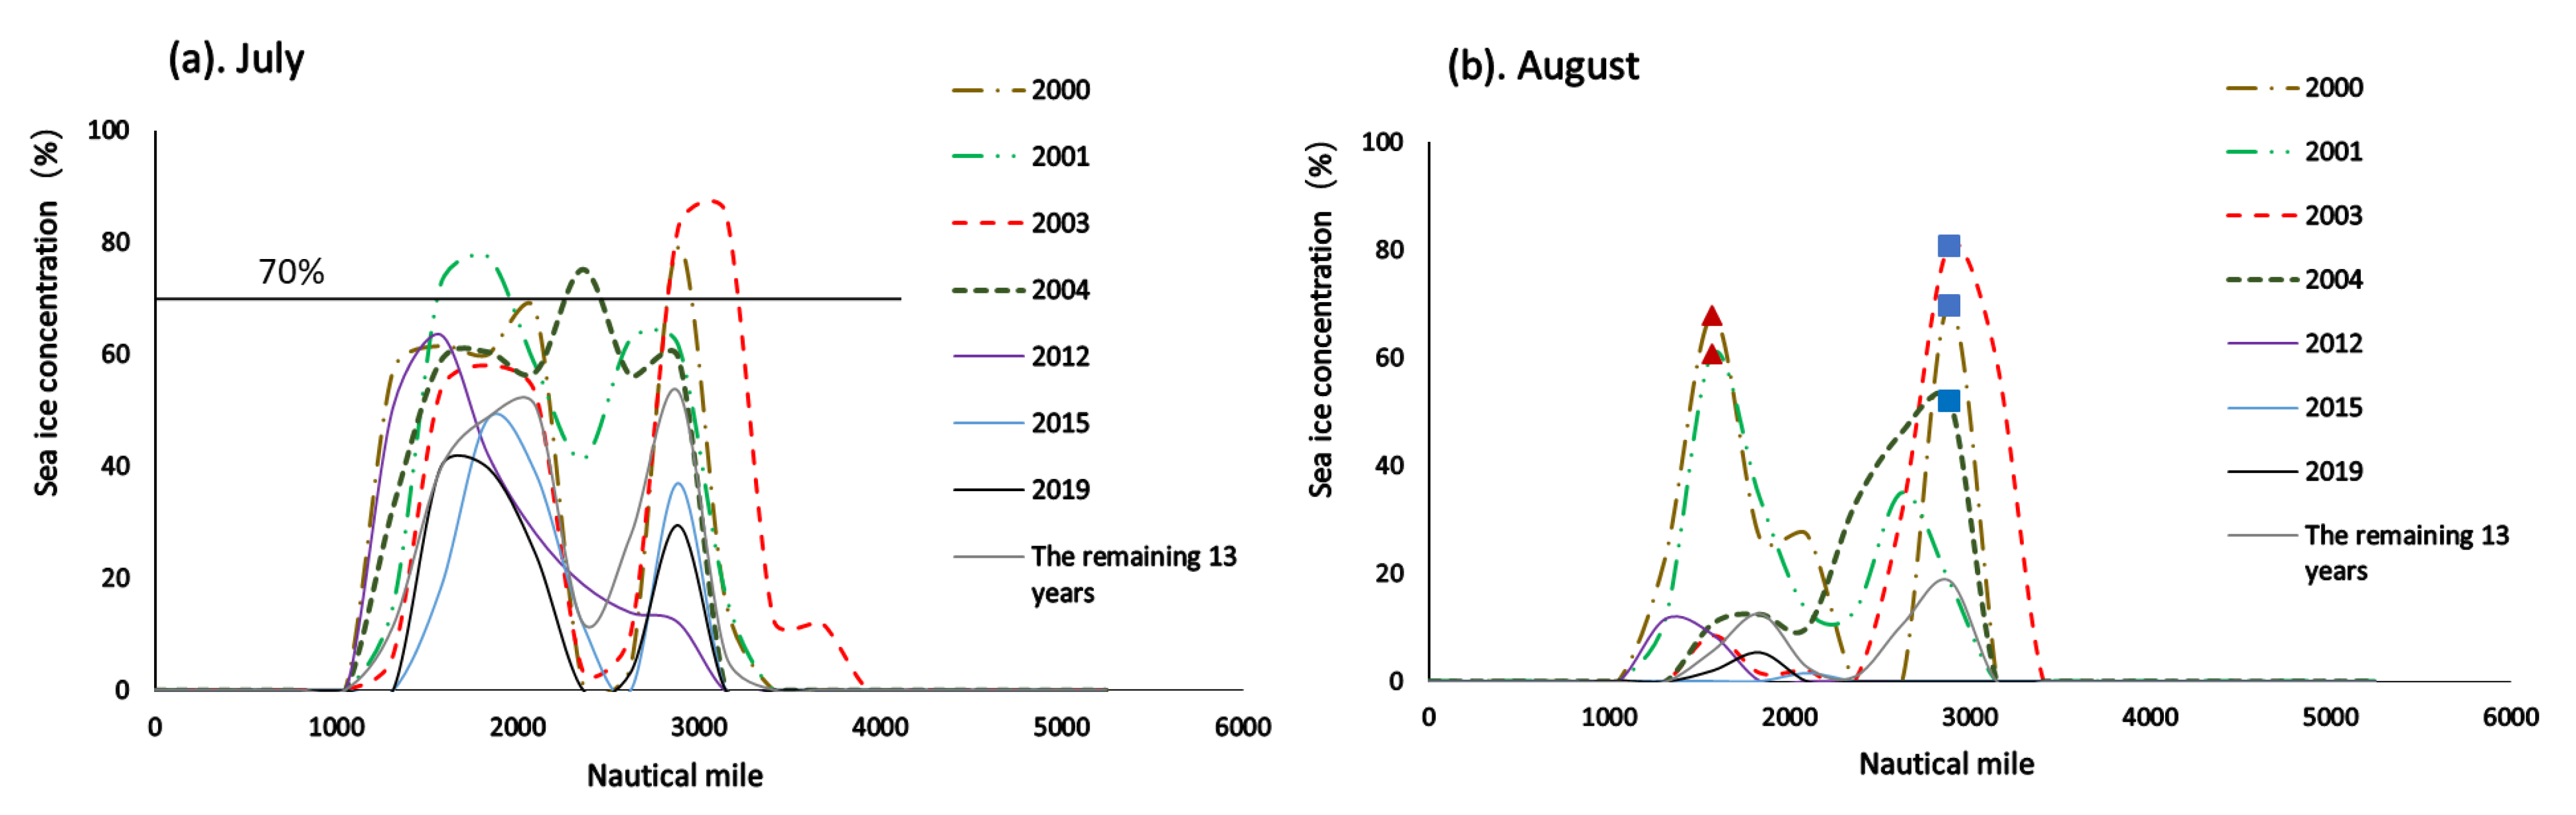
Time-sequence map of monthly average sea ice concentration of the NEP in summer from 2000 to 2019. In (a), the 70% line indicates that the peak value of monthly average sea ice concentration in July in 2000, 2001, 2003 and 2004 was respectively above 70%. In (b), the red triangles represent that in the East Siberian Sea, the sea ice concentration in 2000 and 2001 were the top two, and the blue squares represent that in the Vilkitsky Strait, the sea ice concentration in 2003, 2000 and 2004 were the top three. In (c), the green diamonds represent that in the East Siberia Sea, the sea ice concentration in 2001 and 2000 were the top two, the blue square represents that in the Vilkitsky Strait, the sea ice concentration in 2001, 2003 and 2004 were the top three. In (d), the 80% line indicates that the peak value of monthly average sea ice concentration in October in 2000, 2001, 2003 and 2004 was respectively above 80%.
The NEP is in the freezing period from October to March of the following year, and it is in the melting process from April to September. Due to the influence of sea ice melting degrees, the inter-annual difference in the sea ice concentration of the NEP is great from July to October. It can be seen from Figure 4 that the sea ice concentration of the NEP is the smallest in September, followed by August and July, and the sea ice concentration starts to increase in October. In July, the sea ice concentration of NEP is higher in each year, especially in 2000, 2001, 2003 and 2004 (red box), the sea ice concentration is above 70%, and the navigation risk is high. By August, the sea ice concentration is considerably reduced. Among them, in the East Siberian Sea (1574 nautical miles), the sea ice concentration in 2000 and 2001 (red triangle) was higher than 60%. Near the Vilkitsky Strait (2885 nautical miles), the sea ice concentration in 2003, 2000 and 2004 (blue square) were the top three, up to 50%, 70% and 80% respectively, which had a considerable impact on the navigation. In August 2012 and 2015, the monthly average sea ice concentration of the NEP was below 20%. In August 2019, the sea ice concentration of the NEP approached 0, which had little impact on navigation. In September, the sea ice in the NEP was sparse, and the NEP was in an open sea without ice for many years. In September of 2012, 2015 and 2019, the NEP entered an ice-free state, very feasible for navigation. However, in September 2000, 2001, 2003 and 2004, there was still a considerable amount of sea ice near the East Siberian Sea (green diamond) and the Vilkitsky Strait (blue box). The risk of navigation was relatively high. In October, the sea ice concentration of the NEP years began to increase in each year. Compared with other years, the sea ice concentration in 2000, 2001, 2003 and 2004 was extremely high, with the peak reaching 80%. The monthly average sea ice concentration along the NEP in October 2012 and 2019 was below 20%, while the 2015 and multi-year average sea ice concentration was slightly higher, with the peak at 40%.
4. Connectivity Analysis of the NEP
The navigation window of a route refers to the navigation period during which the sea ice concentration does not affect the safe navigation of ships on the route, and it reflects the sea ice conditions of the sea area which the route passes. According to Shibata et al.’s [28] description of sea ice concentration and ice and navigation conditions, when the sea ice concentration is 10–30%, there is only a small amount of crushed ice on the sea surface, which is very sparse. Navigation is very smooth at this time. When the sea ice concentration is 40–60%, there is a large amount of unconnected crushed ice on the sea surface, and navigation is more difficult at this time. Let us take the “Yongsheng Ship” that crossed the Arctic for the first time as an example. The icebreaking capacity of the cargo ship is Arc4. Assuming that the cargo ship sails independently, without considering the assistance of other icebreakers, the threshold of sea ice concentration through which the “Yongsheng” can pass is 40%. Therefore, we set the threshold of sea ice concentration at 40%. The algorithm of navigable window is as follows: the starting day is the first day when the sea ice concentration at all points of the NEP is less than 40% for 3 consecutive days, and the ending day is the sea ice concentration at all points of the NEP is greater than 40% for 3 consecutive days.
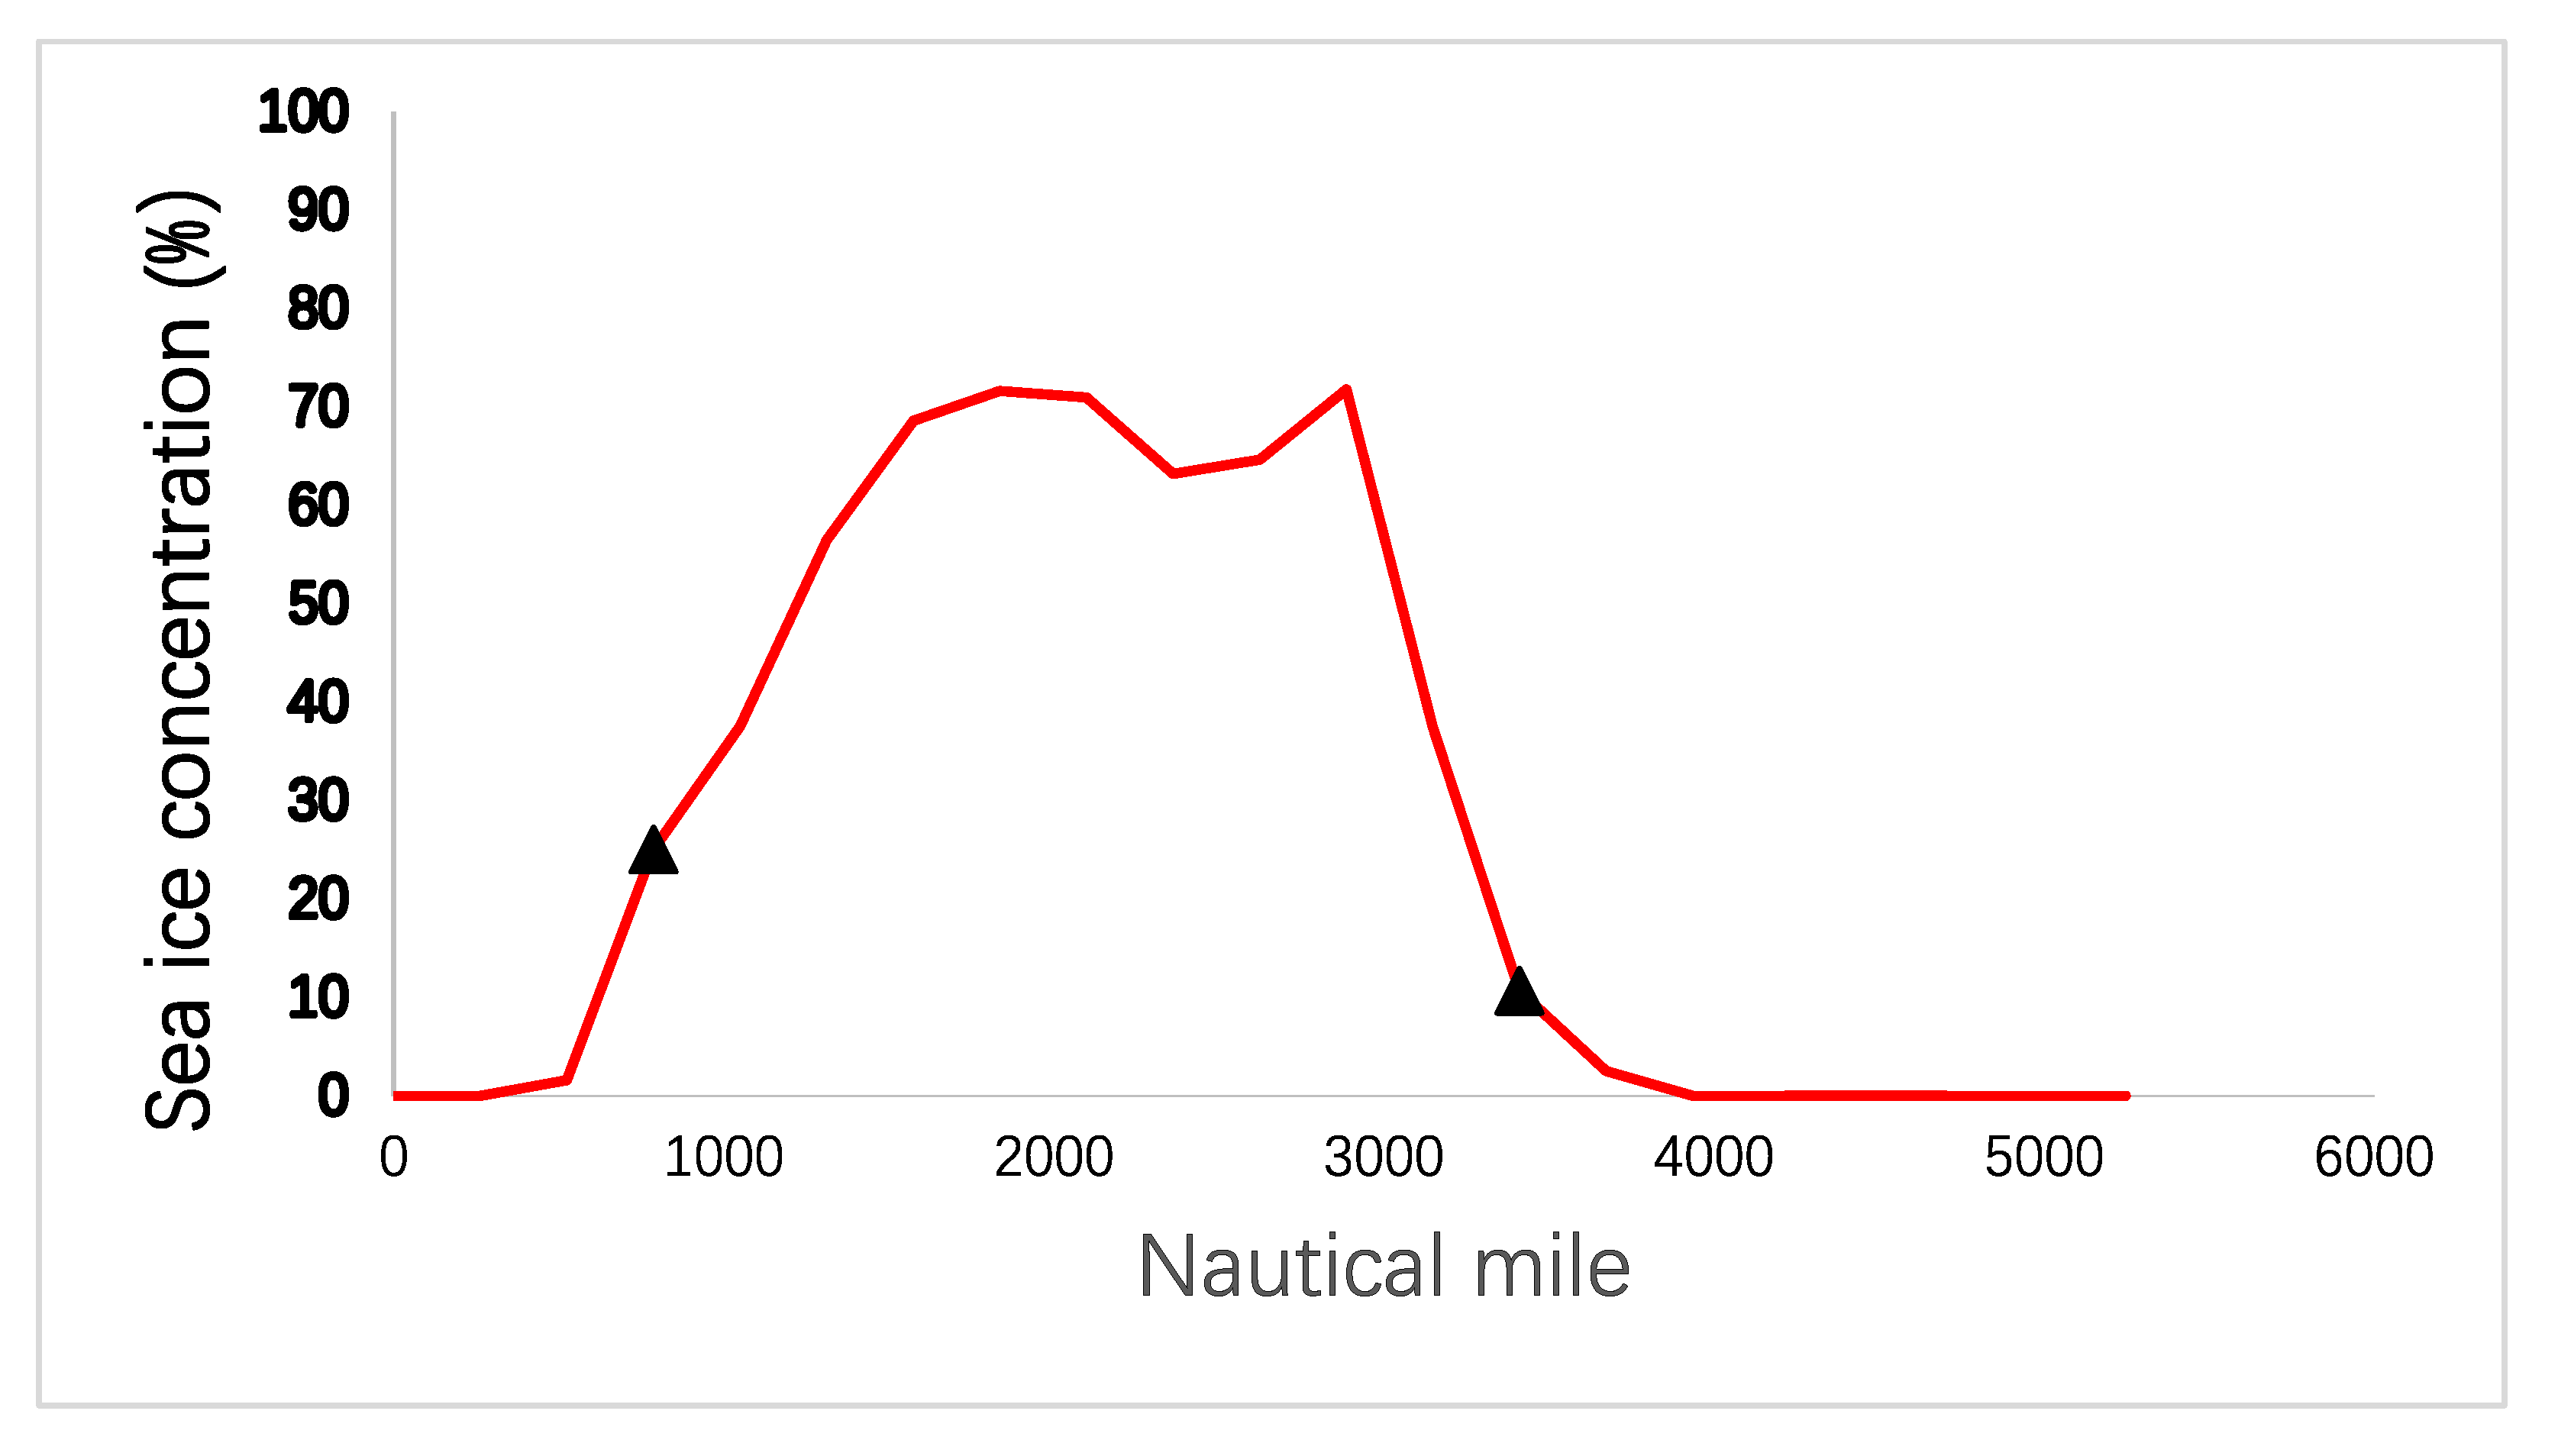
Figure 5 shows the overall sea ice concentration in the NEP from 2000 to 2019. It can be seen that the ice segment of the NEP is from 787.03 nautical miles to 3410.46 nautical miles, and there is less than 40% of the ice in the rest of the year. Therefore, we select from 1311.71 nautical miles to 3410.46 nautical miles to study the navigation window of the NEP, and define that when the navigation time is at least 10 days, the NEP can be opened to ensure the practical feasibility of navigation.
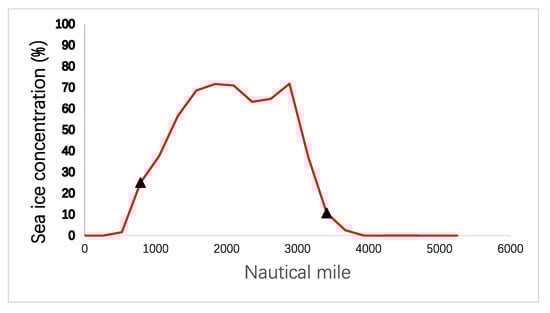
Figure 5.
The overall sea ice concentration of the NEP from 2000 to 2019; the black triangles indicate the start and end positions of the ice segment.
4.1. Navigation Window from 2000 to 2019
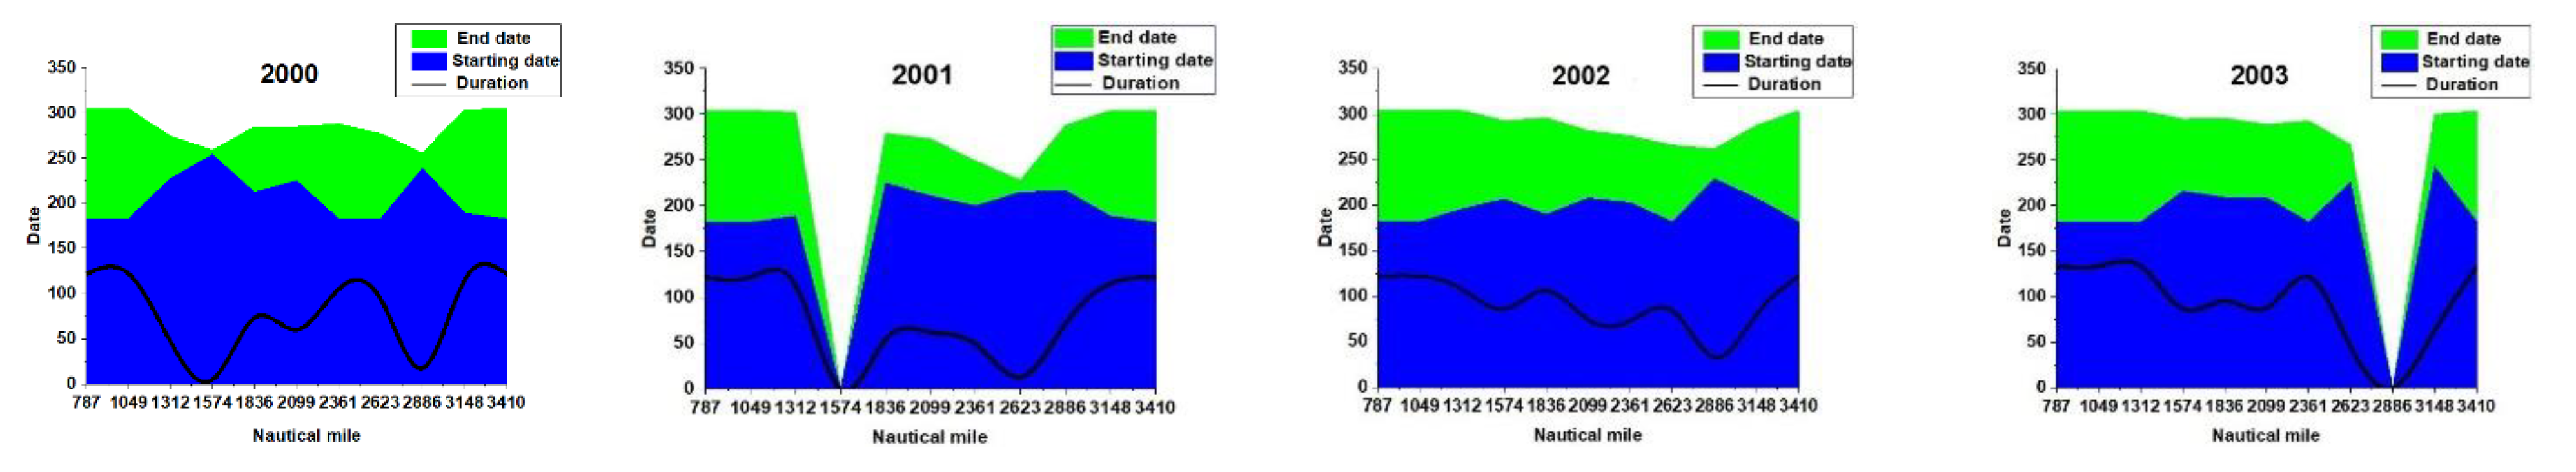
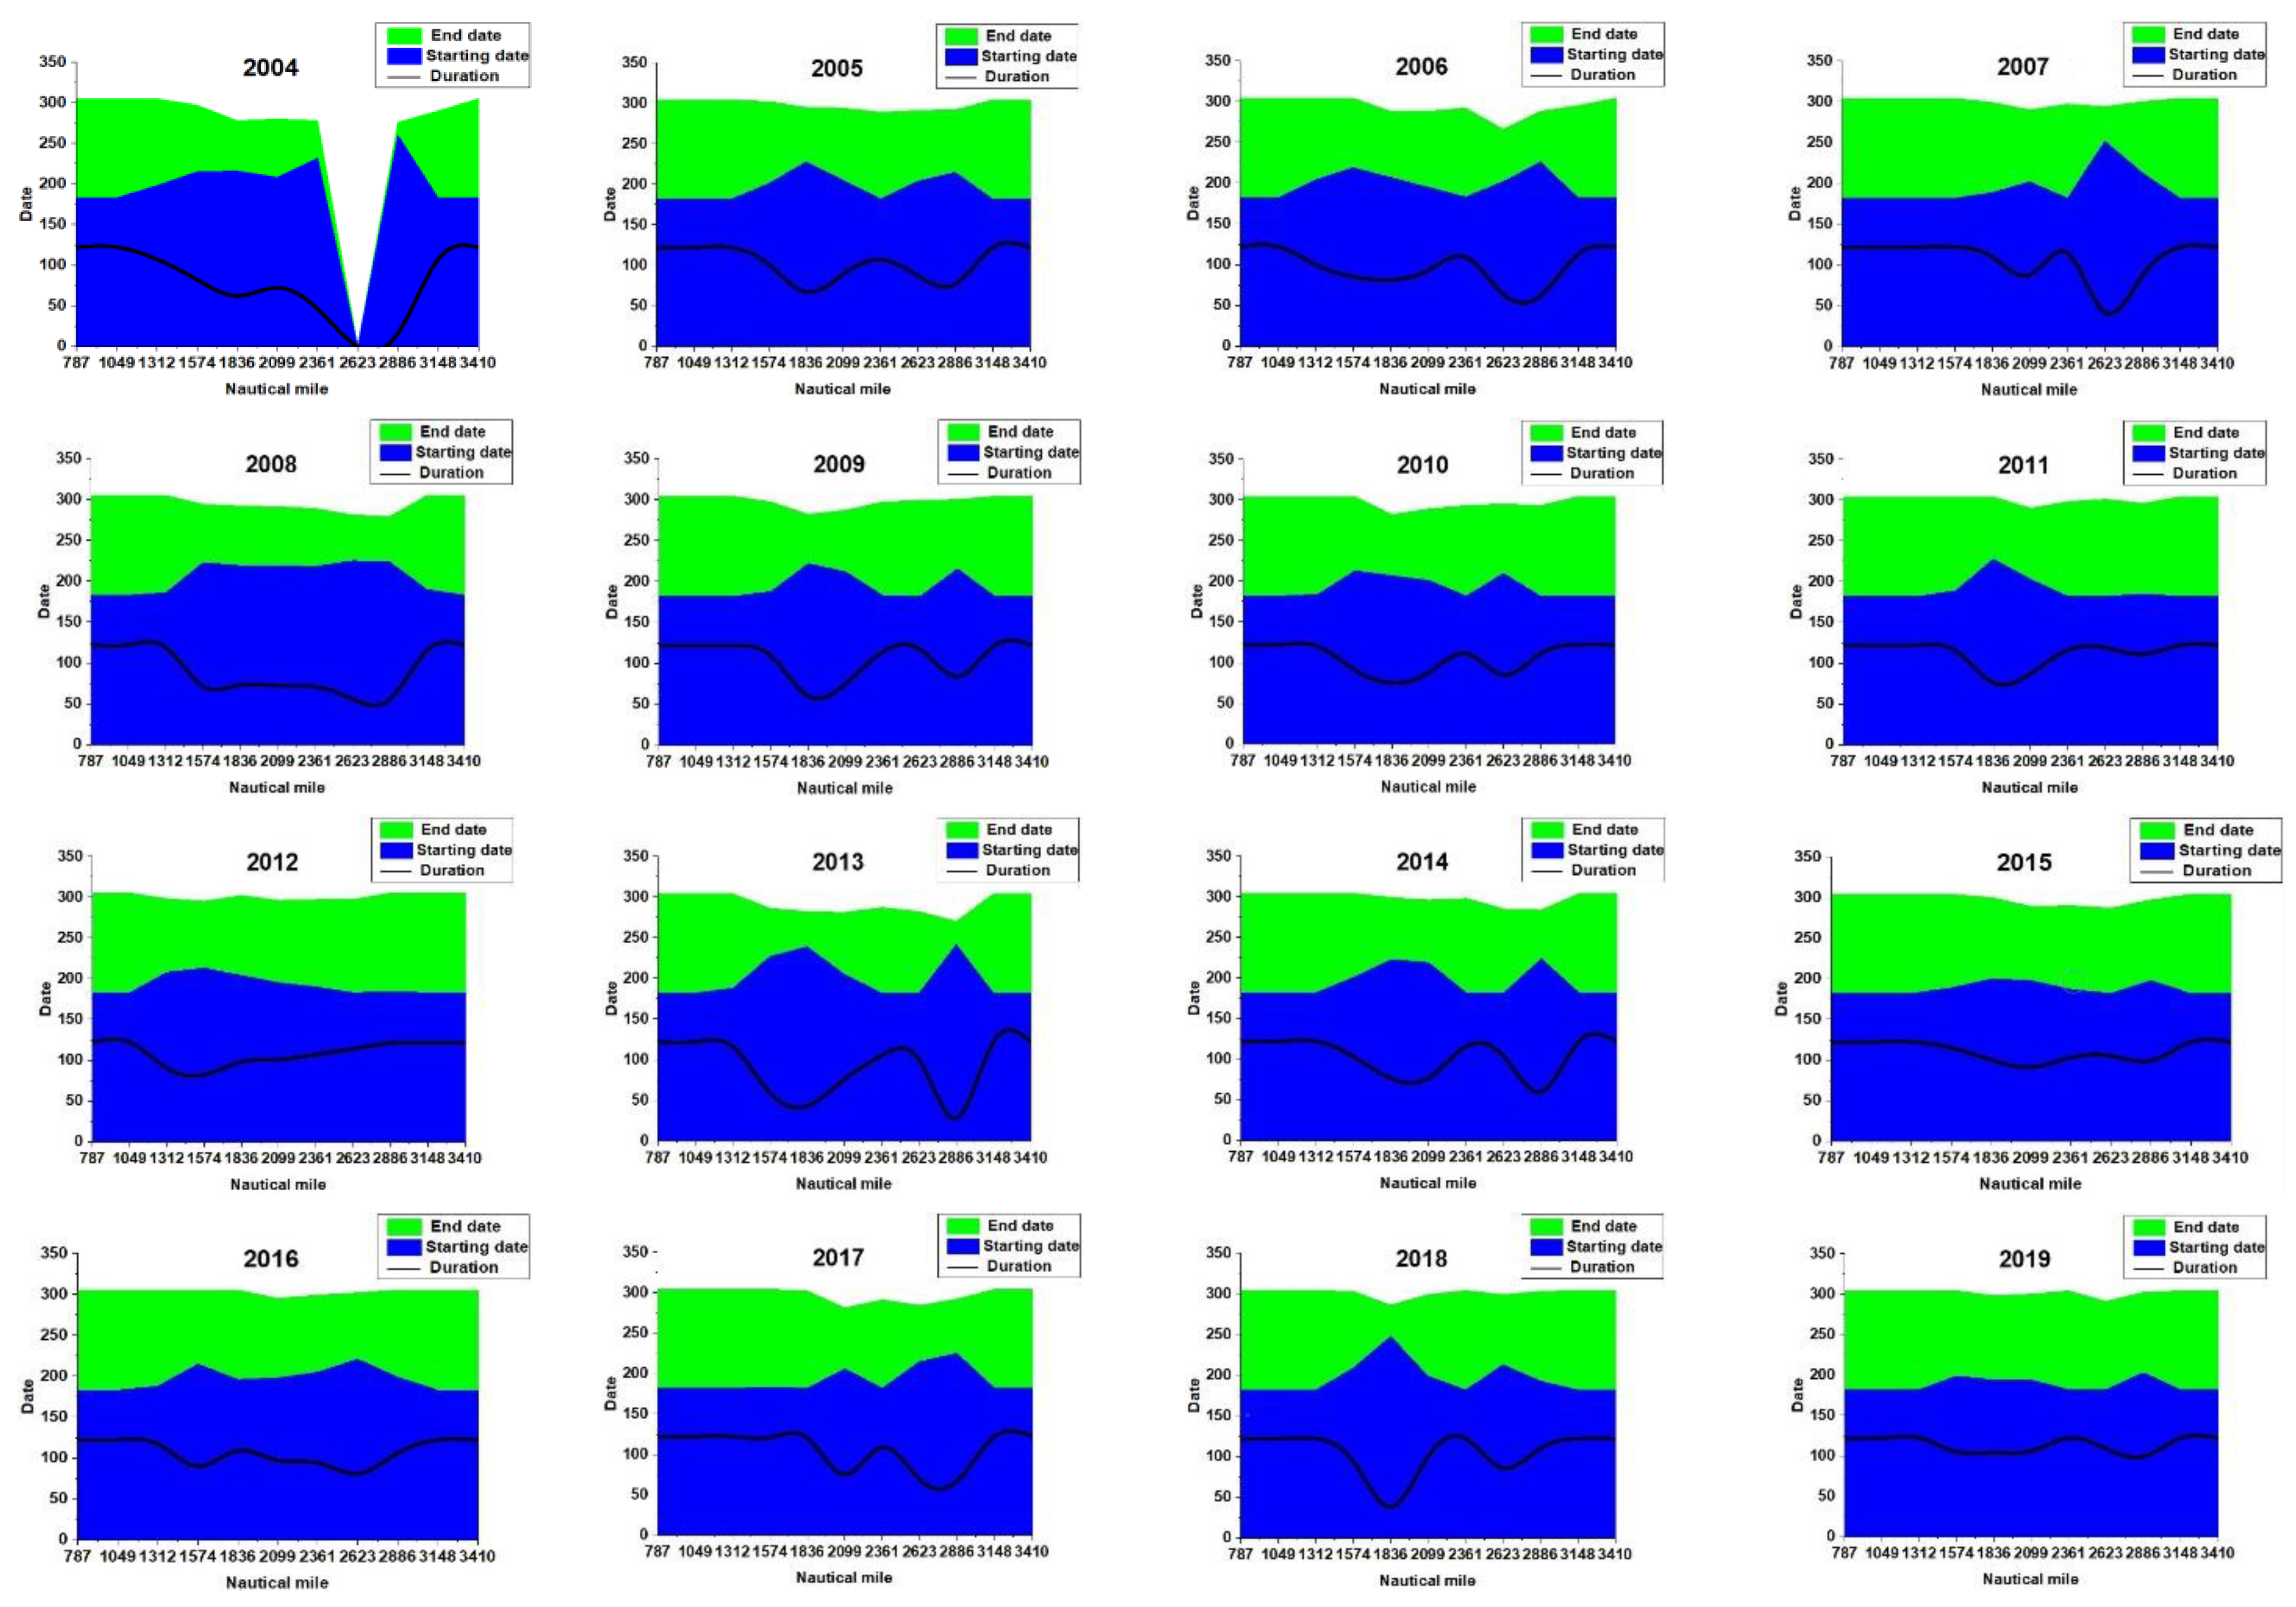
Figure 6 reveals the navigation window information of the NEP from 2000 to 2019. The abscissa is the location of the route, and the ordinate is the number of days in the current year. Table 1 is the navigation timetable of the NEP from 2000 to 2019, including the start and end dates of the navigation each year and the number of the NEP available each year.
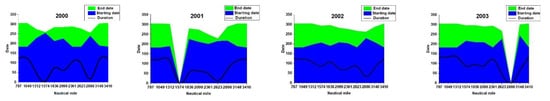
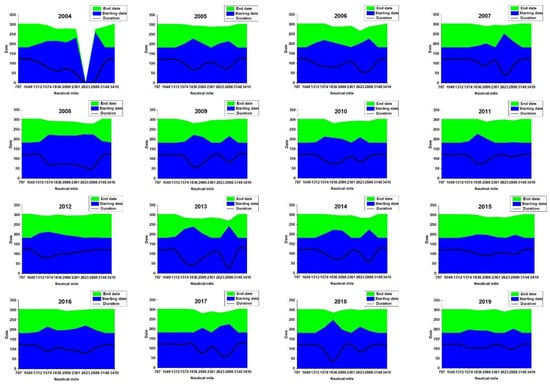
Figure 6.
The start and end time and duration of the navigation of the NEP from 2000 to 2019. The blue area indicates the start date of navigation of the NEP that year, the green area indicates the end date, and the solid black line indicates the navigation duration of the current year.

Table 1.
Navigation schedule of the NEP from 2000 to 2019.
The navigation window calculated in this study has also been verified by related studies. For example, Xinqing Li et al. [29] analyzed the sea ice variations of the NEP in the summer of 2014 and found that the opening time of the NEP in 2014 was approximately from early August to early October. It just coincides with the actual navigation results obtained in this article in 2014. Besides this, according to the report on ships sailing of the NEP from 2013 to 2019 in the International Shipping Network [30], the cargo ships sailing independently in 2013, 2015, 2016, 2017 and 2019 were all within the navigation window (Table 2).
Table 2.
Summary of independent sailing cargo ships from 2013 to 2019.
Table 1 reflects the actual navigable time and standard deviation of the navigable period of the NEP. It can be seen from Figure 6 and Table 1 that the actual navigation period of the NEP has a wide range of fluctuations. The navigation start time ranges from late July to early September, while the navigation end time is basically mid to late October. The most feasible month for navigation is September, followed by August. The standard deviation of the navigation period can reflect the degree of dispersion of the navigation period of various locations on the NEP. According to the standard deviation of the navigation period, it can be seen that the navigation time of each position of the NEP in 2000, 2001, 2003 and 2004 is relatively discrete, while the standard deviation of the navigation period in 2012, 2015 and 2019 is relatively small, and the navigation time difference of each position is relatively small. Among them, the navigation period of each location on the NEP is the most concentrated in 2019.
In 2000–2019, the navigation period of the NEP in 2000 was only 3 days. Actually, it was not actual to navigate, so it was deemed unavailable. In addition to the year 2000, the NEP could not be opened in 2001, 2003 and 2004. The navigation time in 2012, 2015 and 2019 was longer, all over 80 days. The navigation time in 2002, 2007 and 2013 was shorter. In the non-navigable years, the key areas for navigation in 2000 were 1574 nautical miles and 2886 nautical miles. In 2001, they were 1574 nautical miles and 2623 nautical miles. At 1574 nautical miles is the central area of the East Siberian Sea. The ice concentration is higher than 50%, and it is at a high-risk node for navigation; while the locations of 2623 nautical miles and 2886 nautical miles are located in the eastern area (2623 nautical miles) and western area (2886 nautical miles) of the Vilkitsky Strait, respectively. These are the areas that were not navigable in 2003 and 2004. In the short navigable years, the key area for navigation in 2002, 2007 and 2013 is also the Vilkitsky Strait.
For each special year, we use the seasonal average data of wind field, temperature, temperature anomalies, sea ice age and sea ice movement in the Arctic summer for analysis. The summer seasonal average maps are used for 2000, 2001, 2003, 2004, 2012, 2015 and 2019 respectively, while the monthly average maps for July, August and September are used for 2002, 2007 and 2013.
4.2. Non-Navigable Years
4.2.1. 2000 and 2001
In 2000 and 2001, the areas where the NEP was not navigable were in the East Siberian Sea (1574 nautical miles) and the Vilkitsky Strait (2623 to 2886 nautical miles). The possibility of the opening of the NEP in these two years is extremely low. In 2000, there was only a three-day opening period, and the actual navigation was inconvenient. In the summer of 2001, the NEP did not open to navigation because of the high concentration of sea ice.
According to Figure 7a,d, in the summer of 2000, the East Siberian Sea, the Laptev Sea and the Kara Sea were all affected by the northeast wind, while a wind field blowing from southwest to northeast was formed in the Barents Sea, and the wind field in the Vilkitsky Strait was northerly. This was caused by the combined action of a low-pressure system in the central Arctic and high pressure over the European continent (not shown). In the summer of 2001, the Laptev Sea, the Kara Sea and the Vilkitsky Strait formed a wind field blowing from northwest to southeast, and the Barents Sea was mainly affected by the southerly wind. This was caused by the combined action of the low-pressure system in the Laptev Sea and the high pressure over the Kara Sea (not shown).
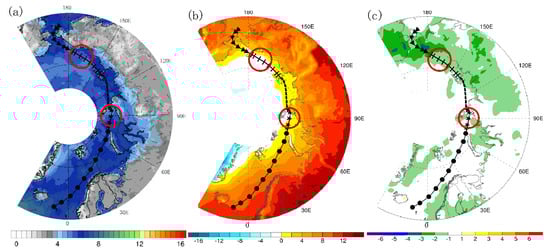

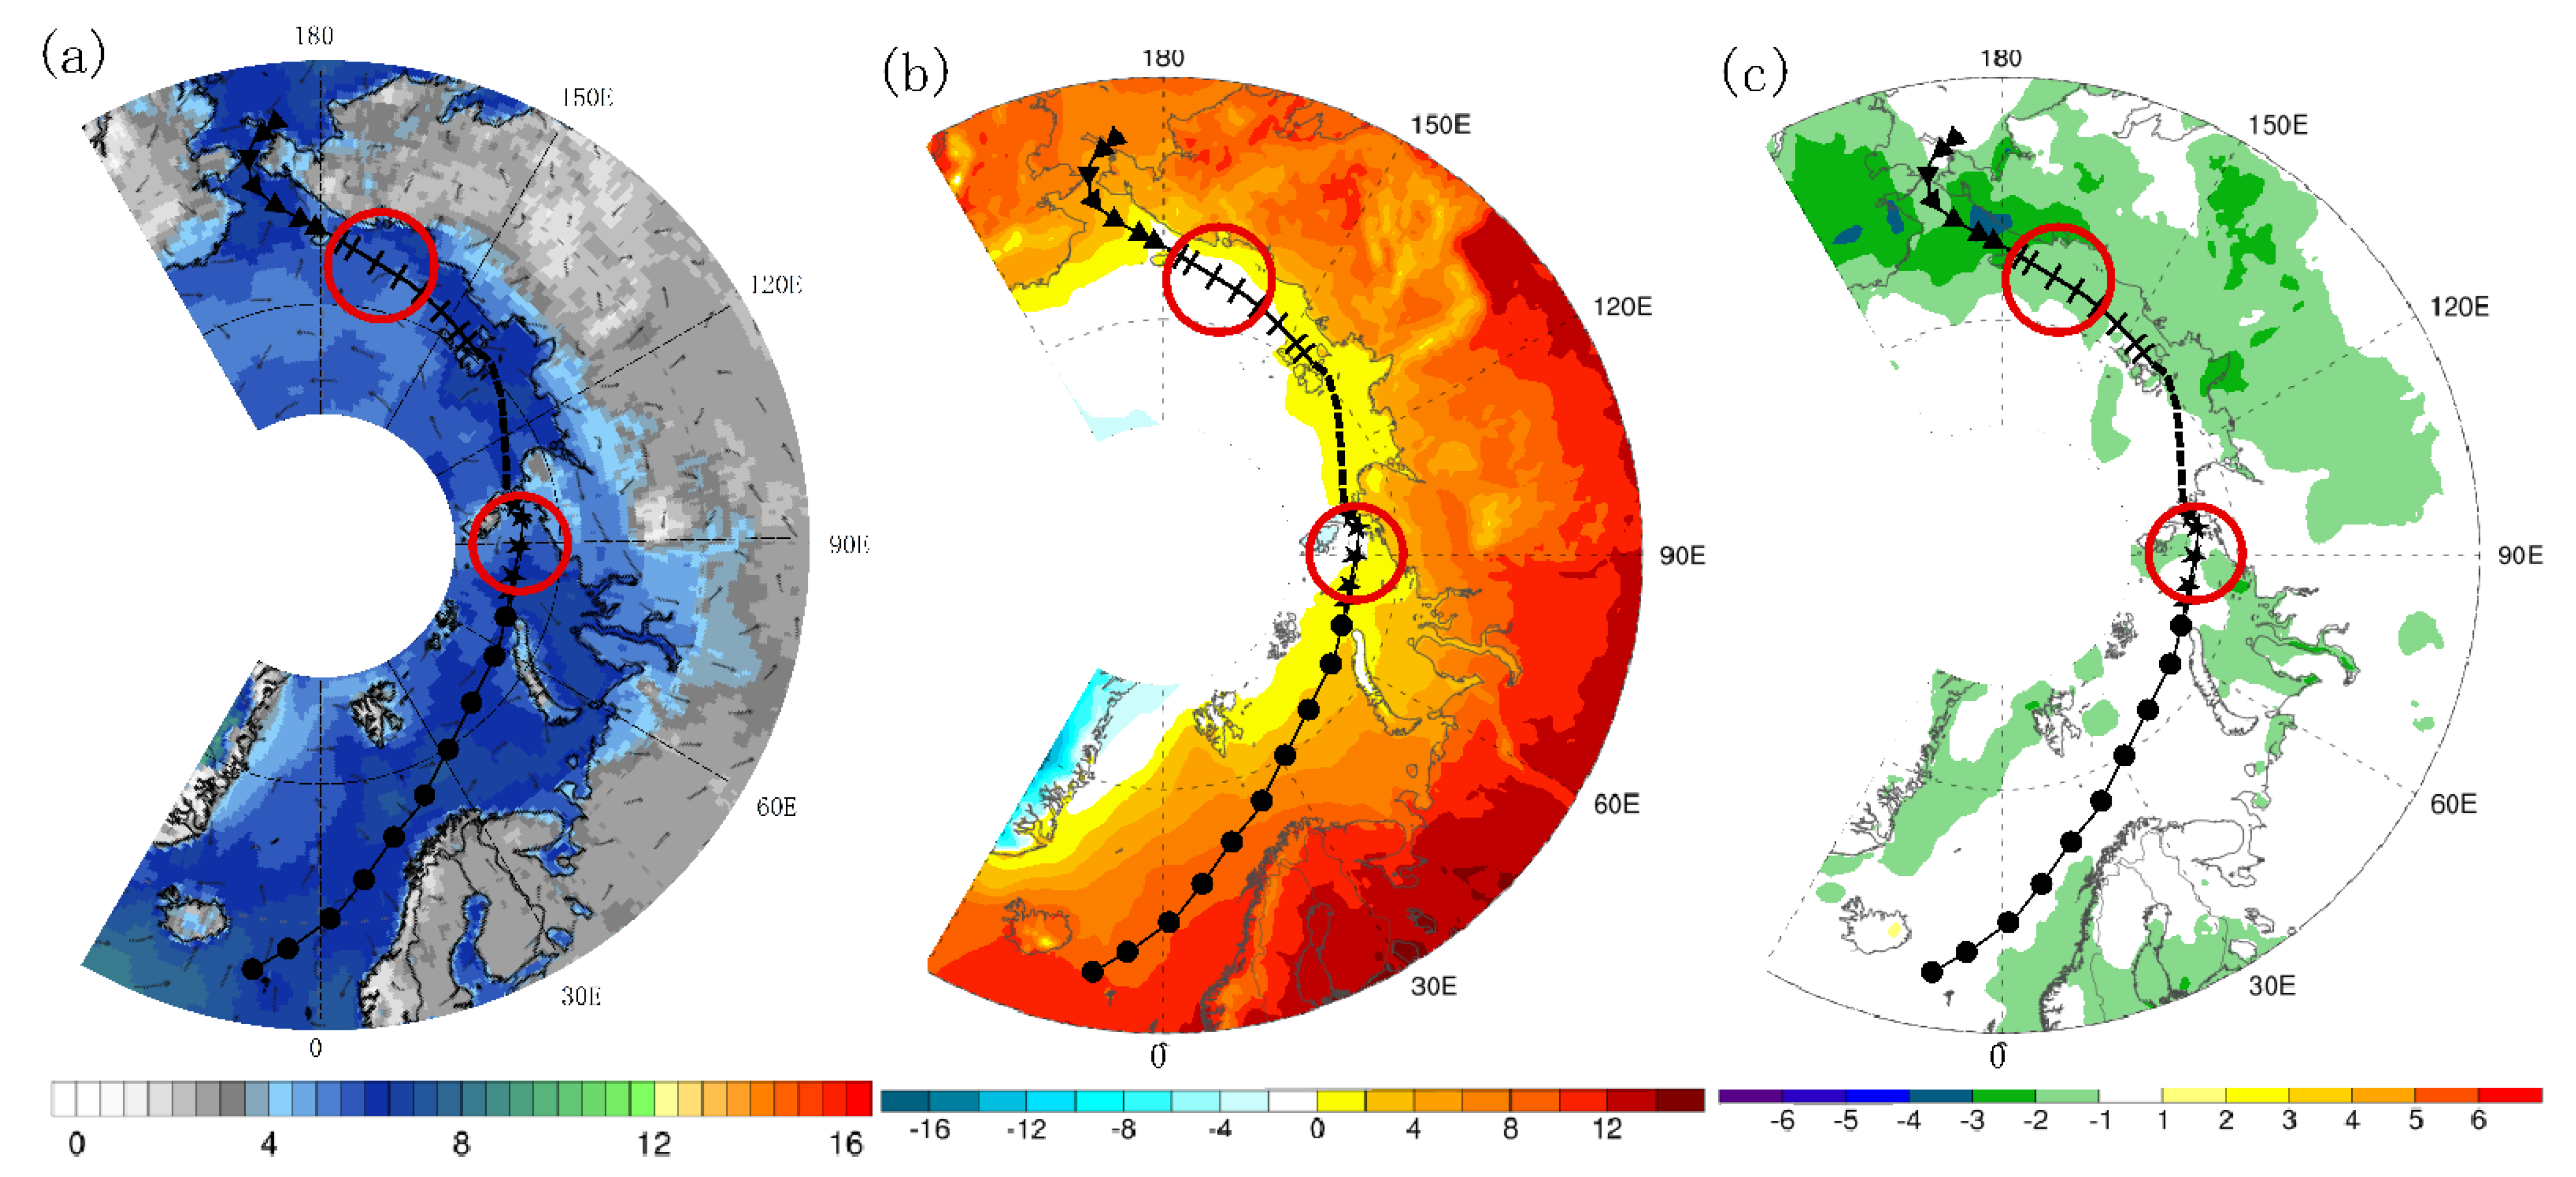
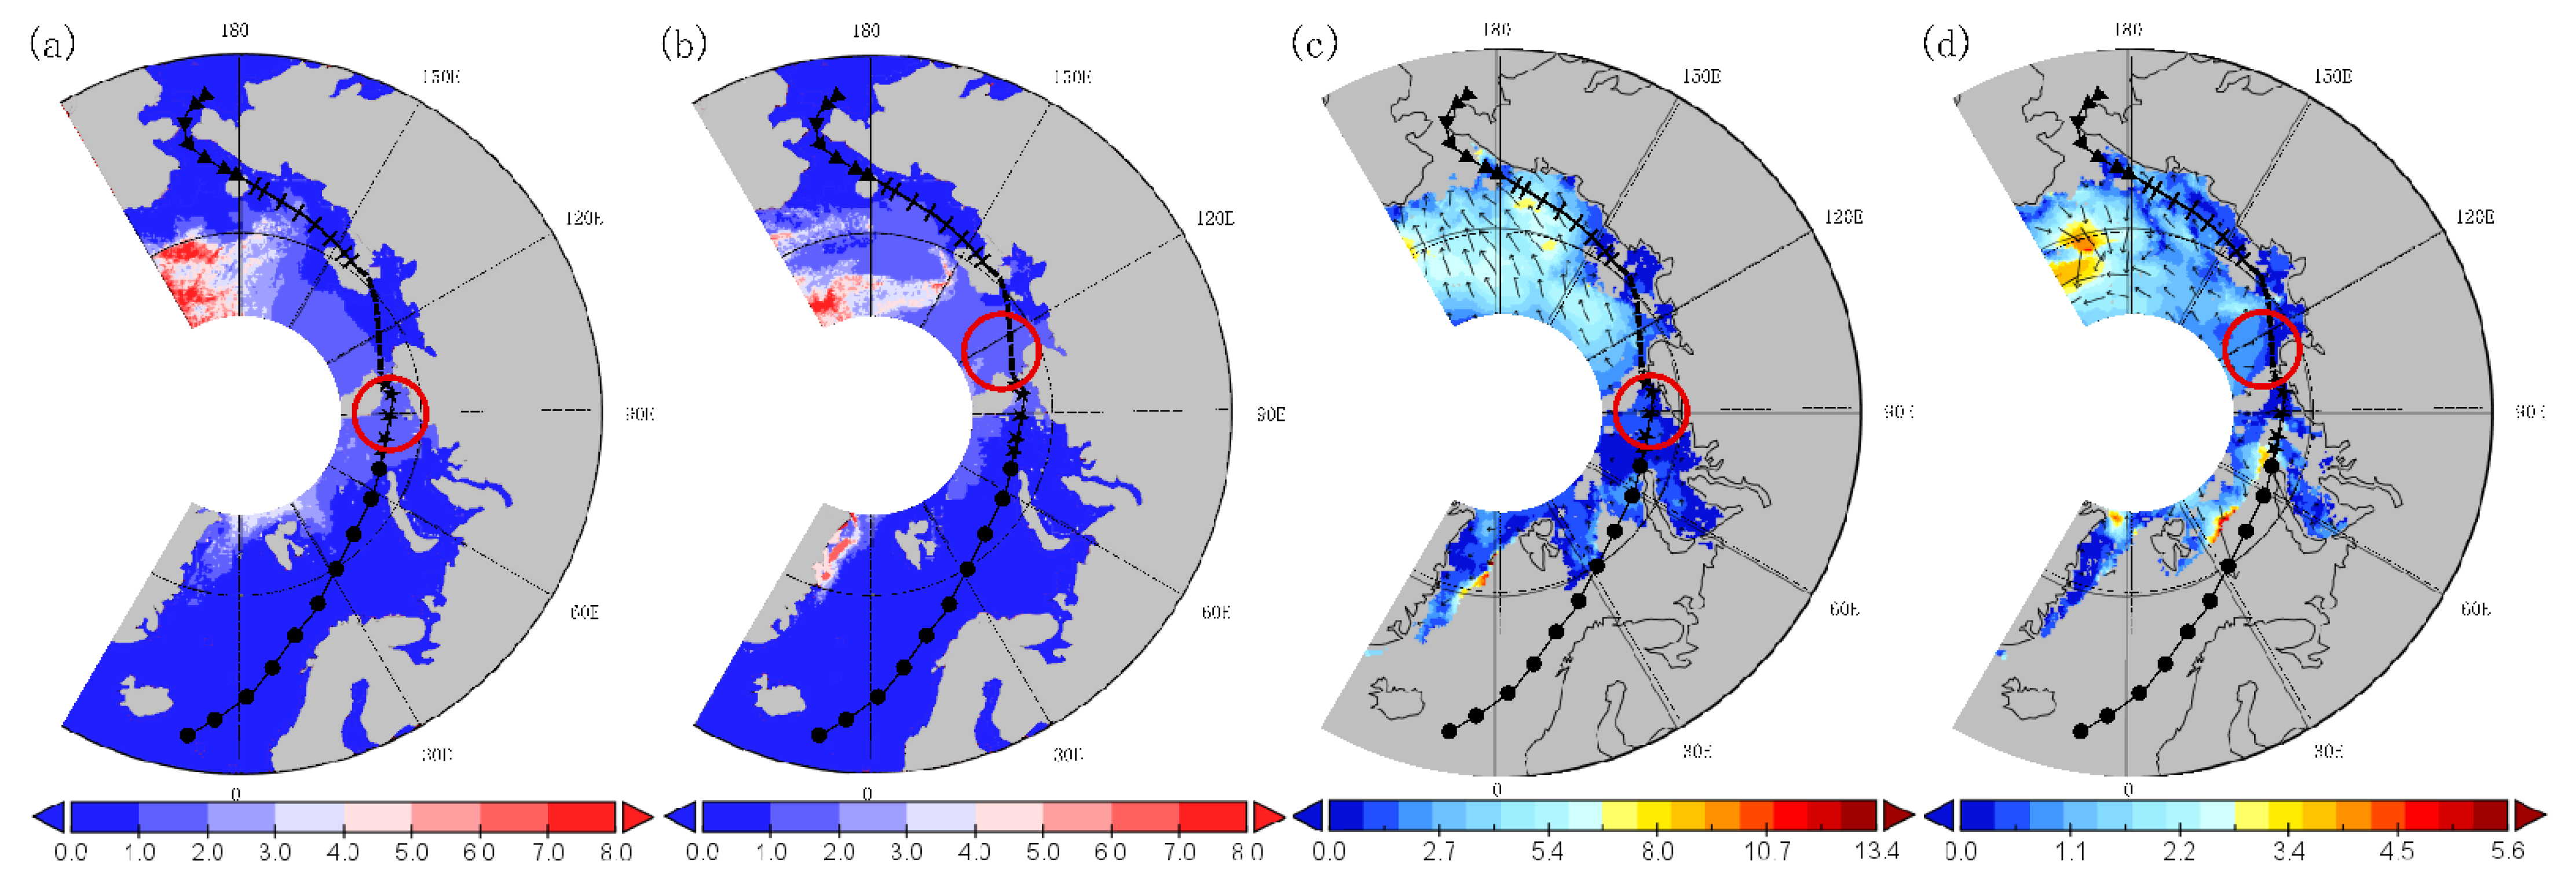
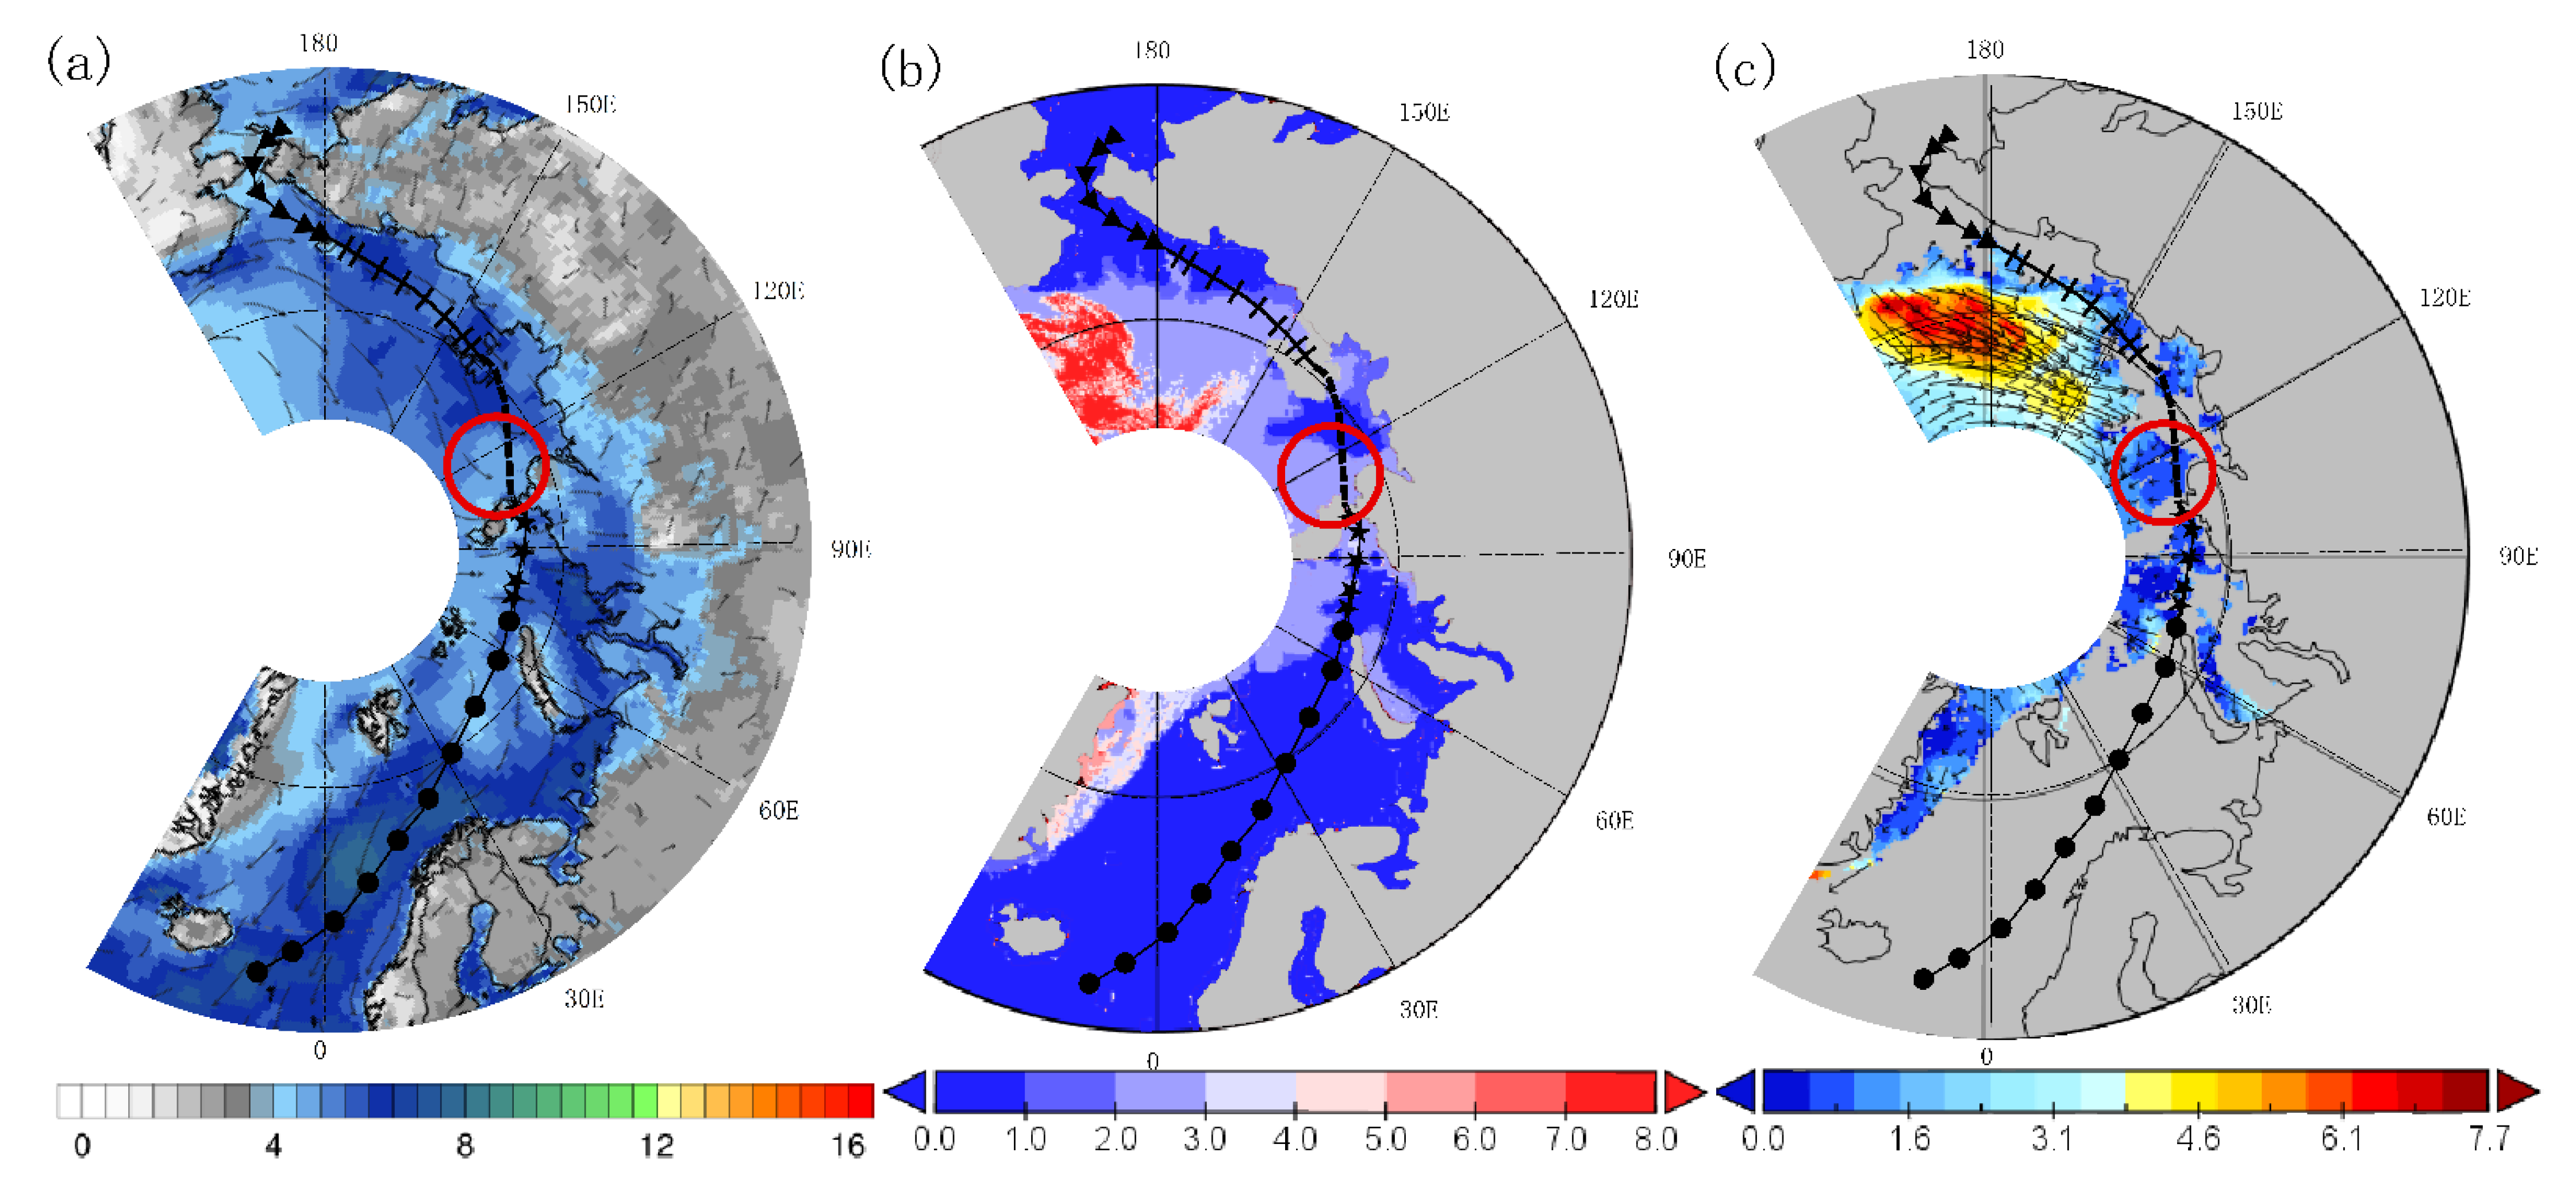
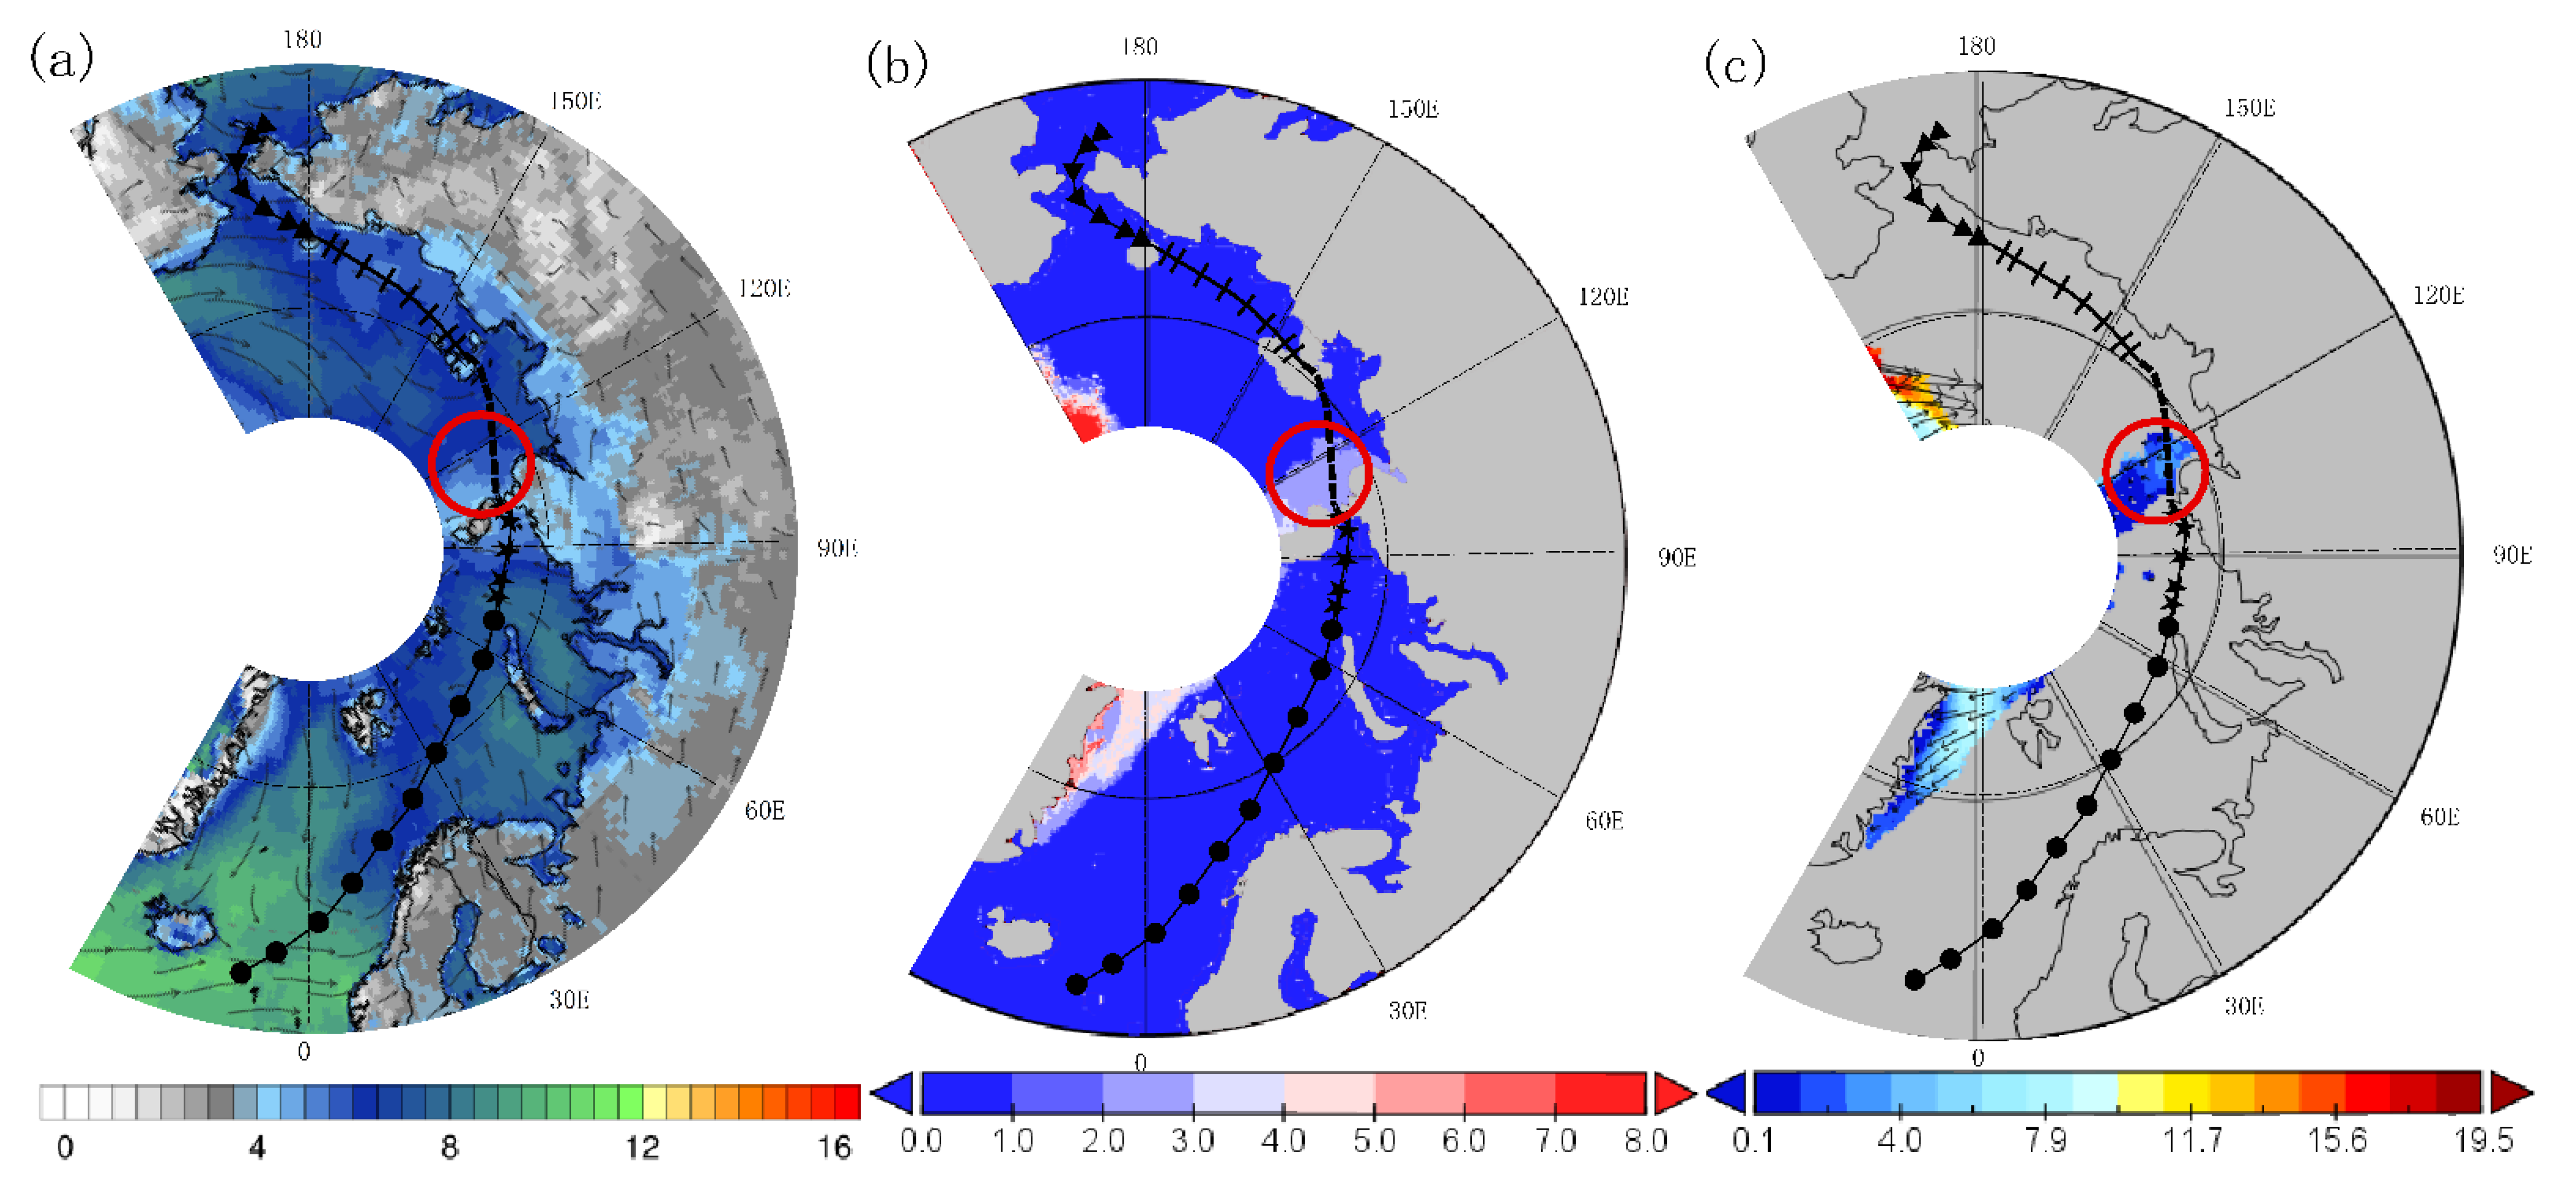
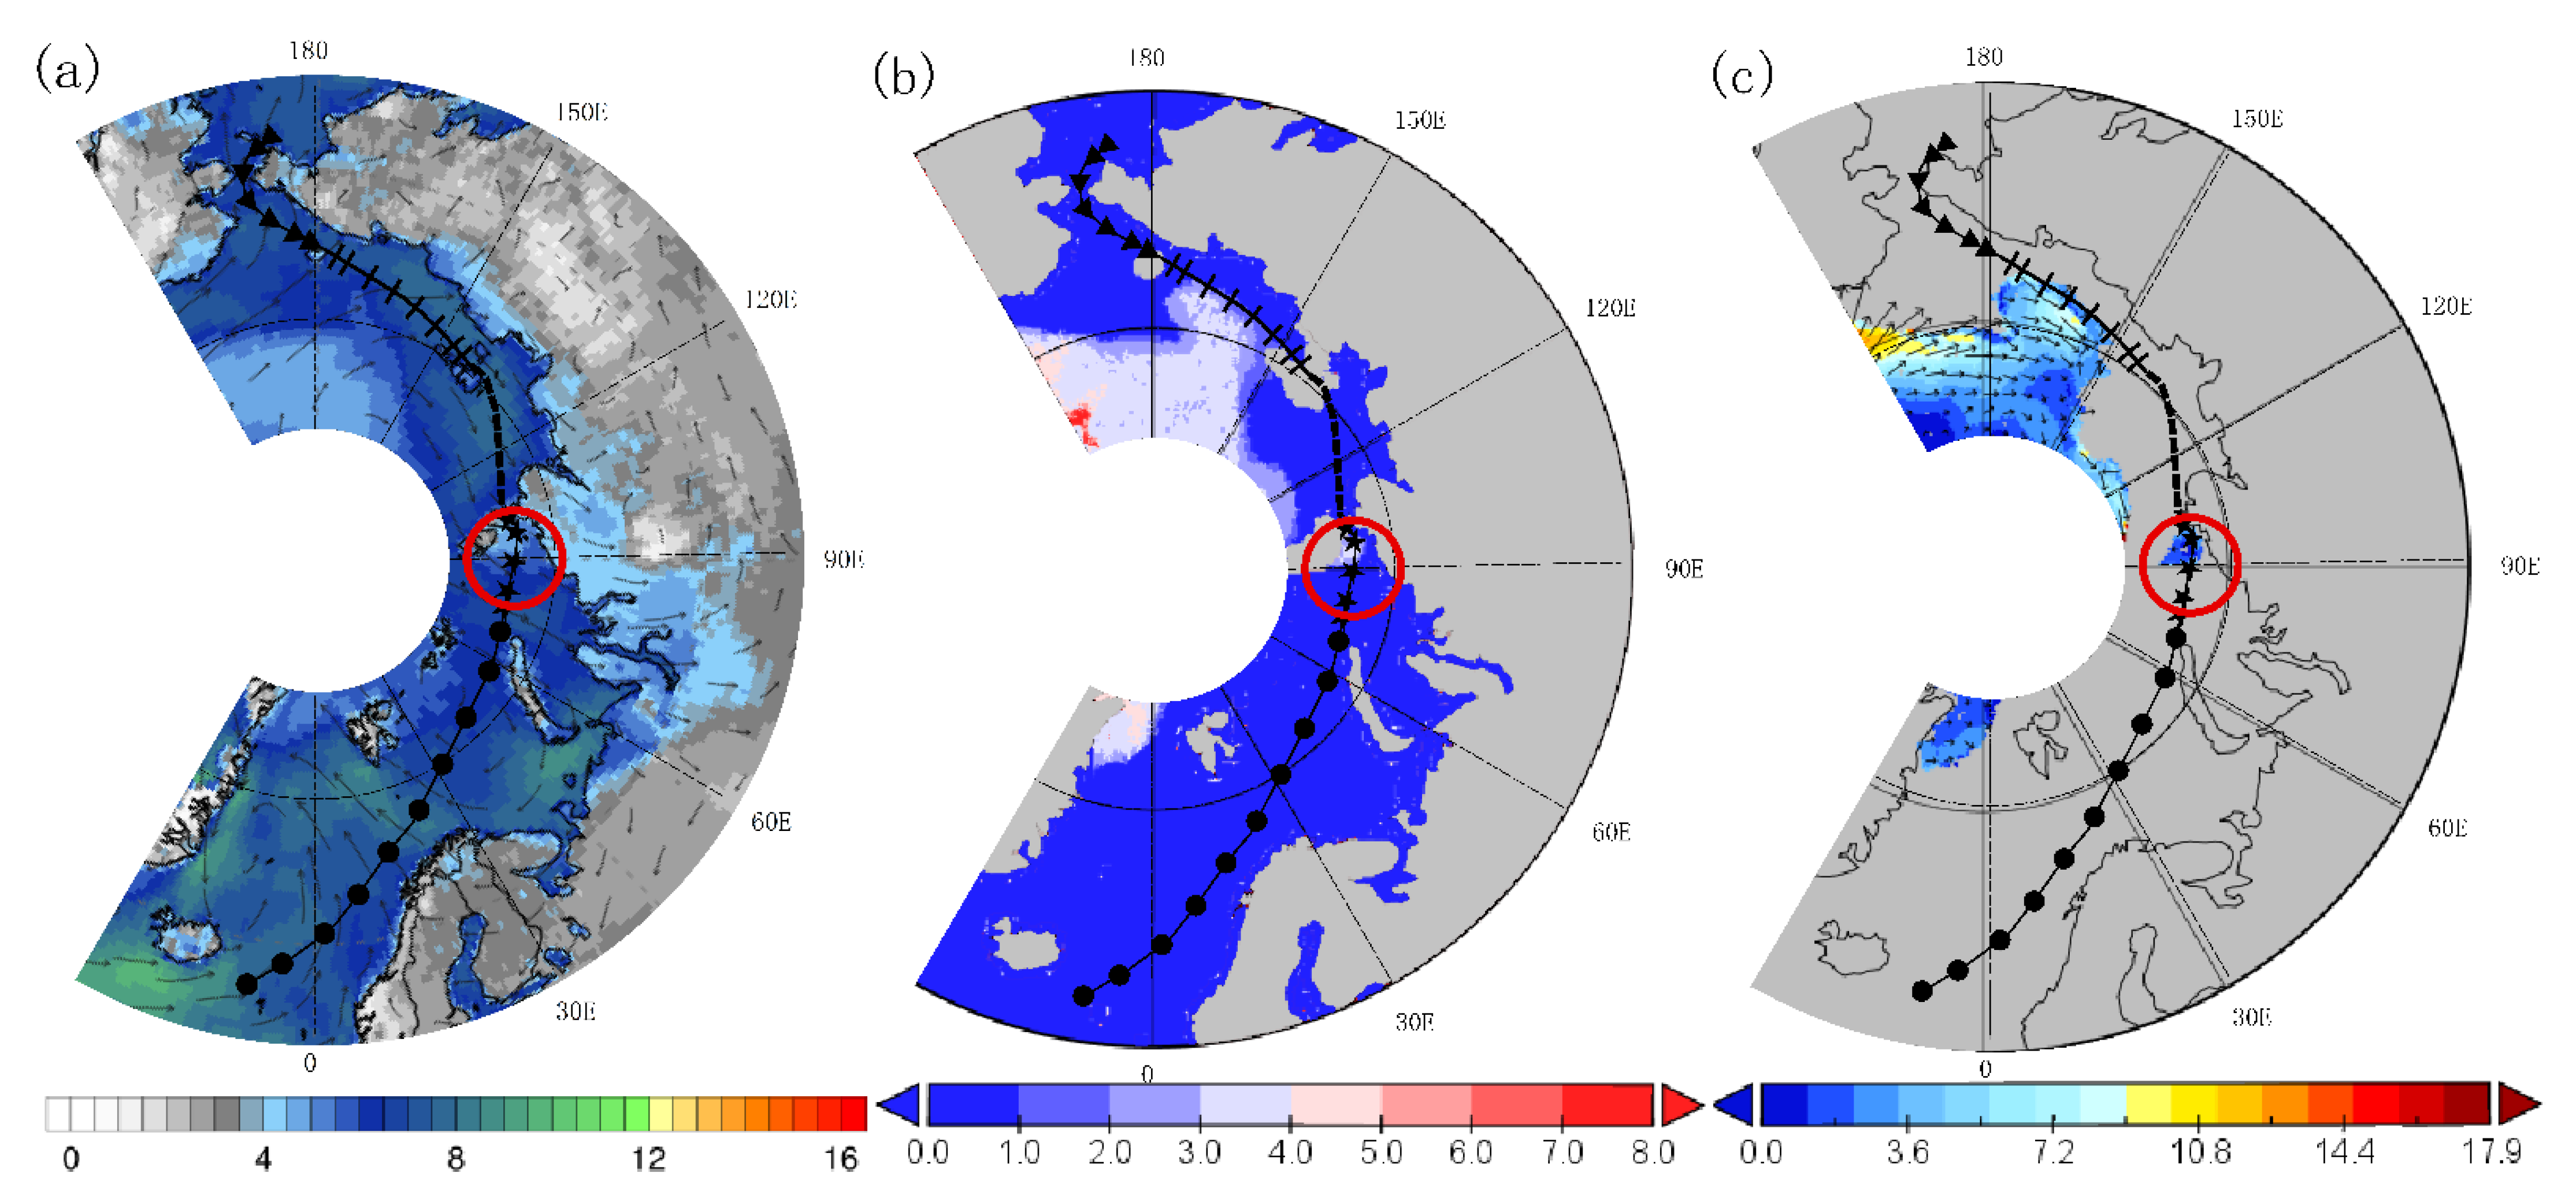
Figure 7.
The average wind field (a), average temperature (b) and temperature anomalies (c) of the NEP in the Arctic summer (July–September) in 2000. The average wind field (d), average temperature (e) and temperature anomalies (f) of the NEP in the Arctic summer in 2001. The red circles indicate the throat areas that affected the navigation of the NEP in that year, the same below.
It can be seen from Figure 7b,e that the temperature in the East Siberian Sea and the Vilkitsky Strait in 2000 was mainly around 0 °C, which was not conducive to the ablation of sea ice. The temperature in the Laptev Sea was 2 °C, the temperature in the Kara Sea was around 2 °C and the temperature in the Barents Sea was 0–4 °C. Compared with the multi-year average, the temperature in the East Siberian Sea, the western side of the Vilkitsky Strait, the Laptev Sea and the Kara Sea was abnormally low by about 2 °C, while the Barents Sea had not changed much. According to Figure 7c,f, the temperature of the East Siberian Sea, the Laptev Sea and the Vilkitsky Strait in 2001 was around −5 °C, and the temperature of the three sea areas was abnormally low compared with the average for many years, which had no effect on the ablation of sea ice. Among them, the temperature in the East Siberian Sea was about 1.2 °C lower, the temperature in the Laptev Sea was 2 °C lower, and the temperature in the eastern side of the Vilkitsky Strait was 0.8–1.6 °C lower. The temperature in the Kara Sea was slightly warmer, between 0–5 °C, and the temperature in the Barents Sea was around 5 °C. There was not much abnormal change in temperature in these two sea areas.
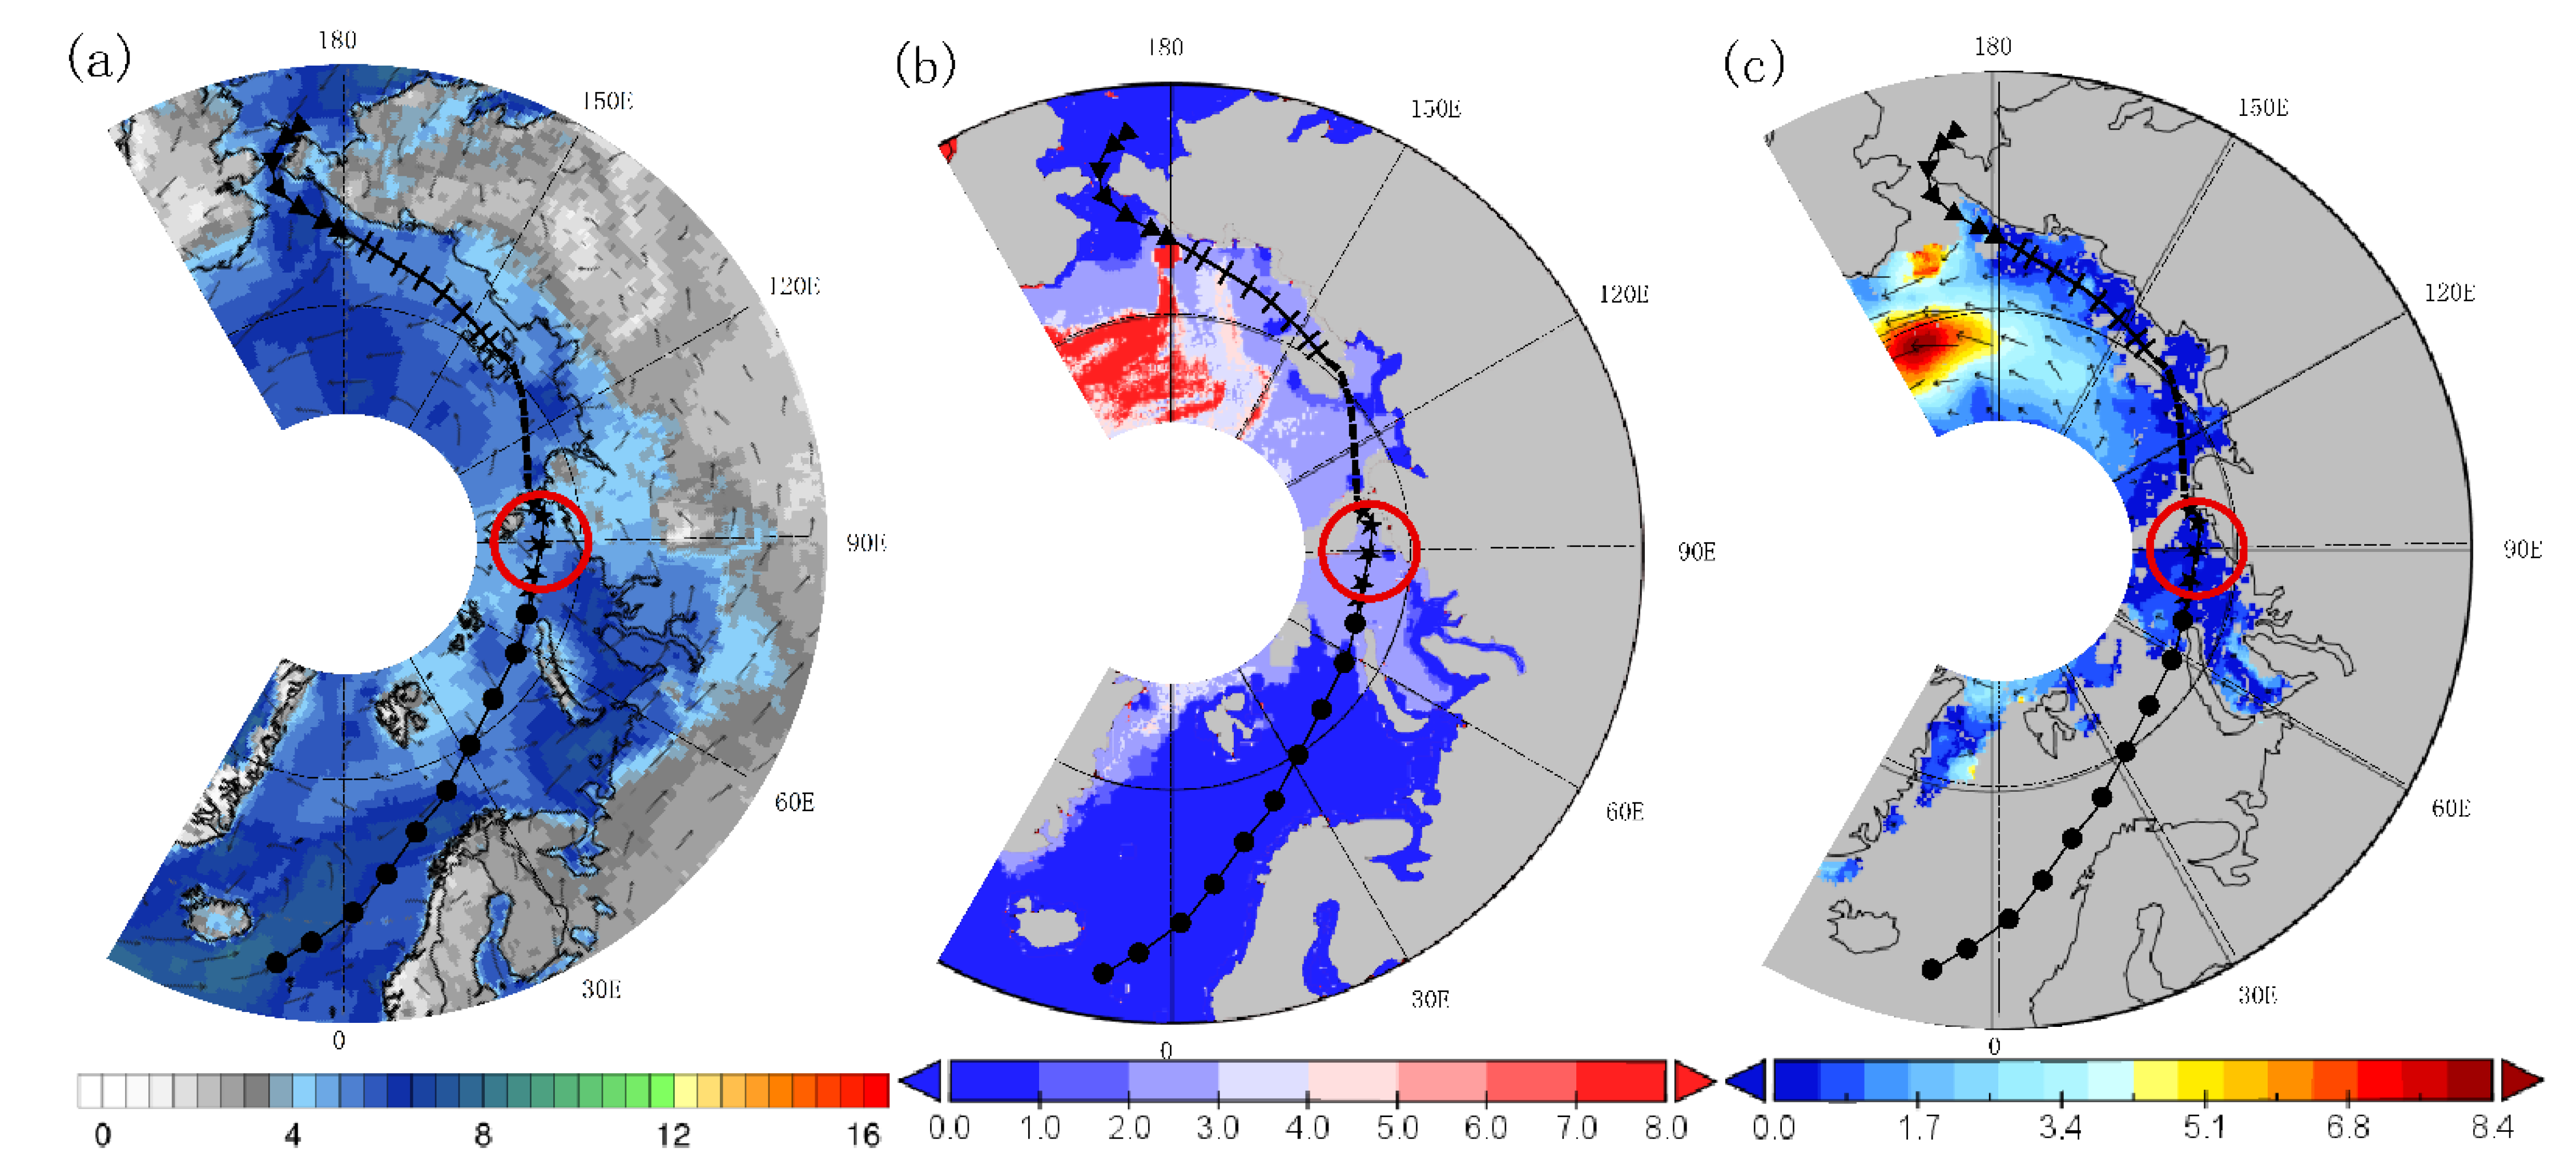
It can be seen from Figure 8a,b that in the NEP in the summer of 2000 and 2001, the Bering Strait, the Laptev Sea, the Kara Sea and the Barents Sea were all dominated by one-year ice. However, in these two years, there was sea ice of more than 2 years in the central waters of the East Siberian Sea. Especially in 2000, there was a small amount of sea ice that was more than 5 years old. In the summer of 2000, in the western part of the Vilkitsky Strait, the sea ice was dominated by 2 to 3 years. In 2001, there was a large area of two-year ice in the eastern part of the Vilkitsky Strait. The multi-year ice layer is thick and the whole is firmer, and it is not easy to melt in summer, which easily causes the sea ice concentration here to increase. According to Figure 8c,d, in the summer of 2000 and 2001, certain sea ice movement occurred in the central waters of the East Siberian Sea. It was possible that under the influence of the Arctic wind field, sea ice was pushed to the central waters of the East Siberian Sea to accumulate, leading to a higher sea ice concentration here. There was a certain amount of sea ice movement in the western part of the Vilkitsky Strait in the summer of 2000 and the eastern part of the Vilkitsky Strait in the summer of 2001, which affected the navigation of the Vilkitsky Strait in that year.
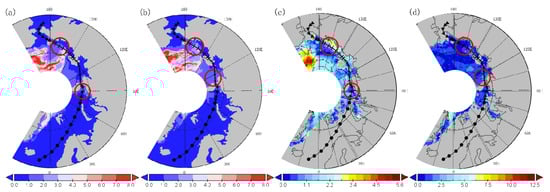
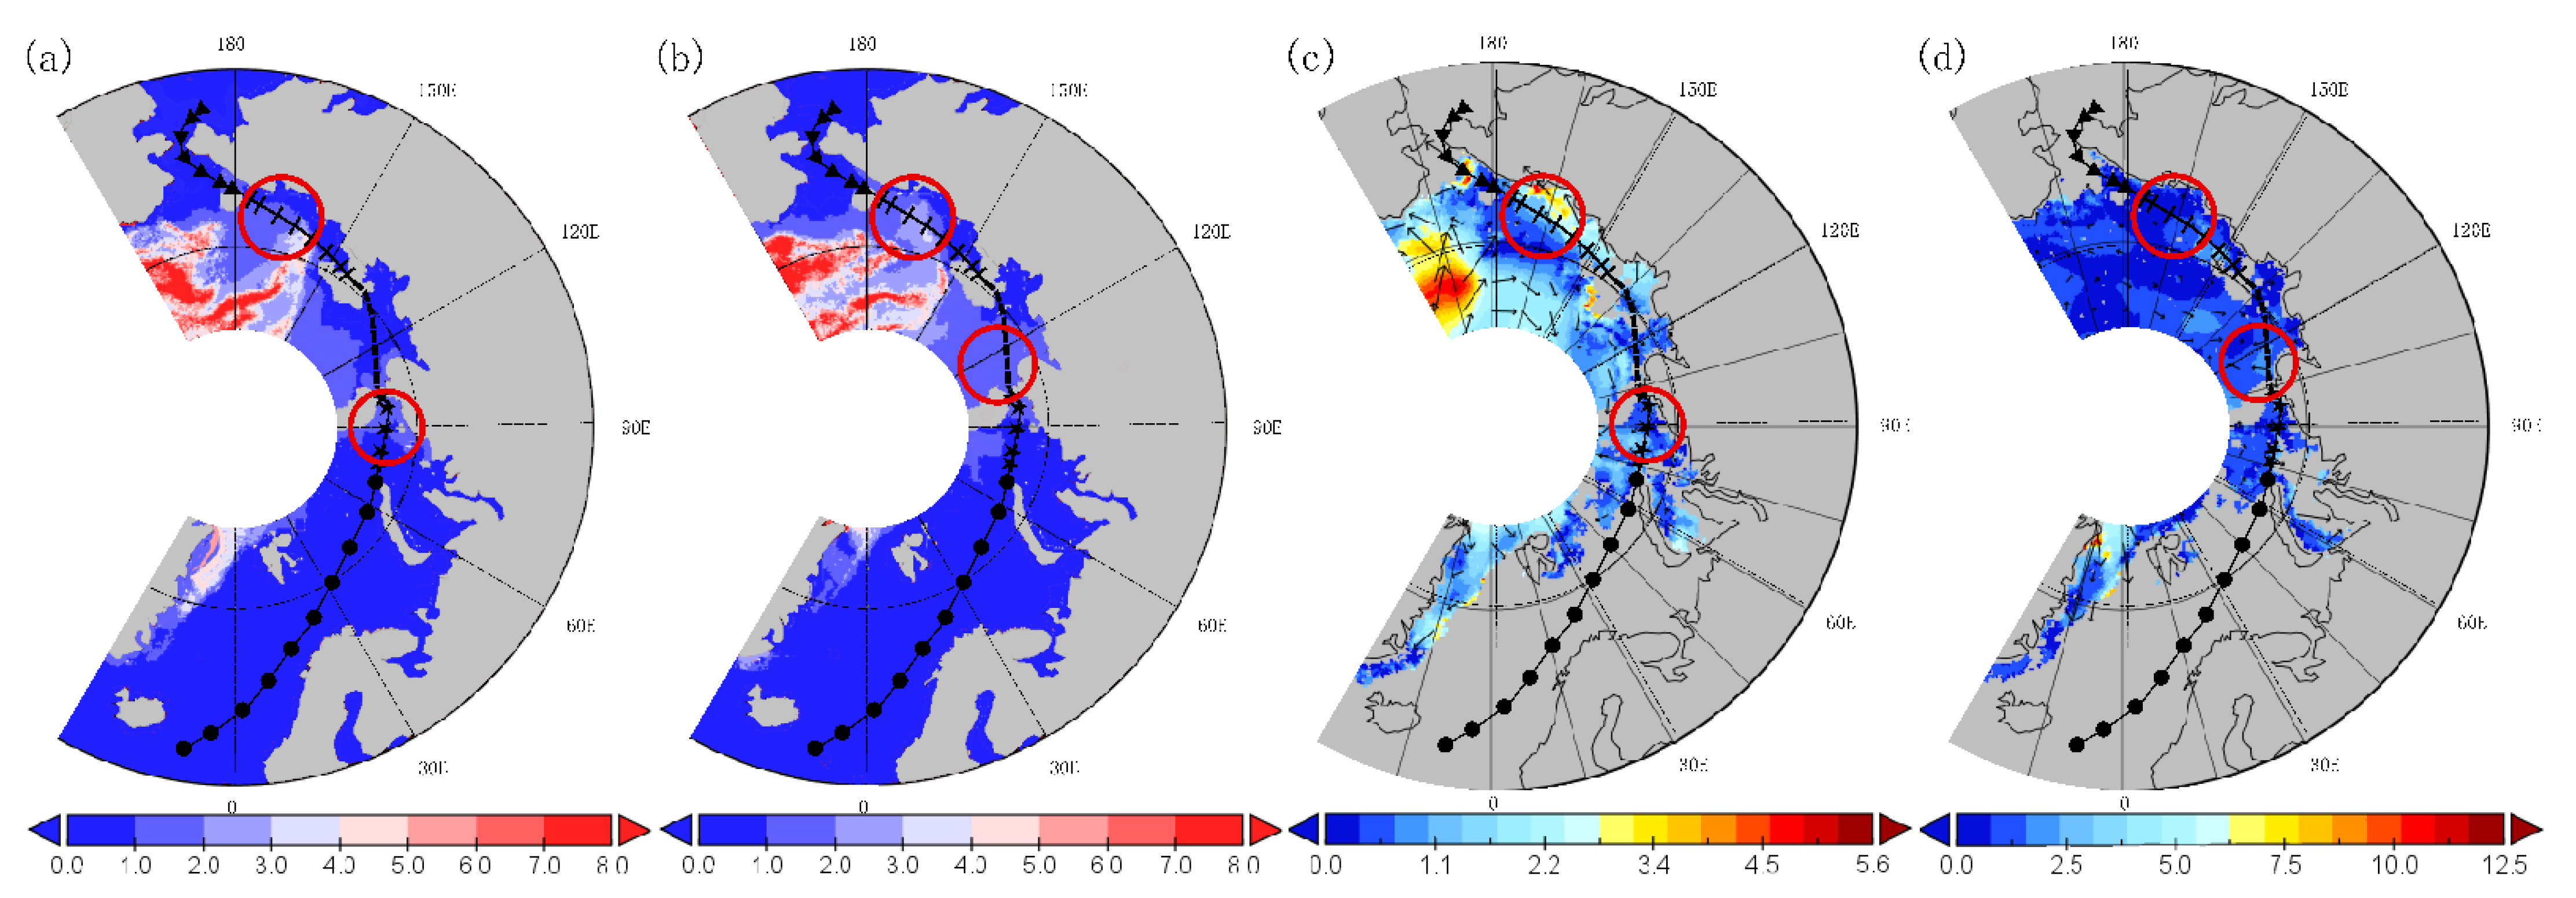
Figure 8.
The distribution map of sea ice age in the NEP in the Arctic summer in 2000 (a) and 2001 (b), and the map of sea ice movement in the NEP in the Arctic summer in 2000 (c) and 2001 (d).
4.2.2. 2003 and 2004
In the summer of 2003 and 2004, the NEP was closed. The key area for navigation is the Vilkitsky Strait. The difference is that the western area of the Vilkitsky Strait had a higher sea ice concentration in 2003, while it was the eastern area in 2004.
According to Figure 9a,d, in the summer of 2003, the East Siberian Sea, the Laptev Sea, the Kara Sea and Vilkitsky Strait were completely controlled by the westerly wind, while the Barents Sea was dominated by northwest winds. This was caused by the strong low-pressure field only in the central region of the North Pole in the summer of 2003 (not shown). In the summer of 2004, there was a high-pressure center in the Kara Sea, and the pressure on the Eurasian continent was relatively low (not shown). Under this sea level pressure field, the southerly wind prevailed in the East Siberian Sea and the Barents Sea in the summer of 2004, while the northerly wind prevailed in the Laptev Sea and Kara Sea, and the cold air brought by the northerly wind slowed the ablation of sea ice.
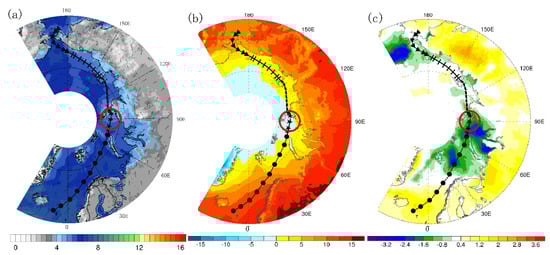
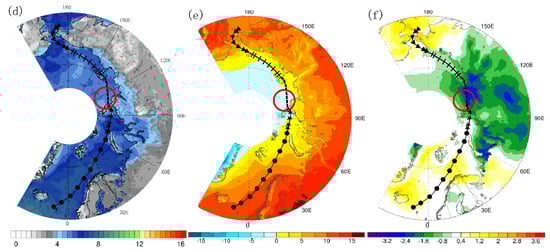
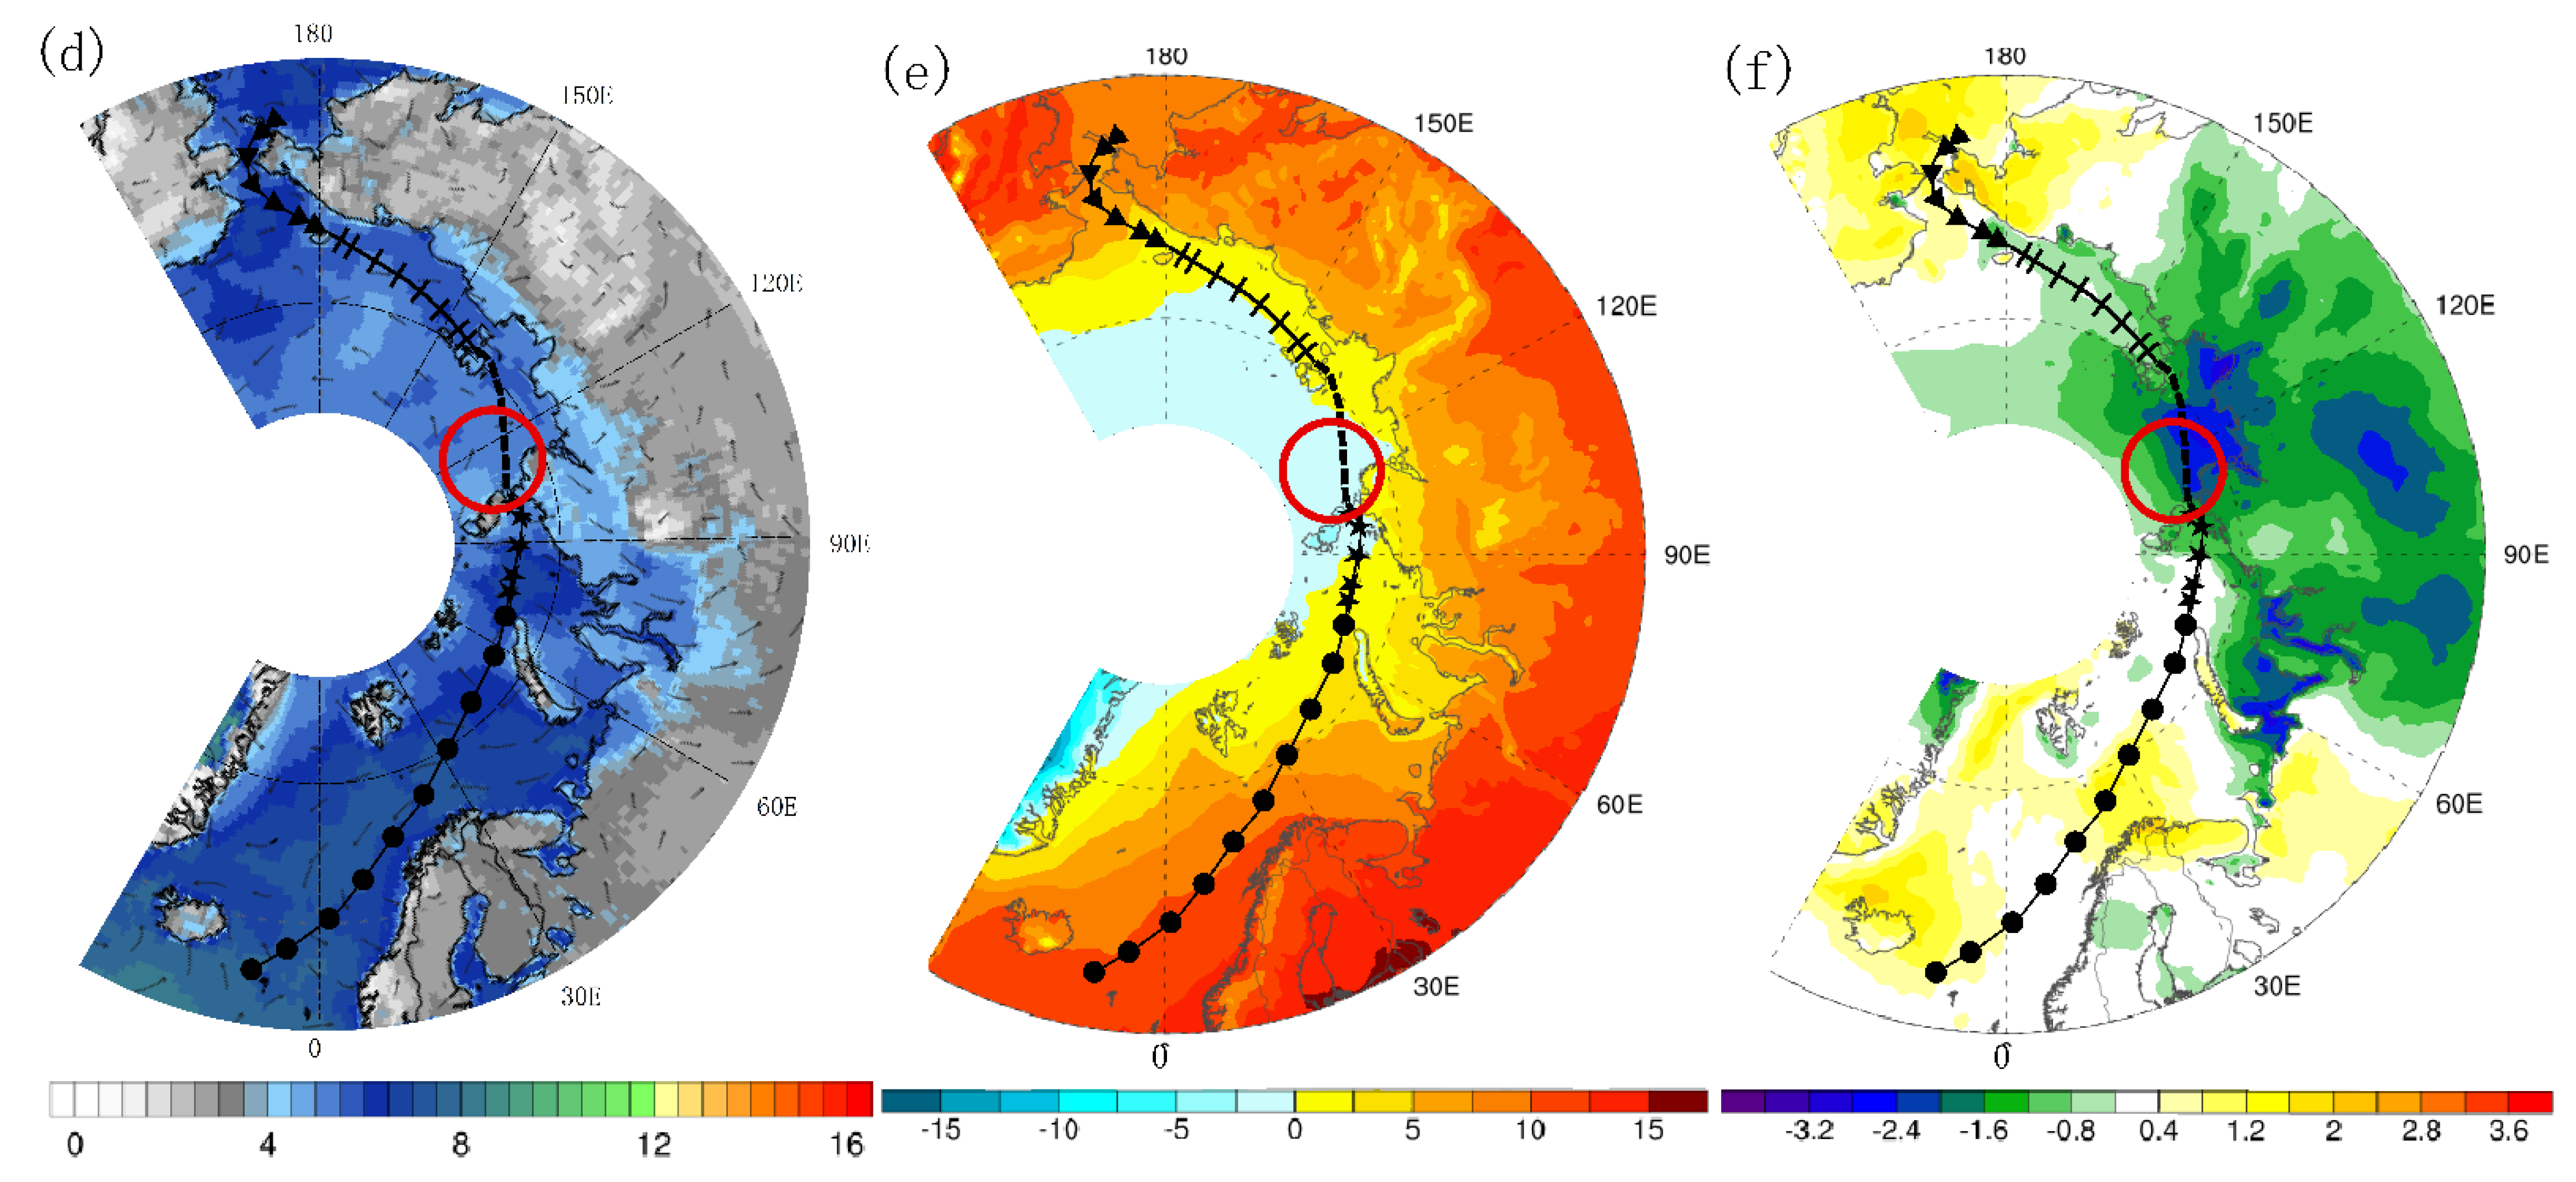
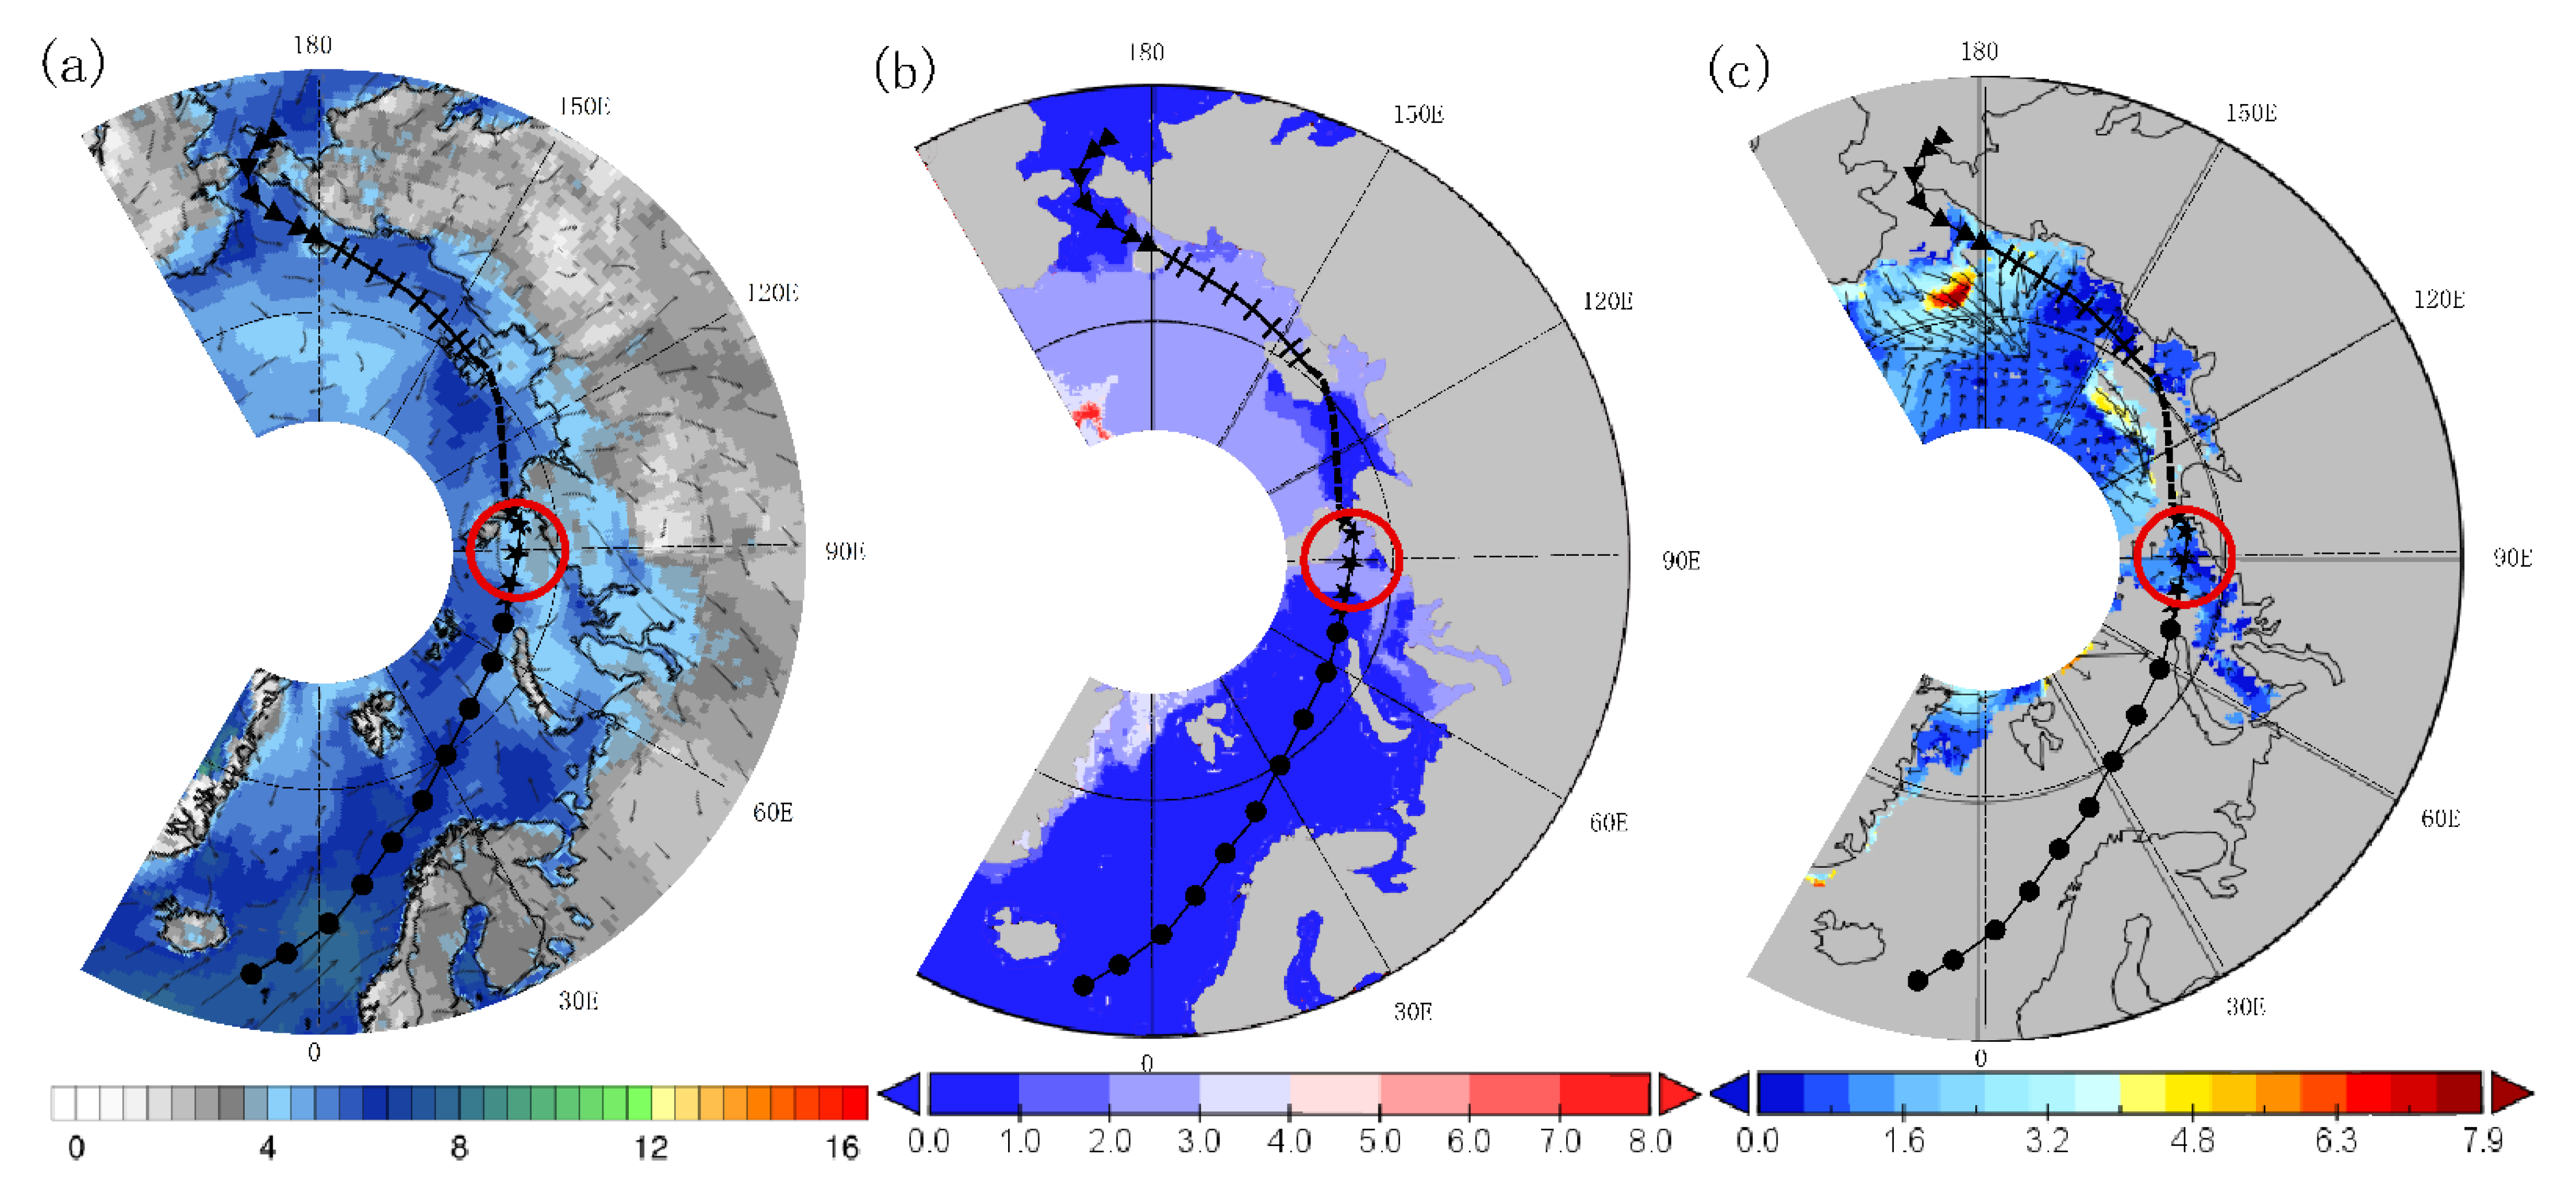
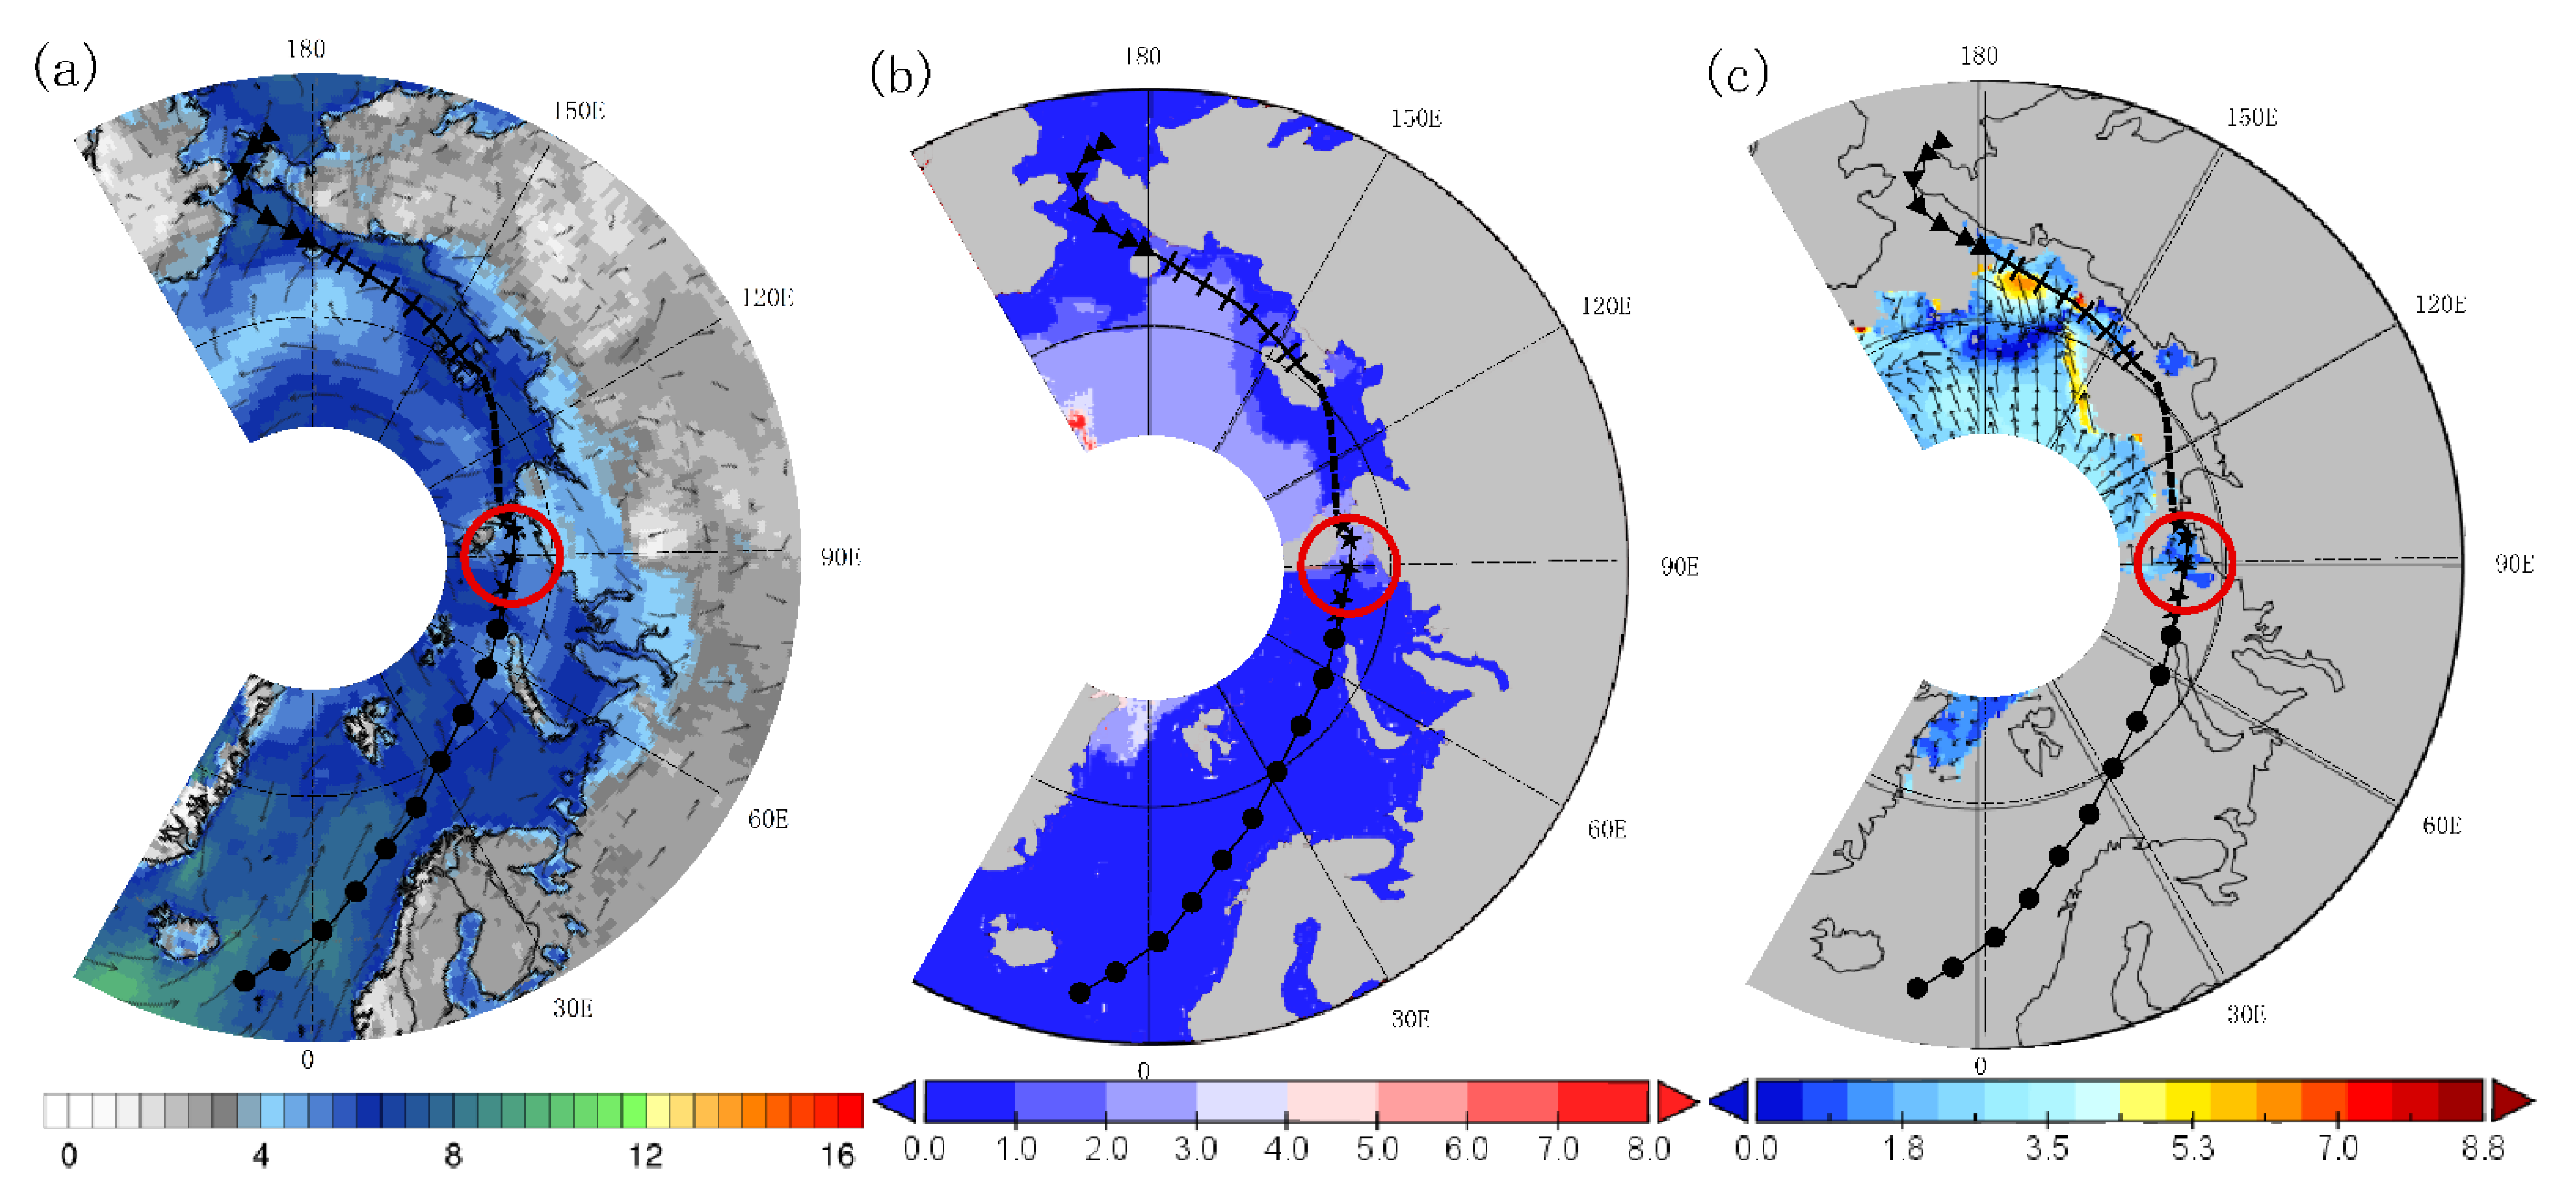
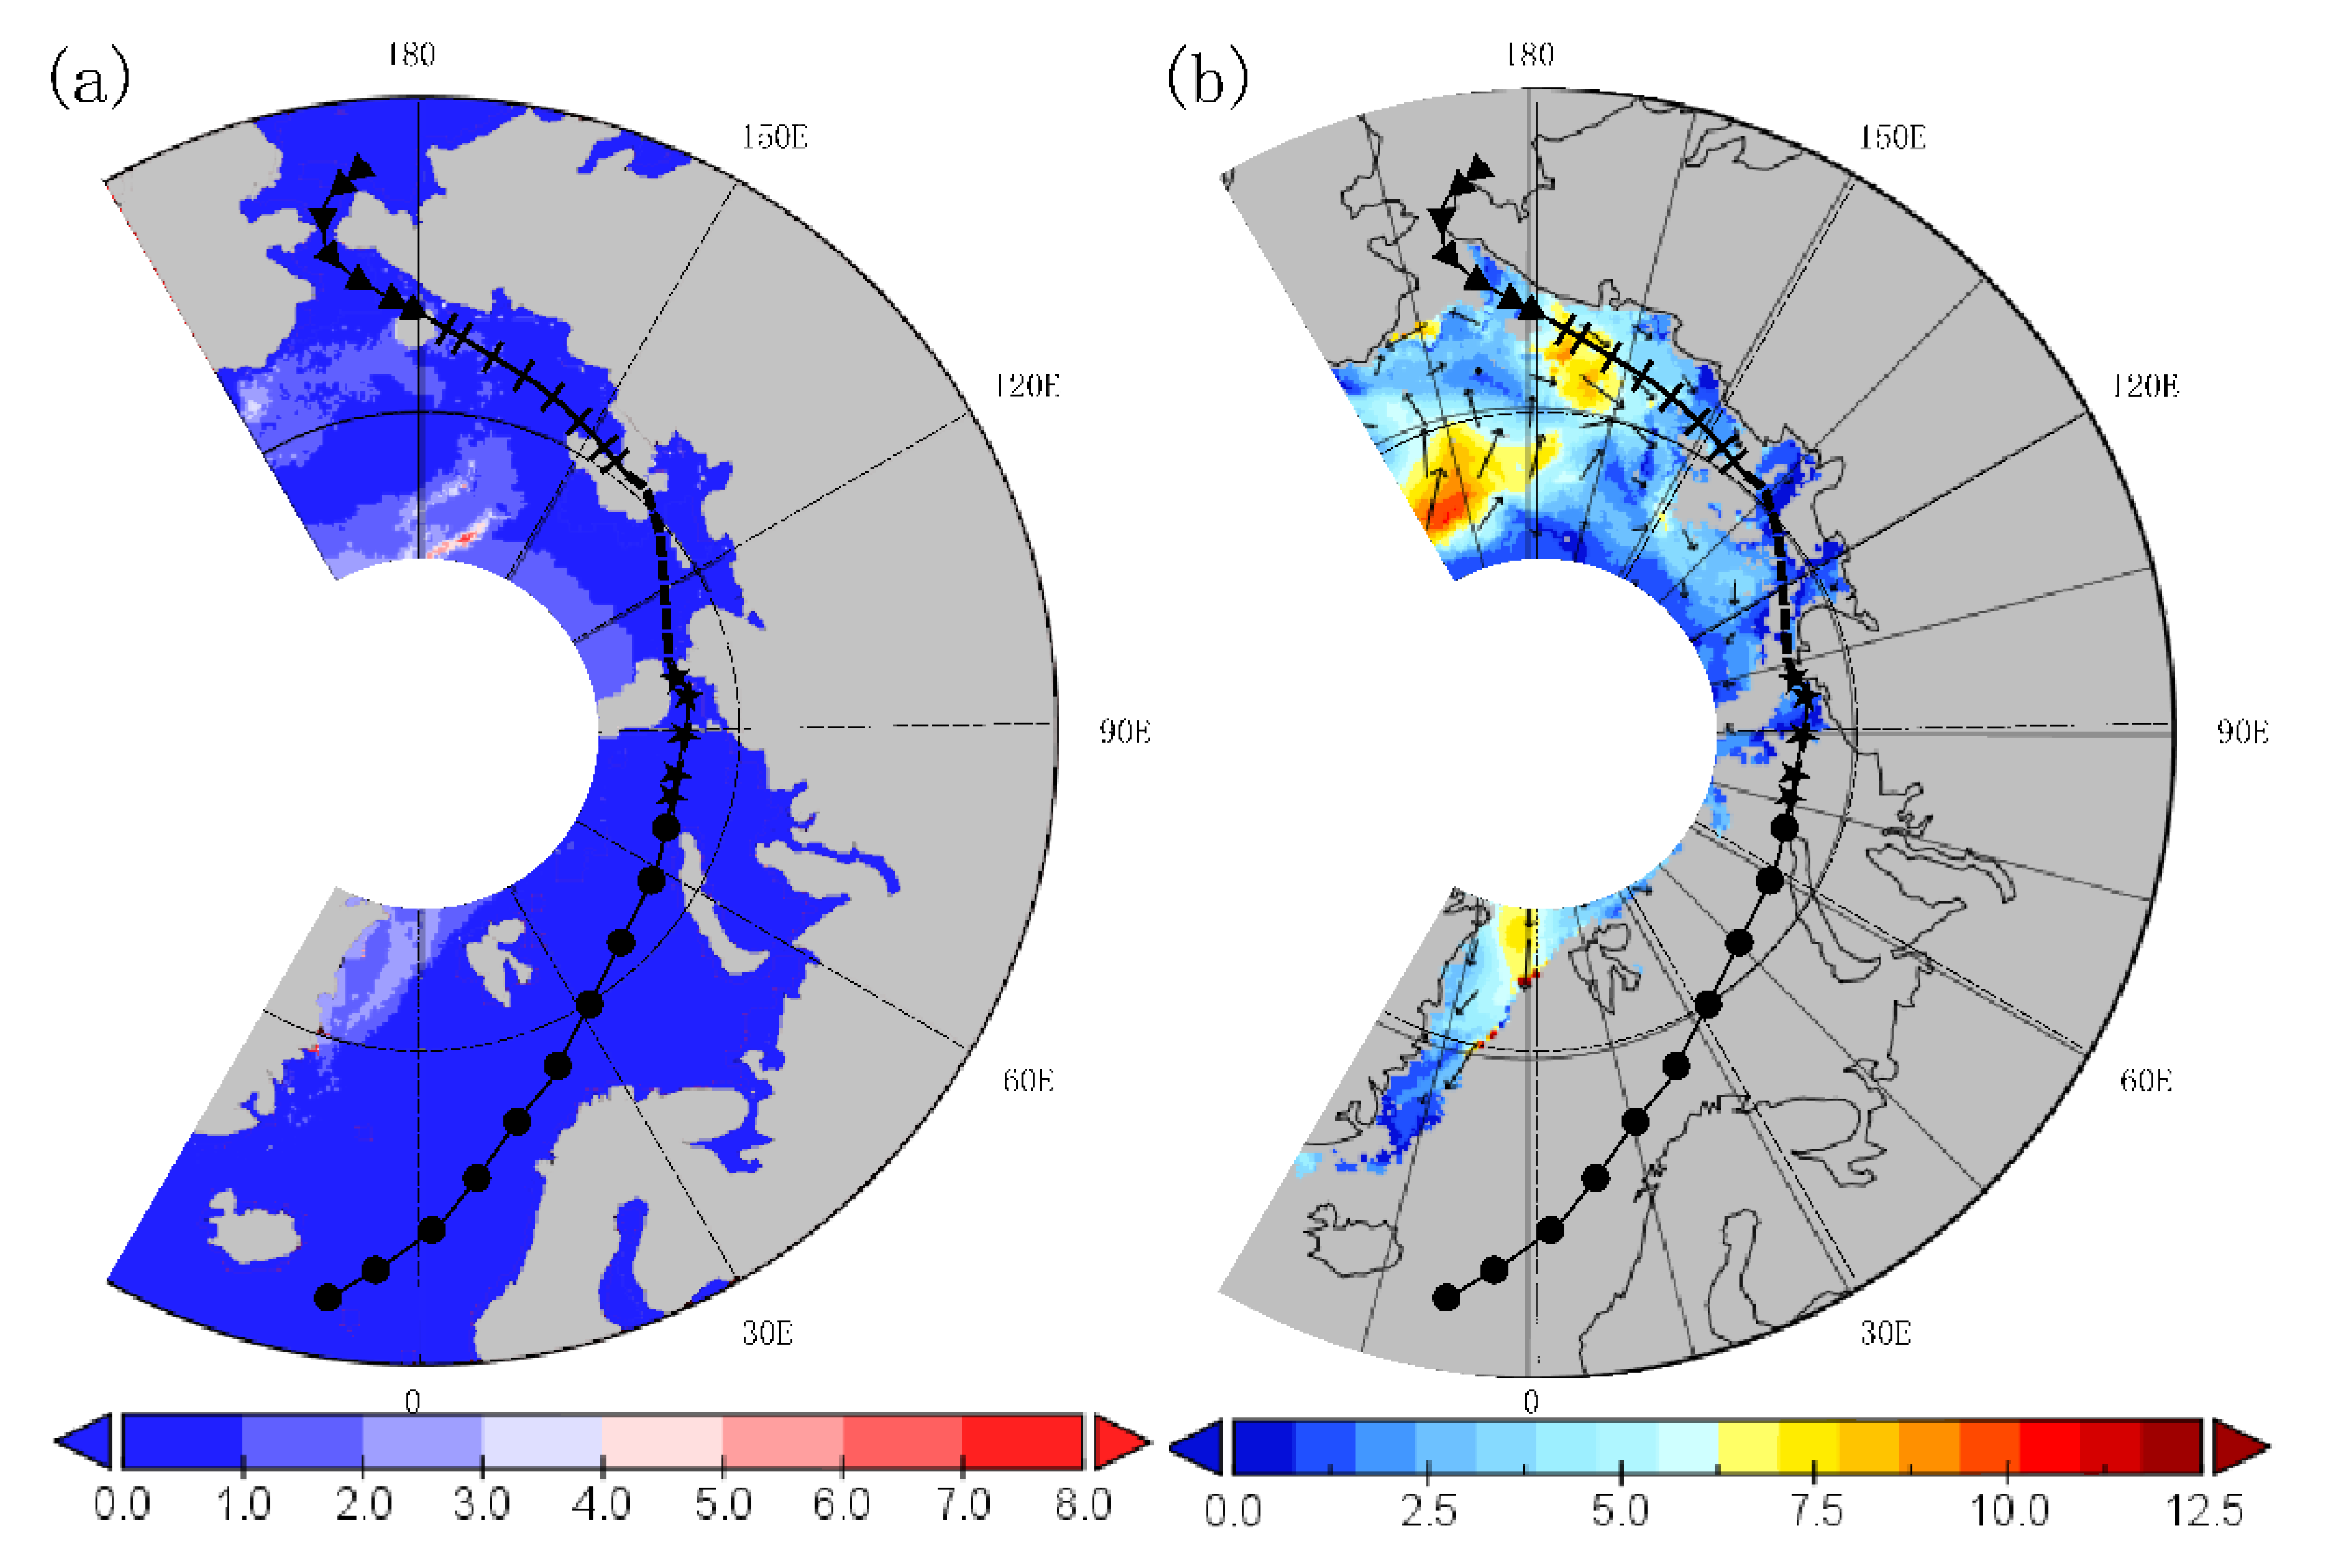
Figure 9.
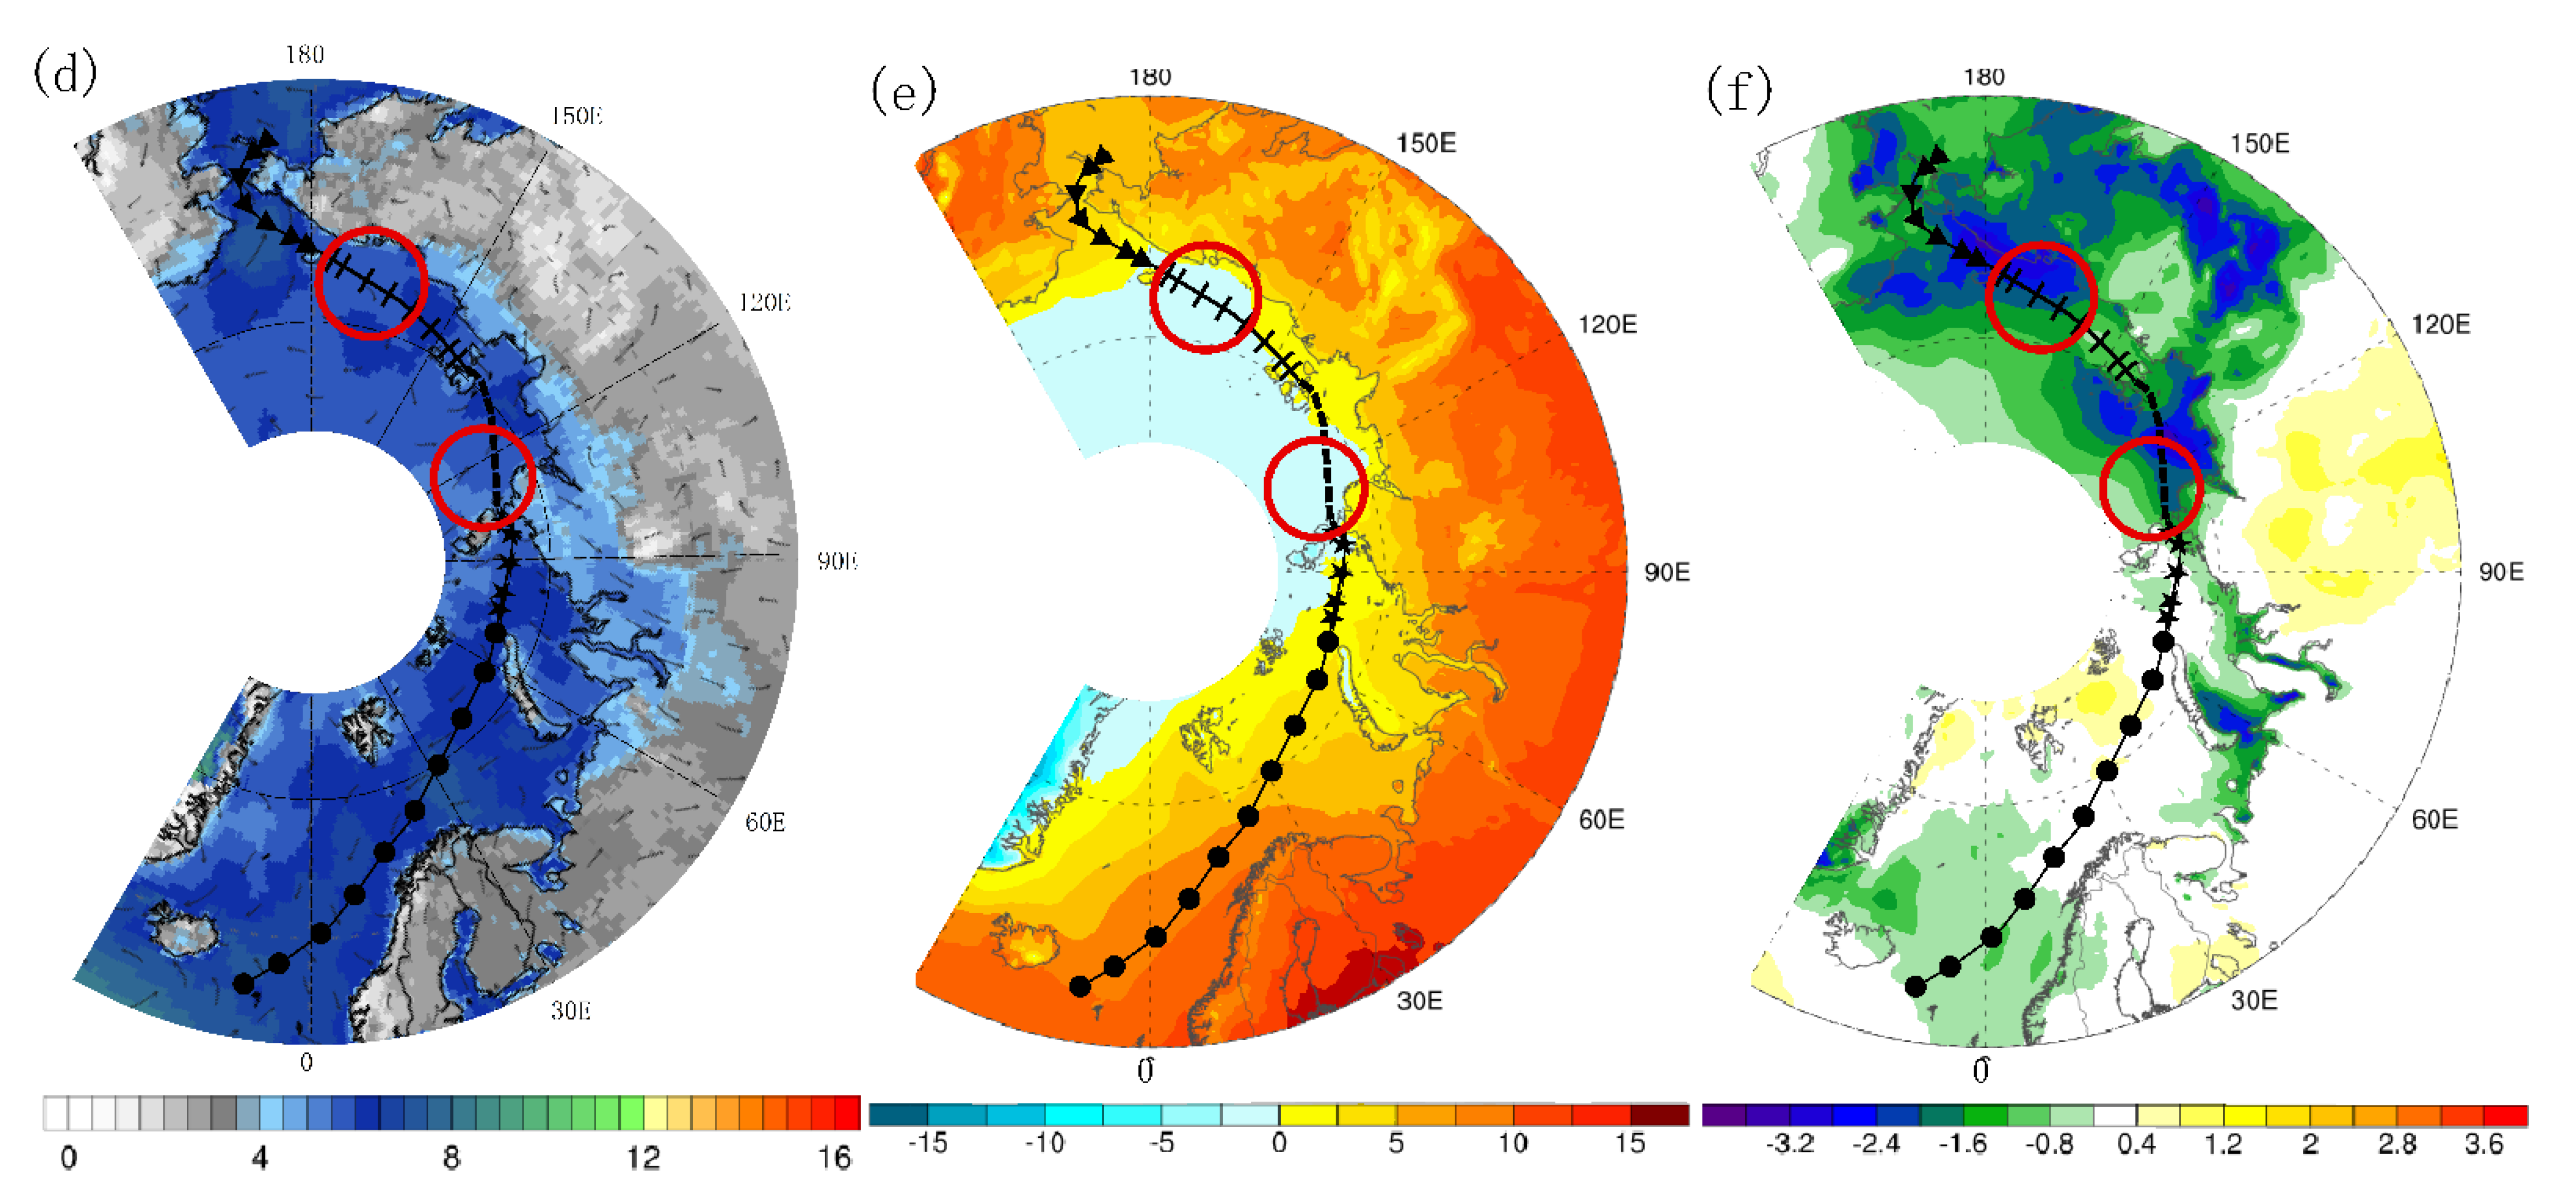
The average wind field (a), average temperature (b) and temperature anomalies (c) of the NEP in the Arctic summer (July–September) in 2003. The average wind field (d), average temperature (e), and temperature anomalies (f) of the NEP in the Arctic summer in 2004.
It can also be seen from Figure 9b,e that the temperature in the East Siberian Sea and the Laptev Sea was basically between 0 °C and 5 °C in the summer of 2003, and there was no abnormal change in the annual average temperature of the two sea areas. The temperature in Kara Sea is between −5 °C and 0 °C in summer, and that in Barents Sea is between 0 °C and 5 °C. The temperature anomaly of the two sea areas is obviously negative. In the summer of 2003, the temperature in the Vilkitsky Strait was relatively low, around −5 °C, which also showed negative anomaly compared with the annual average level, which was not conducive to the ablation of sea ice. In the summer of 2004 (Figure 9c,f), the temperature in the East Siberian Sea, the Laptev Sea and the Vilkitsky Strait was relatively lower than the annual average temperature. The temperature in the East Siberian Sea was about 0 °C, while the temperature in the Laptev Sea was relatively low, between −5 and 0 °C, and the temperature in the Vilkitsky Strait was between −5 and 0 °C. The temperature in the Kara Sea had not changed significantly, ranging from 0 °C to 5 °C, while the temperature in the Barents Sea was abnormally higher than the annual average ranging from 5 °C to 10 °C.
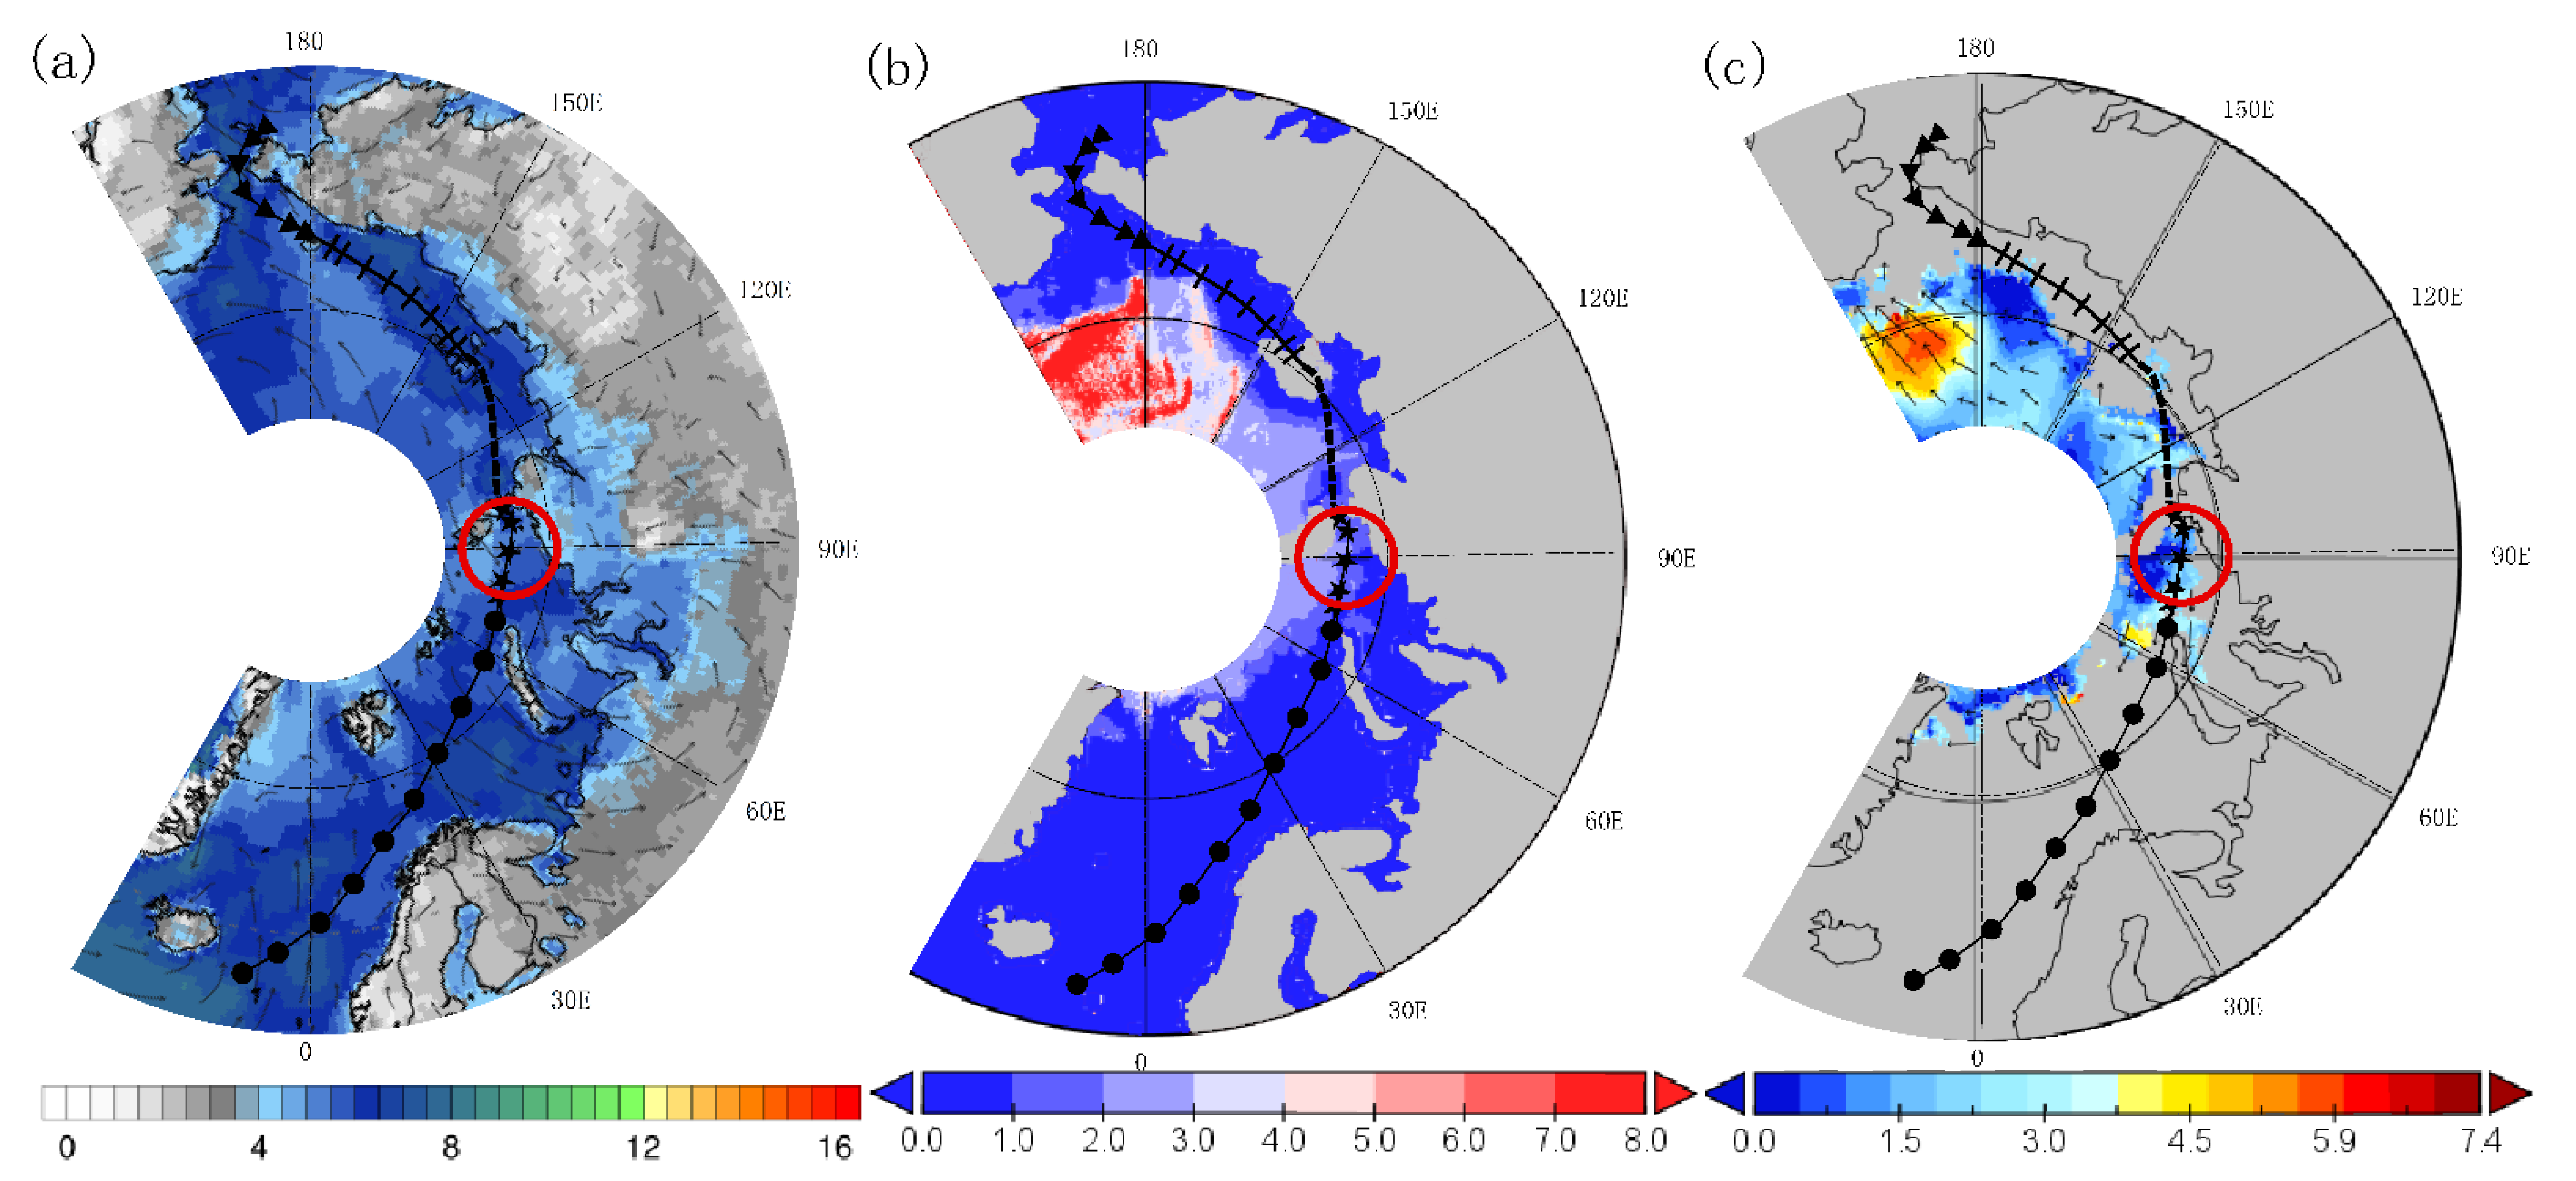
It can be seen from Figure 10a,b that a large area of 2 to 3 years of ice was both distributed in the western part of the Vilkitsky Strait in the summer of 2003 and the eastern part of the Vilkitsky Strait in 2004. Although there was still more two-year ice in the central part of the East Siberian Sea, the area of two-year ice decreased compared with 2000 and 2001. The Bering Strait, the Laptev Sea and the Barents Sea were all dominated by one-year ice. Due to the low-pressure center of the Arctic in 2003, sea ice was advected by the prevailing northwesterly winds from the Arctic Ocean into the northeastern Kara Sea, accumulating to the west of Vilkitsky Strait and thereby blocking the NEP there (Figure 10c). Similarly, due to the influence of wind, the sea ice of the Arctic Ocean moved and accumulated to the east of the Severnaya Zemlya in 2004, resulting in a higher sea ice concentration there and affecting the opening of the NEP, resulting in a higher sea ice concentration in the eastern part of the Vilkitsky Strait, and affected the opening of the NEP (Figure 10d).
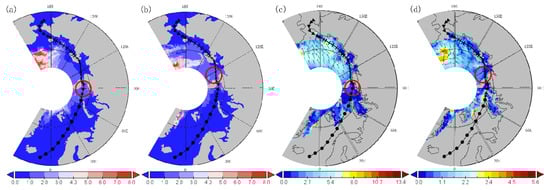
Figure 10.
The distribution map of sea ice age in the NEP in the Arctic summer in 2003 (a) and 2004 (b), and the map of sea ice movement in the NEP in the Arctic summer in 2003 (c) and 2004 (d).
4.3. Short Navigation Years
4.3.1. 2002
The navigation period of the NEP of the Arctic was relatively short in 2002, only 33 days. The main reason is that the navigation ended earlier that year, which ended in mid-September. The decisive area affecting the navigation was the western part of the Vilkitsky Strait. From Figure 11, Figure 12 and Figure 13, it can be seen that the northwest wind prevailed in the Vilkitsky Strait from July to September 2002, the sea ice age in the western part of the Vilkitsky Strait was basically 4 years in July, and mainly 2–4 years in August to September. The ice was firm and hard to melt in summer. In September 2002, the sea ice in the western part of the Vilkitsky Strait moved eastward from the Arctic Ocean into the northeastern part of the Kara Sea (Figure 13c), blocking the western entrance of the Vilkitsky Strait.
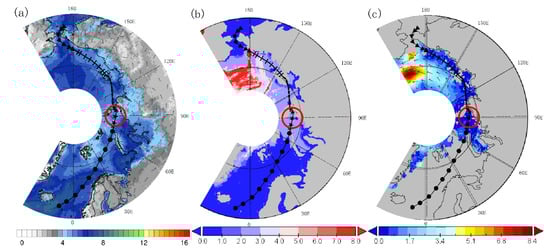
Figure 11.
The average wind field (a), sea ice age (b) and sea ice movement (c) of the NEP in the Arctic in July 2002.
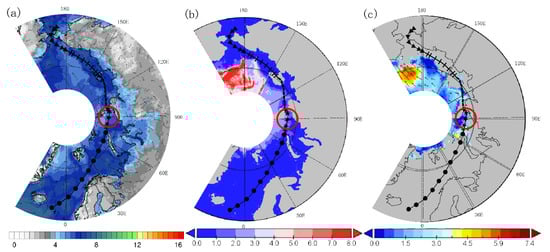
Figure 12.
The average wind field (a), sea ice age (b) and sea ice movement (c) of the NEP in the Arctic in August 2002.
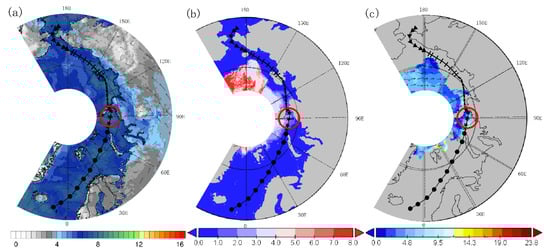
Figure 13.
The average wind field (a), sea ice age (b) and sea ice movement (c) of the NEP in the Arctic in September 2002.
4.3.2. 2007
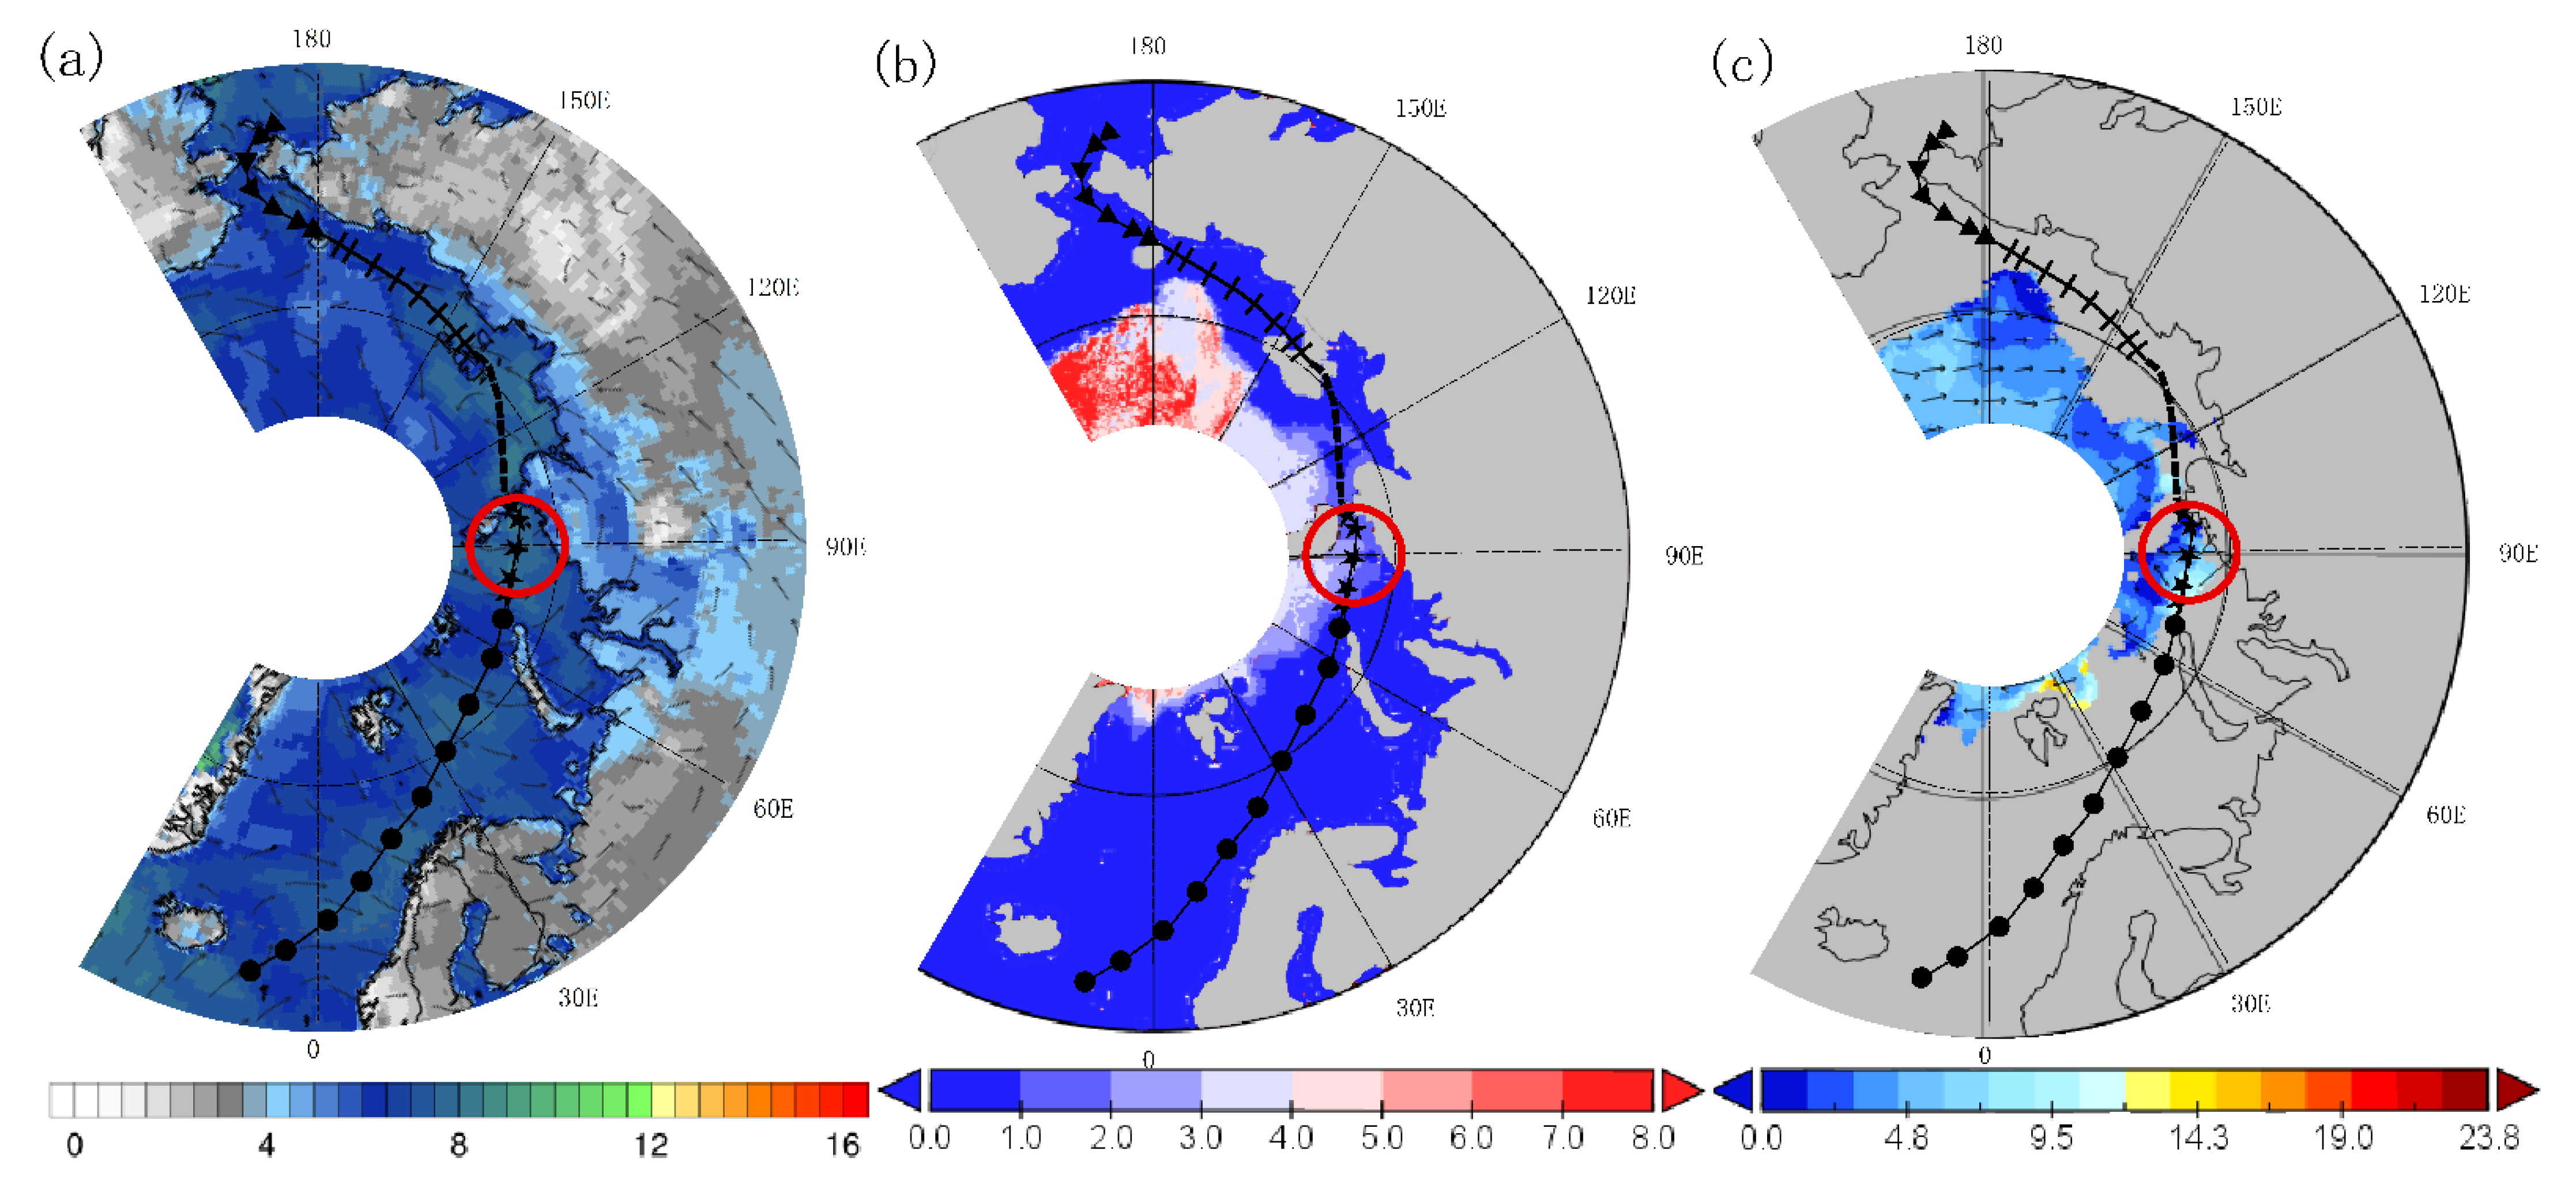
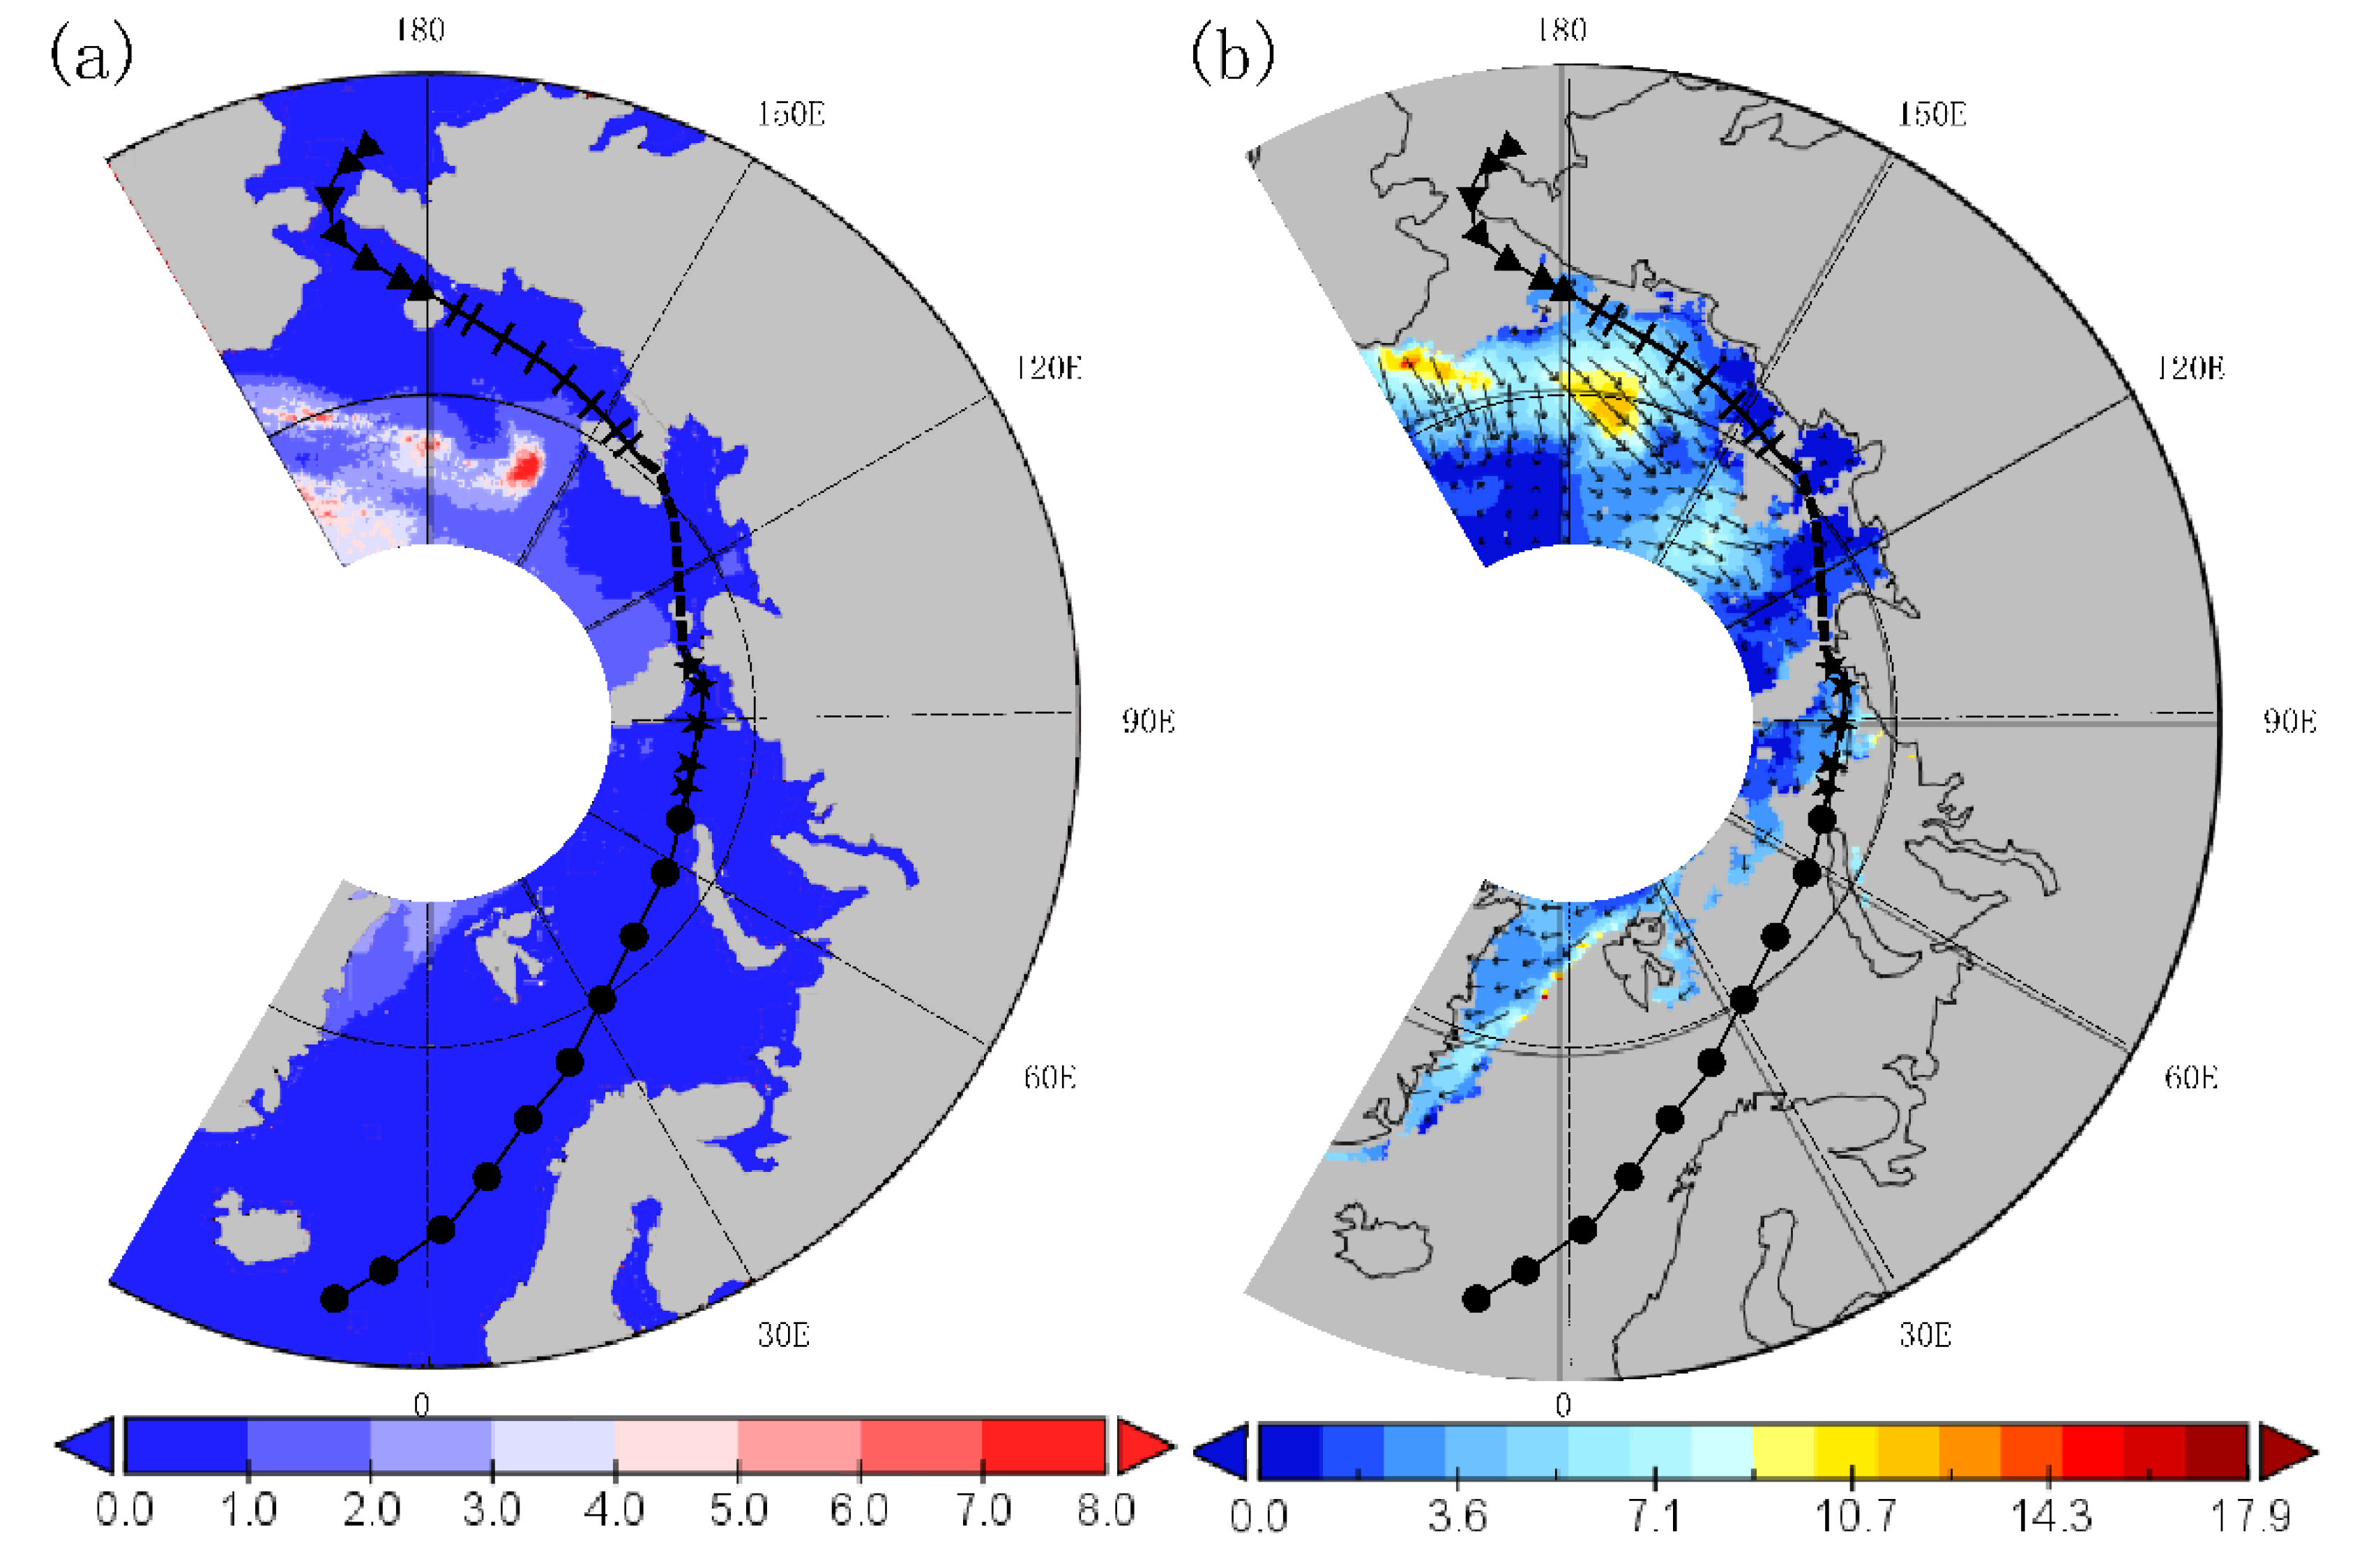
The year 2007 was the second lowest September sea ice area within the satellite observation era. However, the navigation time of the NEP in 2007 was relatively short, only 38 days. The reason was that the NEP was opened in September 2007. As can be seen from Figure 14, Figure 15 and Figure 16, the NEP was continuously affected by northeast winds in July and August 2007. The sea ice moved west/northward under the influence of the wind field. As the sea ice was blocked by the Severnaya Zemlya, it accumulated on its east side, resulting in a high sea ice concentration in this area. According to Figure 14b, Figure 15b and Figure 16b, there was a large area of three-year ice in the west of the Vilkitsky Strait from July to September 2007, which would delay the opening of the NEP. In September, although the NEP was still affected by the northwest wind, the wind decreased. Only the western part of the Vilkitsky Strait had a small amount of sea ice movement in the NEP.

Figure 14.
The average wind field (a), sea ice age (b) and sea ice movement (c) of the NEP in the Arctic in July 2007.
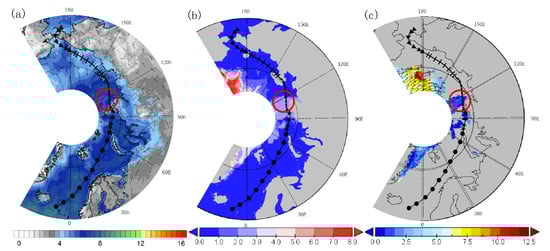
Figure 15.
The average wind field (a), sea ice age (b) and sea ice movement (c) of the NEP in the Arctic in August 2007.
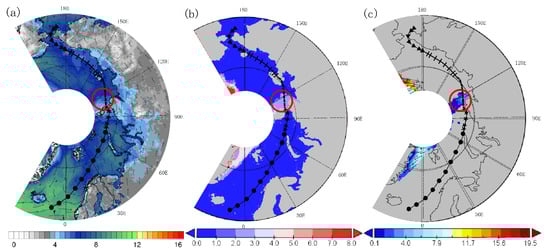
Figure 16.
The average wind field (a), sea ice age (b) and sea ice movement (c) of the NEP in the Arctic in September 2007.
4.3.3. 2013
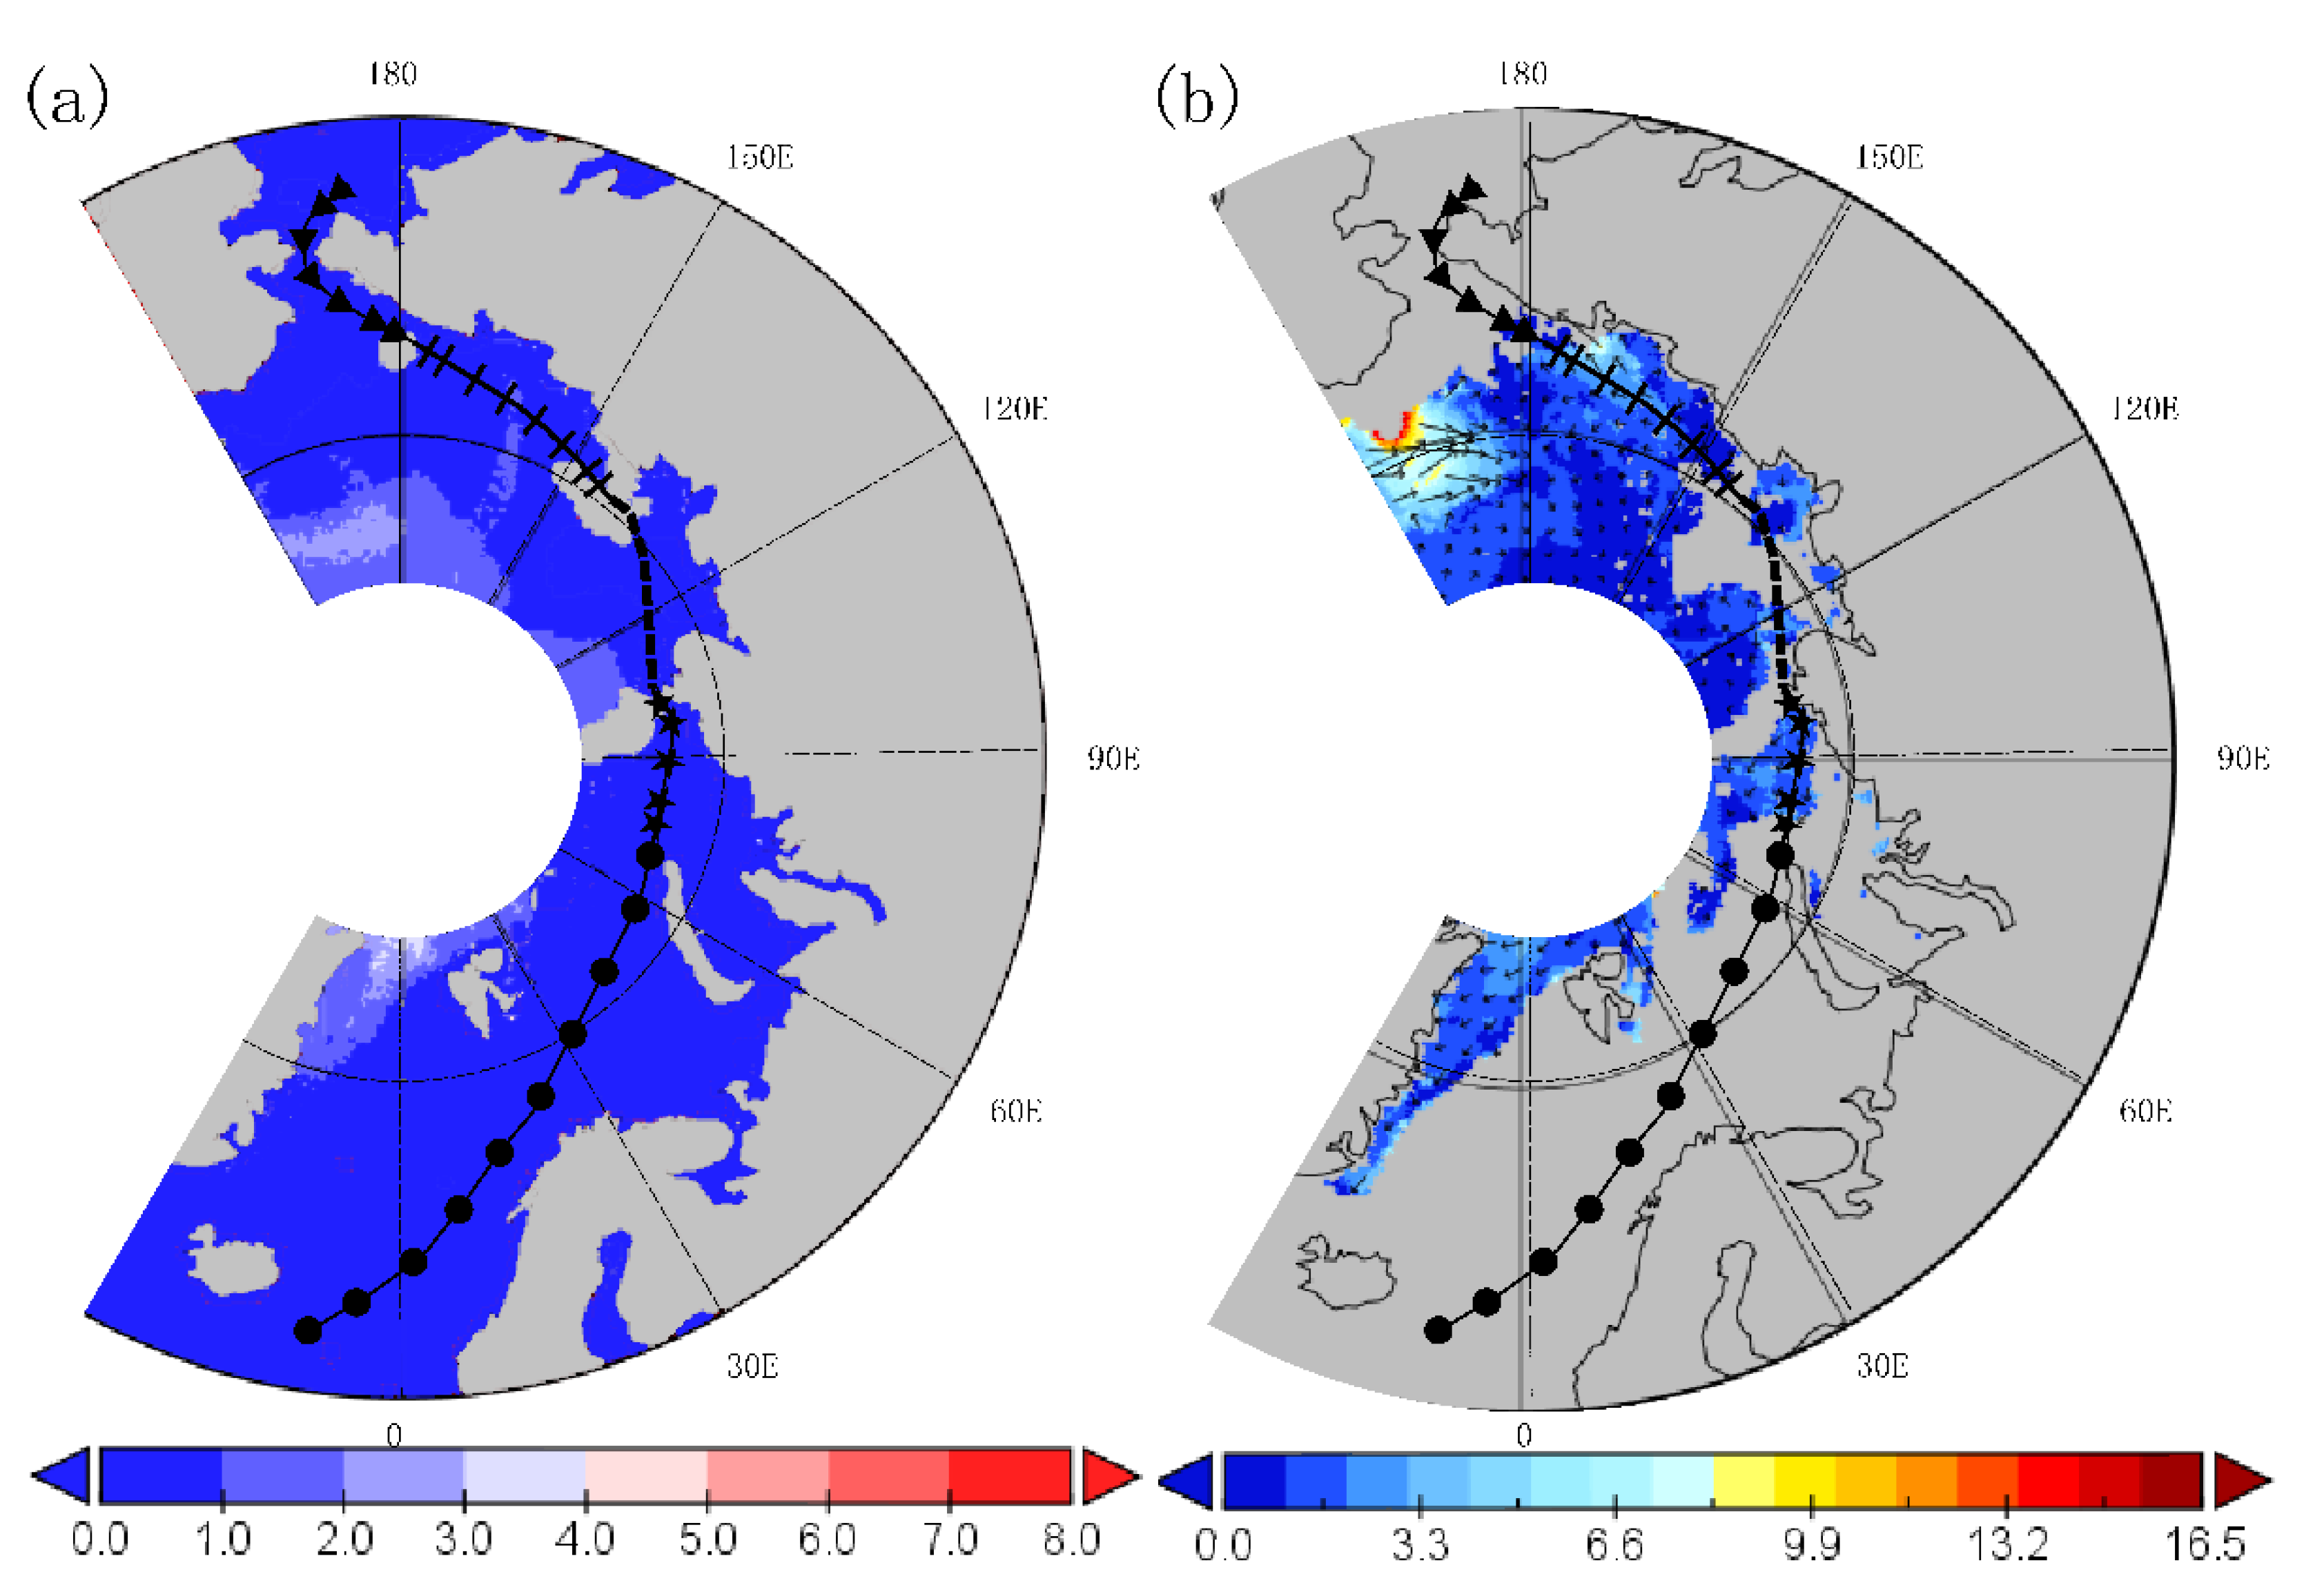
The opening of the NEP in 2013 was relatively late, and it was navigable at the end of August. The key area for navigation was the western part of the Vilkitsky Strait. From Figure 17, Figure 18 and Figure 19, it can be seen that in July and August 2013, the Vilkitsky Strait was affected by a strong westerly wind. Driven by the westerly wind, sea ice moved along the Arctic Ocean to the west of the Severnaya Zemlya, which easily caused the accumulation of sea ice here. In addition, there was a certain amount of three-year ice in the western part of the Vilkitsky Strait in July and August, which would also affect the opening of the NEP. In September, there was little sea ice movement in the Vilkitsky Strait, and the amount of multi-year ice in the Vilkitsky Strait was greatly reduced, which helped the opening of the NEP.

Figure 17.
The average wind field (a), sea ice age (b) and sea ice movement (c) of the NEP in the Arctic in July 2013.
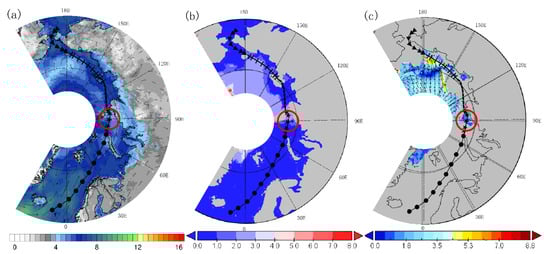
Figure 18.
The average wind field (a), sea ice age (b) and sea ice movement (c) of the NEP in the Arctic in August 2013.

Figure 19.
The average wind field (a), sea ice age (b) and sea ice movement (c) of the NEP in the Arctic in September 2013.
4.4. Long Navigation Years
4.4.1. 2012
The area covered by sea ice in 2012 was 45% less than the average over the past 30 years [31]. The minimum extent of Arctic sea ice in 2012 was 3.41 million km2, and the NEP was open to navigation for 82 days during the year, which is the third longest time since the opening of the NEP in the study of this article.
It can be seen from Figure 20a that, due to the low-pressure system (not shown) across the NEP in the summer of 2012, northerly wind prevailed in the East Siberian Sea and the Kara Sea, while the southwest wind prevailed in the Laptev Sea and the Barents Sea. According to Figure 20b,c, compared with the annual average, the temperature in the East Siberian Sea, the Laptev Sea and the Barents Sea was not significantly abnormal. The temperature in the East Siberian Sea and the Laptev Sea in summer was between 0 and 5 °C, and the Barents Sea reached 5–10 °C. The temperature on the east side of the Kara Sea and the Vilkitsky Strait was between 0 and 5 °C, which was abnormally high compared to the multi-year average, promoting the ablation of sea ice in the two sea areas. However, the temperature in the NEP was generally warm and the wind was light in the summer of 2012, and the temperature in the NEP was about 0–5 °C.
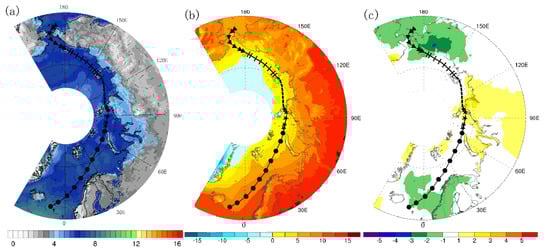
Figure 20.
The average wind field (a), average temperature (b), and temperature anomalies (c) of the NEP in the Arctic summer in 2012.
Figure 21a reveals that compared to 2000, the amount of multi-year ice in the NEP was substantially lower in 2012, and the first-year ice accounted for a larger proportion [32]. In addition, the sea ice in the NEP in summer of 2012 was mostly first-year ice, which usually melts completely earlier than thicker multi-year ice. It can be seen from Figure 21b that in the summer of 2012, the sea ice movement along the NEP was relatively slight, and the accumulation was naturally small, which indirectly promoted the navigation of NEP.

Figure 21.
The sea ice age (a) and sea ice movement (b) of the NEP in the Arctic summer in 2012.
4.4.2. 2015
The opening time of the NEP in 2015 was 86 days, the second longest time since the opening of the NEP from 2000 to 2019.
As shown in Figure 22a, since the Arctic had only one high-pressure center (not shown) in Greenland in 2015, the East Siberian Sea, the Kara Sea and the Barents Sea were prevailing northeasterly winds, while the Laptev Sea was completely easterly winds. According to Figure 22b,c, the temperature of the NEP in 2015 was basically between 0 and 5 °C. Compared with the multi-year average, the temperature in the East Siberian Sea and the Kara Sea was abnormally higher by about 1.2 °C, while the temperature in the Novosibirskiye Islands was about 0.8 °C lower, and the temperature in the other sea areas had little change.
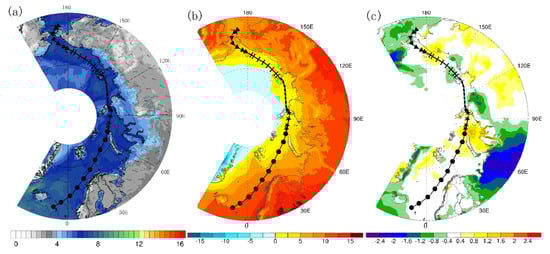
Figure 22.
The average wind field (a), average temperature (b) and temperature anomalies (c) of the NEP in the Arctic summer in 2015.
It can be seen from Figure 23a that the sea ice distributed in the NEP was mostly one-year ice in summer of 2015. Although sea ice movement had occurred along the NEP, it can be seen from Figure 23b that the sea ice movement had a relatively small effect, in particular, in the two key areas of the NEP—the central part of the East Siberian Sea and the Vilkitsky Strait—where sea ice movement was very small, and the possibility of sea ice accumulation was also low.
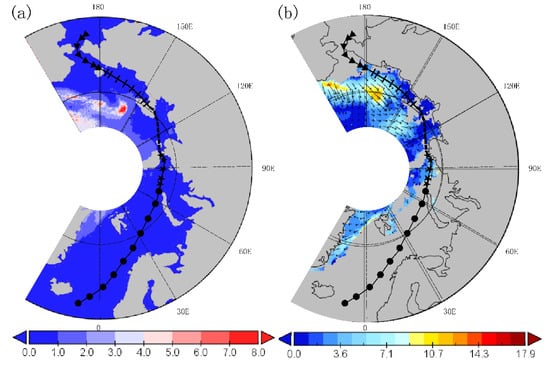
Figure 23.
The sea ice age (a) and sea ice movement (b) of the NEP in the Arctic summer in 2015.
4.4.3. 2019
The global ocean heat capacity and sea level had reached new highs in 2019, the sea ice area was relatively small, and the opening time of the NEP had reached the longest opening period in history (87 days).
It can be seen from Figure 24a that the northeast wind prevailed in the East Siberian Sea, the Laptev Sea was dominated by the westerly wind, and the Kara Sea and the Barents Sea were dominated by the northwest wind in 2019. Due to the average sea level pressure over the Arctic Ocean was muted-there was no strong center of action (not shown), the wind in the NEP was generally weak in 2019, which had little effect on the accumulation of sea ice. It can be seen from Figure 24b,c that the temperature in the NEP in 2019 was warmer, especially in the Laptev Sea, the Vilkitsky Strait and the Kara Sea, which were abnormally 2 °C higher than the annual average. Among them, the temperature in the East Siberian Sea was between 0–5 °C, the temperature in the Laptev Sea was even up to 5 °C, and the temperature in the Vilkitsky Strait, the Kara Sea and the Barents Sea was also between 0 and 5 °C, which played a role in improving navigation.
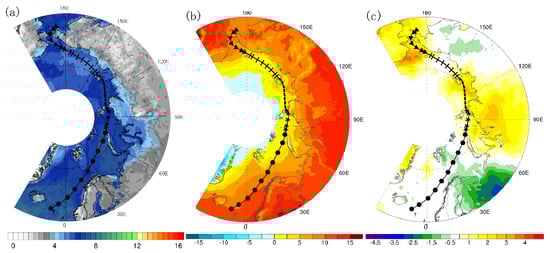
Figure 24.
The average wind field (a), average temperature (b) and temperature anomalies (c) of the NEP in the Arctic summer in 2019.
From the sea ice age map (Figure 25a) and sea ice movement map (Figure 25b) of the NEP in the summer of 2019, it can be seen that the extent of multi-year ice in the Arctic is greatly reduced. The sea ice in the NEP was mostly one-year ice, which is basically seasonal, with thin ice thickness and easy melting in summer. In the summer of 2019, the sea ice movement on the NEP had little effect, which further promoted the opening of the NEP.
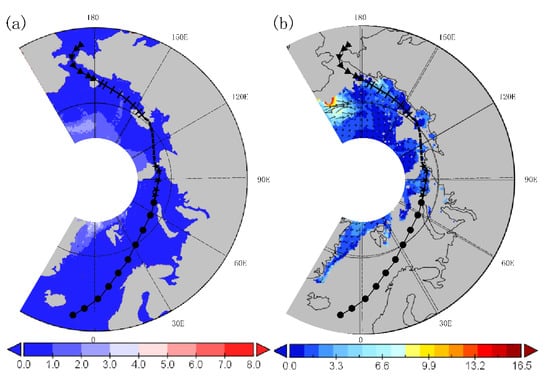
Figure 25.
The sea ice age (a) and sea ice movement (b) of the NEP in the Arctic summer in 2019.
5. Discussion and Conclusions
5.1. Discussion
The sea ice movement of the NEP is due to the action of the wind field, and the wind field is caused by the pressure gradient force. The cloud cover variability can also have an influence on wind, but cloud cover has a greater thermodynamic impact on sea ice. In this article, neither cloud cover nor the effect of cloud cover on sea ice ablation has been considered.
5.2. Conclusions
Sea ice concentration is a crucial factor that affects the variations in sea ice conditions and navigation conditions. We use the Arctic sea ice concentration data from the summer of 2000–2019, sea ice movement and sea age and for years after 2010, as well as thickness and atmospheric information such as near-surface wind vector and near-surface air temperatures, to analyze the sea ice variations and navigation conditions of the NEP and draw the following conclusions:
(1) On the whole, the ice segment in the NEP is from 787 nautical miles to 3410 nautical miles. There are perennial ice-free areas at the beginning and end of the NEP.
(2) The seasonal characteristics of sea ice concentration along the NEP are very obvious. In spring and summer, the sea ice along the NEP gradually melts. At the end of summer, the sea ice concentration on the NEP reaches a minimum, or even 0. The sea ice concentration on the NEP begins to increase in autumn and reaches its maximum in winter. The NEP has the smallest sea ice concentration in September, followed by August and July. In July, the sea ice concentration is high in each year on the NEP, and by August, the sea ice concentration is greatly reduced. In September, the sea ice in the NEP is sparse, and it is basically in the open sea without ice. In September of 2012, 2015 and 2019, the sea ice concentration of the NEP had approached 0, making it very suitable for navigation. However, in September of 2000, 2001, 2003 and 2004, there was still more sea ice near the East Siberian Sea and the Vilkitsky Strait, and the risk of navigation was high. In October, the sea ice concentration along the NEP began to increase. The opening time of the NEP varies from late July to early September, and the end time of navigation is concentrated in mid-to-late October. The most suitable month for navigation is September. Except for the years when navigation is not available, the navigable duration in summer is basically maintained at more than 30 days, and the navigation duration in the past ten years has reached 60 days.
(3) During 2000–2019, the sea ice concentration of the NEP was relatively high in 2000, 2001, 2003 and 2004, and the NEP was not navigable. The sea ice concentration in 2012, 2015 and 2019 was relatively low and the navigation time was longer than 80 days. The opening time of the NEP in 2002, 2007 and 2013 was shorter and did not exceed 38 days. The choke points for navigation of the NEP were the central part of the East Siberian Sea (1574 nautical miles) and the Vilkitsky Strait (2623–2886 nautical miles), where the ice situation is complex and the sea ice concentration is relatively high. Moreover, the influence of the Vilkitsky Strait on the NEP is greater than that of the central part of the East Siberian Sea.
(4) The main reason for the high sea ice concentration in the central part of East Siberian Sea (2000 and 2001) is that the area is the only area distributed with multi-year ice in the NEP in spring and summer, and the wind here is small in summer and the sea ice is not easy to move. Besides this, the temperature at the place is abnormally low in the summer of these two years, which is not conducive to the ablation of sea ice, leading to the high sea ice concentration in this area.
(5) The main reason for the high sea ice concentration in the Vilkitsky Strait (2000, 2001, 2003, 2004 and 2002, 2007 and 2013) is the wind field and sea ice movement. Here, sea ice is prone to movement under the strong wind in summer. In the Vilkitsky Strait region, this is the persistence of sea ice drift directions favoring blocking either the western or the eastern entries. In addition, there is multi-year ice near the Vilkitsky Strait, which also blocks navigation.
(6) The sea ice concentration was low in 2012, 2015 and 2019, and the navigation time of the NEP was long. In these three years, the temperature of the NEP was relatively high. The average temperature in summer was between 0–5 °C. The wind was light, which would not promote the movement and accumulation of sea ice, nor cause the choke point of the NEP to be blocked. In addition, the NEP in the summer of these three years was dominated by one-year ice, which was easy to melt in summer, greatly extending the navigation period.
Author Contributions
Conceptualization, M.J. and G.L.; Data curation, Y.H.; Investigation, G.L.; Methodology, G.L.; Supervision, T.L.; Validation, Y.H. and Y.L.; Writing—original draft preparation, G.L.; Writing—review and editing, M.J. All authors have read and agreed to the published version of the manuscript.
Funding
This research was funded by the National Natural Science Foundation of China (grant number 41471330); the Special Study on the Third Land Survey in Shandong Province (I) (grant number Y220004202000004_001); the National Science Fund subsidized project (grant number 41976184); and the Major scientific and technological innovation projects in Shandong Province (grant number 2019JZZY020103). The APC was funded by the National Natural Science Foundation of China (grant number 41471330).
Institutional Review Board Statement
Not applicable.
Informed Consent Statement
Not applicable.
Data Availability Statement
The sea ice concentration data is from the SSM/I-SSMIS data provided by the National Snow and Ice Data Center (NSIDC): https://nsidc.org/data/nsidc-0051; accessed on 25 November 2020. The wind field maps were acquired by the University of Maine’s reanalysis plotter: https://climatereanalyzer.org/reanalysis/monthly_maps/; accessed on 25 November 2020. The temperature maps and the temperature anomaly maps were obtained from Earth System Research Laboratory: https://psl.noaa.gov/repository/model/compare; accessed on 25 November 2020. The sea ice age data came from NSIDC: https://nsidc.org/data/NSIDC-0611/versions/4; accessed on 25 November 2020. The sea ice motion data came from NSIDC: https://nsidc.org/data/NSIDC-0116/versions/4; accessed on 25 November 2020.
Conflicts of Interest
The authors declare no conflict of interest.
References
- Serreze, M.C.; Holland, M.M.; Stroeve, J. Perspectives on the Arctic’s Shrinking Sea-Ice Cover. Science 2007, 315, 1533–1536. [Google Scholar] [CrossRef] [Green Version]
- Otsuka, N.; Izumiyama, K.; Furuichi, M. Study on feasibility of the northern sea route from recent voyages. In Proceedings of the International Conference on Port and Ocean Engineering under Arctic Conditions (POAC), Espoo, Finland, 9–13 June 2013. [Google Scholar]
- Comiso, J.C.; Hall, D.K. Climate trends in the Arctic as observed from space. Wiley Interdiscip. Rev. Clim. Chang. 2014, 5, 389–409. [Google Scholar] [CrossRef]
- Stroeve, J.; Holland, M.M.; Meier, W.; Scambos, T.; Serreze, M. Arctic sea ice decline: Faster than forecast. Geophys. Res. Lett. 2007, 34, 09591. [Google Scholar] [CrossRef]
- Rothrock, D.A.; Percival, D.B.; Wensnahan, M. The decline in arctic sea-ice thickness: Separating the spatial, annual, and interannual variability in a quarter century of submarine data. J. Geophys. Res. Space Phys. 2008, 113, 05003. [Google Scholar] [CrossRef]
- Kwok, R.; Untersteiner, N.; Hafemeister, D.; Kammen, D.; Levi, B.G.; Schwartz, P. The Thinning of Arctic Ice. AIP Conf. Proc. 2011, 1401, 220–231. [Google Scholar] [CrossRef]
- Markus, T.; Stroeve, J.C.; Miller, J. Recent changes in Arctic sea ice melt onset, freezeup and melt season length. J. Geophys. Res. Ocean. 2009, 114, C12024. [Google Scholar] [CrossRef]
- Intergovernmental Panel on Climate Change. Landmark United in Science Report Informs Climate Action Summit; IPCC: New York, NY, USA, 2019. [Google Scholar]
- He, S.; Ping, Y.; Zhang, W. The influence of the Arctic routes on China’s trade potential: An empirical study based on the stochastic frontier gravity model. Int. Trade Issues 2013, 8, 3–12. [Google Scholar] [CrossRef]
- Council, A. Arctic Marine Shipping Assessment Report 2009; Protection of the Arctic Marine Environment Working Group: Ottawa, ON, Canada, 2009. [Google Scholar]
- Smith, L.C.; Stephenson, S.R. New Trans-Arctic shipping routes navigable by midcentury. Proc. Natl. Acad. Sci. USA 2013, 110, E1191–E1195. [Google Scholar] [CrossRef] [PubMed] [Green Version]
- Rodrigues, J. The rapid decline of the sea ice in the Russian Arctic. Cold Reg. Sci. Technol. 2008, 54, 124–142. [Google Scholar] [CrossRef]
- Lei, R.; Xie, H.; Wang, J.; Leppäranta, M.; Jónsdóttir, I.; Zhang, Z. Changes in sea ice conditions along the Arctic Northeast Passage from 1979 to 2012. Cold Reg. Sci. Technol. 2015, 119, 132–144. [Google Scholar] [CrossRef]
- Gui, D.; Pang, X.; Lei, R.; Zhao, X.; Wang, J. Changes in sea ice kinematics in the Arctic outflow region and their asso-ciations with Arctic Northeast Passage accessibility. Acta Oceanol. Sin. 2019, 38, 101–110. [Google Scholar] [CrossRef]
- Itkin, P.; Krumpen, T. Winter sea ice export from the Laptev Sea preconditions the local summer sea ice cover and fast ice decay. Cryosphere 2017, 11, 2383–2391. [Google Scholar] [CrossRef] [Green Version]
- Chen, J.; Kang, S.; Chen, C.; You, Q.; Du, W.; Xu, M.; Zhong, X.; Zhang, W.; Chen, J. Changes in sea ice and future accessibility along the Arctic Northeast Passage. Glob. Planet. Chang. 2020, 195, 103319. [Google Scholar] [CrossRef]
- Li, Z.; Ringsberg, J.W.; Rita, F. A voyage planning tool for ships sailing between Europe and Asia via the Arctic. Ships Offshore Struct. 2020, 15, S10–S19. [Google Scholar] [CrossRef] [Green Version]
- Wang, Y.; Liu, K.; Zhang, R.; Qian, L.; Shan, Y. Feasibility of the Northeast Passage: The role of vessel speed, route plan-ning, and icebreaking assistance determined by sea-ice conditions for the container shipping market during 2020–2030. Transp. Res. Part E Logist. Transp. Rev. 2021, 149, 102235. [Google Scholar] [CrossRef]
- Yu, M.; Lu, P.; Li, Z.; Li, Z.; Wang, Q.; Cao, X.; Chen, X. Sea ice conditions and navigability through the Northeast Passage in the past 40 years based on remote-sensing data. Int. J. Digit. Earth 2021, 14, 555–574. [Google Scholar] [CrossRef]
- Ma, L.; An, L.; Zhang, X.; Zheng, Z.; Li, Z.; Chen, G. The Northeast Arctic Route 2006-2015 Navigation Window Dataset. J. Glob. Chang. Data 2019, 3, 244–251, 354–361. [Google Scholar] [CrossRef]
- Li, X.; Ci, T.; Ros, H.; Hui, F.; Cheng, X. Spatial-temporal changes and seaworthiness analysis of sea ice in the Northeast Passage of the Arctic Velikitsky Strait. Polar Res. 2015, 27, 282–288. [Google Scholar] [CrossRef]
- Comiso, J.C.; Parkinson, C.; Gersten, R.; Stock, L. Accelerated decline in the Arctic sea ice cover. Geophys. Res. Lett. 2008, 35, 8–13. [Google Scholar] [CrossRef] [Green Version]
- National Snow and Ice Data Center. NSIDC. Available online: https://nsidc.org/data/nsidc-0051 (accessed on 25 November 2020).
- University of Maine’s Reanalysis Plotter. Available online: https://climatereanalyzer.org/reanalysis/monthly_maps/ (accessed on 25 November 2020).
- Earth System Research Laboratory. ESRL. Available online: https://psl.noaa.gov/repository/model/compare (accessed on 25 November 2020).
- NSIDC. Available online: https://nsidc.org/data/NSIDC-0611/versions/4 (accessed on 25 November 2020).
- NSIDC. Available online: https://nsidc.org/data/NSIDC-0116/versions/4 (accessed on 25 November 2020).
- Shibata, H.; Izumiyama, K.; Tateyama, K.; Enomoto, H.; Takahashi, S. Sea-ice coverage variability on the Northern Sea Routes, 1980–2011. Ann. Glaciol. 2013, 54, 139–148. [Google Scholar] [CrossRef]
- Li, X.; Cheng, X.; Hui, F.; Zhai, M.; Zhang, Y. Analysis of ice conditions in the Northeast Passage of the Arctic in summer 2014. Polar Res. 2016, 28, 87–94. [Google Scholar] [CrossRef]
- International Shipping Network. Available online: http://www.eworldship.com (accessed on 25 November 2020).
- Perovich, D.K.; Grenfell, T.C.; Richter-Menge, J.A.; Light, B.; Tucker, W.B.; Eicken, H. Thin and thinner: Sea ice mass balance measurements during SHEBA. J. Geophys. Res. Space Phys. 2003, 108, 8050. [Google Scholar] [CrossRef]
- Polyakov, I.V.; Walsh, J.E.; Kwok, R. Recent Changes of Arctic Multiyear Sea Ice Coverage and the Likely Causes. Bull. Am. Meteorol. Soc. 2012, 93, 145–151. [Google Scholar] [CrossRef]


Publisher’s Note: MDPI stays neutral with regard to jurisdictional claims in published maps and institutional affiliations. |
© 2021 by the authors. Licensee MDPI, Basel, Switzerland. This article is an open access article distributed under the terms and conditions of the Creative Commons Attribution (CC BY) license (https://creativecommons.org/licenses/by/4.0/).