Abstract
The high-pressure multistage centrifugal pump is the main piece of energy-consuming equipment in the reverse osmosis desalination process, and it consumes about 35% of the entire system’s operating cost. The optimization process of multi-stage pumps undoubtedly requires the performance comparison of multiple schemes in order to verify the effectiveness of the optimized design and the optimization method. Therefore, based on ANSYS Workbench and an improved bat algorithm, an intelligent optimization scheme was designed and carried out on a three-stage reverse osmosis desalination high-pressure pump for efficiency improvement by optimizing the matching relationship between the impeller and the guide vane. An external characteristic test was carried out in an open test rig system in order to verify the numerical model. After modifying the positive guide vane structure, the efficiency was improved for both the rated design and the non-design flow conditions without obvious separation and backflow. With the improved bat algorithm, there was a 3.98% increase in the design point efficiency after the final optimization. Under the design conditions, all of the large vortices disappeared after the optimization. The study provides a reference for the optimization design of the impeller–guide vane matching effect in a multistage pump using an improved bat algorithm.
1. Introduction
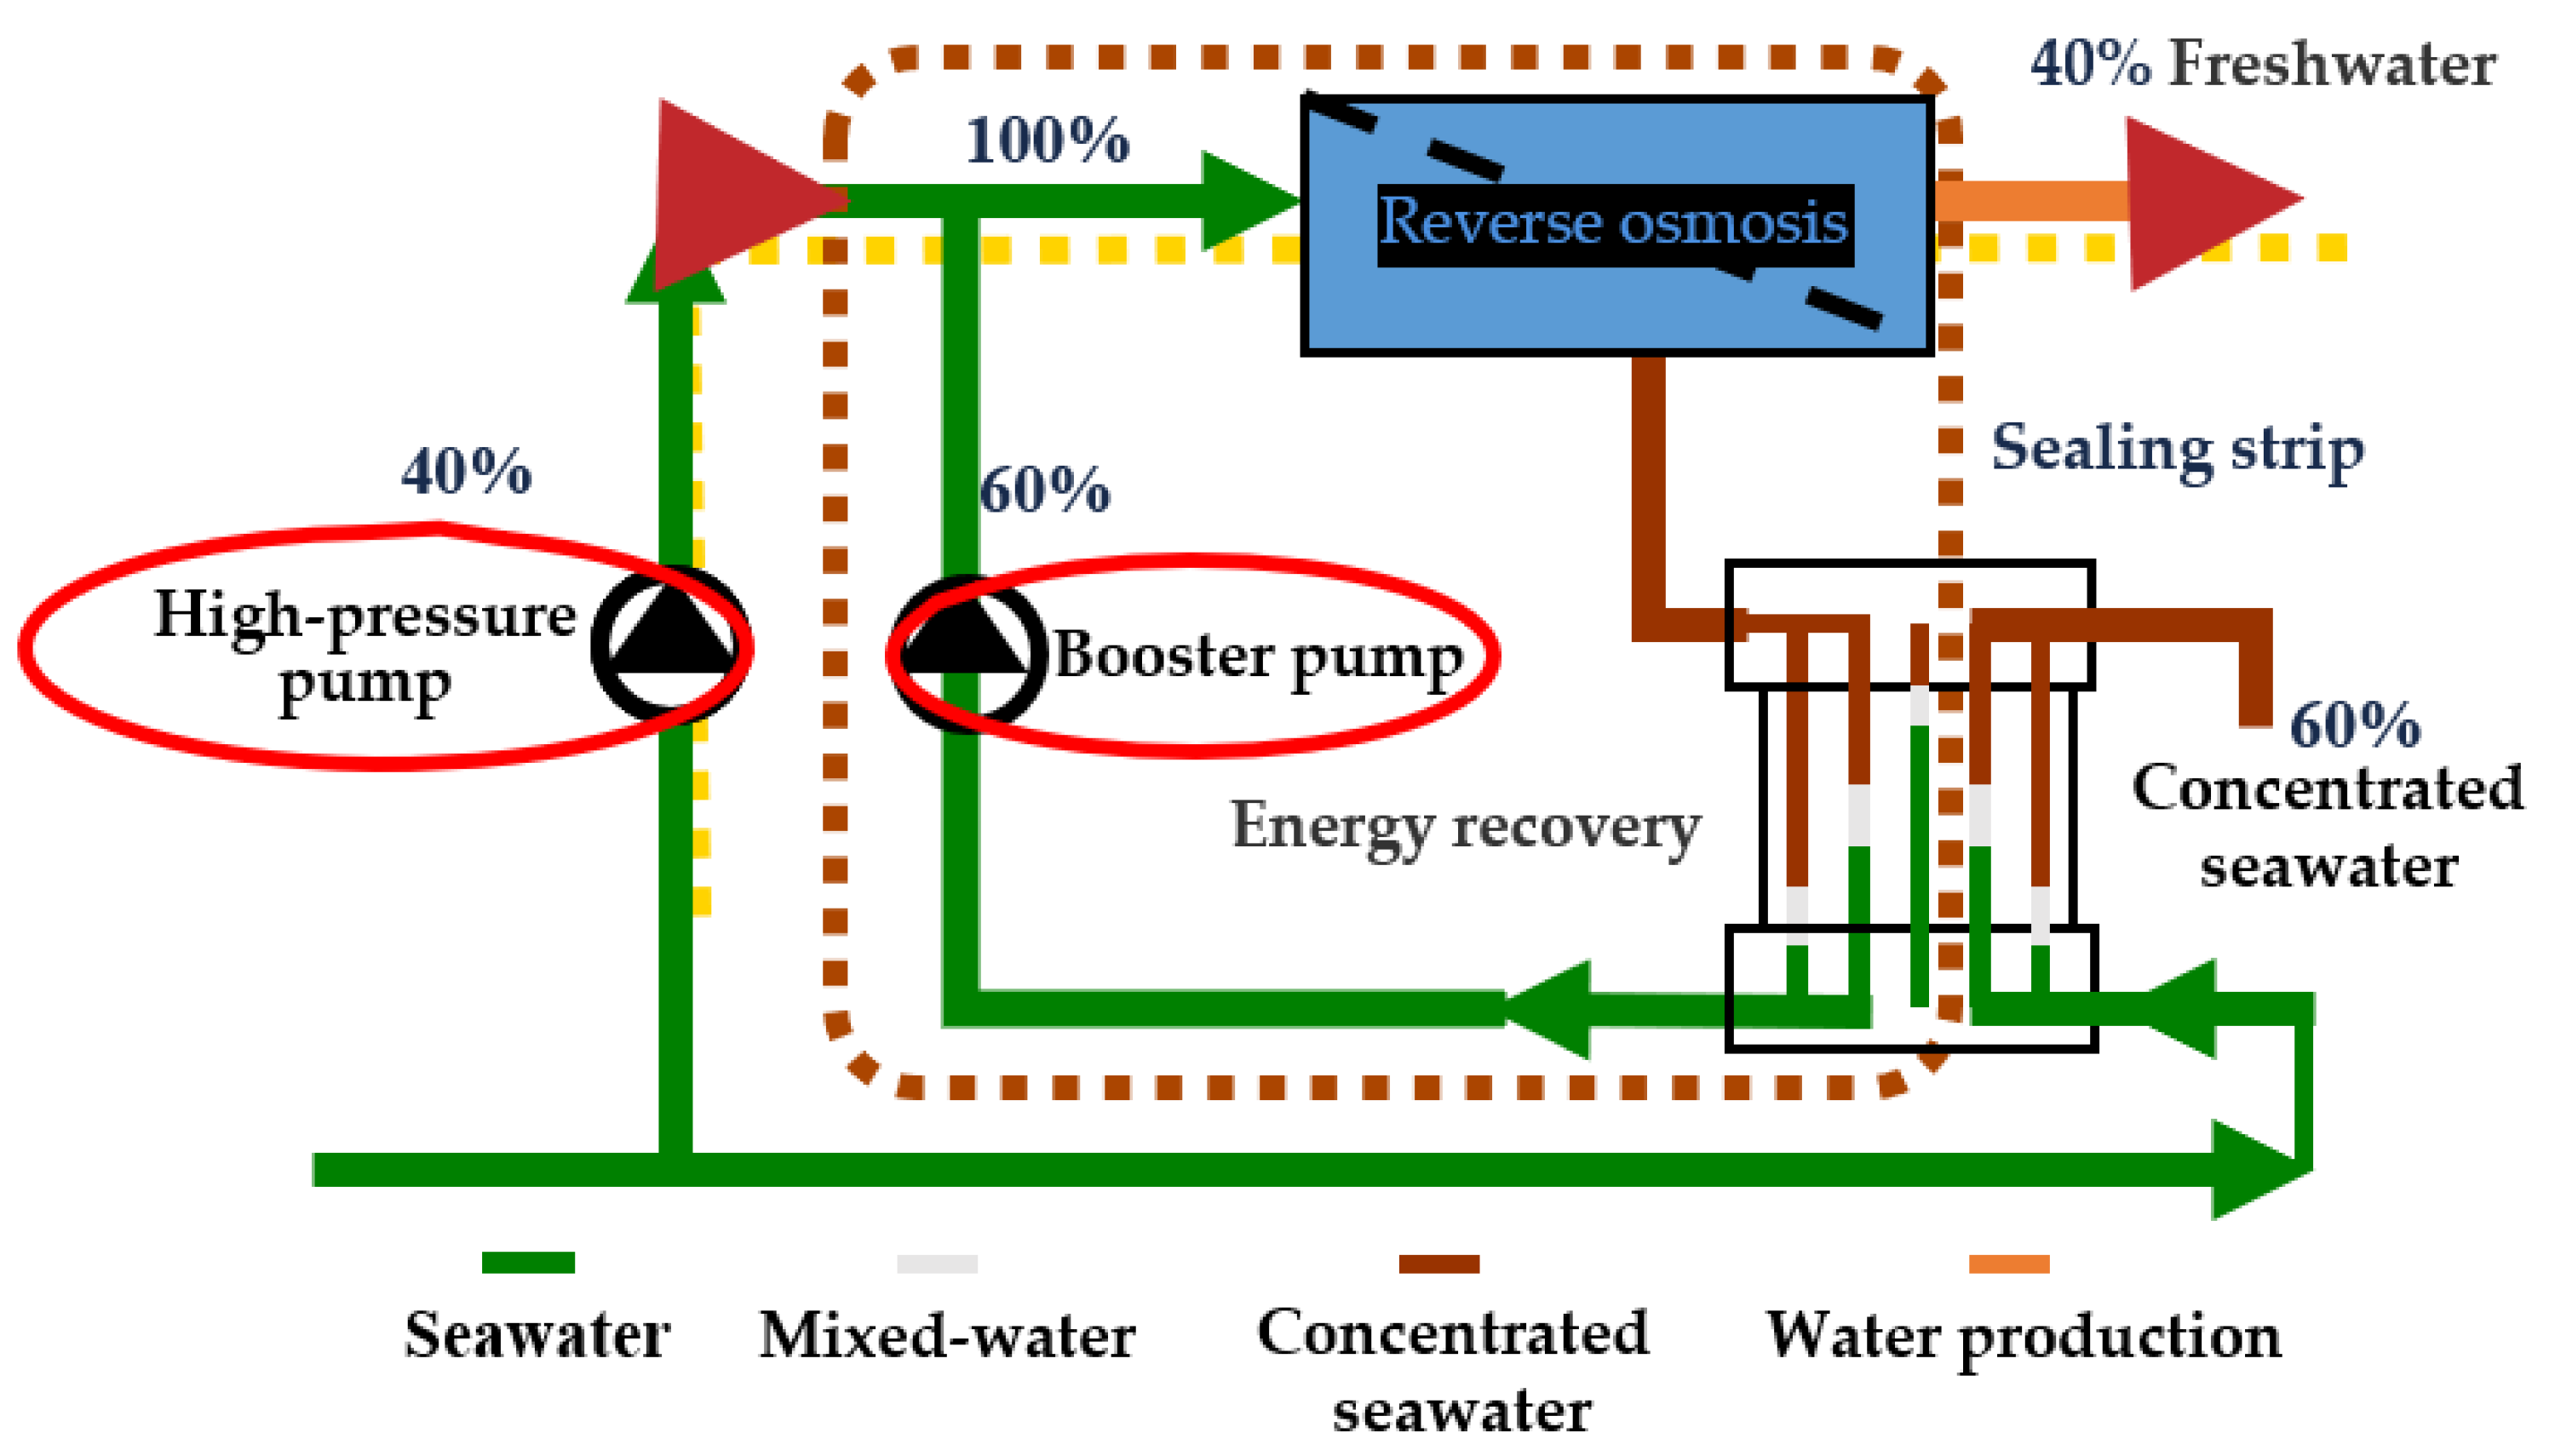
In recent years, the overall scale of seawater desalination projects has grown steadily, particularly for reverse osmosis desalination technology. For this technology, the pressure-driven separation of brine and freshwater is required, and therefore a high-pressure multistage centrifugal pump is an essential piece of equipment for reverse osmosis seawater desalination. The high-pressure pump in Figure 1 is the main energy-consuming piece of equipment, and it consumes about 35% of the entire system’s operating cost [1]. High-pressure pumps operate under varying conditions, with changes in the seawater desalination operating pressures throughout the year. This requires high-pressure pumps to maintain high efficiency within a large flow-rate range. Therefore, the efficiency of high-pressure pumps should be improved and their high-efficiency operating range should be expanded; the optimization of the hydraulic components of centrifugal pumps for performance improvement is rapidly gaining recognition in the renewable energy industry [2].

Figure 1.
Seawater reverse osmosis desalination process.
The theory of pump optimization design has, over the years, evolved into direct and indirect approaches to pump optimization, with each being applied by several researchers [3]. In direct optimization, the numerical simulation is performed directly after changing the design parameters, and the numerical simulation result is the corresponding optimization target value. In this way, the mapping between the design parameters and the optimization target is an accurate functional relationship with only the calculation error [4]. The approximate model method is the main indirect optimization method in pump optimization. Its principle is to transform the relationship between unknown optimization parameters and the optimization goals into explicit mathematical descriptions by establishing the functional relationship between the input parameters and the output response [5,6]. The methods mainly include the response surface model, the kriging model and artificial neural networks, etc. Zhao [7] used the Bezier curve to parameterize the design of a centrifugal pump impeller, and optimized the impeller’s shape based on a back-propagation neural network and an improved genetic algorithm, NSGA-II. Pei [8] carried out the optimization of centrifugal pump hydraulic components based on the orthogonal test method. Practically, single-objective optimization cannot meet the design requirements for multiple objectives. Thus, compared with the theoretical method and the design of experiments method, the surrogate model-based optimization methods are much more accurate and can control more design variables [9,10,11].
The optimization process of multi-stage pumps undoubtedly requires a performance comparison of multiple schemes in order to verify the effectiveness of the optimized design and the optimization method. For the case of multistage centrifugal pumps, several optimization studies geared towards performance improvement have been carried in recent times. The low specific speed, two-stage centrifugal pump has been optimized based on an orthogonal test to improve its efficiency and shaft power [12]. The matching relationship between the guide vane outlet and the impeller inlet of the multi-stage pump was studied. The study selected the relevant geometric parameters of the impeller and the guide vane, combined them into different schemes, and analyzed the selected parameters through performance tests. Kim [13] et al. used experimental design methods and response surface approximation models to optimize the first stage impeller of a two-stage multiphase mixed pump in order to raise the efficiency by 3.5%. Liu [14] et al. assumed that the performance of each stage impeller of the mixed pump is not affected by the positive and negative guide vanes. The orthogonal experiment design method was used to optimize the four parameters of the multistage centrifugal pump impeller, and the influence of the impeller parameters on the efficiency and head was analyzed. Wang [15] conducted an energy loss optimization study on the two-stage model of a five-stage centrifugal pump, considering the influence of the outlet flow of the guide vane on the performance of the secondary impeller. Kawashima [16] et al. studied the effect of two positive guide vane schemes on the performance of multi-stage centrifugal pumps, and pointed out that the good matching characteristics of the positive guide vane and the reverse guide vane are very important to improve the pump performance.
In 2010, a new metaheuristic algorithm known as the bat algorithm (BA) was developed by Xin-She Yang [17], based on the echolocation behavior of bats. This algorithm has good adaptability and robustness, convergence accuracy and accelerated convergence speed, though its implementation is more complex compared to other evolutionary algorithms. This algorithm was further revised to the multi-objective bat algorithm (MOBA) in order to solve multi-objective optimization problems [18]. This was validated against test functions, and the results obtained suggested that the proposed algorithm worked efficiently. The study concluded that the proposed algorithm was superior in comparison with other existing algorithms, including genetic algorithms and particle swarm optimization [19]. Despite the traditional BA having good adaptability and convergence, it has not been applied in pump optimization due to its complexity in implementation.
For this study, a direct optimization approach using an improved bat algorithm was carried out on a high-pressure multistage seawater desalination pump in order to verify the effectiveness of the improved bat algorithm’s direct optimization of the impeller-guide vane for high efficiency. First of all, the guide vane structure was improved in order to obtain a better optimization effect. Subsequently, the improved t-distribution local flying bat algorithm optimization program, based on Ansys Workbench and Matlab, was used to control BladeGen, TurboGrid and CFX to realize the modeling, meshing and numerical calculation. Thereafter, a direct intelligent optimization was executed using an improved bat algorithm to optimize the matching relationship between the first and second stages of the impeller-guide vane. Finally, the internal flow of the model before optimization and the model after optimization were compared and analyzed to provide reference for the subsequent design optimization.
2. Research Object and Computational Domain
2.1. Research Object
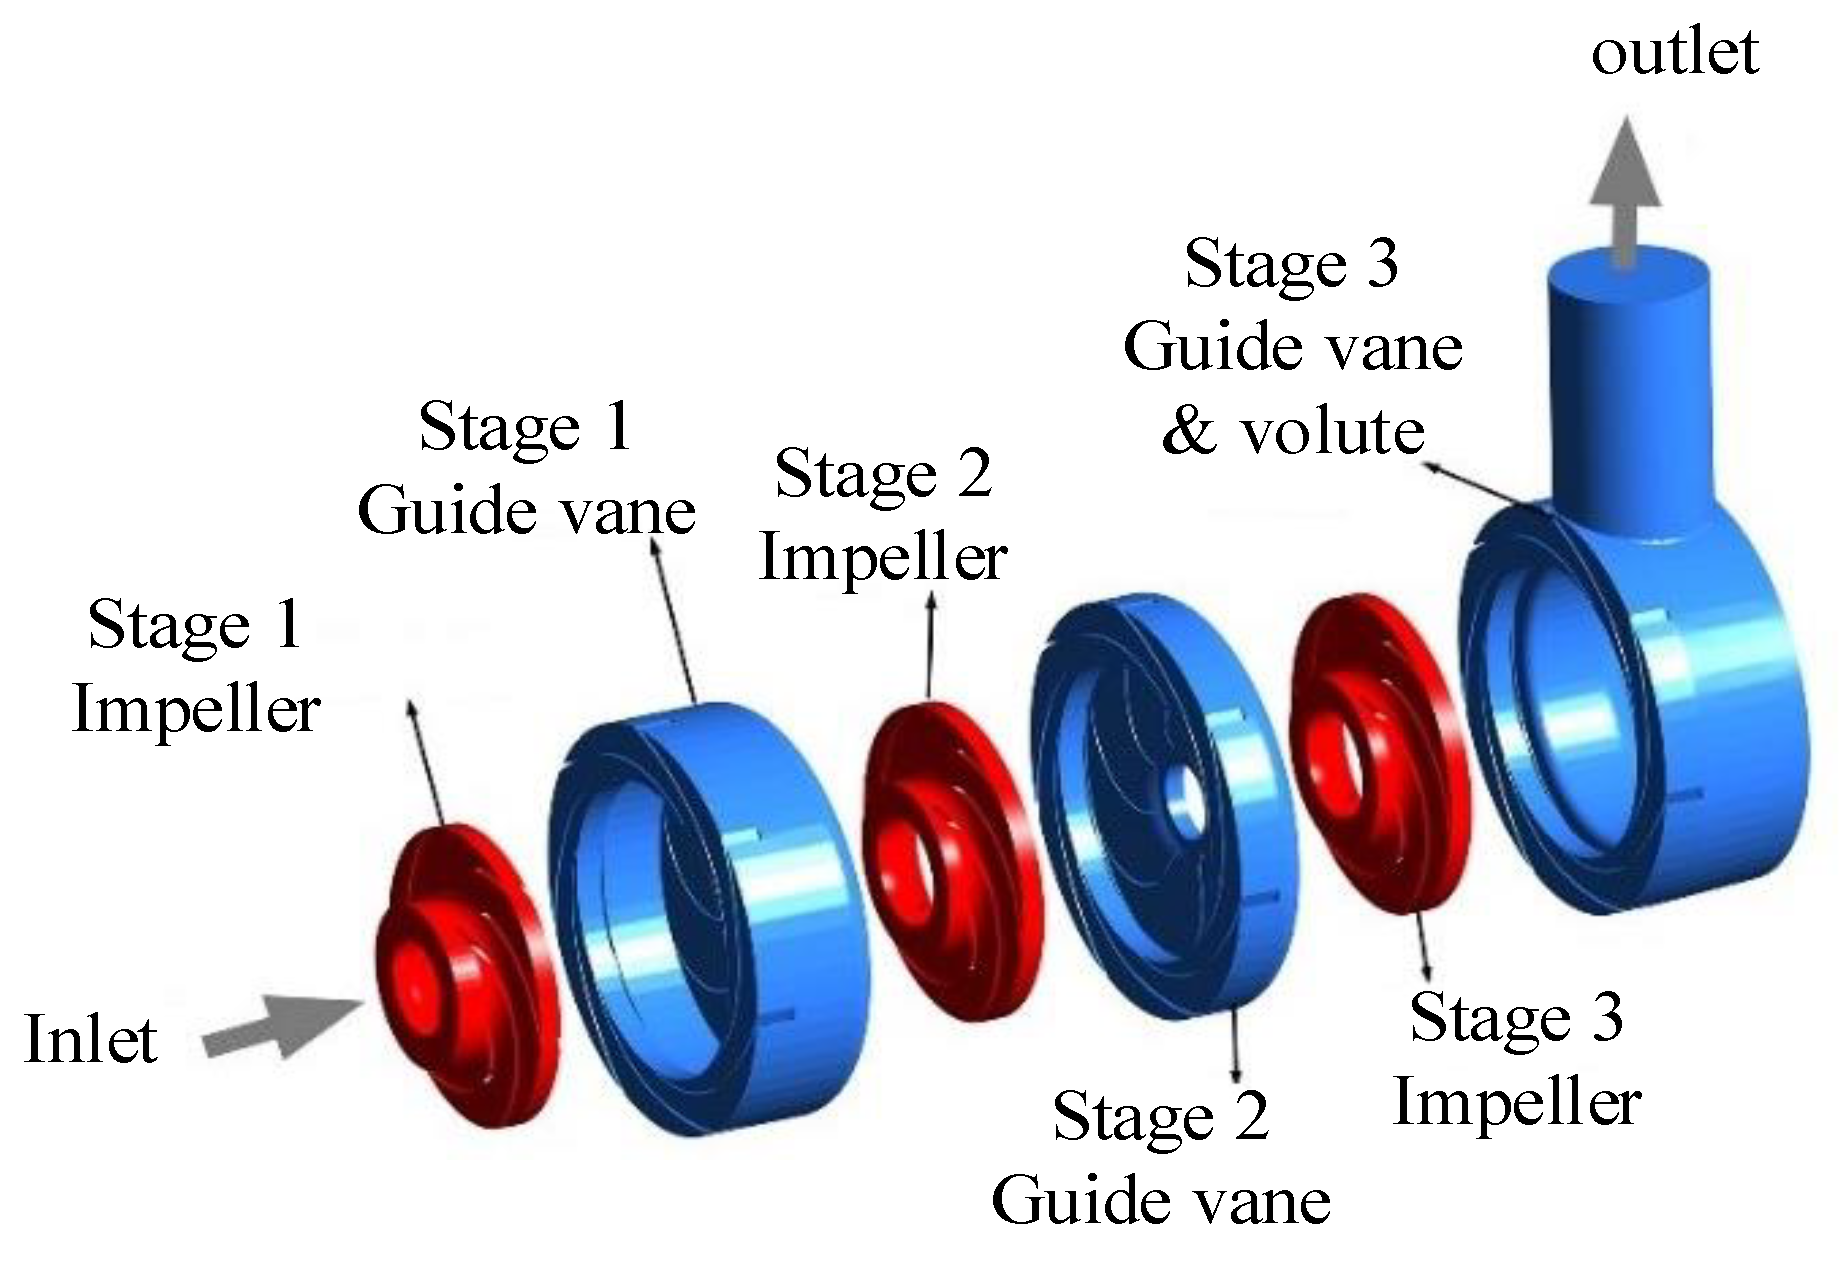
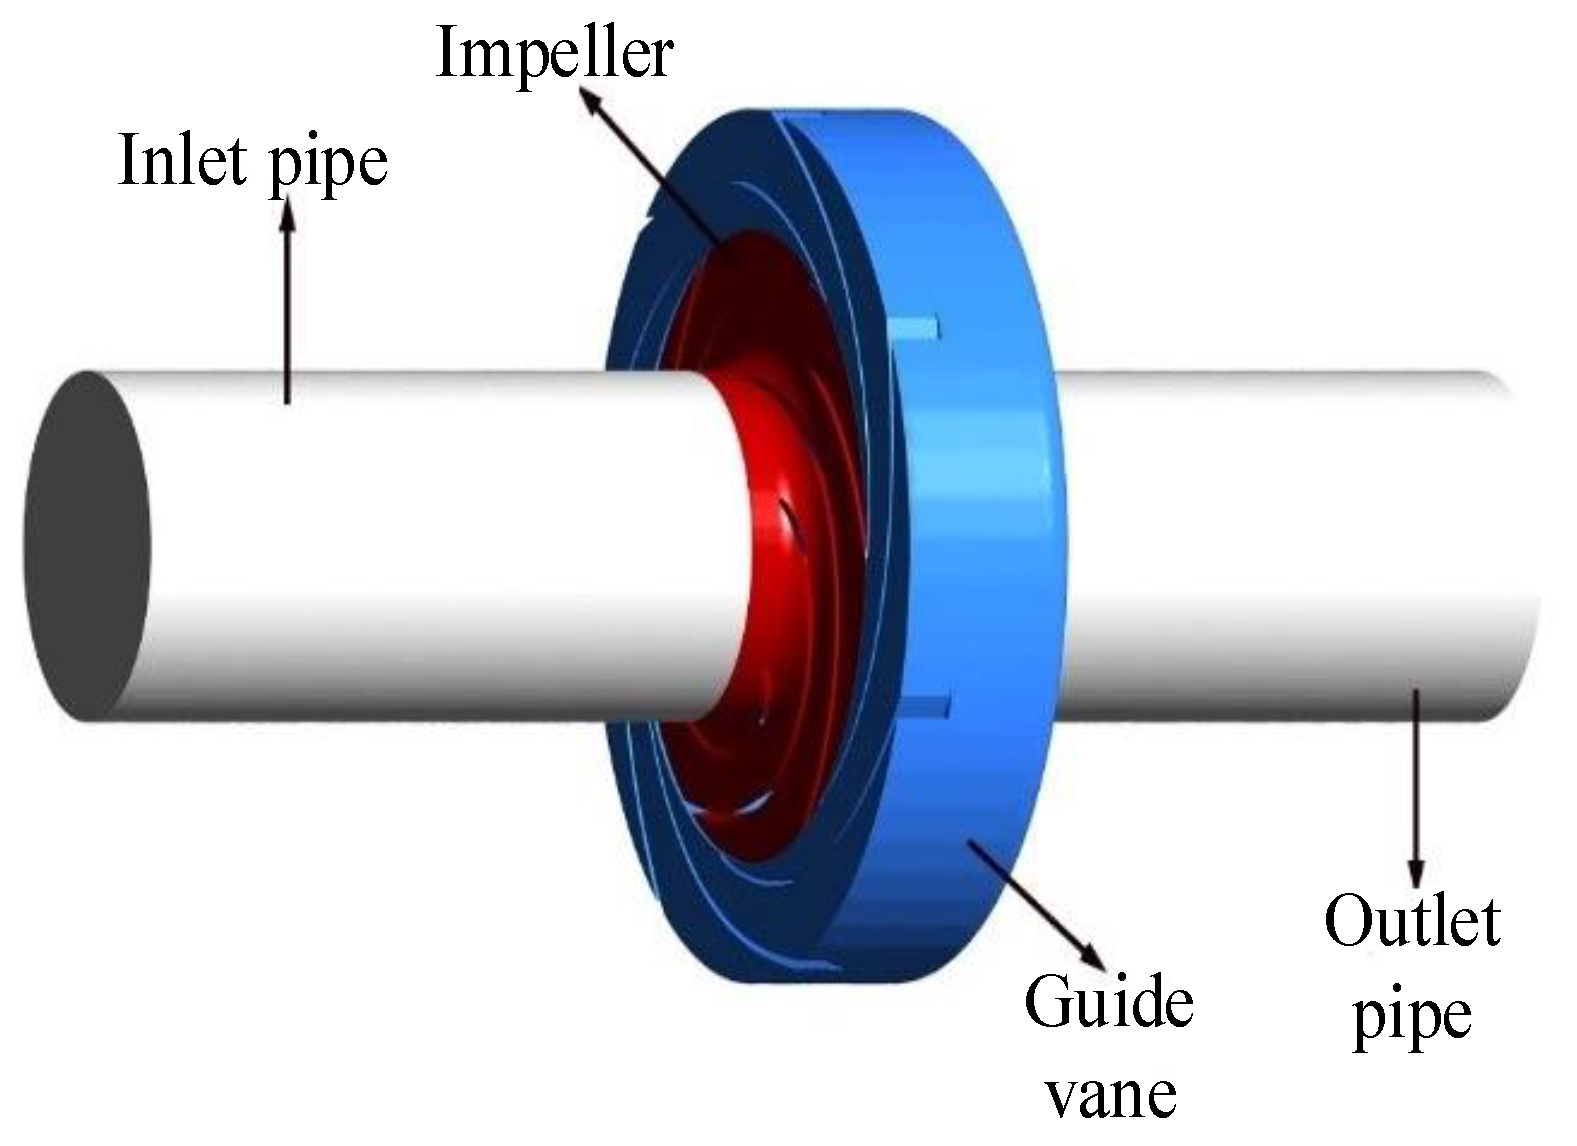
The research object is a three-stage high-pressure centrifugal pump for seawater desalination. The impellers of all three stages have the same hydraulic design and the same positive guide vanes, whereas the final stage has no anti-reflective guide vane. Water flows directly through the volute. The computational domain of the three-stage centrifugal pump was built using ANSYS BladeGen and Unigraphics NX. Figure 2 shows the exploded view of the research object. Because the impellers have the same hydraulic design, the optimization was carried on the first stage impeller-guide vane of the multistage pump.

Figure 2.
Exploded view of the research object.
Figure 3 shows the calculation domain of the first stage impeller-guide vane for optimization. Table 1 refers to the geometric parameters of the guide vane in the first stage, and its single-stage main performance parameters are: design flow rate, ; head, ; speed, ; and specific speed, .
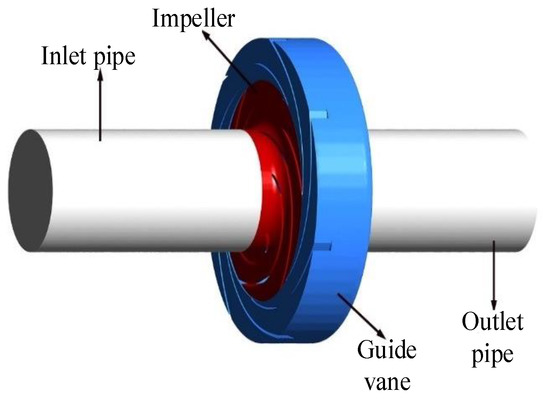
Figure 3.
Calculation domain.

Table 1.
Geometry parameters of the guide vane.
2.2. Governing Equations
The time-dependent Navier–Stokes equation derived from the continuity equation [20] is given as
The dynamic viscosity and density are denoted by ρ and µ, respectively. The velocity is denoted by u, the turbulent viscosity is denoted by µt, and p is for pressure. The axis directions are represented by variables i and j. Shear stress transport (SST k-ω) was applied, because it has the combined advantages of both the k-ω and k-ε turbulence models [21,22]. It has a good performance near the wall treatment, and therefore choosing the SST k-ω for turbulence closure will ensure the simulation’s accuracy during the automatic wall treatment.
2.3. Test of Grid Sensitivity
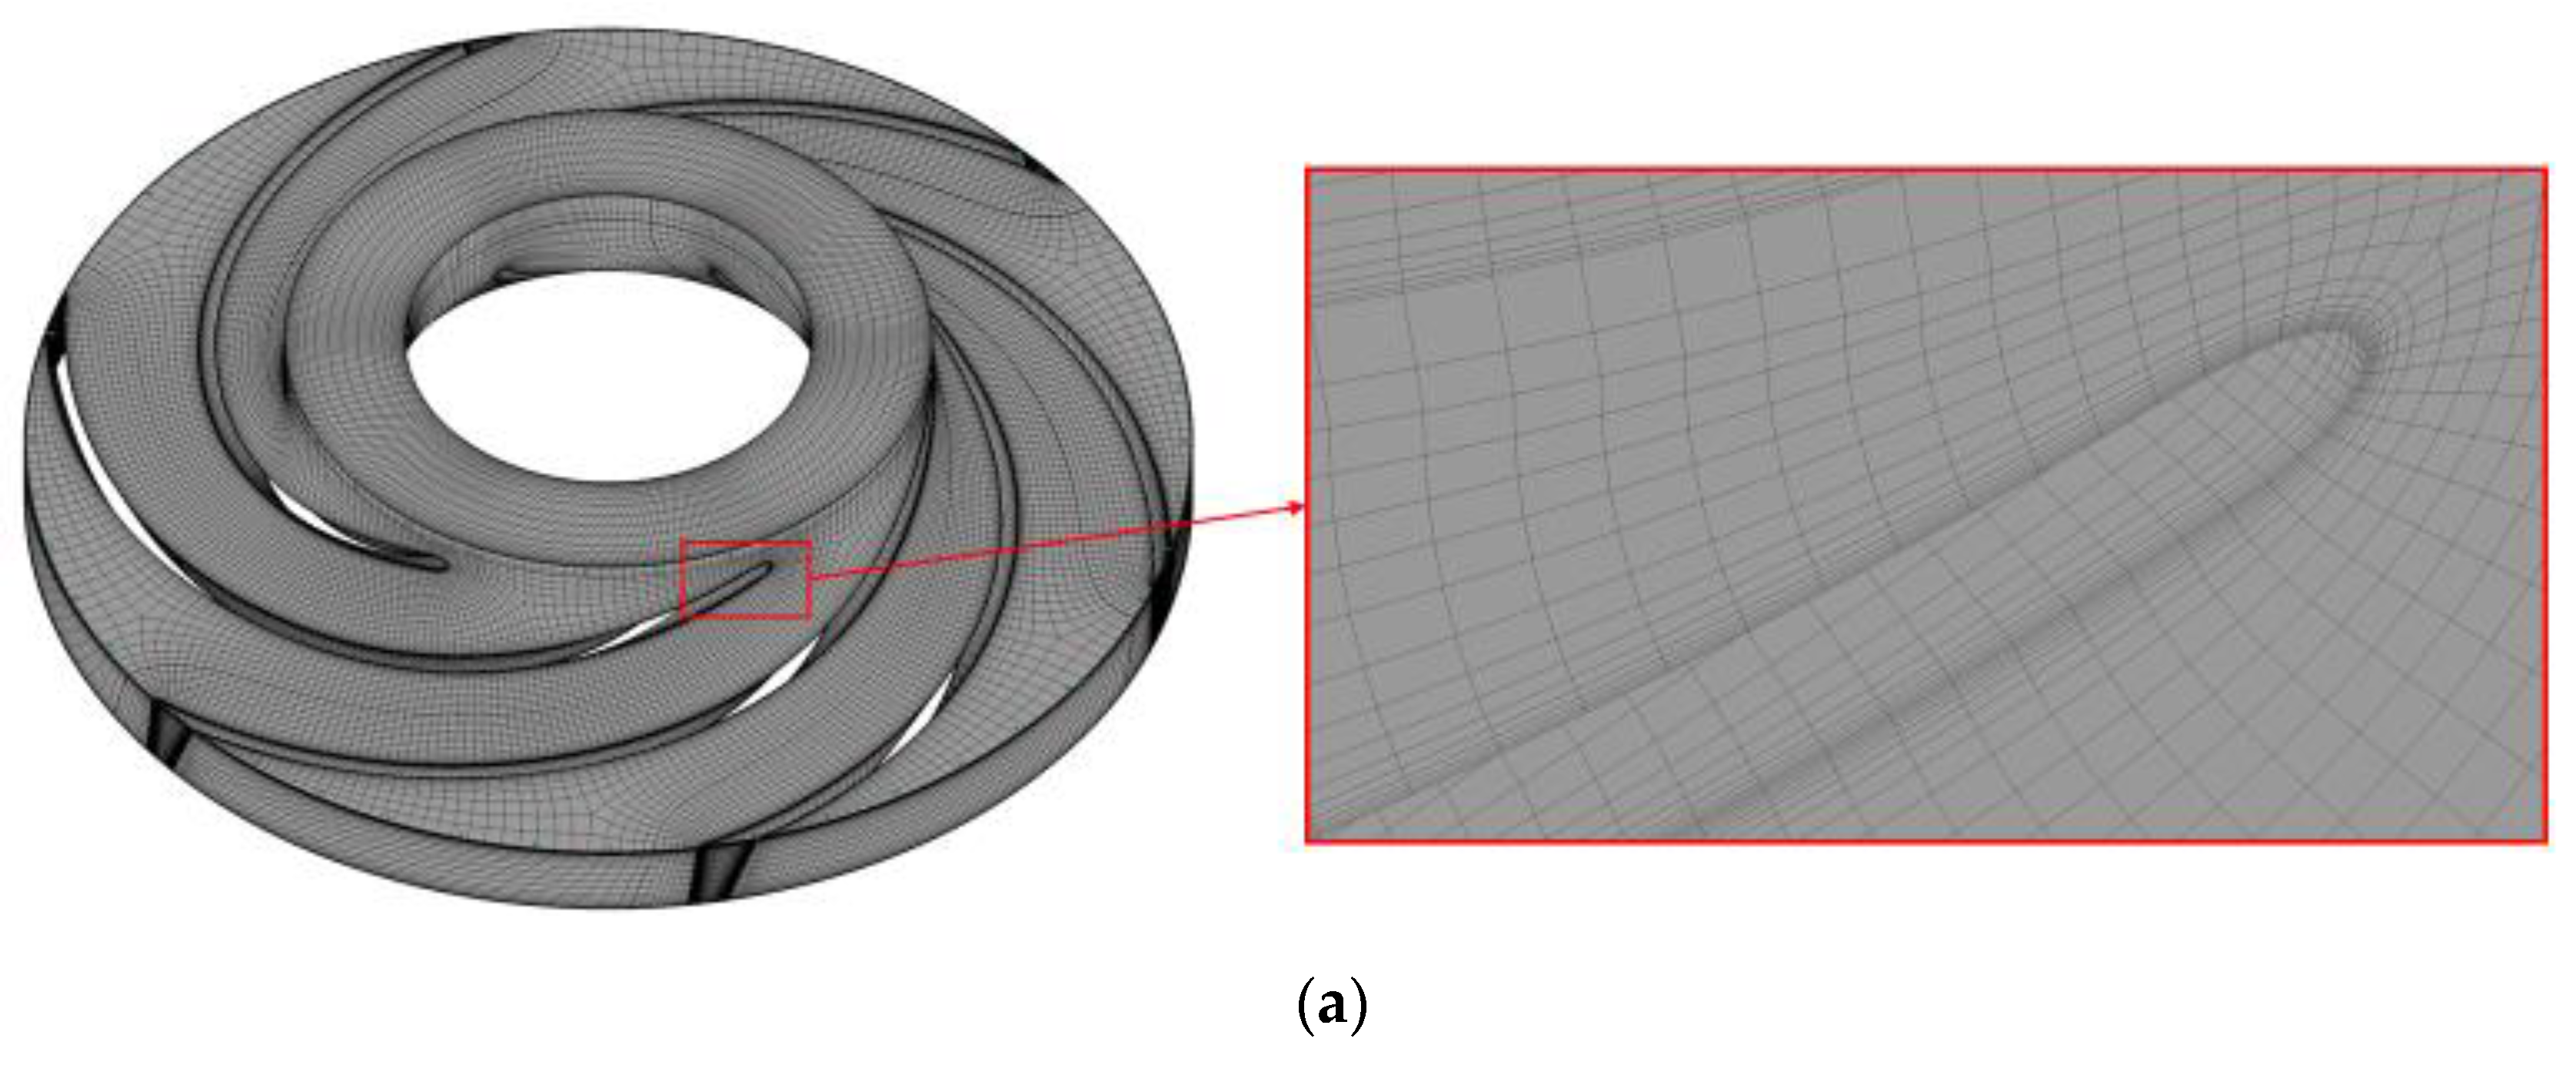
For maximum simulation accuracy, the impeller was meshed using high-quality structural hexahedral mesh with ANSYS ICEM. The inlet and outlet pipes were extended by six times their respective diameter to avoid reverse flow and ensure the stability of the simulation. In order to attain higher precision and boundary motion features, the grids were refined with large numbers and concentrated near the walls. Due to the complex structure of the front and back guide vanes, unstructured grids were built using ANSYS ICEM. The maximum y+ at the key wall of the impeller and the guide vane is less than 10, and the average y+ at the key wall of the remaining components is less than 20.
In order to save computational resource time while maintaining the simulation accuracy, a test of grid independence for head stability was carried out with five different grid schemes. Furthermore, because performance parameters like head alone have been proved not to be sufficient for grid independence [3,23], the Grid Convergence Index (GCI) values were considered during the test. The discretization error reduced as the grid refinements increased until a head stability was achieved. At this point, the effect of the mesh density on head stability was negligible, and there the final mesh adopted for computation had total mesh elements of 12.2502 million and a GCI of 2.015%. The statistics for grid convergence and sensitivity are shown in Table 2, and the grid diagram is shown in Figure 4.
Table 2.
Mesh statistics.
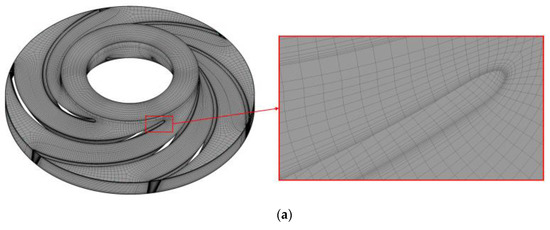
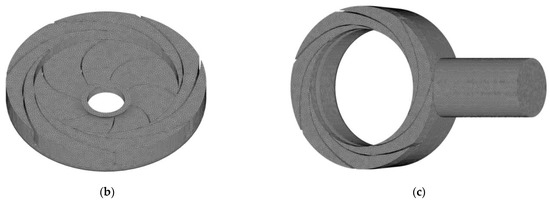
Figure 4.
Mesh of the computational domain. (a) Impeller; (b) guide vane; (c) stage three guide vane with volute.
2.4. Calculation (CFX) Setup
In this investigation, the commercial software package ANSYS was used for the simulations. Water at 25 °C was the working fluid for the flow domain. The reference pressure was set to 1 atm. In order to put the system into thermal equilibrium, an isothermal heat transfer rate was assumed. For additional effects in the viscous sublayer during the wall treatment, the SST (k-ω) turbulence model was applied to maintain an accurate pressure gradient irrespective of the wall distance [11,21]. Referring to similar works, a no-slip condition was assumed, and the turbulence intensity level was set to 5% [24,25]. A high-resolution upwind scheme was set to maintain the accuracy and consistency during the convergence. This scheme locally adjusts the discretization and ensures the physical boundedness of the solution. The transient rotor-stator condition was set at the domain interface. The timestep was set to 0.000168 s, representing an impeller rotation of 3°. The total time was set to 0.1611 s, which corresponds to eight impeller revolutions. The conditions at the boundaries were the pressure opening at the inlet and the mass flowrate at the outlet. Convergence was achieved when the maximum residual values reached 10−5 and the iterations were periodically stable. The performance indicators were calculated with reference to Gülich [26].
2.5. External Characteristic Test
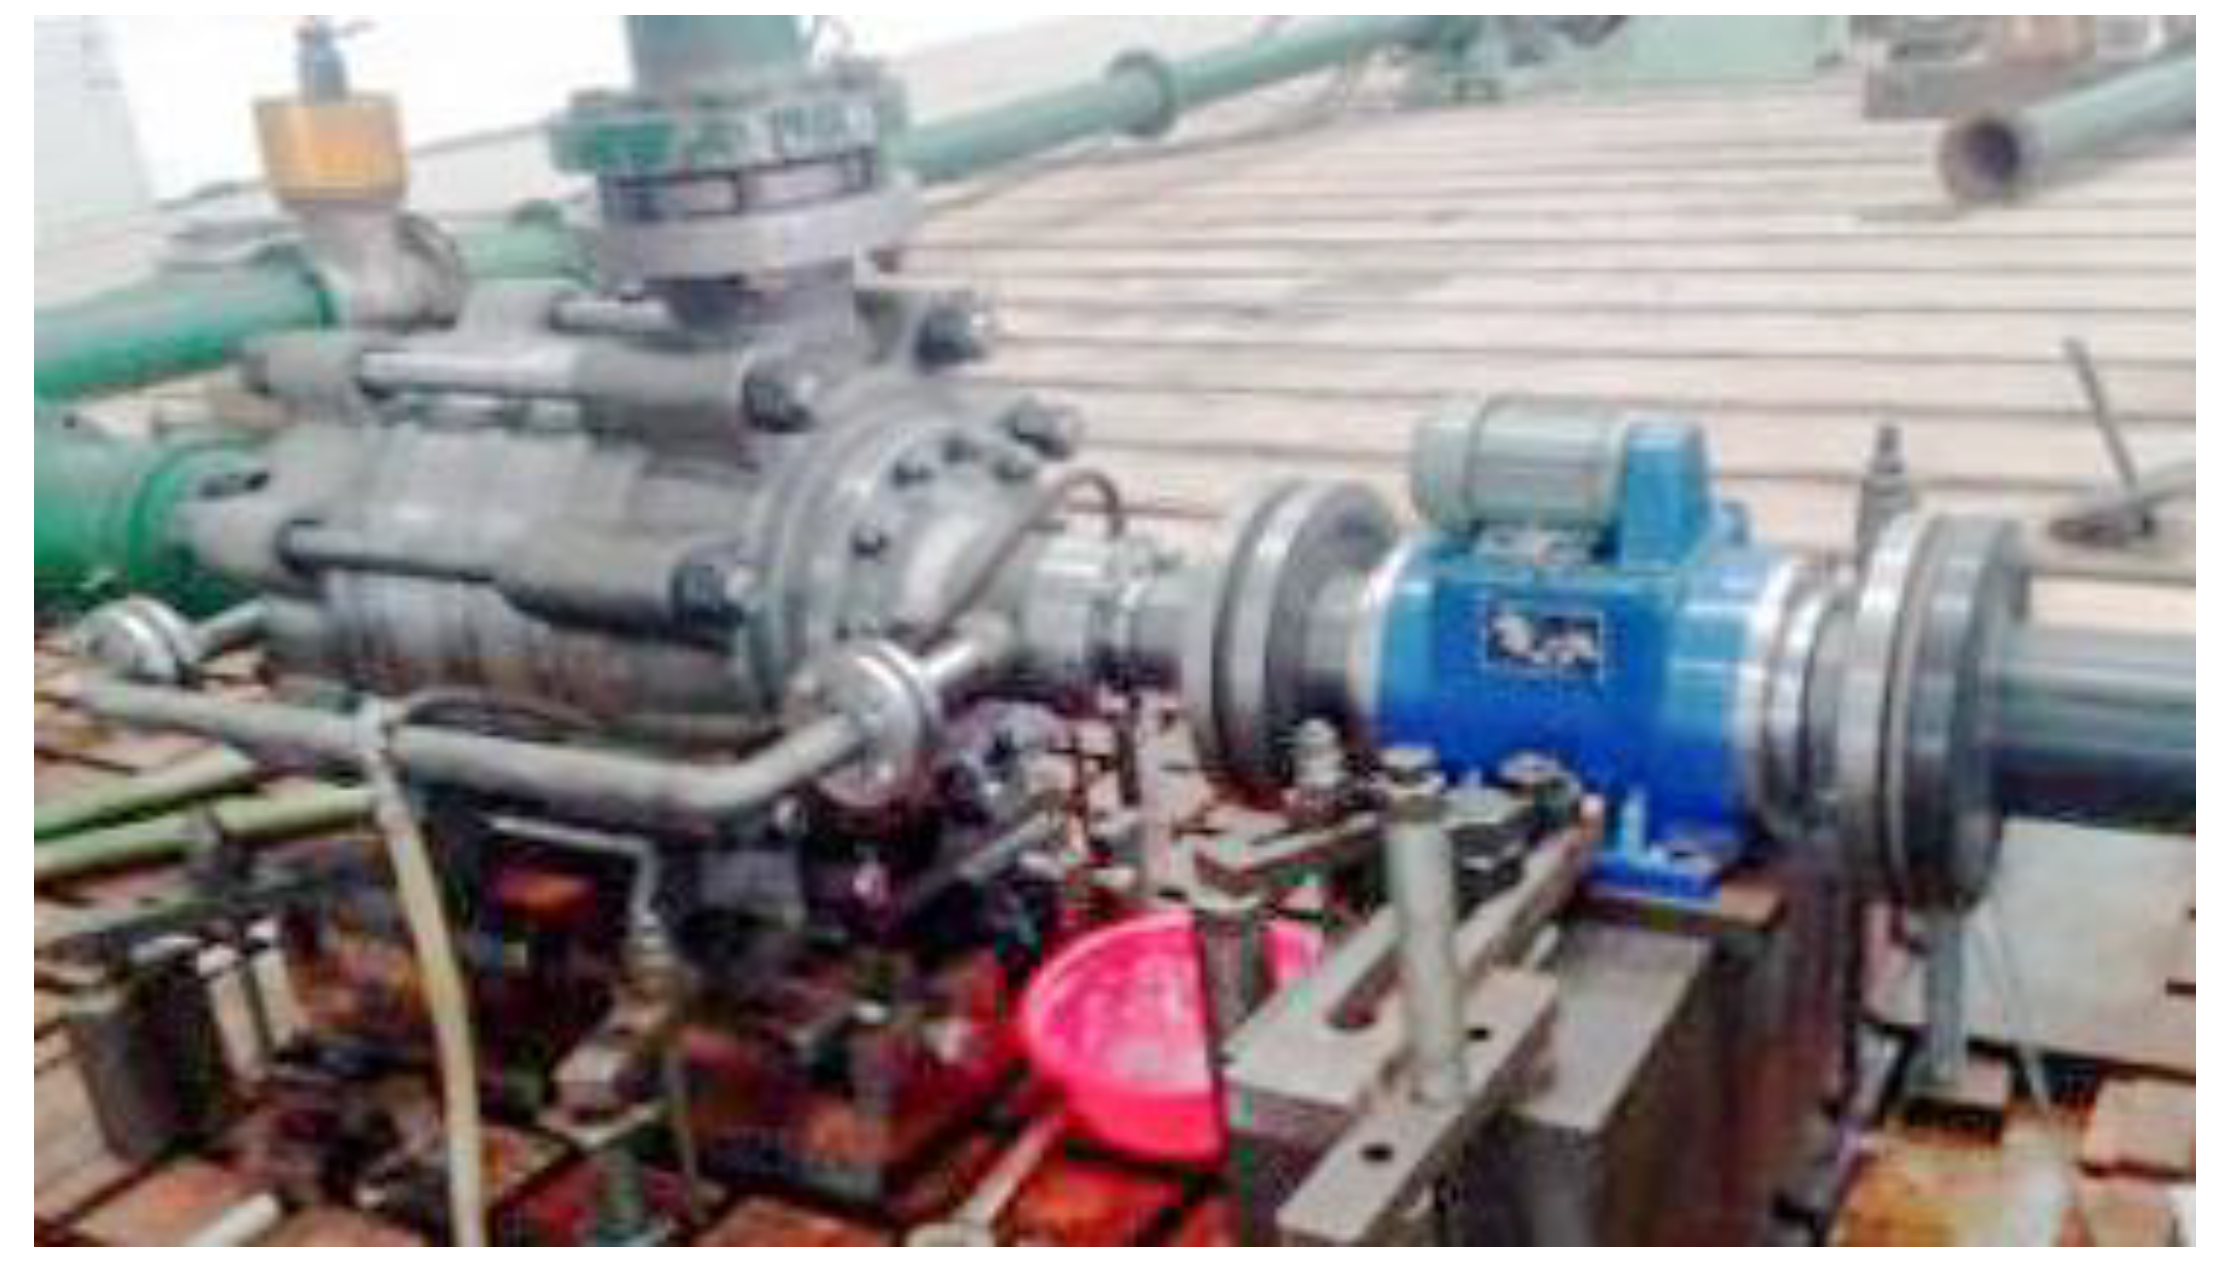
In order to verify the reliability and accuracy of the prediction, an external characteristic test was carried out on the three-stage high-pressure centrifugal pump model. The test was completed on an open test rig system. Figure 5 and Figure 6 present the tested pump and the test rig schematics for the experiments. Pressure transmitters with 0.5% measurement uncertainty were installed at the suction and discharge pipes. A flowmeter with an uncertainty of 0.07% was installed to regulate the flowrate from the pump discharge. The data from the tests were transformed by the equivalent efficiency formula [11] and compared with the numerical investigations. Figure 7 shows the comparison of the external characteristics measured by numerical simulation and experiment. The calculation formula for the head coefficient is as follows:
g (m/s2) is the gravitational acceleration, H (m) is the head, and u2 (m/s) is the circumferential component of the impeller outlet velocity.
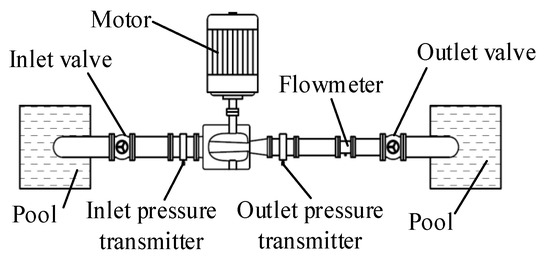
Figure 5.
Test rig schematics.

Figure 6.
Test site diagram.
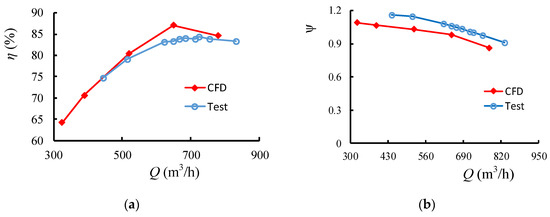
Figure 7.
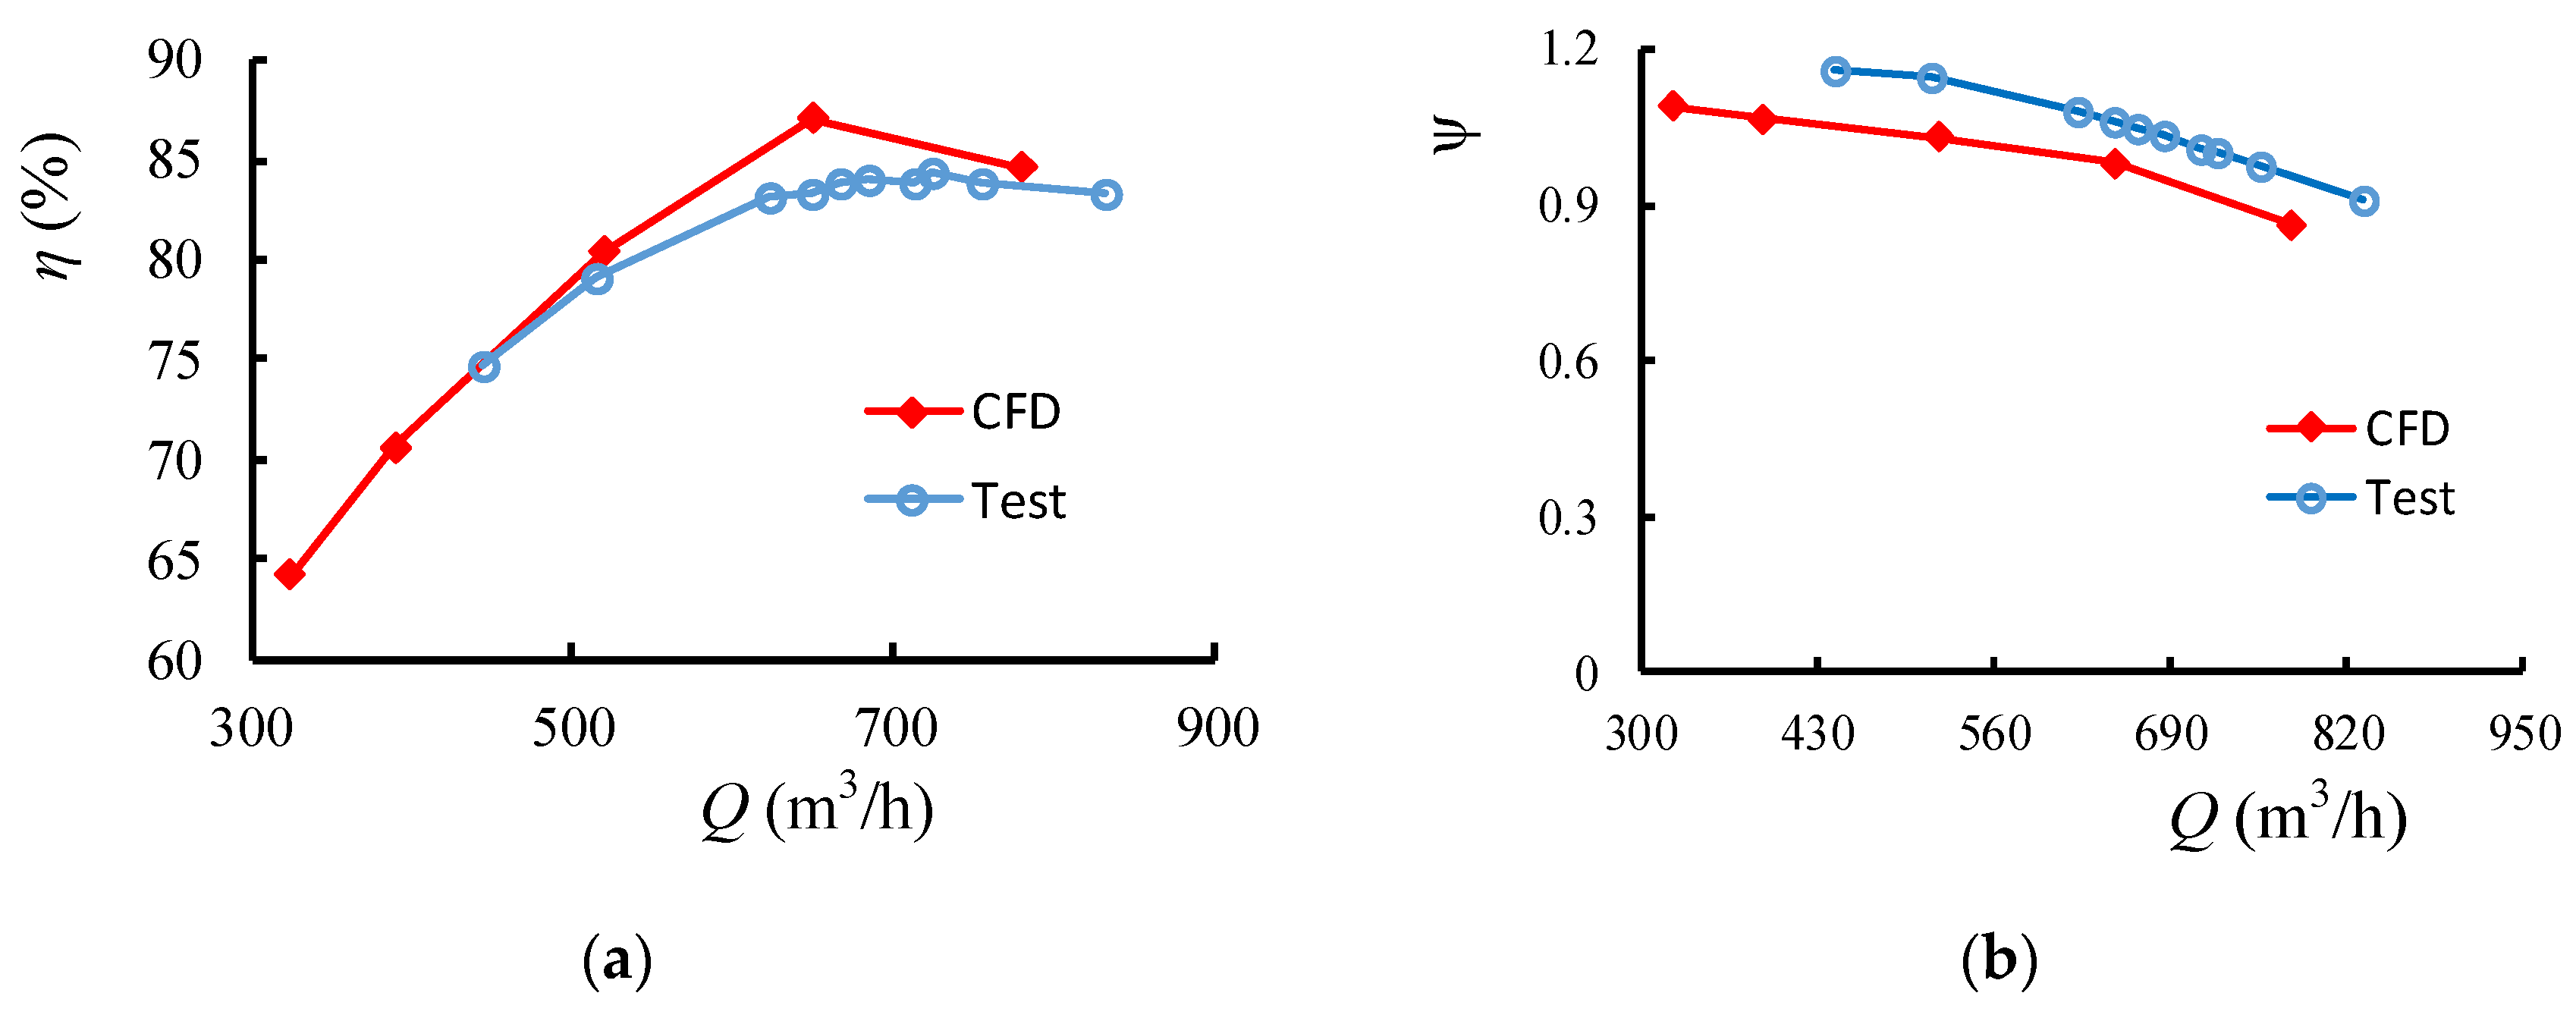
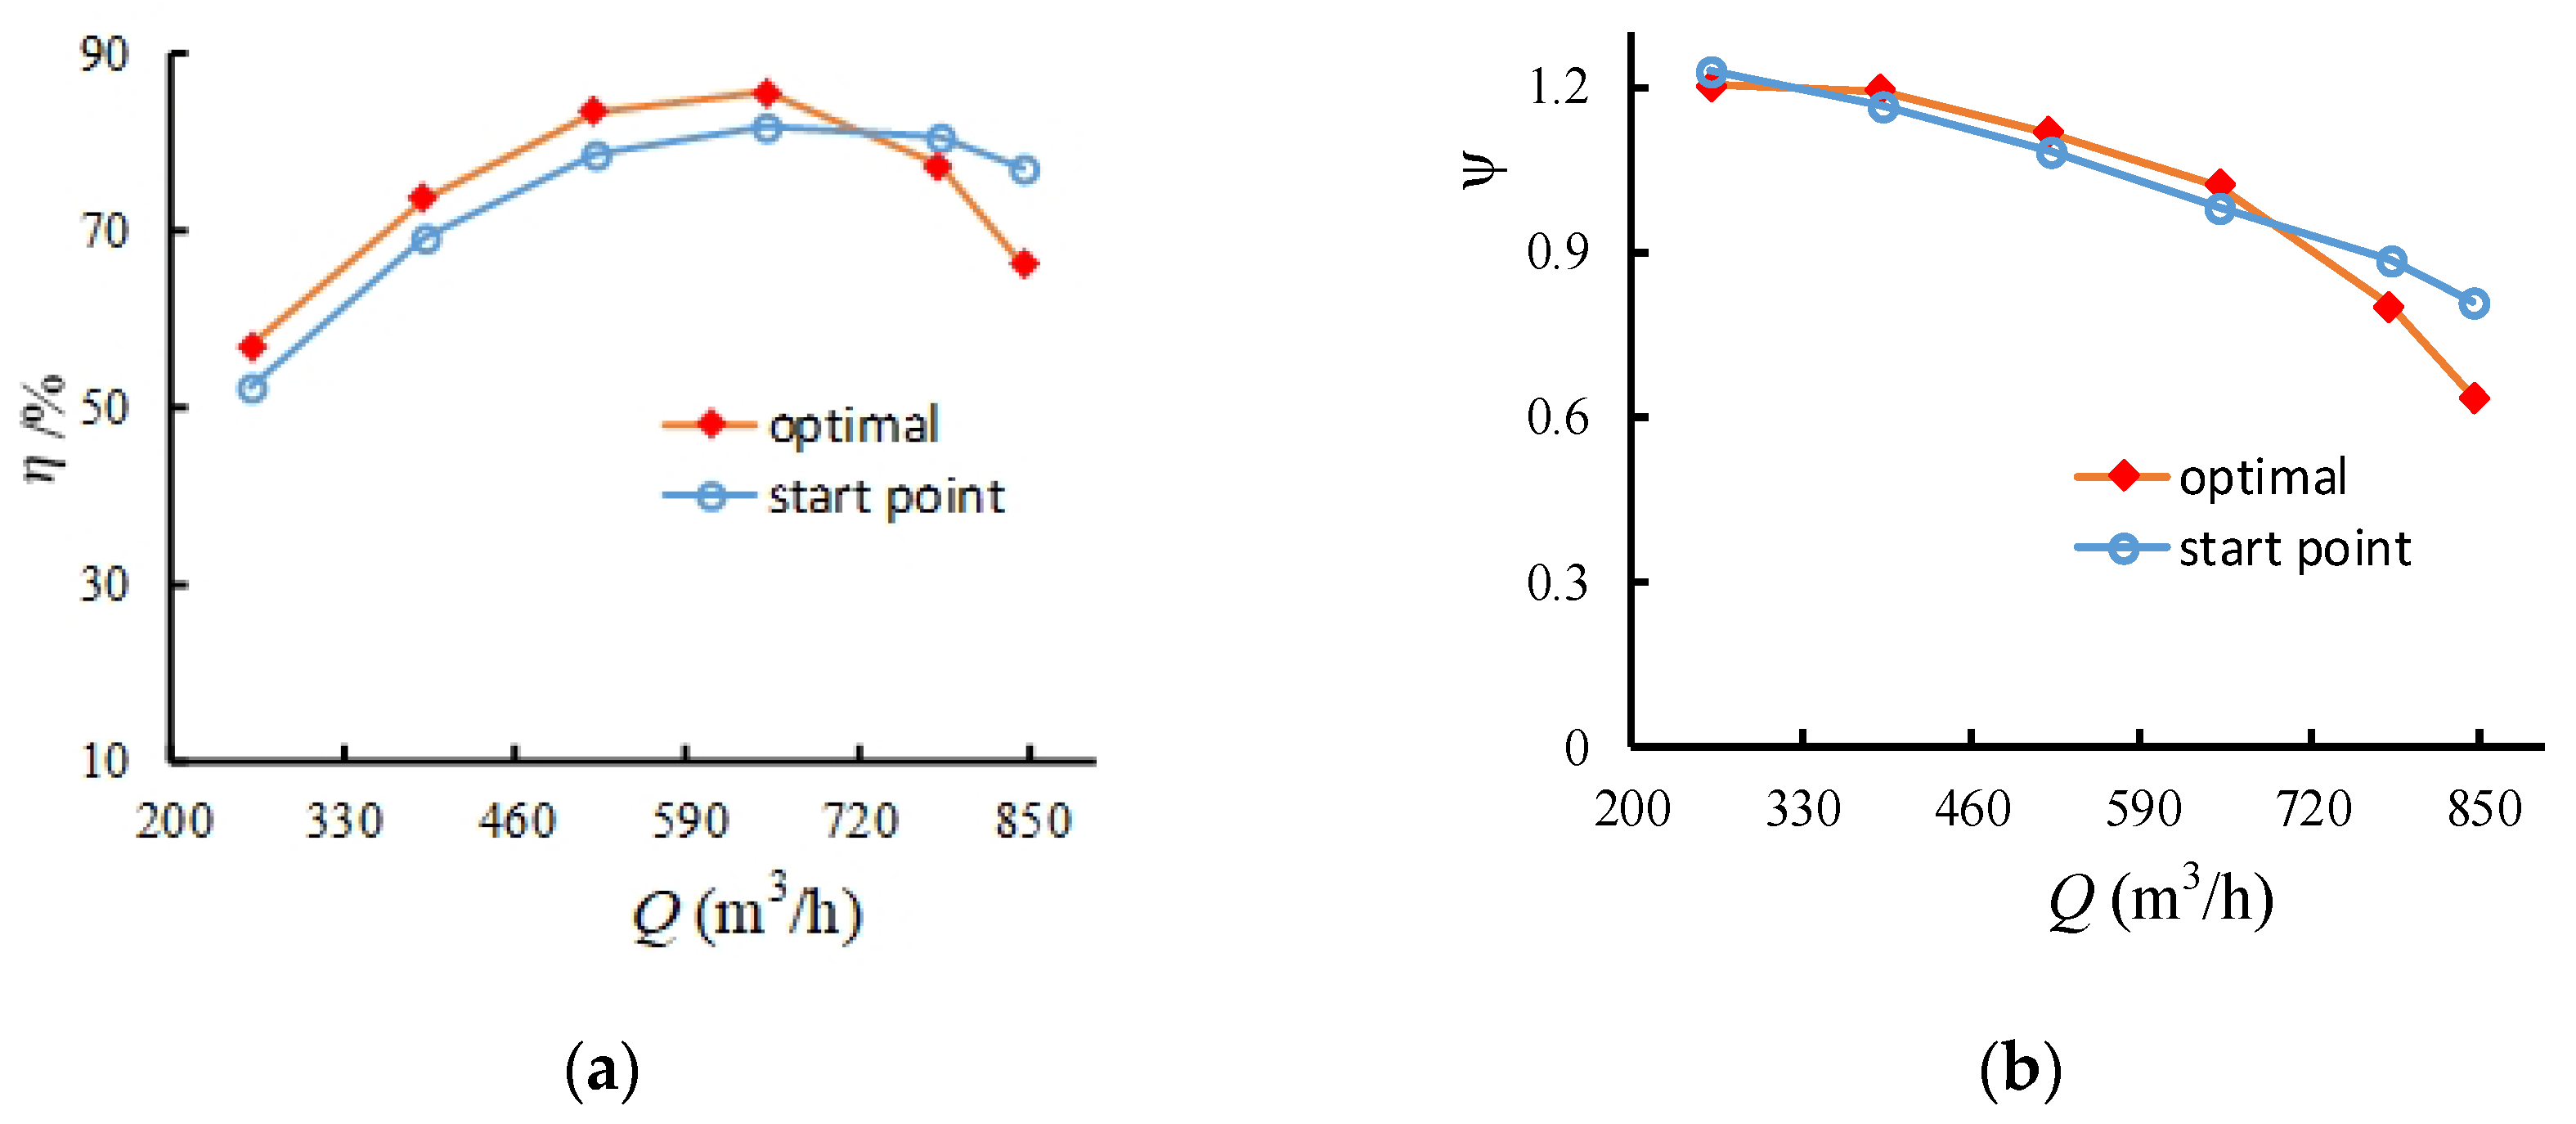
Comparison of the external characteristic curve between the experiment and the numerical simulation. (a) Efficiency curve; (b) head coefficient.
Under the design conditions, the total test efficiency was 83.86%, and the numerical simulation hydraulic efficiency was 87.08%; the test and numerical simulation head coefficients were 1.018 and 0.980, respectively. Due to the complex structure of the multi-stage pump and the small flow conditions with unstable flow, the turbulence model has an increased deviation in the calculation of complex flows. The head loss under the part load condition is higher than the rated condition, and the maximum error is 5.7%. The overall trend of the numerical simulation curve is basically consistent with the experimental data, and the agreement is good. Therefore, the numerical method can be relied upon for further investigations.
3. Strategy for Optimization
3.1. Structure Improvement of the Multi-Stage Pump Guide Vane
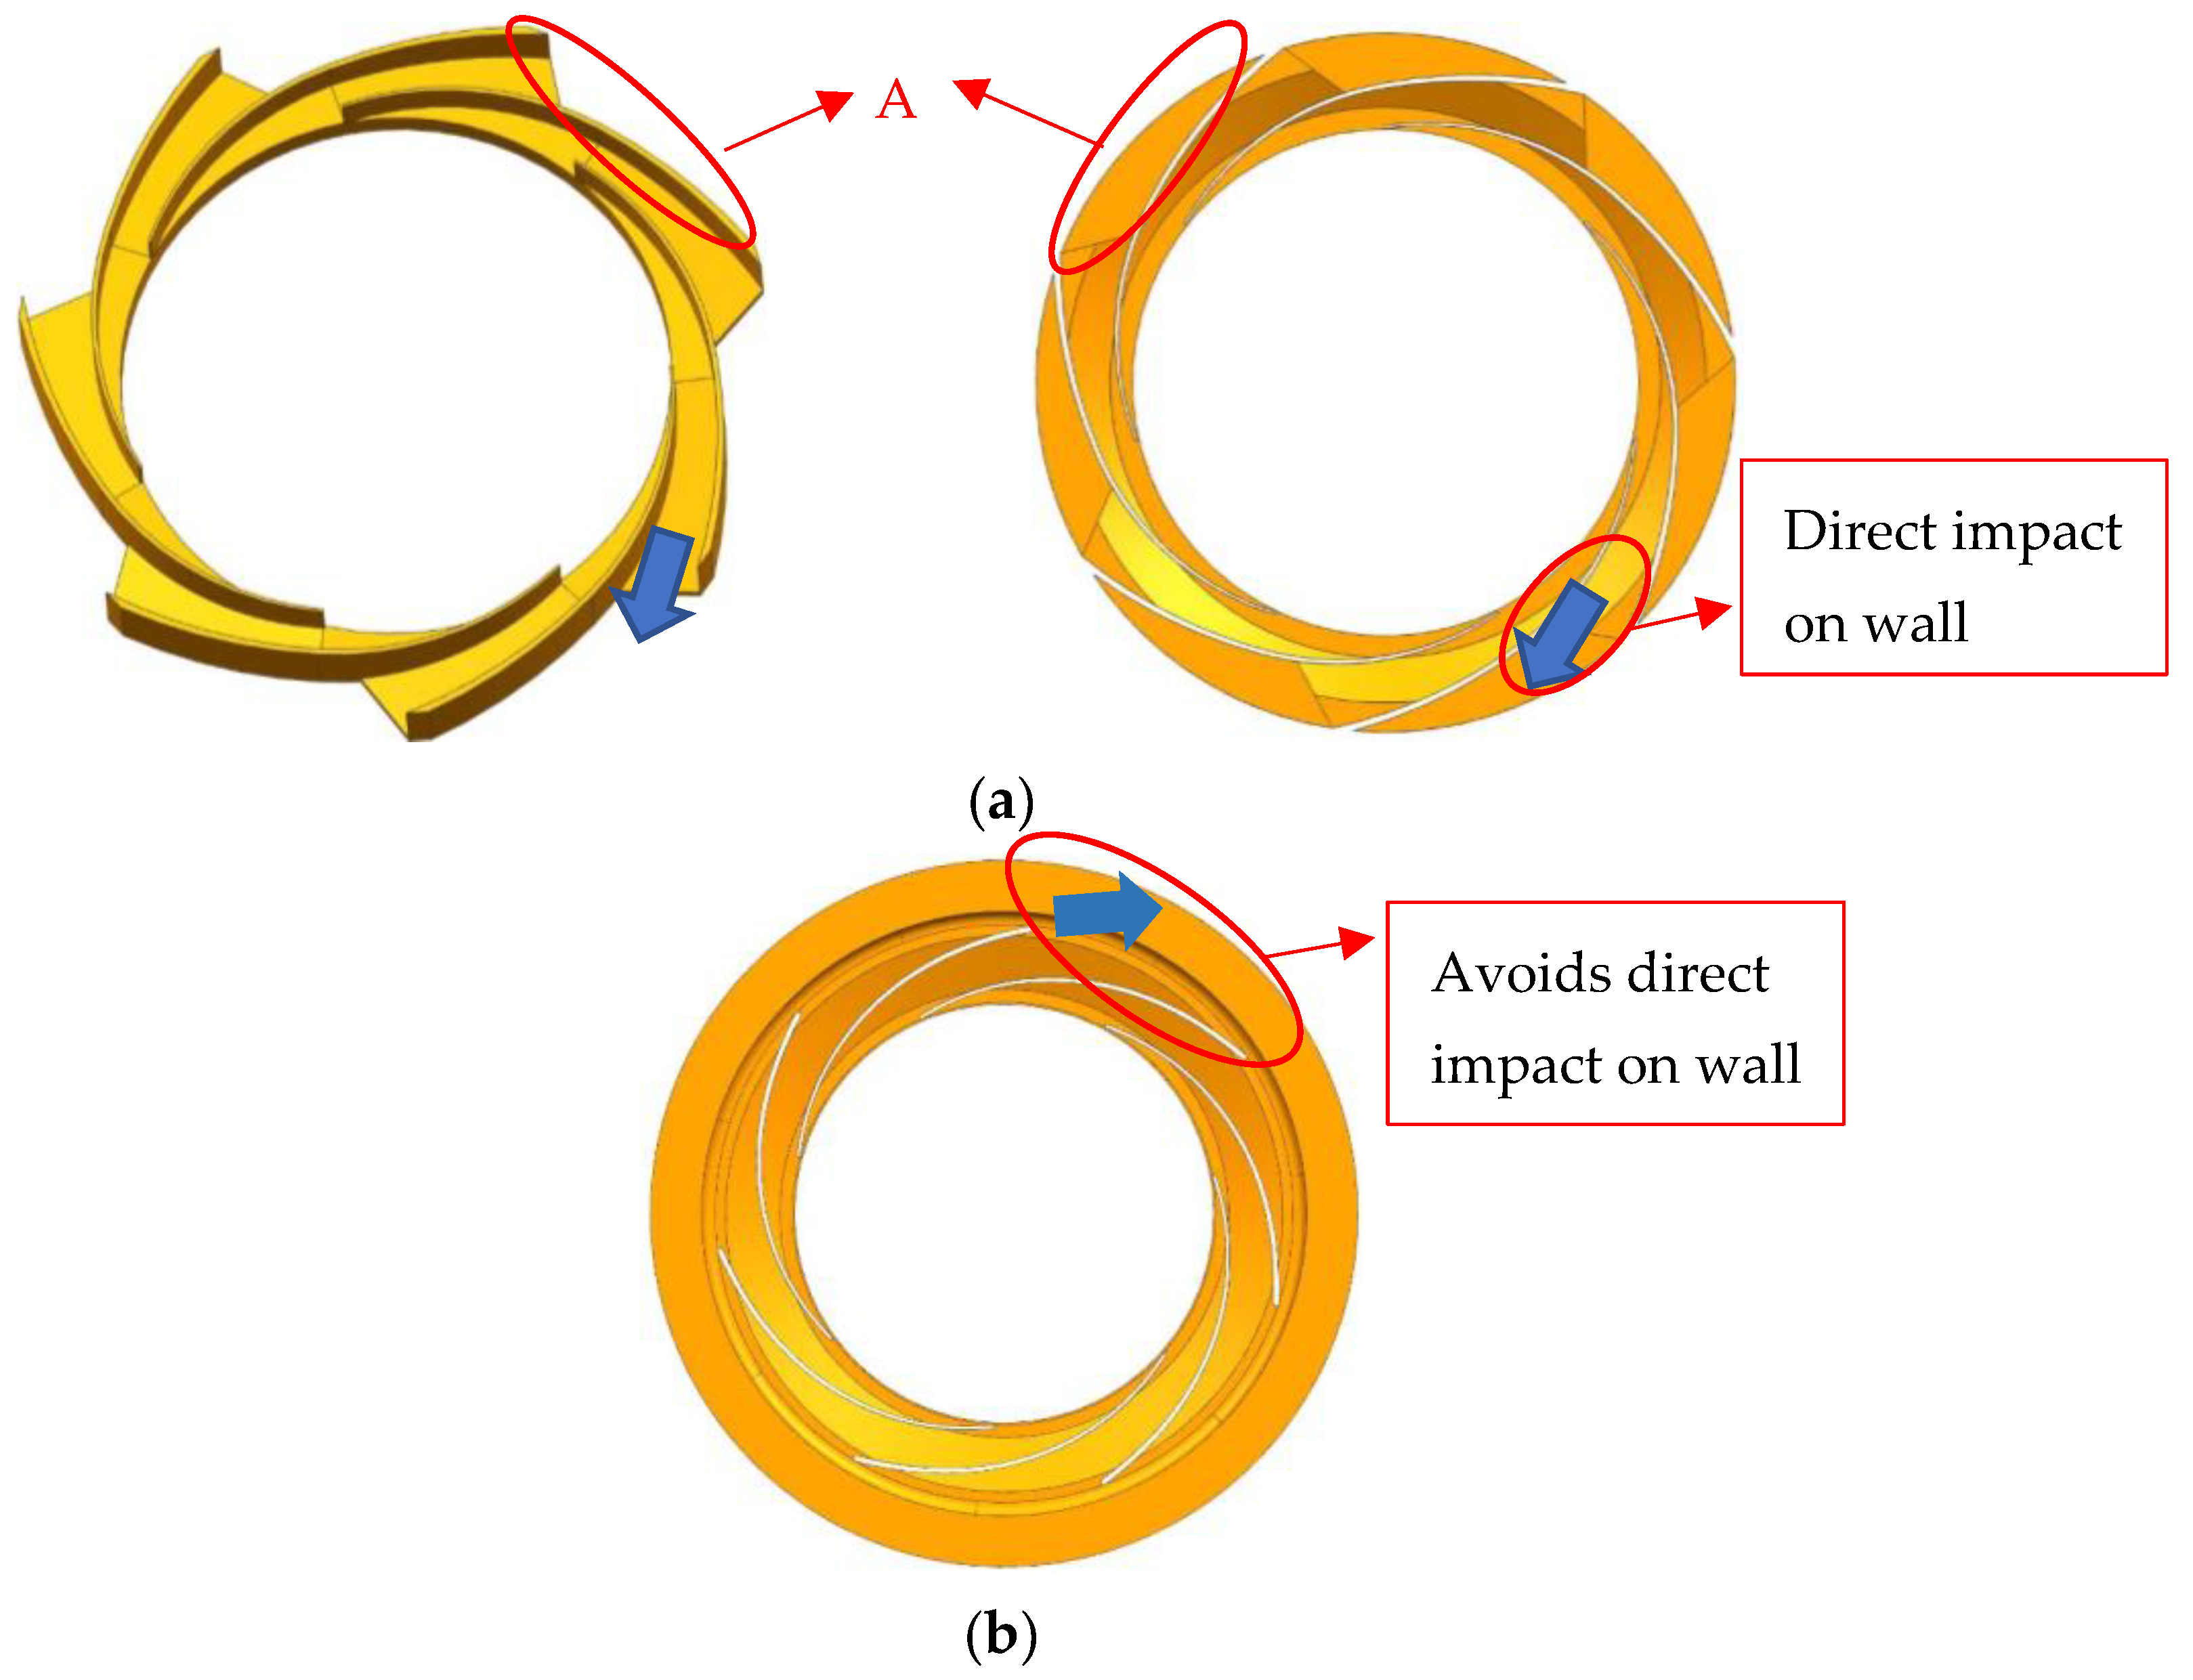
There is a large vortex at the end of the positive guide vane flow channel; hence, it is necessary to separately improve the structure of the positive guide vane in order to avoid the problem of the positive guide vane structure restricting the effect of the automatic optimization. Figure 8a shows the original model of the guide vane and the outlet of the positive guide vane at A. The total area of the outlet channel of the positive guide vane is smaller, and therefore the fluid is squeezed at the end of the flow channel, which directly impacts the wall of the pump casing. In Figure 8b, the improved structure tries to abandon the original triangular flow channel exit design to become an intermediate flow channel in which the guide vane flow channel directly connects with the positive guide vane and the reverse guide vane. The inlet angle and the outlet angle of the guide vane remains unchanged. The fluid at the outlet of the improved guide vane channel avoids direct impact on the wall of the pump casing.

Figure 8.
Improvement of the positive guide vane structure. (a) Original model guide vane; (b) modified guide vane.
3.2. Impeller and Guide Vane Parameterization
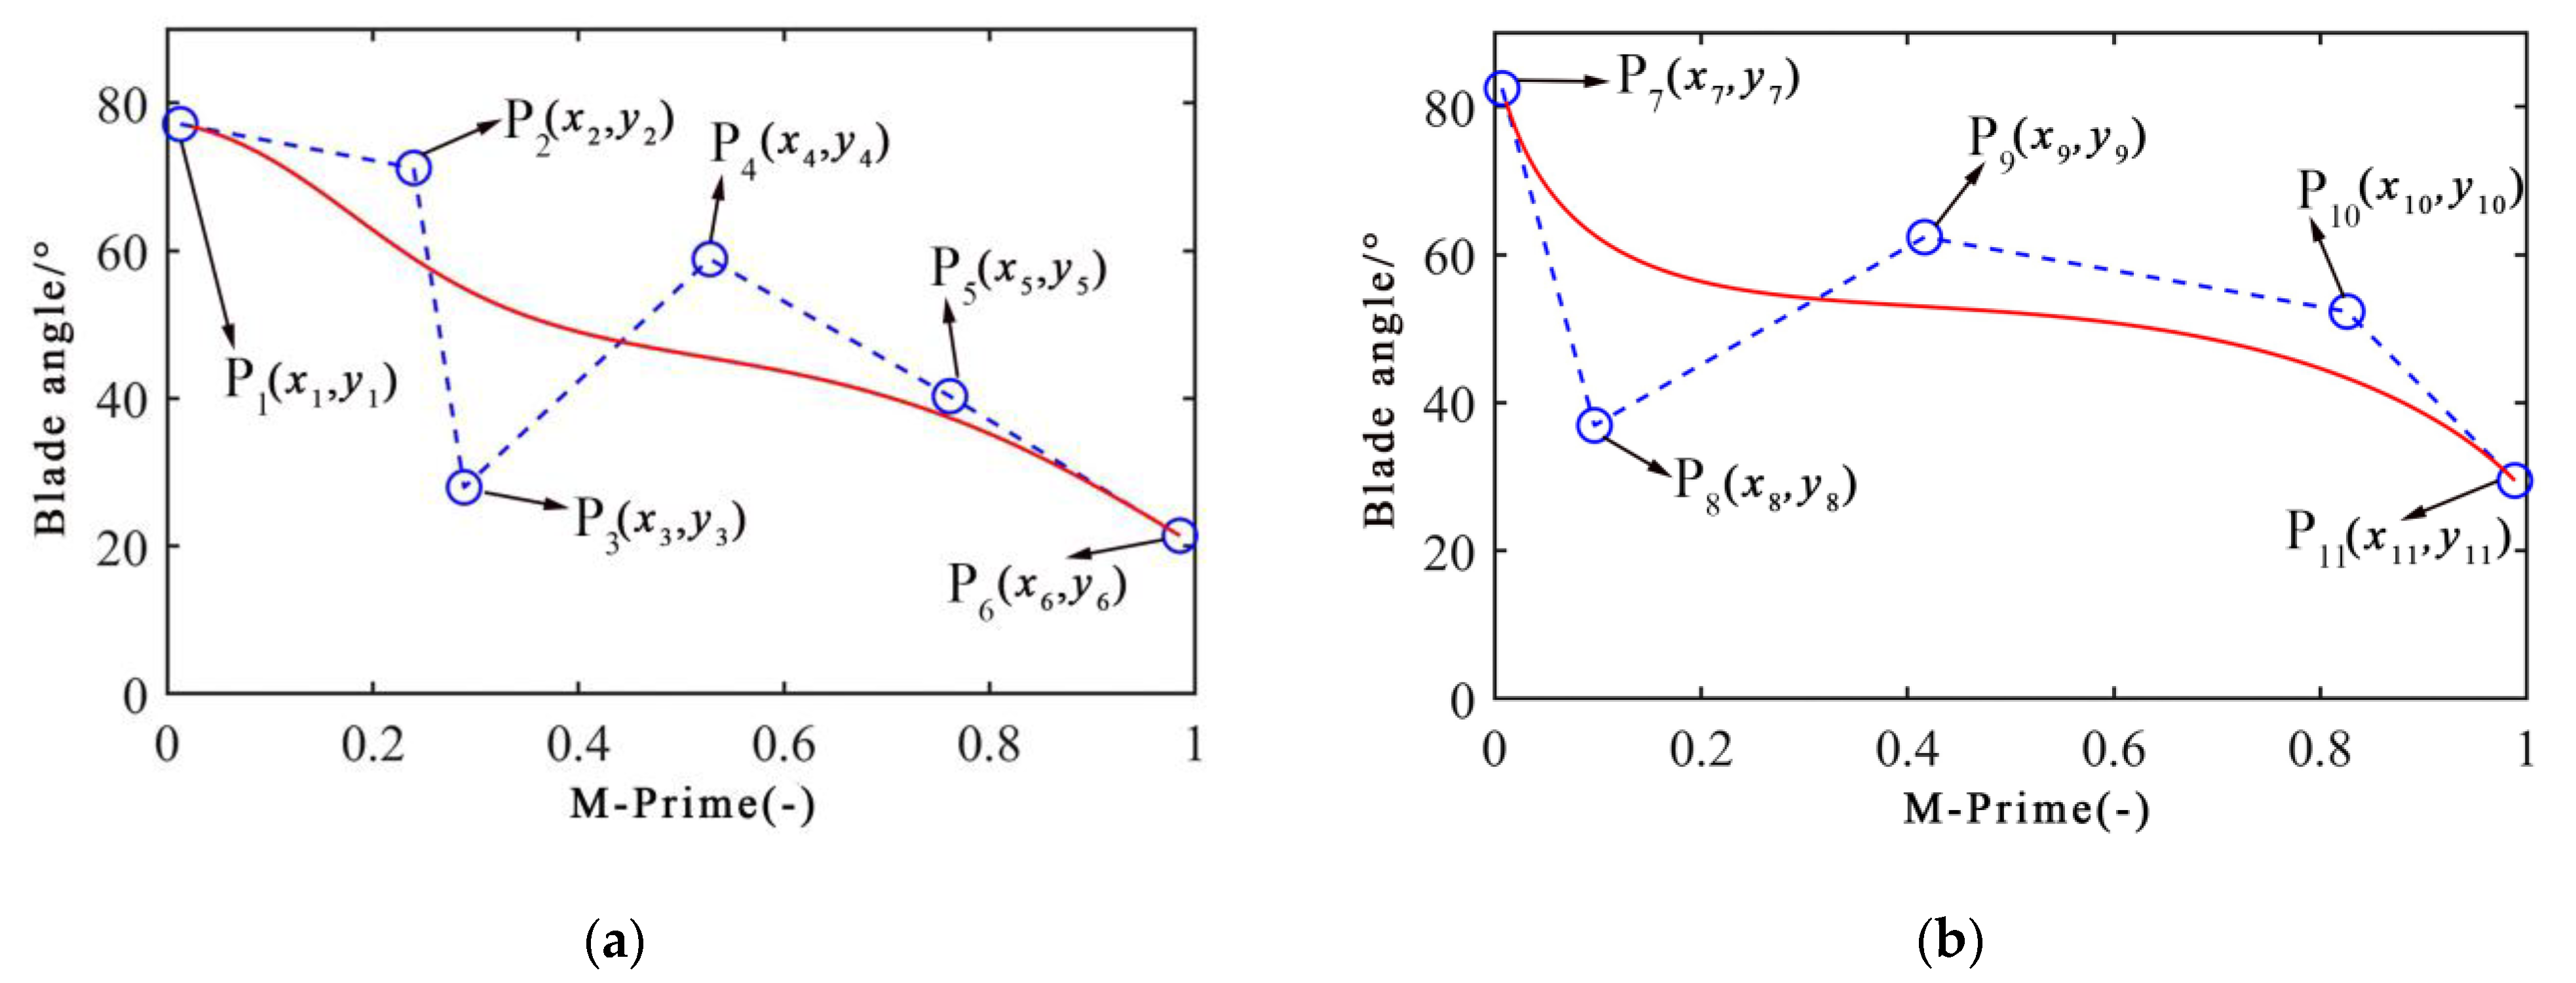
The study mainly optimizes the performance of the high-pressure pump by optimizing the matching relationship between the impeller and the guide vane. In the optimization process, the axial shape of the impeller and the guide vane, and the blade thickness are kept consistent with the original model. As shown in Figure 9, the placement angle of the impeller is controlled by the five-order Bezier curve, and the placement angle of the guide vane is controlled by the four-order Bezier curve. The x-axis value(M-Prime) means the relative position, which represents the relative position of the blade from the inlet side to the outlet side, and the y-axis value is the blade angle with the unit of degree. Therefore, these parameters can be used to fully control the blade shape of the impeller and the guide vane based on a relational function between the blade angle and the wrap angle.
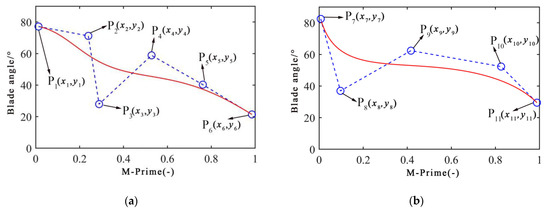
Figure 9.
Placement angle distribution of impeller-guide vane. (a) Impeller placement angle control; (b) Guide vane placement angle control.
In order to keep the shape and position of the inlet and outlet sides of the blades stable during the process of changing the blade profile, the upper and lower limits of the optimization design variables on the impeller and guide vanes and their variation ranges are presented in Table 3. The three-dimensional modeling and meshing are based on the impeller and guide vane data of the improved structure model, and the coordinate change range of each point is also restricted.
Table 3.
Design variables and the variation range of the impeller and guide vane.
3.3. Numerical Calculation Process Control
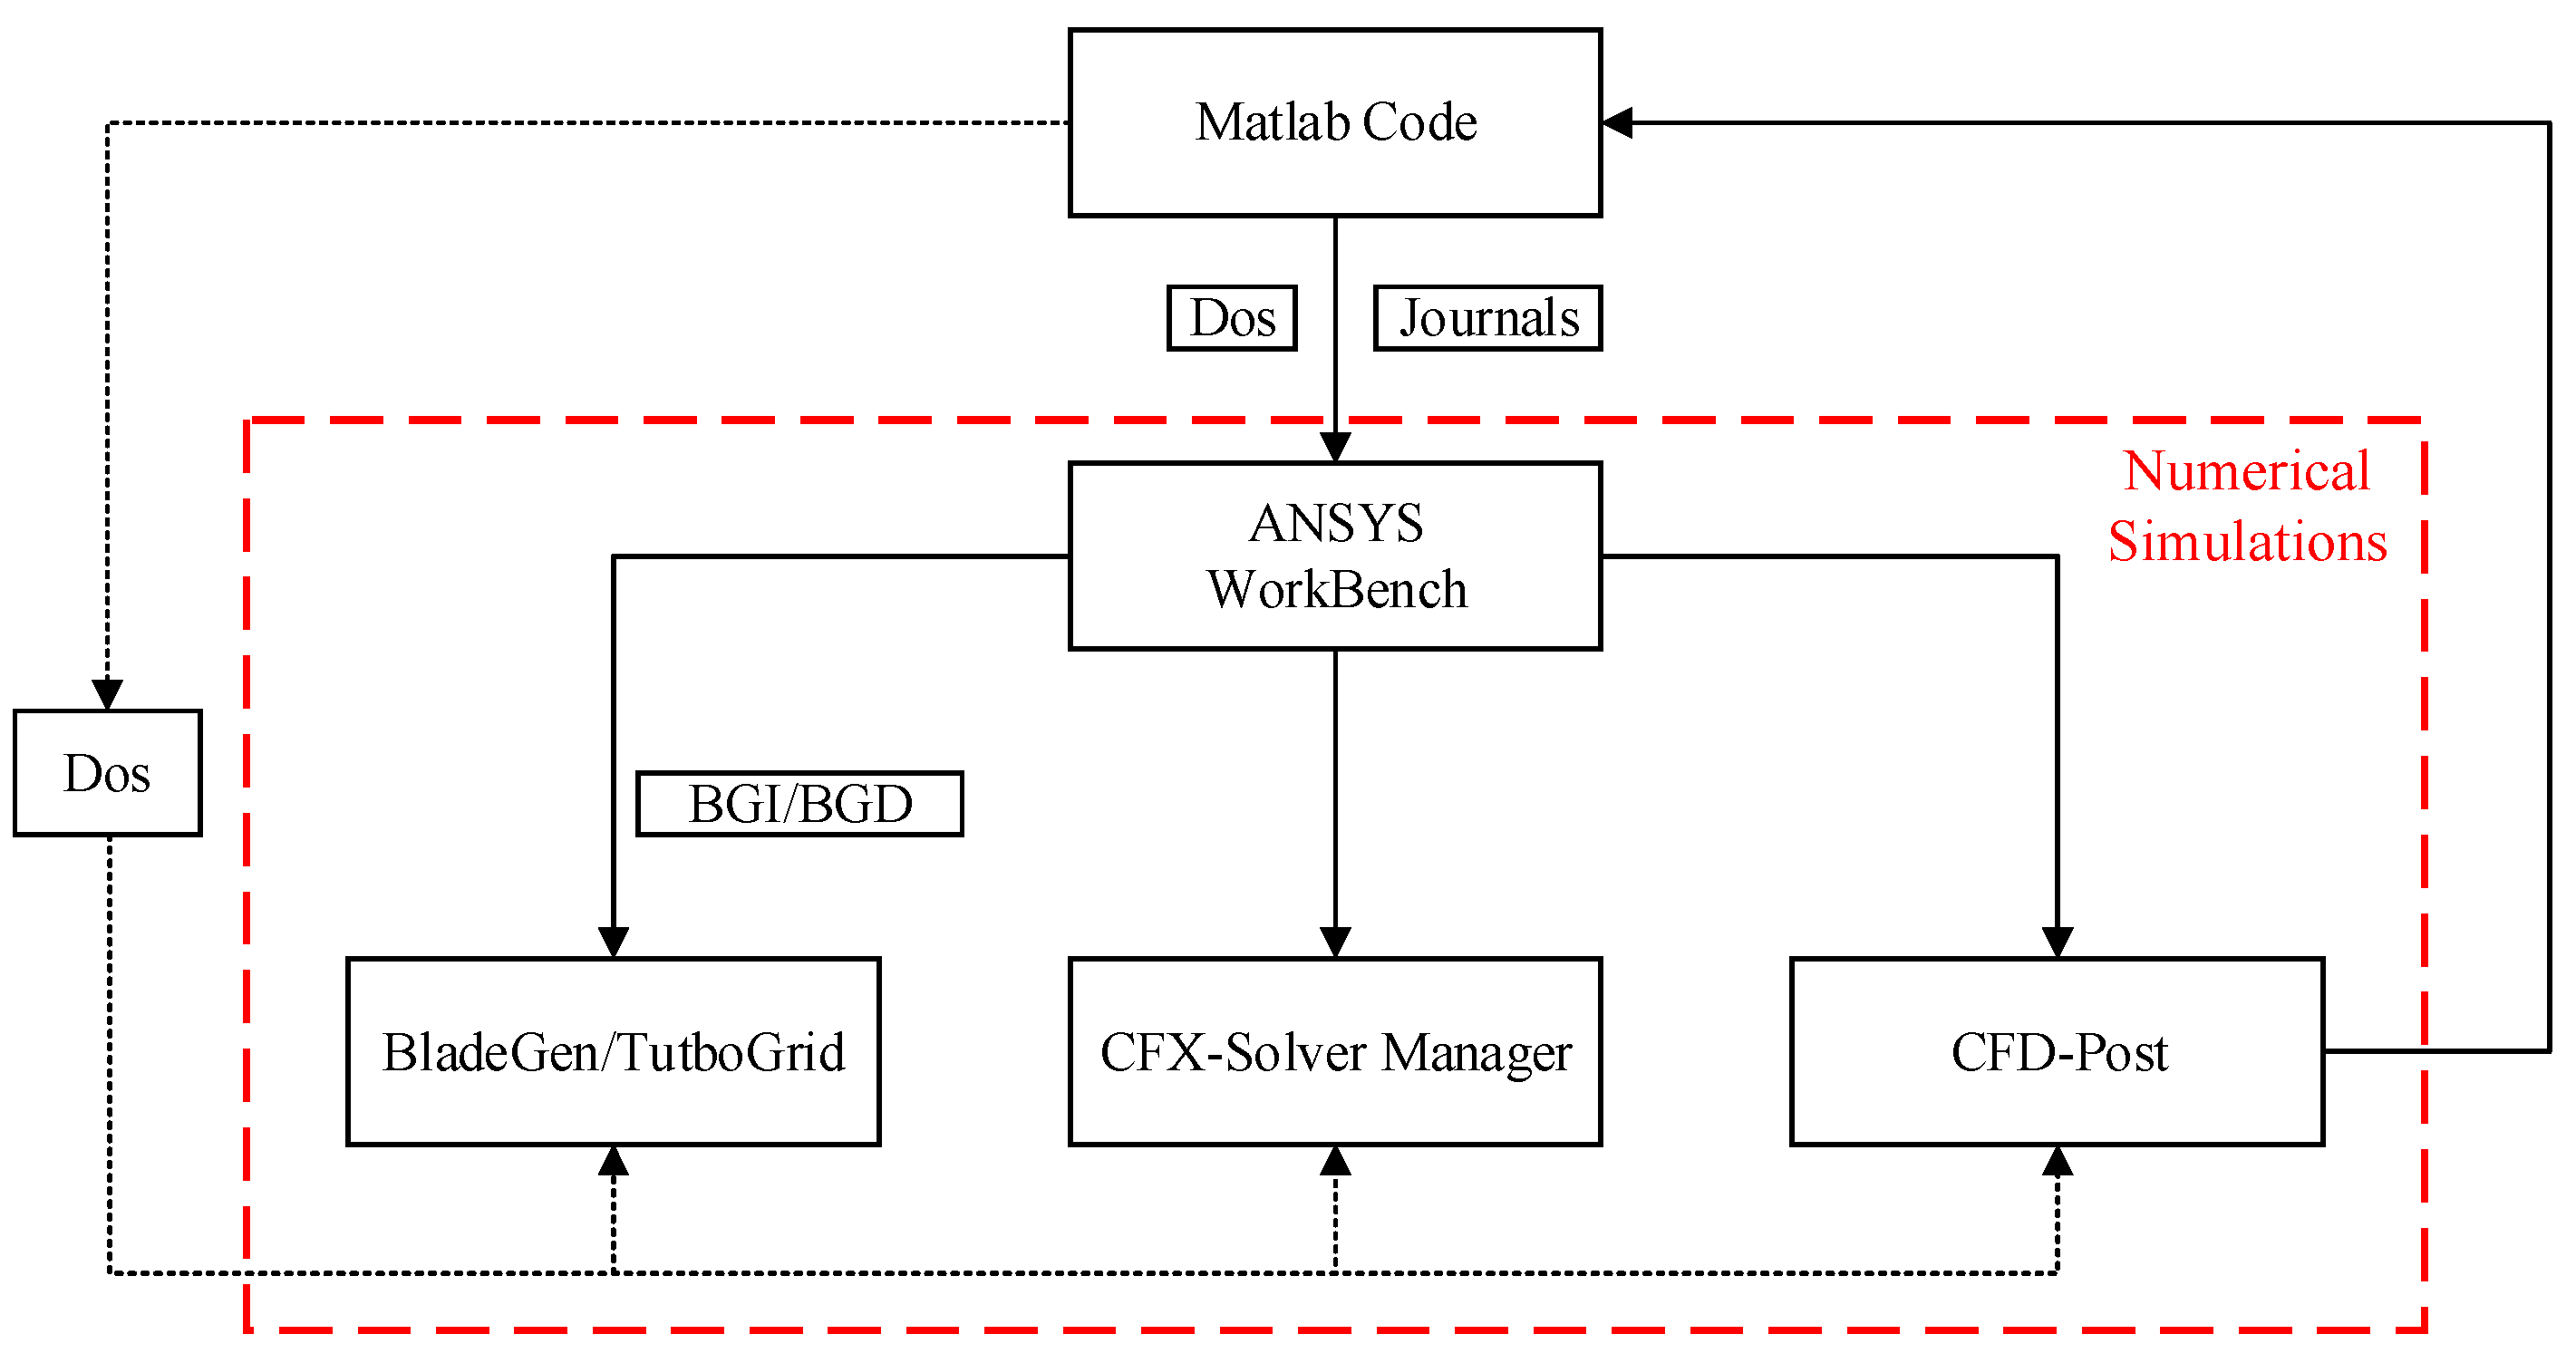
The process control of the numerical simulation is executed by ANSYS WorkBench (WB). The automatic optimization platform uses the improved bat algorithm for optimization [27]. Therefore, he improved bat algorithm is the master control of the entire optimization process, controlling the update of the impeller and guide vanes, the calculation settings of CFX-Solver Manager, and the simulation results of the CFD-Post Data acquisition and optimization process based on numerical simulation results. The schematic diagram of the bat algorithm program control process is shown in Figure 10.
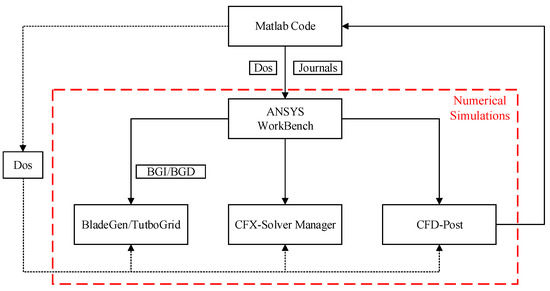
Figure 10.
Schematic diagram of the control process of the improved bat algorithm program.
The main program of the bat algorithm was written using Matlab Code through the Dos command. BladeGen (BG) can record and export all of the information of the current impeller or guide vane in the BGI file. When the parameters of the impeller and guide vanes change during the process of the algorithm, one only needs to modify the corresponding information in the BGI file, and then convert it into a BGD file through BladeBatch.exe and import the BG to generate a new impeller and guide vane. The Dos command to convert a BGI to a BGD file is: “BGI file path” “BladeBatch.exe path” “BGD file target path”. The operations which need to be completed through WB during the algorithm iteration process include: importing the latest impeller and guide vane BGD file into BG to generate the latest 3D model; meshing the latest impeller and guide vane; and importing the latest mesh and generating the calculation file in the CFX module. Write these operations into the Journal file and let RunWB2.exe (the startup software of WB) execute the Journal file through the Dos command, and the above operations can be completed in each iteration.
3.4. Improved Bat Algorithm Settings
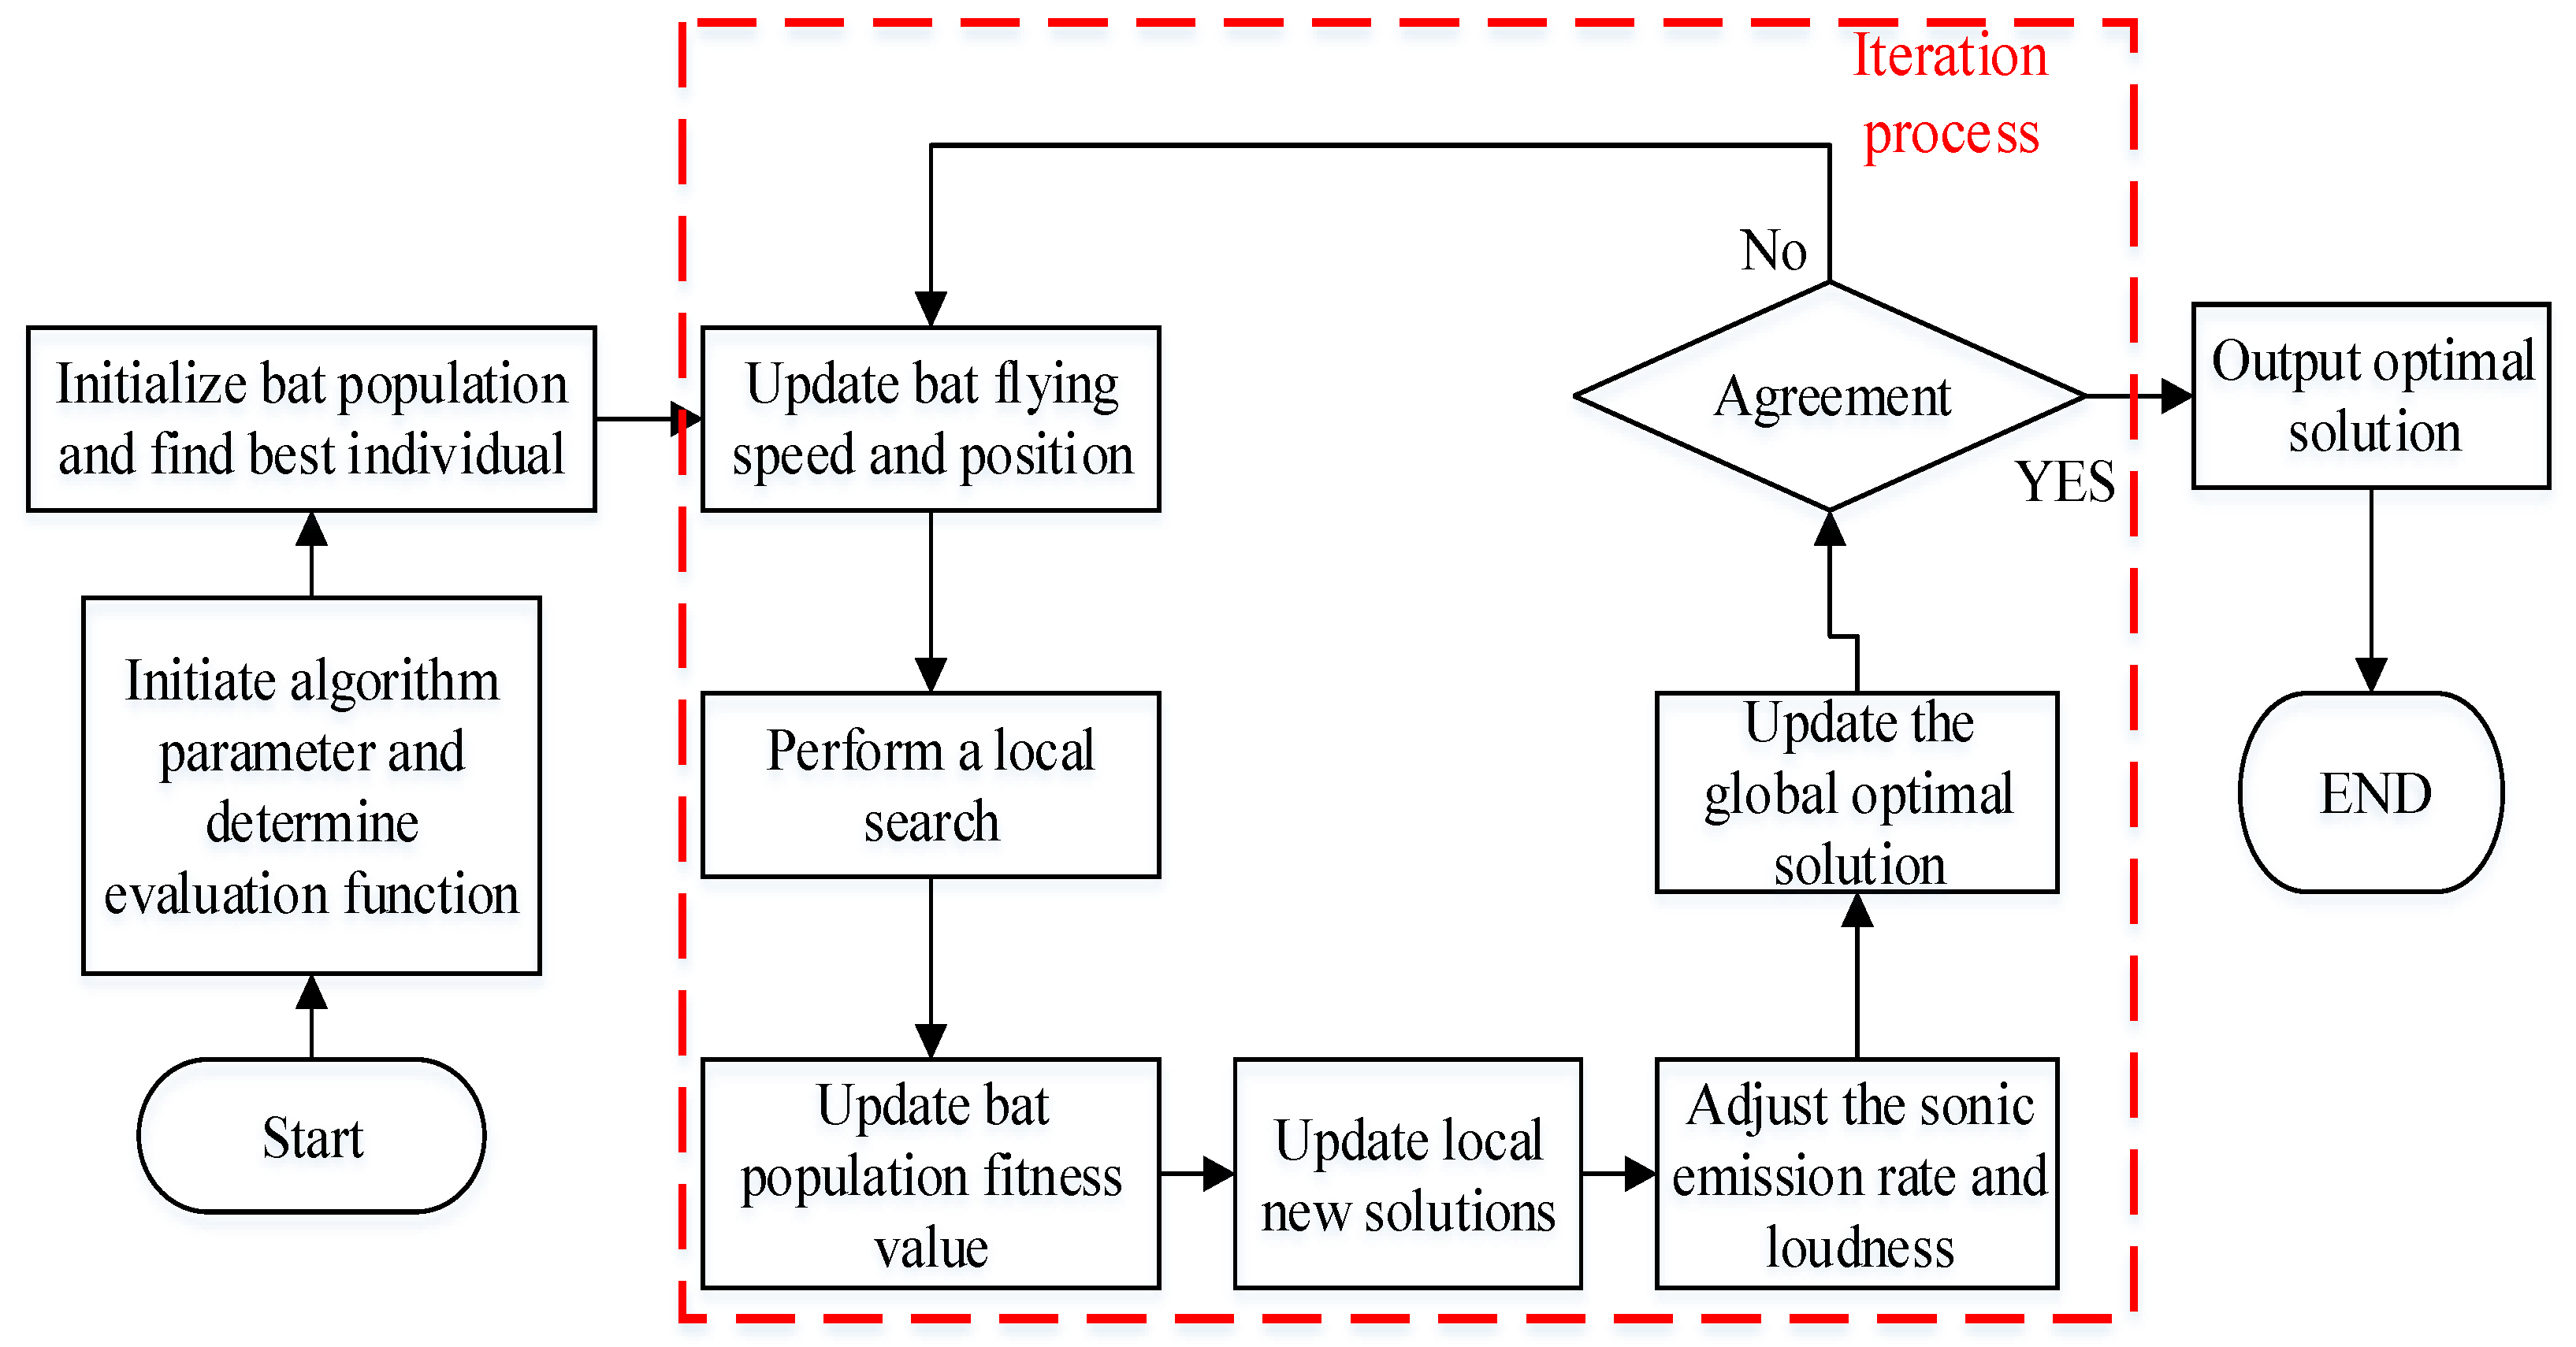
The optimization variables are the design variables, except for the fixed values in Table 3, totaling 18. Therefore, a bat individual is an 18-dimensional vector, and its search domain is defined by the upper and lower bounds of the optimization variables in Table 3. The optimization algorithm adopts the bat algorithm based on a t-distribution local search [28,29]. The basic parameter settings of the algorithm are shown in Table 4. Figure 11 shows the logic diagram of the bat algorithm and its basic execution steps. The bat requires larger flight steps to maintain the population diversity, and smaller flight steps are required to maintain the superiority of their position. The overall step length should be large in the early stage of optimization in order to quickly gather near the optimal value; the overall step length in the later stage of optimization should be small, to prevent them flying out of the optimal circle. In order to meet this demand, the local flight mode is defined as:
where the individual disturbance coefficient, , is a random number which obeys the t distribution; is the step adjustment coefficient of the t distribution; is the average loudness of the sound waves emitted by the bat population at time t; the position of bat i at time t; and is the global optimal position of the bat population. When approaching the true actual optimal value, the flight step size determines the final optimization accuracy. Therefore, it is necessary to fine-tune the step size separately by keeping the flight step length small.
Table 4.
Basic parameter settings of the modified bat algorithm.
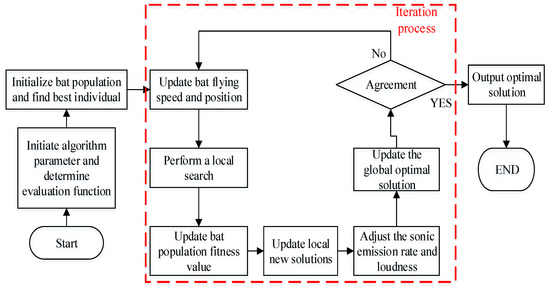
Figure 11.
Logic diagram of basic bat algorithm.
The step adjustment coefficient of Gaussian distribution is the step adjustment coefficient. The basic bat algorithm does not specify the search domain boundary limitation and speed limitation methods. In order to ensure the effectiveness of the local search at the initial stage of the algorithm, and to prevent the bat from missing the optimal value due to excessive speed, the flight speed of the bat must be restricted. The upper limit of the set speed is
The flying speed of the bat is limited to
In the improved bat algorithm, the buffering strategy method is used instead of the absorption method. The buffering method means that when the bat moves to the boundary, it is repositioned to a position near the boundary according to its speed. This not only constrains the position of the bat but also preserves the validity of the position update. This is described as follows:
here, is the ith dimension component of the maximum velocity, is the ith dimension component of the current bat velocity, and rand is a random number between [0,1].
3.5. Verification of Modified BA
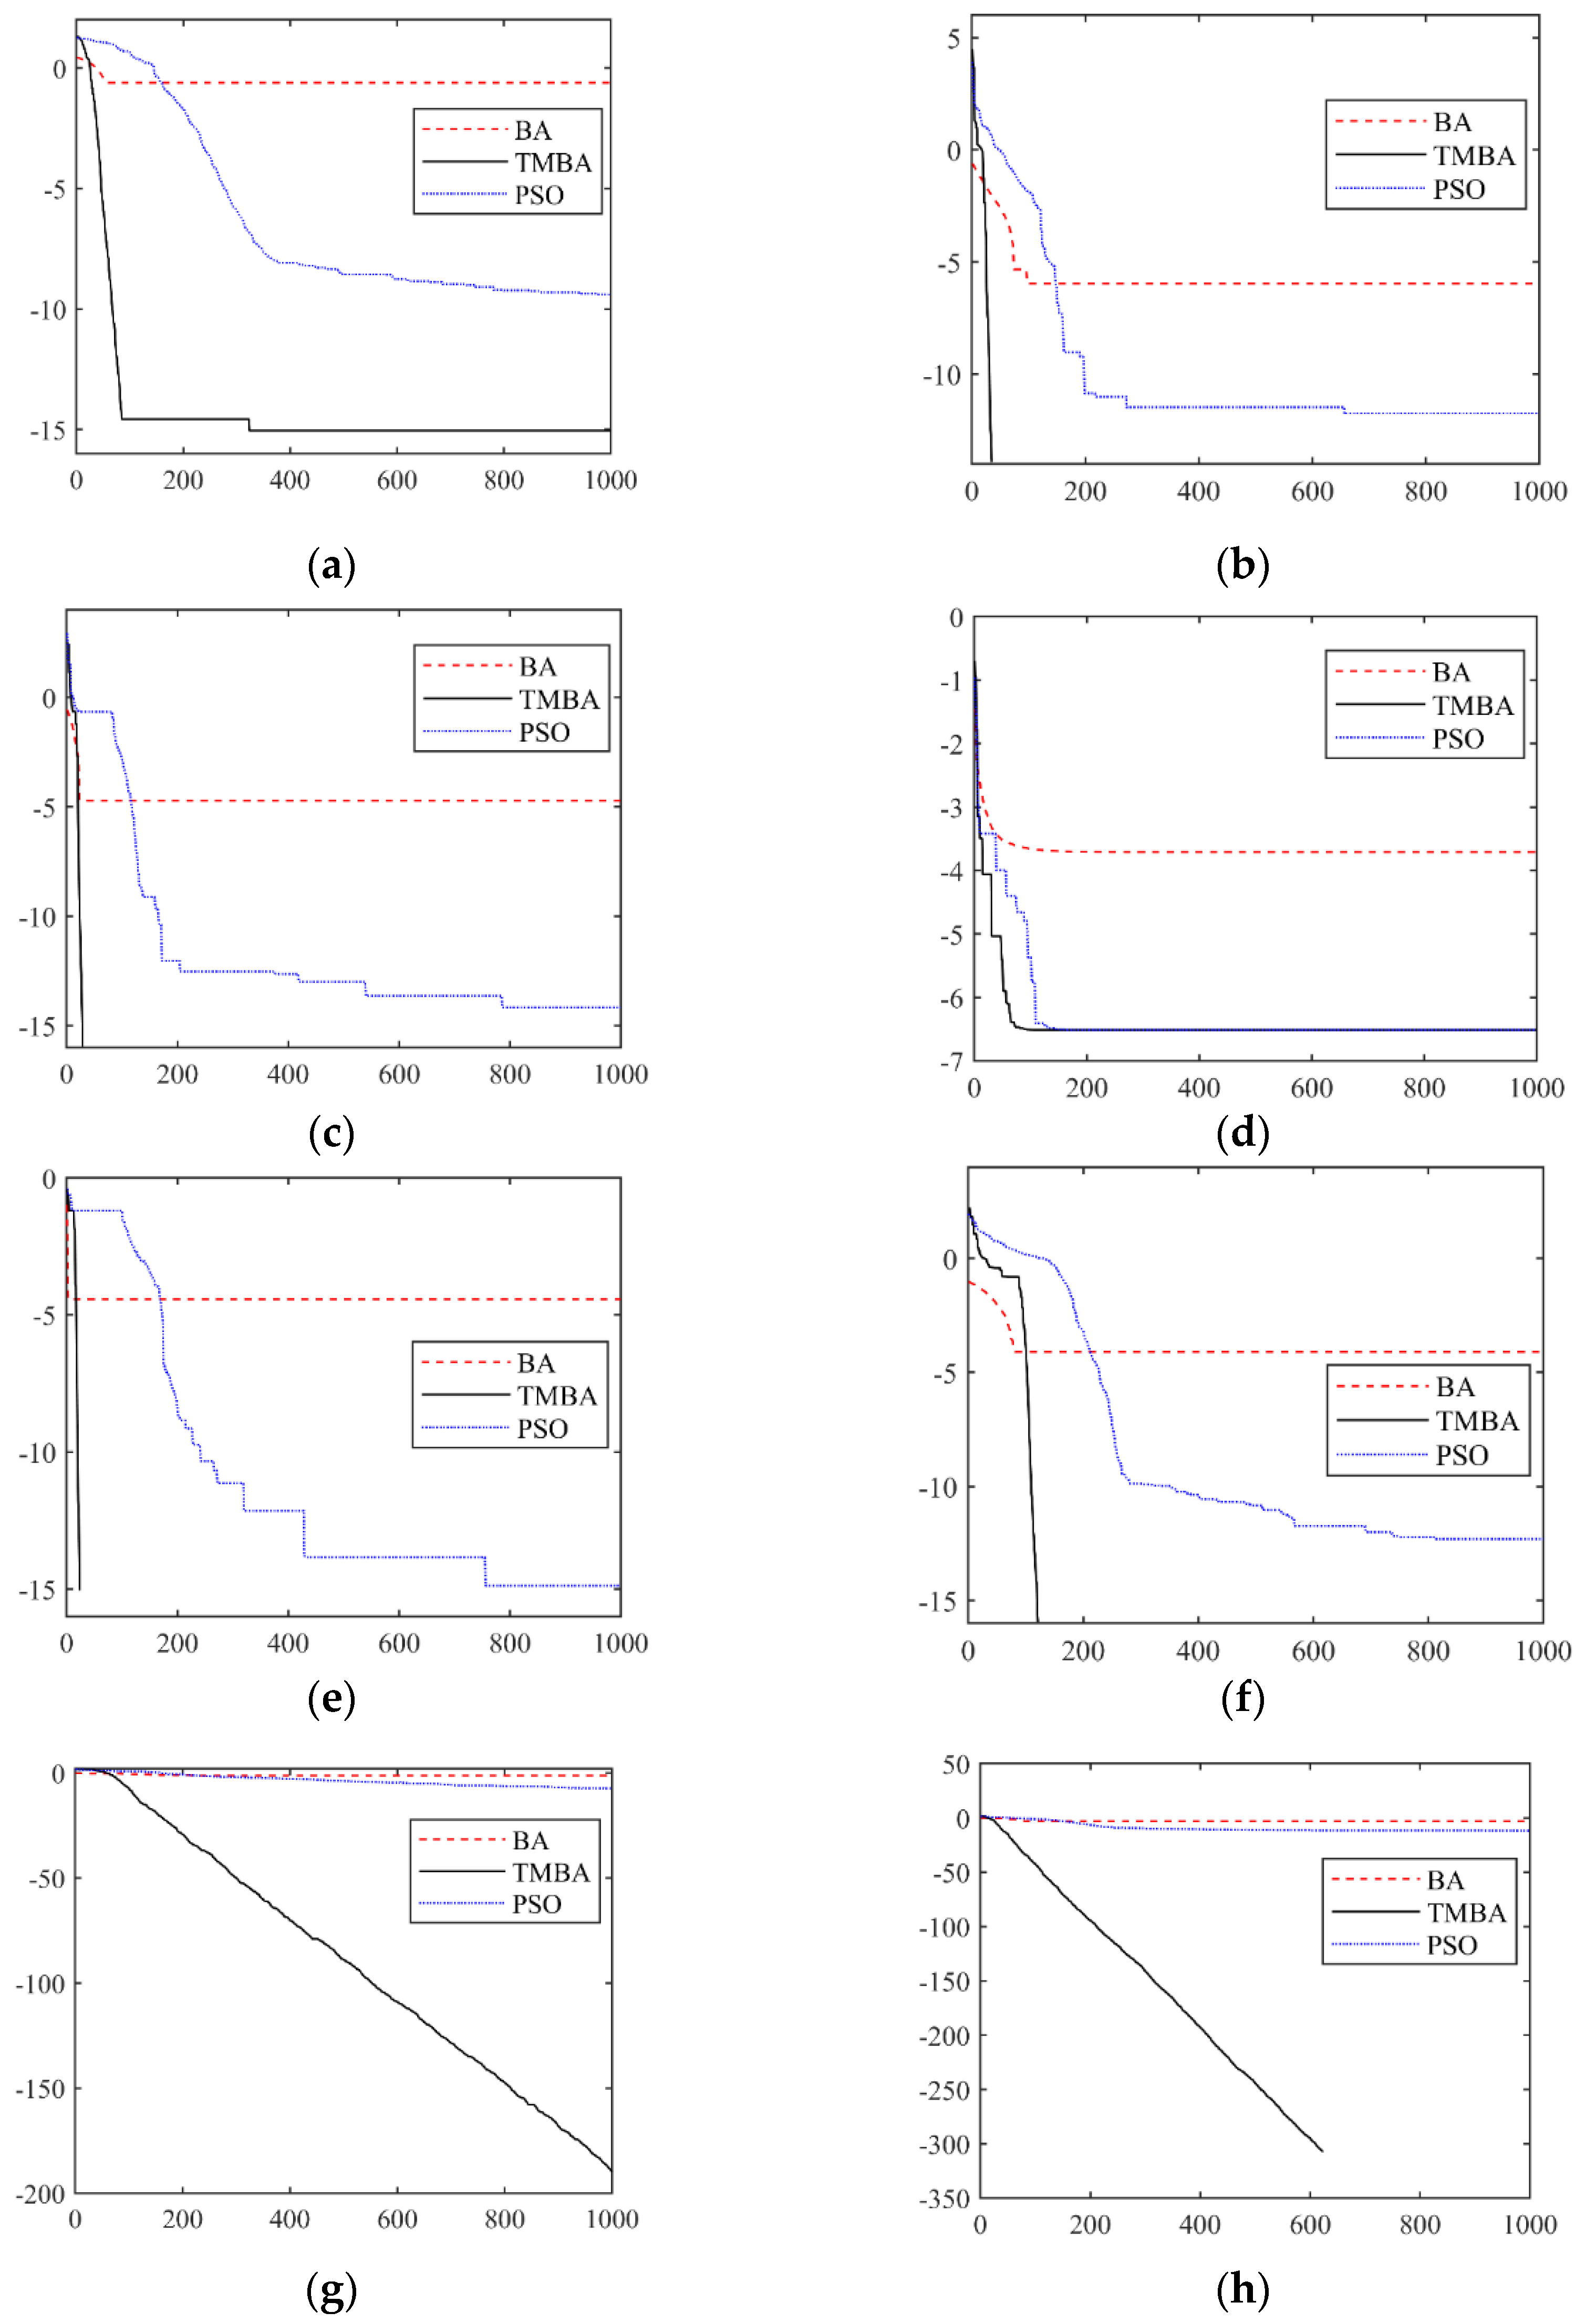
In order to verify the effectiveness of the local search bat algorithm based on t distribution (TMBA), in this section, test functions with different characteristics are selected to test the improved algorithm; at the same time, in order to understand the advantages and disadvantages of the improved algorithm, the test results were compared with the basic bat algorithm (BA) and the particle swarm algorithm (PSO). The convergence process of the three functions in the test function is shown in Figure 12. The abscissa is the number of iteration steps, the ordinate is the logarithm based on 10, and the convergence accuracy is the true number. As the improved bat algorithm reaches a predetermined minimum value in five test functions, the computation satisfies the termination condition, and the image appears as a sudden interruption. The TMBA curve accurately converges to the global optimal value after the accuracy is interrupted. Except for the Cross in Tray Fcn, both the improved bat algorithm and the particle swarm algorithm can quickly converge to a high accuracy; although the PSO algorithm can converge to a higher accuracy, the convergence process is mostly ladder-like, and the optimization has many plateau periods with long steps in the process. However, in the case of convergence to a lower accuracy, the basic bat algorithm was faster than the particle swarm algorithm in most of the test functions. The reason may be that the global–local search balance strategy based on the acoustic emission rate and loudness in the early stage of the bat algorithm is beneficial to the early stage of the bat.
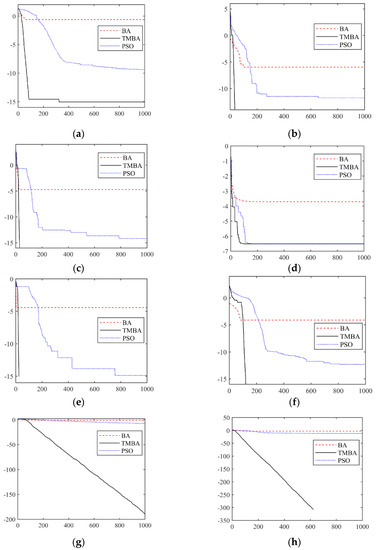
Figure 12.
Trend of the convergence accuracy in the optimization process. (a) Ackley 1 Fcn; (b) Bartels Conn Fcn; (c) Bohachevsky 2 Fcn; (d) Cross in Tray Fcn; (e) Drop Wave Fcn; (f) Griewank Fcn; (g) Schwefel 2.21 Fcn; (h) Sphere Fcn.
In actual engineering, the efficiency of global optimization is particularly critical. Achieving higher accuracy in a shorter iteration step is beneficial to the shortening of the calculation period and saving calculation resources. Due to the local search and step adjustment strategy of the improved bat algorithm, the bat can quickly jump out of the local extremum and continue to optimize the process, such that the improved bat algorithm can quickly converge in the early stage of the iteration and avoid an obvious plateau period.
After comparison, it was found that the improved bat algorithm has good adaptability and robustness, the convergence accuracy in the high-dimensional functions was greatly improved, and the convergence speed was accelerated.
4. Results
4.1. Structure Improvement of the Positive Guide Vane
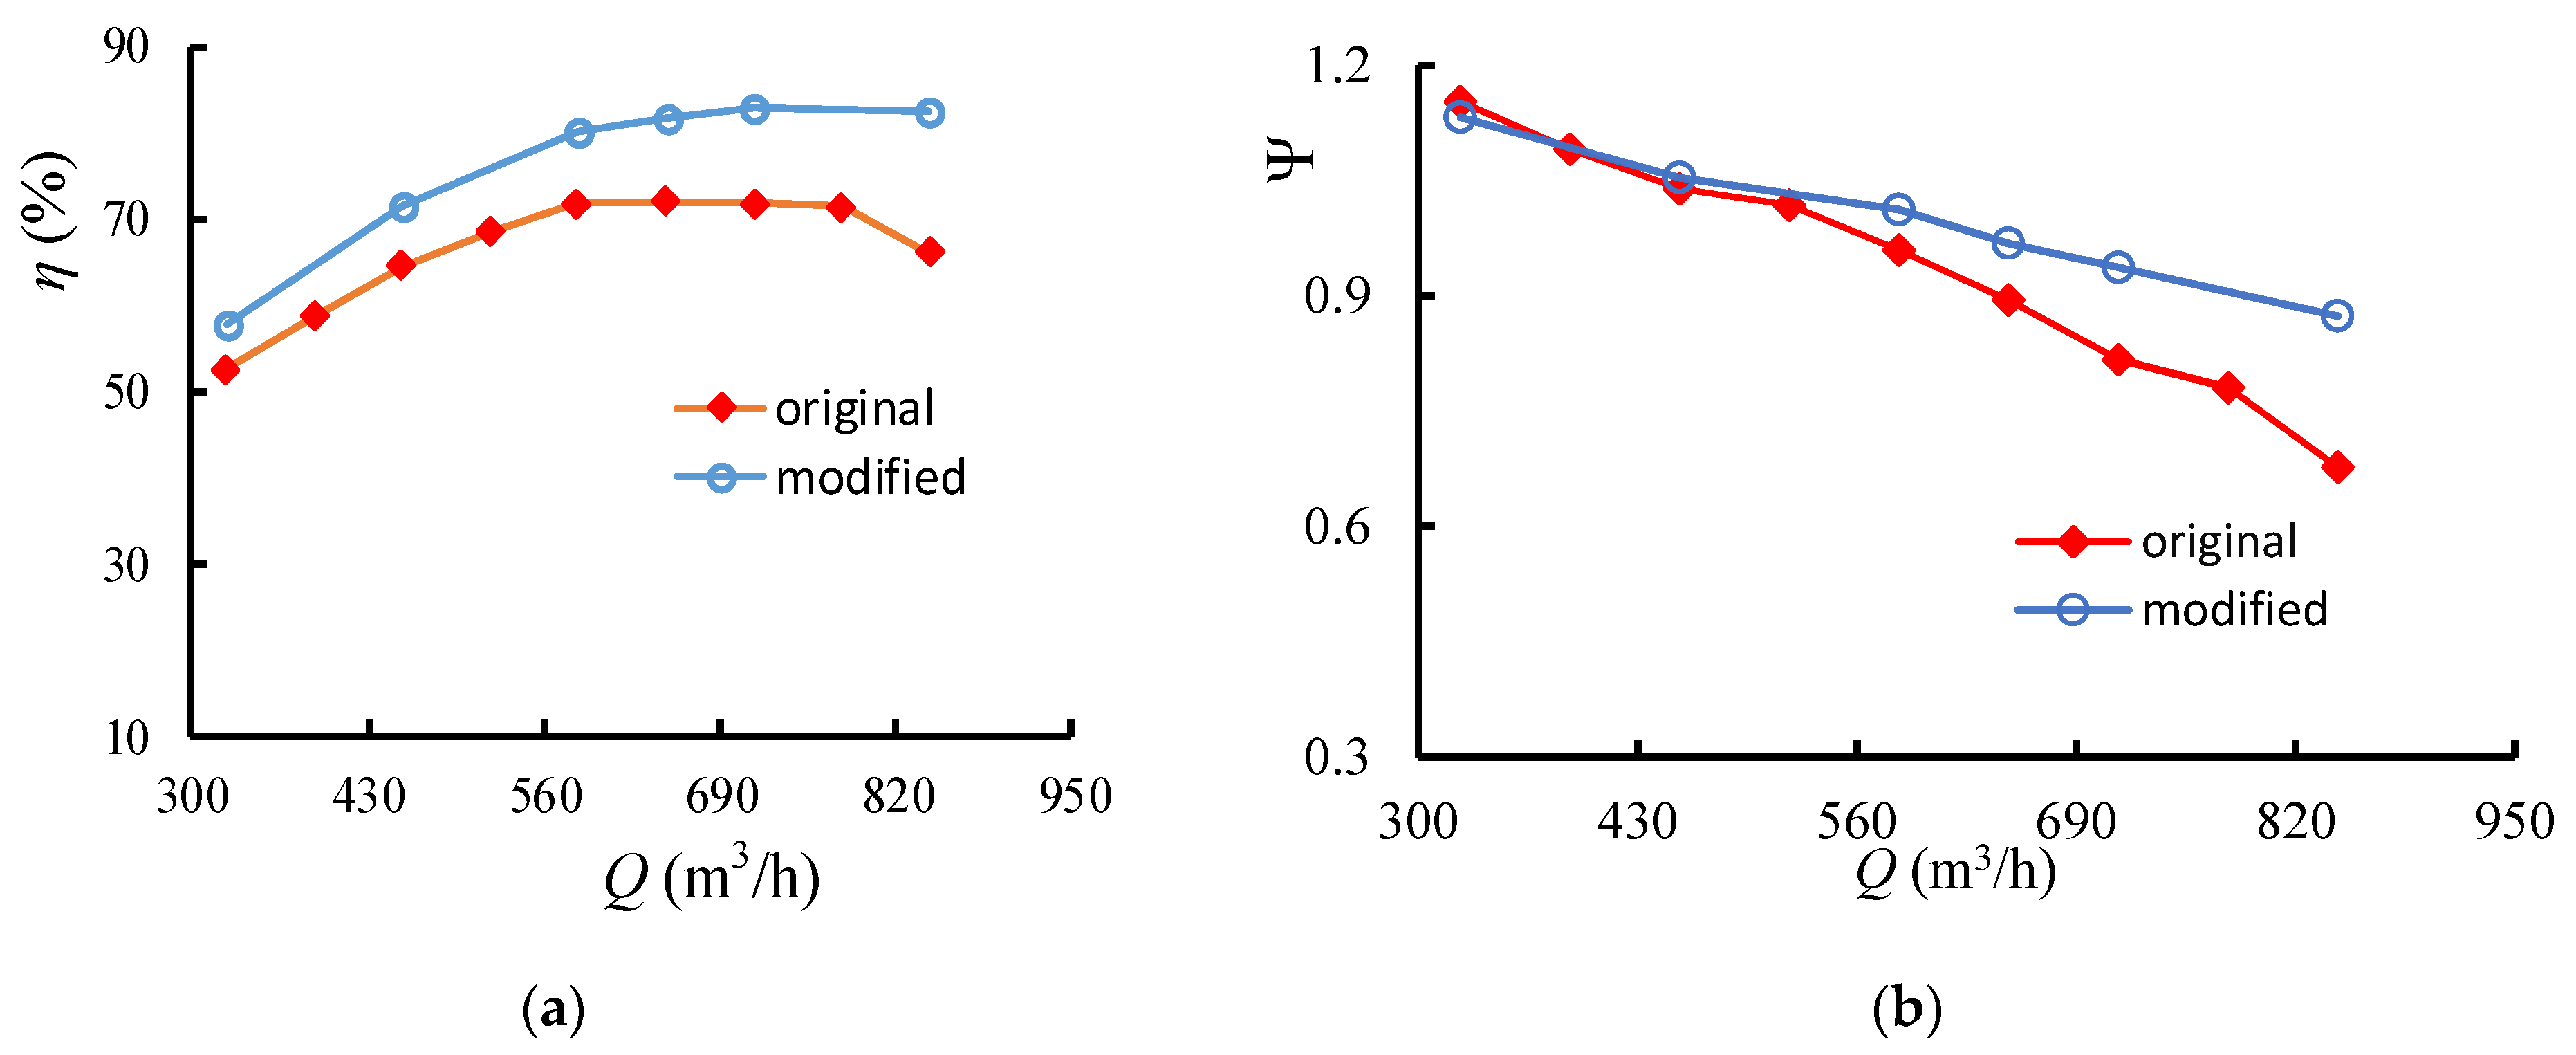
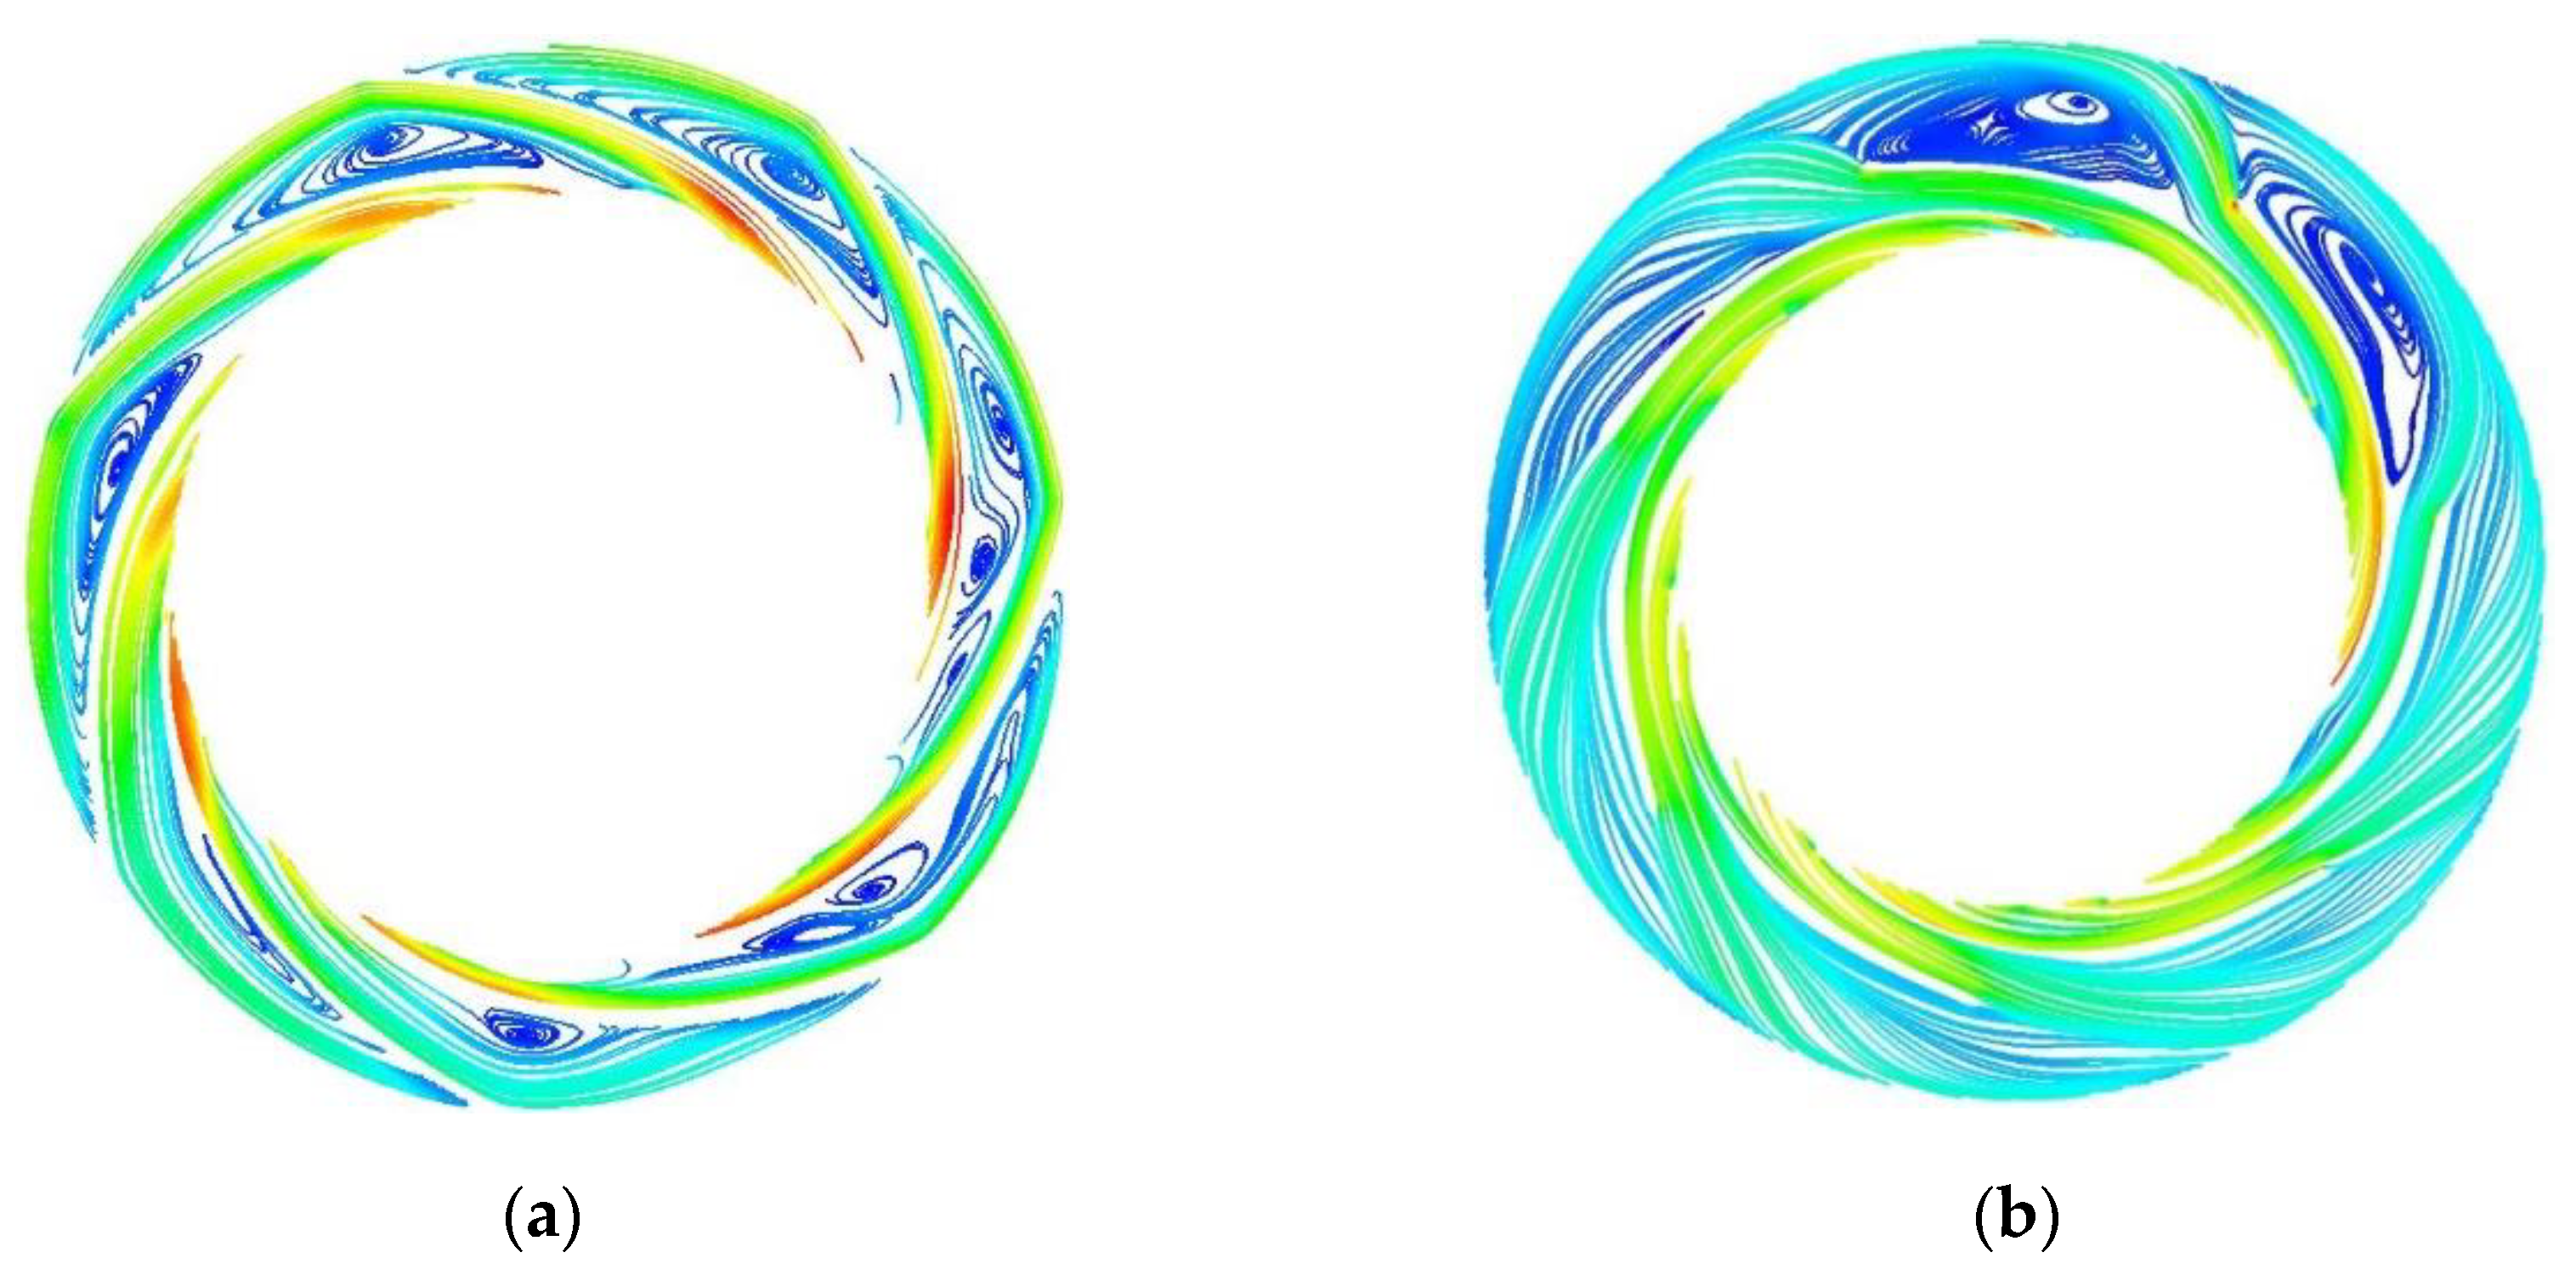
The efficiency comparison curve between the improved model and the original model is shown in Figure 13. After modifying the positive guide vane structure, the efficiency was improved in both the rated design and non-design flow conditions, particularly under the high flow conditions. The head however remained consistent under small flow, with a marginal increase under high flow conditions. The streamline distribution of the positive guide vane flow domain was further examined and compared before and after the structural improvement in Figure 14. Figure 14b shows the streamline distribution in the positive guide vane of the improved structure. Although there are still large vortices at the exits of two flow passages, the flow separation at the exits of the remaining five flow passages was greatly reduced, and the overall flow distribution was relatively uniform compared with Figure 14a. Furthermore, the improved positive guide vane flow channel is more closely fitted to the blade wall without obvious separation and backflow. The new structure may reduce the flow loss, thereby improving the efficiency, and hence the structural improvement achieved the expected effect.
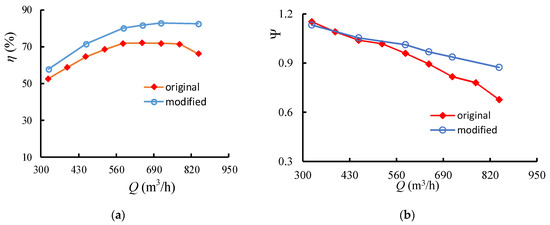
Figure 13.
Efficiency and head comparison of the original and modified guide vane structures. (a) Efficiency comparison; (b) head comparison.
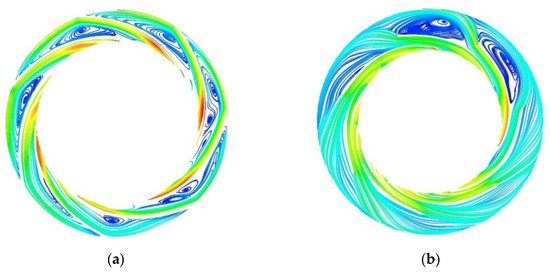
Figure 14.
Streamline distribution before and after the guide vane structure improvement. (a) Original structure; (b) improved structure.
4.2. Matching Optimization of the Improved Structure
The structural modification of the single-stage achieved satisfactory results. The modified guide vane structure was applied to the first stage and the second stage in order to verify its performance under the condition of the inter-stage matching effect. The calculation domain for the impeller–guide vane matching optimization is shown in Figure 15a, and the calculated external characteristic curve is shown in Figure 15b. The rated efficiency was close to 81.65% in the single stage; however, the efficiency is reduced under high flow conditions. Because the improved guide vane model has better performance, the subsequent automatic optimization of the matching effect based on an improved bat algorithm is carried out on this model.
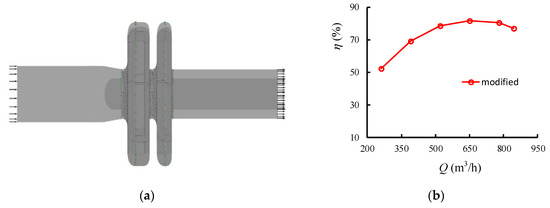
Figure 15.
Secondary calculation domain of the diffuser with a new structure. (a) Calculation domain; (b) efficiency curve of the improved structure.
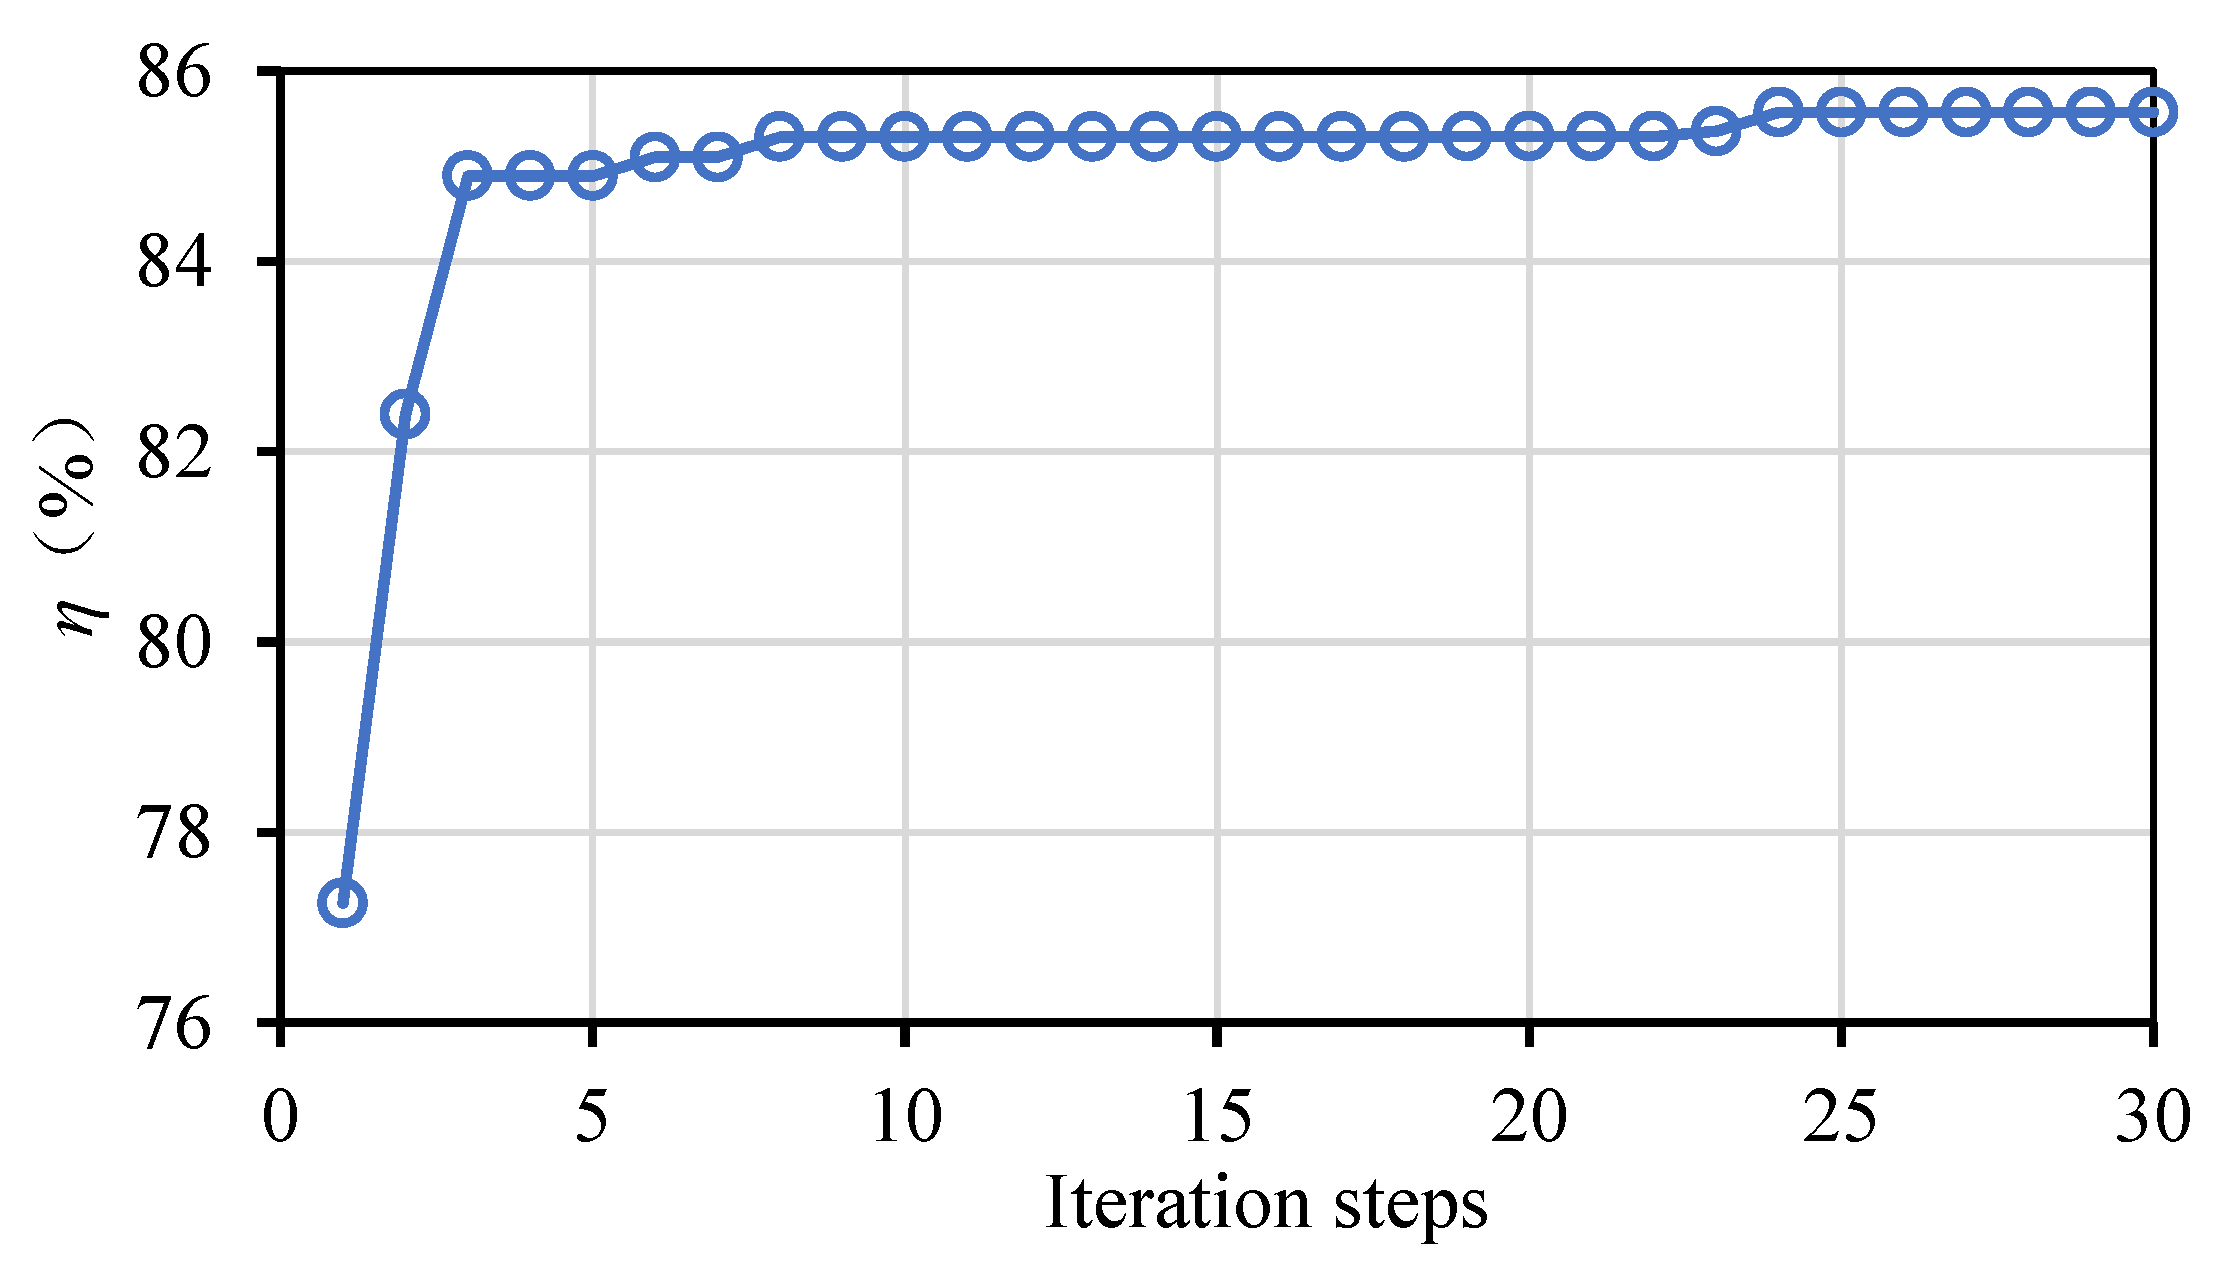
In the optimization process of the improved bat algorithm, the optimization goal is to improve the hydraulic efficiency in the design conditions. Figure 16 is the efficiency optimization process of the multi-stage pump with the improved guide vane structure. Similar to the algorithm test, the global search speed is very fast in the early stage, and the bat quickly approaches the optimal value. It can be seen that, after three iterations, the efficiency increased from 77.26% in the initial generation to 84.89%, and then it entered the stage in which local optimization was dominant. The bat flies in a small step near the optimal value, and the optimization range is reduced. After 25 iterations, the efficiency becomes stable, and the global optimal solution of the 30th iteration, 85.57%, is taken as the final optimization result. The optimized variable values of the optimization result and the corresponding external characteristic data (two-stage pump section model) are shown in Table 5.
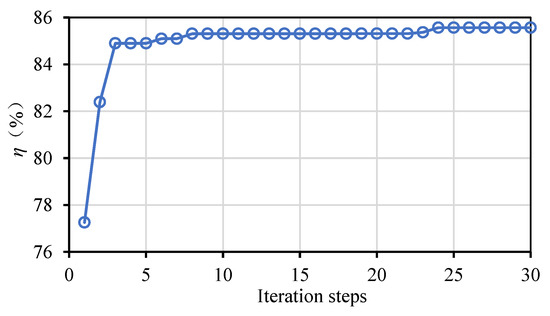
Figure 16.
Efficiency change process in the optimization process.
Table 5.
Design variables and external characteristic data of the optimal solution.
4.3. Analysis of the External Characteristics
Numerical calculations were performed for the design and off-design conditions, and the external characteristics were determined. Figure 17 is a comparison of the external characteristic test between the final optimal solution and the optimal starting point (structure modification). Compared to the optimization starting point, the efficiency of the final optimized model in the low flow conditions and design conditions improved significantly. At the design point, there was a 3.98% increase in efficiency, and the maximum increase of 4.75% occurred at 0.8Q. In the high flow conditions, the efficiency of the optimized model had a significant drop. At 1.2Q, the efficiency of the optimized model was lower than that of the original model. On the head curve, the heads near the design conditions were similar, and there was a slight increase in the design conditions. The head decline rate under the high flow conditions was faster than that of the original model, and there was a large gap under the 1.3Q design flow conditions.
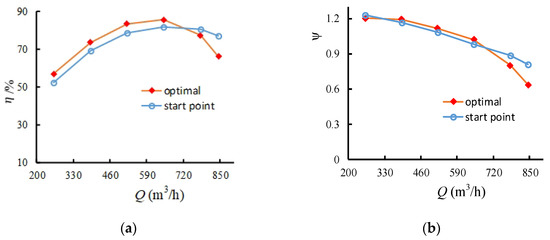
Figure 17.
External characteristics of the optimal solution and optimal start point. (a) Efficiency comparison; (b) head comparison.
In general, because the optimization objective is set to improve the efficiency under the design flow conditions, this optimization achieved the optimization goal. At the design and near-design operating points, both the efficiency and head were improved to a certain extent, indicating that the automatic algorithm based on the improved bat algorithm optimization is suitable for multi-stage pump efficiency optimization. However, the performance of the optimization model under high flow conditions declined, which means that the automatic optimization method would require further improvement.
4.4. Internal Flow Analysis
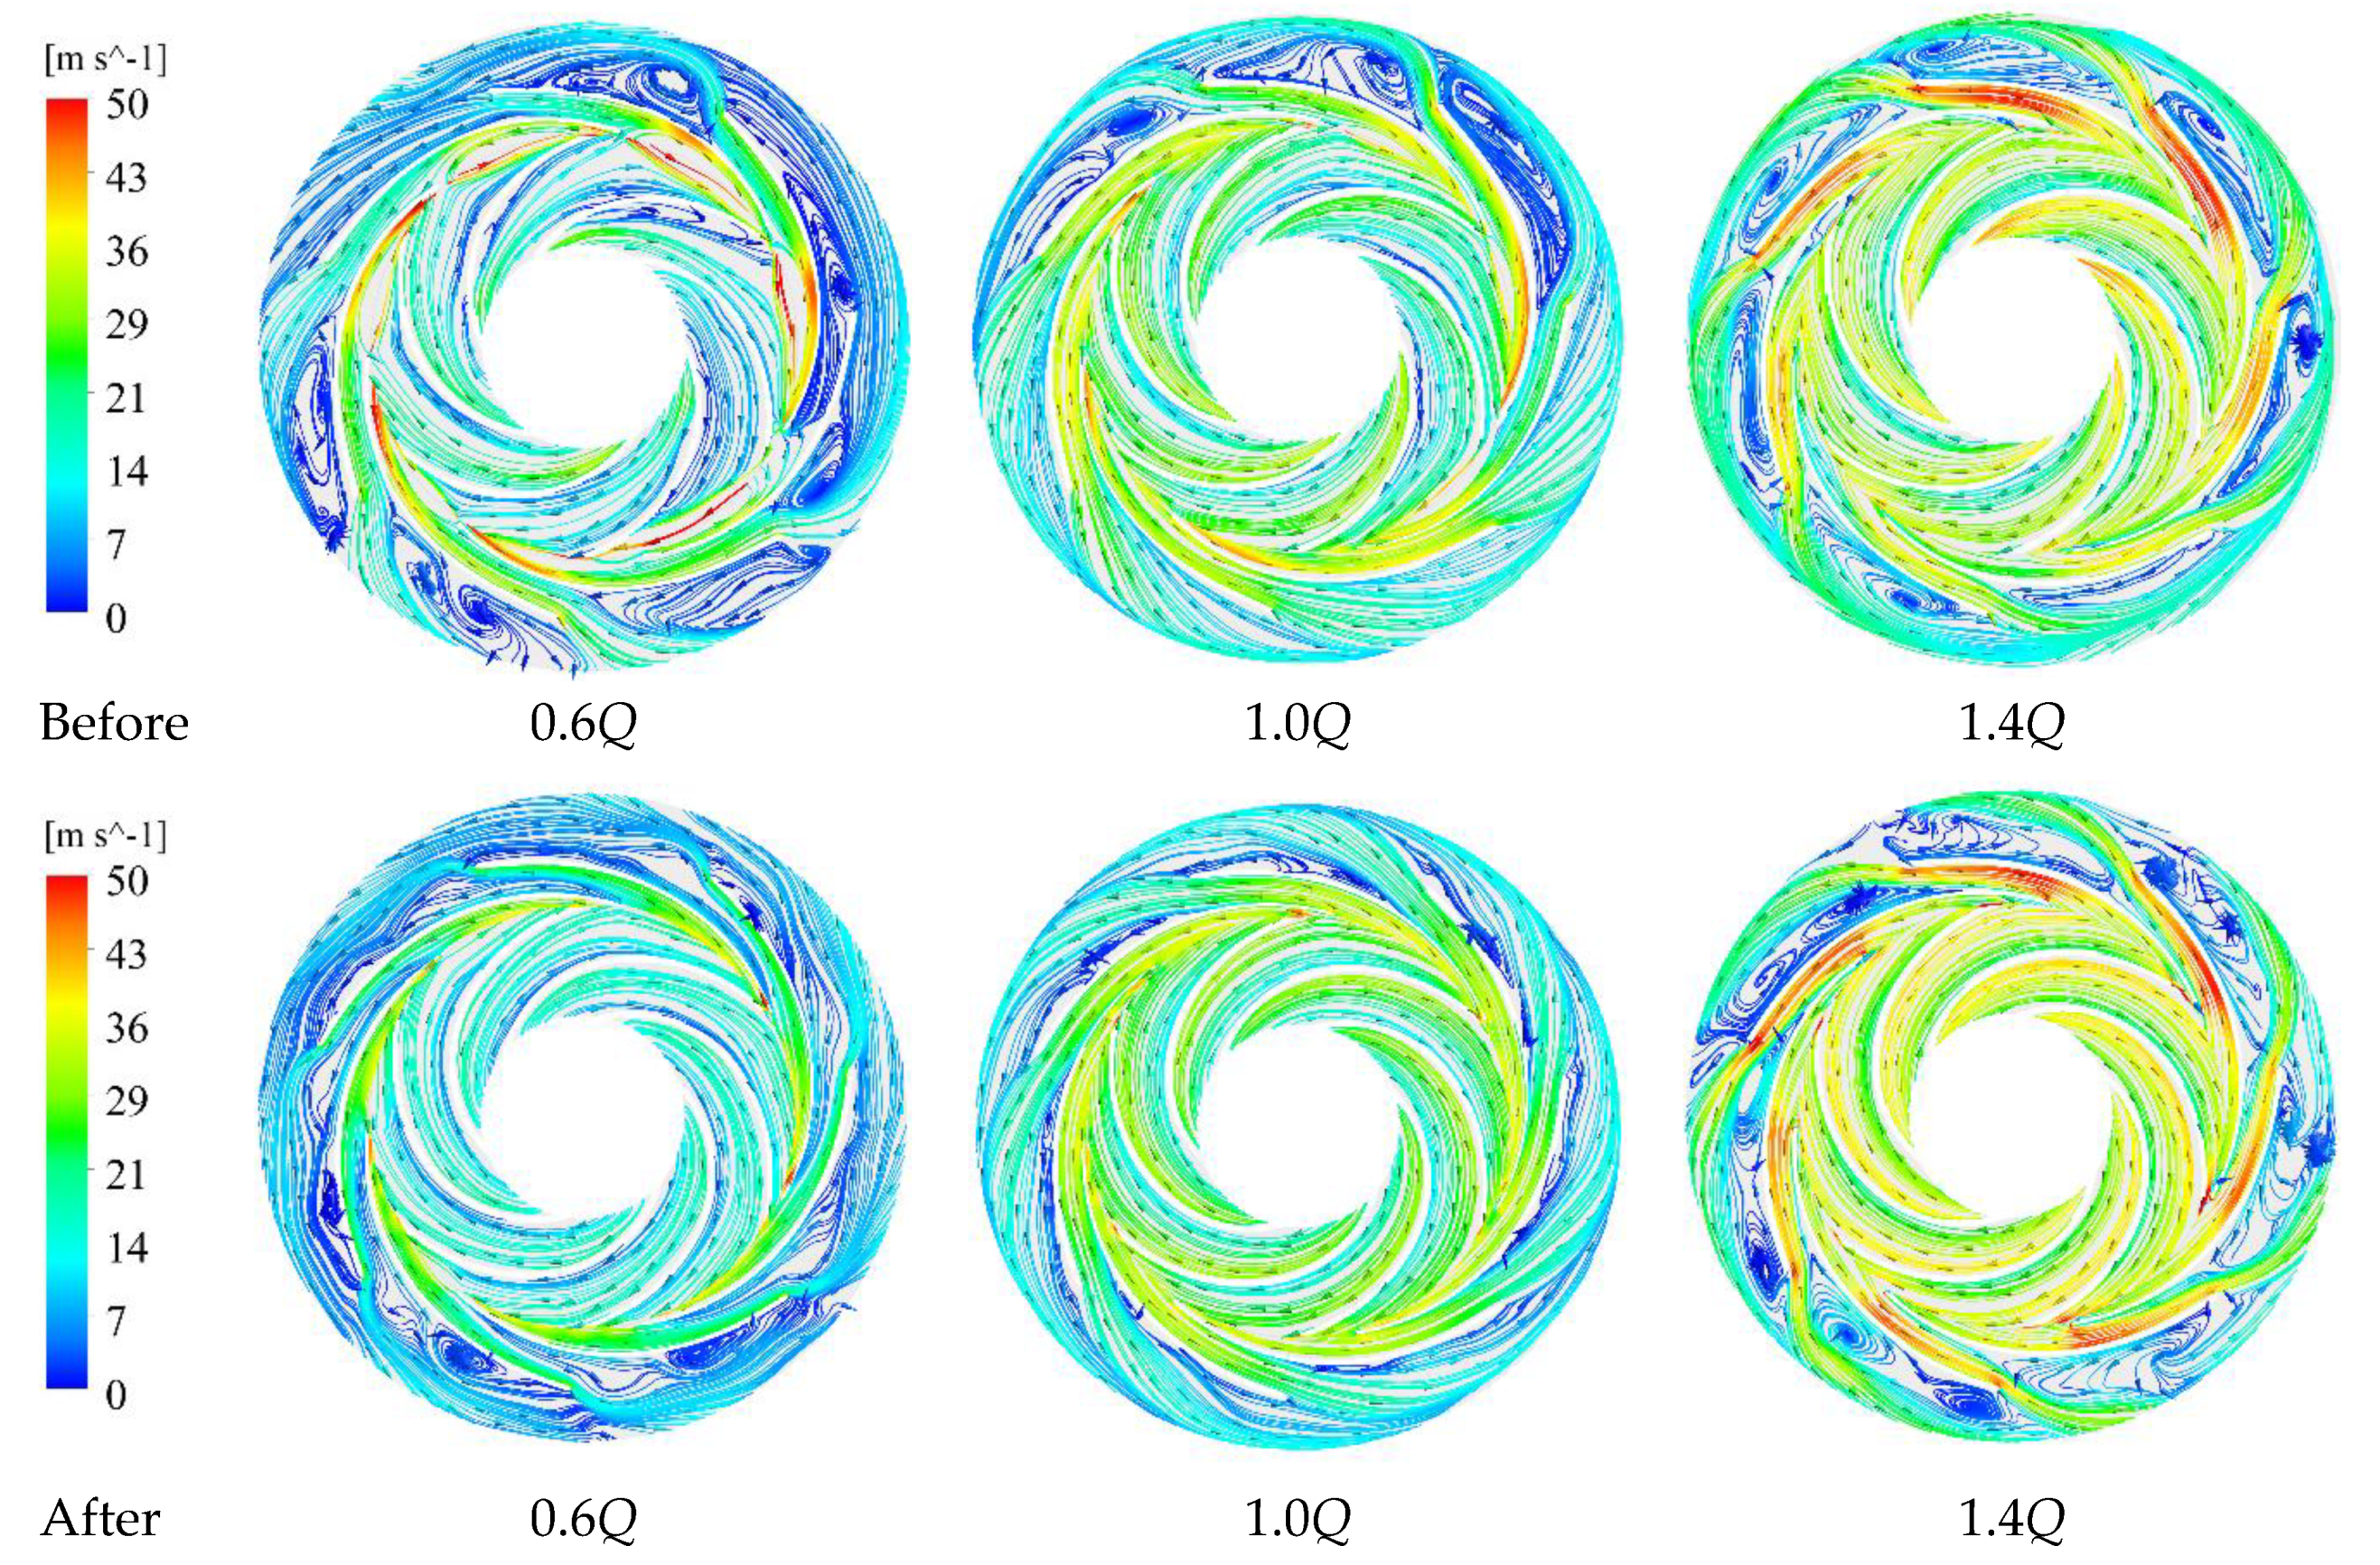
Figure 18 shows the comparison of the streamline distribution of the first-stage impeller-guide vane before and after optimization at different flow rates. At 0.6Q, the backflow and flow separation in some part of the impeller-guide vane was reduced significantly after the optimization. The reason may be that the curvature of the front half of the optimized impeller blade is greater than that of the optimized front impeller, which is more suitable for the inflow conditions of the impeller, such that the fluid entering the impeller fits the wall more closely. The flow in the guide vane is significantly improved at 0.6Q. The vortex at the exit of the improved guide vane channel is significantly smaller and the number is reduced. Under the design conditions, all of the large-size vortices in the improved model disappeared, replaced by the secondary flow at the end of each guide vane, and a small backflow caused by the squeezing of the main flow. In the overload conditions, the flow situation of the optimized model deteriorated. The reason may be that the wrap angle of the guide vane was reduced after optimization, which makes the liquid leave the blade prematurely, and generates more and larger vortices under the action of the pressure difference and shear stress.
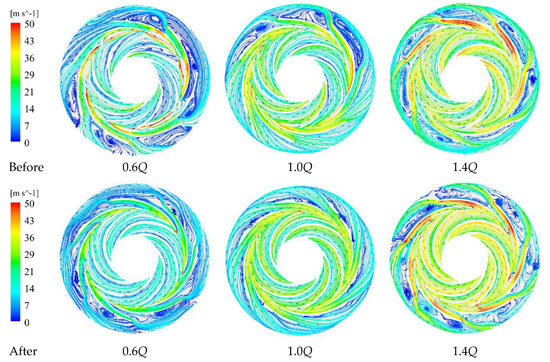
Figure 18.
Streamline distribution of the first-stage impeller-guide vanes.
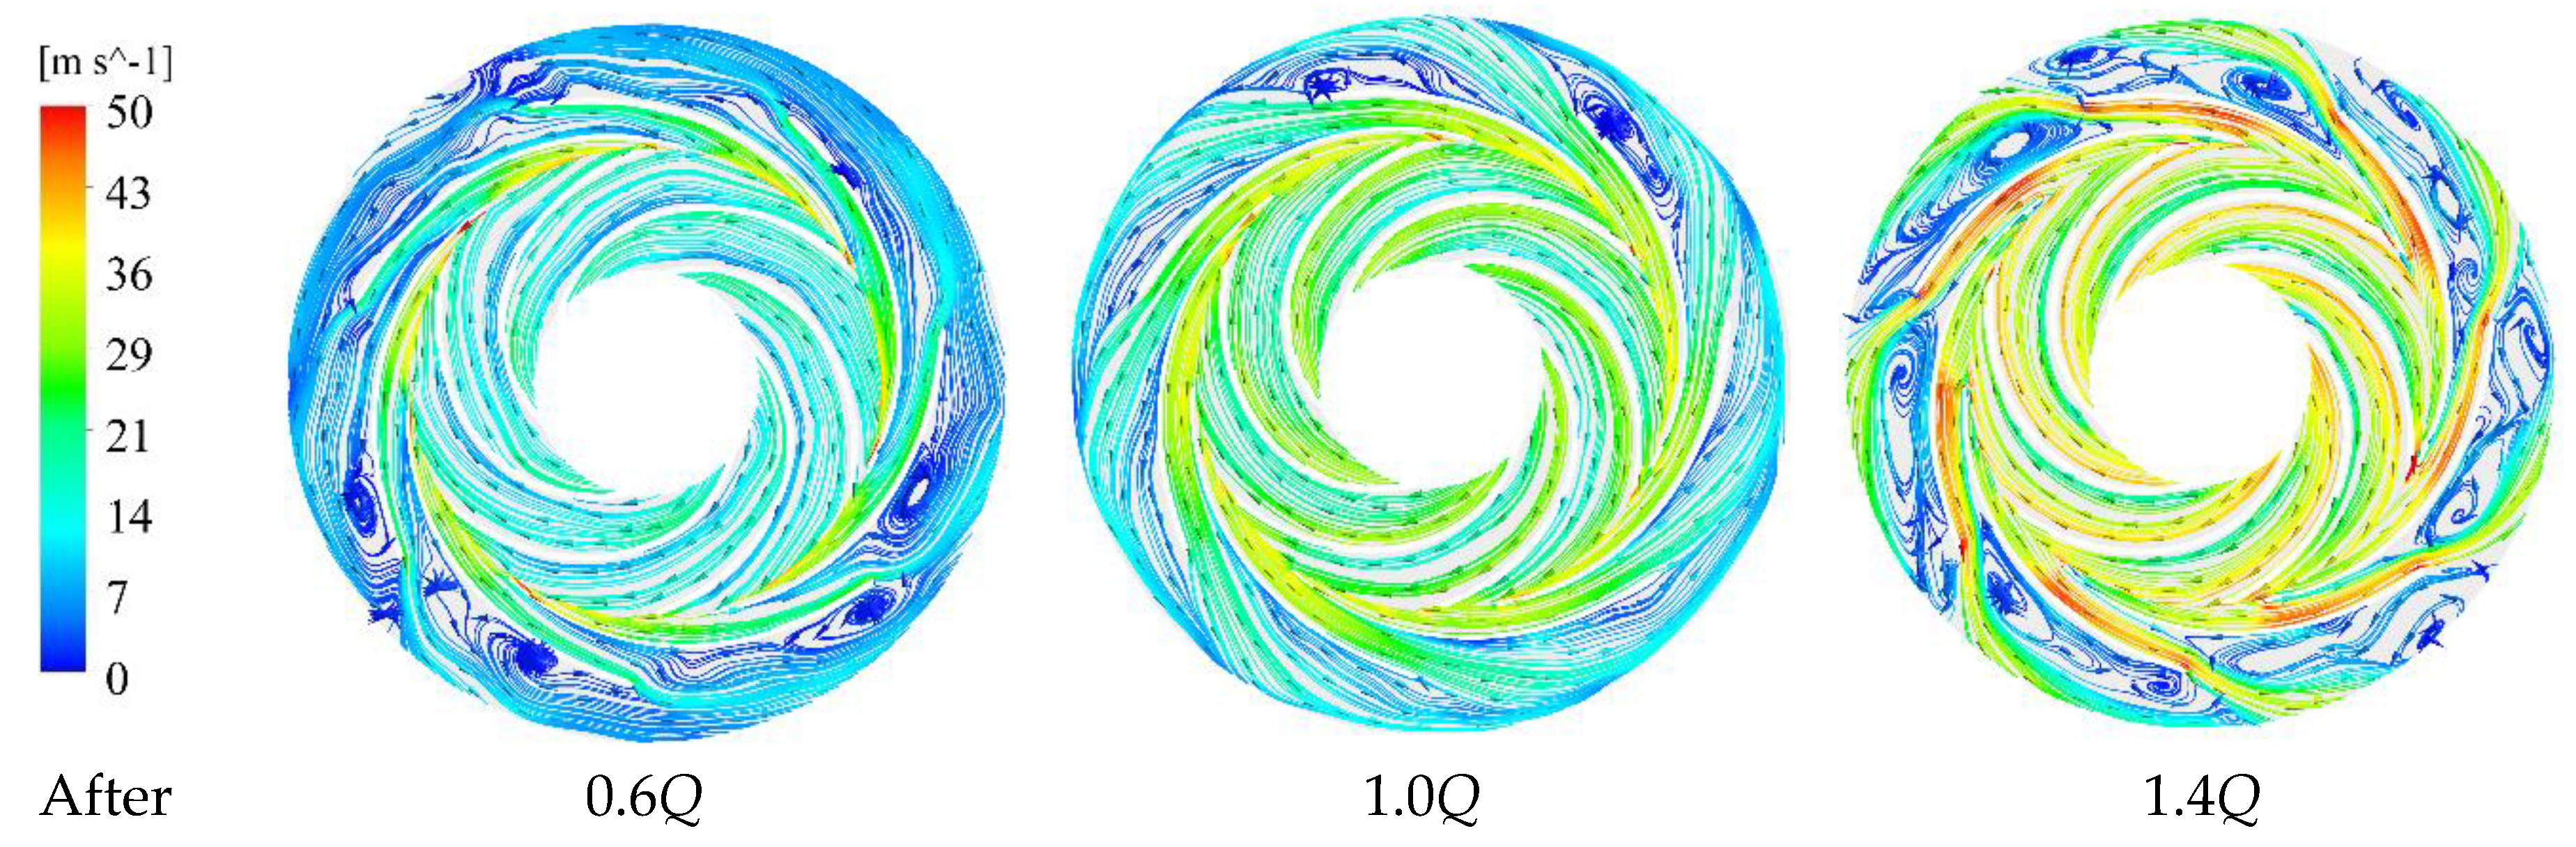
Figure 19 shows the streamline distribution of the second stage impeller and the guide vane at different flow rates before and after optimization. The comparison is similar to the first stage. The overall internal flow is improved at 0.6Q. There is a certain degree of negative optimization in the case of high flow. Overall, at 0.6Q and at the design flow point, the optimized model performed better in the secondary stage than the primary stage, while the model before optimization did not.
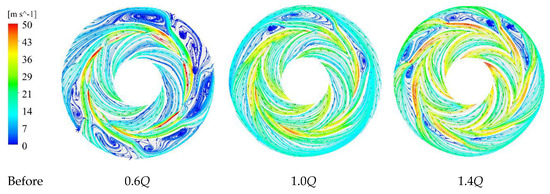
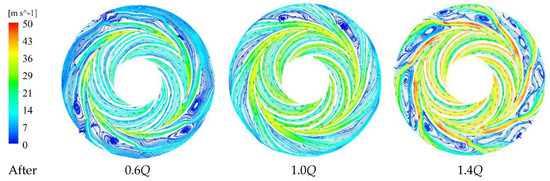
Figure 19.
Streamline distribution of the secondary impeller-guide vane.
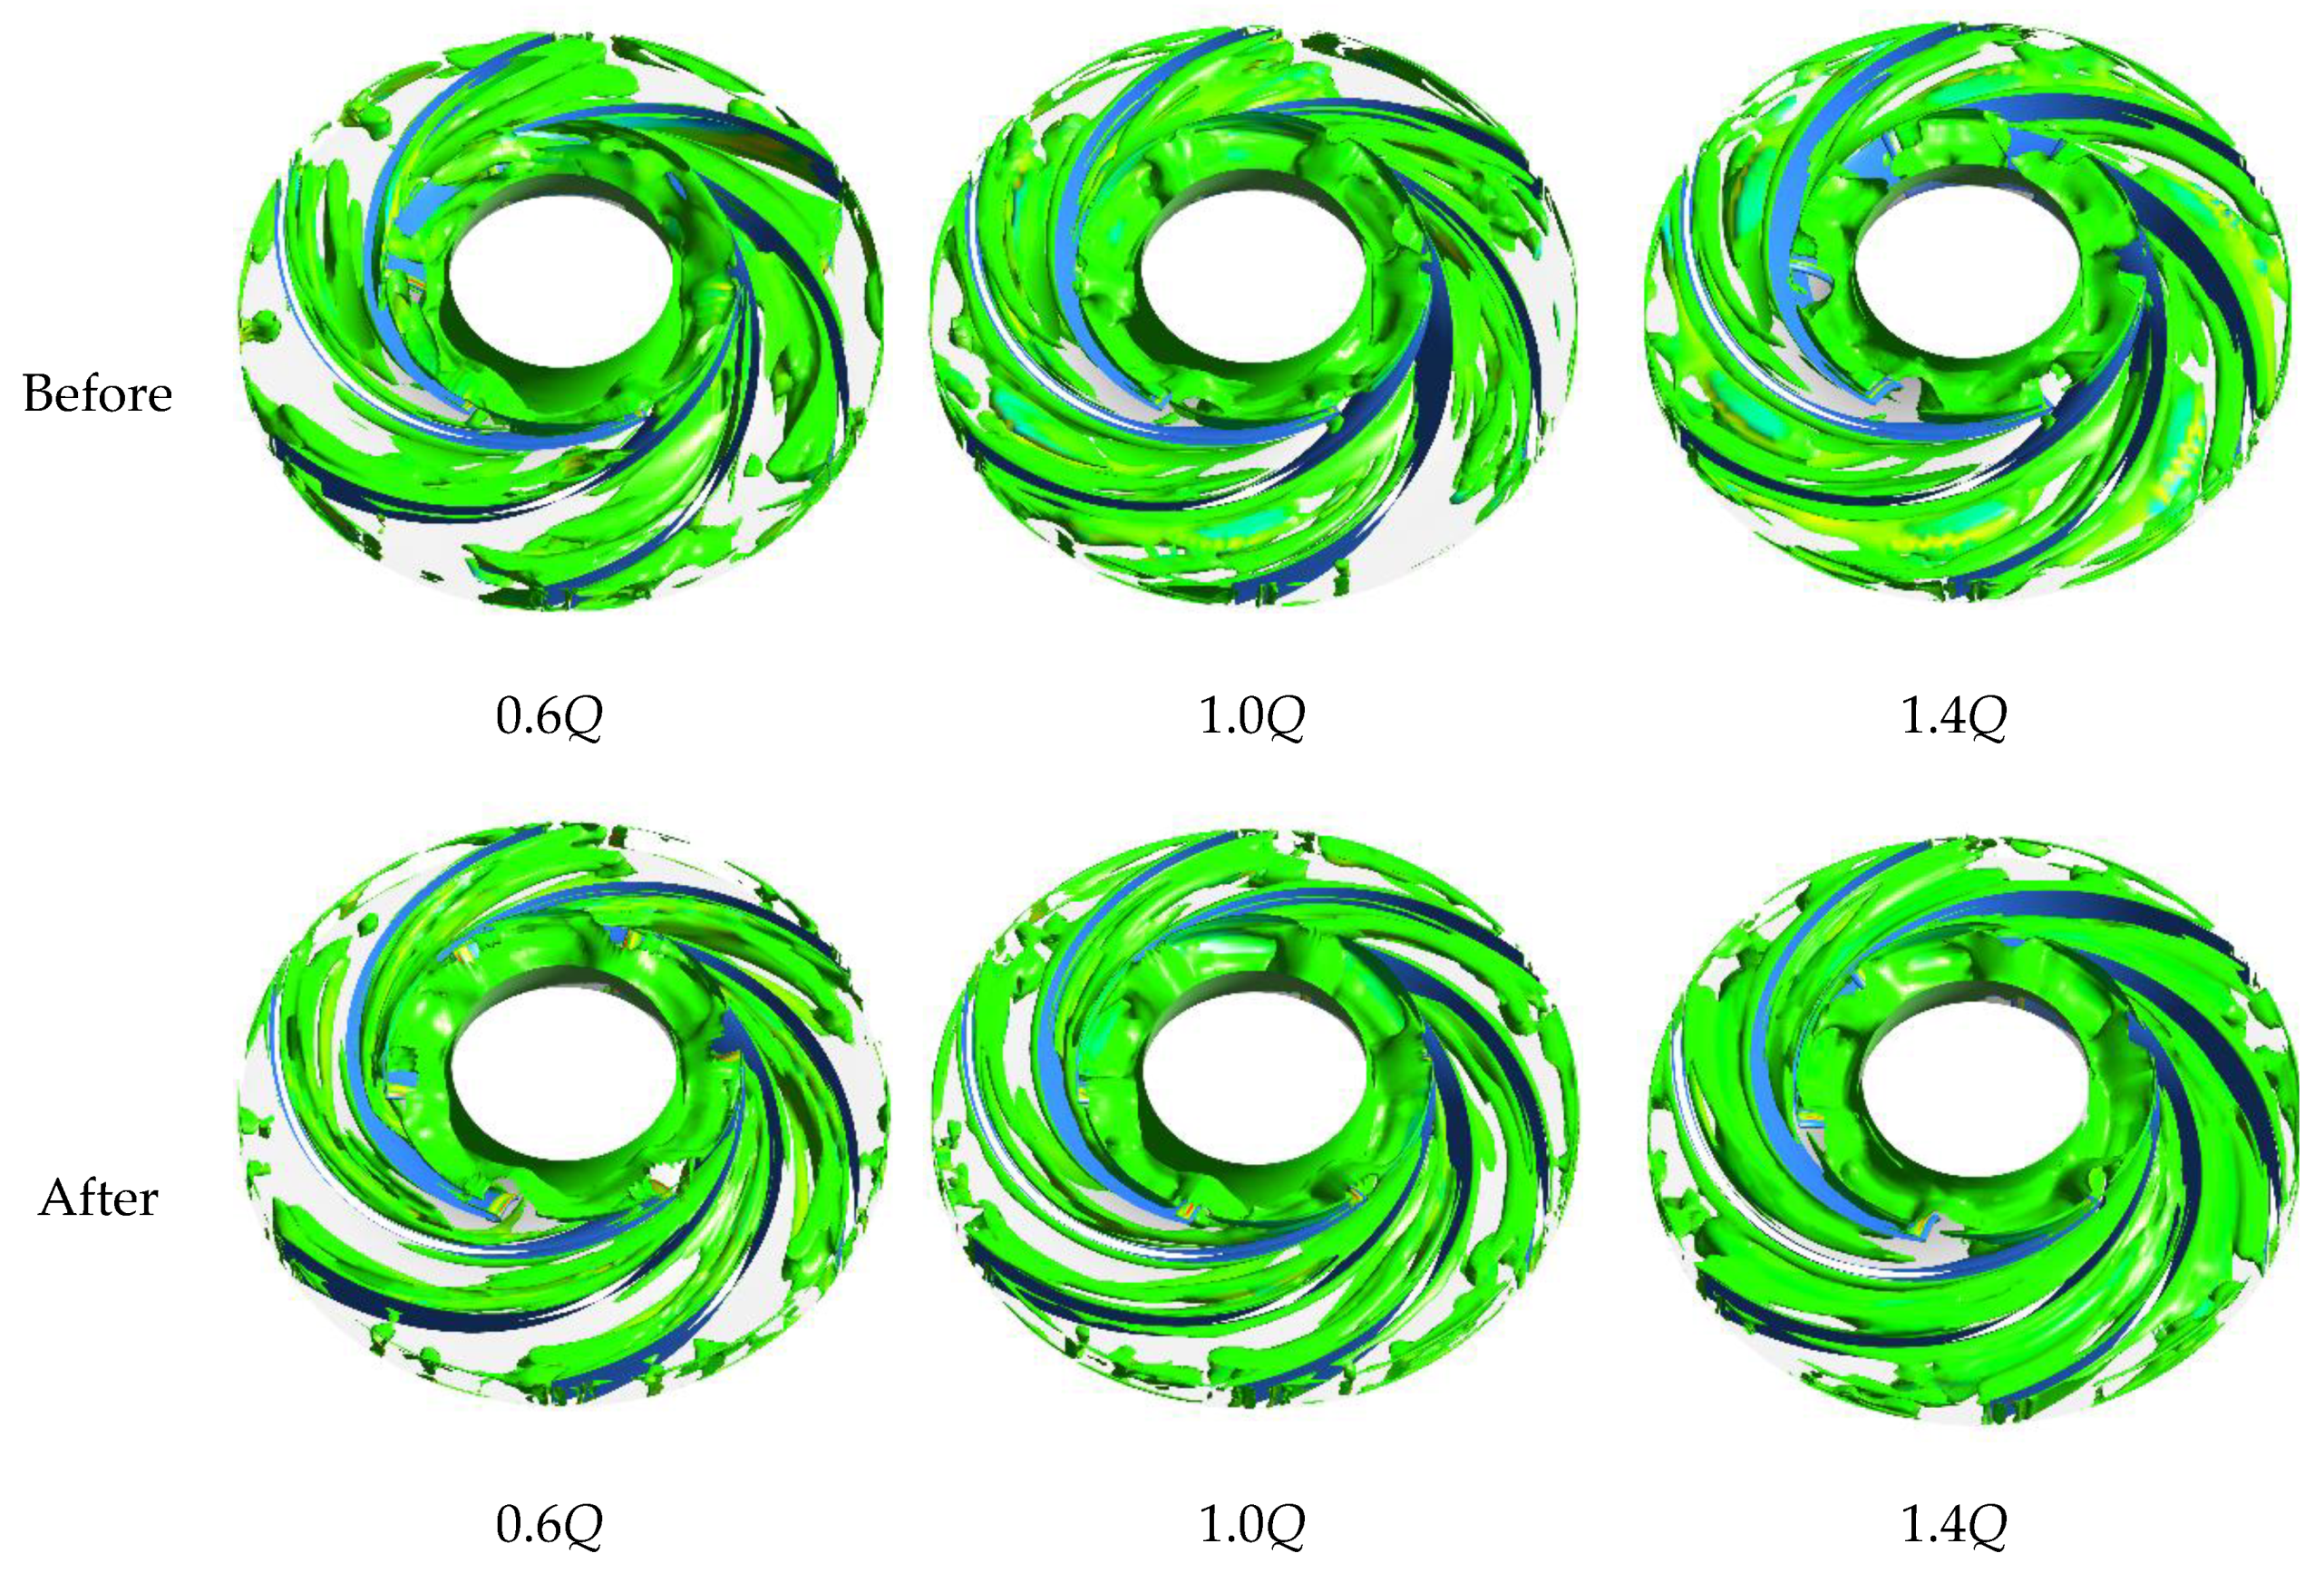
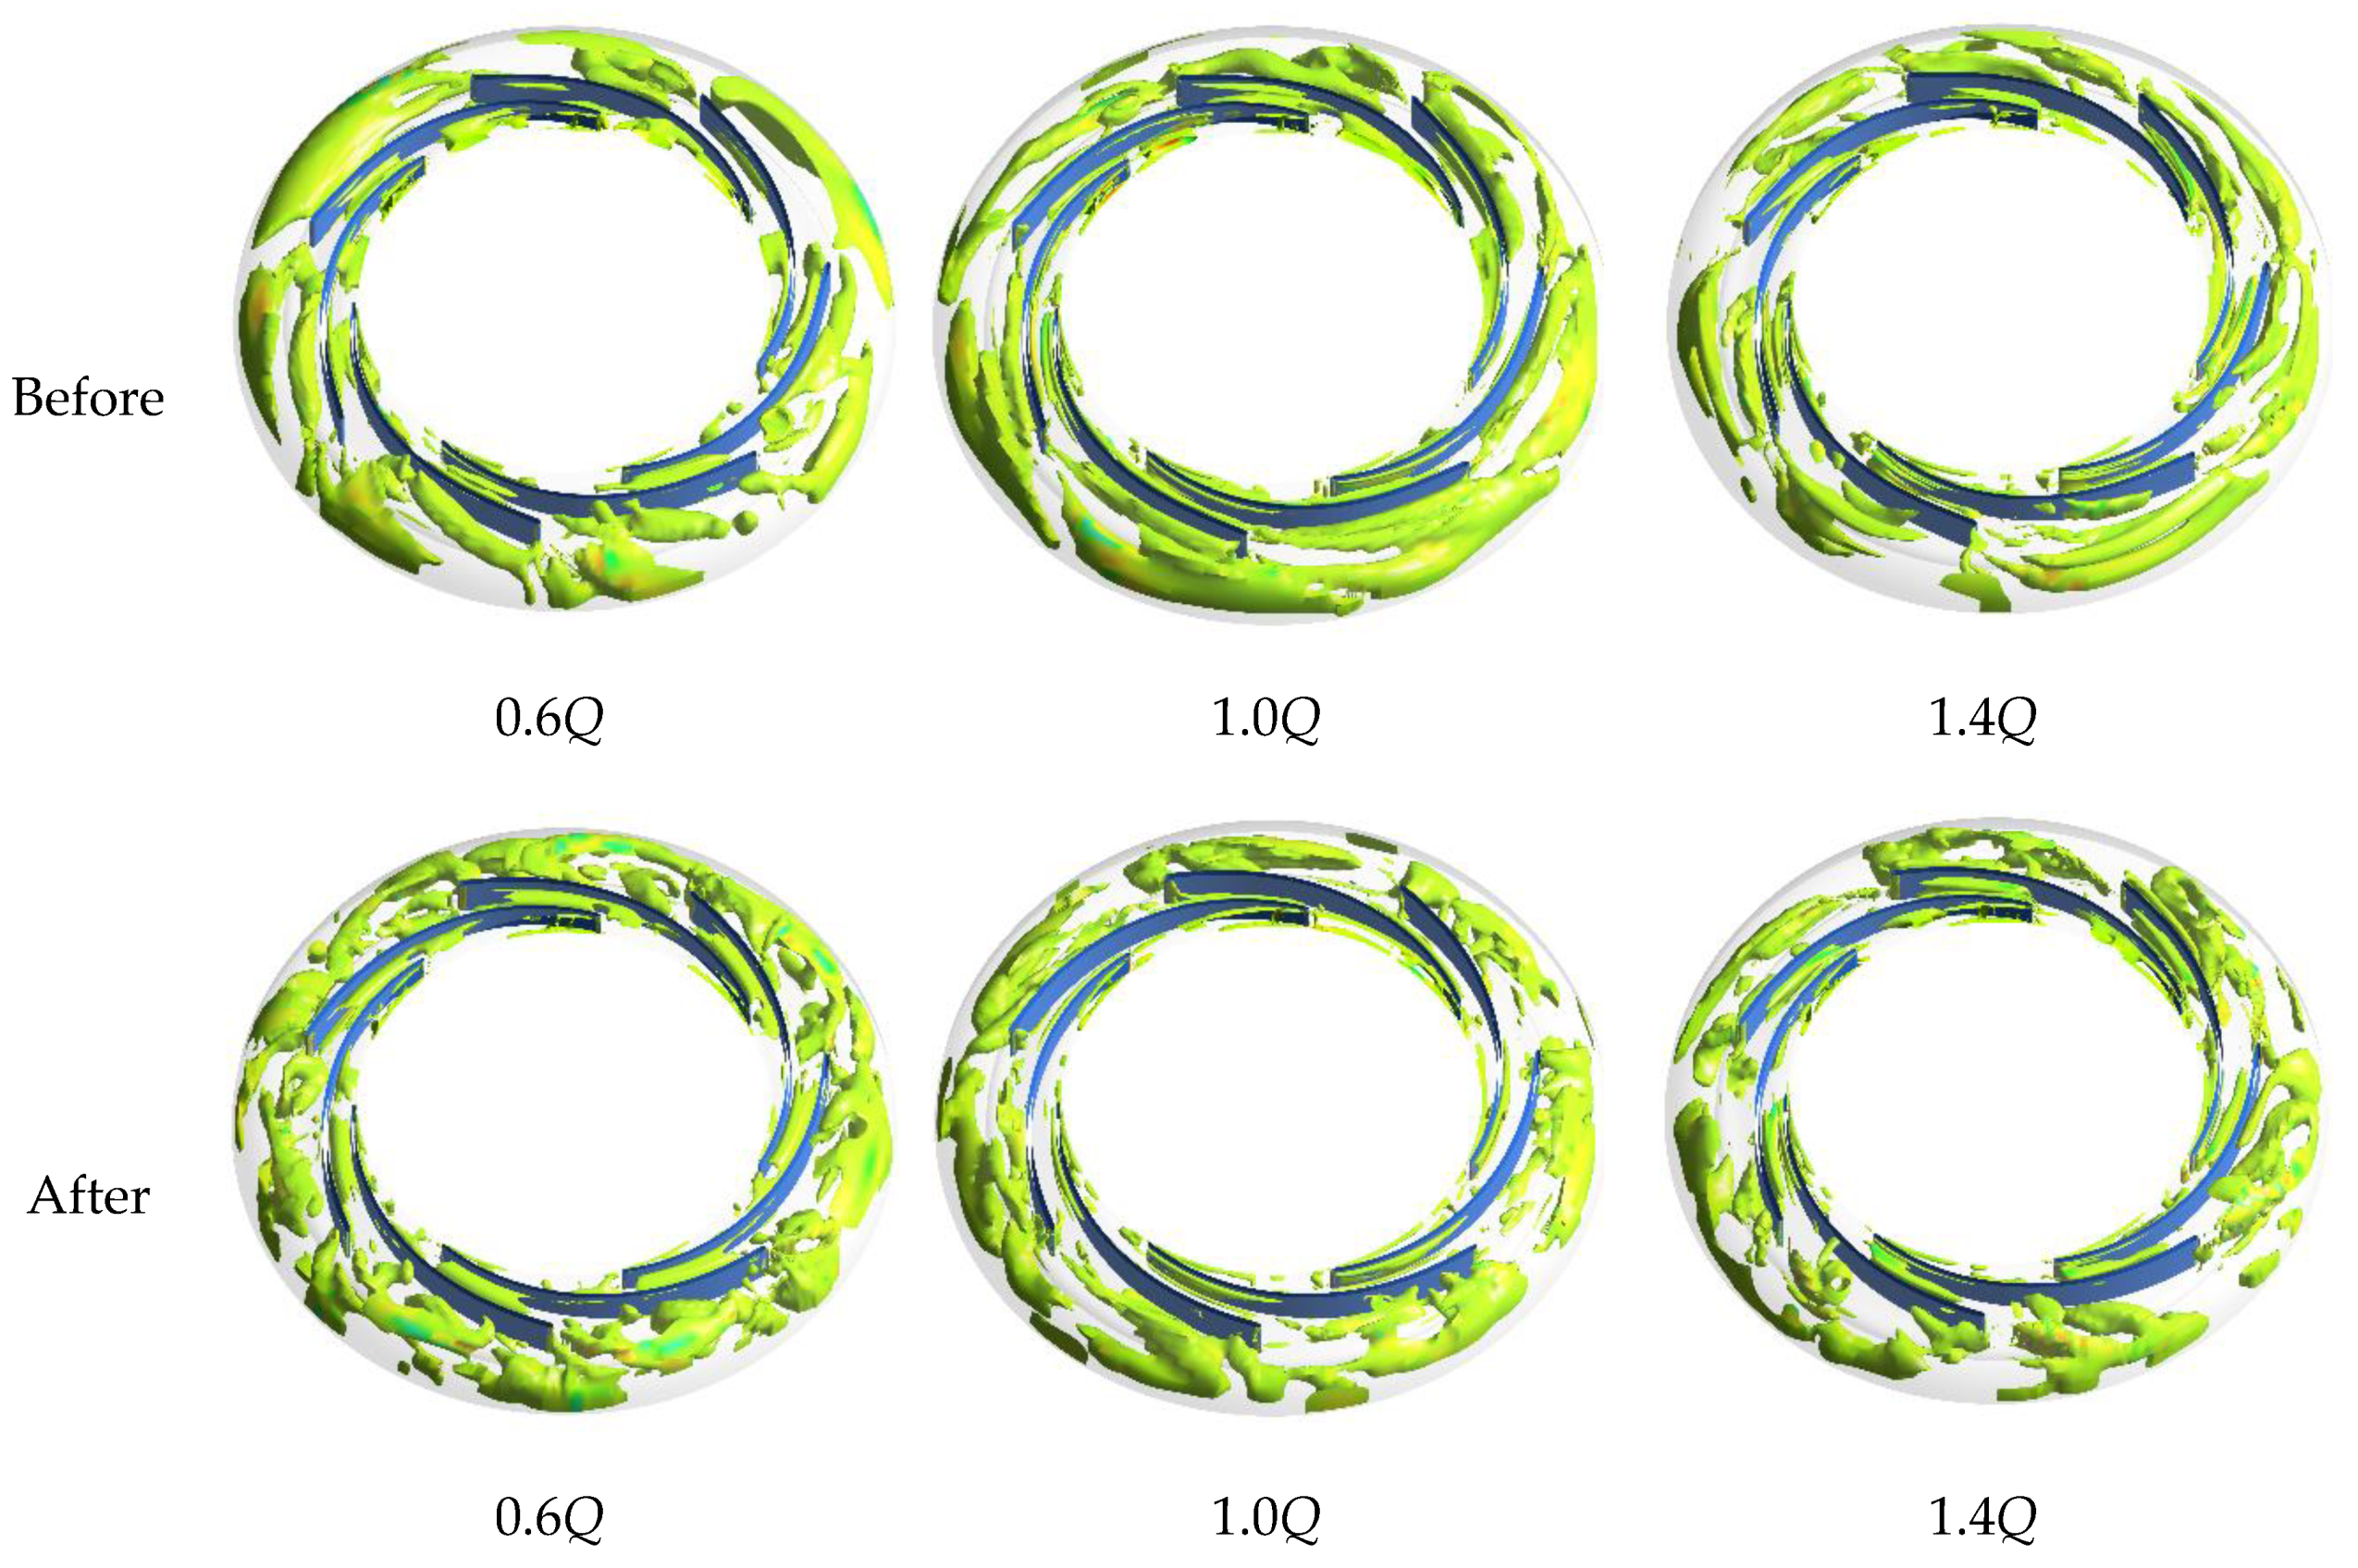
The vortex identification method was used to identify the vorticity, , inside the impeller and the positive guide vane of the model before and after optimization [30,31]. Figure 20 shows the vorticity distribution of the first-stage impeller before and after optimization at different flow rates. Under the low flow conditions, the vorticity at the interface between the outlet of the optimized model impeller and the guide vanes was significantly less than that before the optimization, which shows that the change of the impeller–guide vane matching relationship weakens the low flow conditions. The turbulent flow may be caused by the interference of the movement and static of the lower impeller and guide vanes. Under the design conditions, the vortices in the impeller after optimization were relatively small, and they were mainly concentrated near the suction surface of each flow channel and extended with the blade; before optimization, the vortices of the impeller were relatively more concentrated in the second half of the flow channel, and the pressure surface and suction surface were distributed across the flow channel. This shows that the optimized blade shape makes the vortex distribution of the impeller flow channel more reasonable. The vortex distribution is more suitable for the shape of the blade, and does not affect the passage of the main flow. Both have more vortices under the high flow conditions, but the vorticity at the inlet of the impeller after optimization is greater than that of the original model.
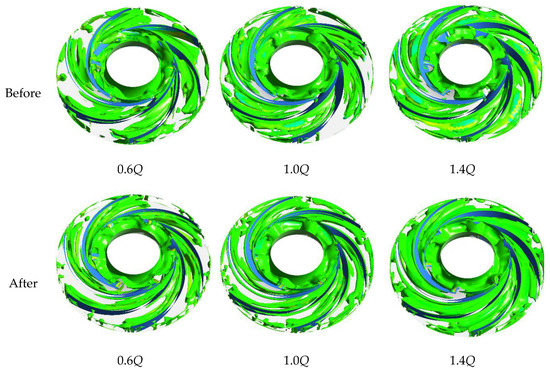
Figure 20.
Vorticity distribution of the first-stage impeller before and after optimization.
The vorticity distribution of the first stage guide vane at different flow rates before and after optimization is shown in Figure 21. The vortex distribution in the optimized positive guide vane was more dispersed and was dominated by small vortices, while at the start point of optimization, there were more large-sized vortices concentrated between the flow channel exit and the positive guide vane exit. Under low flow conditions, there were many vortices with larger sizes distributed near the outlet of the positive guide vane before optimization, whereas the vortices at the corresponding positions of the guide vanes after optimization were relatively small and evenly dispersed. Under the design flow conditions, the vorticity in the guide vane channel after optimization was significantly less than that before optimization, and was close to the blade wall, which had little impact on the main flow. A certain amount of vorticity was distributed in the middle of the guide vane channel before the optimization. This tends to affect the performance of the guide vane, resulting in a loss of head and a decrease in efficiency, which to a certain extent explains the improvement of the efficiency after optimization under the design conditions. In high flow conditions, the vorticity inside the guide vane before and after optimization was relatively small, but the vorticity of the guide vane before optimization was generally less than that after optimization.

Figure 21.
Vorticity distribution of the first-stage guide vane before and after optimization.
5. Conclusions
An optimization was carried out on a high-pressure multistage centrifugal pump to enhance the pump efficiency by optimizing the matching relationship between the impeller and the guide vane using ANSYS Workbench and an improved bat algorithm. The structure of the guide vane was initially modified, and the numerical model was verified with experimental data. The following conclusions were drawn:
- After the modification of the positive guide vane structure, the efficiency was improved in both the rated design and non-design flow conditions without obvious separation and backflow.
- With the improved bat algorithm, there was a 3.98% increase in the design point efficiency after the final optimization. At 0.8Q, the efficiency rose by 4.75%, and the head still met its demands.
- At 0.6Q, the backflow and flow separation in some part of the impeller-guide vane was reduced significantly after the optimization. The vortex at the exit of the improved guide vane channel was significantly smaller and the number was reduced.
- Under the design conditions, all of the large-size vortices disappeared after optimization. In the overload conditions, the flow situation of the optimized model deteriorated. The reason may be that the wrap angle of the guide vane was reduced after the optimization, which made the liquid leave the blade prematurely, and generated more and larger vortices under the action of the pressure difference and shear stress.
- The study provides a reference for the optimization design of the impeller–guide vane matching effect in a multistage pump using an improved bat algorithm.
Author Contributions
Conceptualization, X.G. and W.W.; methodology, X.G. and W.W.; software, X.G. and J.Z.; validation, J.P. and Q.D.; formal analysis, J.Z.; investigation, W.W.; resources, W.J.; data curation, X.G. and W.J.; writing—original draft preparation, M.K.O. and X.G.; writing—review and editing, W.W., J.P. and M.K.O.; visualization, X.G.; supervision, J.P. and W.W.; project administration, W.W. and J.P.; funding acquisition, W.W. and J.P. All authors have read and agreed to the published version of the manuscript.
Funding
This work was supported by the Natural Science Foundation of Jiangsu Province (Grant no. BK20190851), the Natural Science Foundation of China (Grant no. 51879121), the Primary Research & Development Plan of Shandong Province (Grant no. 2019TSLH0304), the Primary Research & Development Plan of Jiangsu Province (Grant no. BE2019009-1), and the China Postdoctoral Science Foundation (No. 2021M691296).
Institutional Review Board Statement
Not applicable.
Informed Consent Statement
Not applicable.
Data Availability Statement
The data that support the findings of this study are available from the corresponding author upon reasonable request.
Conflicts of Interest
The authors declare that there are no conflicts of interest regarding the publication of this article.
References
- Yin, T.; Pei, J.; Yuan, S.; Osman, M.K.; Wang, J.; Wang, W. Fluid-structure interaction analysis of an impeller for a high-pressure booster pump for seawater desalination. J. Mech. Sci. Technol. 2017, 31, 5319–5328. [Google Scholar] [CrossRef]
- Jones, E.; Qadir, M.; van Vliet, M.T.; Smakhtin, V.; Kang, S.M. The state of desalination and brine production: A global outlook. Sci. Total. Environ. 2019, 657, 1343–1356. [Google Scholar] [CrossRef]
- Wang, W.; Osman, M.K.; Pei, J.; Yuan, S.; Cao, J.; Osman, F.K. Efficiency-House Optimization to Widen the Operation Range of the Double-Suction Centrifugal Pump. Complexity 2020, 2020, 9737049. [Google Scholar] [CrossRef]
- Li, Z.; Zheng, X. Review of design optimization methods for turbomachinery aerodynamics. Prog. Aerosp. Sci. 2017, 93, 1–23. [Google Scholar] [CrossRef]
- Jin, R.; Chen, W.; Simpson, T. Comparative studies of metamodelling techniques under multiple modelling criteria. Struct. Multidiscip. Optim. 2001, 23, 1–13. [Google Scholar] [CrossRef]
- Simpson, T.W.; Mauery, T.M.; Korte, J.J.; Mistree, F. Kriging models for global approximation in simulation-based multidisciplinary design optimization. AIAA J. 2001, 39, 2233–2241. [Google Scholar] [CrossRef] [Green Version]
- An, Z.; Zhounian, L.; Peng, W.; Linlin, C.; Dazhuan, W. Multi-objective optimization of a low specific speed centrifugal pump using an evolutionary algorithm. Eng. Optim. 2015, 48, 1251–1274. [Google Scholar] [CrossRef]
- Pei, J.; Yin, T.; Yuan, S.; Wang, W.; Wang, J. Cavitation optimization for a centrifugal pump impeller by using orthogonal design of experiment. Chin. J. Mech. Eng. 2017, 30, 103–109. [Google Scholar] [CrossRef]
- Gan, X.; Wang, W.; Pei, J.; Yuan, S.; Tang, Y.; Osman, M.K. Direct Shape Optimization and Parametric Analysis of a Vertical Inline Pump via Multi-Objective Particle Swarm Optimization. Energies 2020, 13, 425. [Google Scholar] [CrossRef] [Green Version]
- Meng, F.; Li, Y.; Yuan, S.; Wang, W.; Zheng, Y.; Osman, M.K. Multiobjective Combination Optimization of an Impeller and Diffuser in a Reversible Axial-Flow Pump Based on a Two-Layer Artificial Neural Network. Processes 2020, 8, 309. [Google Scholar] [CrossRef] [Green Version]
- Wang, W.; Li, Y.; Osman, M.K.; Yuan, S.; Zhang, B.; Liu, J. Multi-Condition Optimization of Cavitation Performance on a Double-Suction Centrifugal Pump Based on ANN and NSGA-II. Processes 2020, 8, 1124. [Google Scholar] [CrossRef]
- Si, Q.; Yuan, S.; Wang, C.; Hu, B. Optimal design of submersible multistage pumps with low specific speed. Trans. Chin. Soc. Agric. Eng. 2012, 28, 122–127. [Google Scholar]
- Kim, J.-H.; Lee, H.-C.; Kim, J.-H.; Choi, Y.-S.; Yoon, J.-Y.; Yoo, I.-S.; Choi, W.-C. Improvement of Hydrodynamic Performance of a Multiphase Pump Using Design of Experiment Techniques. J. Fluids Eng. 2015, 137, 081301. [Google Scholar] [CrossRef]
- Liu, M.; Tan, L.; Cao, S. Design Method of Controllable Blade Angle and Orthogonal Optimization of Pressure Rise for a Multiphase Pump. Energies 2018, 11, 1048. [Google Scholar] [CrossRef] [Green Version]
- Wang, C.; Shi, W.; Wang, X.; Jiang, X.; Yang, Y.; Li, W.; Zhou, L. Optimal design of multistage centrifugal pump based on the combined energy loss model and computational fluid dynamics. Appl. Energy 2017, 187, 10–26. [Google Scholar] [CrossRef]
- Kawashima, D.; Kanemoto, T.; Sakoda, K.; Wada, A.; Hara, T. Matching Diffuser Vane with Return Vane Installed in Multistage Centrifugal Pump. Int. J. Fluid Mach. Syst. 2008, 1, 86–91. [Google Scholar] [CrossRef] [Green Version]
- Yang, X.-S. A new metaheuristic bat-inspired algorithm. In Nature Inspired Cooperative Strategies for Optimization (NICSO 2010); Springer: Berlin/Heidelberg, Germany, 2010; pp. 65–74. [Google Scholar]
- Yang, X.-S. Bat algorithm for multi-objective optimisation. Int. J. Bio-Inspired Comput. 2011, 3, 267. [Google Scholar] [CrossRef]
- Yang, X.-S.; He, X. Bat algorithm: Literature review and applications. Int. J. Bio-Inspired Comput. 2013, 5, 141. [Google Scholar] [CrossRef] [Green Version]
- Medvitz, R.B.; Kunz, R.F.; Boger, D.A.; Lindau, J.W.; Yocum, A.M.; Pauley, L. Performance Analysis of Cavitating Flow in Centrifugal Pumps Using Multiphase CFD. J. Fluids Eng. 2002, 124, 377–383. [Google Scholar] [CrossRef]
- Bardina, J.; Huang, P.; Coakley, T. Turbulence modeling validation. In Proceedings of the 28th Fluid Dynamics Conference, Snowmass Village, CO, USA, 29 June–2 July 1997; p. 21. [Google Scholar]
- Menter, F.R. Two-equation eddy-viscosity turbulence models for engineering applications. AIAA J. 1994, 32, 1598–1605. [Google Scholar] [CrossRef] [Green Version]
- Hao, Y.; Tan, L. Symmetrical and unsymmetrical tip clearances on cavitation performance and radial force of a mixed flow pump as turbine at pump mode. Renew. Energy 2018, 127, 368–376. [Google Scholar] [CrossRef]
- Osman, M.K.; Wang, W.; Yuan, J.; Zhao, J.; Wang, Y.; Liu, J. Flow loss analysis of a two-stage axially split centrifugal pump with double inlet under different channel designs. Proc. Inst. Mech. Eng. Part C J. Mech. Eng. Sci. 2019, 233, 5316–5328. [Google Scholar] [CrossRef]
- Wang, W.; Osman, M.K.; Pei, J.; Gan, X.; Yin, T. Artificial Neural Networks Approach for a Multi-Objective Cavitation Optimization Design in a Double-Suction Centrifugal Pump. Processes 2019, 7, 246. [Google Scholar] [CrossRef] [Green Version]
- Gülich, J.F. Centrifugal Pumps; Springer Science & Business Media: Berlin, Germany, 2010. [Google Scholar]
- Wang, Y.; Wang, P.; Zhang, J.; Cui, Z.; Cai, X.; Zhang, W.; Chen, J. A Novel Bat Algorithm with Multiple Strategies Coupling for Numerical Optimization. Mathematics 2019, 7, 135. [Google Scholar] [CrossRef] [Green Version]
- Arellano-Valle, R.B.; Bolfarine, H. On some characterizations of the t-distribution. Stat. Probab. Lett. 1995, 25, 79–85. [Google Scholar] [CrossRef]
- Ramli, M.; Abas, Z.A.; Desa, M.; Abidin, Z.Z.; Alazzam, M. Enhanced convergence of Bat Algorithm based on dimensional and inertia weight factor. J. King Saud Univ. Comput. Inf. Sci. 2019, 31, 452–458. [Google Scholar] [CrossRef]
- Liu, C.; Gao, Y.-S.; Dong, X.-R.; Wang, Y.-Q.; Liu, J.-M.; Zhang, Y.-N.; Cai, X.-S.; Gui, N. Third generation of vortex identification methods: Omega and Liutex/Rortex based systems. J. Hydrodyn. 2019, 31, 205–223. [Google Scholar] [CrossRef]
- Liu, J.; Liu, C. Modified normalized Rortex/vortex identification method. Phys. Fluids 2019, 31, 061704. [Google Scholar] [CrossRef] [Green Version]


Publisher’s Note: MDPI stays neutral with regard to jurisdictional claims in published maps and institutional affiliations. |
© 2021 by the authors. Licensee MDPI, Basel, Switzerland. This article is an open access article distributed under the terms and conditions of the Creative Commons Attribution (CC BY) license (https://creativecommons.org/licenses/by/4.0/).