Abstract
A coastal wave buoy was lost near Jeju Island, Korea, in late July 2014 and found at Cape Mendocino, USA, in April 2020. The buoy’s journey was simulated with a Lagrangian particle tracking model using surface ocean currents and wind data at 10 m above sea level. Experiments were conducted with windage values of 0, 2, and 4%. Particles were released along the southern coast of Jeju Island from 31 July to 8 August 2014. When the windage was 0 or 2%, most particles reached the northwest Pacific via the East/Japan Sea or East China Sea, respectively. With 4% windage, very few particles entered the North Pacific. Under 0% windage, particles accumulated in the Great Pacific Garbage Patch (GPGP) and never reached the USA. Under 2%, particles were able to escape the GPGP and started to reach the USA coast 2 years and 7 months after the release. The trajectory of the buoy was deduced from the trajectories of particles with a similar travel time. The buoy likely moved to East China and then to the subtropical convergence zone, where it must have circulated for approximately 2 years before being pushed toward Cape Mendocino by the intensified winter westerlies.
1. Introduction
In April 2020, a buoy managed by the Korea Meteorological Administration was found at Cape Mendocino, California, USA (Figure 1). The buoy, a 70-cm diameter sphere surrounded by a triangular frame, had previously monitored wave height, wave period, and surface water temperature in the southern coastal area of Jeju Island, Korea. It is presumed to have been lost on 31 July 2014 when its mooring cable was damaged by a ship traveling to a port to avoid Typhoon Nakri. This buoy drifted for approximately 2070 days before reaching Cape Mendocino. As the buoy contained no tracking device, its path could not be traced directly. The buoy must have been transported by the surface current and winds for more than several years, similar to plastic debris introduced into the ocean. Thus, if the path of this buoy can be estimated, it will help us to understand the movement of floating objects such as marine plastic debris and pollutants generated around Korea.
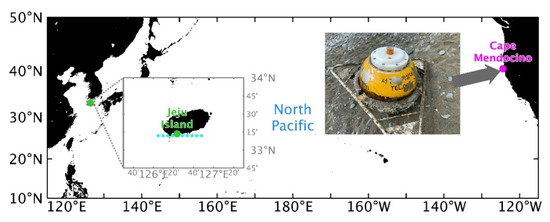
Figure 1.
Locations of Jeju Island, where the buoy was lost (green dot), and Cape Mendocino, where the buoy was found (purple dot), and a photograph of the buoy found in Cape Mendocino. The 10 cyan dots below Jeju Island are the locations where particles were released in the particle tracking model.
Particle tracking models are widely used to track floating objects. For the North Pacific, Lebreton and Borrero [1] showed that after the 2011 tsunami on the eastern coast of Japan, ocean currents took approximately 3 years to transport the resulting debris to the northeastern Pacific and the west coast of the USA. Maximenko et al. [2] and Murray et al. [3] investigated the effects of surface winds and windage on tsunami debris. Debris could reach the coast of the USA in about a year, and the location and timing of the arrival depended on the windage. Floating debris entering the North Pacific accumulates in the subtropical ocean gyre, forming the Great Pacific Garbage Patch (GPGP) [4,5]. Lebreton et al. [5] further analyzed the influence of wind and showed that particles transported by ocean currents are distributed at the center of the GPGP, and those with higher windage are distributed outside the GPGP. The aforementioned studies suggest that ocean currents and winds could have transported the buoy from Jeju Island to the west coast of the USA. However, the waters around Korea were not included in these studies. Therefore, to obtain a complete trajectory, simulations that include the seas around Korea are necessary. Studies have been conducted on the movement of floating debris originating from Korea [6,7], but their areas of interest were around Korea and did not extend into the North Pacific.
We used a Lagrangian particle tracking model to determine the trajectory of the buoy from the southern coast of Jeju Island to the North Pacific, and then to Cape Mendocino. The most probable route of the buoy was determined through experiments. Because the wind in Korea is highly seasonal (due to the eastern Asian monsoon) and because a substantial part of the buoy was exposed above the sea surface, the sensitivity of the buoy to the surface wind was factored into the experiment. The results showed that the buoy was probably transported to the East China Sea and then to the subtropical convergence zone, where it likely circulated for approximately 2 years before being pushed toward Cape Mendocino by winter westerlies. Overall, the results indicate that a systematic investigation of regional and seasonal wind effect is required when assessing the impact of debris.
2. Materials and Methods
2.1. Lagrangian Particle Tracking Model
The particle tracking model used in this study is the same as that used by Seo and Park [6] and Seo et al. [8] and is based on the following equation:
Here, is the particle position at time , and Δt is the integration time interval (1 h). The Runge–Kutta fourth order scheme [9] was used for time integration. The input data are and , the ocean surface current and 10-m wind above sea level, respectively. The windage coefficient , representing the effect of on the movement of floating objects, was determined by the ratio between the amount of exposed buoy and the amount that was submerged in the sea () [7]. The exposure rate of the buoy was about 40–60% and the corresponding windage was in the range of about 2–4%. This value is similar to the windage commonly applied to marine plastic debris [6,10]. The third term on the right-hand side of the equation is the random walk process, where is the diffusion coefficient based on the Smagorinsky parameterization [11]. Once a particle had reached a grid cell classified as land, it was treated as having washed up on shore, and no further calculations were performed.
2.2. Experimental Design
For , the 3 hourly 1/12° global fields from the HYbrid Coordinate Ocean Model (HYCOM, https://www.hycom.org, accessed 15 May 2021) Global Ocean Forecast System (GOFS) 3.1 output were utilized. Diverse observation data such as satellite altimeters, sea surface temperatures, and profiles from Argo floats are assimilated into the HYCOM [12]. Accordingly, HYCOM GOFS 3.1 properly simulates the North Pacific subtropical gyre, which is composed of the Kuroshio Current in the west, the Kuroshio Extension area in the northwest, the North Pacific Current in the north, the California Current in the east, and the Northern Equatorial Current in the south (Figure 2a). For , the three-hourly 1/4° European Center for Medium-Range Weather Forecasts (ECMWF) Reanalysis v5 (ERA5) [13] data product was used. The mean field of shows the trade winds south of 30°N and the westerlies north of 30°N (Figure 2b).
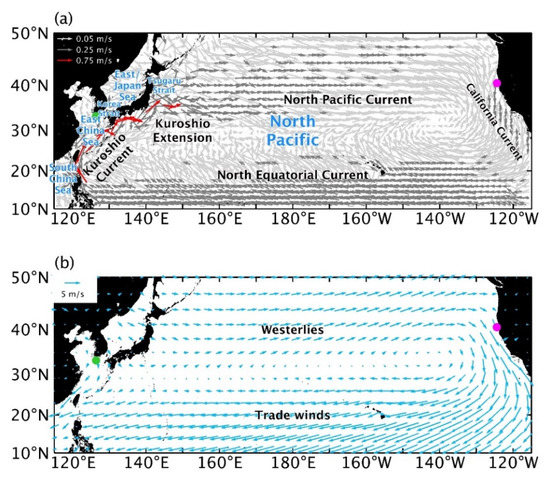
Figure 2.
(a) Mean surface velocity over the North Pacific from the HYCOM GOFS 3.1 reanalysis, from 1994 to 2015. Flows below 0.1 m/s are represented by light gray arrows, between 0.1 and 0.5 m/s by gray arrows, and above 0.5 m/s by red arrows. (b) Mean 10-m wind data, from the ECMWF ERA5, from 1994 to 2015.
To determine the most probable path of the buoy and the governing factors, three experiments were conducted with three different windage values: 0, 2, and 4%. From 31 July to 8 August 2014, 500 particles were released daily at 10 different sites that were 1/12° apart along the southern coast of Jeju Island (Figure 1). Thus, in each experiment, 50,000 particles were released and tracked for up to 5 years and 8 months.
The main paths of the particles were analyzed using probability distributions, as in Rypina et al. [14] and Seo and Park [6]. The entire model domain was divided into a series of 1° × 1° grid cells, and the probability () of a particle reaching a grid cell, and the mean travel time () to that grid cell (i, j), were calculated as follows:
Here, is the zonal direction, is the meridional direction, is the number of particles reaching the grid (i, j), and is the total number of released particles. The particles that reached the coast within a year of being released were excluded from the probability and arrival time calculations. The numbers of particles used in the calculations were 1074, 5046, and 525, respectively, in the 0, 2, and 4% windage experiments.
3. Results and Discussions
3.1. From Jeju Island to the Northwest Pacific
In the 0% windage experiment, more than 90% of the particles released along the southern coast of Jeju Island moved eastward with the Tsushima Warm Current (TWC), to the EJS, as shown in Figure 3a. Note that the particles released from the southwestern coast of Jeju Island circulated clockwise around the island with the Jeju Warm Current, and then moved eastward through the strait to the north of the island, to join the TWC. The particles remained in the southern part of the EJS before escaping into the northwestern Pacific through the Tsugaru Strait, approximately 120 days after release. The path and distribution of the particles within the Korea Strait and the EJS are in agreement with the ocean drifter observations reported by Seo and Park [6]. The small remaining portion (less than 10%) moved to the East China Sea (ECS) after approximately 180 days.
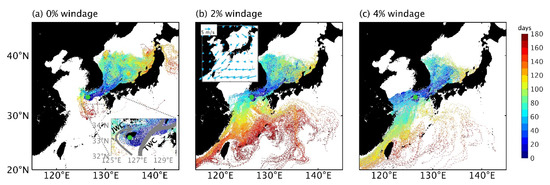
Figure 3.
Particle trajectories with windage of (a) 0%, (b) 2%, and (c) 4% during the early stage (i.e., within 180 days of release). Color represents the travel time to individual points (in number of days). Thick gray lines in (a) indicate the schematic of the Jeju Warm Current (JWC) and Tsushima Warm Current (TWC) from the Korea Hydrographic and Oceanographic Agency (KHOA). Blue arrows in (b) indicate the mean 10-m wind from September to November 2014.
Under 2% windage, the particles initially moved eastward, as in the 0% case. As the particles approached the Korea Strait around September, they were affected by northeasterly or northerly winds [15,16], which were opposite to the direction of the ocean current. The proportion of particles entering the EJS through the Korea Strait was reduced by 65% compared to the 0% case. The wind caused the particles entering the EJS to reach the west coast of Japan, rather than exiting toward the northwestern Pacific through the Tsugaru Strait (Figure 3b). The remaining 35% were transported to the ECS due to the northeasterly wind, and then began reaching the northwest Pacific and the South China Sea (SCS) approximately 150 days after release. As the windage increased to 4%, approximately 20% of the total moving particles entered the EJS, and 90% of them beached on the west coast of Japan. In addition, the drifting of the particles to the ECS and to the coast of China was accelerated, and some particles reached the Chinese coast within approximately 50 days. Particles that migrated to the coast of China were carried to the SCS by the southward current and northeasterly winds along the coast of China.
3.2. Within in the North Pacific
The sensitivity of the trajectories to windage within the North Pacific is illustrated by the probability distribution and travel time in Figure 4. The area with a high probability represents the main path of the particle. The travel time is displayed only over the area with a probability of more than 1%.
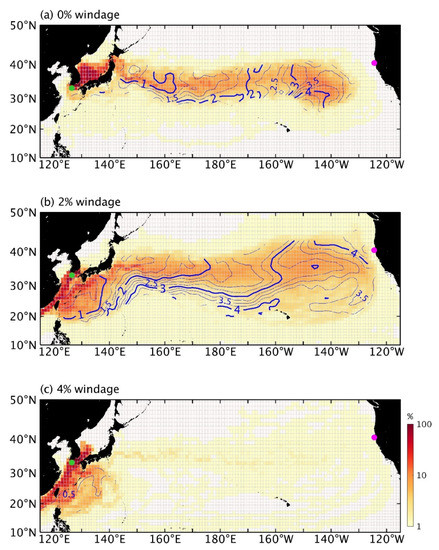
Figure 4.
Mean probability distribution of particles from Jeju Island with windage of (a) 0%, (b) 2%, and (c) 4%. Blue contours denote the mean travel time over the area with probabilities of more than 1%. The grid cells used to calculate the probability are also displayed.
Under 0% windage, the particles introduced into the northwestern Pacific were mainly transported through the Tsugaru Strait and then carried eastward between 30° N and 40° N by the Kuroshio Extension and North Pacific Current, toward the North Pacific subtropical convergence zone, which is located between 30–40° N and 130–150° W. Note that the GPGP, where floating plastic debris converges [4,5,17,18], is within the convergence zone. The average travel time to the convergence zone was approximately 3 to 4 years.
Under 2% windage, particles entered the northwest Pacific via the ECS along the Kuroshio Current. Upon reaching the east coast of Japan, particles were transported toward the convergence zone by the Kuroshio Extension and the North Pacific Current, as in the 0% windage case. However, with 2% windage, the particles took a longer route and spent approximately 6 more months to reach the convergence zone. Within the convergence zone, the ocean currents are weak, and the travel time in this region increased rapidly in the 0% windage case. In the 2% windage case, the westerly wind transported the particles to the east, even in the convergence zone, and such a rapid increase in the travel time did not occur. Therefore, particles reached the convergence zone approximately 3 to 4 years after the release, as in the 0% case. The westerly wind also led to horizontal dispersion [5], and under 2% windage, the particles were distributed over wider areas.
As the windage increased to 4%, only 0.03% of the released particles moved to the North Pacific. As explained earlier, the main portion of the particles moved to the SCS. Note that this is not a general behavior of floating debris from the island but is limited to the particles released around 31 July 2014.
3.3. Particles Reaching the Coast of the USA
As shown in Figure 4, under 0% windage, the particles could not escape the convergence zone. However, under 2% windage, the probability distribution pattern showed that particles could reach Cape Mendocino. Under 4% windage, only one of the 50,000 particles released from the island reached the USA coast in approximately 1 year and 9 months (May 2016). Thus, the probable trajectory of the buoy was deduced from the results of the 2% windage case.
Figure 5 shows the paths of 24 particles arriving within 50 km of Cape Mendocino when the windage was 2%. Particles began arriving at Cape Mendocino after approximately 2 years and 7 months. More than 90% of the particles arrived between February and May owing to strong jet streams associated with the intensified Aleutian Lows, as reported in a previous study [2,19]. In Figure 5, the trajectory of a particle that took 5 years and 8 months to reach Cape Mendocino (the time taken by the wave buoy) has been color shaded based on the chronology of the journey. After moving around Jeju Island for approximately 90 days, the particle moved southward toward Taiwan under the influence of the northeasterly wind. Upon reaching the east of Taiwan, it rode the Kuroshio Current, Kuroshio Extension, and North Pacific Current to reach the subtropical convergence zone in about 2 years. It then took approximately 2 years to complete one anticyclonic (clockwise) circuit of the convergence zone. Finally, the westerly wind pushed the particle from the convergence zone to Cape Mendocino. The total travel distance of the particle was approximately 55,000 km, and its mean speed was approximately 25 km/day.
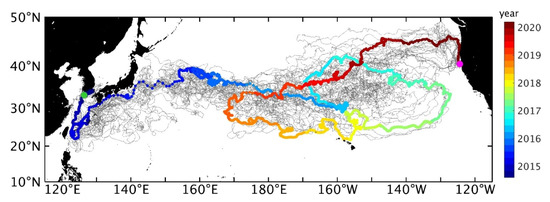
Figure 5.
The paths of particles reaching Cape Mendocino under 2% windage. Among them the path of a particle that took 5 years and 8 months to reach the destination is highlighted and colored according to the chronology along the path.
4. Summary and Conclusions
A buoy lost along the southern coast of Jeju Island in late July 2014 was found at Cape Mendocino, California, USA, in April 2020. To determine the most probable path of the buoy, Lagrangian particle tracking simulations were conducted with varying windage. The model results showed that around Korea, the wind was as important a factor in shaping the trajectories of the particles as the ocean currents. Without windage, the particles passed through the EJS and entered the North Pacific Ocean, but under 2 or 4% windage, the particles entered the North Pacific through the ECS. Under 0 or 2% windage, the particles were transported into the northwestern Pacific Ocean, and then toward the GPGP in the northeast Pacific, by ocean currents and wind (if the windage was greater than 0%). When the windage was 4%, most of the particles were transported to the SCS or beached due to northeasterly winds. Note that since the wind around Korea shows a strong seasonality, particles released during a different season would show different pathways.
Under 0% windage, the particles were not able to escape the GPGP. Under 2% windage, particles were able to escape the GPGP and began reaching Cape Mendocino 2 years and 7 months after the release. A particle took about 5 years and 8 months to travel from Jeju Island to Cape Mendocino, which was the time taken by the wave buoy, and the most probable path of the buoy was therefore deduced using the trajectory of this particle. The buoy must have moved southward toward Taiwan under the influence of the northeasterly wind. Upon reaching the east of Taiwan, it rode the Kuroshio Current, Kuroshio Extension, and North Pacific Current to reach the subtropical convergence zone in about 2 years. It then completed one anticyclonic circuit of the convergence zone in approximately 2 years. Finally, the westerly wind pushed the particle from the convergence zone to Cape Mendocino. Under a higher 4% windage, one particle reached Cape Mendocino in approximately 1 year and 9 months.
There is seasonality in the strength of ocean currents, but the overall direction does not change. In contrast, the wind direction and strength show strong seasonality, similar to the simulated trajectories of the particles. The same factors affect floating debris from Korea and other areas affected by monsoon winds. Thus, a systematic investigation of the effects of monsoonal wind is required when assessing the impact of debris in those areas.
Author Contributions
Conceptualization, S.S. and Y.-G.P.; methodology, S.S. and Y.-G.P.; validation, S.S.; formal analysis, S.S. and Y.-G.P.; investigation, S.S.; resources, S.S.; data curation, S.S.; writing—original draft preparation, S.S.; writing—review and editing, Y.-G.P.; visualization, S.S.; supervision, Y.-G.P.; project administration, Y.-G.P.; funding acquisition, Y.-G.P. All authors have read and agreed to the published version of the manuscript.
Funding
This work was funded through the projects titled “Improvements of ocean prediction accuracy using numerical modeling and artificial intelligence technology (PM62220)” from the Ministry of Oceans and Fisheries, Korea, and “Biogeochemical cycling and marine environmental change studies (PE99912)” from the Korea Institute of Ocean Science and Technology.
Institutional Review Board Statement
Not applicable.
Informed Consent Statement
Not applicable.
Data Availability Statement
Not applicable.
Acknowledgments
We are grateful to the editor and anonymous reviewers for their efforts.
Conflicts of Interest
The authors declare no conflict of interest.
References
- Lebreton, L.C.; Borrero, J.C. Modeling the transport and accumulation floating debris generated by the 11 March 2011 Tohoku tsunami. Mar. Pollut. Bull. 2013, 66, 53–58. [Google Scholar] [CrossRef] [PubMed]
- Maximenko, N.; Hafner, J.; Kamachi, M.; MacFadyen, A. Numerical simulations of debris drift from the Great Japan Tsunami of 2011 and their verification with observational reports. Mar. Pollut. Bull. 2018, 132, 5–25. [Google Scholar] [CrossRef] [PubMed]
- Murray, C.C.; Maximenko, N.; Lippiatt, S. The influx of marine debris from the Great Japan Tsunami of 2011 to North American shorelines. Mar. Pollut. Bull. 2018, 132, 26–32. [Google Scholar] [CrossRef] [PubMed]
- Lebreton, L.C.; Greer, S.D.; Borrero, J.C. Numerical modelling of floating debris in the world’s oceans. Mar. Pollut. Bull. 2012, 64, 653–661. [Google Scholar] [CrossRef] [PubMed]
- Lebreton, L.C.; Slat, B.; Ferrari, F.; Sainte-Rose, B.; Aitken, J.; Marthouse, R.; Hajbane, S.; Cunsolo, S.; Schwarz, A.; Levivier, A.; et al. Evidence that the Great Pacific Garbage Patch is rapidly accumulating plastic. Sci. Rep. 2018, 8, 1–15. [Google Scholar] [CrossRef] [PubMed] [Green Version]
- Seo, S.; Park, Y.-G. Destination of floating plastic debris released from ten major rivers around the Korean Peninsula. Environ. Int. 2020, 138, 105655. [Google Scholar] [CrossRef] [PubMed]
- Yoon, J.H.; Kawano, S.; Igawa, S. Modeling of marine litter drift and beaching in the Japan Sea. Mar. Pollut. Bull. 2010, 60, 448–463. [Google Scholar] [CrossRef] [PubMed]
- Seo, S.; Park, Y.-G.; Kim, K. Tracking flood debris using satellite-derived ocean color and particle-tracking modeling. Mar. Pollut. Bull. 2020, 161, 111828. [Google Scholar] [CrossRef] [PubMed]
- Dormand, J.R.; Prince, P.J. A family of embedded Runge-Kutta formulae. J. Comput. Appl. Math. 1980, 6, 19–26. [Google Scholar] [CrossRef] [Green Version]
- Duhec, A.V.; Jeanne, R.F.; Maximenko, N.; Hafner, J. Composition and potential origin of marine debris stranded in the Western Indian Ocean on remote Alphonse Island, Seychelles. Mar. Pollut. Bull. 2015, 96, 76–86. [Google Scholar] [CrossRef] [PubMed]
- Smargorinsky, J. General circulation experiments with the primitive equations. Mon. Weather Rev. 1964, 91, 99–164. [Google Scholar] [CrossRef]
- Chassignet, E.P.; Hurlburt, H.E.; Smedstad, O.M.; Halliwell, G.R.; Hogan, P.J.; Wallcraft, A.J.; Baraille, R.; Bleck, R. The HYCOM (hybrid coordinate ocean model) data assimilative system. J. Mar. Syst. 2007, 65, 60–83. [Google Scholar] [CrossRef]
- Hersbach, H.; Bell, B.; Berrisford, P.; Hirahara, S.; Horányi, A.; Muñoz-Sabater, J.; Nicolas, J.; Peubey, C.; Radu, R.; Schepers, D.; et al. The ERA5 global reanalysis. Q. J. R. Meteorol. Soc. 2020, 146, 1999–2049. [Google Scholar] [CrossRef]
- Rypina, I.I.; Jayne, S.R.; Yoshida, S.; Macdonald, A.M.; Buesseler, K. Drifter-based estimate of the 5 year dispersal of Fukushima-derived radionuclides. J. Geophys. Res. Oceans 2014, 119, 8177–8193. [Google Scholar] [CrossRef] [Green Version]
- Moon, J.H.; Hirose, N.; Yoon, J.H.; Pang, I.C. Effect of the along-strait wind on the volume transport through the Tsushima/Korea Strait in September. J. Oceanogr. 2009, 65, 17–29. [Google Scholar] [CrossRef]
- Shimada, T. Structures and seasonal variations of surface winds blowing through the Tsushima strait. J. Appl. Meteorol. Clim. 2010, 49, 1714–1727. [Google Scholar] [CrossRef]
- Eriksen, M.; Lebreton, L.C.; Carson, H.S.; Thiel, M.; Moore, C.J.; Borerro, J.C.; Galgani, F.; Ryan, P.G.; Reisser, J. Plastic pollution in the world’s oceans: More than 5 trillion plastic pieces weighing over 250,000 tons afloat at sea. PLoS ONE 2014, 9, e111913. [Google Scholar] [CrossRef] [PubMed] [Green Version]
- Maximenko, N.; Hafner, J.; Niiler, P. Pathways of marine debris derived from trajectories of Lagrangian drifters. Mar. Pollut. Bull. 2012, 65, 51–62. [Google Scholar] [CrossRef] [PubMed]
- Kako, S.I.; Isobe, A.; Kataoka, T.; Yufu, K.; Sugizono, S.; Plybon, C.; Murphy, T.A. Sequential webcam monitoring and modeling of marine debris abundance. Mar. Pollut. Bull. 2018, 132, 33–43. [Google Scholar] [CrossRef] [PubMed]
Publisher’s Note: MDPI stays neutral with regard to jurisdictional claims in published maps and institutional affiliations. |
© 2021 by the authors. Licensee MDPI, Basel, Switzerland. This article is an open access article distributed under the terms and conditions of the Creative Commons Attribution (CC BY) license (https://creativecommons.org/licenses/by/4.0/).