Article

Numerical Study of the Dynamic Stall Effect on a Pair of Cross-Flow Hydrokinetic Turbines and Associated Torque Enhancement Due to Flow Blockage

Department of Mechanical Engineering, Keio University, Yokohama 223-8522, Japan
*
Author to whom correspondence should be addressed.
J. Mar. Sci. Eng. 2021, 9(8), 829; https://doi.org/10.3390/jmse9080829
Submission received: 12 June 2021 / Revised: 21 July 2021 / Accepted: 27 July 2021 / Published: 30 July 2021
(This article belongs to the Section Ocean Engineering)

Abstract

:
An open-source 2D Reynolds-averaged Navier–Stokes (RANS) simulation model was presented and applied for a laboratory-scaled cross-flow hydrokinetic turbine and a twin turbine system in counter-rotating configurations. The computational fluid dynamics (CFD) model was compared with previously published experimental results and then used to study the turbine power output and relevant flow fields at four blockage ratios. The dynamic stall effect and related leading edge vortex (LEV) structures were observed, discussed, and correlated with the power output. The results provided insights into the blockage effect from a different perspective: The physics behind the production and maintenance of lift on the turbine blade at different blockage ratios. The model was then applied to counter-rotating configurations of the turbines and similar analyses of the torque production and maintenance were conducted. Depending on the direction of movement of the other turbine, the blade of interest could either produce higher torque or create more energy loss. For both of the scenarios where a blade interacted with the channel wall or another blade, the key behind torque enhancement was forcing the flow through its suction side and manipulating the LEV.

1. Introduction

In a wind or water tunnel experiment, the interaction between a turbine and the tunnel walls is a widely known effect. The cross-flow turbine literature mostly concerns with the correction of the power output and similarity of the turbine wakes [1,2,3,4,5]. At the same time, the differences in torque production created by confining the flow and the physics behind were not well studied. Understanding the hydrodynamic interaction between a turbine and a fixed wall is a firm foundation for exploring interaction between multiple devices in an array.
One of the simplest explanations is that confining the flow forces more kinetic energy into the turbine and, therefore, creates more power output. Another perspective to look at this problem is that changing the incoming flow also varies the relative angle of attack magnitude and frequency over time, which can affect the lift force and associated torque. This approach suggests a correlation between the blockage ratio and the turbine dynamic stall effect. While the dynamic stall effect on a pitching airfoil has been well studied by numerical simulations [6,7,8], building accurate models for a vertical-axis turbine remained challenging [9,10,11].
Based on the previous work of cross-flow (vertical-axis) turbines in counter-rotating configurations [12,13,14], a pair of laboratory-scaled cross-flow hydrokinetic turbines in counter-rotating configurations was experimentally recorded to produce higher power compared to a single turbine in the same flume facility [15]. The reason behind the power enhancement, however, could not be clearly distinguished between the increase in blockage ratio and the hydrodynamic interaction between the turbines. Therefore, simulations were taken into consideration since the blockage ratio could be varied freely.
This article presents an open-source 2D Reynolds Averaged Navier–Stokes (RANS) model of the laboratory-scaled cross-flow hydrokinetic turbines discussed in [15,16,17]. Following the guidelines by Bachant and Wosnik [18], the computational fluid dynamics (CFD) model was developed and applied for the specific turbine geometry within the open-source CFD framework OpenFOAM 4.1 [19]. Previous work suggested that implementing a 2D model with the Spalart–Allamaras turbulence model and a rotating mesh technique produced good results within a reasonable amount of required computational power [20,21,22]. The Spalart–Allamars RANS simulations of a single turbine were compared with experimental results and then used to study the turbine power output and relevant flow fields at four blockage ratio values. To the best of the authors’ knowledge, this is the first study that includes a RANS model of a cross-flow turbine validated with the instantaneous wake measurement at specific turbine phase angles. The results also provide insight into the blockage effect from a different perspective: The physics behind the production and maintenance of lift of the turbine blade at different blockage ratios.
Moreover, the model was adjusted for two turbines in two different counter-rotating configurations. The same analyses of torque production and maintenance were performed and compared with the single turbine results at the same blockage ratio. The results from the twin turbine system simulations suggest the advantages and disadvantages of the hydrodynamic interaction between the turbines depending on their relative position with respect to the incoming flow.

2. Blockage Effect on a Single Turbine

2.1. Materials and Methodology

2.1.1. Turbine Geometry

The physical vertical-axis turbine, which operated at the diameter-based Reynolds number of 0.2 × 10 5 , included three NACA 0012 blades. Each blade possesses a chord length of 25.4 mm mounted at a 34.1 mm radius and 15 pitch angle. All the 100 mm long blades were submerged approximately 80 mm under water inside the water tunnel cross section of 270 mm wide and 105 mm deep, providing an experimental blockage ratio of β = 19.3 % [15,16]. The turbine was designed based on the experimental constraints which were discussed in [15]. The geometry and relevant parameters used in this study are summarized in Table 1.

2.1.2. Pre-Processing

The baseline model was built according to the 2D physical dimensions of the water channel. The whole computational domain was 2 m long and 0.27 m wide with the turbine placed in the middle that corresponded to a stationary and a rotating sub-domain. The meshing process, shown in Figure 1, was performed with the open-source meshing code blockMesh and snappyHexMesh provided with OpenFOAM. A coarse background mesh was first generated by blockMesh with equal rectangular cuboid cells. The number of cells in each direction was chosen so that the cuboid sides were roughly equal. From the coarse mesh, the cell size was refined twice into refined zone 1 and 2 at the refinement level of 2 and 5, respectively. The cells were refined up to level 6 adjacent to the blade and 20 structured layers were extruded from each blade to solve for the boundary layer. The model was expected to resolve for the blade boundary layers and, thus, no wall function was applied and the relevant y + value was reported in the section below.
The rotating interface diameter was chosen to be 1.7 D t , where D t is the turbine diameter. Since there was the expectation to implement the same CFD model for later counter-rotating turbine simulations, this rotating zone diameter was the maximum possible value for 2 turbines placed side-by-side at the separation distance of 1.25 D t . Although refinement of level 5 at refined zone 2 might have been unnecessary if the rotating domain diameter was bigger, refined zone 2 resolution was decided to be at level 5 so that the small rotating diameter had no interference with the mesh around the blades. This method process allowed controlling the meshing resolution by changing only the number of cells of the background mesh in the streamwise direction.

2.1.3. Turbulence Model, Boundary Conditions, and Numerical Schemes

Choosing an appropriate turbulence model is one of the most crucial keys when implementing a RANS model. Although Rezaeiha et al. suggested variants of shear stress transport (SST) model [23] for a vertical-axis wind turbine, Bachant and Wosnik conluded that the Spalart–Allmaras model better predicted the power performance and the SST model accurately predicted the turbulent kinetic energy [18] for their cross-flow hydrokinetic turbine. For the specific turbine geometry discussed in this article, previous work had shown that there were no significant differences between the Spalart–Allmaras and k- ω -SST models in terms of the wake and power output [21,22]. Therefore, the Spalart–Allmaras turbulence model [24] was chosen for this study as it only has one transport equation and variable ( ν ˜ ), which made it easier to implement boundary conditions and was faster to solve numerically.
The experimental water tunnel was estimated to deliver approximately 0.3 m/s freestream velocity a 4% turbulent intensity at the inlet [21] and, thus, 0.3 m/s streamwise velocity and zero gradient pressure were imposed at the inlet. Additionally, the tunnel hydraulic diameter was calculated by the following equation:
D h = 4 A P ,
where A is the cross-sectional area and P is the test section circumference, which is 0.15 m. With these assumptions, the turbulent length scale l t could be calculated to be 5.7 × 10 3 m as 3.8% of the hydraulic diameter. The transport variable ν ˜ at the inlet was then fixed at 8.4 × 10 5 m 2 / s and calculated from the following equation:
ν ˜ = 3 2 ( U I l t ) ,
where U is the freestream velocity and I is the turbulence intensity. The same was also used to initialize the ν ˜ field throughout the whole computational domain. On the other side of the tunnel, the outlet pressure was fixed at atmospheric pressure with zero gradient velocity. The other boundaries are as follows: Channel side walls, blades, and top/bottom face. The channels side walls were modeled as zero velocity, zero gradient pressure, and zero ν ˜ . Similarly, zero relative velocity (as the blades were constantly moving), zero gradient pressure, and zero ν ˜ were imposed on the blade walls. The top and bottom surfaces, which were results from 1 cell extrusion in the third dimension, were modeled as empty faces for triggering OpenFOAM 2D solver.
As the flow was assumed to be incompressible and unsteady with no heat transfer, OpenFOAM’s pimpleDyMFoam solver was chosen since it permits dynamic mesh. All discretization schemes used were second order schemes for the sake of reliable accuracy.

2.2. Sensitivity Analysis

2.2.1. Convergence Criterion

Since the solution was both spatial and temporal sensitive, an iterative sensitivity analysis was conducted. The rotating zone speed was first fixed at 11.5 rad/s, which was the highest expected experimental turbine speed [15], and the average the turbine power coefficient was scrutinized for convergence behavior. The power coefficient C P is given by the following equation:
C P = P 1 2 ρ A t U 3 ,
where P is the produced power, ρ is the water density, and A t is the turbine frontal area. Since the produced power is the product of turbine rotational speed and the exerted hydrodynamic torque on the turbine, Equation (3) with a fixed turbine speed can be re-written as follows:
C P = ω t 1 2 ρ A t U 3 1 T t t + T T H d t ,
where ω t is the rotating speed, T is the turbine period, and T H is the instant hydrodynamic torque. After each rotation, the hydrodynamic torque as the sum of the viscous and pressure torque was extracted as a function of time to numerically integrate C P (Equation (4)) by using the trapezoidal rule.
For each case, the average power coefficient value was calculated after each rotation using Equation (4). An example of the convergence behavior can be observed in Figure 2. The calculated power coefficient typically converged into a value after 10–15 rotations. Qualitatively, all simulations were defined to be statistically converged when the difference in C P after each rotation was less than 0.1% for 10 consecutive rotations as suggested by Balduzzi et al. [25].

2.2.2. Iterative Spatial and Temporal Sensitivity Analysis

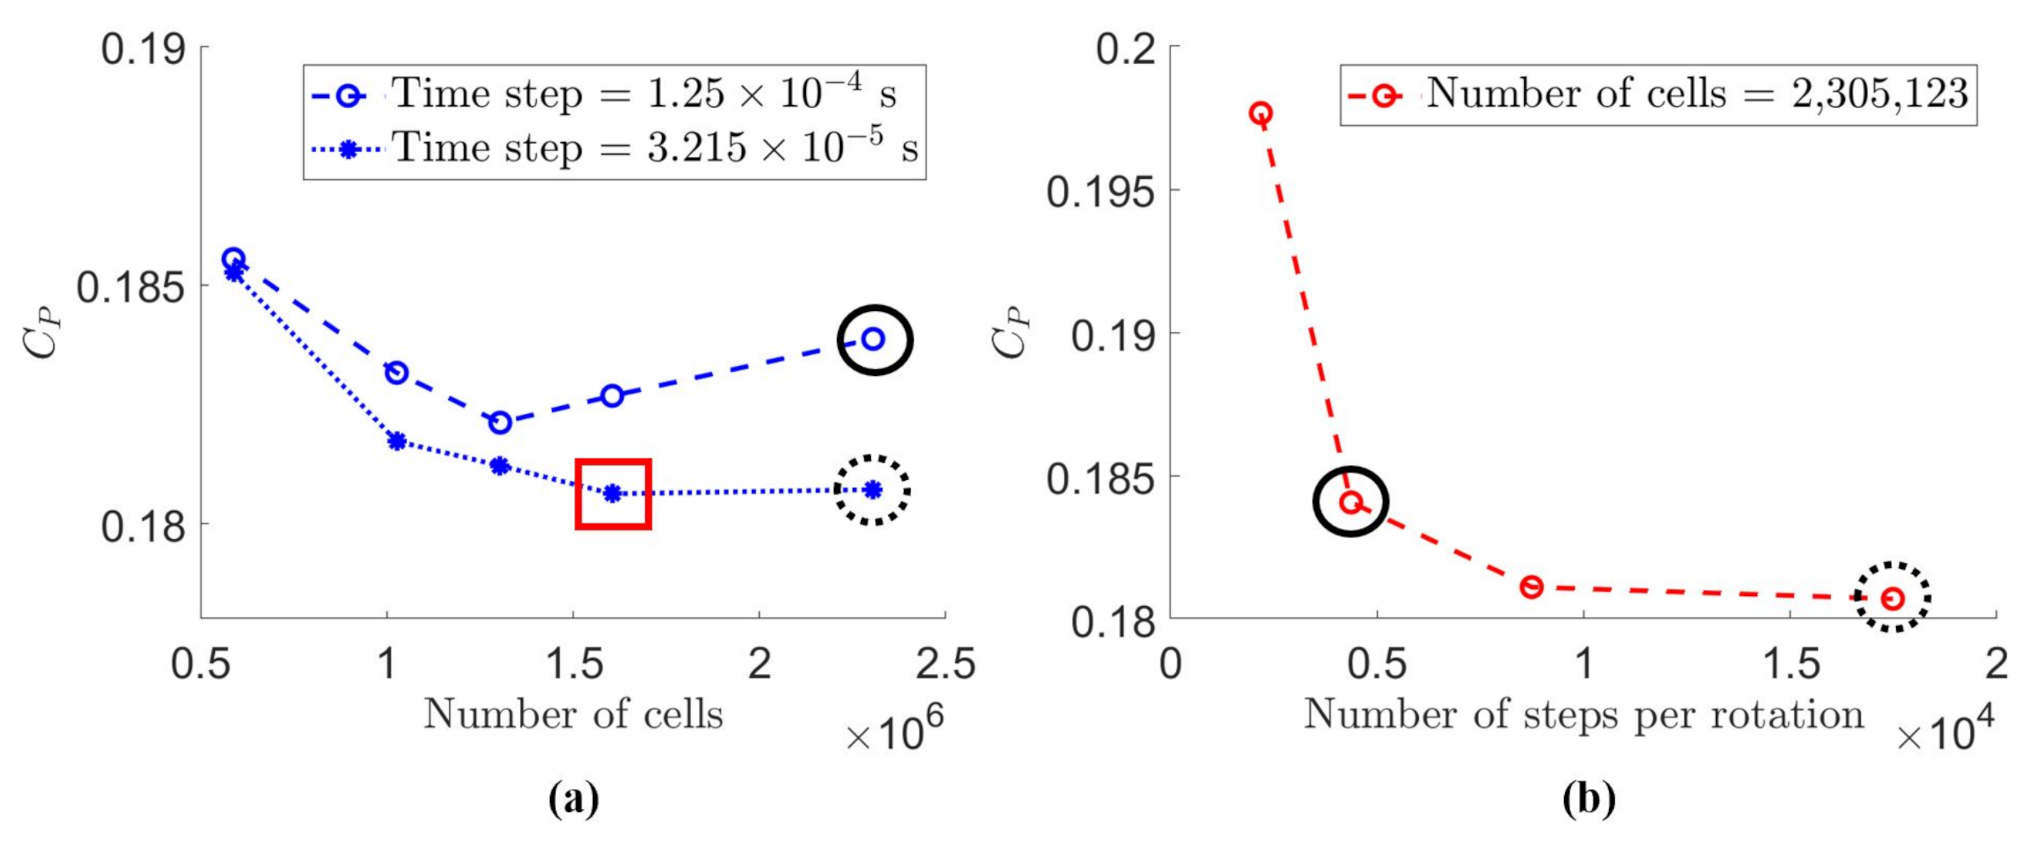
Following suggestions from preliminary studies described in [21,22], the time step was firstly fixed at 1.25 × 10 4 s, which created more than 4000 steps per revolution to conduct a mesh convergence study. All the meshes are summarized in Table 2.
As shown in Figure 3a, fixing the time step at 1.25 × 10 4 s (approximately 4370 steps per turbine rotation) and solving for the power coefficient at different meshing resolution did not result in a converged C P curve. Although the mean of the 5 C P values was only 0.93% different from the max and the min, the fact that the curve reached a local minimum value and then diverged indicated that the time step might have been inappropriate. Therefore, the finest mesh of 2.3 million cells was used for the second step of the iterative process. Figure 3b shows that refining the time step for this mesh resolution displayed a fully converged curve. The C P value at the finest time step of 3.125 × 10 5 s (about 17,480 steps per revolution), which was 0.23% different from the adjacent point, was used for the third step of the iterative process. With this temporal resolution, the power coefficient as a function of the number of mesh cells nicely converged. The last two points were only 0.049% different from one another and so the mesh with 1.6 million cells was chosen for the rest of this study.
From the iterative process, the finally chosen baseline mesh of 1,605,068 cells with a time step of 3.125 × 10 5 s (enclosed in the red rectangle in Figure 3a) was decided to be the best option. The uncertainty due to spatial and temporal resolution was estimated to be within 0.2%. The baseline model at this chosen resolution produced an averaged y + value of less than 0.1 on all the 3 blades. Occasionally, a maximum y + 3 was observed for a couple of cells in the trailing edge area where the boundary layers were detached. At the same time, the other cells on both sides of the airfoil where the boundary layers were attached had their y + value of less than 1.

2.3. Results and Discussion

From the baseline CFD model discussed above, cases at four different blockage ratios and various tip-speed-ratio were simulated and compared. While the main goal of the study was to obtain insights into the physics behind the effect of blockage on torque production, the numerical model was first compared with experimental results to evaluate its reliability. Difficulties, however, remained in comparing 2D simulations with real 3D experiments.
The authors were aware that it is almost impossible to validate 2D CFD results with experimental measurements in the case of a vertical-axis turbine with high solidity and operating tip-speed-ratio of approximately 1. Nevertheless, the presented results provided better understanding of the physics behind this turbine geometry and prepared the authors for better numerical studies in the future. Since experimental data were available, the comparison is shown for the reader’s interest.
In terms of power output, Bachant and Wosnik stated that a 2D model with the exact physical dimensions of the water tunnel would dramatically over-predict the power performance due to artificial blockage increases [18]. Later working on the same turbine, Bianchini et al. suggested that 2D simulations in an “open-field” setup would better match the experimental results with blockage [26].
Since this study compares different blockage ratios and another research goal is to simulate a twin turbine system in counter-rotating configurations, the sub-section below presents power coefficient correction models for the numerical and experimental results and compares them in “corrected for open-field” values. The interested blockage ratios β were: 19.7%, 25.3%, 33.8%, and 50.6%.

2.3.1. Comparison with Experimental Results

In order to correct the numerical power coefficient results, the scheme proposed by Bahaja et al. [27] and derived by Kinsey and Dumas [28] was adopted. Figure 4 displays the numerical power curves and their corrected versions. It was obvious that, at the interested blockage ratios, the turbine power output significantly increased as the blockage ratio increased. The method by Bahaja et al. that performs the correction by using the thrust coefficient shows its robustness as the four curves collapsed nicely into a single curve.
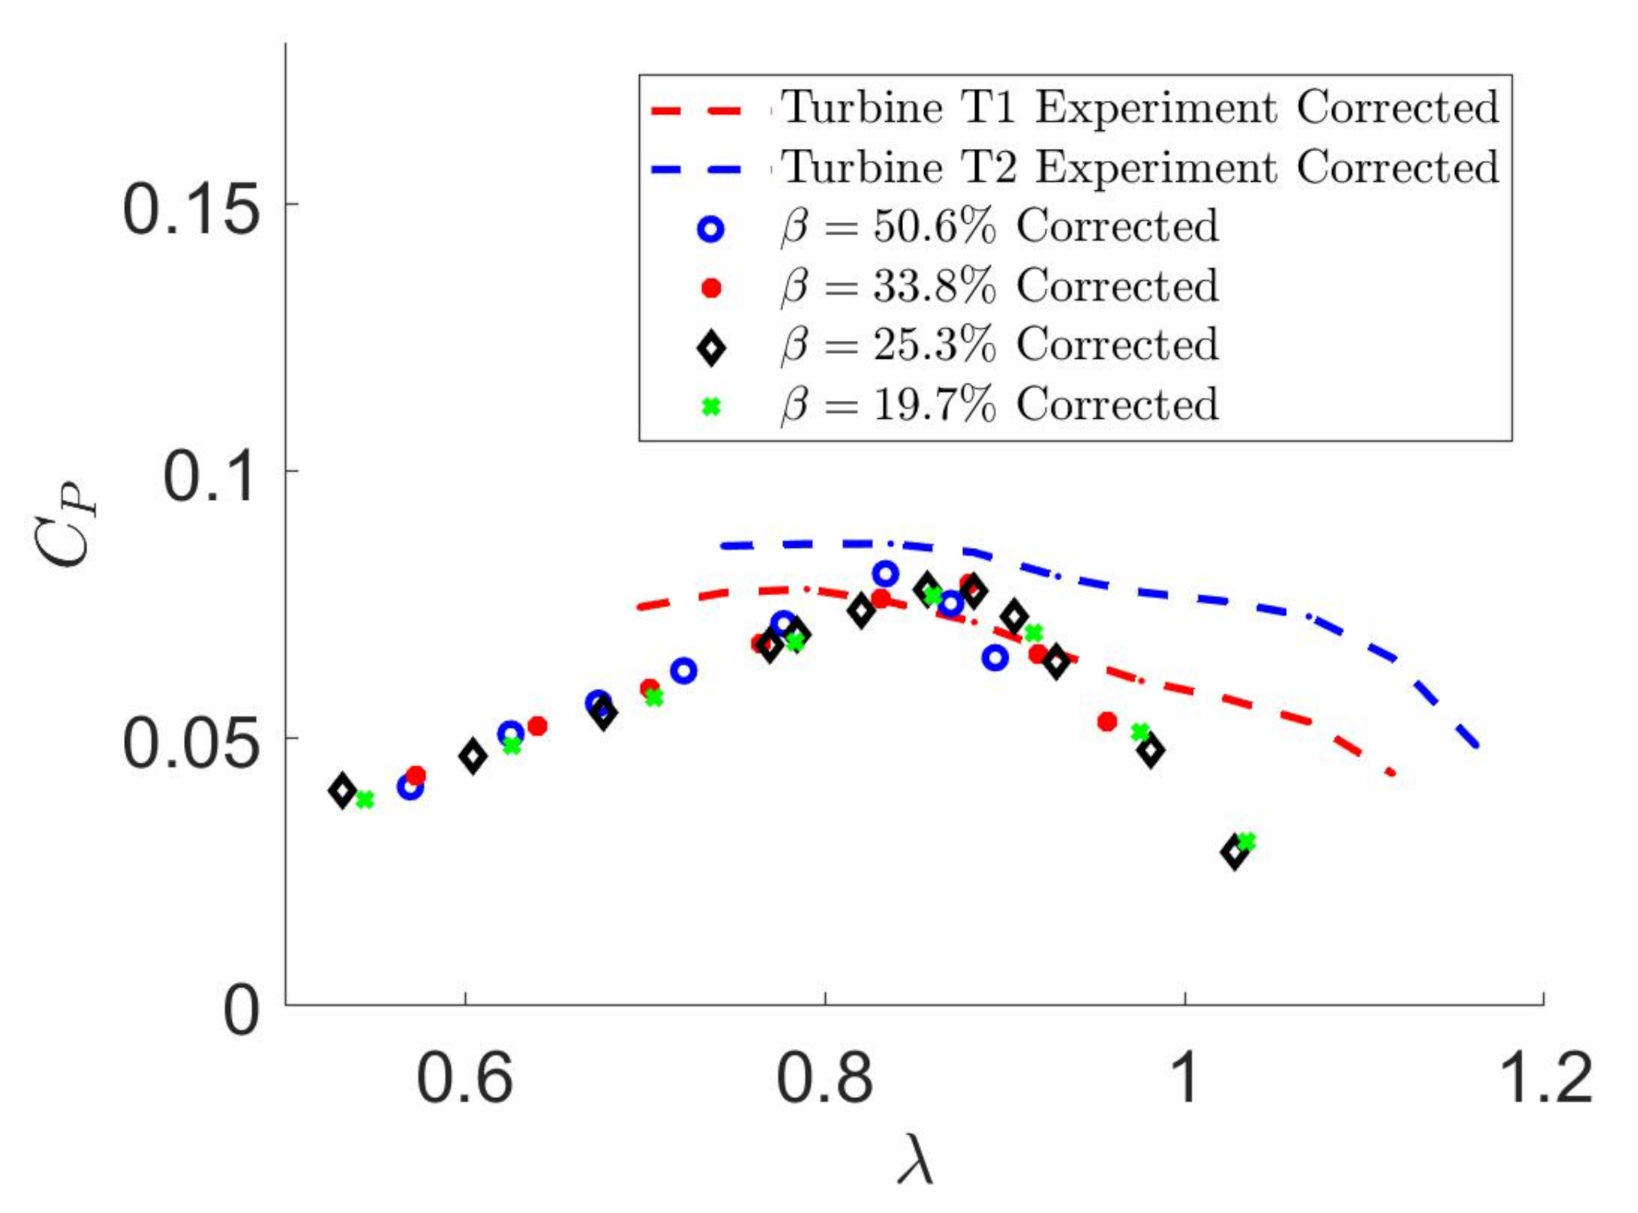
For the experimental power curve previously shown in [15], no thrust was measured and, thus, a different correction method was needed. Since the near-wake was measured in [16], the cross-sectional area of the wake downstream (called A 1 by Ross and Polagye in [5]) could be estimated. The A 1 / A t ratio, where A t is the turbine frontal area, was approximated to be 1.2875 to input into the correction method proposed by Mikkelsen and Sorensen and formulated by Ross and Polagye [5]. The experimentally and numerically corrected C P can be observed in Figure 5. While the A 1 / A t ratio was only a rough estimate from the 2D PIV measurement and the shapes of the experimental and numerical curves were not similar, the corrected power curves quantitatively peaked at the same values. These experimental and numerical operating points around the peaks in Figure 5 were the closest values and, thus, CFD results at the related tip-speed-ratios were extracted for further analyses. The difference between experimental and simulation of the other points can be attributed to the 3D effect and inaccuracy in prediction of the flow detachment azimuthal angle. The authors hope to address these points in future work.
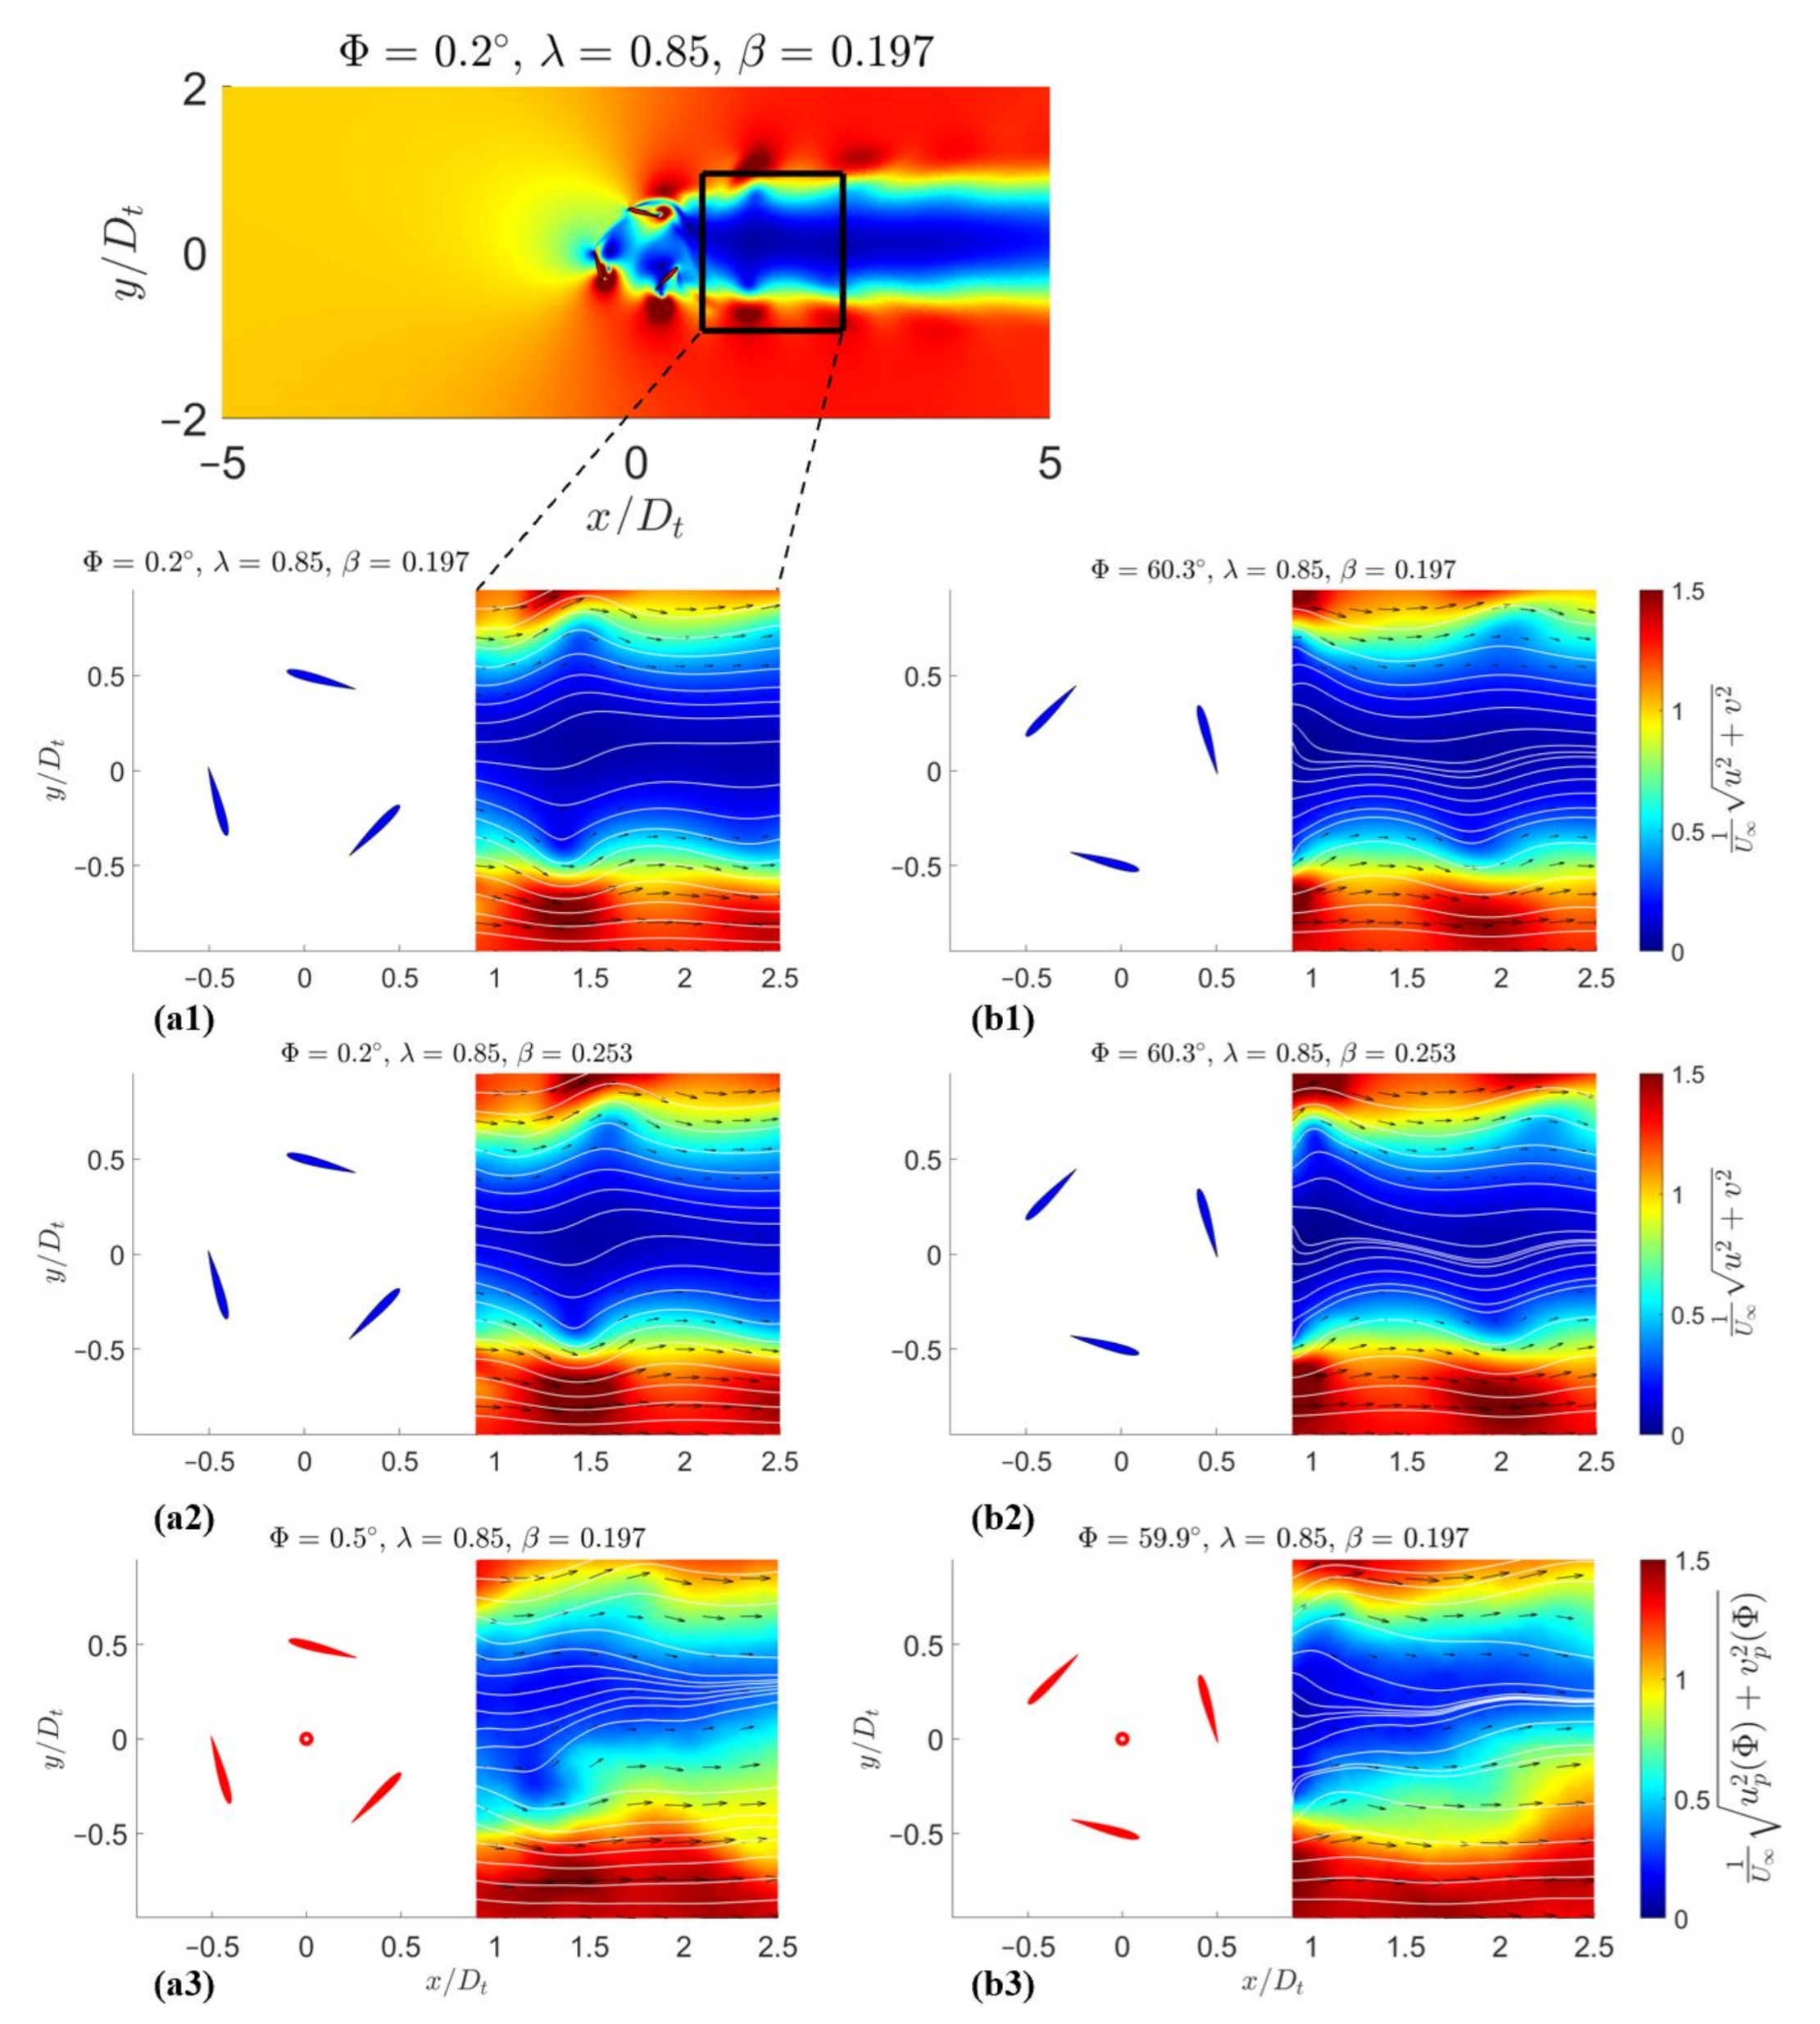
Other than the measured C P curve, experimental data were also available in the form of the 2D near-wake [16]. Table 3 summarizes the interesting operating points of the turbine that were used to compare the experimental and numerical wake. As the PIV measurement window was limited, the CFD results were extracted over the exact same region for comparison (Figure 6). Both the experimental and numerical cases shown in Table 3 had the same tip-speed-ratio. The turbine phase (azimuthal angle) Φ was defined similar to the experiments in [16]. The phase reaches its zero value at the position where the blade vector is opposite to the freestream velocity vector. While numerical model 1 was built with the same blockage ratio as the experiment, numerical model 2 (the baseline) possessed the same dimensions as the physical water tunnel.
Qualitatively, numerical model 1 displayed in Figure 6a1,b1 simulated better by-pass flow compared to the experiment at the same λ while numerical model 2 accelerated the by-pass flow faster. On the other hand, results of the higher blockage case with the same physical dimensions matched more closely with the experiment in terms of the details in the slow-zone. This observation is consistent with the discussion by Bianchini et al. [26] as 2D simulations reduce mixing in the wake and non-confined 2D simulations would provide a better match to related experiments.

2.3.2. The Laboratory Frame of Reference

The torque that was sampled at every single time step of 3.125 × 10 5 s was extracted for one rotation after the convergence criterion was reached for comparison between cases. The torque curves were plotted against the turbine azimuthal angle in Figure 7 for two cases: (a) λ = 0.85 (less than 1) and (b) λ = 1.42 (more than 1). The eight points are highlighted in Figure 4. Figure 7 shows that the majority of differences in C P could be attributed to significant differences in the positive torque phase. The flow was sampled at 100 Hz to observe the physical phenomena around the blade during the positive torque phase.
The positive torque phase of the baseline model at λ = 0.85 in Figure 8 shows signs of the leading edge vortex (LEV). At this rotating speed of 7.5 rad/s, the blade enclosed in the red dashed lines (Figure 8a) attained its maximum torque around Φ = 85 . 3 in Figure 8b. Figure 8c–e displays an LEV on the inner side of the blade. As the blade switched to its negative torque zone at Φ = 184 . 9 , Figure 8f shows that at a higher azimuthal angle, the LEV was mixed into the wake while another vortex was shed from the trailing edge on the outer side.
Additionally, the behavior of the torque curves during their positive phase was similar between the two turbine tip-speed-ratios (Figure 7). At λ = 1.42 (Figure 7b), the torque curves reached their positive values around the azimuth of 30 to 180 . Increasing the blockage made the torque curve attain its maximum value at a lower azimuthal angle and switch to the negative phase at a higher azimuthal angle. The net effect of this behavior was the dramatically higher power output for higher blockage ratio.
At the angle where the turbine attained its maximum torque value, the vorticity fields at the four blockage ratios show minimal difference (Figure 9) while pressure fields display similarity with the classic airfoil theory (Figure 10). The torque due to airfoil lift was generated by the pressure difference between the inner (suction) and outer (pressure) side of the turbine blade. Higher blockage ratio resulted in higher pressure on the outer side and lower pressure on the inner side, which created higher hydrodynamic torque. Moreover, no vortex shedding near the leading edge was observed at these angles.
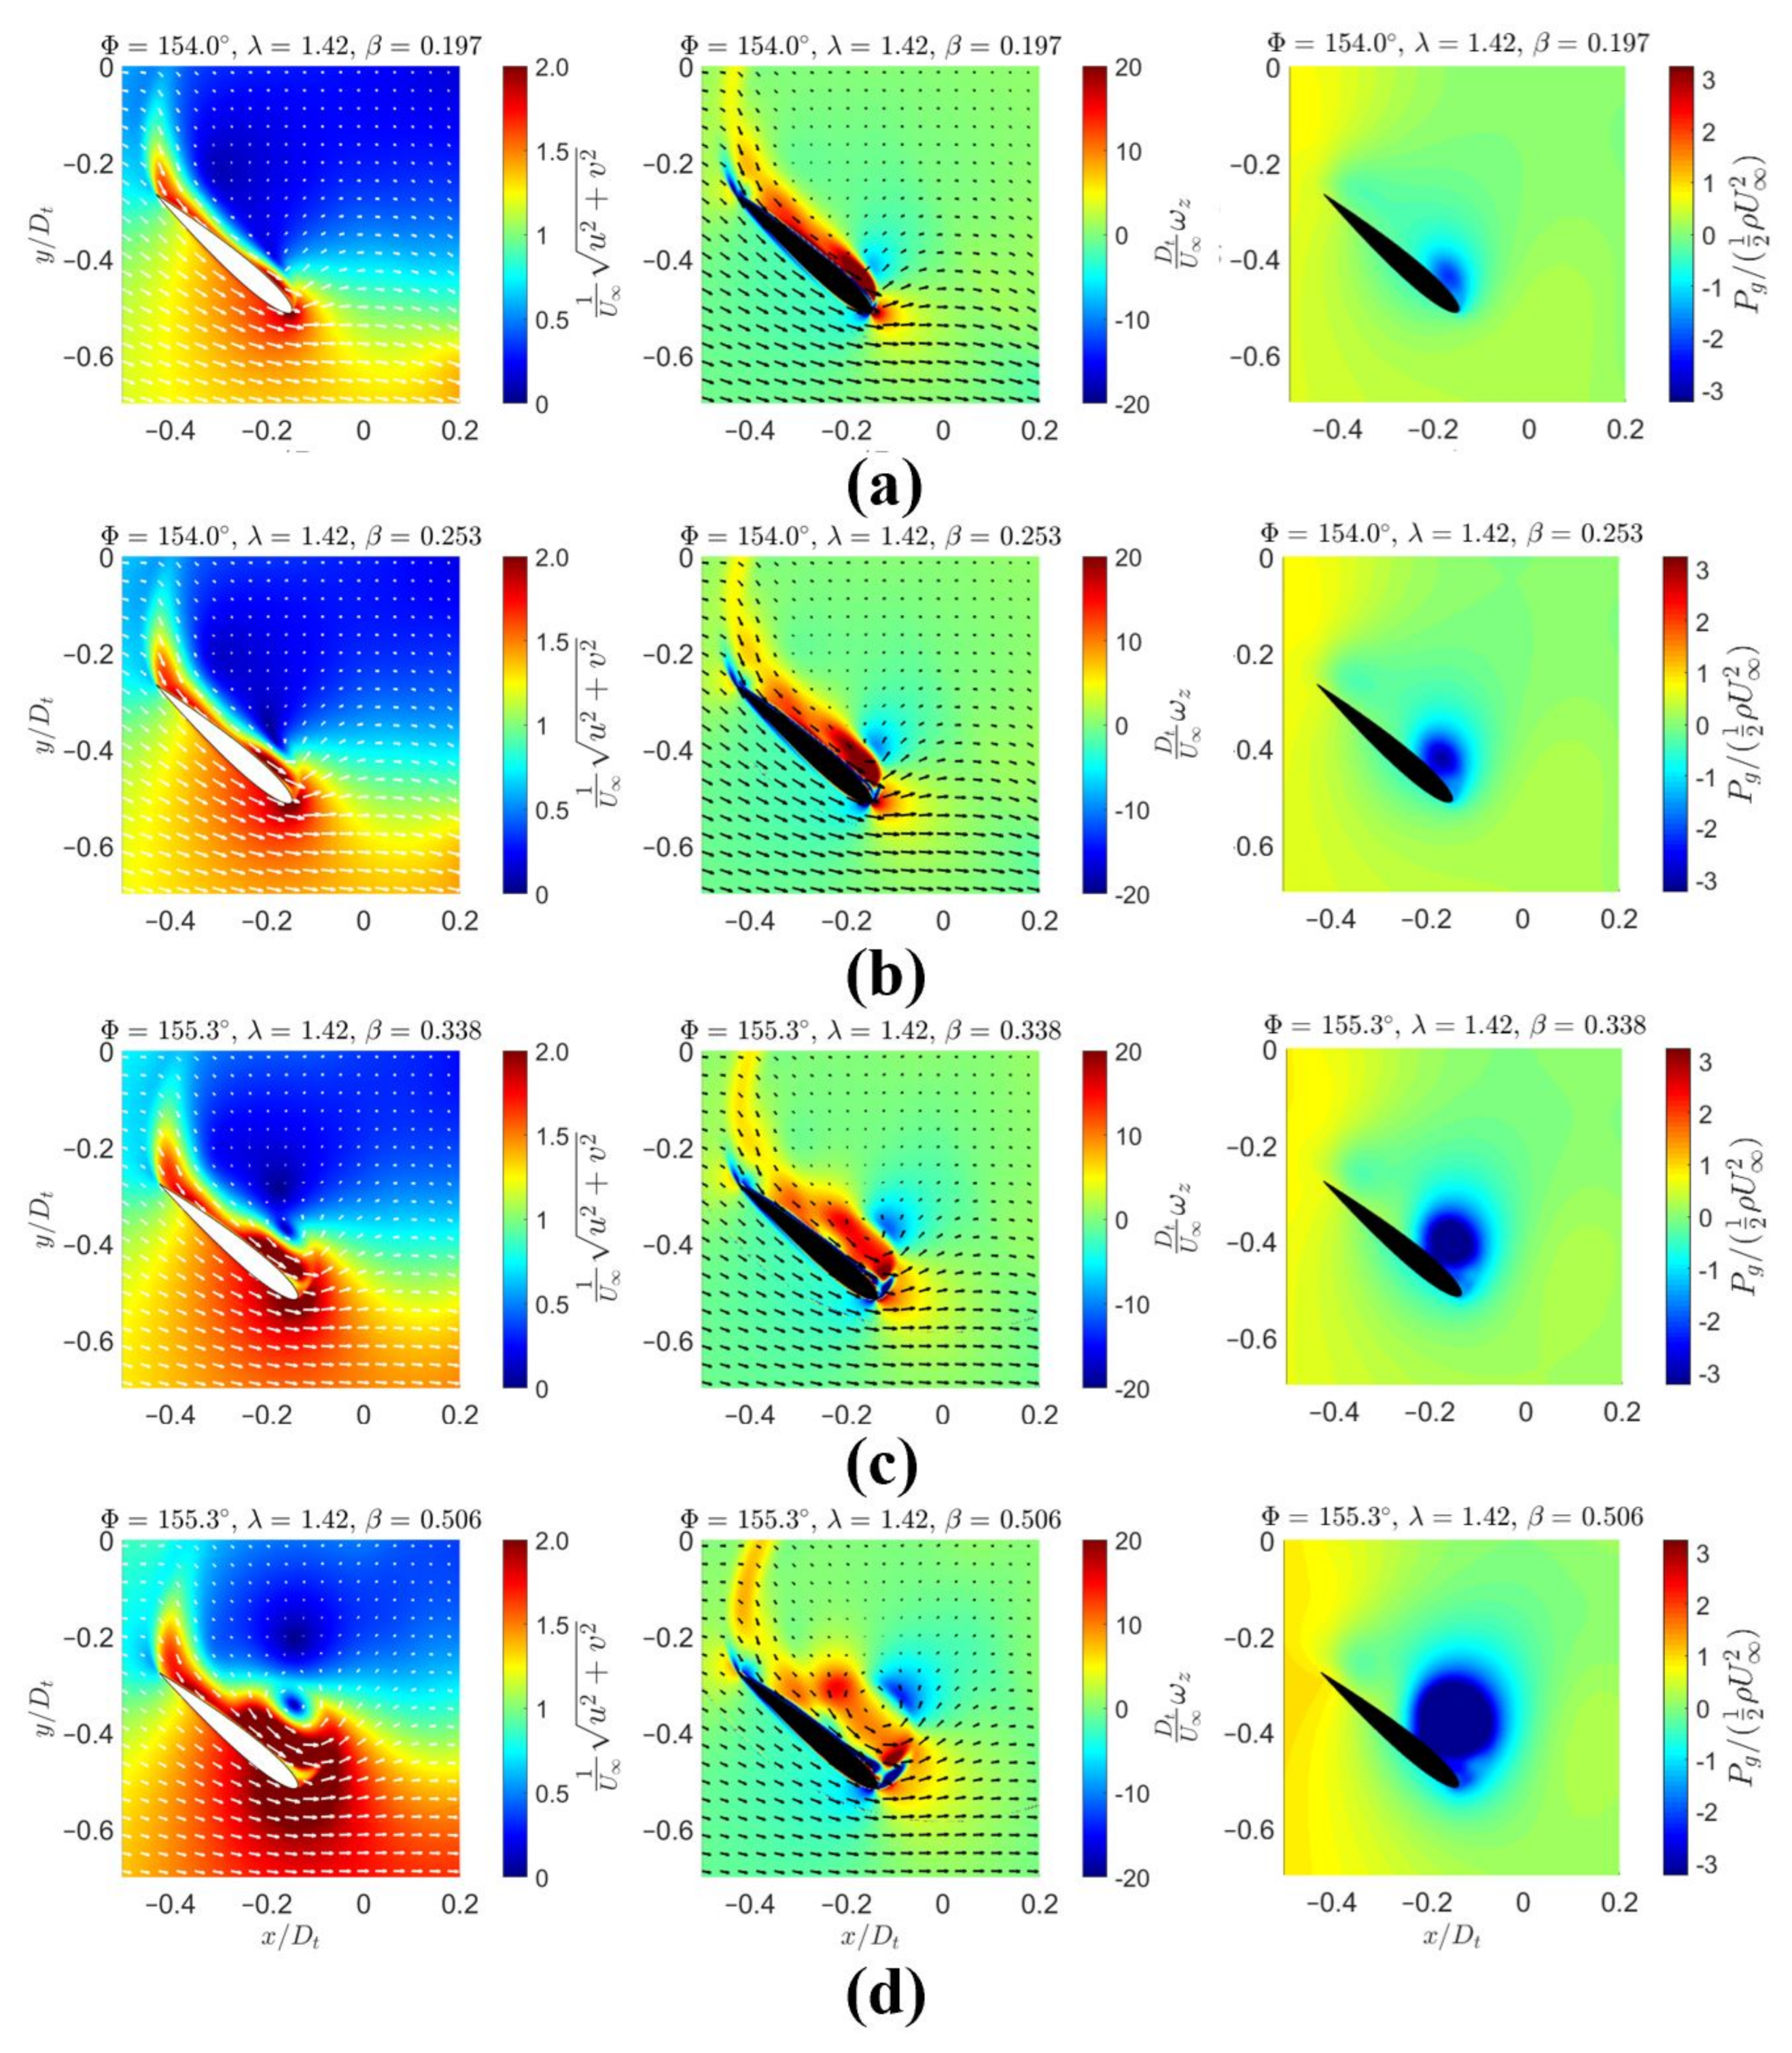
After the blade reached its maximum torque point, clear LEV structures could be observed for the two highest blockage ratio cases (Figure 11c,d). In terms of the pressure fields, hardly any differences on the outer side but significantly lower pressure on the inner side of the turbine could be observed (Figure 12). The LEVs in Figure 11c,d not only created higher lift and torque but also reduced the vorticity near the leading edge. Comparing the case of β = 0.506 and β = 0.338 , the LEV of the higher blockage ratio was bigger and stronger. In the two lower blockage ratio cases (Figure 11a,b), no obvious LEV structure was observed at this turbine speed and the torque generation could be explained by the classic airfoil theory.
Observation of the flow (velocity, vorticity, and pressure field) in the laboratory reference frame shows that the torque (dominantly due to the lift) generation mechanism could be explained by the classic airfoil theory. After attaining the maximum torque value, the pressure difference between the two sides of the blade continued to decrease and, thus, reduced the lift and torque. By increasing the blockage ratio and the associated by-pass flow velocity, a vortex could be generated and kept attached at on the suction side at the leading edge to maintain the lift force. Any explanation related to the airfoil theory should be more clear by looking at the flow in the blade reference frame in the subsequent session.

2.3.3. The Blade Frame of Reference

The transformed coordinate system ( X T r , Y T r ) of the blade was defined as the streamwise velocity moves from left to right, the blade chord pitches up at 15 , and the quarter-chord point is fixed at ( X T r = 0 and Y T r = R t ) . This coordinate system provides a similar field of view as the blade at 0 azimuth in the laboratory reference frame. Moving with the blade (rotating counter-clockwise) in this frame is equivalent to rotating the velocity field by the blade azimuthal angle Φ in the clockwise direction with an added term in the X T r direction due to the blade movement. The clockwise rotation matrix has the following form:
R ( Φ ) = cos ( Φ ) sin ( Φ ) sin ( Φ ) cos ( Φ ) ,
which can be used to calculate the coordinates of each point as follows
X T r Y T r = 1 D t R ( Φ ) x y
and the transformed velocity vector at each point is as described:
u T r v T r = 1 U R ( Φ ) u v + ω t R t 0 .
Figure 13 displays the transformed velocity field of the four cases before the blade attained its maximum torque value. The angle between the relative incoming flow and the blade chord was qualitatively similar for all the blockage ratios and the difference was mainly the velocity magnitude on the inner side. Higher blockage ratios created faster velocity on the suction side and smaller wake, which explains the higher torque and power coefficient. On the other side of the positive torque phase, all the transformed velocity fields show clear LEV structures in this reference frame (Figure 14). Similar to observation above, the higher the blockage was, the bigger and stronger the LEV became. Therefore, it could be concluded for this turbine geometry that the positive torque phase could be divided into two halves:
(1)
Before the maximum point, the torque generation was due the attached fast flow on the inner of the blade, which created an associated low pressure region and suction force. As the azimuthal angle increased, the relative angle between the incoming flow and the blade chord also increased and resulted in higher lift and torque. Higher blockage ratio created faster flow on the suction side and smaller area of the blade wake.
(2)
After reaching the maximum torque, the blade experienced the dynamic stall effect and the lift force was maintained by a vortex shed from the leading edge and attached on the suction side. Higher blockage ratio created a bigger and stronger vortex, which maintained higher lift and torque.
Figure 13. The velocity fields in the blade reference frame before it reached the maximum torque of 4 blockage ratios: 19.7 % (a), 25.3 % (b), 33.8 % (c), and 50.6 % (d). On each figure, the lower surface is the turbine inner side and the upper surface is the turbine outer side.
Jmse 09 00829 g013
Figure 14. The velocity fields in the blade reference frame after it reached the maximum torque of 4 blockage ratios: 19.7 % (a), 25.3 % (b), 33.8 % (c), and 50.6 % (d). On each figure, the lower surface is the turbine inner side and the upper surface is the turbine outer side.
Jmse 09 00829 g014
Both of the above observations shared the same phenomenon that moving the outer side of the turbine closer to a wall not only accelerated the bypass flow but also forced the flow into the inner of the turbine, which was the basic vortex generation mechanism. Figure 15 compares the turbulent viscosity field between the baseline model and the twice blockage ratio case. Interestingly, higher flow blockage reduced the shear rate on the turbine outer side but increased the shear rate on the inner side, which resulted in a stronger vortex. It should be noted that another mechanism for enhancing the lift is by forcing the out-of-plane motion on the suction side, stretching the dynamic stall vortex, and intensifying the related vorticity. However, this mechanism could be observed in 3D simulations only.

3. Twin Turbine Configurations

3.1. Materials and Methodology

3.1.1. System Geometry

Based on the baseline RANS model of a single turbine (at the blockage ratio β of 25.3%), two variants were built by shifting the turbine closer to the tunnel wall and by adding the second one symmetrically over the tunnel center line. The variants, which are shown in Figure 16, were called “Forward” and “backward” counter-rotating configurations, which were similar to the experimental convention. The backward configuration had the turbine blades moving opposite to freestream velocity in the middle region, while the forward configuration had the blades move in the same direction as the freestream velocity. Since adding another turbine essentially increases the blockage ratio by a factor of 2, the CFD results of the twin turbine system should be compared with the single turbine results at both of the relevant blockage ratios.

3.1.2. Simulation Setup

The OpenFOAM solver, turbulence model, and boundary conditions were set exactly the same as the single turbine CFD model. As the rotating zone of the single turbine case was purposely set to be less than half of the turbine separation distance, the second turbine could be added without any extra procedures. An illustration of the twin system mesh can be in Figure 17. Although the turbines were set at zero phase angle difference and the CFD domain could be modeled as only one half of the existing one with a symmetry boundary condition, this setup allows future studies of the phase angle difference effect. By adding the second turbine, the number of cells increased up to 1.6 million and the time step was kept at 3.125 × 10 5 s.
Convergence criterion was also similar to the single turbine CFD study. Since the meshes were not perfectly symmetrical, a slight difference between the turbine power output was recorded, as shown in Figure 18a. For the cases that fully reached the convergence criterion, the differences in the final power coefficient C P between the turbines were less than 0.2%, which was also the uncertainty from the previous spatial and temporal sensitivity analysis. For some of the operating points, fluctuations of the power output were observed as displayed in Figure 18b. The same behavior was observed and discussed by Kinsey and Dumas [28]. For some operating conditions, vortex interactions in the near-wake were characterized by slower time scales and had a small impact on the power performance. When fluctuations were observed, the reported C P value was the averaged over 10 rotations and the uncertainties were within 1.5%.

3.2. Results and Discussion

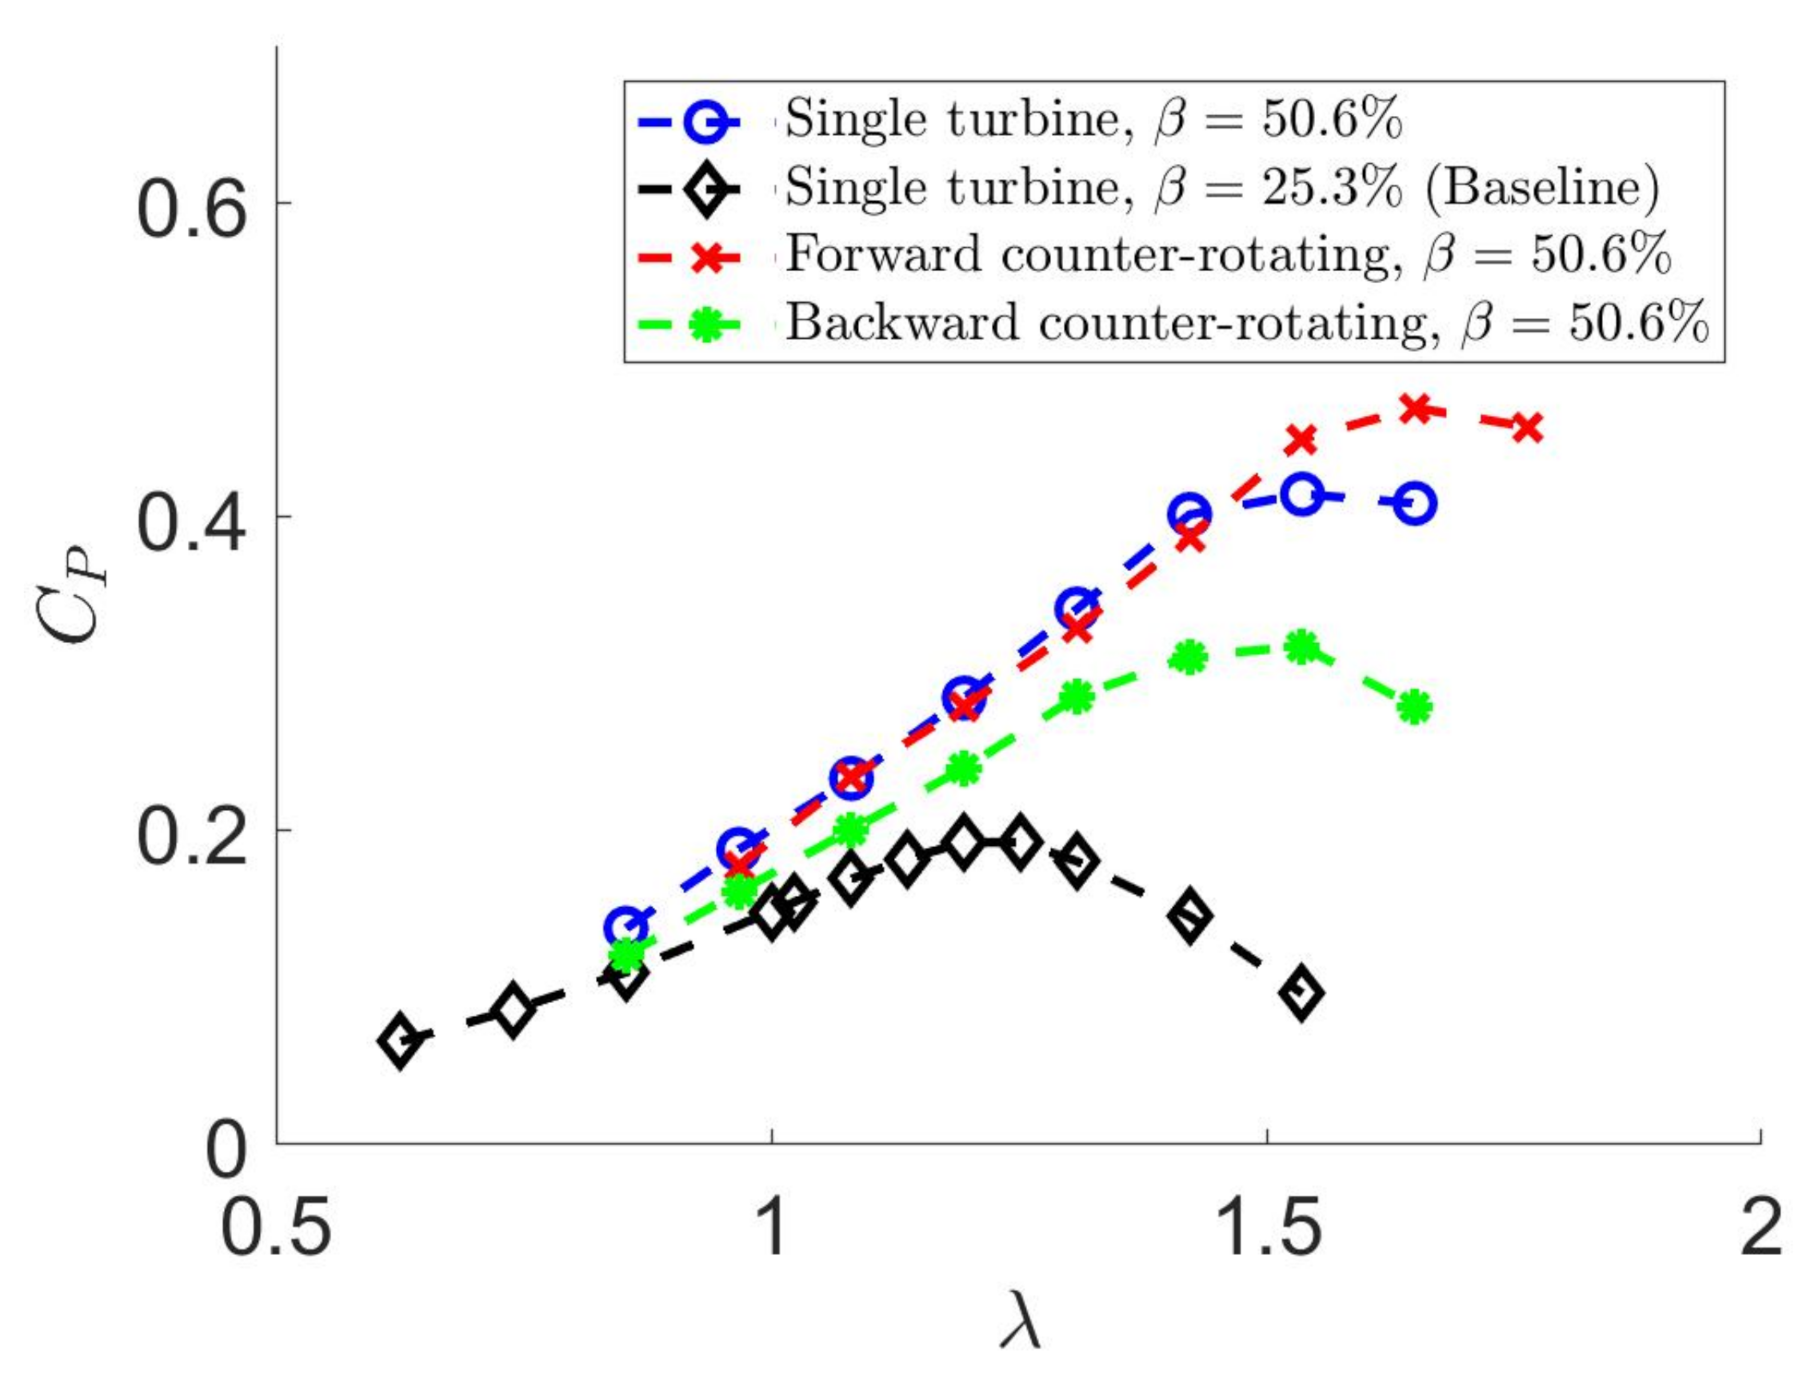
The model was firstly used to calculate the power curves of the two counter-rotating configurations shown in Figure 16c,d to compare with the single turbine cases illustrated in Figure 16a,b. For each case, the two rotating zones were fixed at a constant speed. As it can observed in Figure 19, counter-rotating turbines in the same physical water tunnel significantly increased the power output, which was consistent with the previous experimental observations. The enhancement was attributed to the blockage increase and the blade interaction.
In order to distinguish between the two effects, the power output of the twin turbine system was compared with the single turbine power performance at the same blockage ratio. Figure 19 shows that on the lower tip-speed-ratio side the forward configuration produced almost the same amount of power as the single turbine, while the backward configuration power output was significantly lower. The summary of the maximum power output for all of the configurations can be observed in Table 4. The relevant flow fields were then deeper analyzed to obtain insights into the physics. The interested operating points were ω t = 12.5 rad/s ( λ = 1.42 ), which was extensively discussed in the single turbine CFD study, and ω t = 13.5 rad/s ( λ = 1.53 ), which was the maximum power point of the single turbine and backward configuration.
The torque curves of the interested turbine speeds can be observed in Figure 20. For both of the cases, the backward counter-rotating configuration produced lower positive torque and slightly higher negative torque compared to the other two cases. At λ = 1.42 (Figure 20a), the forward counter-rotating configuration created higher positive torque but also higher negative torque compared to the single turbine, resulting in relatively similar power coefficient. At λ = 1.56 , while the amount of difference in positive torque of the forward twin turbine and single turbine configuration stayed similar to the other case, the forward configuration produced similar negative torque which created higher power output.
In terms of torque production, flow field observations show evidence that the general physics were the same for the single and twin turbine configurations. During the first half of the positive torque phase, the pressure on the inner side of the blade was lower compared to the outer side, which created a lift force and associated torque (Figure 21 and Figure 22). After reaching the maximum value, the torque was maintained by the leading edge vortex (LEV) (Figure 23 and Figure 24) until this structure detached and mixed into the wake. While the general physics were similar for the cases, different geometry created minor differences in the flow approaching angle and velocity magnitude, which affect the pressure on the blade.

3.2.1. The Laboratory Frame of Reference

In the laboratory reference frame, the velocity, vorticity, and pressure fields of the single, forward, and backward configurations show that the flow fields at Φ 100 (around the maximum torque point) were qualitatively similar. The interaction between the turbine and the channel walls as well as between the two turbines changed the velocity magnitude.
On the pressure side of the blade (turbine outer side) and the suction side (turbine inner side), the velocity magnitude of the backward configuration Figure 21c was smaller compared to the other cases, which resulted in significantly lower pressure magnitude and lower pressure difference between the sides. Inside the turbine, the flow was faster for the forward configuration compared to the single turbine case, which created slightly lower pressure difference and lower hydrodynamic torque.
On the other side of the positive torque phase, a clear difference can be observed between the configurations as shown in Figure 23. The interaction reduced the velocity magnitude on the blade pressure side of the backward configuration but enhanced it for the forward configuration compared to the stand-alone turbine. This tendency resulted in the strongest and biggest LEV for the forward counter-rotating turbines and, thus, increased the hydrodynamic torque. Nevertheless, these effects could be more clearly observed in the blade-fixed reference frame.

3.2.2. The Blade Frame of Reference

Similar to the study of a single turbine in different blockage ratios, the velocity fields were transformed into the blade reference frame for better understanding of the physics and comparison with the classic airfoil theory.
At Φ 55 in the first half of the positive torque phase, the blade interacted with one of the channel walls for the single and forward configuration and with the other turbine for the backward configuration. Comparing the single (Figure 25a) and forward (Figure 25b) configuration, the flow approaching angles were qualitatively similar while the flow on the pressure side of the forward configuration was relatively faster. Although the two cases possessed the same blockage ratio, the turbine blade in the forward configuration was farther from the wall, which interestingly accelerated the flow faster on its pressure side. Instead of a fixed wall, the blade in the backward configuration interacted with another turbine blade (Figure 25c), which significantly decelerated the incoming flow. The deceleration was due to the other blade movement, which was opposite to the freestream velocity vectors. Therefore, it can be concluded that while a fixed wall on the turbine outer side could be taken advantage of to enhance the torque production, a moving object opposing the freestream flow created a negative impact on the turbine performance.
In the later half of the positive torque phase, the blade in the single and backward configuration interacted with the bottom tunnel wall while interacting with another blade in the forward configuration. The forward configuration LEV structure was the strongest among the three cases. Figure 26b suggested that the other turbine blade created a positive impact on the torque with its movement. The other blade movement forced the flow accelerating over the pressure side of the interested blade resulting in a stronger attached LEV to maintain the lift. At this azimuthal angle, the turbine blade in the backward configuration was farther from the wall, which created a smaller LEV compared to the single turbine configuration.
It is worth noting that while blade cavitation can be a serious problem in hydro turbine design [29,30], the specific turbine geometry presented in this article encountered much higher pressure compared to the vapor pressure of water at room temperature (Figure 10, Figure 12, Figure 22 and Figure 24) and, thus, no cavitation phenomenon was expected.

4. Summary and Conclusions

A 2D open-source Reynolds-Averaged Navier–Stockes (RANS) based on the Spalart–Allmaras turbulence model was presented and discussed in this article. After an iterative sensitivity analysis, the numerical model was compared with previously published experimental results and reached quantitative agreement in terms of turbine power performance around the peak after blockage correction. The model was then applied to simulate the flow around the laboratory-scaled cross-flow turbine at four blockage ratios.
The flow fields in the laboratory and rotating blade reference frame suggested the basic mechanism behind the turbine torque production and maintenance. During the positive torque phase, the flow accelerated on the inner surface of the turbine blade, which created a low pressure region and the associated lift and torque. The torque was then maintained by a vortex shed from the blade leading edge and attached on the inner surface until this vortex was mixed into the turbine wake.
At the same channel inlet velocity, increasing the blockage ratio forced the flow into the inner area of the turbine resulting in higher lift force during the first half of the positive torque phase and a stronger and bigger leading edge vortex during the other half. The results of this work explained in depth the mechanism of torque enhancement and maintenance when increasing the blockage ratio.
The CFD simulations also show that placing two turbines in counter-rotating configurations produced significantly higher power (more than double at the peak) compared to a single one in the same physical water tunnel. This enhancement effect could be simply explained in that physically doubling the blockage ratio would force more flow into the blades and produced more power. Interestingly, simulations of the forward counter-rotating turbine case still produced higher power compared to the single turbine configuration at the same blockage ratio. At the peak power output, a 13.3% increase in the system power coefficient was observed for the forward counter-rotating configuration ( C P = 0.470 ) compared with the single turbine ( C P = 0.415 ).
Deeper analyses of the flow fields showed that the enhancement was due to interactions between the turbine blades and between the blades and the channel walls. Compared to the single turbine case, the forward configuration blade, during the former half of the positive torque phase, was closer to the wall, which resulted in higher pressure on its suction side and the associated lower torque. The backward configuration blade was in the vicinity of another blade, which moved opposite to the freestream and created significantly lower pressure on its pressure side and higher pressure on its suction side; thus, this ultimately reduced the torque. On the other side of the torque phase, interacting with another turbine blade in the forward configuration accelerated the flow over its suction side and resulted in a stronger LEV and higher torque. The blade in the backward configuration was farther from the channel wall compared to the single turbine cases, which reduced the flow into the turbine inside the area and created a smaller and weaker LEV.
Therefore, the following are concluded for this turbine geometry:
(1)
At the same blockage ratio, moving the turbine closer a fixed wall created positive impact on the positive torque phase.
(2)
Placing a moving object near the turbine could have both positive and negative impact depending on the movement direction of the object. Specifically, another turbine blade moving against the incoming freestream flow would have reduced the torque while movement in the same direction of the freestream created a stronger and bigger LEV to maintain higher hydrodynamic torque.
Lastly, previous study of this turbine geometry in different blockage ratios show great agreement with analytical methods for blockage correction, which suggested that this turbine dynamic was no different from industrial scaled turbines. As a consequence, this turbine geometry cannot be scaled up but the discussions of turbine dynamic in this article is expected to remain valid for bigger turbines.

Author Contributions

Conceptualization, M.N.D. and S.O.; methodology, M.N.D.; software, M.N.D.; validation, M.N.D.; formal analysis, M.N.D. and S.O.; investigation, M.N.D.; resources, S.O.; writing—original draft preparation, M.N.D.; writing—review and editing, S.O.; visualization, M.N.D.; supervision, S.O.; project administration, M.N.D. and S.O.; funding acquisition, S.O. All authors have read and agreed to the published version of the manuscript.

Funding

This research received no external funding.

Institutional Review Board Statement

Not applicable.

Informed Consent Statement

Not applicable.

Data Availability Statement

Not applicable.

Acknowledgments

M.N.D. thanks Koji Fukagata, Keita Ando, and Ivan Alayeto for their fruitful discussions. The authors also thank Hisae Mizuno for her endless help with the grant and logistics paperwork. This research was partly supported by the Keio Design The Future Award and the Keio Leading-edge Laboratory of Science and Technology Grant.

Conflicts of Interest

The authors declare no conflict of interest.

Abbreviations

The following abbreviations are used in this manuscript:
MHKMarine hydrokinetic turbine;
VAWTVertical axis wind turbine;
PIVParticle image velocimetry;
CFDComputational fluid dynamics.

References

  1. Consul, C.A.; Willden, R.H.J.; McIntosh, S.C. Blockage effects on the hydrodynamic performance of a marine cross-flow turbine. Philos. Trans. R. Soc. A Math. Phys. Eng. Sci. 2013, 371, 20120299. [Google Scholar] [CrossRef] [PubMed]
  2. Goude, A.; Agren, O. Simulations of a vertical axis turbine in a channel. Renew. Energy 2014, 63, 477–485. [Google Scholar] [CrossRef]
  3. Dossena, V.; Persico, G.; Paradiso, B.; Battisti, L.; Dell’Anna, S.; Brighenti, A.; Benini, E. An Experimental Study of the Aerodynamics and Performance of a Vertical Axis Wind Turbine in a Confined and Unconfined Environment. J. Energy Resour. Technol. 2014, 137, 051207. [Google Scholar] [CrossRef]
  4. Sarlak, H.; Nishino, T.; Martinez-Tossas, L.; Meneveau, C.; Sorensen, J. Assessment of blockage effects on the wake characteristics and power of wind turbines. Renew. Energy 2016, 93, 340–352. [Google Scholar] [CrossRef] [Green Version]
  5. Ross, H.; Polagye, B. An experimental assessment of analytical blockage corrections for turbines. Renew. Energy 2020, 152, 1328–1341. [Google Scholar] [CrossRef] [Green Version]
  6. Corke, T.C.; Thomas, F.O. Dynamic Stall in Pitching Airfoils: Aerodynamic Damping and Compressibility Effects. Annu. Rev. Fluid Mech. 2015, 47, 479–505. [Google Scholar] [CrossRef]
  7. Guillaud, N.; Balarac, G.; Goncalves, E. Large Eddy Simulations on a pitching airfoil: Analysis of the reduced frequency influence. Comput. Fluids 2018, 161, 1–13. [Google Scholar] [CrossRef] [Green Version]
  8. Wang, S.; Ingham, D.B.; Ma, L.; Pourkashanian, M.; Tao, Z. Numerical investigations on dynamic stall of low Reynolds number flow around oscillating airfoils. Comput. Fluids 2010, 39, 1529–1541. [Google Scholar] [CrossRef]
  9. Tsai, H.C. Numerical Investigation of Vertical-Axis Wind Turbines at Low Reynolds Number. Ph.D. Thesis, California Institute of Technology, Pasadena, CA, USA, 2016. [Google Scholar]
  10. Guillaud, N.; Balarac, G.; Goncalves, E.; Zanette, J. Large Eddy Simulations on Vertical Axis Hydrokinetic Turbines and flow phenomena analysis. IOP Conf. Ser. Earth Environ. Sci. 2016, 49, 102010. [Google Scholar] [CrossRef] [Green Version]
  11. Guilbot, M.; Barre, S.; Balarac, G.; Bonamy, C.; Guillaud, N. A numerical study of Vertical Axis Wind Turbine Performances in Twin-Rotor Configurations. J. Phys. Conf. Ser. 2020, 1618, 052012. [Google Scholar] [CrossRef]
  12. Dabiri, J. Potential order-of-magnitude enhancement of wind farm power density via counter-rotating vertical-axis wind turbine arrays. J. Renew. Sustain. Energy 2011, 3, 043104. [Google Scholar] [CrossRef] [Green Version]
  13. Brownstein, I.D.; Wei, N.J.; Dabiri, J.O. Aerodynamically Interacting Vertical-Axis Wind Turbines: Performance Enhancement and Three-Dimensional Flow. Energies 2019, 12, 2724. [Google Scholar] [CrossRef] [Green Version]
  14. Jiang, Y.; Zhao, P.; Stoesser, T.; Wang, K.; Zhou, L. Experimental and numerical investigation of twin vertical axis wind turbines with a deflector. Energy Convers. Manag. 2020, 209, 112588. [Google Scholar] [CrossRef]
  15. Doan, M.; Kai, Y.; Obi, S. Twin Marine Hydrokinetic Cross-Flow Turbines in Counter Rotating Configurations: A Laboratory-Scaled Apparatus for Power Measurement. J. Mar. Sci. Eng. 2020, 8, 918. [Google Scholar] [CrossRef]
  16. Doan, M.; Kai, Y.; Takuya, K.; Obi, S. Flow Field Measurement of Laboratory-Scaled Cross-Flow Hydrokinetic Turbines: Part 1—The Near-Wake of a Single Turbine. J. Mar. Sci. Eng. 2021, 9, 489. [Google Scholar]
  17. Doan, M.; Takuya, K.; Obi, S. Flow Field Measurement of Laboratory-Scaled Cross-Flow Hydrokinetic Turbines: Part 2—The Near-Wake of Twin Turbines in Counter-Rotating Configurations. J. Mar. Sci. Eng. 2021, 9, 777. [Google Scholar]
  18. Bachant, P.; Wosnik, M. Modeling the near-wake of a vertical-axis cross-flow turbine with 2-D and 3-D RANS. J. Renew. Sustain. Energy 2016, 8, 053311. [Google Scholar] [CrossRef] [Green Version]
  19. The OpenFOAM Foundation. OpenFOAM 4.1. Available online: https://openfoam.org/version/4-1/ (accessed on 1 July 2021).
  20. Doan, M.N.; Alayeto, I.H.; Padricelli, C.; Obi, S.; Totsuka, Y. Experimental and computational fluid dynamic analysis of laboratory-scaled counter-rotating cross-flow turbines in marine environment. In Proceedings of the ASME 2018 5th Joint US-European Fluids Engineering Division Summer Meeting, Montreal, QC, Canada, 15 July 2018; American Society of Mechanical Engineer: New York, NY, USA, 2018; Volume 2, p. V002T14A003. [Google Scholar]
  21. Doan, M.N.; Alayeto, I.H.; Kumazawa, K.; Obi, S. Computational fluid dynamic analysis of a marine hydrokinetic crossflow turbine in low Reynolds number flow. In Proceedings of the ASME-JSME-KSME 2019 8th Joint Fluids Engineering Conference, San Francisco, CA, USA, 28 July–1 August 2019; American Society of Mechanical Engineer: New York, NY, USA, 2019; Volume 2, p. V002T02A067. [Google Scholar]
  22. Alayeto, I.H.; Doan, M.N.; Kumazawa, K.; Obi, S. Wake characteristics comparison between isolated and pair configurations of marine hydrokinetic crossflow turbines at low Reynolds numbers. In Proceedings of the ASME-JSME-KSME 2019 8th Joint Fluids Engineering Conference, San Francisco, CA, USA, 28 July–1 August 2019; American Society of Mechanical Engineer: New York, NY, USA, 2019; Volume 1, p. V001T01A037. [Google Scholar]
  23. Rezaeiha, A.; Montazeriab, H.; Blockenab, B. On the accuracy of turbulence models for CFD simulations of vertical axis wind turbines. Energy 2019, 180, 838–857. [Google Scholar] [CrossRef]
  24. Spalart, P.; Allmaras, S. A one-equation turbulence model for aerodynamic flows. Rech. Aerosp. 1992, 1, 5–12. [Google Scholar]
  25. Balduzzi, F.; Bianchini, A.; Maleci, R.; Ferrara, G.; Ferrari, L. Critical issues in the CFD simulation of Darrieus wind turbines. Renew. Energy 2016, 85, 419–435. [Google Scholar] [CrossRef]
  26. Bianchini, A.; Balduzzi, F.; Bachant, P.; Ferrara, G.; Ferrari, L. Effectiveness of two-dimensional CFD simulations for Darrieus VAWTs: A combined numerical and experimental assessment. Energy Convers. Manag. 2017, 136, 318–328. [Google Scholar] [CrossRef]
  27. Bahaja, A.; Molland, A.; Chaplin, J.; Battena, W. Power and thrust measurements of marine current turbines under various hydrodynamic flow conditions in a cavitation tunnel and a towing tank. Renew. Energy 2007, 32, 407–426. [Google Scholar] [CrossRef]
  28. Kinsey, T.; Dumas, G. Impact of channel blockage on the performance of axial and cross-flow hydrokinetic turbines. Renew. Energy 2007, 103, 239–254. [Google Scholar] [CrossRef]
  29. Adhikari, R.C.; Vaz, J.; Wood, D. Cavitation Inception in Crossflow Hydro Turbines. Energies 2016, 9, 237. [Google Scholar] [CrossRef] [Green Version]
  30. Da Silva, P.A.S.F.; Shinomiya, L.D.; de Oliveira, T.F.; Vaz, J.R.P.; Mesquita, A.L.A.; Junior, A.C.P.B. Design of Hydrokinetic Turbine Blades Considering Cavitation. Energy Procedia 2015, 75, 277–282. [Google Scholar] [CrossRef] [Green Version]
Figure 1. An overview of the meshing process.
Jmse 09 00829 g001
Figure 2. An example of the convergence behavior of C P . This example shows the results on a 1.3 million cell mesh at a time step of 1.25 × 10 4 s.
Jmse 09 00829 g002
Figure 3. An iterative sensitivity analysis. The first and third steps are shown in (a) and the second step of the process is displayed in (b). The points enclosed in same style circles are equivalent on the 2 figures. The final spatial and temporal resolution used for the rest of this article is enclosed in the red rectangle.
Jmse 09 00829 g003
Figure 4. The numerically calculated and corrected power coefficient C P as a function of tip-speed-ratio λ . The purple dotted lines enclosed the interested points for later torque analyses.
Jmse 09 00829 g004
Figure 5. The experimental and numerically corrected power coefficient C P as a function of tip-speed-ratio λ at 4 blockage ratios.
Jmse 09 00829 g005
Figure 6. The numerical (blue turbine) and experimental (red turbine) near-wake results. The CFD flow pictures are instantaneous snapshots at 2 phase angles after the convergence criterion was satistfied (a1,a2,b1,b2). The experimental pictures are the phase-averaged results discussed in [16] at the relevant phase angle (a3,b3).
Jmse 09 00829 g006
Figure 7. The torque as a function of the turbine azimuthal angle at 4 blockage ratios and 2 tip-speed-ratios λ = 0.85 (a) and λ = 1.42 (b).
Jmse 09 00829 g007
Figure 8. An example of the velocity field around the blade during its positive torque phase (ae) and at an azimuthal angle after it switched into the negative torque zone (f). The analysis focused on the blade enclosed in the red dashed lines in (a).
Jmse 09 00829 g008
Figure 9. The velocity, vorticity, and pressure fields around one of the turbine blades at its maximum torque angle of 4 blockage ratios: 19.7 % (a), 25.3 % (b), 33.8 % (c), and 50.6 % (d).
Jmse 09 00829 g009
Figure 10. The pressure loading on one of the turbine blades at its maximum torque angle of 4 blockage ratios: 19.7 % (a), 25.3 % (b), 33.8 % (c), and 50.6 % (d). The relevant blade is colored in white on the right side.
Jmse 09 00829 g010
Figure 11. The velocity, vorticity, and pressure fields around one of the turbine blades after reaching its maximum torque angle of 4 blockage ratios: 19.7 % (a), 25.3 % (b), 33.8 % (c), and 50.6 % (d).
Jmse 09 00829 g011
Figure 12. The pressure loading on one of the turbine blades after reaching its maximum torque angle of 4 blockage ratios: 19.7 % (a), 25.3 % (b), 33.8 % (c), and 50.6 % (d). The relevant blade is colored in white on the right side.
Jmse 09 00829 g012
Figure 15. The turbulent viscosity field at β = 25.3 % (a) and β = 50.6 % (b) during the generation of the leading edge vortex.
Jmse 09 00829 g015
Figure 16. The interested turbine configurations for this computational fluid dynamic study: Single turbine at β = 25.3 % (a), single turbine at β = 50.6 % (b), forward counter-rotating turbines at β = 50.6 % (c), and backward counter-rotating turbine at β = 50.6 % (d). The green arrows denote the rotating direction and the solid black lines illustrate the water tunnel walls.
Jmse 09 00829 g016
Figure 17. An illustration of the forward counter-rotating mesh.
Jmse 09 00829 g017
Figure 18. Examples of the convergence behavior of the 2 turbines for 2 cases: Forward at ω t = 12.5 rad/s (a) and forward at ω t = 14.5 rad/s (b).
Jmse 09 00829 g018
Figure 19. The power curves of the configurations displayed in Figure 16 and their associated blockage ratios.
Jmse 09 00829 g019
Figure 20. The torque curves of the single and twin turbine configurations at λ = 1.42 (a) and λ = 1.56 (b).
Jmse 09 00829 g020
Figure 21. The velocity, vorticity, and pressure fields around one of the turbine blades around its maximum torque angle of the 3 configurations: Single turbine (a), forward counter-rotating turbines (b), and backward counter-rotating turbines (c).
Jmse 09 00829 g021
Figure 22. The pressure loading on one of the turbine blades around its maximum torque angle of the 3 configurations: Single turbine (a), forward counter-rotating turbines (b), and backward counter-rotating turbines (c). The relevant blade is colored in white on the right side.
Jmse 09 00829 g022
Figure 23. The velocity, vorticity, and pressure fields around one of the turbine blades after reaching its maximum torque angle of the 3 configurations: Single turbine (a), forward counter-rotating turbines (b), and backward counter-rotating turbines (c).
Jmse 09 00829 g023
Figure 24. The pressure loading on one of the turbine blades after reaching its maximum torque angle of the 3 configurations: Single turbine (a), forward counter-rotating turbines (b), and backward counter-rotating turbines (c). The relevant blade is colored in white on the right side.
Jmse 09 00829 g024
Figure 25. The velocity fields in the blade reference frame before it reached the maximum torque of the 3 configurations: single turbine (a), forward counter-rotating turbines (b), and backward counter-rotating turbines (c). On each figure, the lower surface is the turbine inner side and the upper surface is the turbine outer side. The figures on the left side show the position of the blade of interest colored in white.
Jmse 09 00829 g025
Figure 26. The velocity fields in the blade reference frame after it reached the maximum torque of the 3 configurations: single turbine (a), forward counter-rotating turbines (b), and backward counter-rotating turbines (c). On each figure, the lower surface is the turbine inner side and the upper surface is the turbine outer side. The figures on the left side show the position of the blade of interest colored in white.
Jmse 09 00829 g026
Table 1. Summary of the turbine geometry and relevant parameters.
ParameterSymbolValue (Unit)
Blade chordc2.54 (cm)
Solidity σ 0.39 (-)
Reynolds number (diameter based) R e D 20,000 (-)
Water density ρ 998 (kg/m 3 )
Freestream velocity U 0.3 (m/s)
Blockage ratio β 0.197/0.253/0.338/0.506 (-)
Table 2. Summary of the meshes used in the sensitivity analysis. N x and N y are the number of coarse cells in the streamwise and transverse direction.
Case N x N y Total Number of Cells
122230588,649
2296401,026,883
3333451,304,364
4370501,605,068
5444602,305,123
Table 3. The cases of interest for experimental and numerical comparison of the near-wake.
Case β Note
T1 Experiment19.7% λ = 0.85 —Optimal power output
Numerical Model 119.7%Same blockage ratio as the experiment
Numerical Model 225.3%Same physical dimensions as the experiment
Table 4. Summary of the maximum power points of the 4 configurations.
Case λ C P , max Difference from the Baseline
Single turbine, β = 25.3 % (baseline)1.250.19N/A
Single turbine, β = 50.6 % 1.530.41115%
Forward counter-rotating1.650.47144%
Backward counter-rotating1.530.3265.7%
Publisher’s Note: MDPI stays neutral with regard to jurisdictional claims in published maps and institutional affiliations.